Embed Size (px)
Citation preview

Febrero 20, 2008
Integración de Riesgos de Mercado y Crédito
Valuacion y Riesgo en Derivados de Credito y Structured Finance (ABS, MBS y CDO)
Dan Rosen, R2 Financial Technologies and Fields Institute
www.R2-financial.com

Introduction: Integration of Market and Credit Risk
• Trading book: credit risk and market risk are entangled– Direct issuer/borrower risk – bonds, loans
– Counterparty credit risk (CCR) – derivatives
– Credit derivatives – indirect issuer/borrower, counterparty
• Credit derivatives and Structured Finance portfolios– Single name (CDSs)
– Portfolio: synthetic and cash (underlying loans, bonds, ABS/MBS)
• Key issues– Pricing: market and credit risk are intrinsically linked (credit spreads, PDs
and LGDs, credit migration)
– Risk measurement: market vs. credit events, liquidity, horizons
• Basel II capital: IDR (+ event risk) & CCR (credit) capital, securitization
framework

Context – in the News…
Yesterday, WSJ
• “Credit Suisse cut the value of some asset-backed securities by
$2.85 billion, blaming some of the hit on "mismarkings and
pricing errors" by traders…”
• Now, Lehman Gets Pelted. Many investors have been surprised at
the ability of Lehman Brothers Holdings Inc. to navigate the credit
crunch, given the size of its exposure to potential land mines. But…
Lehman is sitting on a big pile of commercial real-estate loans,
and… credit markets have worsened… now facing a write-down in
the $1.3 billion range…”

Context – in the News…
Monday
• “The government decided to nationalise Northern Rock on
Sunday, abandoning a five-month attempt to snare a private sector
buyer for the ailing bank…”
– “The fifth-largest mortgage lender has borrowed 25 billion
pounds from the Bank of England since its funding model
collapsed in the credit crisis last year, sparking the first run on
deposits at a British bank for some 140 years.”
“Sources: Reuters, Risk, Banking Technology,, Dow Jones, FT,, G&M,
Bloomberg
Context – in the News…
• “Subprime crisis worse than 1998, says S&P”
• “Bifurcation or Meltdown… Since BS spectacularly announced an
initial $3.2B rescue of BSAM HG structured credit fund (June 22),
funds…have seem to topple like dominoes…”
• “Edward Cahill, head of European CDOs at BarCap has resigned…
decision comes after… two structures downgraded by S&P… by
16 notches, with the most senior notes going from AAA to CCC+”
Sources: WSJ, Reuters, Risk, Banking Technology,, Dow Jones, FT,
Bloomberg
Context – in the News…
• “It all happened exactly like he said it would happen... In every
single detail…”
– “The hedge fund creator's name was John Paulson… by
making between $3 billion and $4 billion for himself in 2007,
he appears to have set a Wall Street record… no one has
ever made so much so fast.”
• Investors blaming a “1 in 10,000 years” event…
Sources: Reuters, Risk, Banking Technology,, Dow Jones, FT,, G&M,
Bloomberg

Context – Rare Event? Black Monday’s 20th Anniversary
• Oct 19th 1987 – DJ Industrial average fell almost 23% in a single day… “Taking other world indices down with him and creating fear of a global
recession and a permanent change to the way investors look at financial markets”
• A 23% one day change is a very, very rare event (“standard” risk models)
• Rare events seem to be not so rare….– e.g., from 1926-2000, there were nine crashes in the DJI Index that exceeded
6-sigma in a single day (based on the previous 250 business days)
• From data: actual likelihood of a 6-sigma crash occurring on any given day= 0.04%.
– If model was right: how likely are these observed historical evenets?
• Assume daily returns are independent Normal–probability of a single 6-sigma event on any given day is about 10-9 (significantly less than 0.04%)
• The probability of one event in 84 years is then about 0.002%; the probability of nine 6-sigma events occurring in 84 years is about 10-43…

S&P/Case-Shiller: database with 20 years of home prices (some metropolitan areas covered for 20 years, other for a shorter period)
What caused the sub-prime crisis?
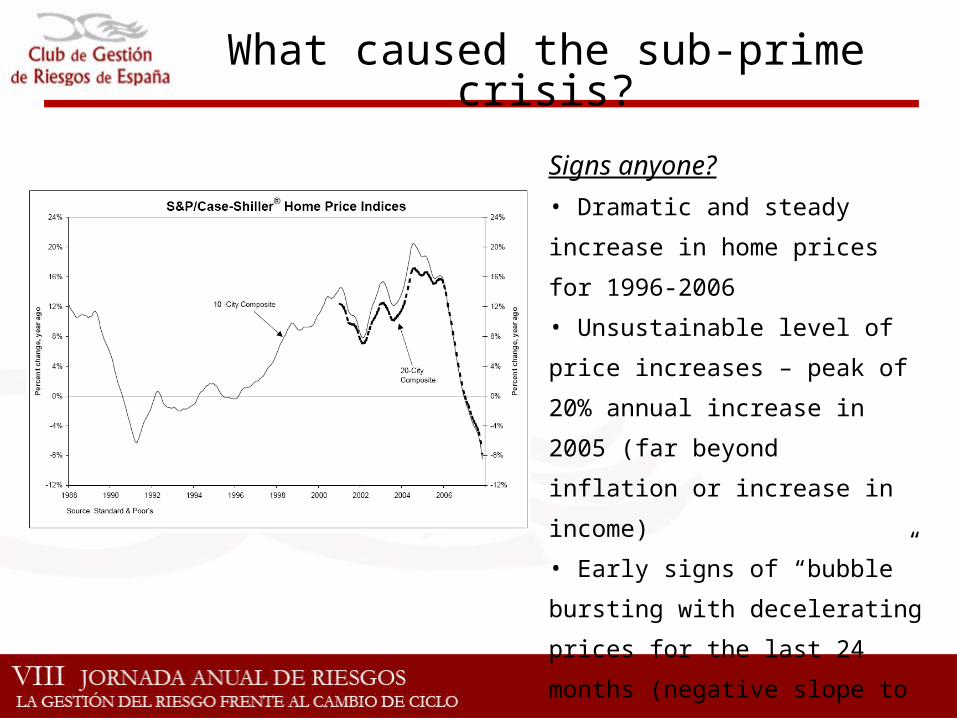
Signs anyone?
• Dramatic and steady increase in
home prices for 1996-2006
• Unsustainable level of price
increases – peak of 20% annual
increase in 2005 (far beyond
inflation or increase in income)
• Early signs of “bubble” bursting
with decelerating prices for the last
24 months (negative slope to the
annual % increase) and actual
falling prices all through 2007
What caused the sub-prime crisis?
What caused the sub-prime crisis?
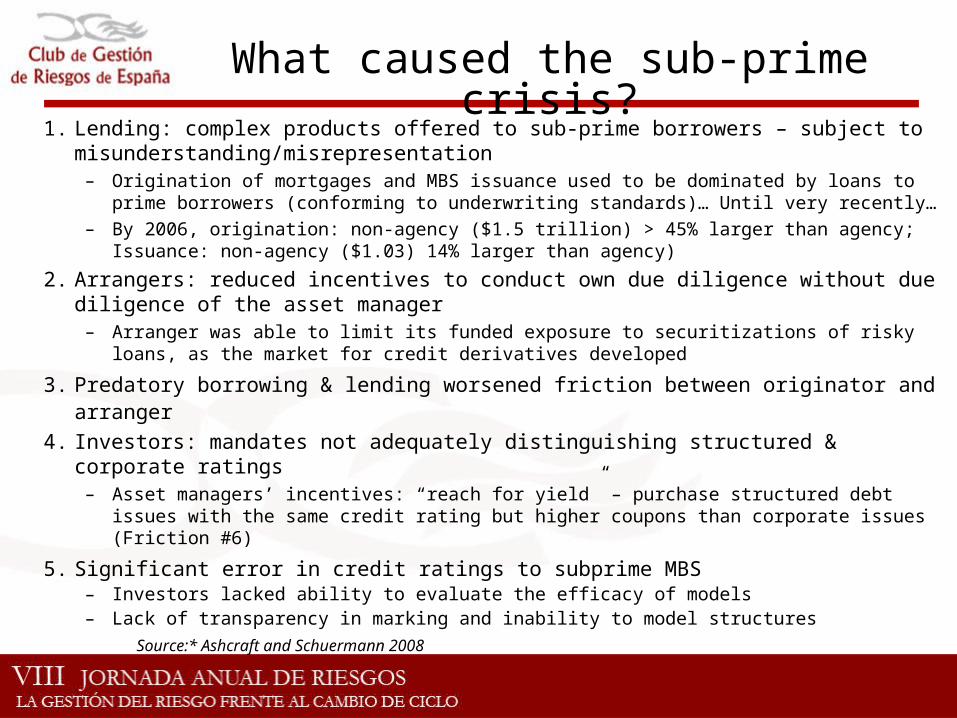
1. Lending: complex products offered to sub-prime borrowers – subject to misunderstanding/misrepresentation
– Origination of mortgages and MBS issuance used to be dominated by loans to prime borrowers (conforming to underwriting standards)… Until very recently…
– By 2006, origination: non-agency ($1.5 trillion) > 45% larger than agency; Issuance: non-agency ($1.03) 14% larger than agency)
2. Arrangers: reduced incentives to conduct own due diligence without due diligence of the asset manager
– Arranger was able to limit its funded exposure to securitizations of risky loans, as the market for credit derivatives developed
3. Predatory borrowing & lending worsened friction between originator and arranger
4. Investors: mandates not adequately distinguishing structured & corporate ratings– Asset managers’ incentives: “reach for yield” – purchase structured debt issues with
the same credit rating but higher coupons than corporate issues (Friction #6)
5. Significant error in credit ratings to subprime MBS– Investors lacked ability to evaluate the efficacy of models– Lack of transparency in marking and inability to model structures
Source:* Ashcraft and Schuermann 2008

Lessons Learned from the Sub-Prime Crisis
• Assessment of risk (and ratings) of CDO tranches
– Home prices in the US could not continue to increase indefinitely
• Risk function: analyze what would happen once home prices fall
– Strong conditional systematic factor: falling home prices
• Default rates of subprime mortgages and correlation of default of
ABS tranches
– Regime switch? Default rates and ABS tranche’s correlations
based on the benign period of 1996-2006 (housing prices
continually rising), are not applicable in a falling price
environment

Lessons Learned from the Sub-Prime Crisis
• Signs that house prices were about to fall by end 2006 – Some people bet on this (e.g. Goldman, Paulson)
• Assessment of risk concentrations (lack of diversification) – A primary error made by rating agencies and others: assume that ABS
tranches in a CDO are highly diversified – default correlation equivalent to corporate bonds of different issuers
• Models need to take into account • Changes in the nature of the subprime mortgages (e.g. lower standards on
documentation)
• Effect of changed standards on default and correlations (when housing prices fall)
• Systematic factors and nature of data
• Transparency, transparency, transparency…– Structure, MtM, risk
– Investment decisions cannot rely solelely on simple ratings measures

CDO Valuation and Risk ModellingCurrent State
• Valuation of synthetics – Gaussian copula framework still prevalent– Pricing bespoke portfolios is difficult and not standardized – models generally ad-hoc
– Dynamic models and detailed bespooke models still in infancy (application and hedging)
• Valuation of cash CDOs – difficult, computationally intensive, not standardized– IR, spreads, prepayment, credit (and correlation) risks
– Structures are complex and opaque
– Simple “bond models” and matrix pricing generally used
– Advanced models are fairly new or not yet fully developed for all asset classes
– Standardized calibration is difficult to achieve
• Risk modelling for Credit Derivatives and SF assets is immature (still in its infancy)– Market risk… vs. credit risk
– Generally used simple market risk sensitivities (e.g. CR01, etc.)
– Computationally intensive risk applications (e.g. name-specific sensitivities)
– VaR (market and credit) measures not easy and contribution measures not well defined
– Correlation is very important & difficult to assess in SF – not widely used or standardized

Valuation and Risk Measurement Systems – Current State
• Difficult to build a fully integrated solution for valuing and managing the risk of ABS/MBS and CDO portfolios (in particular cash CDOs)
• Managers and dealers developed and maintain costly in-house capabilities for internal use
– Multiple components, analytics and data sources, – Systems do not generally provide good and consistent pricing for business users, in a timely
basis, nor flexible risk management and reporting capabilities– In-house solution consisting of multiple ad-hoc (excel-based) solutions to model cash-flows,
generate scenarios,
• Investors generally rely on (multiple) periodic valuations and reports provided by dealers (or valuation “opinions”)
– Simple integration into their systems– Little or no risk capabilities: stress testing, concentration reports, etc.
• Modelling and valuation are difficult – model risk, lack of liquidity and price transparency, structure transparency and data
• Developing a consistent and practical risk measurement methodology and infrastructure is difficult –interaction of market and creidt risk

Valuation Methods for SF and CDOs
Models to value CDOs (CBOs, CLOs, ABS, etc.) can be classified as
1. “Risky” Bond models (single scenario)
2. Stochastic models (simulation)
– Static, dynamic
– Top-down, bottom-up
– Collateral market value models (NAV-based models)

1. Risky Bond Models for CDOs
• Single-scenario modelling – Deterministic cash-flow approach
• No direct modelling of correlations, optionality and non-linearities in structure
• Detailed cash-flow modelling of collateral pool and of CDO waterfall– Pool level assumptions and loan-level assumptions and clustering
• Comparative pricing via matrix approach– Scenario assumptions, discount spreads (premiums)
• Efficient stress-testing framework
tXsrT
jj
jjeYCFPV
1
... vintage,sector, rating, ,...,, XLGDDefPPY

• Step 3: Use collateral CFs and CDO waterfall to generate CDO cash flows
• NPV – discount cash flows with appropriate discount rates
• Discount rates (spreads) – from comparable market quotes where available– Knowing cash flows for that CDO, and assuming
that the market value equals the NPV, one can calculate the spread for that tranche
– Application of discount rate to all other tranches with the same rating, deal type, vintage, etc.
Discount
Discount
Discount
Discount
Collateral Model
CDO Model
Defaults
Recoveries
Prepayments
Collateral Cash Flows
Senior Cash Flow
Mezz Cash Flow
Junior Cash Flow
Equity Cash Flow
Price
Price
Price
Price
• Step 1: Gather collateral cash flow assumption vectors (CPR, CDR, recovery)– e.g. assumptions by
type of CDO collateral (e.g. CRE, ABS, loan, bond)
– For ABS CDOs, can use loan performance analysis on the loans in each ABS
• Step 2: Generate cash flows (e.g. using Intex) for each piece of collateral – Using given
assumption vectors
1. Risky Bond Models

2. Stochastic Models
• Standard valuation technique for derivatives (option-theoretic approach)– Multi-scenario approach (via structured scenarios, MC, analytics)
– Captures explicitly key risks: credit (default, LGD, spread), prepayment, market risk
– Portfolio risk – correlation
– “Arbitrage-free” (generally) approach (although can add liquidity, etc.)
• Consistent valuation of various asset classes (synthetics, cash; ABS, CLO, CDO, CDO^2)
• Sensitivities to various risks and hedge ratios• Computationally intensive• Various level of modelling
– Static (e.g. copula) vs. dynamic
– Top-down vs. bottom-up approaches
– Risks: credit, prepayment, market, liquidity

Example: ABX and ABS CDO
• Pricing ABS CDOs is complex– Each underlying bond may contain thousands of small loans (in essence, CDO^2)
– Cash-flow generation• Cashflow of underlying loans in pool
• Complex CDO waterfall (IR and principal cash-flows, OC, substitution rules, fees, active management, etc.)
• Must model defaults, LGDs) and prepayment - applies different to tranches
• Simplistic valuation as bond with deterministic scheduled amortization – Computed under a single scenario (default, LGD, prepayment, interest rates, spreads)
– Discount spread from comparable trades (matrix pricing)
Collateral cash-flow
engine
CDO waterfall
Defaults
LGD/recoveries
Prepayments
Collateral Cash Flows
Senior trancheMezz trancheJunior tranche Equity tranche
Other factors

Example – ABX
• ABX –referencing 20 Asset Backed CDS (ABCDS) – Home Equity / Sub-prime Bonds
– Five indices: AAA / AA / A / BBB / BBB-
– Trading Began January 2006
• Standard prices and quotes• Modelling issues
– Default risk as well as prepayment risk (competing risks)
– Cash-flow generation• Underlying loans• Bond (and CDS) waterfall
ABX MktPrice ABX-XHAAA72_INDEX 91.81 ABX-XHAA72_INDEX 71.06 ABX-XHA72_INDEX 44.31 ABX-XHBBB72_INDEX 26 ABX-XHBBBM72_INDEX 23

Example – ABX Valuation Model
Simple valuation model (illustration purposes)
• Single systematic factor – drives– Default rates
– Prepayment rates
– Recovery rates
(underlying loans in the pools)
• Large homogeneous portfolio assumption
• Discretization– 133 systematic factor
scenarios0.00%
10.00%
20.00%
30.00%
40.00%
50.00%
60.00%
70.00%
80.00%
90.00%
1 6
11
16
21
26
31
36
41
46
51
56
61
66
71
76
81
86
91
96
10
1
10
6
11
1
11
6
12
1
12
6
13
1
PD LGD PP
k kk
Zj Zbtahtp

Example – ABX Valuation under Scenarios
ABX bonds discounted Cashflows (values) under scenarios
$0.00
$20.00
$40.00
$60.00
$80.00
$100.00
$120.00
$140.00
$160.00
1 6
11
16
21
26
31
36
41
46
51
56
61
66
71
76
81
86
91
96
10
1
10
6
11
1
11
6
12
1
12
6
13
1
ABX-XHAAA72_INDEX ABX-XHAA72_INDEX ABX-XHA72_INDEX
ABX-XHBBB72_INDEX ABX-XHBBBM72_INDEX
0.00%
10.00%
20.00%
30.00%
40.00%
50.00%
60.00%
70.00%
80.00%
90.00%
1 5 9 13 17 21 25 29 33 37 41 45 49 53 57 61 65 69 73 77 81 85 89 93 97 101
105
109
113
117
121
125
129
133
PD LGD PP
ABX MktPrice ABX-XHAAA72_INDEX 91.81 ABX-XHAA72_INDEX 71.06 ABX-XHA72_INDEX 44.31 ABX-XHBBB72_INDEX 26 ABX-XHBBBM72_INDEX 23
Example – ABX Valuation under Scenarios

Example – ABX Valuation and Calibration
Weighted MC implied factor distribution (implied scenario weights)
0.00%
10.00%
20.00%
30.00%
40.00%
50.00%
60.00%
70.00%
80.00%
90.00%
1 5 9 13 17 21 25 29 33 37 41 45 49 53 57 61 65 69 73 77 81 85 89 93 97 101
105
109
113
117
121
125
129
133
PD LGD PP
Example:
• Vasicek PD distribution (Gaussian copula)– Implied avg. PD = 12%– Implied correlation = 7%
$0.00
$20.00
$40.00
$60.00
$80.00
$100.00
$120.00
$140.00
$160.00
1 6
11
16
21
26
31
36
41
46
51
56
61
66
71
76
81
86
91
96
10
1
10
6
11
1
11
6
12
1
12
6
13
1
ABX-XHAAA72_INDEX ABX-XHAA72_INDEX ABX-XHA72_INDEX
ABX-XHBBB72_INDEX ABX-XHBBBM72_INDEX
0.00%
0.50%
1.00%
1.50%
2.00%
2.50%
1 5 9
13
17
21
25
29
33
37
41
45
49
53
57
61
65
69
73
77
81
85
89
93
97
10
1
10
5
10
9
11
3
11
7
12
1
12
5
12
9
ABX-XHAAA72 91.81 103.06 ABX-XHAA72 71.06 94.40 ABX-XHA72 44.31 78.89
ABX-XHBBB72 26 57.19 ABX-XHBBBM72 23 48.47
Market Price Estimated Prices

Example – ABX Valuation and Calibration
Weighted MC implied factor distribution (implied scenario weights)
0.00%
10.00%
20.00%
30.00%
40.00%
50.00%
60.00%
70.00%
80.00%
90.00%
1 5 9 13 17 21 25 29 33 37 41 45 49 53 57 61 65 69 73 77 81 85 89 93 97 101
105
109
113
117
121
125
129
133
PD LGD PP
Example:• Optimized Vasicek PD
distribution
(Gaussian copula)– Implied avg. PD = 16%– Implied correlation 6.5%
$0.00
$20.00
$40.00
$60.00
$80.00
$100.00
$120.00
$140.00
$160.00
1 6
11
16
21
26
31
36
41
46
51
56
61
66
71
76
81
86
91
96
10
1
10
6
11
1
11
6
12
1
12
6
13
1
ABX-XHAAA72_INDEX ABX-XHAA72_INDEX ABX-XHA72_INDEX
ABX-XHBBB72_INDEX ABX-XHBBBM72_INDEX
0.00%
0.20%
0.40%
0.60%
0.80%
1.00%
1.20%
1.40%
1.60%
1.80%
1 5 9
13
17
21
25
29
33
37
41
45
49
53
57
61
65
69
73
77
81
85
89
93
97
10
1
10
5
10
9
11
3
11
7
12
1
12
5
12
9
ABX-XHAAA72 91.81 102.11 ABX-XHAA72 71.06 74.52 ABX-XHA72 44.31 48.36
ABX-XHBBB72 26 27.81 ABX-XHBBBM72 23 21.78
Market Price Estimated Prices

ABX-XHAAA72_INDEX 91.81 97.66 5.99% ABX-XHAA72_INDEX 71.06 69.91 -1.65% ABX-XHA72_INDEX 44.31 44.69 0.86%
ABX-XHBBB72_INDEX 26 25.84 -0.63% ABX-XHBBBM72_INDEX 23 23.02 0.08%
Market Price Model Prices
0
0.05
0.1
0.15
0.2
0.25
0.3
0.35
0.4
1 5 9
13 17 21 25 29 33 37 41 45 49 53 57 61 65 69 73 77 81 85 89 93 97 101
105
109
113
117
121
125
129
133
Example – ABX Valuation and Calibration
Weighted MC implied factor distribution (implied scenario weights)
0.00%
10.00%
20.00%
30.00%
40.00%
50.00%
60.00%
70.00%
80.00%
90.00%
PD LGD PP
Example:• Implied distribution with
closest matching prices• Cannot simultaneously match
the prices of all tranches over this scenarios (model)
$0.00
$20.00
$40.00
$60.00
$80.00
$100.00
$120.00
$140.00
$160.00
1 6
11
16
21
26
31
36
41
46
51
56
61
66
71
76
81
86
91
96
10
1
10
6
11
1
11
6
12
1
12
6
13
1
ABX-XHAAA72_INDEX ABX-XHAA72_INDEX ABX-XHA72_INDEX
ABX-XHBBB72_INDEX ABX-XHBBBM72_INDEX
0
0.05
0.1
0.15
0.2
0.25
0.3
0.35
0.4
1 5 9
13
17
21
25
29
33
37
41
45
49
53
57
61
65
69
73
77
81
85
89
93
97
10
1
10
5
10
9
11
3
11
7
12
1
12
5
12
9
13
3

Example – ABX Valuation and Calibration
0
0.005
0.01
0.015
0.02
0.025
0.03
0.035
0.04
0.045
1 5 9
13
17
21
25
29
33
37
41
45
49
53
57
61
65
69
73
77
81
85
89
93
97
10
1
10
5
10
9
11
3
11
7
12
1
12
5
12
9
13
3 ABX-XHAAA72_INDEX 91.81 98.46 7.2% ABX-XHAA72_INDEX 71.06 69.59 -2.1% ABX-XHA72_INDEX 44.31 44.94 1.4%
ABX-XHBBB72_INDEX 26 26.04 0.2% ABX-XHBBBM72_INDEX 23 22.70 -1.3%
7.8%
Market Price Model Price
0
0.005
0.01
0.015
0.02
0.025
0.03
0.035
0.04
0.045
1 5 9
13
17
21
25
29
33
37
41
45
49
53
57
61
65
69
73
77
81
85
89
93
97
10
1
10
5
10
9
11
3
11
7
12
1
12
5
12
9
13
3
0.00%
0.20%
0.40%
0.60%
0.80%
1.00%
1.20%
1.40%
1.60%
1 5 9
13
17
21
25
29
33
37
41
45
49
53
57
61
65
69
73
77
81
85
89
93
97
10
1
10
5
10
9
11
3
11
7
12
1
12
5
12
9
ABX-XHAAA72 91.81 101.46 10.5% ABX-XHAA72 71.06 69.07 -2.8% ABX-XHA72 44.31 45.35 2.3%
ABX-XHBBB72 26 27.21 4.7% ABX-XHBBBM72 23 21.70 -5.7%
13.3%
Market Price Model Price
Best fitted prices
Smoothed distribution (non-parametric)
Optimal parametricDistributionPD=16.5 R=7%
ABX-XHAAA72_INDEX 91.81 97.66 5.99% ABX-XHAA72_INDEX 71.06 69.91 -1.65% ABX-XHA72_INDEX 44.31 44.69 0.86%
ABX-XHBBB72_INDEX 26 25.84 -0.63% ABX-XHBBBM72_INDEX 23 23.02 0.08%
Market Price Model Prices
0
0.05
0.1
0.15
0.2
0.25
0.3
0.35
0.4
1 5 9
13 17 21 25 29 33 37 41 45 49 53 57 61 65 69 73 77 81 85 89 93 97
101
105
109
113
117
121
125
129
133
0
0.05
0.1
0.15
0.2
0.25
0.3
0.35
0.4
1 5 9
13
17
21
25
29
33
37
41
45
49
53
57
61
65
69
73
77
81
85
89
93
97
10
1
10
5
10
9
11
3
11
7
12
1
12
5
12
9
13
3

Five Steps
1. Factor scenarios PD, PP, LGD scenarios for new CDO (factor models)
2. CDO PV scenarios from cash-flow and waterfall engines
3. Valuation using pre-calibrated model
4. Sensitivities and risk measures
5. Model risk assessment
– “Plausible” factor distributions
– PD, PP, LGD model assumptions
– Stress testing and extreme scenarios
Example – Valuing ABS CDO
X0.00%
10.00%
20.00%
30.00%
40.00%
50.00%
60.00%
70.00%
80.00%
90.00%
1 6
11 16 21 26 31 36 41 46 51 56 61 66 71 76 81 86 91 96
101
106
111
116
121
126
131
PD LGD PP
0.00%
10.00%
20.00%
30.00%
40.00%
50.00%
60.00%
70.00%
80.00%
90.00%
1 6
11 16 21 26 31 36 41 46 51 56 61 66 71 76 81 86 91 96
101
106
111
116
121
126
131
PD LGD PP
0.00%
10.00%
20.00%
30.00%
40.00%
50.00%
60.00%
70.00%
80.00%
90.00%
1 6
11 16 21 26 31 36 41 46 51 56 61 66 71 76 81 86 91 96
101
106
111
116
121
126
131
PD LGD PP
ABX PD, PP, LGDCDO PD, PP, LGD
$0.00
$20.00
$40.00
$60.00
$80.00
$100.00
$120.00
$140.00
$160.00
1 6
11 16 21 26 31 36 41 46 51 56 61 66 71 76 81 86 91 96
101
106
111
116
121
126
131
ABX-XHAAA72_INDEX ABX-XHAA72_INDEX ABX-XHA72_INDEX
ABX-XHBBB72_INDEX ABX-XHBBBM72_INDEX
$0.00
$20.00
$40.00
$60.00
$80.00
$100.00
$120.00
$140.00
$160.00
1 6
11 16 21 26 31 36 41 46 51 56 61 66 71 76 81 86 91 96
101
106
111
116
121
126
131
ABX-XHAAA72_INDEX ABX-XHAA72_INDEX ABX-XHA72_INDEX
ABX-XHBBB72_INDEX ABX-XHBBBM72_INDEX
0
0.005
0.01
0.015
0.02
0.025
0.03
0.035
1 5 913 17 21 25 29 33 37 41 45 49 53 57 61 65 69 73 77 81 85 89 93 97
101
105
109
113
117
121
125
129
133
0
0.005
0.01
0.015
0.02
0.025
0.03
0.035
1 5 9
13 17 21 25 29 33 37 41 45 49 53 57 61 65 69 73 77 81 85 89 93 97
101
105
109
113
117
121
125
129
133
0
0.05
0.1
0.15
0.2
0.25
0.3
0.35
0.4
1 5 9
13 17 21 25 29 33 37 41 45 49 53 57 61 65 69 73 77 81 85 89 93 97 101
105
109
113
117
121
125
129
133
0.00%
0.20%
0.40%
0.60%
0.80%
1.00%
1.20%
1.40%
1.60%
1.80%
1 5 9 13 17 21 25 29 33 37 41 45 49 53 57 61 65 69 73 77 81 85 89 93 97 101
105
109
113
117
121
125
129
0.00%
10.00%
20.00%
30.00%
40.00%
50.00%
60.00%
70.00%
80.00%
90.00%
1 6
11
16
21
26
31
36
41
46
51
56
61
66
71
76
81
86
91
96
10
1
10
6
11
1
11
6
12
1
12
6
13
1
PD LGD PP
$0.00
$20.00
$40.00
$60.00
$80.00
$100.00
$120.00
$140.00
$160.00
1 6
11 16 21 26 31 36 41 46 51 56 61 66 71 76 81 86 91 96
101
106
111
116
121
126
131
ABX-XHAAA72_INDEX ABX-XHAA72_INDEX ABX-XHA72_INDEX
ABX-XHBBB72_INDEX ABX-XHBBBM72_INDEX
$0.00
$20.00
$40.00
$60.00
$80.00
$100.00
$120.00
$140.00
$160.00
1 6
11 16 21 26 31 36 41 46 51 56 61 66 71 76 81 86 91 96
101
106
111
116
121
126
131
ABX-XHAAA72_INDEX ABX-XHAA72_INDEX ABX-XHA72_INDEX
ABX-XHBBB72_INDEX ABX-XHBBBM72_INDEX
General Scenario Frameworkfor Valuation and Risk Profiling
• Basic idea: set of scenarios where instruments can be consistently valued– Imply “risk-neutral” joint distribution (process) for underlying systematic risk factors
• Observed (liquid) prices (e.g. CDSs, index tranches)
• Prior or “quality” preferences on distribution; subjective views
• Implied factor distributions and weighted MC techniques – Multi-factor credit models
• Consistently characterize concentrations/correlations for different baskets
– Weighted Monte Carlo techniques (used in options pricing)
– CDO analytics and computational techniques
• Value consistently bespoke CDOs, products on multiple indices, structured finance CDOs and CDO-squared
– Characterize and model explicitly the effect concentration/diversification
• Structured finance (ABS, MBS and CDOs)– Flexibly incorporate cash-flow and waterfall engines
– ABS and CLO products – effectively apply prepayment and LGD models

Detailed Asset Modelling and Discrimination
Important to understand underlying pools and model collateral details (bottom-up)- sub-prime vs. prime, vintage, region, etc…

• Important to understand contents and model collateral details
– Scenario vectors with specific loan assumptions
• Key to model concentration risk
– Within a product – impact on valuation and risk
– Across products – portfolio credit risk
• Understand basic components: defaults, LGD, prepayments and
correlations (e.g. ABS tranches)
– Systematic factors
• Risk metrics
– Sensitivities
– Scenarios and stress testing
– Statistical measures (VaR) and risk contributions
Risk Measurement for Structured Finance and CDOs

Risk Measurement for Structured Finance and CDOs
Risk metrics
Product characteristics
NYC-CGU02711-127
High LowLiquidity
Yes NoHedged
High LowStandardization
Pure market risk Pure credit risk
PD/LGDsensitivities
SensitivitiesDV01/CR01
Credit VaR(over 1yr)
StatisticalMarket VaR(over 10 yr)
Jump-to-default/ Downgrade
Discrete/scenarioIR/FX
scenarios
Evolution over ‘07
Correlation Desk CDO Desk
NYC-CGU02711-127
High LowLiquidity
Yes NoHedged
High LowStandardization
Pure market risk Pure credit riskPure market risk Pure credit risk
PD/LGDsensitivities
SensitivitiesDV01/CR01
PD/LGDsensitivities
SensitivitiesDV01/CR01
Credit VaR(over 1yr)
StatisticalMarket VaR(over 10 yr)
Credit VaR(over 1yr)
StatisticalMarket VaR(over 10 yr)
Jump-to-default/ Downgrade
Discrete/scenarioIR/FX
scenariosJump-to-default/ Downgrade
Discrete/scenarioIR/FX
scenarios
Evolution over ‘07
Correlation Desk CDO DeskCorrelation Desk CDO Desk
(over 10 days)
Valuation
Risks
“Correlation-based” models “Bond” models

Remarks: Modeling Structured Credit
• Some drivers in credit markets today – Relatively new asset classes (CDOs, sub-prime MBSs, etc..)– Structures
• Complexity… likely to decrease• Lack of transparency – key issue for the markets to recover!
– Lack of Liquidity and price discovery
• Creation of risks we are ill-equipped to model and manage?• Lack of data and little empirical basis to asses risk• Ability to hedge and manage risk (concentration/diversification)
• Implications for modelling– Valuation, mark-to-market/model: know your collateral
• Understand underlying portfolio and risk
– Interaction of market risk and credit risk in structures
– Concentration risk in credit portfolios– Structure complexity and computational issues– Model risk…

Presenter’s Bio
Dr. Dan Rosen is currently a visiting fellow at the Fields Institute for Research in Mathematical Sciences and an adjunct professor at the University of Toronto‘s Masters program in Mathematical Finance. He is the President of R2 Financial Technologies and acts as an advisor to institutions in Europe, North America, and Latin America on derivatives valuation, risk management, economic and regulatory capital.
Up to July 2005, Dr. Rosen had a successful ten-year career at Algorithmics Inc., where he held senior management roles in strategy and business development, research and financial engineering, and product marketing. In these roles, he was responsible for setting the strategic direction of Algorithmics' solutions, new initiatives and strategic alliances as well as heading up the design, positioning of credit risk and capital management solutions, market risk management tools, operational risk, and advanced simulation and optimization techniques, as well as their application to several industrial settings.
Dr. Rosen lectures extensively around the world on financial engineering, enterprise risk and capital management, credit risk and market risk. He has authored numerous papers on quantitative methods in risk management, applied mathematics, operations research, and has coauthored two books and various chapters in risk management books (including two chapters of PRMIAs Professional Risk Manger Handbook). He is a member of the Oliver Wyman Institute, the Industrial Advisory Board of the Fields Institute, the Academic Advisory Board of Fitch, the Advisory Board and Credit Risk Steering Committee of the IAFE (International Association of Financial Engineers), and the regional director in Toronto of PRMIA (Professional Risk Management International Association). He is also one of the founders of RiskLab, an international network of research centres in Financial Engineering and Risk Management, initiated by the University of Toronto and Algorithmics.
He holds several degrees, including an M.A.Sc. and a Ph.D. in Chemical Engineering from the University of Toronto.

www.R2-financial.com