Embed Size (px)
Citation preview

Board of Directors Meeting Highlights Held on January 18, 2018 at 9:00 AM
at the MRF Board Room
Amended Blue Box Program Plan Fails to Meet Expectations
It is with disappointment that we cannot recommend the Amended Blue Box Program Plan (a-BBPP) as presented. The failure to present an acceptable plan rests solely on Stewardship Ontario (SO) and their flagrant disregard for the consultation process and the solutions presented to them to resolve the issues. Instead, they proceeded with the presentation of the BC plan version 2.0 despite repeatedly being told it would never be acceptable in Ontario. The outcome is truly disappointing as the process was launched as a result of an historical accord between Ontario municipalities and Stewardship Ontario. The objectives of the accord were for the a-BBPP to:
1) act as the transition from the current shared cost model to the future IPR model under the RRCEA;
2) accelerate the transition before 2023; 3) define how the transfer of services to SO would take place where desired; 4) address payments to non-transitioned programs based on verified net costs; 5) establish the arrangement with SO by which Newspapers will meet their obligation for old
newsprint without cost to transitioned municipalities. Instead, Stewardship Ontario delivered a plan that:
1) attempts to transition municipalities to a program controlled by the Stewards without any clear process to move to full IPR under RRCEA at any time if ever;
2) extends the transition to 2027; 3) loosely defines how the transfer of services to SO would take place where desired without any
clear terms and conditions, collecting less materials and serving less customers than the current programs;
4) fails to fully address payments to non-transitioned programs based on verified net costs with in fact having less eligible costs resulting in payments lower than currently provided;
5) failed to provide clear payment of the old newsprint without cost to transitioned municipalities. The draft a-BBPP is a 56 page document designed to replace the 244 page original Blue Box Program Plan without counting its many amendments since 2002. It is significantly lacking in details by design to leave to interpretation key parts of the program that can be later defined and adjusted. Unfortunately, the current proposal leaves so much to interpretation that we cannot with any certainty report on what materials will be collected from who exactly and how much it will truly cost the municipalities. Furthermore, we cannot report why certain materials will be included or excluded from the program.
February 07, 2018 Page 1 of 12

In general, the a-BBPP issues can be summarized into five main categories: 1) Move to individual producer responsibility (timeline) 2) Transparency (definitions, targets, metrics) 3) Governance & decision-making (process mechanisms) 4) Environmental outcomes (obligated, standardized list) 5) Legacy (stranded assets, eligible costs, in-kind)
Municipalities spent countless hours developing solutions to the many issues under each of these main issue categories. The municipalities did so under the understanding this was to be a collaborative process. We had the utmost desire to reach an acceptable plan. SO has missed an opportunity to take our BBPP to the next level in Ontario because of their greed and shortsightedness. The current presented draft a-BBPP fails to address provincial interests, because it;
• Negatively impacts Ontarians’ experience with and access to existing recycling services as it excludes many groups that are currently serviced such as municipal buildings, schools, churches, long term care facilities, hospitals, downtown businesses, parks and public areas, to name a few;
• Does not measurably and continuously improve environmental outcomes since it reduces the scope of materials collected and does not significantly expand the collection program to non-serviced areas;
• Does not create a consistent recycling experience for all Ontario residents as it suggests a transition period that will last nine years at a minimum and could extend into perpetuity leaving residents with mismatched programs; and
• Ensures SO has full control of the system to discharge its obligations at the lowest possible cost without a fair and open marketplace with the use of unachievable goals, punitive damages, and payments based on “benchmark” rather than real costs.
The a-BBPP cannot be approved in good conscience by any of the stakeholders. We believe that the position presented by SO is not an accurate reflection of the majority of producers views and desire but rather an effort by those in power at SO to maintain their current monopsony as long as they can. With the accord, SO had begun a reconciliation process with the municipalities but we now see that it was simply another tactic to delay the inevitable. This is the same group that was legislated to pay 50% of the Blue Box costs and has never paid their share. They have even taken municipalities to arbitration to avoid paying their share. They continue to introduce complex and non-recyclable packaging in the marketplace but refuse to take responsibility for them. Our members, like other municipalities in Ontario have been the provider of the Blue Box programs for approximately three decades. We want good environmental outcomes for our ratepayers by providing fair and reasonable solutions that satisfies the Minister’s direction. Unfortunately, the producers objective remains shortsighted economically focused. For more details, we have attached the final submission of M3RC to the Authority on the proposal which was co-signed by all major stakeholders in the proposal. A copy of the proposed amended Blue Box Program Plan can be retrieved from Stewardship Ontario’s website at http://stewardshipontario.ca/a-bbpp/ We will continue to keep you apprised of any further development on this file.
February 07, 2018 Page 2 of 12

Ontario Blue Box Recovery Rate Slips, But Paper Steady
The reported recovery rate of Ontario’s residential Blue Box system has fallen to its lowest level since 2005. The draft recovery rates, to be finalised by Stewardship Ontario in December, show a 2016 recovery rate of 62.4%, down 2% on the previous year. This will make the recent “request” by Ontario’s minister of environment and climate change for a new Blue Box recovery rate of 75% rather interesting. Some 75% of what’s currently being recovered is paper of one kind or another, the same as it was back in 2003. Printed paper (newspapers, magazines and catalogues, telephone books and printing and writing paper) has the highest recovery rate overall (81%), followed by glass packaging (70%), paper packaging (67%) and steel packaging (63%). Paper packaging is the only material grouping whose recovery rate has either stayed at the same level or improved in every category (boxboard up 9%), with corrugated boxes again the recovery leader overall at a hard-to-believe 98 per cent. The glass recovery rate has dropped significantly from 2015 but the Blue Box laggards continue to be aluminum and plastics packaging at 38% and 29% recovery respectively. Plastics packaging recovery has gone down in almost every category and now represents 43% of what ends up going to disposal (on a weight basis). It’s also by far the most expensive material to recover (the net cost of recovering plastic film, for example, is listed at $2,646 a tonne)
February 07, 2018 Page 3 of 12

China Revises Scrap Paper Import Contamination Restrictions
In a series of Nov. 15 filings with the World Trade Organization (WTO), China's Ministry of Environmental Protection (MEP) proposed adopting Environmental Protection Control Standards for Imported Solid Wastes as Raw Materials (GB 16487.2-13) on Dec. 31, 2017 with an "entry into force" on March 1, 2018. These filings describe a slight relaxation of the previously announced 0.3% carried waste standard for all materials. The new standard for both "waste and scrap of plastics" and "waste and scrap of paper or paperboard" would be 0.5%. The MEP also proposed a 0.5% standard for smelt slag, wood, waste electric motors, wires and cables, metal and appliance scrap, and ferrous metals. The standard for non-ferrous metals would be 1.0%. The automobile scrap standard is still 0.3%. All filings list "Protection of human health or safety; Protection of animal or plant life or health; Protection of the environment" as the objective of these proposals. China proposed the following standards for contamination, which would apply beginning March 1, 2018:
• smelt slag, 0.5 percent;
• wood, 0.5 percent;
• paper, 0.5 percent;
• ferrous, 0.5 percent;
• nonferrous, 1 percent;
• electric motors, 0.5 percent;
• wires and cables, 0.5 percent;
• metal and appliances, 0.5 percent;·
• vessels, 0.05 percent;
• plastic, 0.5 percent; and
• autos, 0.3 percent. We are pleased to see that there has been movement away from the 0.3 percent thresholds, the new proposed threshold levels are still of great concern.
February 07, 2018 Page 4 of 12

Plastic bags no more: Victoria to implement ban July 1
The City of Victoria plans to ban businesses from offering plastic bags to consumers starting July 1, 2018. Councillors have approved a bylaw which prohibits grocery stores from offering or selling plastic bags to shoppers. Stores can still offer paper bags or reusable bags for a cost if customers ask. Under the new ban, there will be exceptions. Stores can still offer plastic bags to package bulk items as well as for meat, prescriptions and dry cleaning. Victoria, like other cities across Canada, is struggling with the amount of waste single-use, plastic bags create. It says 17 million plastic bags are used each year by Victoria residents, and they make up more than 15 per cent of landfill waste. Starting in January, the city will spend $30,000 to run education programs about the ban. It will also launch a contest looking for the most "creative and compelling idea," to inspire people to make the shift to reusable shopping bags. The winner will be awarded $2,000. In 2019, businesses that do not conform to the ban could face fines ranging from $100 to $10,000.
It’s Been a Year Since California Banned Single-Use Plastic Bags. The World Didn’t End.
It’s been a year since Californian banned most stores from handing out flimsy, single-use plastic bags to customers. It was the first and remains the only, U.S. state to do so. But guess what? In the end, this momentous change was not a big deal. Shoppers did not revolt or launch recall campaigns against state lawmakers. Food still gets to people’s houses. Reusable bags did not spark an epidemic of food-borne illnesses, as some critics suggested they would. Consumers didn’t go broke paying 10 cents apiece for the thicker, reusable plastic bags stores are allowed to distribute instead. For the most part, Californians took in stride the sudden absence of some 13 billion bags that in previous years were handed out at grocery checkout counters and by other retailers of all sorts. Maybe a few grumbled at first about the inconvenience. But most adjusted quickly, perhaps because they intuited that something was not right about all those plastic bags hanging from trees, caught up in storm drains, clumped by the sides of freeways and floating in the ocean. Although local bans already had cut down considerably on the plastic bag litter on beaches, the figure dropped further this year after passage of the statewide ban, preliminary data show. Plastic bags (both the banned and the legal variety) accounted for 3.1% of the litter collected from the state’s beaches during the 2017 Coastal Cleanup Day, down from to 7.4% in 2010. So much for all the terrible things plastic-bag makers warned would happen during their multimillion campaign to persuade voters to reject the ban last November. In fact, this first year unfolded pretty much the way proponents had predicted. That’s an important lesson for next time. And there must be a next time. Because although it took several years and a fierce political fight to accomplish, banning disposable plastic grocery bags (known as T-shirt bags because of their design) was just the first salvo in the battle to reduce disposable plastic waste. There is still far too much single-use plastic tossed out every day — heaps of beverage cups and lids, snack wrappings, potato chip bags, water bottles and take-out food containers. Plastic litter isn’t just ugly to look at, it is a threat to the environment. As studies continue to show, plastic is accumulating rapidly in every corner of the natural environment. Plastic doesn’t biodegrade like paper. It breaks into smaller and smaller bits that are showing up in increasing numbers in oceans and are being eaten by seabirds and fish. There’s evidence that microplastics are creeping into our own food chain; it can contain toxins like Bisphenol A, an endocrine disrupter.
February 07, 2018 Page 5 of 12

Globe and Mail newspaper to get 'trimmer' — cut Monday to Friday sections in half
The Globe and Mail says it will offer a "trimmer" product to make handling easier for readers and save money on newsprint costs. Publisher and CEO Phillip Crawley says the Toronto-based company will save about $1 million per year on newsprint as it cuts the width of its printed product to 10 inches (25.4 centimetres) from the current 11 inches (28 centimetres). He says the company spent $8.2 million on newsprint in its last fiscal year. The savings therefore amount to about 12%. He says a similar slimming down of the newspaper from 12 inches in 2010 proved popular with readers.
The Globe and Mail's Publisher and CEO, Phillip Crawley, and former Editor-in-Chief, John Stackhouse review the 2010 redesigned Globe and Mail. (CNW Group/Globe and Mail) The revamp comes at a tumultuous time for newspapers. On Monday, Postmedia and Torstar announced they will trade 42 newspaper titles, mainly in Ontario, and close most of them, citing a lack of advertising revenue. The Globe's redesign includes putting Monday to Thursday content in two sections instead of four, although Crawley says the amount of space for news stories will remain the same. Friday's newspaper will include a newly minted national real estate section. He says online data collected by Sophi, the Globe's proprietary data analytics tool, have influenced the redesign, just as it is influencing daily editorial and advertising decisions. A subsidiary of the Globe and Mail and the Toronto Star's owner Torstar holds investments in The Canadian Press as part of a joint agreement with the parent company of Montreal's La Presse.
February 07, 2018 Page 6 of 12

Toronto Blue Bins Will Be Sifted Through To See Who's Putting In The Wrong Items
Materials that aren't recyclable are contaminating bins, and it’s costing taxpayers millions, the city says.
Typically, 26 per cent of what goes into Toronto blue bins is considered garbage, according to the city. Dear resident: Don’t be surprised to see someone rummaging through your blue bin after it’s put out to the curb for collection. And it won’t be the guy who usually goes down your street, rifling bins for bottles that can be returned for a deposit. The city is sending out inspectors to see exactly what people are putting in their blue bins and warning them that if it’s contaminated with materials that shouldn’t be in it, they could end paying a “cost recovery fee” to remove it. Like everyone, we received a “Dear Resident” letter last week from Jim McKay, general manager of solid waste management, saying the wrong stuff is contaminating recyclables that earn cash for the city. “When a resident sets out a blue bin that contains too many nonrecyclable items, the materials cannot be sorted and can ruin perfectly good recycling that must be sent to landfill,” McKay said. The letter said 52,000 tonnes of stuff that can’t be recycled was put into blue bins last year, of which the net cost to the city was about $10 million. “In order to help offset these costs and reduce the amount of recycling ending up in landfill, the city may require a cost recovery payment from homeowners who set out contaminated recycling bins,” he said. That sentence jumped off the page, suggesting the city would have to engage in wholesale snooping to identify offenders.
February 07, 2018 Page 7 of 12

The World’s Most Wasteful Countries
The average person generates over 1.5 tonnes of solid waste per year, but which country produces the most waste in a single day? The average household produces more than a tonne of waste every year – and it’s during the festive period that we waste the most. In fact, over Christmas we create 30 percent more waste than usual. Everything from cards and envelopes, wrapping paper, boxes from biscuits and chocolates, shopping bags, wine bottles and toy packaging – on average, each household will chuck out an extra five bags of waste over Christmas, adding up to 736,571 tonnes of refuse every year. Overall recycling rates are increasing, but so is our population. Countries around the world are generating large amounts of waste as their populations grow and their economies expand. The amount of waste generated by urban residents in 2016 is estimated to have doubled to 1.2 kilograms per capita per day from 0.64 kilograms per capita per day 10 years ago. On a yearly basis, this equates to 1.3 billion tonnes per year in 2016, versus about 680 million tonnes per year a decade ago. The World Bank has reported that the amount of urban waste being produced is growing faster than the rate of urbanisation. In fact, by 2025 there will be 1.4 billion more people living in cities worldwide, with each person producing an average of 1.42kg of municipal solid waste (MSW) per day – more than double the current average of 0.64kg per day. Annual worldwide urban waste is estimated to more than triple, from 0.68 to 2.2 billion tonnes per year. The top producers of waste are small island nations. These include:
• Kuwait • Antigua and Barbuda • St. Kitts and Nevis • Guyana • Sri Lanka
Waste accumulation in places like Kuwait lack proper landfills to dispose of all the waste, whereas in places such as Antigua, Barbados and St. Kitts, a large majority of waste is accumulated due to tourism. What is clear is that none of these countries have the necessary infrastructure for proper sanitation and waste removal. In fact, recent reports suggest that more than half of the world’s population does not have access to regular waste collection. On the flip side, the more urbanised and industrialized a country become, the more waste it produces. The top producers in the developed world are:
• New Zealand • Ireland • Norway • Switzerland • United States
February 07, 2018 Page 8 of 12

OSHA releases statement on fatal occupational injuries in 2016
While workplace fatalities increased 7 percent from 2015, fatalities declined in the waste and recycling industry. The Bureau of Labor Statistics’ “Census of 2016 Fatal Occupational Injuries” reports 5,190 workplace fatalities occurred in 2016, a 7 percent increase from 2015. The fatal injury rate also increased from 3.4 per 100,000 full-time equivalent workers in 2015 to 3.6 in 2016. The census was based on data from the Occupational Safety and Health Administration (OSHA). Despite this overall increase, in the public and private waste and recycling industry, fatalities declined from 50 in 2015 to 42 in 2016. “This should give our industry a little encouragement that our organizational commitment to a strong safety culture and our safety processes are having an impact,” NWRA President and CEO Darrell Smith says in a news release responding to the OSHA data. He says the NWRA and its members will continue to look for opportunities to improve. “Zero is possible.” Smith adds, “Since our board of trustees designated safety as a strategic initiative in 2015, NWRA has worked to provide its members with tools and outreach efforts including Safety Stand Downs and our Safety Professional Development Series, as well as collecting our own data from members to monitor trends in the industry. We are also preparing for additional programs in 2018.” More workers lost their lives in transportation incidents than any other event in 2016, accounting for about 1 out of every 4 fatal injuries, OSHA says. “In early 2016, NWRA convened an unprecedented industry wide Safety Summit to significantly reduce crashes, injuries and fatalities by building out sustainable prevention measures and engagement processes for a stronger industry safety culture,” NWRA National Safety Director Anthony Hargis says. Over the past three years, NWRA and its chapters have championed “Slow Down to Get Around” legislation, which is now the law in 16 states and under consideration in several more. These laws require motorists slow down when waste and recycling collection vehicles are stopped and workers are getting on and off, just as motorists are required to slow down in construction work zones, stop for school buses and pull over for emergency vehicles. The NWRA notes that fatalities declined at landfills and material recovery facilities (MRFs), while they remained the same in the waste collection industry. The refuse and recyclable material collector fatalities also declined to 31 as did the fatal work injury rate (34.1 per 100,000 full-time equivalent workers); however, this occupation retained its position at the fifth most dangerous industry. Looking more broadly at the OSHA report, workplace violence injuries increased by 23 percent, making it the second most common cause of workplace fatality. The report also shows the number of overdoses on the job increased by 32 percent in 2016, while the number of fatalities has increased by at least 25 percent annually since 2012. Loren Sweatt, OSHA deputy assistant secretary, says, “Today’s occupational fatality data show a tragic trend with the third consecutive increase in worker fatalities in 2016—the highest since 2008. America’s workers deserve better.” She adds that OSHA will address the trends revealed by the report through enforcement, compliance assistance, education and training and outreach. “The Department of Labor will work with public and private stakeholders to help eradicate the opioid crisis as a deadly and growing workplace issue.” The NWRA’s Hargis expresses the association’s desire to work with its members and partners to improve safety, saying, “NWRA is completely committed to achieving a positive and robust safety culture industry wide.”
February 07, 2018 Page 9 of 12
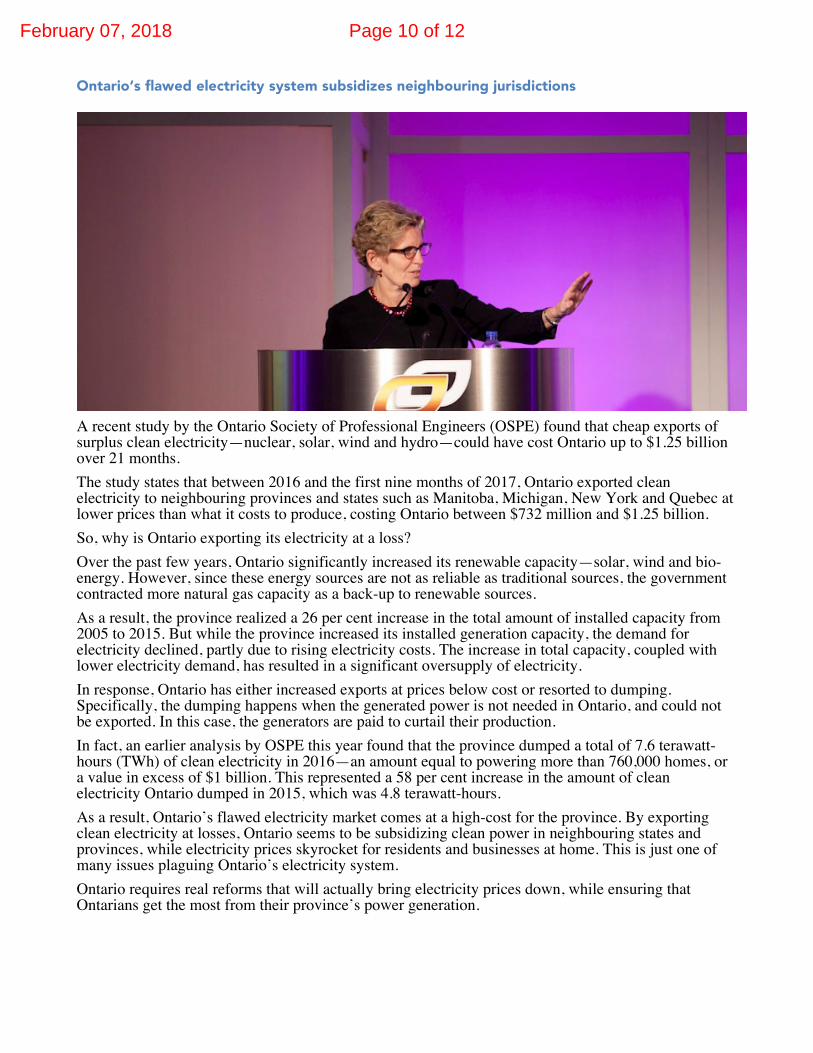
Ontario’s flawed electricity system subsidizes neighbouring jurisdictions
A recent study by the Ontario Society of Professional Engineers (OSPE) found that cheap exports of surplus clean electricity—nuclear, solar, wind and hydro—could have cost Ontario up to $1.25 billion over 21 months. The study states that between 2016 and the first nine months of 2017, Ontario exported clean electricity to neighbouring provinces and states such as Manitoba, Michigan, New York and Quebec at lower prices than what it costs to produce, costing Ontario between $732 million and $1.25 billion. So, why is Ontario exporting its electricity at a loss? Over the past few years, Ontario significantly increased its renewable capacity—solar, wind and bio-energy. However, since these energy sources are not as reliable as traditional sources, the government contracted more natural gas capacity as a back-up to renewable sources. As a result, the province realized a 26 per cent increase in the total amount of installed capacity from 2005 to 2015. But while the province increased its installed generation capacity, the demand for electricity declined, partly due to rising electricity costs. The increase in total capacity, coupled with lower electricity demand, has resulted in a significant oversupply of electricity. In response, Ontario has either increased exports at prices below cost or resorted to dumping. Specifically, the dumping happens when the generated power is not needed in Ontario, and could not be exported. In this case, the generators are paid to curtail their production. In fact, an earlier analysis by OSPE this year found that the province dumped a total of 7.6 terawatt-hours (TWh) of clean electricity in 2016—an amount equal to powering more than 760,000 homes, or a value in excess of $1 billion. This represented a 58 per cent increase in the amount of clean electricity Ontario dumped in 2015, which was 4.8 terawatt-hours. As a result, Ontario’s flawed electricity market comes at a high-cost for the province. By exporting clean electricity at losses, Ontario seems to be subsidizing clean power in neighbouring states and provinces, while electricity prices skyrocket for residents and businesses at home. This is just one of many issues plaguing Ontario’s electricity system. Ontario requires real reforms that will actually bring electricity prices down, while ensuring that Ontarians get the most from their province’s power generation.
February 07, 2018 Page 10 of 12

101.9
108.1 107.3 105.7 104.9 103.1 101.3 99.0
101.3 103.9
106.1
114.7 118.7
60.0
70.0
80.0
90.0
100.0
110.0
120.0
130.0
Dec-
16
Jan-
17
Feb-
17
Mar
-17
Apr-
17
May
-17
Jun-
17
Jul-1
7
Aug-
17
Sep-
17
Oct-
17
Nov
-17
Dec-
17
¢/l
Diesel Price (Retail incl. Tax)
60.0
70.0
80.0
90.0
100.0
110.0
120.0
130.0
140.0
150.0
Jan-
12
Apr-
12
Jul-1
2
Oct-
12
Jan-
13
Apr-
13
Jul-1
3
Oct-
13
Jan-
14
Apr-
14
Jul-1
4
Oct-
14
Jan-
15
Apr-
15
Jul-1
5
Oct-
15
Jan-
16
Apr-
16
Jul-1
6
Oct-
16
Jan-
17
Apr-
17
Jul-1
7
Oct-
17
¢/l
Diesel Price (Retail incl. Tax)
February 07, 2018 Page 11 of 12

140 152
170
189
166
150 159
170 166 157
128 125 124
0
20
40
60
80
100
120
140
160
180
200
Dec-
16
Jan-
17
Feb-
17
Mar
-17
Apr-
17
May
-17
Jun-
17
Jul-1
7
Aug-
17
Sep-
17
Oct-
17
Nov
-17
Dec-
17
$/to
nne
Commodity Prices
0
20
40
60
80
100
120
140
160
180
200
Jan-
1
Apr-
Jul-1
Oct-
1
Jan-
1
Apr-
Jul-1
Oct-
1
Jan-
1
Apr-
Jul-1
Oct-
1
Jan-
1
Apr-
Jul-1
Oct-
1
Jan-
1
Apr-
Jul-1
Oct-
1
Jan-
1
Apr-
Jul-1
Oct-
1
$/to
nne
Commodity Prices
February 07, 2018 Page 12 of 12