Embed Size (px)
Citation preview
How Markets WorkSM
February 2008
China Product Recalls: What’s at Stake and What’s Next
Lucy P. Allen
Dr. Renzo Comolli
Dr. Simona Heumann
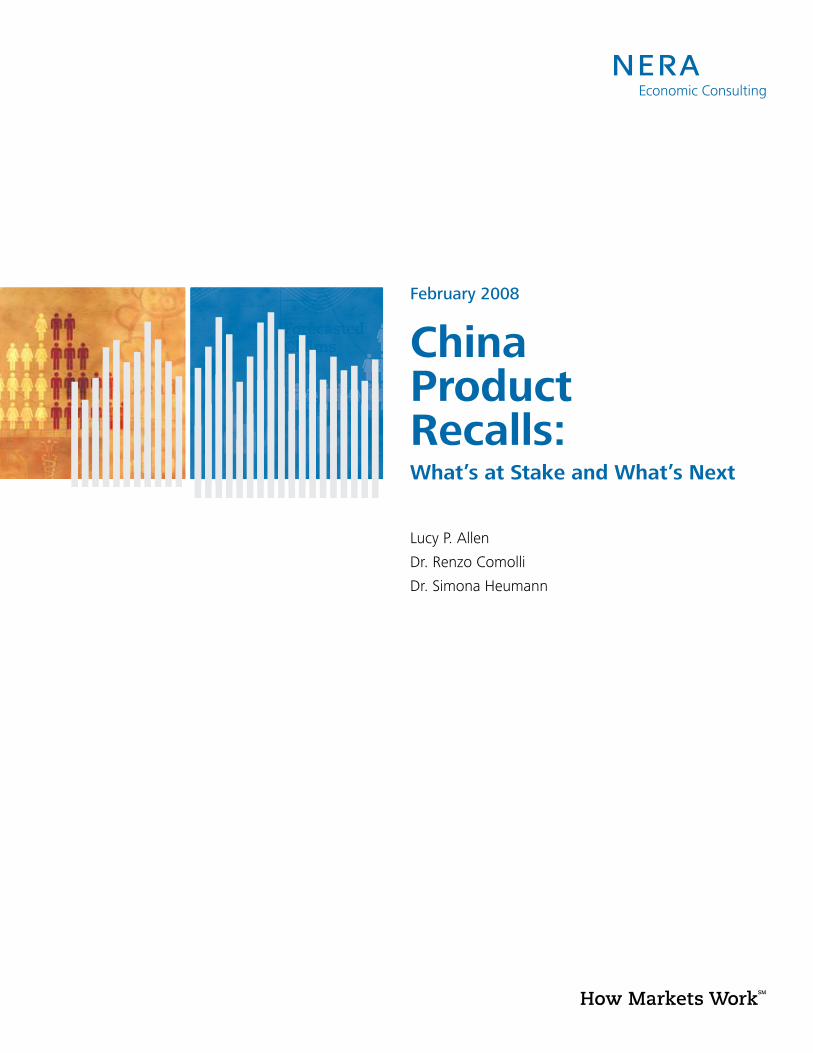
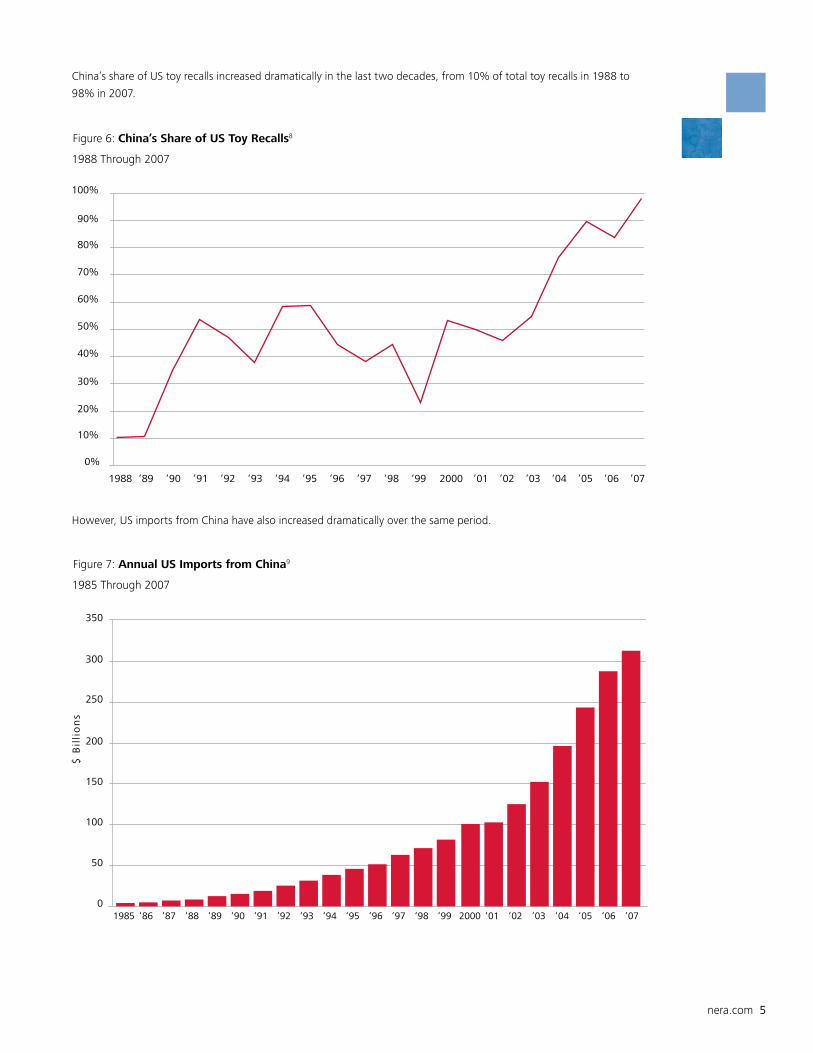
China’s share of US toy recalls increased dramatically in the last two decades, from 10% of total toy recalls in 1988 to 98% in 2007.
nera.com 1
China Product Recalls: What’s at Stake and What’s Next
Lucy P. Allen and Dr. Renzo Comolli with Dr. Simona Heumann*
February 2008
2007: THE YEAR OF THE CHINA RECALLThroughout 2007, the front pages of newspapers were filled with stories of toys contaminated with lead, tainted pet
food, and toothpaste laced with antifreeze. According to the press, a large number of these recalled products were
connected to Chinese manufacturers, and 2007 was dubbed “the year of China recalls.” These stories raised numerous
questions about the present and future magnitude of the “China recall” problem.
To evaluate the assertions made in the popular press, it is useful to consider the recent recall activity in light of history.
Although 2007 saw more consumer product recalls than previous years, consumer product recalls had been on the rise
for the past several years. In 2007, it appears this trend accelerated.
The trend within the toy industry, however, appears to be different. Although the number of toy recalls had been
relatively stable over the last two decades, there was a sharp spike in toy recalls in 2007. China’s share of US toy recalls
also rose significantly—in fact, China-related toy recalls accounted for nearly all toy recalls in 2007.
During 2007, the presence of potentially hazardous levels of lead was the leading cause of recalled consumer products
manufactured in China. The number of consumer product recalls related to potentially hazardous levels of lead has
grown exponentially since 2000.
Below, we investigate these trends in greater detail, providing statistics on recall types, magnitudes, and countries of
origin. All figures refer to US recalls. We also report data on recalls by regulatory agency. Lastly, we outline techniques
that may be used in estimating the wide-ranging costs associated with such recalls. Using Mattel as an example, we
perform a simplified application of one such technique to obtain a preliminary understanding of the market’s estimate
of such costs. Mattel issued several recalls of Chinese-made toys in 2007, several of which were highly publicized in
the press. However, our analysis indicates that the market’s estimate of the economic impact of Mattel’s recalls on the
company was negligible, and not statistically different from zero.
2 nera.com
IN 2007, PRODUCTS FROM CHINA DOMINATED RECALLSThroughout 2007, China was in the spotlight of the news about product recalls, with a particular focus on the toy and
pet food industries. Tire recalls and warnings about toothpaste laced with an antifreeze ingredient also commanded
attention. (See the timeline on pages 14 and 15 for a list of recall-related press coverage.)
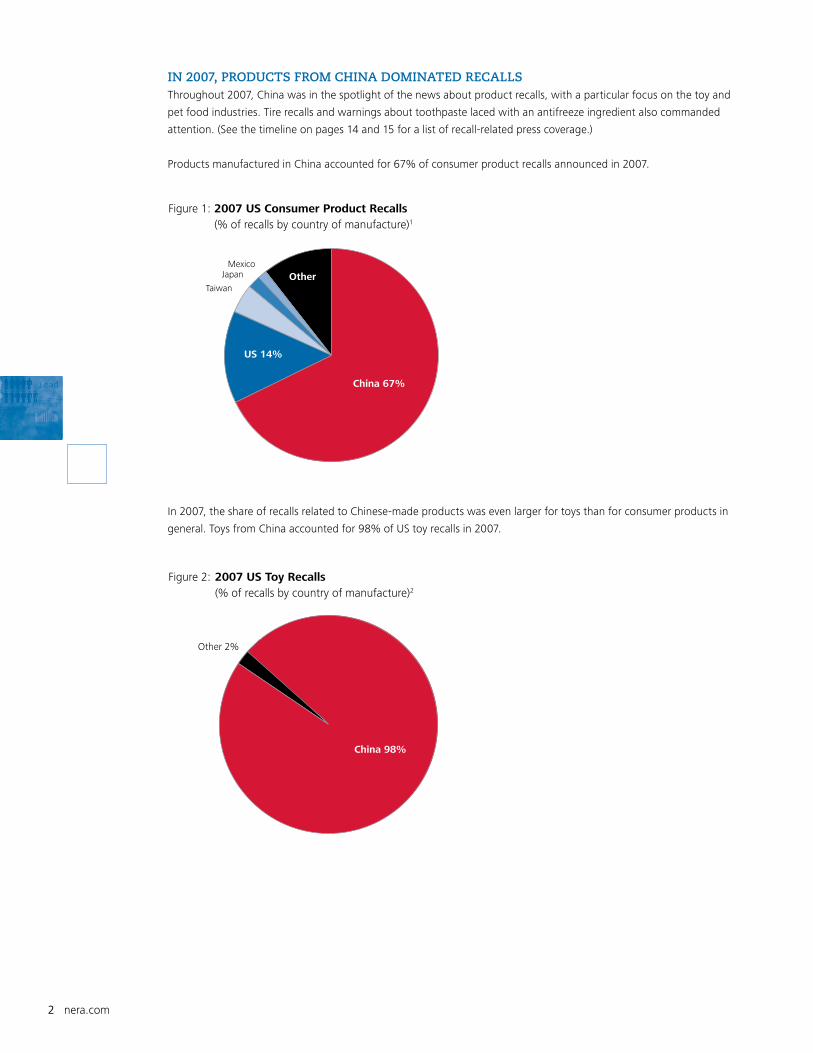
Products manufactured in China accounted for 67% of consumer product recalls announced in 2007.
Figure 2: 2007 US Toy Recalls (% of recalls by country of manufacture)2
Figure 1: 2007 US Consumer Product Recalls (% of recalls by country of manufacture)1
China 98%
Other 2%
China 67%
US 14%
OtherMexico
Japan
Taiwan
Figure 2: 2007 US Toy Recalls (% of recalls by country of manufacture)2
Figure 1: 2007 US Consumer Product Recalls (% of recalls by country of manufacture)1
China 98%
Other 2%
China 67%
US 14%
OtherMexico
Japan
Taiwan
In 2007, the share of recalls related to Chinese-made products was even larger for toys than for consumer products in
general. Toys from China accounted for 98% of US toy recalls in 2007.
nera.com 3
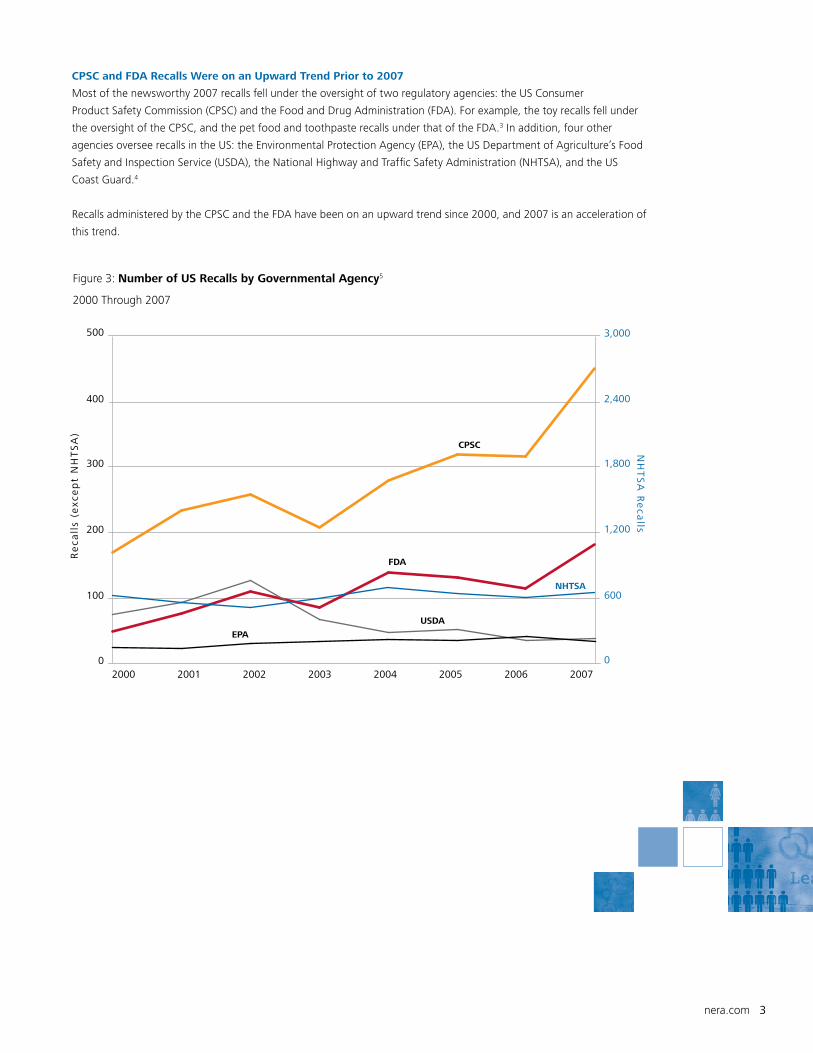
CPSC and FDA Recalls Were on an Upward Trend Prior to 2007
Most of the newsworthy 2007 recalls fell under the oversight of two regulatory agencies: the US Consumer
Product Safety Commission (CPSC) and the Food and Drug Administration (FDA). For example, the toy recalls fell under
the oversight of the CPSC, and the pet food and toothpaste recalls under that of the FDA.3 In addition, four other
agencies oversee recalls in the US: the Environmental Protection Agency (EPA), the US Department of Agriculture’s Food
Safety and Inspection Service (USDA), the National Highway and Traffic Safety Administration (NHTSA), and the US
Coast Guard.4
Recalls administered by the CPSC and the FDA have been on an upward trend since 2000, and 2007 is an acceleration of
this trend.
Figure 3: Number of US Recalls by Governmental Agency5
2000 Through 2007
100
0
200
1,800
2,400
3,000
1,200
600
0
300
500
400
2000 2001 2002 2003 2004 2005 2006 2007
CPSC
FDA
NHTSA
USDA
EPA
Re
call
s (e
xce
pt
NH
TS
A)
NH
TS
A R
eca
lls
4 nera.com
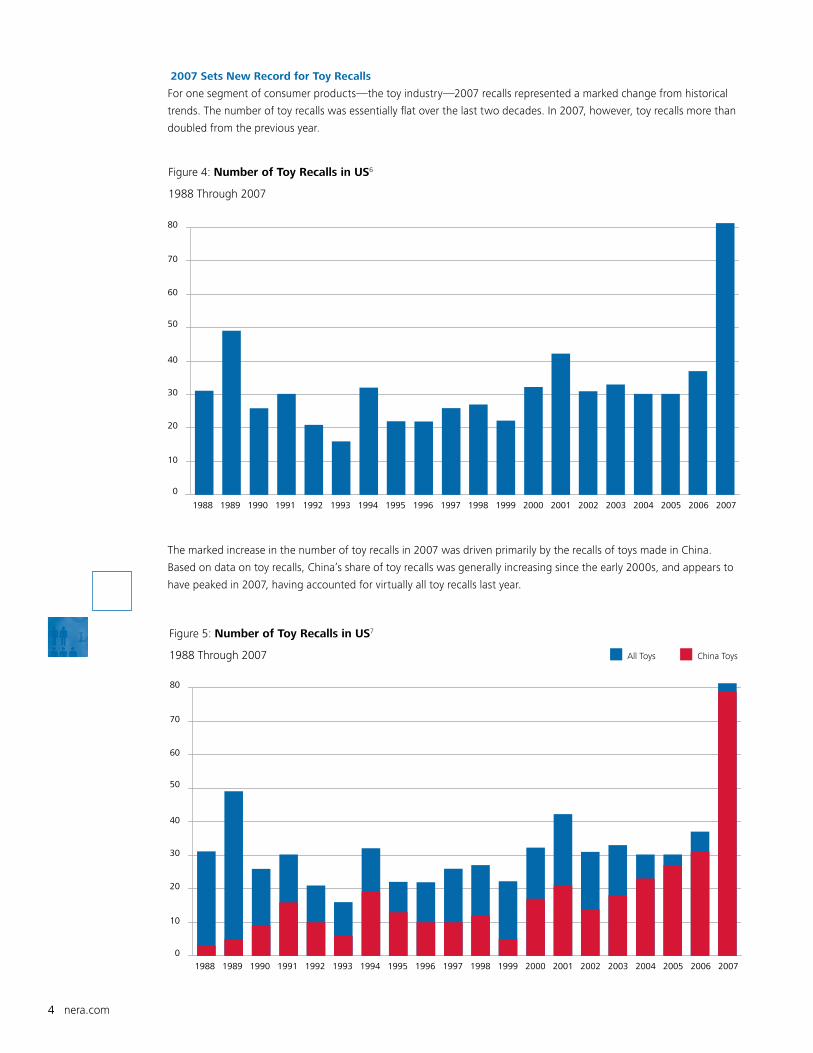
2007 Sets New Record for Toy Recalls
For one segment of consumer products—the toy industry—2007 recalls represented a marked change from historical
trends. The number of toy recalls was essentially flat over the last two decades. In 2007, however, toy recalls more than
doubled from the previous year.
Figure 5: Number of Toy Recalls in US7
1988 Through 2007
10
0
20
30
40
50
70
80
60
1988 1989 1990 1991 1992 1993 1994 1995 1996 1997 1998 1999 2000 2001 2002 2003 2004 2005 2006 2007
All Toys China Toys
Figure 4: Number of Toy Recalls in US6
1988 Through 2007
10
0
20
30
40
50
70
80
60
1988 1989 1990 1991 1992 1993 1994 1995 1996 1997 1998 1999 2000 2001 2002 2003 2004 2005 2006 2007
The marked increase in the number of toy recalls in 2007 was driven primarily by the recalls of toys made in China.
Based on data on toy recalls, China’s share of toy recalls was generally increasing since the early 2000s, and appears to
have peaked in 2007, having accounted for virtually all toy recalls last year.
nera.com 5
China’s share of US toy recalls increased dramatically in the last two decades, from 10% of total toy recalls in 1988 to
98% in 2007.
Figure 7: Annual US Imports from China9
1985 Through 2007
50
0
100
150
200
250
300
350
1985 ‘87‘86 ‘88 ‘89 ‘90 ‘91 ‘92 ‘93 ‘94 ‘95 ‘96 ‘97 ‘98 ‘99 2000 ‘01 ‘02 ‘03 ‘04 ‘05 ‘06 ‘07
$ B
illi
on
s
Figure 6: China’s Share of US Toy Recalls8
1988 Through 2007
10%
0%
20%
30%
40%
50%
60%
70%
80%
90%
100%
1988 ‘89 ‘90 ‘91 ‘92 ‘93 ‘94 ‘95 ‘96 ‘97 ‘98 ‘99 2000 ‘01 ‘02 ‘03 ‘04 ‘05 ‘06 ‘07
However, US imports from China have also increased dramatically over the same period.
6 nera.com
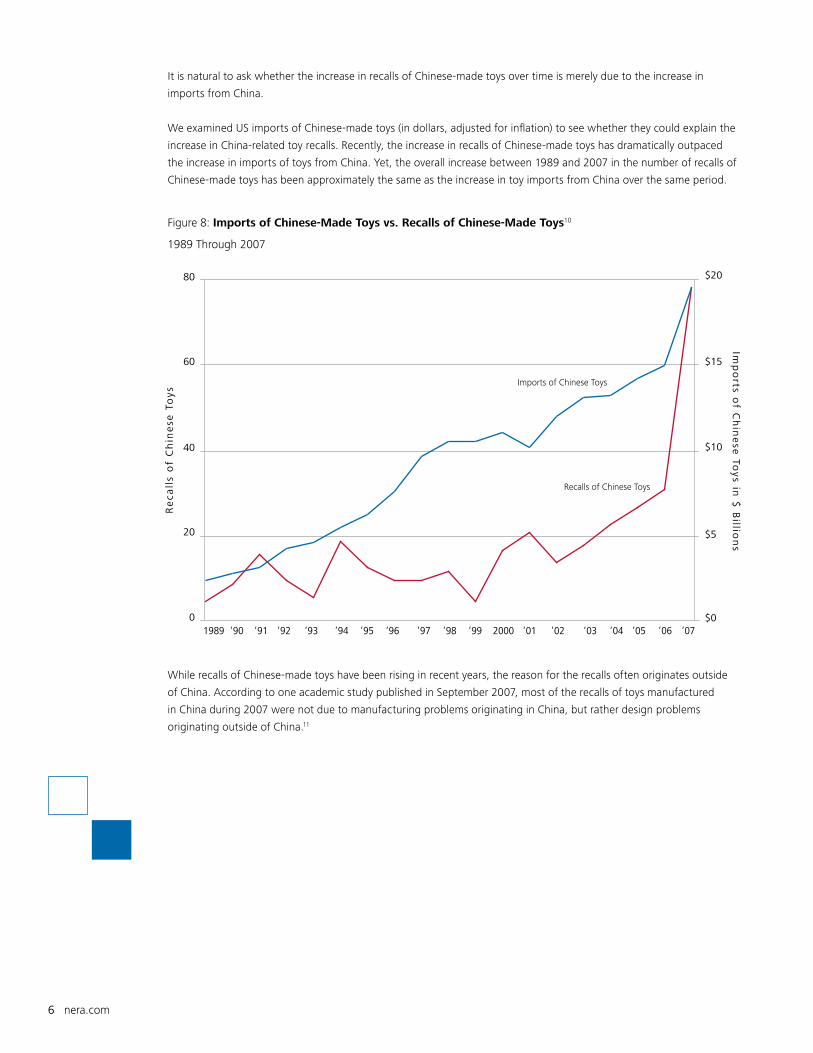
It is natural to ask whether the increase in recalls of Chinese-made toys over time is merely due to the increase in
imports from China.
We examined US imports of Chinese-made toys (in dollars, adjusted for inflation) to see whether they could explain the
increase in China-related toy recalls. Recently, the increase in recalls of Chinese-made toys has dramatically outpaced
the increase in imports of toys from China. Yet, the overall increase between 1989 and 2007 in the number of recalls of
Chinese-made toys has been approximately the same as the increase in toy imports from China over the same period.
Figure 8: Imports of Chinese-Made Toys vs. Recalls of Chinese-Made Toys10
1989 Through 2007
0
40
20
60
Imp
orts o
f Ch
ine
se To
ys in $
Billio
ns
Re
call
s o
f C
hin
ese
To
ys
$15
$20
$10
$5
$0
80
1989 ‘90 ‘91 ‘92 ‘93 ‘94 ‘95 ‘96 ‘97 ‘98 ‘99 2000 ‘01 ‘02 ‘03 ‘04 ‘05 ‘06 ‘07
Imports of Chinese Toys
Recalls of Chinese Toys
While recalls of Chinese-made toys have been rising in recent years, the reason for the recalls often originates outside
of China. According to one academic study published in September 2007, most of the recalls of toys manufactured
in China during 2007 were not due to manufacturing problems originating in China, but rather design problems
originating outside of China.11
nera.com 7
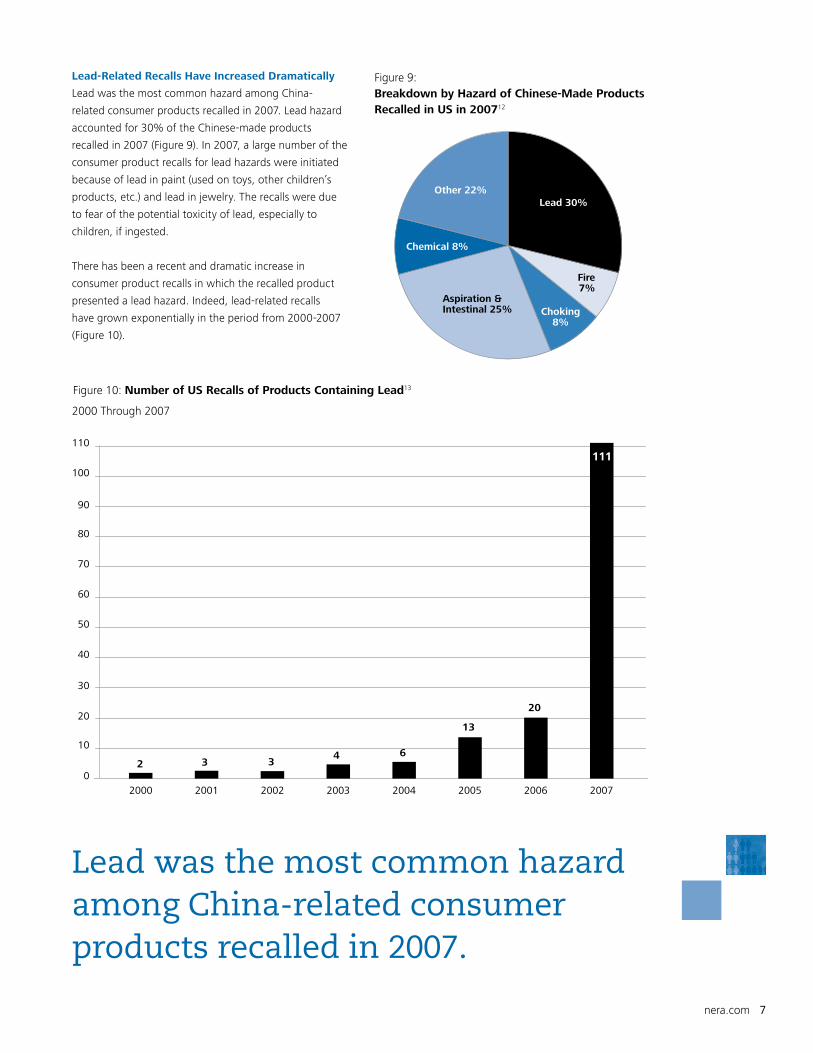
Lead-Related Recalls Have Increased Dramatically
Lead was the most common hazard among China-
related consumer products recalled in 2007. Lead hazard
accounted for 30% of the Chinese-made products
recalled in 2007 (Figure 9). In 2007, a large number of the
consumer product recalls for lead hazards were initiated
because of lead in paint (used on toys, other children’s
products, etc.) and lead in jewelry. The recalls were due
to fear of the potential toxicity of lead, especially to
children, if ingested.
There has been a recent and dramatic increase in
consumer product recalls in which the recalled product
presented a lead hazard. Indeed, lead-related recalls
have grown exponentially in the period from 2000-2007
(Figure 10).
Figure 9:Breakdown by Hazard of Chinese-Made Products Recalled in US in 200712
Lead 30%Other 22%
Chemical 8%
Aspiration &Intestinal 25% Choking
8%
Fire7%
Figure 10: Number of US Recalls of Products Containing Lead13
2000 Through 2007
10
0
20
30
40
50
60
70
80
90
100
110
2000 2001 2002 2003 2004 2005 2006 2007
111
6
13
20
4332
Lead was the most common hazard among China-related consumer products recalled in 2007.
8 nera.com
People WhoMake a Claim
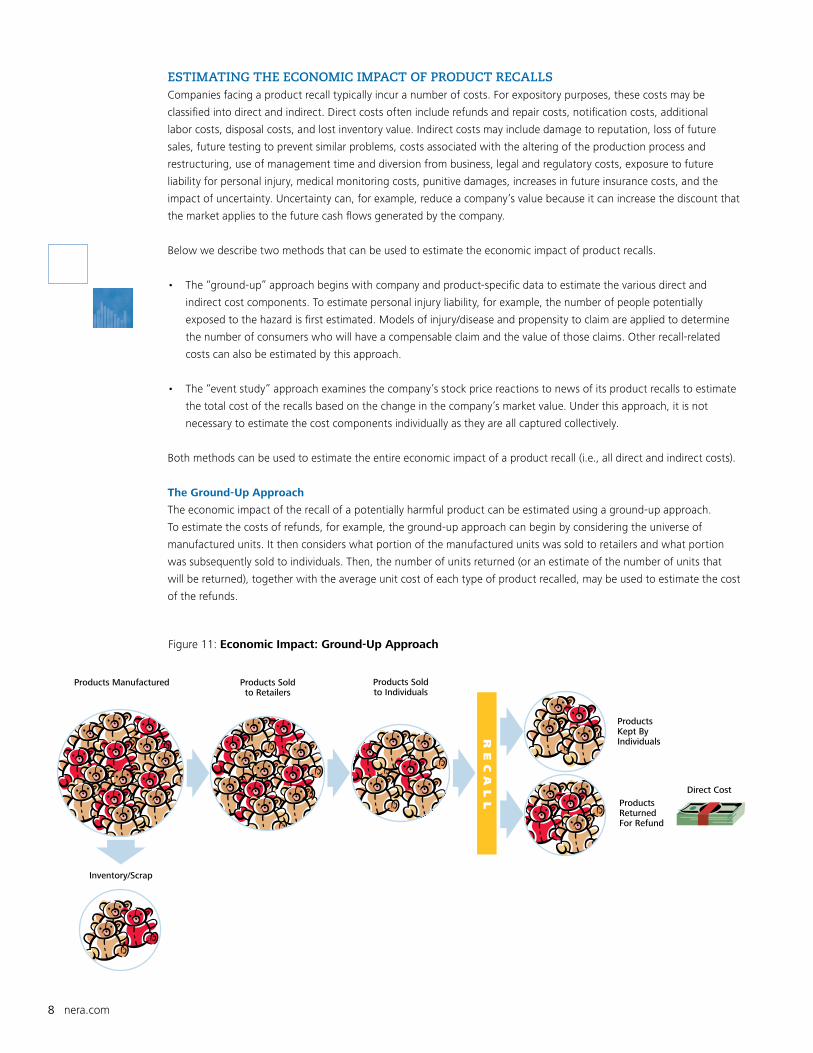
Figure 11: Economic Impact: Ground-Up Approach
Products Manufactured
Inventory/Scrap
Products Soldto Retailers
Products Soldto Individuals
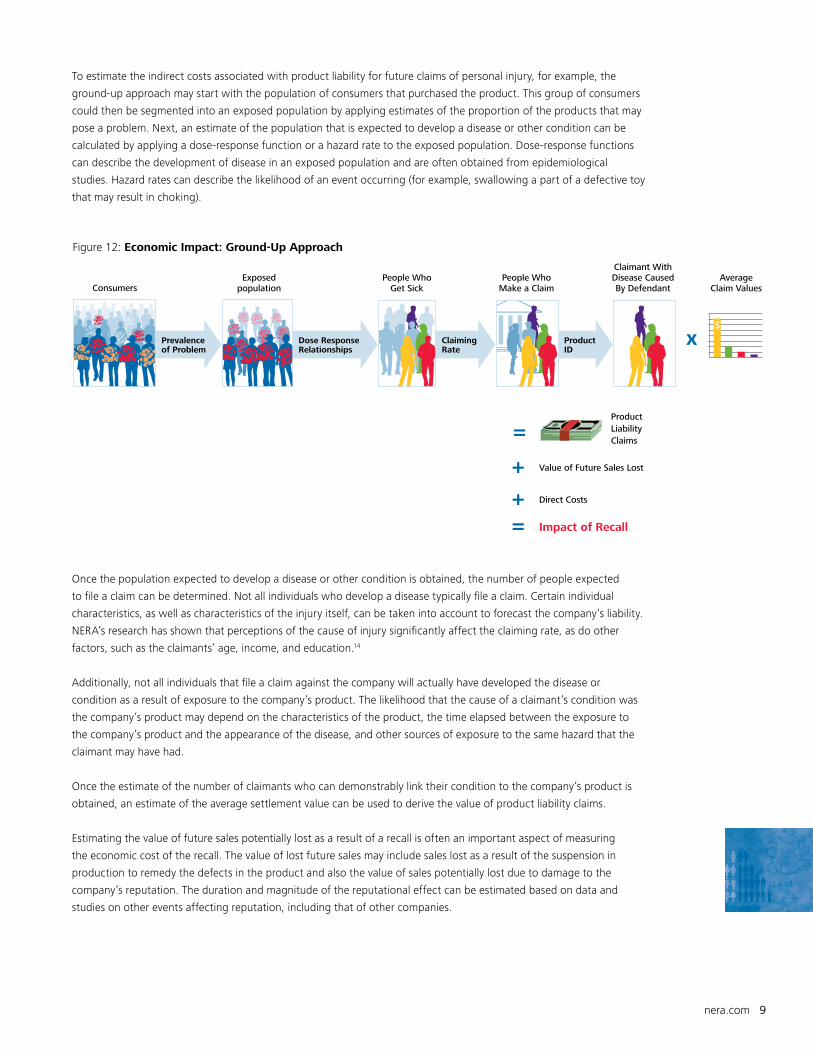
Figure 12: Economic Impact: Ground-Up Approach
x
Product LiabilityClaims
=
Direct Costs+
Value of Future Sales Lost+
Impact of Recall=
Direct Cost
ProductsReturnedFor Refund
ProductsKept ByIndividualsR
EC
AL
L
Claimant WithDisease CausedBy Defendant
ClaimingRate
ProductID
AverageClaim Values
$
People WhoGet SickConsumers
Exposedpopulation
Prevalenceof Problem
Dose ResponseRelationships
ESTIMATING THE ECONOMIC IMPACT OF PRODUCT RECALLSCompanies facing a product recall typically incur a number of costs. For expository purposes, these costs may be
classified into direct and indirect. Direct costs often include refunds and repair costs, notification costs, additional
labor costs, disposal costs, and lost inventory value. Indirect costs may include damage to reputation, loss of future
sales, future testing to prevent similar problems, costs associated with the altering of the production process and
restructuring, use of management time and diversion from business, legal and regulatory costs, exposure to future
liability for personal injury, medical monitoring costs, punitive damages, increases in future insurance costs, and the
impact of uncertainty. Uncertainty can, for example, reduce a company’s value because it can increase the discount that
the market applies to the future cash flows generated by the company.
Below we describe two methods that can be used to estimate the economic impact of product recalls.
• The “ground-up” approach begins with company and product-specific data to estimate the various direct and
indirect cost components. To estimate personal injury liability, for example, the number of people potentially
exposed to the hazard is first estimated. Models of injury/disease and propensity to claim are applied to determine
the number of consumers who will have a compensable claim and the value of those claims. Other recall-related
costs can also be estimated by this approach.
• The “event study” approach examines the company’s stock price reactions to news of its product recalls to estimate
the total cost of the recalls based on the change in the company’s market value. Under this approach, it is not
necessary to estimate the cost components individually as they are all captured collectively.
Both methods can be used to estimate the entire economic impact of a product recall (i.e., all direct and indirect costs).
The Ground-Up Approach
The economic impact of the recall of a potentially harmful product can be estimated using a ground-up approach.
To estimate the costs of refunds, for example, the ground-up approach can begin by considering the universe of
manufactured units. It then considers what portion of the manufactured units was sold to retailers and what portion
was subsequently sold to individuals. Then, the number of units returned (or an estimate of the number of units that
will be returned), together with the average unit cost of each type of product recalled, may be used to estimate the cost
of the refunds.
nera.com 9
To estimate the indirect costs associated with product liability for future claims of personal injury, for example, the
ground-up approach may start with the population of consumers that purchased the product. This group of consumers
could then be segmented into an exposed population by applying estimates of the proportion of the products that may
pose a problem. Next, an estimate of the population that is expected to develop a disease or other condition can be
calculated by applying a dose-response function or a hazard rate to the exposed population. Dose-response functions
can describe the development of disease in an exposed population and are often obtained from epidemiological
studies. Hazard rates can describe the likelihood of an event occurring (for example, swallowing a part of a defective toy
that may result in choking).
People WhoMake a Claim
Figure 11: Economic Impact: Ground-Up Approach
Products Manufactured
Inventory/Scrap
Products Soldto Retailers
Products Soldto Individuals
Figure 12: Economic Impact: Ground-Up Approach
x
Product LiabilityClaims
=
Direct Costs+
Value of Future Sales Lost+
Impact of Recall=
Direct Cost
ProductsReturnedFor Refund
ProductsKept ByIndividualsR
EC
AL
L
Claimant WithDisease CausedBy Defendant
ClaimingRate
ProductID
AverageClaim Values
$
People WhoGet SickConsumers
Exposedpopulation
Prevalenceof Problem
Dose ResponseRelationships
Once the population expected to develop a disease or other condition is obtained, the number of people expected
to file a claim can be determined. Not all individuals who develop a disease typically file a claim. Certain individual
characteristics, as well as characteristics of the injury itself, can be taken into account to forecast the company’s liability.
NERA’s research has shown that perceptions of the cause of injury significantly affect the claiming rate, as do other
factors, such as the claimants’ age, income, and education.14
Additionally, not all individuals that file a claim against the company will actually have developed the disease or
condition as a result of exposure to the company’s product. The likelihood that the cause of a claimant’s condition was
the company’s product may depend on the characteristics of the product, the time elapsed between the exposure to
the company’s product and the appearance of the disease, and other sources of exposure to the same hazard that the
claimant may have had.
Once the estimate of the number of claimants who can demonstrably link their condition to the company’s product is
obtained, an estimate of the average settlement value can be used to derive the value of product liability claims.
Estimating the value of future sales potentially lost as a result of a recall is often an important aspect of measuring
the economic cost of the recall. The value of lost future sales may include sales lost as a result of the suspension in
production to remedy the defects in the product and also the value of sales potentially lost due to damage to the
company’s reputation. The duration and magnitude of the reputational effect can be estimated based on data and
studies on other events affecting reputation, including that of other companies.
10 nera.com
The other recall-related cost components mentioned above (e.g., medical monitoring costs, punitive damages, etc.) can
also be estimated based on their underlying economics, and on either company-specific or other data sets.
While a ground-up approach is generally relevant for all recalls, certain steps described above may not apply to some
recalls, or other steps may be required. The actual estimation approach may be implemented by surveying and sampling
the product recalled or the population exposed, or by analyzing databases of products and their potential defects.
These methods can be applied to data specific to the company and product in question, or adapted to data on similar
companies and products. In addition, data and studies, including medical and economic, which may not be related to
the product in question (or even recalls) can aid in the estimation process by helping to model the underlying forces.
For example, the claiming rate can be modeled based on the factors driving individuals’ propensity to claim and the
economic incentives of plaintiffs’ lawyers.
The Event Study Approach
A second approach to estimating the economic impact of a recall is the event study approach. This approach provides
an estimate of the market’s valuation of the net economic impact of the recall based on all public information available
to the market. It does not distinguish between cost components; rather it provides the market’s estimate of all cost
components as a whole, net of all possible benefits (if any), and net of any expected recovery from insurance.
More specifically, the event study approach estimates the net economic impact of a recall based on the movement
of that company’s stock price and, therefore, the change in the market capitalization of the company following the
announcement of the recall. This approach is based on the financial principle that, in an efficient market, the price of a
stock is the market’s estimate of the present discounted value of the future cash flows expected to be generated by the
company, based on all publicly available information.
To isolate the stock price impact of the recall in question from price changes associated with general market and
industry movements, the event study approach uses a statistical model of the company’s stock price returns.
This estimated statistical model is then used to predict how the company’s stock price would have performed absent
any recall announcement. The difference between the actual stock performance following the announcement and the
predicted stock performance based on the statistical model is often called a (market-adjusted) price reaction. If the
price reaction is statistically significant (i.e., large relative to the usual day-to-day fluctuation of the stock), it may be
interpreted as an indication of the stock price impact of the recall.
According to our simplified event study, the market’s estimate of the economic impact of the 2007 Mattel recalls and related events as a whole was not statistically different from zero.
nera.com 11
Simplified Event Study Approach Applied to Selected 2007 Recall Announcements
In this section, we perform simplified event studies to determine the stock price reactions of four toy companies (Mattel,
Hasbro, RC2, and The Character Group) and one pet food company (Menu Foods) to several announcements of China-
related product recalls and other related news.
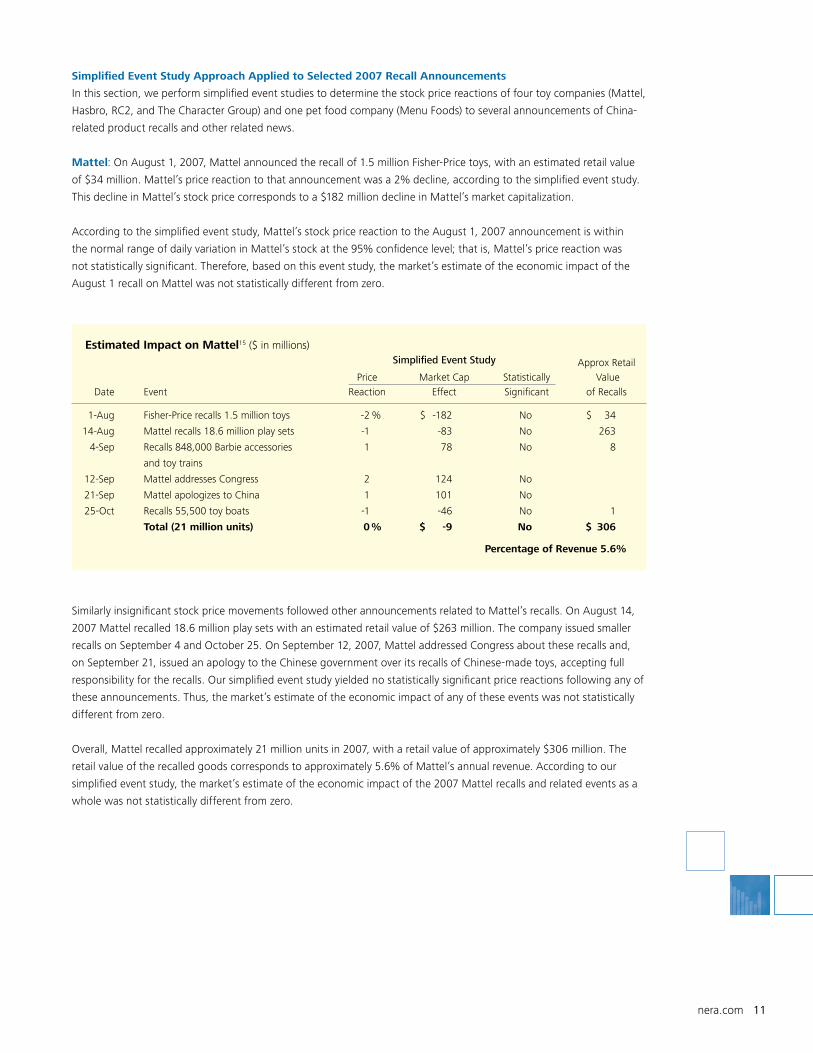
Mattel: On August 1, 2007, Mattel announced the recall of 1.5 million Fisher-Price toys, with an estimated retail value
of $34 million. Mattel’s price reaction to that announcement was a 2% decline, according to the simplified event study.
This decline in Mattel’s stock price corresponds to a $182 million decline in Mattel’s market capitalization.
According to the simplified event study, Mattel’s stock price reaction to the August 1, 2007 announcement is within
the normal range of daily variation in Mattel’s stock at the 95% confidence level; that is, Mattel’s price reaction was
not statistically significant. Therefore, based on this event study, the market’s estimate of the economic impact of the
August 1 recall on Mattel was not statistically different from zero.
Similarly insignificant stock price movements followed other announcements related to Mattel’s recalls. On August 14,
2007 Mattel recalled 18.6 million play sets with an estimated retail value of $263 million. The company issued smaller
recalls on September 4 and October 25. On September 12, 2007, Mattel addressed Congress about these recalls and,
on September 21, issued an apology to the Chinese government over its recalls of Chinese-made toys, accepting full
responsibility for the recalls. Our simplified event study yielded no statistically significant price reactions following any of
these announcements. Thus, the market’s estimate of the economic impact of any of these events was not statistically
different from zero.
Overall, Mattel recalled approximately 21 million units in 2007, with a retail value of approximately $306 million. The
retail value of the recalled goods corresponds to approximately 5.6% of Mattel’s annual revenue. According to our
simplified event study, the market’s estimate of the economic impact of the 2007 Mattel recalls and related events as a
whole was not statistically different from zero.
Estimated Impact on Mattel15 ($ in millions) Simplified Event Study Approx Retail Price Market Cap Statistically Value Date Event Reaction Effect Significant of Recalls
1-Aug Fisher-Price recalls 1.5 million toys -2 % $ -182 No $ 34
14-Aug Mattel recalls 18.6 million play sets -1 -83 No 263
4-Sep Recalls 848,000 Barbie accessories 1 78 No 8
and toy trains
12-Sep Mattel addresses Congress 2 124 No
21-Sep Mattel apologizes to China 1 101 No
25-Oct Recalls 55,500 toy boats -1 -46 No 1
Total (21 million units) 0 % $ -9 No $ 306
Percentage of Revenue 5.6%
12 nera.com
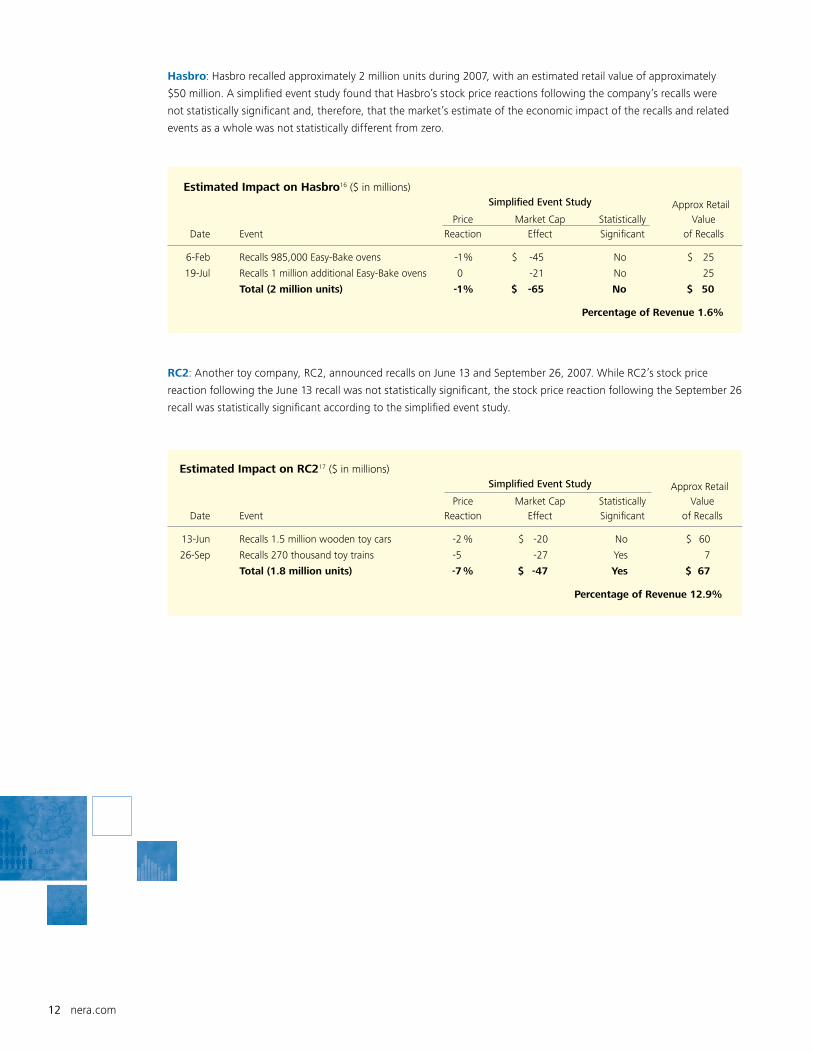
Hasbro: Hasbro recalled approximately 2 million units during 2007, with an estimated retail value of approximately
$50 million. A simplified event study found that Hasbro’s stock price reactions following the company’s recalls were
not statistically significant and, therefore, that the market’s estimate of the economic impact of the recalls and related
events as a whole was not statistically different from zero.
RC2: Another toy company, RC2, announced recalls on June 13 and September 26, 2007. While RC2’s stock price
reaction following the June 13 recall was not statistically significant, the stock price reaction following the September 26
recall was statistically significant according to the simplified event study.
Estimated Impact on Hasbro16 ($ in millions) Simplified Event Study Approx Retail Price Market Cap Statistically Value Date Event Reaction Effect Significant of Recalls
6-Feb Recalls 985,000 Easy-Bake ovens -1 % $ -45 No $ 25
19-Jul Recalls 1 million additional Easy-Bake ovens 0 -21 No 25
Total (2 million units) -1 % $ -65 No $ 50
Percentage of Revenue 1.6%
Estimated Impact on RC217 ($ in millions) Simplified Event Study Approx Retail Price Market Cap Statistically Value Date Event Reaction Effect Significant of Recalls
13-Jun Recalls 1.5 million wooden toy cars -2 % $ -20 No $ 60
26-Sep Recalls 270 thousand toy trains -5 -27 Yes 7
Total (1.8 million units) -7 % $ -47 Yes $ 67
Percentage of Revenue 12.9%
nera.com 13
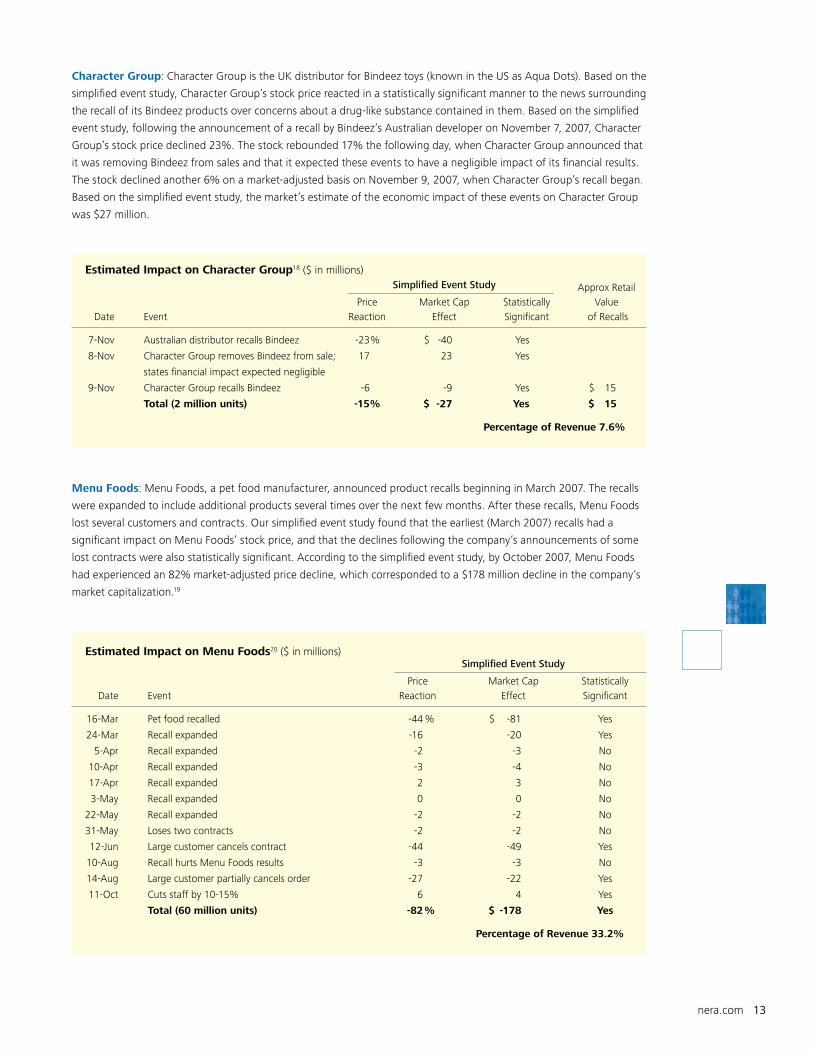
Menu Foods: Menu Foods, a pet food manufacturer, announced product recalls beginning in March 2007. The recalls
were expanded to include additional products several times over the next few months. After these recalls, Menu Foods
lost several customers and contracts. Our simplified event study found that the earliest (March 2007) recalls had a
significant impact on Menu Foods’ stock price, and that the declines following the company’s announcements of some
lost contracts were also statistically significant. According to the simplified event study, by October 2007, Menu Foods
had experienced an 82% market-adjusted price decline, which corresponded to a $178 million decline in the company’s
market capitalization.19
Estimated Impact on Character Group18 ($ in millions) Simplified Event Study Approx Retail Price Market Cap Statistically Value Date Event Reaction Effect Significant of Recalls
7-Nov Australian distributor recalls Bindeez -23 % $ -40 Yes
8-Nov Character Group removes Bindeez from sale; 17 23 Yes
states financial impact expected negligible
9-Nov Character Group recalls Bindeez -6 -9 Yes $ 15
Total (2 million units) -15 % $ -27 Yes $ 15
Percentage of Revenue 7.6%
Estimated Impact on Menu Foods20 ($ in millions) Simplified Event Study
Price Market Cap Statistically Date Event Reaction Effect Significant
16-Mar Pet food recalled -44 % $ -81 Yes
24-Mar Recall expanded -16 -20 Yes
5-Apr Recall expanded -2 -3 No
10-Apr Recall expanded -3 -4 No
17-Apr Recall expanded 2 3 No
3-May Recall expanded 0 0 No
22-May Recall expanded -2 -2 No
31-May Loses two contracts -2 -2 No
12-Jun Large customer cancels contract -44 -49 Yes
10-Aug Recall hurts Menu Foods results -3 -3 No
14-Aug Large customer partially cancels order -27 -22 Yes
11-Oct Cuts staff by 10-15% 6 4 Yes
Total (60 million units) -82 % $ -178 Yes
Percentage of Revenue 33.2%
Character Group: Character Group is the UK distributor for Bindeez toys (known in the US as Aqua Dots). Based on the
simplified event study, Character Group’s stock price reacted in a statistically significant manner to the news surrounding
the recall of its Bindeez products over concerns about a drug-like substance contained in them. Based on the simplified
event study, following the announcement of a recall by Bindeez’s Australian developer on November 7, 2007, Character
Group’s stock price declined 23%. The stock rebounded 17% the following day, when Character Group announced that
it was removing Bindeez from sales and that it expected these events to have a negligible impact of its financial results.
The stock declined another 6% on a market-adjusted basis on November 9, 2007, when Character Group’s recall began.
Based on the simplified event study, the market’s estimate of the economic impact of these events on Character Group
was $27 million.
14 nera.com
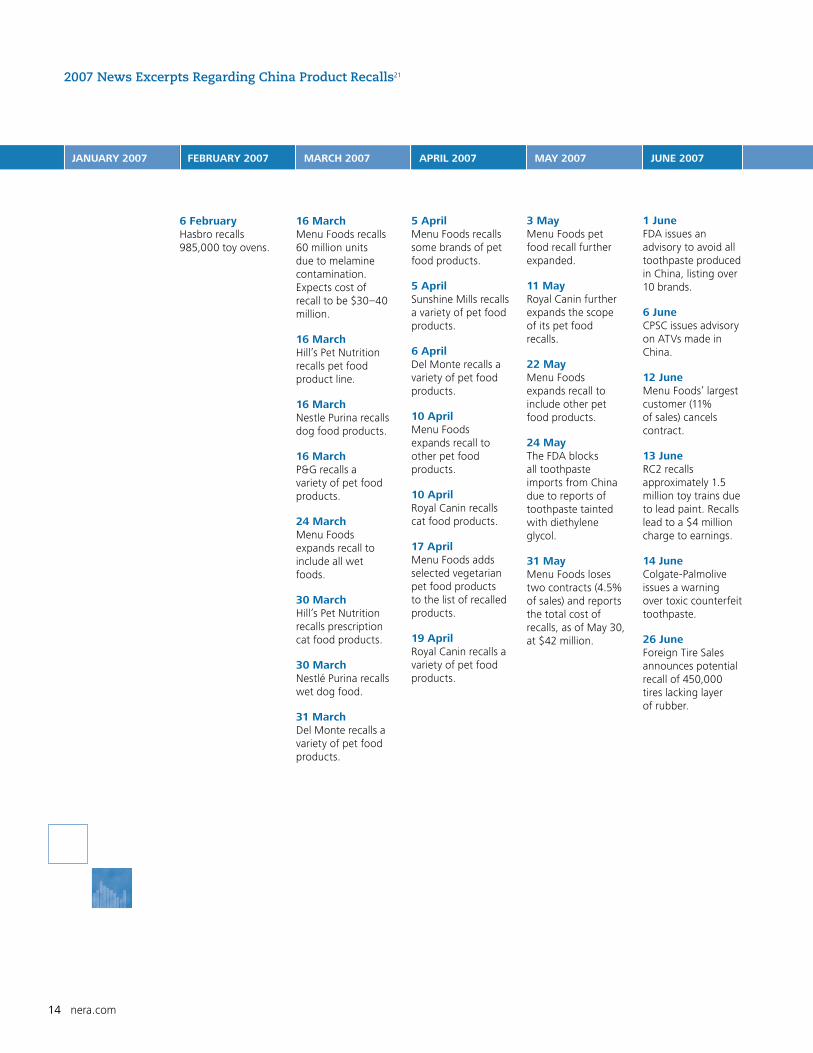
2007 News Excerpts Regarding China Product Recalls21
6 February Hasbro recalls 985,000 toy ovens.
16 March Menu Foods recalls 60 million units due to melamine contamination. Expects cost of recall to be $30–40 million.
16 March Hill’s Pet Nutrition recalls pet food product line.
16 March Nestle Purina recalls dog food products.
16 March P&G recalls a variety of pet food products.
24 March Menu Foods expands recall to include all wet foods.
30 March Hill’s Pet Nutrition recalls prescription cat food products.
30 March Nestlé Purina recalls wet dog food.
31 March Del Monte recalls a variety of pet food products.
5 April Menu Foods recalls some brands of pet food products.
5 April Sunshine Mills recalls a variety of pet food products.
6 April Del Monte recalls a variety of pet food products.
10 April Menu Foods expands recall to other pet food products.
10 April Royal Canin recalls cat food products.
17 April Menu Foods adds selected vegetarian pet food products to the list of recalled products.
19 April Royal Canin recalls a variety of pet food products.
3 May Menu Foods pet food recall further expanded.
11 May Royal Canin further expands the scope of its pet food recalls.
22 May Menu Foods expands recall to include other pet food products.
24 May The FDA blocks all toothpaste imports from China due to reports of toothpaste tainted with diethylene glycol.
31 May Menu Foods loses two contracts (4.5% of sales) and reports the total cost of recalls, as of May 30, at $42 million.
1 June FDA issues an advisory to avoid all toothpaste produced in China, listing over 10 brands.
6 June CPSC issues advisory on ATVs made in China.
12 June Menu Foods’ largest customer (11% of sales) cancels contract.
13 June RC2 recalls approximately 1.5 million toy trains due to lead paint. Recalls lead to a $4 million charge to earnings.
14 June Colgate-Palmolive issues a warning over toxic counterfeit toothpaste.
26 June Foreign Tire Sales announces potential recall of 450,000 tires lacking layer of rubber.
JANUARY 2007 FEbRUARY 2007 MARCH 2007 APRIL 2007 MAY 2007 JUNE 2007
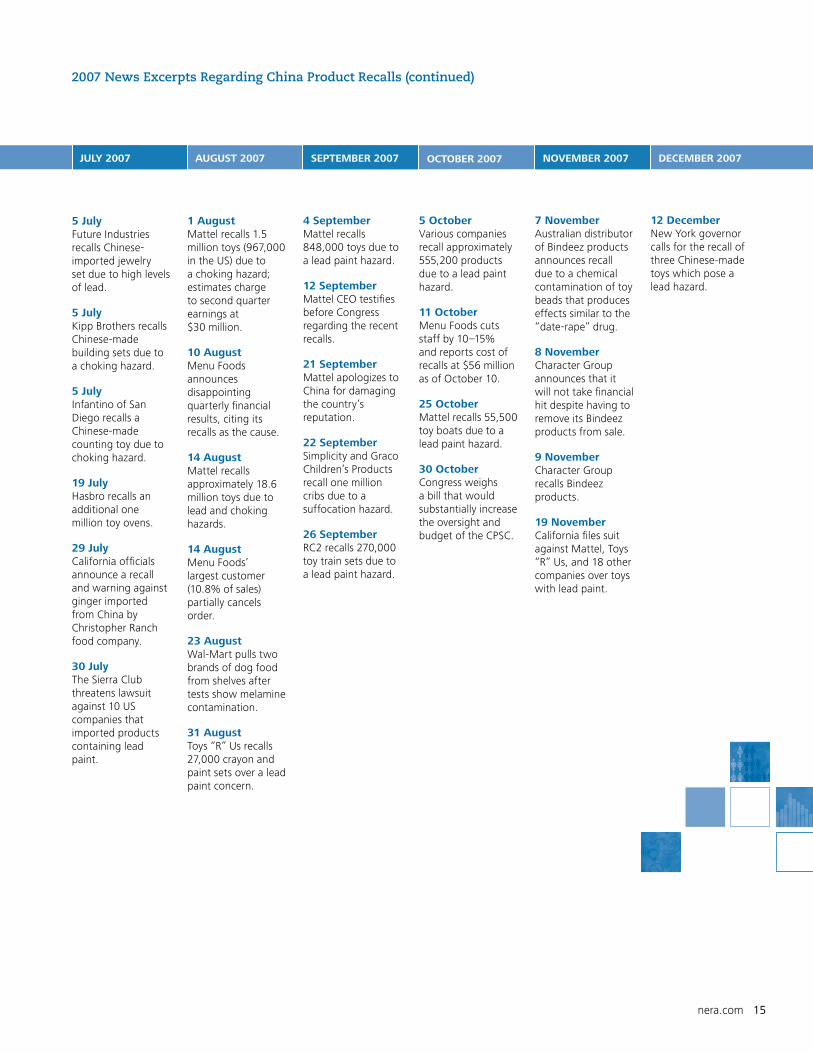
nera.com 15
5 July Future Industries recalls Chinese-imported jewelry set due to high levels of lead.
5 July Kipp Brothers recalls Chinese-made building sets due to a choking hazard.
5 July Infantino of San Diego recalls a Chinese-made counting toy due to choking hazard.
19 July Hasbro recalls an additional one million toy ovens.
29 July California officials announce a recall and warning against ginger imported from China by Christopher Ranch food company.
30 July The Sierra Club threatens lawsuit against 10 US companies that imported products containing lead paint.
1 August Mattel recalls 1.5 million toys (967,000 in the US) due to a choking hazard; estimates charge to second quarter earnings at $30 million.
10 August Menu Foods announces disappointing quarterly financial results, citing its recalls as the cause.
14 August Mattel recalls approximately 18.6 million toys due to lead and choking hazards.
14 August Menu Foods’ largest customer (10.8% of sales) partially cancels order.
23 August Wal-Mart pulls two brands of dog food from shelves after tests show melamine contamination.
31 August Toys “R” Us recalls 27,000 crayon and paint sets over a lead paint concern.
4 September Mattel recalls 848,000 toys due to a lead paint hazard.
12 September Mattel CEO testifies before Congress regarding the recent recalls.
21 September Mattel apologizes to China for damaging the country’s reputation.
22 September Simplicity and Graco Children’s Products recall one million cribs due to a suffocation hazard.
26 September RC2 recalls 270,000 toy train sets due to a lead paint hazard.
5 October Various companies recall approximately 555,200 products due to a lead paint hazard.
11 October Menu Foods cuts staff by 10–15% and reports cost of recalls at $56 million as of October 10.
25 October Mattel recalls 55,500 toy boats due to a lead paint hazard.
30 October Congress weighs a bill that would substantially increase the oversight and budget of the CPSC.
7 November Australian distributor of Bindeez products announces recall due to a chemical contamination of toy beads that produces effects similar to the “date-rape” drug.
8 November Character Group announces that it will not take financial hit despite having to remove its Bindeez products from sale.
9 November Character Group recalls Bindeez products.
19 November California files suit against Mattel, Toys “R” Us, and 18 other companies over toys with lead paint.
12 December New York governor calls for the recall of three Chinese-made toys which pose a lead hazard.
JULY 2007 AUGUST 2007 SEPTEMbER 2007 OCTObER 2007 NOvEMbER 2007 DECEMbER 2007
2007 News Excerpts Regarding China Product Recalls (continued)
16 nera.com
September 4 recall, see New York Times, September 5, 2007, “Mattel in another recall, citing lead in toys from China.” For the October 25 recall, see Associated Press, October 25, 2007, “55000 Mattel toys recalled for lead paint.”
16 Stock price data were obtained from FactSet Research Systems, Inc. Price reactions are based on a regression of company returns against the returns of S&P 500 index over the one-year period preceding the company’s earliest recall event. Retail value determined using product price information from www.cpsc.gov. Market cap effect determined using shares outstanding from 10-Q for period ending September 30, 2007. Percent of revenue determined using revenue listed in 10-K for the period ending December 31, 2006. Statistical significance is measured at the 95% confidence level. For recall information, see CPSC press releases on dates of recalls.
17 Stock price data were obtained from FactSet Research Systems, Inc. Price reactions are based on a regression of company returns against the returns of S&P 500 index over the one-year period preceding the company’s earliest recall event. Retail value determined using product price information from www.cpsc.gov. Market cap effect determined using shares outstanding from 10-Q for period ending September 30, 2007. Percent of revenue determined using revenue listed in 10-K for the period ending December 31, 2006. Statistical significance is measured at the 95% confidence level. For recall information, see CPSC press releases on dates of recalls and www.recalls.rc2.com.
18 Stock price data were obtained from Bloomberg. Price reactions are based on a regression of company returns against the returns of S&P 500 index over the one-year period preceding the company’s earliest recall event. Retail value determined using product price information from commercial websites and www.cpsc.gov. Market cap effect and percent of revenue determined using shares outstanding and revenue listed in Annual Report for the period ending August 31, 2007. Statistical significance is measured at the 95% confidence level. For recall information, see The Guardian, November 10, 2007, “500,000 Chinese-made toys recalled over date-rape drug link.”
19 Menu Food Income Fund owned 65.9% of Menu Foods (see http://www.menufoods.com/about_us/index.html, visited on January 2, 2008). The simplified event study refers to the stock of Menu Food Income Fund.
20 Stock price data were obtained from FactSet Research Systems, Inc. Price reactions are based on a regression of company returns against the returns of S&P 500 index over the one-year period preceding the company’s earliest recall event. Retail value determined using average product price information from www.petco.com. Market cap effect determined using shares outstanding from Quarterly Results for period ending September 30, 2007. Percent of revenue determined using revenue listed in quarterly reports for 1-Q and 2-Q 2007 annualized. Statistical significance is measured at the 95% confidence level. For information on recalls see www.fda.gov and Reuters news, March 30, 2007, “Menu Foods says its pet food is now safe.”
21 News from Factiva and Bloomberg.
* Lucy P. Allen is a Senior Vice President, Renzo Comolli is a Senior Consultant, and Simona Heumann is a former Senior Consultant with NERA Economic Consulting. The authors gratefully acknowledge the contribution of Denise N. Martin, Abhimanyu Sharma, and Alexander Stein. In addition, the authors thank Gregory Hort, David Bubb, and Denitsa Petkova for assistance. All errors and omissions are ours.
1 Analysis based on CPSC data under the “manufactured in” category for 2007.
2 Analysis based on CPSC data under the category “toys” using description “China” in the “manufactured in” category for 2007.
3 See www.recalls.gov.4 See www.recalls.gov.5 Analysis based on data from the databases of the respective
agencies. The NHTSA, USDA, and EPA 2007 data are annualized based on the January-November data. The CPSC and FDA figures include all of 2007 data. For NHTSA the graph depicts the number of unique campaign numbers per year (according to the year in which the report was received).
6 Analysis based on CPSC data under the category “toys.”7 Analysis based on CPSC data under the category “toys” using
description “China” in the “manufactured in” category.8 Analysis based on CPSC data under the category “toys” using
description “China” in the “manufactured in” category.9 Data from US Census Foreign Trade Statistics. 2007 data
annualized based on the January-October data. 10 Recalls of Chinese toys are based on CPSC data using description
“China” in the “manufactured in” category. Imports of Chinese toys are obtained from the US International Trade Commission Data Web; the word “toy” refers to the following industry classifications: “dolls and stuffed toys” and “games, toys, and children’s vehicles”; imports for 2007, on which data were available only through October 2007, were annualized based on historical trends; imports are expressed in 2007 dollars by adjusting for inflation using the Consumer Price Index.
11 Hari Bapuji and Paul W. Beamish Toy Recalls Is China Really the Problem? Canada-Asia Commentary, Number 45, September 2007.
12 Analysis based on CPSC data using information in the “hazard” category for 2007. Percentages refer to the number of units recalled.
13 Analysis based on CPSC data using description “lead” in the “hazard” category for 2007.
14 Frederick Dunbar and Faten Sabry “The Propensity to Sue: Why Do People Seek Legal Actions?” NERA Economic Consulting, April 18, 2007.
15 Stock price data were obtained from FactSet Research Systems, Inc. Price reactions are based on a regression of company returns against the returns of S&P 500 index over the one-year period preceding the company’s earliest recall event. Retail value determined using product price information from www.cpsc.gov. Market cap effect determined using shares outstanding from 10-Q for period ending September 30, 2007. Percent of revenue determined using revenue listed in 10-K for the period ending December 31, 2006. Statistical significance is measured at the 95% confidence level. For the August 1 recall, see Reuters News article, August 1, 2007, “China warns of alarmism amid new U.S. toy scare.” For August 14 recall, see New York Times, August 15, 2007, “Mattel recalls 19 million toys sent from China.” For the
End Notes
About NERA
NERA Economic Consulting (www.nera.com) is a global firm of experts dedicated to applying
economic, finance, and quantitative principles to complex business and legal challenges. For nearly
half a century, NERA’s economists have been creating strategies, studies, reports, expert testimony, and
policy recommendations for government authorities and the world’s leading law firms and corporations.
We bring academic rigor, objectivity, and real world industry experience to bear on issues arising from
competition, regulation, public policy, strategy, finance, and litigation.
NERA’s clients value our ability to apply and communicate state-of-the-art approaches clearly and
convincingly, our commitment to deliver unbiased findings, and our reputation for quality and
independence. Our clients rely on the integrity and skills of our unparalleled team of economists and
other experts backed by the resources and reliability of one of the world’s largest economic consultancies.
With its main office in New York City, NERA serves clients from over 20 offices across North America,
Europe, and Asia Pacific.
Contact Information
Lucy P. Allen
Senior vice President
Chair, Mass Torts and Product
Liability Practice
NERA Economic Consulting
1166 Avenue of the Americas
28th Floor
New York, NY 10036
Tel: +1 212 345 5913
Fax: +1 212 345 4650
Renzo Comolli
Consultant
NERA Economic Consulting
1166 Avenue of the Americas
28th Floor
New York, NY 10036
Tel: +1 212 345 6025
Fax: +1 212 345 4650
Visit www.nera.com to learn
more about our practice areas
and global offices.
© Copyright 2008
National Economic Research
Associates, Inc.
All rights reserved.
Printed in the USA.