Embed Size (px)
Citation preview

February, 2016 NTHMP
Warning Coordination Subcommittee Meeting

Agenda • Introductions • WCS
– 2015-Action Item Review – Strategic Plan Tasks – TOR Update
• 2015 tsunami alerts – January - Alaska – September – Chile
• CA Survey • Should Watch be issued? • Should impact estimates be provided prior to tsunami being recorded anywhere? • Review/Lessons Learned • Web Site • TWeb

Agenda • TWC Products
– PTWC update – WEA Polygons – Auto EAS status – EAS activation for advisories – BC Notification project – Brainstorming on new graphical/mobile products
• Exercises – Monthly Comms tests and false alarms – Use Live Code??? – 2016 National exercises – 2016 ETE Comms tests – Others? – 2017 plans

Agenda • Training
– COMET Module update – NTWC TWS training plans
• IT Mod. Update • Tsunami Research Advisory Council projects impacting TWCs • Meteotsunami forecast protocol • New Action Items

Reviews
• Action Item Review • WCS Strategic Plan Tasks • WCS Terms of Reference

2015 Tsunami Alerts • Alaska – January, 2016
– Response • 2.5 minutes – M=6.4; no tsunami danger • 9 minutes – M=7.1; no tsunami danger (depth)
– Impact • No casualties • Significant damage on Kenai Peninsula • Some damage in Anchorage and Mat-Su Valley • Power outage at NTWC; UPS worked well
– Lessons • Initial magnitude determination

2015 Tsunami Alerts • Chile – September, 2015
– Response • PTWC – initial threat message for Peru and Chile
– Watch for HI – American Samoa/Guam
• NTWC – Tsunami Information Stmt. – potential threat – About 3 hours into event, Advisory issued for part of CA – Cancelled about 17 hours later

U.S. National Oceanic and Atmospheric Administration National Weather Service
Pacific Tsunami Warning Center, Ewa Beach, Hawaii
Chile Tsunami of September 16-17, 2015
Charles McCreery Director, PTWC

Historical Tsunamis in the Chile Region
2015 – Mw 8.3
2007 – Mw 8.0
1960 – Mw 9.5
2014 – Mw 8.2
2001 – Mw 8.4
2010 – Mw 8.8
1995 – Mw 8.0

Elapsed Time: 6 Minutes Initial TWC Products Issued
Potential Immediate Tsunami Threat to Chile and Peru. Threat to Other Pacific Countries Under Evaluation
Hawaii Tsunami Watch
while Threat Evaluated
American Samoa Information while Threat Evaluated
Alaska, BC & West Coast Information while Threat
Evaluated
Guam/CNMI Information while Threat Evaluated

Elapsed Time: 28 Minutes Regional Forecast based on EQ Mechanism
>3 m: Chile 1-3m: None 0.3-1m: Peru, Ecuador Other Pacific Countries Still Under Evaluation
Hawaii Tsunami Watch
American Samoa Information while Threat Evaluated
Guam/CNMI Information while Threat Evaluated
Alaska, BC & West Coast Information while Threat
Evaluated

Ocean Forecast

Coastal Forecast

Elapsed Time: 52 Minutes Forecast based on EQ Mechanism
>3 m: Chile 1-3m: Fr. Polynesia 0.3-1m: Peru, Ecuador, Japan, Russia, and many other places
Hawaii Tsunami Watch
American Samoa Information while Threat Evaluated
Guam/CNMI No Threat
Alaska, BC & West Coast Information while Threat
Evaluated

Real-Time Reporting Sea Level Gauges

Real-Time Reporting Deep-Ocean Gauges (DARTs)

Confirmation of Tsunami, Evaluation of Threat, and US Alerts
Elapsed Place Event Max Value 00:10-01:29 Quintero, Chile Gauge Reading 1.77 m 00:21-00:29 Coquimbo, Chile Gauge Reading 4.72 m 00:51-01:03 Chanaral, Chile Gauge Reading 1.14 m 00:25-00:39 DART 32402 Gauge Reading 0.10 m
TWCs Models Constrained with DART Data
01:31-01:46 DART 32401 Gauge Reading 0.05 m
TWCs Confidence in All Model Results
02:29 Hawaii Advisory 0.3-1 m 02:29 Guam/CNMI No Threat <0.3 m 02:48 S. California Advisory 0.3-1 m 03:14 Am. Samoa Advisory 0.3-1 m

Summary of Forecast and Observations
PLACE FORECAST ALERT MAXIMUM ON GAUGE Chile >3 m N/A 4.72 m (Coquimbo) Fr. Polynesia 1-3 m N/A 1.40 m (Nuku Hiva) Peru 0.3-1 m N/A 0.52 m (Callao) Ecuador 0.3-1 m N/A 0.18 m (Baltra) Japan 0.3-1 m N/A 0.80 (Kuji) Russia 0.3-1 m N/A 0.44 m (Shikotan Is.) Hawaii 0.3-1 m Advisory 0.85 m (Hilo) West Coast 0.3-1 m Advisory 0.33 m (Ventura) Am. Samoa 0.3-1 m Advisory 0.63 m (Pago Pago) Guam/CNMI <0.3 m None <0.03 m (Apra Harbor)

Comparison of NTWC Domestic Forecasts

Cancellation of Threat and US Alerts
Elapsed Place Event 18:39 Hawaii Advisory Cancelled 18:39 American Samoa Advisory Cancelled 20:24 Southern California Advisory Cancelled
24:10 Countries of the Pacific System (PTWS)
Final Threat Message for the Pacific

Summary of Casualties and Damages (Earthquake and Tsunami)
All major effects happened in Chile Over 1 million were evacuated from the coast 13 deaths and 14 injuries (most or all from earthquake) 6 persons missing as of 24 September 55 persons in shelters 13427 without housing 816 homes destroyed 1011 homes uninhabitable Most tsunami damage around Coquimbo and Tongoy Most earthquake damage around Salamanch and Illapel
Particulars Courtesy of ONEMI and SHOA

Coquimbo Sea Level Gauge (+4.72 m)
Photo Courtesy of SHOA

Multiple Ships Aground at Coquimbo
Photo Courtesy of SHOA
Summary of Event Response
TWCs Responded Quickly Preliminary and Later Seismic Analysis was Accurate Judgment of Potential Tsunami Threat was Accurate Three Tsunami Forecast Models Used
Seismic and Sea Level Model Constraints were Sufficient All Models Gave Consistent and Accurate Forecasts Appropriate Alert and Threat Levels Issued
Domestic and International Systems Worked Well

THANK YOU

2015 Tsunami Alerts • Chile – September, 2015
– Tweb used experimentally; viewer; ViewOnly – Lessons
• Should Watch have been issued by NTWC? • Should NTWC provide impact estimates without
validation by observation? • Others?
– California Survey results – NTHMP Survey? Action!

Products – New Format
• New NTWC Format Live November, 2015 – Major changes
• Headlines • Organization • Impacts • Recs.
– Need to better include forecast information in headline

Products – PTWC Update

Products
• WEA Polygon Status – Action! • EAS for Advisory Status • Auto EAS at WFO Status • BC Notification Project • Brainstorming on graphical/mobile products

Improving End-To-End Tsunami Warning for Risk Reduction on Canada's West Coast
Supported b y the Canadian Safety and Security Program, in partnership with
Emergency Management British Columbia
Project Update
Peter Anderson
Simon Fraser University [email protected]
30

Objective
Pilot and evaluate new notification techniques and technologies along the
British Columbia coastline
31

B.C. Notification Challenges
• 26,000+ kms of varying coastline, much of which is rugged and remote
• Biggest challenges: – notifying populations in remote permanent
communities with limited and/or poor communications coverage
– identifying and notifying populations on the move or in temporary fixed locations (transient populations) who now inhabit areas all year round
32

33
Examples of Recreational Activities

Annual total visitation numbers for coastal Provincial and National Parks from 2010 to 2014
Note: Many parks are used during off-season but attendance is not recorded.
34
Coastal National and Provincial Park Attendance
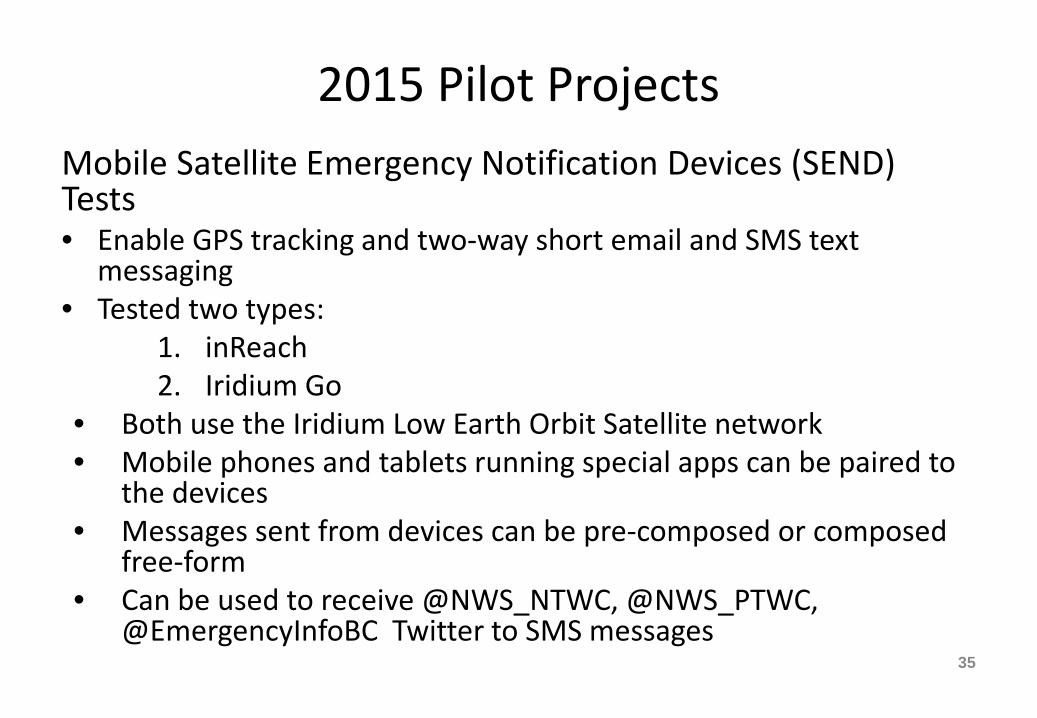
2015 Pilot Projects Mobile Satellite Emergency Notification Devices (SEND) Tests • Enable GPS tracking and two-way short email and SMS text
messaging • Tested two types:
1. inReach 2. Iridium Go
• Both use the Iridium Low Earth Orbit Satellite network • Mobile phones and tablets running special apps can be paired to
the devices • Messages sent from devices can be pre-composed or composed
free-form • Can be used to receive @NWS_NTWC, @NWS_PTWC,
@EmergencyInfoBC Twitter to SMS messages
35

2015 B.C. Community/Regional SEND Pilot locations
• Gitga'at Nation (Hartley Bay) • Wuikiunxv Nation (Rivers Inlet) • Port Alice • Ehattesaht/Chinehkint First Nation • Zeballos • Ucluelet • Tseshaht First Nation (Port Alberni) • KwiKwikwasut’inuxwHaxwa’mis First Nation (Gilford Island) • Regional District of Mount Waddington • Strathcona Regional District • Prince Rupert to Victoria coastline • Pacific Rim National Park – Westcoast Trail 36

inReach
37
Iridium Go

Gitga’at Nation 38

39

40

41
Paired Smartphone App Testing message delivery times

CCGS Bartlett 25 August - 3 September, 2015
42

43

For internal use only
Produced by Simon Fraser University Telematics Research Lab
with support from Canadian Safety and Security Program Project Number CSSP-2013-TI-1033
30 October, 2015
44

For internal use only
Produced by Simon Fraser University Telematics Research Lab
with support from Canadian Safety and Security Program Project Number CSSP-2013-TI-1033
30 October, 2015
45

46

47

West Coast Trail Trek Pacific Rim National Park
West Coast of Vancouver Island 25-31 August, 2015
48

49
75 km Backpacking Trail

For internal use only
Produced by Simon Fraser University Telematics Research Lab
with support from Canadian Safety and Security Program Project Number CSSP-2013-TI-1033
30 October, 2015
50

Observations • Timeliness of messages sent and received
– Subject to line-of-sight and satellite connectivity conditions – Since messages are stored and forwarded, they will eventually
arrive, but could be delayed for considerable time in forested or mountainous terrain, especially narrow inlets
– Consequently, not suitable for local/near-shore tsunami event notification
• GPS reporting is useful for reporting last known locations • Generally useful where there is no other form of external
communication • Affordable and accessible technology
51

Follow up – Next Steps
• Analysis of message input procedures – Manual versus automated – Timeliness of tsunami messaging
• Knowledge and technology transfer • Interest in collaboration with other Pacific regions
52

For Further Information
Please Contact:
Peter Anderson Director, Telematics Research Lab
Simon Fraser University Burnaby, BC, Canada
53
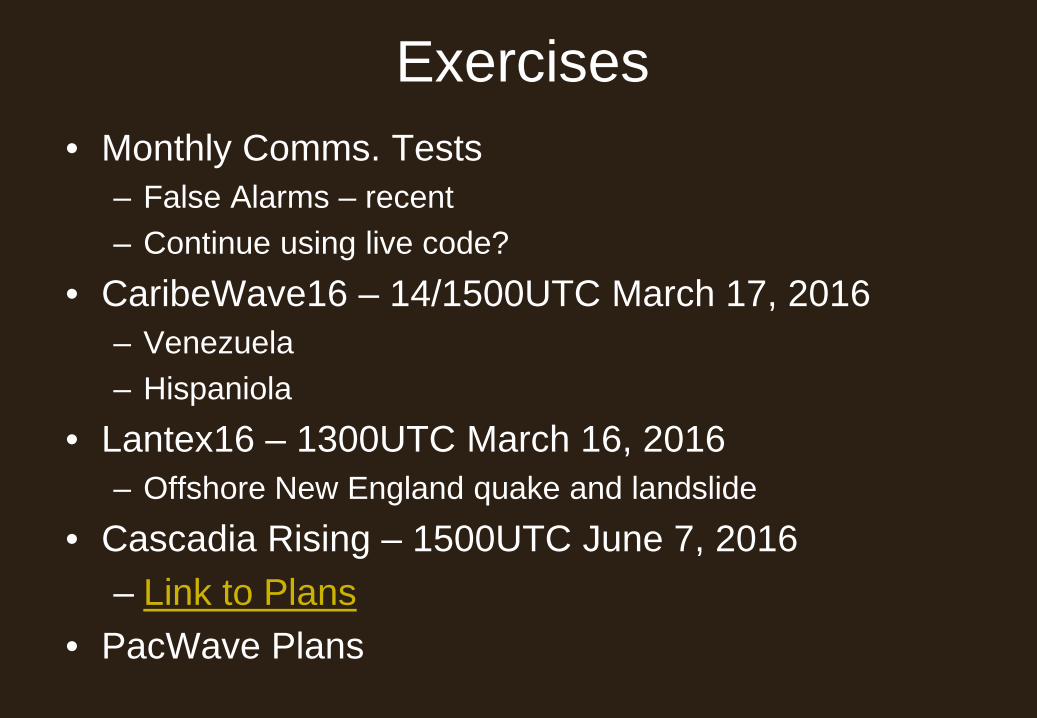
Exercises • Monthly Comms. Tests
– False Alarms – recent – Continue using live code?
• CaribeWave16 – 14/1500UTC March 17, 2016 – Venezuela – Hispaniola
• Lantex16 – 1300UTC March 16, 2016 – Offshore New England quake and landslide
• Cascadia Rising – 1500UTC June 7, 2016 – Link to Plans
• PacWave Plans

Exercises • EAS/NWR Test Plans • 2017 Exercises
– Pacific • Suggestions?
– Atlantic • Wednesday March 29, 2017? • Source? Action!
– Caribbean • Define Action!

Training • COMET Updates
– Tsunamis! – Dec. 23, 2014 – Community Tsunami Preparedness – Oct. 28, 2015 – Tsunami Warning Systems – Jan. 7, 2016
• NTWC TWS training • Others

Training • COMET Usage
– Tsunamis! • About 1500 per year
– Tsunami Warning Systems • About 400 per year
– Community Tsunami Preparedness • Variable – 400 to 2000 per year
– Tsunami Strike! • Two versions; 500 to 1200 per year

TWC TOPS Update

Tsunami Research Adv. Comm.
• 2016 Projects – Ongoing
• GPS Ships – last year • COMMIT • GPS Source/NASA • Tweb • DART4g • SIFT – Ongoing and upgrades

Tsunami Research Adv. Comm.
• 2016 Projects – New
• HF Radar • Real-time SIFT models • SIFT source units - smaller • Time dependent rupture
– Proposed • Webcams

U N I T E D S T A T E S D E P A R T M E N T O F C O M M E R C E
N A T I O N A L O C E A N I C A N D A T M O S P H E R I C A D M I N I S T R A T I O N
Meteotsunamis: Working Toward an Operational Forecasting Capability
Michael Angove, NOAA/NWS Paul Whitmore, NOAA/NTWC
Fourth Symposium on Building a Weather-Ready Nation: Enhancing Our Nation’s Readiness, Responsiveness, and Resilience to High Impact Weather Events
January 12, 2016

N A T I O N A L O C E A N I C A N D A T M O S P H E R I C A D M I N I S T R A T I O N
Meteotsunamis
• Tsunami-like waves of meteorological vs. seismic origin
Meteotsunamis: Working Toward an Operational Forecasting Capability
• Depend on intensity, direction, and speed of disturbance over water body with a depth that enhances wave magnification
• NOT same as storm surge Source: Monserrat, Vilibić, Rabinovich; Nat. Hazards Earth Syst. Sci., 6, 2006

N A T I O N A L O C E A N I C A N D A T M O S P H E R I C A D M I N I S T R A T I O N
October 28, 2008, 1800Z
Meteotsunamis: Working Toward an Operational Forecasting Capability

N A T I O N A L O C E A N I C A N D A T M O S P H E R I C A D M I N I S T R A T I O N
October 28, 2008
• Boothbay Harbor, Maine (Gulf of Maine shelf) • Waves up to 12’ high emptied and flooded the harbor
at least 3 times over 15 minutes, damaging boats and shoreline infrastructure
Meteotsunamis: Working Toward an Operational Forecasting Capability
• Wave heights were reproduced by tsunami forecast model and atmospheric gravity wave source
• Tsunami models work, but case highlights challenge of forecasting met parameters prior to detection

Introduction
https://www.youtube.com/watch?v=QHw2KlC3a2o
NJ News Clip – We will insert the video clip before uploading it to AMS. With the video, the file is too large and cannot be sent over e-mail for purposes of working on it remotely. Once inserted. All you’ll have to do is click on it and it will play. It will not take you to YouTube.

N A T I O N A L O C E A N I C A N D A T M O S P H E R I C A D M I N I S T R A T I O N
June 13, 2013
• New Jersey and southern Massachusetts coasts • Barnegat Inlet, New Jersey: 3 people injured by 6-foot
wave that swept them off jetty into water • Waves recorded on water-level stations from Puerto
Rico to New England and tsunami buoy
Meteotsunamis: Working Toward an Operational Forecasting Capability
• Caused by weakening, low-end derecho
• Alerts possible based on shelf effect

N A T I O N A L O C E A N I C A N D A T M O S P H E R I C A D M I N I S T R A T I O N
Meteotsunamis: Working Toward an Operational Forecasting Capability
https://www.youtube.com/watch?v=ykABRe5Yt3c
2013 Animation
Insert video before uploading to AMS. We will insert the video clip before uploading it to AMS. With the video, the file is too large and cannot be sent over e-mail for purposes of working on it remotely. Once inserted. All you’ll have to do is click on it and it will play. It will not take you to YouTube.

N A T I O N A L O C E A N I C A N D A T M O S P H E R I C A D M I N I S T R A T I O N
Meteotsunamis: Working Toward an Operational Forecasting Capability
DART Systems

N A T I O N A L O C E A N I C A N D A T M O S P H E R I C A D M I N I S T R A T I O N
Meteotsunamis: Working Toward an Operational Forecasting Capability
Coastal Water-Level Gauges

N A T I O N A L O C E A N I C A N D A T M O S P H E R I C A D M I N I S T R A T I O N
Challenges
• Forecasting—Meteotsunami (MT) formation tightly constrained by depth, translational speed of disturbance, and direction; requires extremely accurate mesoscale forecast
• Detection—Even if MT forms, network of observation systems not dense enough to detect MT disturbance
• Messaging—Potential for confusion with wind-driven storm surge and normal seiche activity
Meteotsunamis: Working Toward an Operational Forecasting Capability

N A T I O N A L O C E A N I C A N D A T M O S P H E R I C A D M I N I S T R A T I O N
Meteotsunamis: Working Toward an Operational Forecasting Capability
• Not for all MTs; emphasis on eastward propagating disturbances • May, June, July—National Tsunami Warning Center (NTWC) will follow
medium-range numerical weather prediction (NWP) models to ID candidate disturbances
• If disturbance is in models at TAU 24 or less, NTWC will contact responsible WFOs to discuss
• WFOs may include potential for MT in forecast discussions or special weather statements
• Inside TAU 12, NTWC will monitor tsunami detection networks—DART buoys placed in event mode, coastal gauges, HF coastal radar (potentially)—for MT signals
• If detection made, NTWC will alert WFOs and provide estimates of amplitude and travel time to coastal locations
• WFOs may issue alerts (e.g., coastal flood warning)
Proposed Protocol

N A T I O N A L O C E A N I C A N D A T M O S P H E R I C A D M I N I S T R A T I O N
Future Development
Meteotsunamis: Working Toward an Operational Forecasting Capability
1. More accurate and timely alert on detection capability – MT source inversion techniques – MT historical libraries/simulations – Denser detection network
2. Work toward alert on forecast capability – High-resolution mesoscale maritime NWP – Sophisticated MT detection algorithms – High-density sea level pressure detection network over
coastal margin

N A T I O N A L O C E A N I C A N D A T M O S P H E R I C A D M I N I S T R A T I O N
Q&A
Michael Angove NOAA/NWS Tsunami Warning Program
[email protected] http://www.tsunami.gov
Paul Whitmore NOAA/NWS National Tsunami Warning Center
[email protected] http://ntwc.arh.noaa.gov
Meteotsunamis: Working Toward an Operational Forecasting Capability
Meteotsunami Fact Sheet: http://nws.weather.gov/nthmp/meteotsunamis.html

N A T I O N A L O C E A N I C A N D A T M O S P H E R I C A D M I N I S T R A T I O N
Proudman Resonance
Meteotsunamis: Working Toward an Operational Forecasting Capability
Source: Monserrat, Vilibić, Rabinovich; Nat. Hazards Earth Syst. Sci., 6, 2006

N A T I O N A L O C E A N I C A N D A T M O S P H E R I C A D M I N I S T R A T I O N
Meteotsunamis: Working Toward an Operational Forecasting Capability
HF Coastal Radar
CODAR Detection Ranges

N A T I O N A L O C E A N I C A N D A T M O S P H E R I C A D M I N I S T R A T I O N
Meteotsunamis: Working Toward an Operational Forecasting Capability
DART Systems (cont’d)


Maximum recorded at NOAA gauges
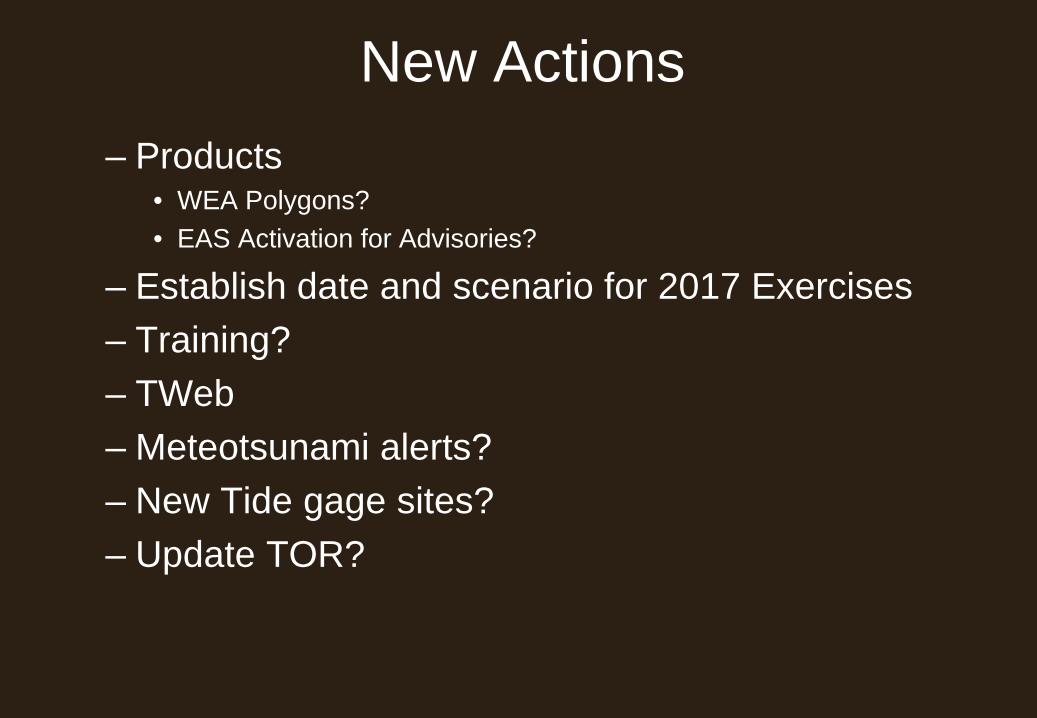
New Actions – Products
• WEA Polygons? • EAS Activation for Advisories?
– Establish date and scenario for 2017 Exercises – Training? – TWeb – Meteotsunami alerts? – New Tide gage sites? – Update TOR?