Embed Size (px)
Citation preview
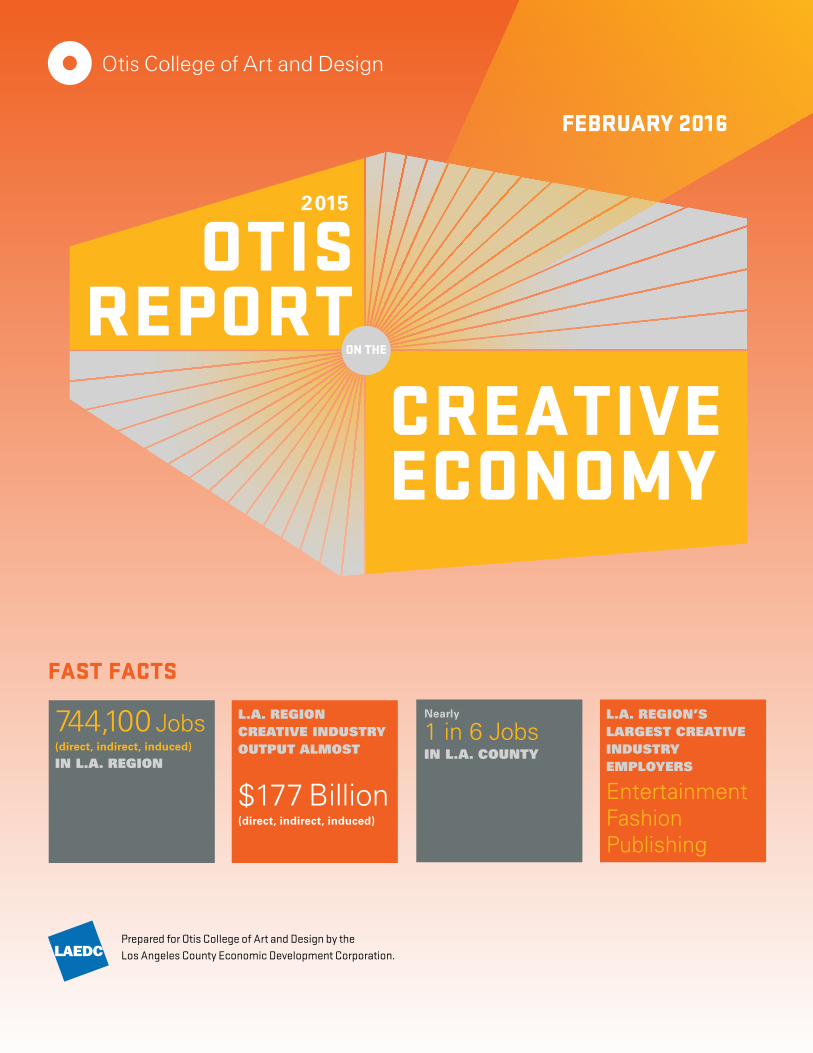
LOS ANGELES REGION
Prepared for Otis College of Art and Design by theLos Angeles County Economic Development Corporation.
FAST FACTS
744,100 Jobs (direct, indirect, induced)
IN L.A. REGION
L.A. REGION CREATIVE INDUSTRY OUTPUT ALMOST
$177 Billion(direct, indirect, induced)
L.A. REGION’S LARGEST CREATIVE INDUSTRY EMPLOYERS
Entertainment Fashion Publishing
FEBRUARY 2016
Nearly
1 in 6 Jobs IN L.A. COUNTY

Back to Contents2015 Otis Report on the Creative Economy of the Los Angeles Regionwww.otis.edu/econreport 2
THANK YOUR
EPO
RT
SPO
NS
OR
SE
VEN
T S
PON
SO
RS
MED
IA P
AR
TNER
S
DPR ConstructionAr thur J. Gallagher & Co. | Bon Appétit Management Company | Hir tle, Callaghan & Co. Moss Adams LLPAdditional suppor t provided by Marsh.
Back to Contents
2015 Otis Report on the Creative Economy of the Los Angeles Region
Prepared for Otis College of Art and Design by theLos Angeles County Economic Development Corporation.
2015 Otis Report on the Creative Economy of the Los Angeles Regionwww.otis.edu/econreport 3
Back to Contents2015 Otis Report on the Creative Economy of the Los Angeles Regionwww.otis.edu/econreport 4
PREPARED AND RESEARCHED BY:
The LAEDC Kyser Center for Economic Research
Robert A. Kleinhenz, Ph.DChief Economist
Kimberly Ritter-MartinezEconomist
Bengte Evenson, Ph.DEconomist
George EntisResearch Analyst
The LAEDC Institute for Applied Economics
Christine Cooper, Ph.D.Vice President
PROJECT MANAGED BY: Otis College of Art and Design Matthew TecleSpecialist Institutional Advancement
Arleen Chikami Assistant Director of Strategic Partnerships
Claudia Beinkinstadt KrumlaufDevelopment & Special Events Manager Chelsey SobelCoordinator, Institutional Advancement Anne Swett-Predock Creative Direction
Sean Yoon Design and Production
Download the full report, view highlights from the creative economy launch event, and learn more about other resources at www.otis.edu/econreport
www.otis.edu/econreport
REPORT CONTENTS
Back to Contents
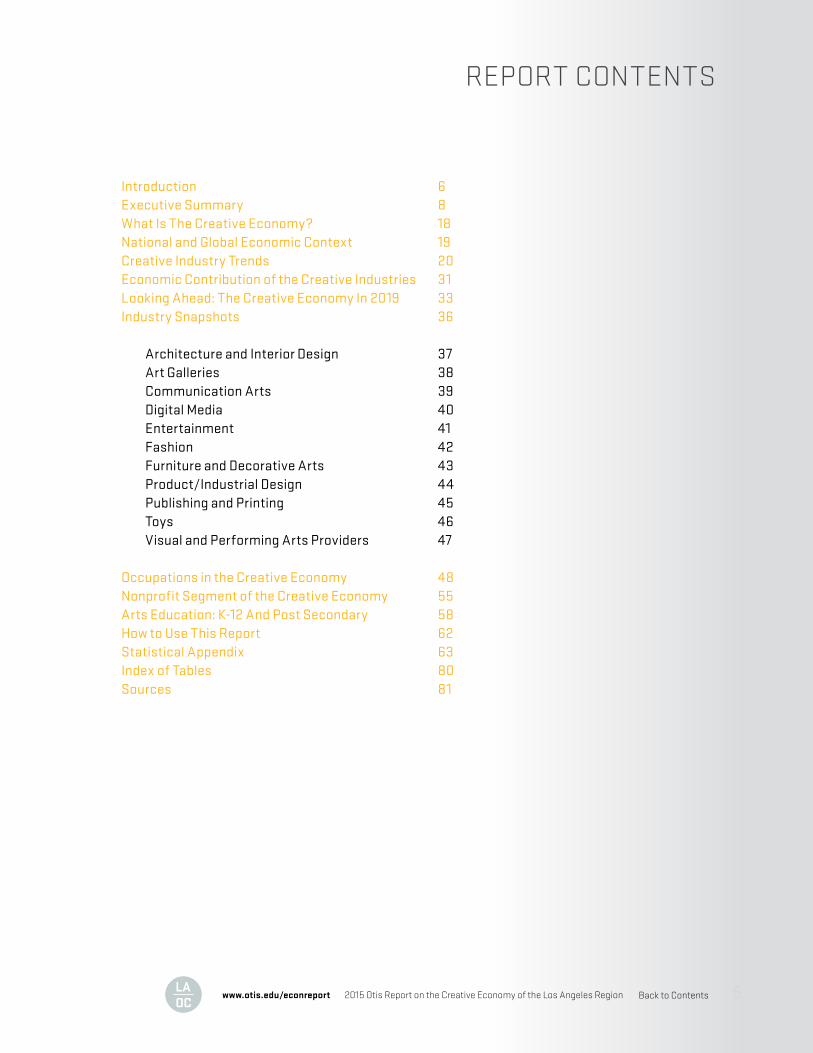
Introduction 6Executive Summary 8What Is The Creative Economy? 18National and Global Economic Context 19Creative Industry Trends 20Economic Contribution of the Creative Industries 31Looking Ahead: The Creative Economy In 2019 33Industry Snapshots 36
Architecture and Interior Design 37Art Galleries 38Communication Arts 39Digital Media 40Entertainment 41Fashion 42Furniture and Decorative Arts 43Product/Industrial Design 44Publishing and Printing 45Toys 46Visual and Performing Arts Providers 47
Occupations in the Creative Economy 48Nonprofit Segment of the Creative Economy 55Arts Education: K-12 And Post Secondary 58 How to Use This Report 62Statistical Appendix 63Index of Tables 80Sources 81
2015 Otis Report on the Creative Economy of the Los Angeles Region 5
Back to Contents2015 Otis Report on the Creative Economy of the Los Angeles Regionwww.otis.edu/econreport 6
PRESIDENT OTIS COLLEGE OF ART AND DESIGN
BRUCE W. FERGUSON
OT
IS IN
TR
OD
UC
TIO
N
For nearly a decade the Otis Report on the Creative Economy (Otis Report) has illustrated the enormous impact the creative industries have had on the health and stability of the overall economy. Since 2007, Otis has commissioned the Los Angeles County Economic Development Corporation (LAEDC) to measure, assess, and project the economic impacts of the creative industries in the Los Angeles region. The Otis Report has expanded and flourished over the years to become a powerful advocacy tool for the nonprofit arts community, bringing together leaders across disciplines and sectors to advance policies in support of arts education, and inspiring countless municipalities, both in the U.S. and abroad, to research and document the economic contributions of artists and creative businesses in their own communities.
In 2013, with the generous support of the California Arts Council, Otis and the LAEDC were able to broaden the scope of analysis to include a statewide report. 2015 marks the third iteration of the annual Otis Report on the Creative Economy of California. The full California Report will be unveiled at a public hearing in Sacramento before the Joint Committee on the Arts—a committee consisting of representatives from both the California Senate and Assembly. Further information on the release of the statewide report can be found at the California Arts Council’s website, at http://www.arts.ca.gov.
New to this year’s Otis Report is a comparative analysis of the number and relative concentration of creative jobs in the top five Metropolitan Statistical Areas of the United States. Specifically, L.A.’s Statistical Metropolitan Area (also referred to as the L.A. region in this report) contains over 418,000 creative jobs out of the total 4,955,400 salary and wage jobs in the area—a share of over 8.4%. New York’s Metropolitan Area comes in second with 402,000 creative jobs out of 7,515,400, which translates to 5.4% of the share. Chicago comes in third with 133,800 jobs out of 3,794,400, or around 3.5% of the total share of salary and wages jobs. There is no other metropolitan area that can boast the highest number and greatest concentration of creative industries jobs as Los Angeles.
Here are a few highlights of the 2015 Otis Report related specifically to the Los Angeles region:
• The total economic output of the creative industries in 2014 totaled $176.9 billion (direct, indirect, and induced effects), which corresponds to nearly 13% of the region’s gross domestic product of $861 billion.
• The creative industries in the L.A. region generated an additional $7.7 billion in tax revenue (property, state, local personal income, and sales), which was nearly half of the $15.5 billion in tax revenues generated by creative industries statewide.
Back to Contents2015 Otis Report on the Creative Economy of the Los Angeles Regionwww.otis.edu/econreport 7
OT
IS IN
TR
OD
UC
TIO
N
AKNOWLEDGEMENTS This year’s Otis Report would not have been possible without the generous support of the many organizations and companies that have invested their resources to advance creativity and innovation in our community. On behalf of the College, I would like to express my deepest appreciation to the Los Angeles County Economic Development Corporation’s Kyser Center for Economic Research for again creating a compelling and rich analysis.
I would also like to thank our report sponsors for their incredible support and leadership: the California Arts Council, Mattel, the City of Los Angeles, Department of Cultural Affairs, and City National Bank. Special thanks to this year’s event sponsors include our friends at DPR Construction, Arthur J. Gallagher & Co., Bon Appétit Management Company, Hirtle, Callaghan & Co., and Moss Adams LLP. Additional support was provided by Marsh. Thank you to our media partners Arts for LA, Arts Orange County, Californians for the Arts, and LAX Coastal Chamber of Commerce.
Finally, thank you and congratulations to our creative colleagues for their success and determination in making Los Angeles the creative epicenter of the globe. We look forward to continued growth and many more triumphs in the years to come.
Bruce W. FergusonPresidentOtis College of Art and Design
Otis prepares diverse students of art and design to enrich our world through their creativity, their skill, and their vision. The College offers an interdisciplinary education for approximately 1,200 full-time students, awarding BFA degrees in Architecture/Landscape/Interiors, Communication Arts, Digital Media, Fashion Design, Fine Arts, Product Design, and Toy Design, and MFA degrees in Fine Arts, Graphic Design, Public Practice, and Writing. Through Continuing Education & Pre-College Programs, Otis offers a wide range of art and design courses and programs for all ages, including children and teens. For information, visit www.otis.edu.
• The creative industries in the Los Angeles region include over 744,100 jobs (direct, indirect, and induced).
• These jobs had a total labor income of $53.4 billion (direct, indirect, and induced).
The Otis Report demonstrates that creativity and innovation thrive in Los Angeles, and the current renaissance happening throughout the city echoes this. New businesses, motion picture and television studios, restaurants, museums, start-ups, and tech hubs exhibit how the creative economy is intimately tied to the health and well-being of our citizens and communities. In an increasingly globalized world, where creative thinking and innovation are at the core of advancement, it is critical that leaders from the public, private, and nonprofit sectors work together to nurture and challenge the creative economy to continue to flourish and thrive.
The creative industries of the Los Angeles region (Los Angeles and Orange counties) turned in a solid performance in 2014 in terms of employment, labor income, and output. Over the five year period covered in this report (2009 to 2014), direct wage and salary employment in the region’s creative industries increased by 11,400 jobs (up by 2.8%) to 418,200. This was a considerable improvement over the previous five-year cycle (2008 to 2013) during which, employment contracted by 48,000 jobs (down by 10.5%). In spite of the improvement, however, job growth in the creative sectors lagged the 8.3% growth rate recorded for all of region’s industries from 2009 to 2014. Much of the difference can be explained by the creative economy’s higher concentration of manufacturing jobs, which have not fared as well as jobs in other parts of the economy in the aftermath of the Great Recession.
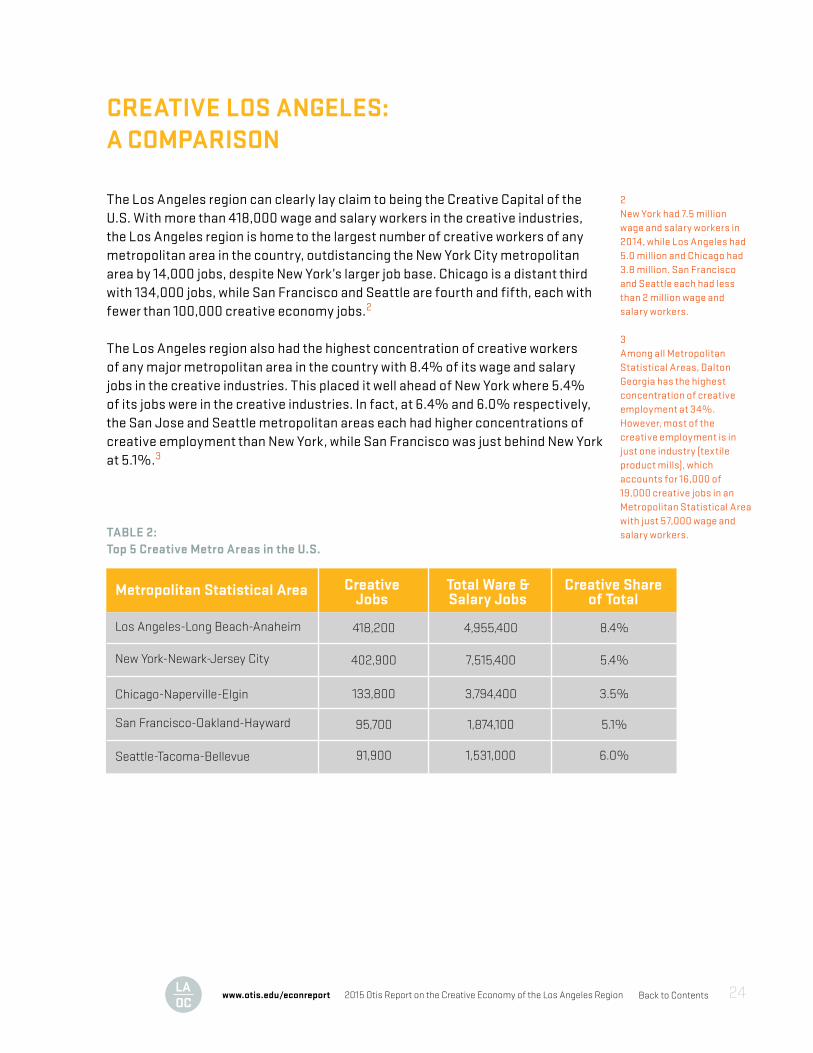
The Los Angeles region can clearly lay claim to being the Creative Capital of the U.S. With more than 418,000 wage and salary workers in the creative industries, the Los Angeles region is home to the largest number of creative workers of any metropolitan area in the country, outdistancing the New York City metropolitan area by 14,000 jobs, despite New York’s larger job base. Chicago is a distant third with 134,000 jobs, while San Francisco and Seattle are fourth and fifth, each with fewer than 100,000 creative economy jobs
Total direct labor income in the creative industries of the Los Angeles region amounted to $36.1 billion in 2014 or 13.1% of the annual private sector wage and salary payroll in the region. Of that total, the entertainment sector contributed $15.1 billion (primarily motion picture and video production) or nearly half of the total (41.7%), followed by the visual and performing arts at $6.0 billion, and fashion at $4.2 billion.
In addition to wage and salary employment, growth in the creative industries is also driven by talented self-employed individuals. In 2013 (latest data available), there were 166,404 nonemployer firms in the Los Angeles region’s creative industries that earned revenues of $7.7 billion. Between 2008 and 2013, the number of self-employed workers in Los Angeles and Orange counties increased by 15.0% (21,682 firms), slightly outpacing the region’s 14.4% increase across all industries.
While direct job counts in the creative industries of the Los Angeles region were impressive (418,200 in 2014), they were only one part of a much larger employment picture. Direct employees are those who work in the creative industries themselves. Indirect jobs are created when firms in those industries make
EXECUTIVE SUMMARY
Back to Contents2015 Otis Report on the Creative Economy of the Los Angeles Regionwww.otis.edu/econreport 8
Back to Contents2015 Otis Report on the Creative Economy of the Los Angeles Regionwww.otis.edu/econreport 9
purchases from their suppliers and vendors. Additional induced jobs are generated when the direct and indirect employees spend their wages on consumer goods and services. In that sense, every job within the creative sector supports or sustains other jobs in the region.
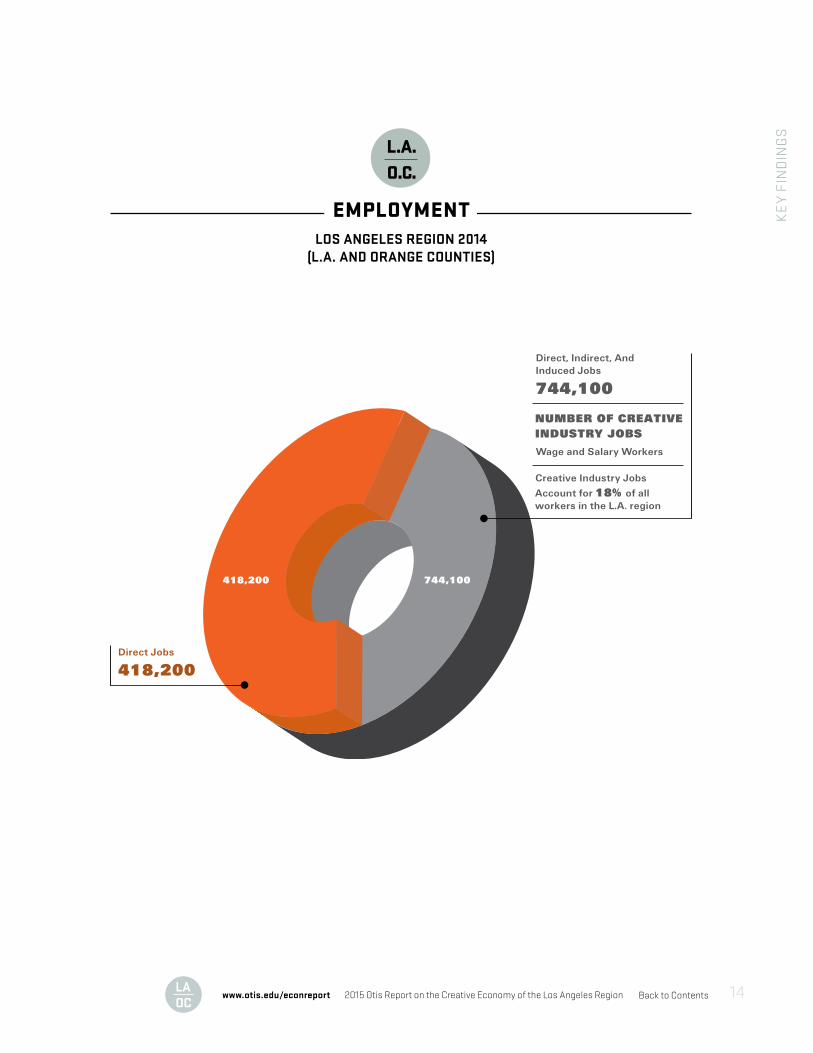
Direct, indirect and induced employment in the creative industries of the Los Angeles region totaled 744,100 jobs in 2014, up from 695,100 in 2013. The labor income earned by these 744,100 million wage and salary workers was $53.4 billion. Activity in the creative sectors not only triggers jobs and spending, but it also results in tax revenues for state and local government that help to fund local services like education and public safety. Property taxes, state and local personal income and sales taxes generated directly and indirectly by the creative industries were $7.7 billion across the region in 2014.
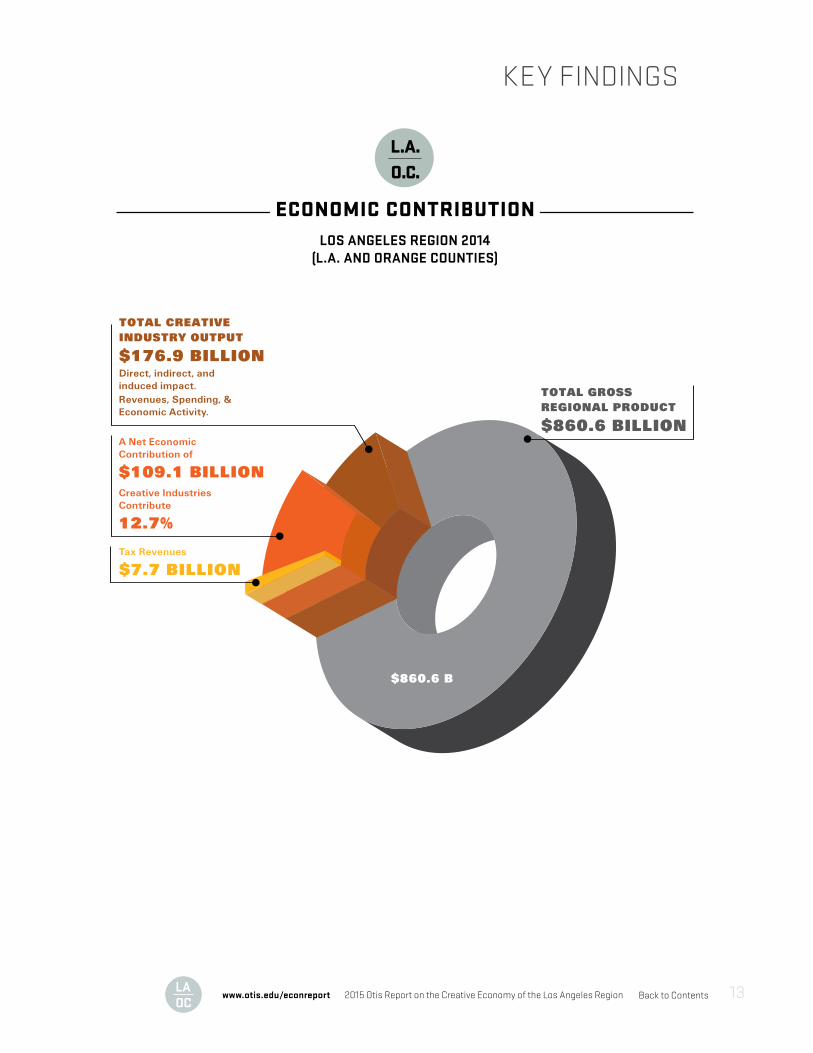
The creative industries of Los Angeles and Orange County also generated $176.9 billion in economic output. Of that, $109.1 billion was value-added (corporate profits and labor income). This net economic contribution was the equivalent of 12.7% of the region’s gross product ($860.6 billion) in 2014, up from a share of 10.6% in 2013, an indication that the contribution of the creative industries to the region’s economy is growing.
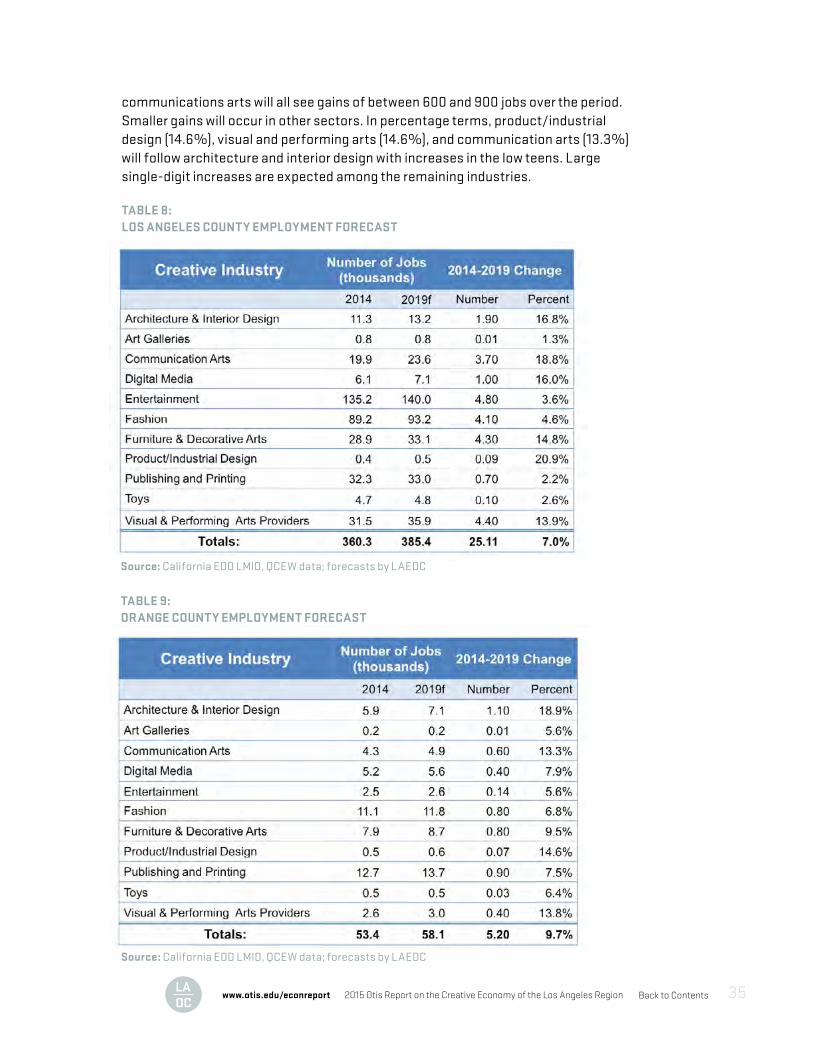
The Los Angeles region continues to make steady economic progress. Over the period 2014 to 2019, wage and salary employment in Los Angeles County is expected to grow by 4.5% and in Orange County by 8.0%. However, the LAEDC projects creative industry employment will grow faster over that period in both counties. Creative employment is expected to increase by 7.0% in Los Angeles County from 360,300 wage and salary jobs in 2014 to 385,400 in 20191. In Orange County, creative economy employment is expected to increase by 9.7% from 53,400 jobs to 58,100 over the same period.
All of the creative industries in both counties will experience wage and salary job gains. With a long-awaited lift off in the housing market anticipated in 2016, there will be increased demand for architecture and interior design, as well as furniture and the decorative arts. This will drive demand upstream to industrial design. As the national and state economies continue to expand, household expenditures on art, entertainment and toys should grow and lend support to the creative industries. Throughout this period, job gains will gradually narrow but not close the gap between current creative economy employment and the pre-recession peak level of 464,200 jobs that prevailed in 2007.
As demonstrated above, the creative industries of the Los Angeles region make a significant contribution to economic growth and employment. They also foster innovation and spillover effects that enhance other industries. The creative industries help drive the region’s economy by attracting investment, tourism, consumer spending and by generating tax revenues. In a post-industrial society,
1 Employment forecasts do not include employment at fine and performing arts schools.

Back to Contents2015 Otis Report on the Creative Economy of the Los Angeles Regionwww.otis.edu/econreport 10
activities based on creativity and culture are an essential feature of a flourishing economy. Creativity and culture also have a non-monetary value in that they contribute to inclusive social development, dialogue and understanding between people.
Given the large economic contribution of the creative industries to the regional economy, it is important to ask how stakeholders can nurture, support and grow the creative economy. Creativity is unique in that it relies on an unlimited resource: human ingenuity. Growth strategies in the creative economy should therefore focus on harnessing the development potential of this unlimited resource.
To strengthen the creative economy, a good place to start is at the beginning of the creative pipeline, preK-12 education. Education in the arts is a necessary part of preparing students to meet the demands of the twenty-first century workforce where workers now have to compete in a global labor market. Arts education fosters creative, critical thinking, problem solving and collaboration. In this sense, creativity has become as important in modern education as mastering specific language and computational skills.
California has one of the strongest polices on arts education in the nation, but uneven implementation and funding issues have resulted in huge disparities in the Los Angeles region between schools in affluent areas compared with those in low income areas. Closing these gaps would go a long way toward creating an even playing field for all of the children in the region and ensuring a future workforce with the skills necessary to gain entry into today’s economy. Additionally, companies’ decisions about where to locate their businesses are often influenced by factors such as the ready availability of a skilled and creative workforce.
Support for the creative industries must also include policies and initiatives that increase the competitiveness of the region’s creative firms and increase awareness of the state’s creative and cultural products beyond its borders. Initiatives may come from state and/or local governments, but the creative industries themselves should play the dominant role in this process.
Back to Contents2015 Otis Report on the Creative Economy of the Los Angeles Regionwww.otis.edu/econreport 11
While it is beyond the scope of this report to recommend specific development strategies, the following is a sampling of strategies that are available:
• A regional branding initiative• Marketing and partnerships that promote cultural tourism• Capacity building through programs that teach business skills to entrepreneurs,
professional education, consulting and coaching for business startups• Building physical infrastructure (e.g. affordable housing/spaces for artists to
work; improving mobility for people and freight)• Creative business incubation• Training programs that meet the specific needs of targeted industries• Access to finance
Much has been written about the need for employees in the new economy to work collaboratively to facilitate the exchange of ideas that leads to innovation. The same holds true for firms and businesses. This is one of the primary benefits of industry clustering. While the disparate set of industries that make up the creative economy do not naturally form a cluster, they are a source of significant spillover effects on innovation and productivity, tourism and branding, education and social innovation. Strengthening ties among the creative industries, as well as those between the creative industries and the broader economy, would encourage cross-innovation, lend vitality to existing industries, and contribute to the emergence of new industries.
Back to Contents2015 Otis Report on the Creative Economy of the Los Angeles Regionwww.otis.edu/econreport 12
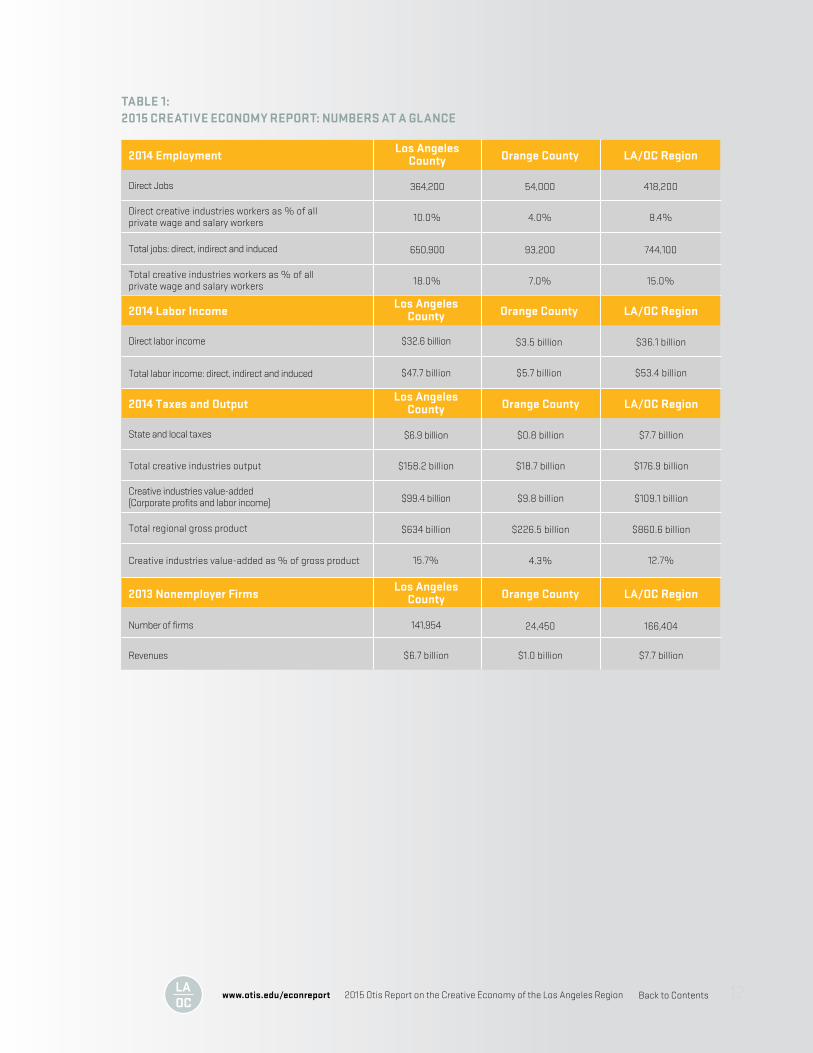
Direct Jobs 364,200 54,000 418,200
Total jobs: direct, indirect and induced 650,900 93,200 744,100
10.0% 4.0% 8.4%Direct creative industries workers as % of allprivate wage and salary workers
18.0% 7.0% 15.0%Total creative industries workers as % of allprivate wage and salary workers
2014 EmploymentLos Angeles
County Orange County LA/OC Region
State and local taxes $6.9 billion $0.8 billion $7.7 billion
Creative industries value-added(Corporate profits and labor income) $99.4 billion $9.8 billion $109.1 billion
$158.2 billion $18.7 billion $176.9 billionTotal creative industries output
$634 billion
15.7%
$226.5 billion
4.3%
$860.6 billion
12.7%
Total regional gross product
Creative industries value-added as % of gross product
2014 Taxes and OutputLos Angeles
County Orange County LA/OC Region
Direct labor income
Total labor income: direct, indirect and induced
$32.6 billion $3.5 billion $36.1 billion
$47.7 billion $5.7 billion $53.4 billion
2014 Labor IncomeLos Angeles
County Orange County LA/OC Region
Number of firms
Revenues
141,954 24,450 166,404
$6.7 billion $1.0 billion $7.7 billion
2013 Nonemployer FirmsLos Angeles
County Orange County LA/OC Region
TABLE 1:2015 CREATIVE ECONOMY REPORT: NUMBERS AT A GLANCE
Back to Contents2015 Otis Report on the Creative Economy of the Los Angeles Regionwww.otis.edu/econreport 13
$860.6 B
ECONOMIC CONTRIBUTIONLOS ANGELES REGION 2014
(L.A. AND ORANGE COUNTIES)
L.A.O.C.
TOTAL GROSS
REGIONAL PRODUCT
$860.6 BILLION
TOTAL CREATIVE
INDUSTRY OUTPUT
$176.9 BILLION
Revenues, Spending, &
Economic Activity.
Direct, indirect, and
induced impact.
A Net Economic
Contribution of
$109.1 BILLION
Creative Industries
Contribute
12.7%
Tax Revenues
$7.7 BILLION
KEY FINDINGS
Back to Contents2015 Otis Report on the Creative Economy of the Los Angeles Regionwww.otis.edu/econreport 14
744,100418,200
Creative Industry Jobs
Account for 18% of all
workers in the L.A. region
NUMBER OF CREATIVE
INDUSTRY JOBS
Wage and Salary Workers
Direct, Indirect, And
Induced Jobs
744,100
Direct Jobs
418,200
EMPLOYMENTLOS ANGELES REGION 2014
(L.A. AND ORANGE COUNTIES)
L.A.O.C.
KE
Y F
IND
ING
S
Back to Contents2015 Otis Report on the Creative Economy of the Los Angeles Regionwww.otis.edu/econreport 15
KE
Y F
IND
ING
S
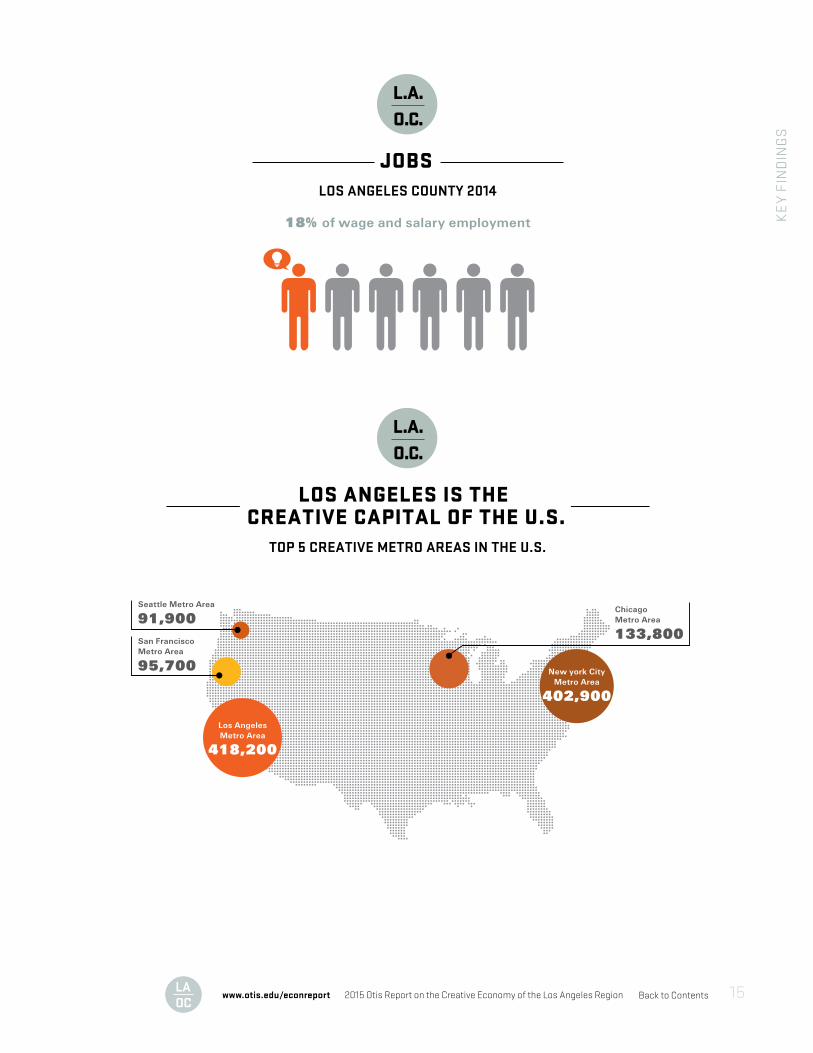
JOBSLOS ANGELES COUNTY 2014
18% of wage and salary employment
L.A.O.C.
LOS ANGELES IS THE CREATIVE CAPITAL OF THE U.S.
TOP 5 CREATIVE METRO AREAS IN THE U.S.
L.A.O.C.
Los Angeles
Metro Area
418,200
New york City
Metro Area
402,900
Seattle Metro Area
91,900
San Francisco
Metro Area
95,700
Chicago
Metro Area
133,800
Back to Contents2015 Otis Report on the Creative Economy of the Los Angeles Regionwww.otis.edu/econreport 16
About the Kyser Center for Economic Research The Kyser Center for Economic Research was named in November 2007 in honor of the LAEDC’s first Chief Economist, Jack Kyser. The Kyser Center’s economic research encompasses the Southern California region, which includes: the counties of Los Angeles, Orange, Riverside, San Bernardino, San Diego and Ventura. The center also tracks developments and produces forecasts, studies, and reports on the California, national and international economies.
The economy of the greater Los Angeles region is driven by more than its famed entertainment industry. The region’s broad economic base also includes aerospace, automotive, biotechnology, fashion, manufacturing and international trade. The Kyser Center conducts research on the individual industries of the region to better understand ongoing changes in the economy.
The Kyser Center is highly regarded for its accurate and unbiased assessment of the economy. Kyser Center economists are also sought-after public speakers and frequent contributors to media coverage of the economy. At the heart of the Kyser Center is its mission to provide information, insights and perspectives to help business leaders, government officials and the general public understand and take advantage of emerging trends.
© 2016 Los Angeles County Economic Development CorporationThe Kyser Center for Economic Research444 S. Flower St., 37th Floor, Los Angeles, CA 90071Tel: 213-622-4300, 888-4-LAEDC-1 Fax: 213-622-7100www.LAEDC.org [email protected]
Prepared for Otis College of Art and Design by theLos Angeles County Economic Development Corporation.
Back to Contents
2015 OTIS REPORT ON THECREATIVE ECONOMY OF THE LOS ANGELES REGION
Back to Contents2015 Otis Report on the Creative Economy of the Los Angeles Regionwww.otis.edu/econreport 18
WHAT IS THE CREATIVE ECONOMY? Creativity is one of the Los Angeles region’s foremost economic assets and the creative economy is undeniably important to the region’s economic growth. In this report, the creative economy is defined as the businesses and individuals involved in producing cultural, artistic, and design goods and services. It consists of creative professionals and enterprises that take powerful, original ideas and transform them into practical and often beautiful goods, or inspire us with their artistry.
The creative economy also includes organizations that provide a venue for artists to share their work with the public such as museums, art galleries and theaters. Finally, the creative economy includes activities one does not instinctively associate with creativity such as apparel, toy and furniture manufacturing - all industries that depend on good design.
In a broader sense, the creative economy must include a support system that teaches, nurtures and sustains creative activity: arts programs in preK-12 schools, post-secondary arts institutions to develop talent, and philanthropic foundations along with other nonprofit funding organizations to provide financial resources, incentives, and services to the creative arts.
In today’s economy, the market value of products and services is increasingly determined by a product’s uniqueness, performance and aesthetic appeal. More companies are seeking employees with creativity and out-of-the-box thinking as well as problem solving and communication skills. Business location decisions are also influenced by factors such as the availability of a creative workforce and the quality of life available to employees. The talent that drives the creative economy provides a competitive advantage that reaches across almost every industry in the Los Angeles region.
Regions acquire a competitive advantage when they attract creative employees because creative thinkers encourage innovation, which in turn fosters economic growth. In recent years, advanced technology jobs have been outsourced in much the same way basic manufacturing jobs have been sent offshore. But original artistic creation, innovative design and other higher-level creative work cannot be outsourced so easily. Creativity builds brand awareness and attracts talented people to a dynamic environment.
Back to Contents2015 Otis Report on the Creative Economy of the Los Angeles Regionwww.otis.edu/econreport 19
Because creativity is a dynamic function of humanity, the creative economy is a vibrant and vital force in society. Intellectual and aesthetic sensibilities lead individuals to express themselves through the arts, solve problems through design, and seek out what is beautiful and original. In many ways, the Los Angeles region is unique because of its combination of place, resources and open attitudes toward new ideas. This openness to new ideas and the ability to make associations and connections that other people do not see is one of the defining characteristics of creativity. Here, new ideas are constantly given form and brought to life by creative people.
NATIONAL AND GLOBAL ECONOMIC CONTEXTThe industries of the creative economy in the Los Angeles region respond to the ebbs and flows of the overall economy, not just locally and statewide, but nationally and globally as well. This section briefly summarizes recent and anticipated economic conditions and their likely effects on the state’s creative industries.
The year 2015 was marked by steady growth in the U.S. economy, with gross domestic product (GDP) expected to match the previous year’s growth rate of 2.4%. GDP growth has been modest, but it has also been steady and the source of solid job gains for several years running. By 2015, the U.S. was closing in on full employment with an unemployment rate of 5.0%. This was an important milestone for the economy, as it signals a return to a more normal labor market. At the same time, a pickup in wage gains drove growth in household incomes, and, in turn, consumer expenditures, which make up two-thirds of the domestic economy. Apart from the energy sector, most industries of the national economy grew, adding jobs and undertaking capital expenditures on technology, equipment, and buildings. International trade was a mixed bag in 2015. A stronger dollar enabled U.S. consumers and businesses to import more for less, but at the same time it made it more difficult for U.S. exporters to make sales given weakness among the nation’s major trading partners.
GDP growth is expected to accelerate to 2.8% in 2016, with most industries adding jobs and continuing their capital expenditures. Wage gains will spur increases in consumer spending, while business spending will maintain momentum. Meanwhile, housing and construction is expected to do well as a result of demographic changes: the oldest Millennials are now in their early thirties, the stage of life to form new households and exert greater demand for both rental and owner-
Back to Contents2015 Otis Report on the Creative Economy of the Los Angeles Regionwww.otis.edu/econreport 20
occupied housing. Inflation, which was nearly nonexistent in 2015, is increasing somewhat but will stay below two percent over the foreseeable future. Finally, international trade will again face challenges in 2016 as the dollar appreciates further and U.S. trading partners see only marginal improvement in their economies, if any at all.
California has outpaced the nation in terms of both economic growth and job creation over the past year. Nearly all of California’s industries added jobs in 2015 and will do so again in 2016. With improvements across much of the state, California’s unemployment rate has converged on long-run normal levels. Personal income, which has improved during the last several years, will grow more quickly going forward.
What does all this mean for the creative industries of the Los Angeles region? A number of creative industries are related directly or indirectly to real estate and construction: architecture and interior design, furniture and decorative arts, and product/industrial design. These industries should benefit from strength in real estate and construction during 2016. Other creative sectors may be more reliant on overall consumer spending or spending by individual consumer segments. These include art galleries, fashion, entertainment, toys, visual and performing arts, and digital media. Continued growth in consumer spending in the year 2016 should provide a boost to these industries. Both communications and printing and publishing may be facing structural changes, but they also tend to be pro-cyclical with the overall economy. As such, the outlook for continued growth implies that these sectors will see further expansion in the year ahead.
CREATIVE INDUSTRY TRENDSEMPLOYMENT A total of 364,200 wage and salary workers in Los Angeles County were employed directly in the creative industries in 2014. By sector, the largest employment counts were in entertainment (135,200 jobs), fashion (89,200 jobs), and publishing and printing (32,300 jobs). Although Los Angeles’ iconic entertainment industry consistently employs the largest number of workers by far – over 37% of total wage and salary employment – the creative economy of Los Angeles is diverse with jobs distributed across a wide array of industries.
Direct employment in Los Angeles County’s creative industries reached its peak in this cycle in 2007 at 400,500 jobs. Like total employment in the region, creative employment fell sharply during the recession. Los Angeles County as a whole recovered all of its recession-era job losses by 2014 and has been in record
Back to Contents2015 Otis Report on the Creative Economy of the Los Angeles Regionwww.otis.edu/econreport 21
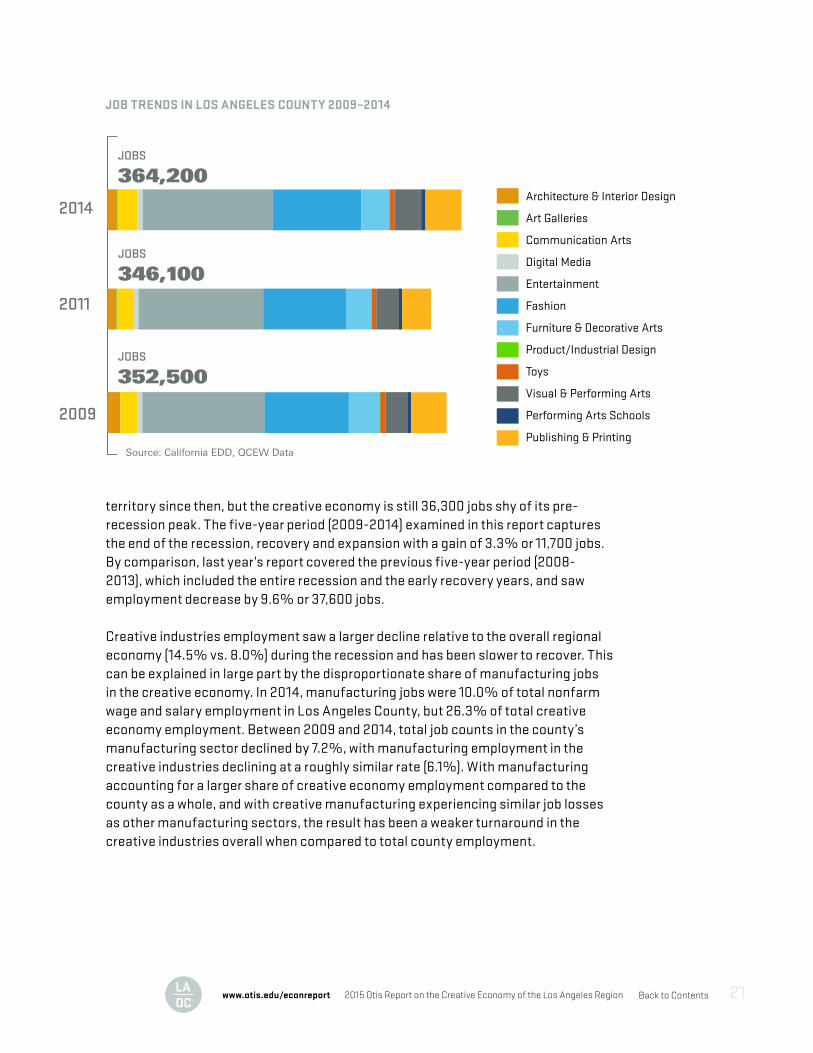
territory since then, but the creative economy is still 36,300 jobs shy of its pre-recession peak. The five-year period (2009-2014) examined in this report captures the end of the recession, recovery and expansion with a gain of 3.3% or 11,700 jobs. By comparison, last year’s report covered the previous five-year period (2008-2013), which included the entire recession and the early recovery years, and saw employment decrease by 9.6% or 37,600 jobs.
Creative industries employment saw a larger decline relative to the overall regional economy (14.5% vs. 8.0%) during the recession and has been slower to recover. This can be explained in large part by the disproportionate share of manufacturing jobs in the creative economy. In 2014, manufacturing jobs were 10.0% of total nonfarm wage and salary employment in Los Angeles County, but 26.3% of total creative economy employment. Between 2009 and 2014, total job counts in the county’s manufacturing sector declined by 7.2%, with manufacturing employment in the creative industries declining at a roughly similar rate (6.1%). With manufacturing accounting for a larger share of creative economy employment compared to the county as a whole, and with creative manufacturing experiencing similar job losses as other manufacturing sectors, the result has been a weaker turnaround in the creative industries overall when compared to total county employment.
JOB TRENDS IN LOS ANGELES COUNTY 2009–2014
GDP growth is expected to accelerate to 2.8% in 2016, with most industries adding jobs and continuing their capital expenditures. Wage gains will spur increases in consumer spending, while business spending will maintain momentum. Meanwhile, housing and construction is expected to do well as a result of demographic changes: the oldest Millennials are now in their early thirties, the stage of life to form new households and exert greater demand for both rental and owner-occupied housing. Inflation, which was nearly nonexistent in 2015, is increasing somewhat but will stay below two percent over the foreseeable future. Finally, international trade will again face challenges in 2016 as the dollar appreciates further and U.S. trading partners see only marginal improvement in their economies, if any at all.
California has outpaced the nation in terms of both economic growth and job creation over the past year. Nearly all of California’s industries added jobs in 2015 and will do so again in 2016. With improvements across much of the state, California’s unemployment rate has converged on long-run normal levels. Personal income, which has improved during the last several years, will grow more quickly going forward.
What does all this mean for the creative industries of the Los Angeles region? A number of creative industries are related directly or indirectly to real estate and construction: architecture and interior design, furniture and decorative arts, and product/industrial design. These industries should benefit from strength in real estate and construction during 2016. Other creative sectors may be more reliant on overall consumer spending or spending by individual consumer segments. These include art galleries, fashion, entertainment, toys, visual and performing arts, and digital media. Continued growth in consumer spending in the year 2016 should provide a boost to these industries. Both communications and printing and publishing may be facing structural changes, but they also tend to be pro-cyclical with the overall economy. As such, the outlook for continued growth implies that these sectors will see further expansion in the year ahead.
CREATIVE INDUSTRY TRENDSEMPLOYMENT A total of 364,200 wage and salary workers in Los Angeles County were employed directly in the creative industries in 2014. By sector, the largest employment counts
were in entertainment (135,200 jobs), fashion (89,200 jobs), and publishing and printing (32,300 jobs). Although Los Angeles’ iconic entertainment industry consistently employs the largest number of workers by far – over 37% of total wage and salary employment -- the creative economy of Los Angeles is diverse with jobs distributed across a wide array of industries.
JOB TRENDS IN LOS ANGELES COUNTY 2009-2014
Architecture & Interior Design
Art Galleries
Communication Arts
Digital Media
Entertainment
Fashion
Furniture & Decorative Arts
Product/Industrial Design
Toys
Visual & Performing Arts
Performing Arts Schools
Publishing & Printing
Architecture & Interior Design
Art Galleries
Communication Arts
Digital Media
Entertainment
Fashion
Furniture & Decorative Arts
Product/Industrial Design
Toys
Visual & Performing Arts
Performing Arts Schools
Publishing & Printing
JOBS
364,200
JOBS
346,100
JOBS
352,500
Source: California EDD, QCEW Data
LOS ANGELES COUNTY
2014
2011
2009
JOBS
54,0O0
JOBS
50,500
JOBS
54,300
Source: California EDD, QCEW Data
ORANGE COUNTY
2014
2011
2009
Direct employment in Los Angeles County’s creative industries reached its peak in this cycle in 2007 at 400,500 jobs. Like total employment in the region, creative employment fell sharply during the recession. Los Angeles County as a whole recovered all of its recession-era job losses by 2014 and has been in record territory since then, but the creative economy is still 36,300 jobs shy of its pre-recession peak. The five-year period (2009-2014) examined in this report captures the end of the recession, recovery and expansion with a gain of 3.3% or 11,700 jobs. By comparison, last year’s report covered the previous five-year period (2008-2013), which included the entire recession and the early recovery years, and saw employment decrease by 9.6% or 37,600 jobs.
JOBSLOS ANGELES COUNTY 2013
1 IN 7 JOBS
(direct, indirect, and induced)
Total creative industries wage and
salary employment
L.A.O.C.
2015 Otis Report on the Creative Economy of the Los Angeles Region 2015 Otis Report on the Creative Economy of the Los Angeles Regionwww.otis.edu/otisreport www.otis.edu/econreport1918
JOBSLOS ANGELES COUNTY 2013
1 IN 7 JOBS
(direct, indirect, and induced)
Total creative industries wage and
salary employment
L.A.O.C.
Back to Contents2015 Otis Report on the Creative Economy of the Los Angeles Regionwww.otis.edu/econreport 22
It is encouraging to note that more recently the decline in employment in some manufacturing sectors has slowed or even reversed. While employment continues to contract in textiles and apparel manufacturing along with publishing and printing, jewelry, furniture and toy manufacturing have all posted small gains over the last five years.
Although some manufacturing jobs are returning as the economy nears full employment, it is unlikely that manufacturing employment will regain prerecession levels. Over the past three decades, manufacturing has shifted to more capital intensive production, increasing output while using less labor. As a result, manufacturing employment has shown a trend decline, not just in the Los Angeles region, but across the U.S.
Conversely, the share of services employment has been on the rise: design, retail and wholesale. Service sector jobs that require specialized skills (which exist in abundance in Los Angeles) or serve the local population are much harder to outsource. Many local firms choose to maintain domestic design facilities and/or research and development activities in the U.S. precisely because these are high value-added activities, less easily replicated elsewhere. Between 2009 and 2014, creative industries employment in the service sector increased by 9.4%, with design and wholesale employment now accounting for 74% of creative industries employment.
Turning to more recent trends, creative industries employment in Los Angeles County increased by 2.4% or nearly 8,600 jobs in 2014 compared with the previous year. The creative industries grew marginally faster than the 2.3% growth rate posted for total private nonfarm employment in Los Angeles. Over the year, the visual and performing arts sector recorded the largest gain in both numerical and percentage terms, adding over 3,500 jobs, an increase of 12.6%. The entertainment industry also posted a notable gain, expanding by 2,500 jobs (1.9%). Within this sector, motion picture and video production employment, which accounted 77% of the jobs in the entertainment industry, increased by 2.5%. After posting small employment declines in 2012 and 2013, the expansion of the California Film Tax Credit may be having its intended effect, although at this early stage, overall improvement in the economy was probably a bigger factor.
Elsewhere, employment was up in architecture and interior design, digital media, furniture and decorative arts, publishing and printing, and at fine and performing arts schools. However, some industries recorded job declines over the year in 2014, notably art galleries, communication arts, fashion, product/industrial design and toys.
Back to Contents2015 Otis Report on the Creative Economy of the Los Angeles Regionwww.otis.edu/econreport 23
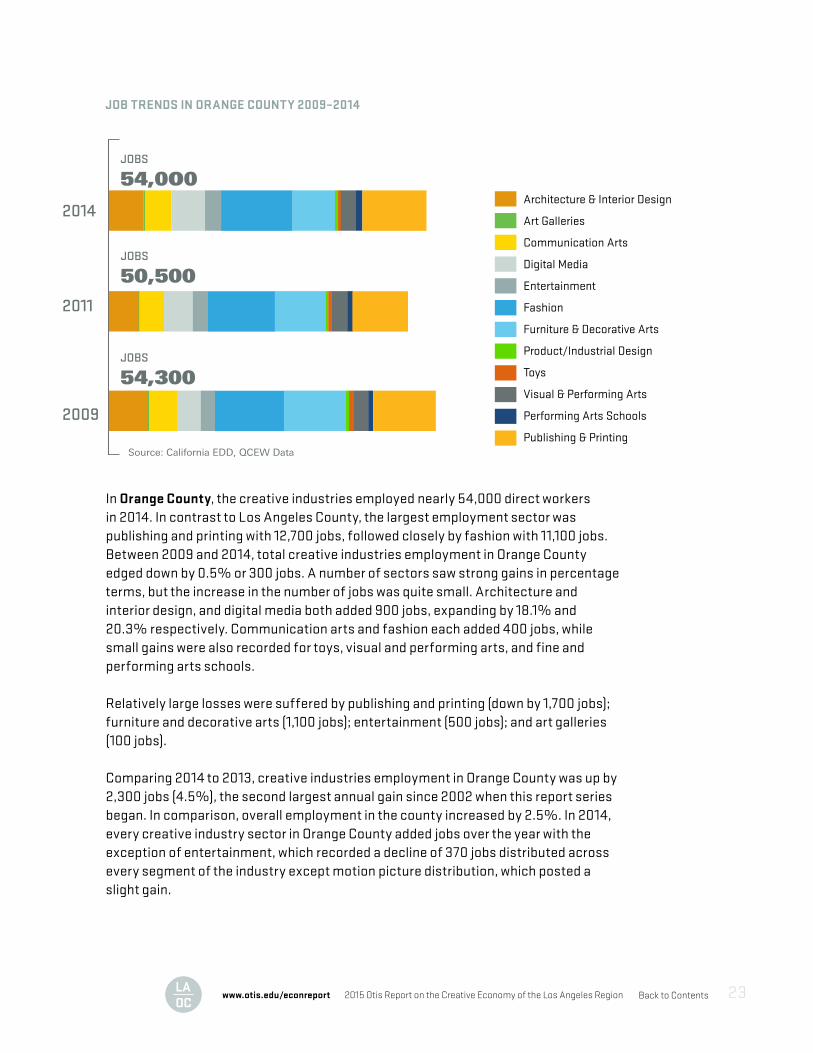
In Orange County, the creative industries employed nearly 54,000 direct workers in 2014. In contrast to Los Angeles County, the largest employment sector was publishing and printing with 12,700 jobs, followed closely by fashion with 11,100 jobs. Between 2009 and 2014, total creative industries employment in Orange County edged down by 0.5% or 300 jobs. A number of sectors saw strong gains in percentage terms, but the increase in the number of jobs was quite small. Architecture and interior design, and digital media both added 900 jobs, expanding by 18.1% and 20.3% respectively. Communication arts and fashion each added 400 jobs, while small gains were also recorded for toys, visual and performing arts, and fine and performing arts schools.
Relatively large losses were suffered by publishing and printing (down by 1,700 jobs); furniture and decorative arts (1,100 jobs); entertainment (500 jobs); and art galleries (100 jobs).
Comparing 2014 to 2013, creative industries employment in Orange County was up by 2,300 jobs (4.5%), the second largest annual gain since 2002 when this report series began. In comparison, overall employment in the county increased by 2.5%. In 2014, every creative industry sector in Orange County added jobs over the year with the exception of entertainment, which recorded a decline of 370 jobs distributed across every segment of the industry except motion picture distribution, which posted a slight gain.
JOB TRENDS IN ORANGE COUNTY 2009–2014
Creative industries employment saw a larger decline relative to the overall regional economy (14.5% vs. 8.0%) during the recession and has been slower to recover. This can be explained in large part by the disproportionate share of manufacturing jobs in the creative economy. In 2014, manufacturing jobs were 10.0% of total nonfarm wage and salary employment in Los Angeles County, but 26.3% of total creative economy employment. Between 2009 and 2014, total job counts in the county’s manufacturing sector declined by 7.2%, with manufacturing employment in the creative industries declining at a roughly similar rate (6.1%). With manufacturing accounting for a larger share of creative economy employment compared to the county as a whole, and with creative manufacturing experiencing similar job losses as other manufacturing sectors, the result has been a weaker turnaround in the creative industries overall when compared to total county employment.
It is encouraging to note that more recently the decline in employment in some manufacturing sectors has slowed or even reversed. While employment continues to contract in textiles and apparel manufacturing along with publishing and printing, jewelry, furniture and toy manufacturing have all posted small gains over the last five years.
Although some manufacturing jobs are returning as the economy nears full employment, it is unlikely that manufacturing employment will regain prerecession levels. Over the past three decades, manufacturing has shifted to more capital intensive production, increasing output while using less labor. As a result, manufacturing employment has shown a trend decline, not just in the Los Angeles region, but across the U.S.
Conversely, the share of services employment has been on the rise: design, retail and wholesale. Service sector jobs that require specialized skills (which exist in abundance in Los Angeles) or serve the local population are much harder to outsource. Many local firms choose to maintain domestic design facilities and/or research and development activities in the U.S. precisely because these are high value-added activities, less easily replicated elsewhere. Between 2009 and 2014, creative industries employment in the service sector increased by 9.4%, with design and wholesale employment now accounting for 74% of creative industries employment.
Turning to more recent trends, creative industries employment in Los Angeles County increased by 2.4% or nearly 8,600 jobs in 2014 compared with the previous year. The creative industries grew marginally faster than the 2.3% growth rate posted for total private nonfarm employment in Los Angeles. Over the year, the visual and performing arts sector recorded the largest gain in both numerical and percentage terms, adding over 3,500 jobs, an increase of 12.6%. The entertainment industry also posted a notable gain, expanding by 2,500 jobs (1.9%). Within this sector, motion picture and
video production employment, which accounted 77% of the jobs in the entertainment industry, increased by 2.5%. After posting small employment declines in 2012 and 2013, the expansion of the California Film Tax Credit may be having its intended effect, although at this early stage, overall improvement in the economy was probably a bigger factor. Elsewhere, employment was up in architecture and interior design, digital media, furniture and decorative arts, publishing and printing, and at fine and performing arts schools. However, some industries recorded job declines over the year in 2014, notably art galleries, communication arts, fashion, product/industrial design and toys. In Orange County, the creative industries employed nearly 54,000 direct workers in 2014. In contrast to Los Angeles County, the largest employment sector was publishing and printing with 12,700 jobs, followed closely by fashion with 11,100 jobs. Between 2009 and 2014, total creative industries employment in Orange County edged down by 0.5% or 300 jobs. A number of sectors saw strong gains in percentage terms, but the increase in the number of jobs was quite small. Architecture and interior design, and digital media both added 900 jobs, expanding by 18.1% and 20.3% respectively. Communication arts and fashion each added 400 jobs, while small gains were also recorded for toys, visual and performing arts, and fine and performing arts schools.
JOB TRENDS IN LOS ANGELES COUNTY 2009-2014
Architecture & Interior Design
Art Galleries
Communication Arts
Digital Media
Entertainment
Fashion
Furniture & Decorative Arts
Product/Industrial Design
Toys
Visual & Performing Arts
Performing Arts Schools
Publishing & Printing
Architecture & Interior Design
Art Galleries
Communication Arts
Digital Media
Entertainment
Fashion
Furniture & Decorative Arts
Product/Industrial Design
Toys
Visual & Performing Arts
Performing Arts Schools
Publishing & Printing
JOBS
364,200
JOBS
346,100
JOBS
352,500
Source: California EDD, QCEW Data
LOS ANGELES COUNTY
2014
2011
2009
JOBS
54,0O0
JOBS
50,500
JOBS
54,300
Source: California EDD, QCEW Data
ORANGE COUNTY
2014
2011
2009
JOBSLOS ANGELES COUNTY 2013
1 IN 7 JOBS
(direct, indirect, and induced)
Total creative industries wage and
salary employment
L.A.O.C.
2015 Otis Report on the Creative Economy of the Los Angeles Region 2015 Otis Report on the Creative Economy of the Los Angeles Regionwww.otis.edu/otisreport www.otis.edu/econreport2120
JOBSLOS ANGELES COUNTY 2013
1 IN 7 JOBS
(direct, indirect, and induced)
Total creative industries wage and
salary employment
L.A.O.C.
Back to Contents2015 Otis Report on the Creative Economy of the Los Angeles Regionwww.otis.edu/econreport 24
CREATIVE LOS ANGELES: A COMPARISON
The Los Angeles region can clearly lay claim to being the Creative Capital of the U.S. With more than 418,000 wage and salary workers in the creative industries, the Los Angeles region is home to the largest number of creative workers of any metropolitan area in the country, outdistancing the New York City metropolitan area by 14,000 jobs, despite New York’s larger job base. Chicago is a distant third with 134,000 jobs, while San Francisco and Seattle are fourth and fifth, each with fewer than 100,000 creative economy jobs.2
The Los Angeles region also had the highest concentration of creative workers of any major metropolitan area in the country with 8.4% of its wage and salary jobs in the creative industries. This placed it well ahead of New York where 5.4% of its jobs were in the creative industries. In fact, at 6.4% and 6.0% respectively, the San Jose and Seattle metropolitan areas each had higher concentrations of creative employment than New York, while San Francisco was just behind New York at 5.1%.3
2New York had 7.5 million wage and salary workers in 2014, while Los Angeles had 5.0 million and Chicago had 3.8 million. San Francisco and Seattle each had less than 2 million wage and salary workers.
3Among all Metropolitan Statistical Areas, Dalton Georgia has the highest concentration of creative employment at 34%. However, most of the creative employment is in just one industry (textile product mills), which accounts for 16,000 of 19,000 creative jobs in an Metropolitan Statistical Area with just 57,000 wage and salary workers.TABLE 2:
Top 5 Creative Metro Areas in the U.S.
Relatively large losses were suffered by publishing and printing (down by 1,700 jobs); furniture and decorative arts (1,100 jobs); entertainment (500 jobs); and art galleries (100 jobs).
Comparing 2014 to 2013, creative industries employment in Orange County was up by 2,300 jobs (4.5%), the second largest annual gain since 2002 when this report series began. In comparison, overall employment in the county increased by 2.5%. In 2014, every creative industry sector in Orange County added jobs over the year with the exception of entertainment, which recorded a decline of 370 jobs distributed across every segment of the industry except motion picture distribution, which posted a slight gain.
CREATIVE LOS ANGELES: A COMPARISON The Los Angeles region can clearly lay claim to being the Creative Capital of the U.S. With more than 418,000 wage and salary workers in the creative industries, the Los Angeles region is home to the largest number of creative workers of any metropolitan area in the country, outdistancing the New York City metropolitan area by 14,000 jobs, despite New York’s larger job base. Chicago is a distant third with 134,000 jobs, while San Francisco and Seattle are fourth and fifth, each with fewer than 100,000 creative economy jobs.2
The Los Angeles region also had the highest concentration of creative workers of any major metropolitan area in the country with 8.4% of its wage and salary jobs in the creative industries. This placed it well ahead of New York where 5.4% of its jobs were in the creative industries. In fact, at 6.4% and 6.0% respectively, the San Jose and Seattle metropolitan areas each had higher concentrations of creative employment than New York, while San Francisco was just behind New York at 5.1%.3
TABLE 1: Top 5 Creative Metro Areas in the U.S.
Los Angeles-Long Beach-Anaheim 418,200 4,955,400 8.4%
402,900 7,515,400 5.4%
133,800 3,794,400 3.5%
95,700 1,874,100 5.1%
91,900 1,531,000 6.0%
New York-Newark-Jersey City
Chicago-Naperville-Elgin
San Francisco-Oakland-Hayward
Seattle-Tacoma-Bellevue
Metropolitan Statistical Area CreativeJobs
Total Ware & Salary Jobs
Creative Share of Total
2New York’s had 7.5 million wage and salary workers in 2014, while Los Angeles had 5.0 million and Chicago had 3.8 million. San Francisco and Seattle each had less than 2 million wage and salary workers.
LABOR INCOME Total direct labor income in the creative industries of Los Angeles County amounted to $32.6 billion in 2014. Creative industries labor income in Orange County totaled $3.5 billion. The distribution of labor income across the creative economy provides a sense of how individual creative industries compare in size and economic contribution.
At $14.9 billion, the entertainment sector contributed the largest share (45.8%) to total creative industry payrolls in Los Angeles County. This also represents a slight increase in share from 45% in 2013. The visual and performing arts were a distant second at 18.1% ($5.9 billion), an increase from 17.7% last year; followed by fashion at 11.2% ($3.6 billion).
In Orange County, total payroll was distributed across a broader range of industries. Publishing and printing generated the largest share – 20.7% ($727 million), while the next largest went to digital media with 19.7% ($691 million).
3Among all MSAs, Dalton Georgia has the highest concentration of creative employment at 34%. However, most of the creative employment is in just one industry (textile product mills), which accounts for 16,000 of 19,000 creative jobs in an MSA with just 57,000 wage and salary workers.
JOBSLOS ANGELES COUNTY 2013
1 IN 7 JOBS
(direct, indirect, and induced)
Total creative industries wage and
salary employment
L.A.O.C.
2015 Otis Report on the Creative Economy of the Los Angeles Region 2015 Otis Report on the Creative Economy of the Los Angeles Regionwww.otis.edu/otisreport www.otis.edu/econreport2322
JOBSLOS ANGELES COUNTY 2013
1 IN 7 JOBS
(direct, indirect, and induced)
Total creative industries wage and
salary employment
L.A.O.C.
Back to Contents2015 Otis Report on the Creative Economy of the Los Angeles Regionwww.otis.edu/econreport 25
LABOR INCOME
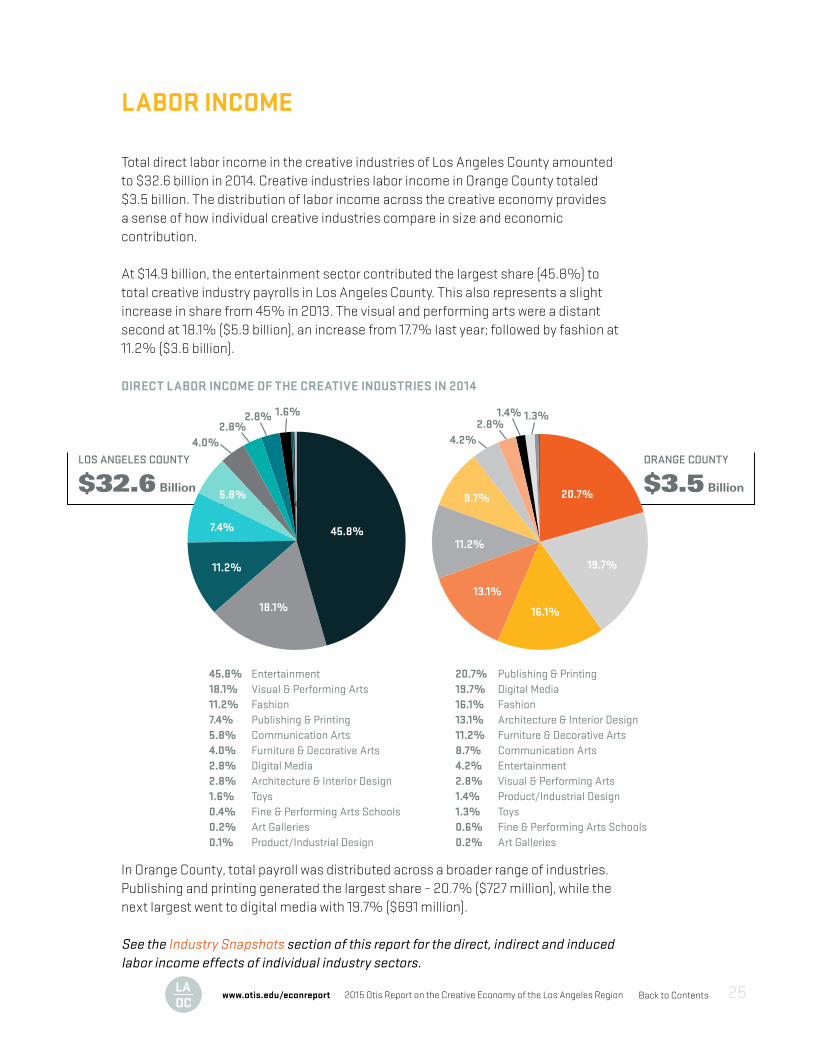
Total direct labor income in the creative industries of Los Angeles County amounted to $32.6 billion in 2014. Creative industries labor income in Orange County totaled $3.5 billion. The distribution of labor income across the creative economy provides a sense of how individual creative industries compare in size and economic contribution.
At $14.9 billion, the entertainment sector contributed the largest share (45.8%) to total creative industry payrolls in Los Angeles County. This also represents a slight increase in share from 45% in 2013. The visual and performing arts were a distant second at 18.1% ($5.9 billion), an increase from 17.7% last year; followed by fashion at 11.2% ($3.6 billion).
In Orange County, total payroll was distributed across a broader range of industries. Publishing and printing generated the largest share – 20.7% ($727 million), while the next largest went to digital media with 19.7% ($691 million).
See the Industry Snapshots section of this report for the direct, indirect and induced labor income effects of individual industry sectors.
DIRECT LABOR INCOME OF THE CREATIVE INDUSTRIES IN 2014
LOS ANGELES COUNTY
$32.6 Billion
45.8%
18.1%
11.2%
7.4%
5.8%
4.0%2.8%
2.8% 1.6%
4.2%2.8%
ORANGE COUNTY
$3.5 Billion
1.4% 1.3%
20.7%
19.7%
16.1%
13.1%
11.2%
8.7%
45.8% Entertainment18.1% Visual & Performing Arts11.2% Fashion7.4% Publishing & Printing5.8% Communication Arts4.0% Furniture & Decorative Arts2.8% Digital Media2.8% Architecture & Interior Design1.6% Toys0.4% Fine & Performing Arts Schools0.2% Art Galleries0.1% Product/Industrial Design
20.7% Publishing & Printing19.7% Digital Media16.1% Fashion13.1% Architecture & Interior Design11.2% Furniture & Decorative Arts8.7% Communication Arts4.2% Entertainment2.8% Visual & Performing Arts1.4% Product/Industrial Design1.3% Toys0.6% Fine & Performing Arts Schools0.2% Art Galleries
Source: California EDD, QCEW Data
DIRECT LABOR INCOMEOF THE CREATIVE INDUSTRIESIN 2014
Back to Contents2015 Otis Report on the Creative Economy of the Los Angeles Regionwww.otis.edu/econreport 26
COUNTING THE SELF-EMPLOYED
A large and growing portion of the creative industries are driven by talented individuals who are self-employed. Although their contribution to the creative economy is significant, their activities are not captured in the federal and state employment data used to develop most of the job numbers in this report. The government does collect data separately on people who are classified as “nonemployer firms.” These are firms consisting of one person with revenues but no additional employees. The latest nonemployer data come from the IRS for tax year 2013. It is important to note that some individuals may work on the payroll of an employer and be self-employed as well.
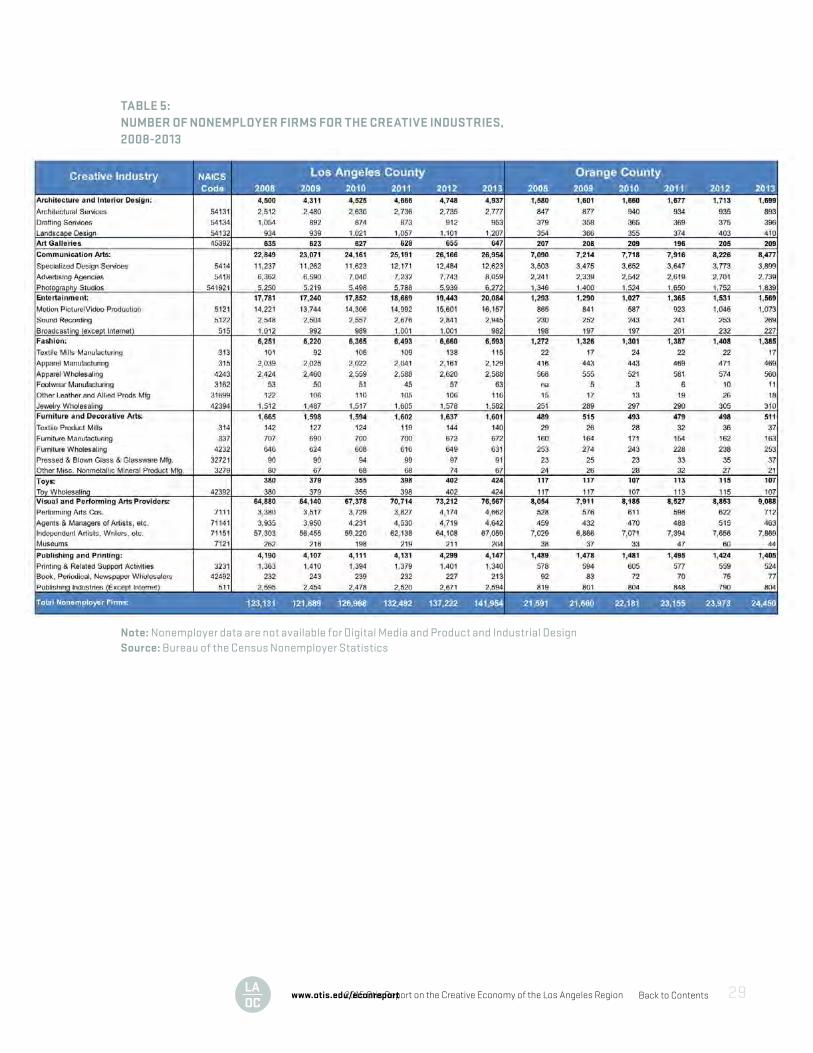
In 2013, there were 141,954 nonemployer firms in the creative industries in Los Angeles County and 24,450 in Orange County. Similar to trends in payroll employment, the number of self-employed individuals fell during 2008 and 2009, but turned around in 2010 and has achieved new record highs every year since 2011. In contrast, creative payroll employment is years away from regaining and surpassing its pre-recession peak.
In Los Angeles County, the number of nonemployer firms grew by 15.3% (18,823 firms) between 2008 and 2013 and in Orange County by 13.2% (2,859 firms). The growth of creative nonemployer firms closely tracks the increase in self-employed individuals across all industries: 15.2% in Los Angeles County and 11.7% in Orange County. In contrast, total wage and salary employment from 2008 to 2013 fell by 0.9% and 2.2% in Los Angeles and Orange counties respectively.
Visual and performing arts providers continued to make up the largest sector of nonemployer firms, particularly the subset of independent artists, writers and performers. Many of these people were involved in the entertainment industry as actors, screen writers, and set designers. A large number of independents also appeared in the communication arts sector as free-lance graphic artists and commercial or portrait photographers.
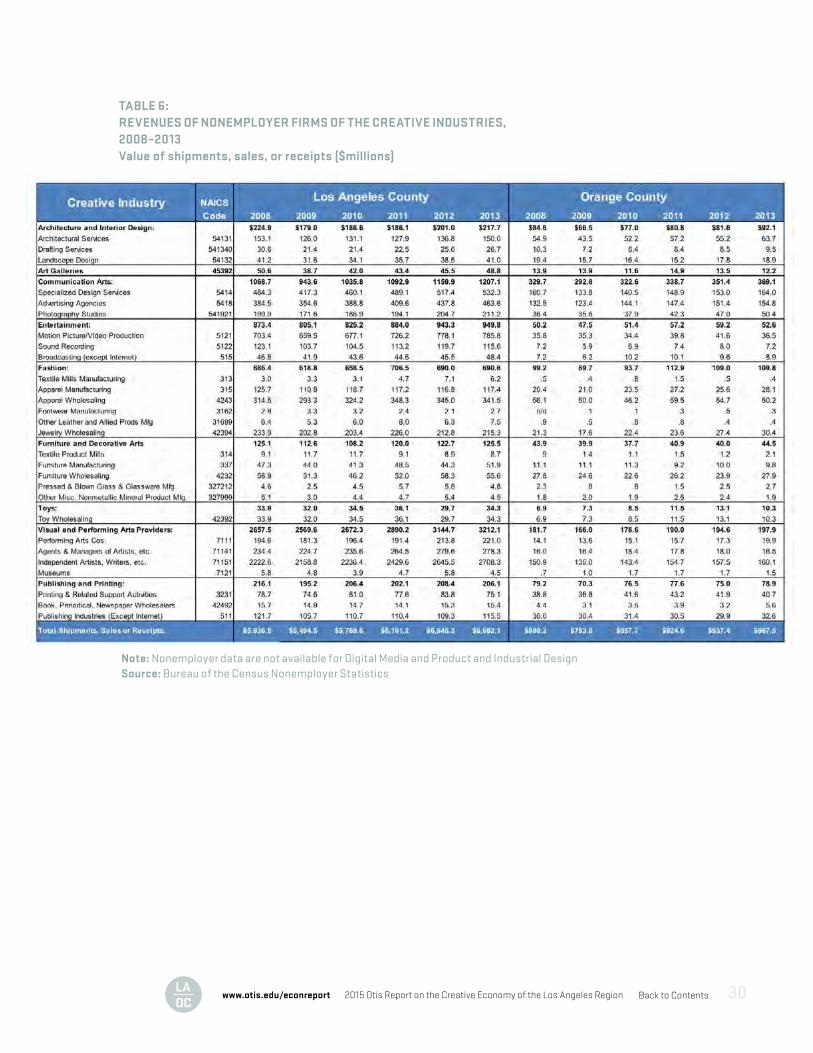
Revenues and receipts of creative nonemployer firms in Los Angeles County were $6.7 billion in 2013 with 40.5% of that total generated by independent artists, writers and performers. Revenues in 2013 were up by 12.7% compared with 2008. In Orange County, revenues grew by 8.8% to $967.5 million.
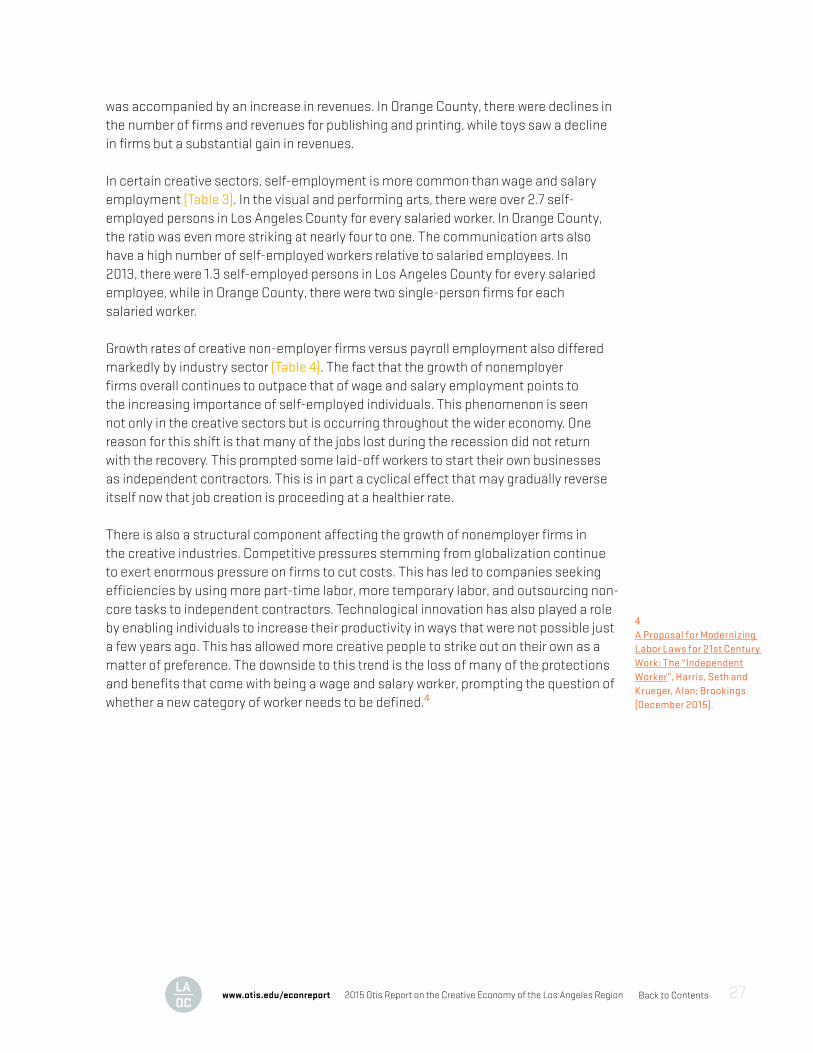
In spite of the overall increase between 2008 and 2013, a handful of nonemployer sectors in both Los Angeles and Orange County saw declines in the number of firms and revenues. In some cases, even though the number of firms in a sector contracted, revenues increased. In Los Angeles, employment and revenues declined in publishing and printing, while in furniture and decorative arts, a reduction in the number of firms
Back to Contents2015 Otis Report on the Creative Economy of the Los Angeles Regionwww.otis.edu/econreport 27
was accompanied by an increase in revenues. In Orange County, there were declines in the number of firms and revenues for publishing and printing, while toys saw a decline in firms but a substantial gain in revenues.
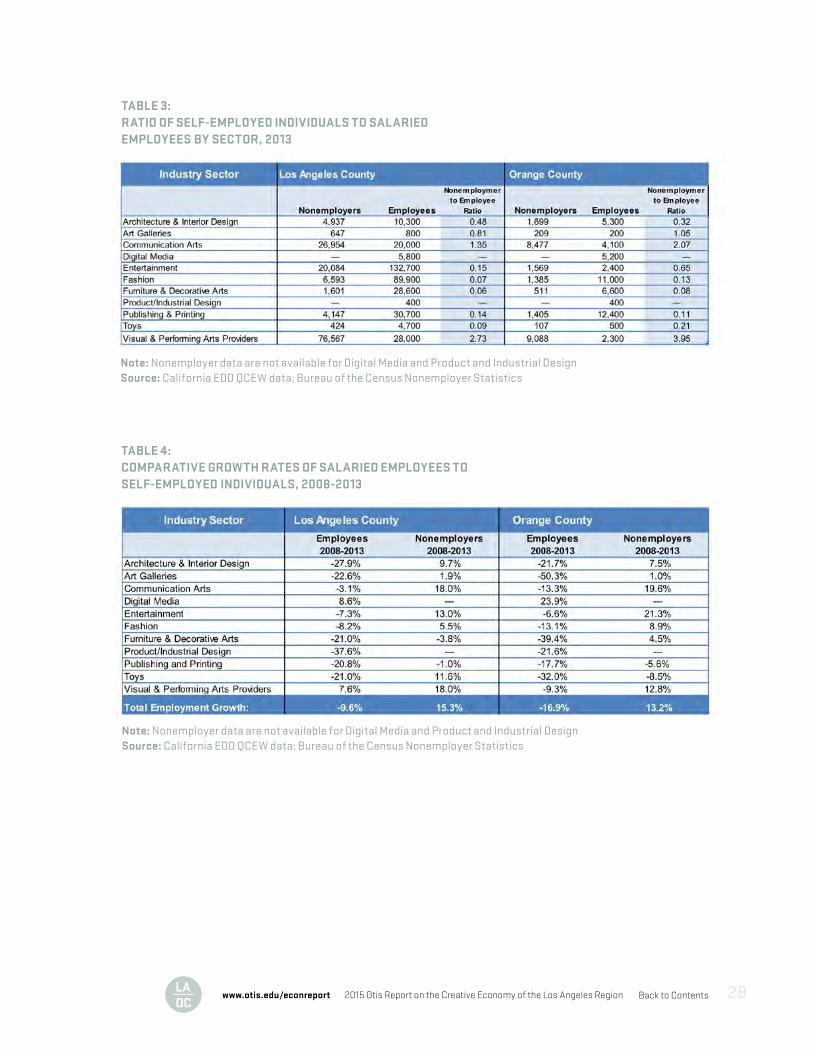
In certain creative sectors, self-employment is more common than wage and salary employment (Table 3). In the visual and performing arts, there were over 2.7 self-employed persons in Los Angeles County for every salaried worker. In Orange County, the ratio was even more striking at nearly four to one. The communication arts also have a high number of self-employed workers relative to salaried employees. In 2013, there were 1.3 self-employed persons in Los Angeles County for every salaried employee, while in Orange County, there were two single-person firms for each salaried worker.
Growth rates of creative non-employer firms versus payroll employment also differed markedly by industry sector (Table 4). The fact that the growth of nonemployer firms overall continues to outpace that of wage and salary employment points to the increasing importance of self-employed individuals. This phenomenon is seen not only in the creative sectors but is occurring throughout the wider economy. One reason for this shift is that many of the jobs lost during the recession did not return with the recovery. This prompted some laid-off workers to start their own businesses as independent contractors. This is in part a cyclical effect that may gradually reverse itself now that job creation is proceeding at a healthier rate.
There is also a structural component affecting the growth of nonemployer firms in the creative industries. Competitive pressures stemming from globalization continue to exert enormous pressure on firms to cut costs. This has led to companies seeking efficiencies by using more part-time labor, more temporary labor, and outsourcing non-core tasks to independent contractors. Technological innovation has also played a role by enabling individuals to increase their productivity in ways that were not possible just a few years ago. This has allowed more creative people to strike out on their own as a matter of preference. The downside to this trend is the loss of many of the protections and benefits that come with being a wage and salary worker, prompting the question of whether a new category of worker needs to be defined.4
4A Proposal for Modernizing Labor Laws for 21st Century Work: The “Independent Worker”, Harris, Seth and Krueger, Alan; Brookings (December 2015).
Back to Contents2015 Otis Report on the Creative Economy of the Los Angeles Regionwww.otis.edu/econreport 28
TABLE 3: RATIO OF SELF-EMPLOYED INDIVIDUALS TO SALARIED EMPLOYEES BY SECTOR, 2013
TABLE 4: COMPARATIVE GROWTH RATES OF SALARIED EMPLOYEES TO SELF-EMPLOYED INDIVIDUALS, 2008-2013
Note: Nonemployer data are not available for Digital Media and Product and Industrial DesignSource: California EDD QCEW data; Bureau of the Census Nonemployer Statistics
Note: Nonemployer data are not available for Digital Media and Product and Industrial DesignSource: California EDD QCEW data; Bureau of the Census Nonemployer Statistics
Back to Contents2015 Otis Report on the Creative Economy of the Los Angeles Region 29
TABLE 5: NUMBER OF NONEMPLOYER FIRMS FOR THE CREATIVE INDUSTRIES, 2008-2013
Note: Nonemployer data are not available for Digital Media and Product and Industrial DesignSource: Bureau of the Census Nonemployer Statistics
www.otis.edu/econreport
Back to Contents2015 Otis Report on the Creative Economy of the Los Angeles Regionwww.otis.edu/econreport 30
TABLE 6: REVENUES OF NONEMPLOYER FIRMS OF THE CREATIVE INDUSTRIES, 2008–2013Value of shipments, sales, or receipts ($millions)
Note: Nonemployer data are not available for Digital Media and Product and Industrial DesignSource: Bureau of the Census Nonemployer Statistics
Back to Contents2015 Otis Report on the Creative Economy of the Los Angeles Regionwww.otis.edu/econreport 31
ECONOMIC CONTRIBUTION OF THE CREATIVE INDUSTRIES
EMPLOYMENT AND WAGES While direct job counts in the creative industries of the Los Angeles region are impressive (418,200 in 2014), they are only one part of a much larger employment picture. Direct employees are those who actually work in the creative industries of the Los Angeles region. Indirect jobs are created when firms in these industries make purchases from their suppliers and vendors. Additional induced jobs are generated when the direct and indirect employees spend their wages on consumer goods and services. In that sense, every job within the creative sector supports or sustains other jobs in the region.
The ripple effect is substantial, giving rise to job gains and increases in income across a wide range of industries throughout the regional economy. In addition to the 418,200 direct jobs, the creative industries of the Los Angeles region generated 325,900 indirect and induced jobs for a total of 744,100 jobs in 2014, up from 612,400 in 2013. Moreover, labor income earned by these 744,100 wage and salary workers was $53.4 billion, up from $48.8 billion a year earlier.
The 166,404 nonemployer establishments in Los Angeles region’s creative sector are excluded from the contribution analysis (direct, indirect and induced) in part because they are from a different year, and also to avoid double counting (an individual may do both contract work and be on a company payroll). However, this figure shows that a significant number of workers are employed as free-lance/contingent workers over and above the wage and salary jobs that are a part of the formal contribution analysis.
TAX EFFECTSActivity in the creative sectors triggers jobs and spending, but it also results in tax revenues for state and local government that helps to fund local services like education and public safety. As with jobs, there is a ripple effect with tax revenues because the initial direct effects give rise to indirect and induced effects. The LAEDC calculated tax effects attributable directly and indirectly to the creative industries, including property tax, state and local income tax and sales tax revenues.
Back to Contents2015 Otis Report on the Creative Economy of the Los Angeles Regionwww.otis.edu/econreport 32
In the Los Angeles region, property taxes, state and local personal income taxes, and sales taxes generated directly and indirectly by the creative industries were $7.7 billion in 2014. By sector, fashion generated tax revenues of $2.0 billion, followed by entertainment at $1.9 billion, and publishing and printing at $670 million.
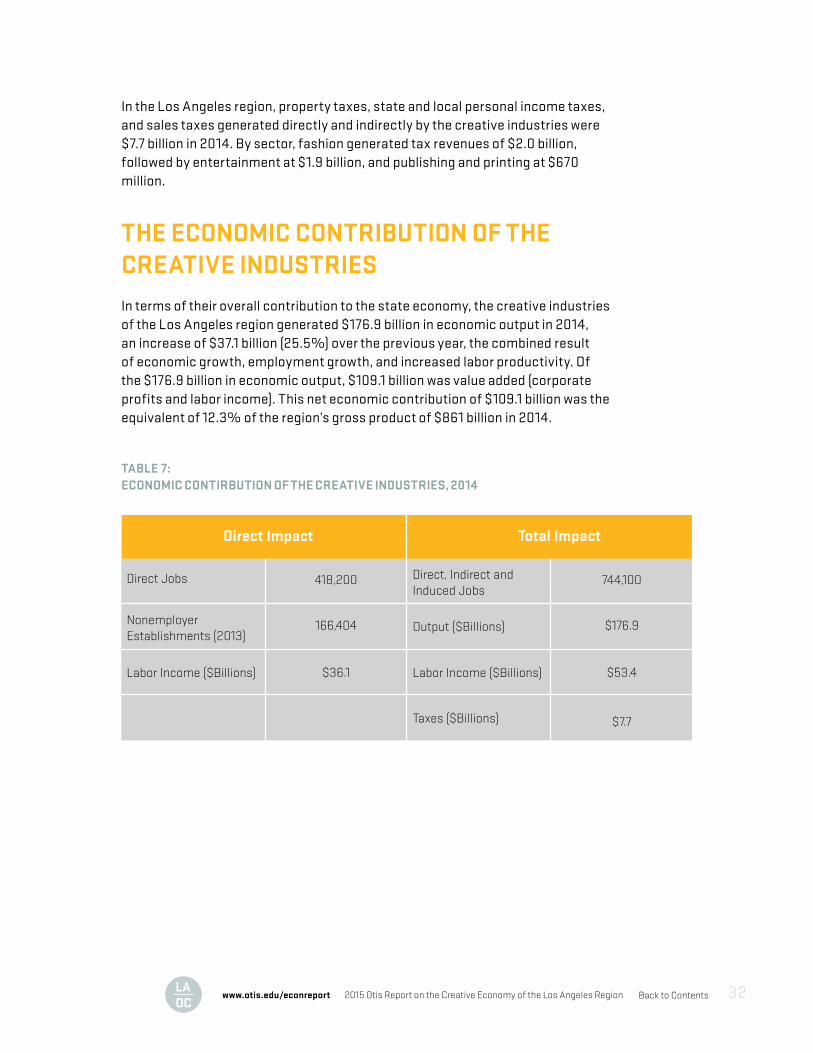
THE ECONOMIC CONTRIBUTION OF THE CREATIVE INDUSTRIESIn terms of their overall contribution to the state economy, the creative industries of the Los Angeles region generated $176.9 billion in economic output in 2014, an increase of $37.1 billion (25.5%) over the previous year, the combined result of economic growth, employment growth, and increased labor productivity. Of the $176.9 billion in economic output, $109.1 billion was value added (corporate profits and labor income). This net economic contribution of $109.1 billion was the equivalent of 12.3% of the region’s gross product of $861 billion in 2014.
TABLE 7:ECONOMIC CONTIRBUTION OF THE CREATIVE INDUSTRIES, 2014
ECONOMIC CONTRIBUTION OF THE CREATIVE INDUSTRIES EMPLOYMENT AND WAGES While direct job counts in the creative industries of the Los Angeles region are impressive (418,200 in 2014), they are only one part of a much larger employment picture. Direct employees are those who actually work in the creative industries of the Los Angeles region. Indirect jobs are created when firms in these industries make purchases from their suppliers and vendors. Additional induced jobs are generated when the direct and indirect employees spend their wages on consumer goods and services. In that sense, every job within the creative sector supports or sustains other jobs in the region.
The ripple effect is substantial, giving rise to job gains and increases in income across a wide range of industries throughout the regional economy. In addition to the 418,200 direct jobs, the creative industries of the Los Angeles region generated 325,900 indirect and induced jobs for a total of 744,100 jobs in 2014, up from 612,400 in 2013. Moreover, labor income earned by these 744,100 wage and salary workers was $53.4 billion, up from $48.8 billion a year earlier.
The 166,404 nonemployer establishments in Los Angeles region’s creative sector are excluded from the contribution analysis (direct, indirect and induced) in part because they are from a different year, and also to avoid double counting (an individual may do both contract work and be on a company payroll). However, this figure shows that a significant number of workers are employed as free-lance/contingent workers over and above the wage and salary jobs that are a part of the formal contribution analysis.
TAX EFFECTS Activity in the creative sectors triggers jobs and spending, but it also results in tax revenues for state and local government that helps to fund local services like
THE ECONOMIC CONTRIBUTION OF THE CREATIVE INDUSTRIES In terms of their overall contribution to the state economy, the creative industries of the Los Angeles region generated $176.9 billion in economic output in 2014, an increase of $37.1 billion (25.5%) over the previous year, the combined result of economic growth, employment growth, and increased labor productivity. Of the $176.9 billion in economic output, $109.1 billion was value added (corporate profits and labor income). This net economic contribution of $109.1 billion was the equivalent of 12.3% of the region’s gross product of $861 billion in 2014.
TABLE 6: Economic Contirbution of the Creative Industries, 2014
Direct Jobs Direct, Indirect and Induced Jobs
418,200 744,100
166,404 $176.9
$36.1 $53.4
$7.7
NonemployerEstablishments (2013)
Output ($Billions)
Labor Income ($Billions) Labor Income ($Billions)
Taxes ($Billions)
Direct Impact Total Impact
education and public safety. As with jobs, there is a ripple effect with tax revenues because the initial direct effects give rise to indirect and induced effects. The LAEDC calculated tax effects attributable directly and indirectly to the creative industries, including property tax, state and local income tax and sales tax revenues. In the Los Angeles region, property taxes, state and local personal income taxes, and sales taxes generated directly and indirectly by the creative industries were $7.7 billion in 2014. By sector, fashion generated tax revenues of $2.0 billion, followed by entertainment at $1.9 billion, and publishing and printing at $670 million.
JOBSLOS ANGELES COUNTY 2013
1 IN 7 JOBS
(direct, indirect, and induced)
Total creative industries wage and
salary employment
L.A.O.C.
2015 Otis Report on the Creative Economy of the Los Angeles Region 2015 Otis Report on the Creative Economy of the Los Angeles Regionwww.otis.edu/otisreport www.otis.edu/econreport3130
JOBSLOS ANGELES COUNTY 2013
1 IN 7 JOBS
(direct, indirect, and induced)
Total creative industries wage and
salary employment
L.A.O.C.
Back to Contents2015 Otis Report on the Creative Economy of the Los Angeles Regionwww.otis.edu/econreport 33
LOOKING AHEAD: THE CREATIVE ECONOMY IN 2019
The Los Angeles region marked another year of steady progress in 2015, following the cyclical expansion of the national economy. With employment growing faster than the nation, the region is expected to add over 130,000 jobs in 2015. Most industries have experienced job gains, with relatively small declines among those seeing job losses. Employment growth in the region has been led by gains in health care services, professional and business services employment, and the trade industries. Meanwhile, manufacturing employment continues to face pressure as global competition drives efficiency gains and increased automation.
Creative industries have generally participated in cyclical job gains. In a general sense, improvements in the overall economy have lifted household incomes with resulting increases in spending on entertainment, clothing, and other consumer goods. The cyclical expansion in real estate has driven large gains in architecture and interior design along with furniture and decorative arts. On the other hand, the ongoing digital revolution has fueled rapid expansion in digital media.
Will these trends continue? This section looks ahead to 2019, first with projections for the overall economy, followed by employment projections for the creative industries. Between 2014 and 2019, California’s wage and salary jobs are expected to grow by approximately two percent per year, exceeding the nation’s pace of job growth throughout the period. Most of the state’s industries will add jobs throughout the period, led by health care, professional and business services, construction and real-estate related activities, and leisure and hospitality. California’s unemployment rate will remain below six percent, approaching the U.S. rate but remaining marginally higher, consistent with the long-term trend.
Los Angeles County’s economy will see an average job growth rate of 1.2% from 2014 through 2019, but annual rates will diminish from 2.0% in 2015 to 0.5% in 2019. With these job gains, the unemployment rate in the county will approach six percent by 2019. Orange County will see job gains of about two percent per year, closer to the state’s trajectory, and resulting in an unemployment rate that will approach four percent.
The LAEDC projects that creative industry employment in the Los Angeles-Orange County region will grow by 7.2% from 2014 through 2019, roughly on par with the projected growth rate for all wage and salary jobs in the region. Creative industry job
Back to Contents2015 Otis Report on the Creative Economy of the Los Angeles Regionwww.otis.edu/econreport 34
counts will climb from 413,700 in 2014 to 443,500 wage and salary jobs in 2019, an increase of 29,800 jobs over the period. Growth is expected across the entire creative economy but the pace will vary by industry. The largest percentage gains will occur in those industries that are tied to real estate and construction activity: architecture and interior design, furniture and decorative arts, and industrial design. Improvement in the overall economy will yield increases in household incomes that will spur growth in art galleries, entertainment, and toys. While job gains will ensue over the period, creative employment will still fall short of the pre-recession peak of 464,100 from 2007, mainly due to recession-era declines in entertainment and manufacturing-related creative industries. The figures above and those cited below for Los Angeles and Orange counties track changes in wage and salary employment only. As noted earlier in this report, many creative industries rely to varying degrees on free-lance workers and independent contractors along with wage and salary employees. As such, the historical and projected job counts cited here generally under-estimate total creative employment overall and employment in the individual industries.5
Los Angeles County: Total creative industry employment in Los Angeles County has seen increases over each of the last four years. This trend will continue over the forecast period, with an increase of more than 25,000 (7.0%) from 360,300 wage and salary jobs in 2014 to 385,400 in 2019.
The largest numeric gain (4,800 jobs) will occur in the creative sector with the largest employment base, entertainment, followed by increases in visual and performing arts (4,400), furniture and decorative arts (4,300), and fashion (4,100). These four industries will account for 70% of the job gains, but other industries will see modest gains as well.
Product/industrial design, the smallest of the creative industries by job count with just over 400 workers, will see the largest percentage increase at 20.9%, which is equivalent to an increase of less than one hundred jobs. Several other industries will experience double-digit percentage increases, notably communications arts, architecture and interior design, digital media, furniture and decorative arts, and visual and performing arts.
Orange County: Creative industry employment in Orange County increased in two of the last three years, with a robust 5.3% gain occurring in 2014. Having added nearly 2,700 jobs over the previous year, wage and salary employment in the county stood at 53,400 in 2014. Job gains are anticipated over the forecast period with employment reaching 58,100 by 2019, a 9.7% increase.
Architecture and interior design will lead the county’s creative industries with both the largest numeric gain (1,100 jobs) and the largest percentage increase (18.9%). Publishing and printing, fashion, furniture and decorative arts and
5These figures also do not include employment and fine and performing arts schools.
Back to Contents2015 Otis Report on the Creative Economy of the Los Angeles Regionwww.otis.edu/econreport 35
communications arts will all see gains of between 600 and 900 jobs over the period. Smaller gains will occur in other sectors. In percentage terms, product/industrial design (14.6%), visual and performing arts (14.6%), and communication arts (13.3%) will follow architecture and interior design with increases in the low teens. Large single-digit increases are expected among the remaining industries.
TABLE 8: LOS ANGELES COUNTY EMPLOYMENT FORECAST
TABLE 9: ORANGE COUNTY EMPLOYMENT FORECAST
Source: California EDD LMID, QCEW data; forecasts by LAEDC
Source: California EDD LMID, QCEW data; forecasts by LAEDC

Back to Contents
INDUSTRY SNAPSHOTS
Back to Contents2015 Otis Report on the Creative Economy of the Los Angeles Regionwww.otis.edu/econreport 37
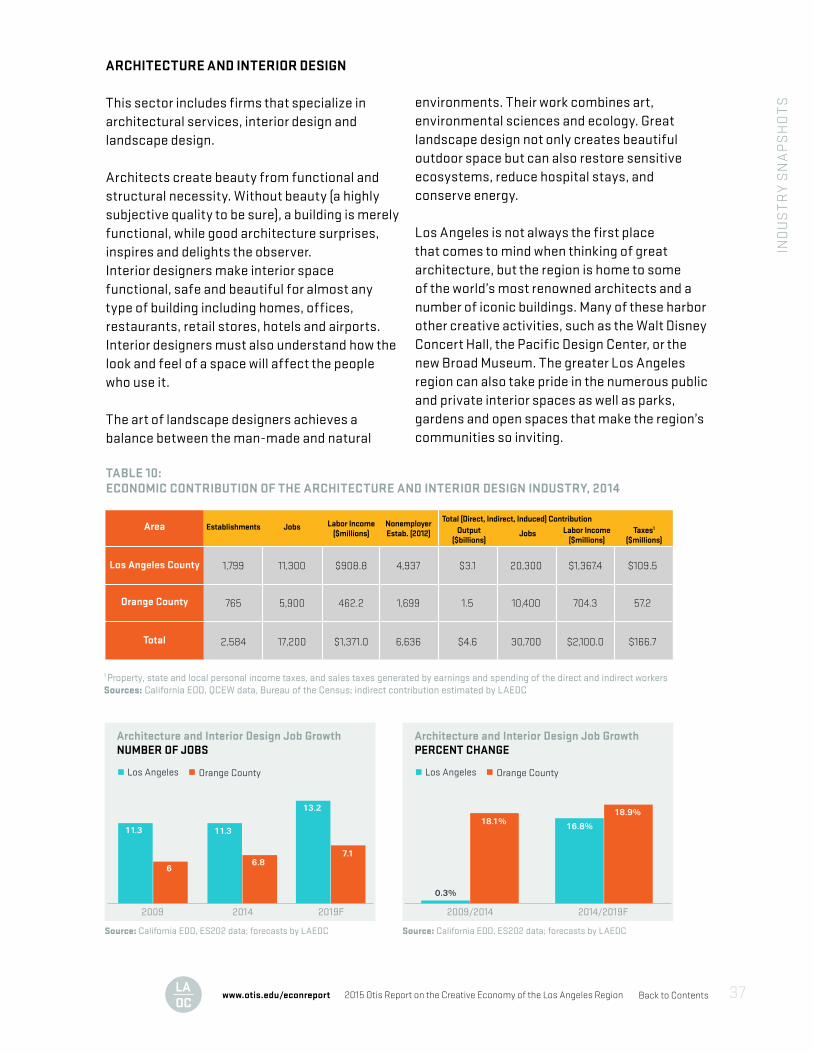
ARCHITECTURE AND INTERIOR DESIGN This sector includes firms that specialize in architectural services, interior design and landscape design.
Architects create beauty from functional and structural necessity. Without beauty (a highly subjective quality to be sure), a building is merely functional, while good architecture surprises, inspires and delights the observer.Interior designers make interior space functional, safe and beautiful for almost any type of building including homes, offices, restaurants, retail stores, hotels and airports. Interior designers must also understand how the look and feel of a space will affect the people who use it.
The art of landscape designers achieves a balance between the man-made and natural
environments. Their work combines art, environmental sciences and ecology. Great landscape design not only creates beautiful outdoor space but can also restore sensitive ecosystems, reduce hospital stays, and conserve energy.
Los Angeles is not always the first place that comes to mind when thinking of great architecture, but the region is home to some of the world’s most renowned architects and a number of iconic buildings. Many of these harbor other creative activities, such as the Walt Disney Concert Hall, the Pacific Design Center, or the new Broad Museum. The greater Los Angeles region can also take pride in the numerous public and private interior spaces as well as parks, gardens and open spaces that make the region’s communities so inviting.
TABLE 10: ECONOMIC CONTRIBUTION OF THE ARCHITECTURE AND INTERIOR DESIGN INDUSTRY, 2014
IND
US
TR
Y S
NA
PS
HO
TS
TABLE 9: Economic Contribution of the Architecture and Interior Design Industry, 2014
Area
1,799 $3.111,300 20,300$908.8 $1,367.44,937 $109.5
Establishments Output ($billions)
Total (Direct, Indirect, Induced) ContributionJobs
JobsLabor Income
($millions) Labor Income($millions)
Nonemployer Estab. (2012) Taxes1
($millions)
765 1.55,900 10,400462.2 704.31,699 57.2
2,584 $4.617,200 30,700$1,371.0 $2,100.06,636 $166.7
Los Angeles County
Orange County
Total
1 Property, state and local personal income taxes, and sales taxes generated by earnings and spending of the direct and indirect workersSources: California EDD, QCEW data, Bureau of the Census; indirect contribution estimated by LAEDC
Source: California EDD, ES202 data; forecasts by LAEDC Source: California EDD, ES202 data; forecasts by LAEDC
Los Angeles Orange County
2009 2014 2019F
11.3
6
11.3
13.2
6.8
7.1
Los Angeles Orange County
2009/2014 2014/2019F
0.3%
16.8%
18.1%
18.9%
Architecture and Interior Design Job Growth NUMBER OF JOBS
Architecture and Interior Design Job Growth PERCENT CHANGE
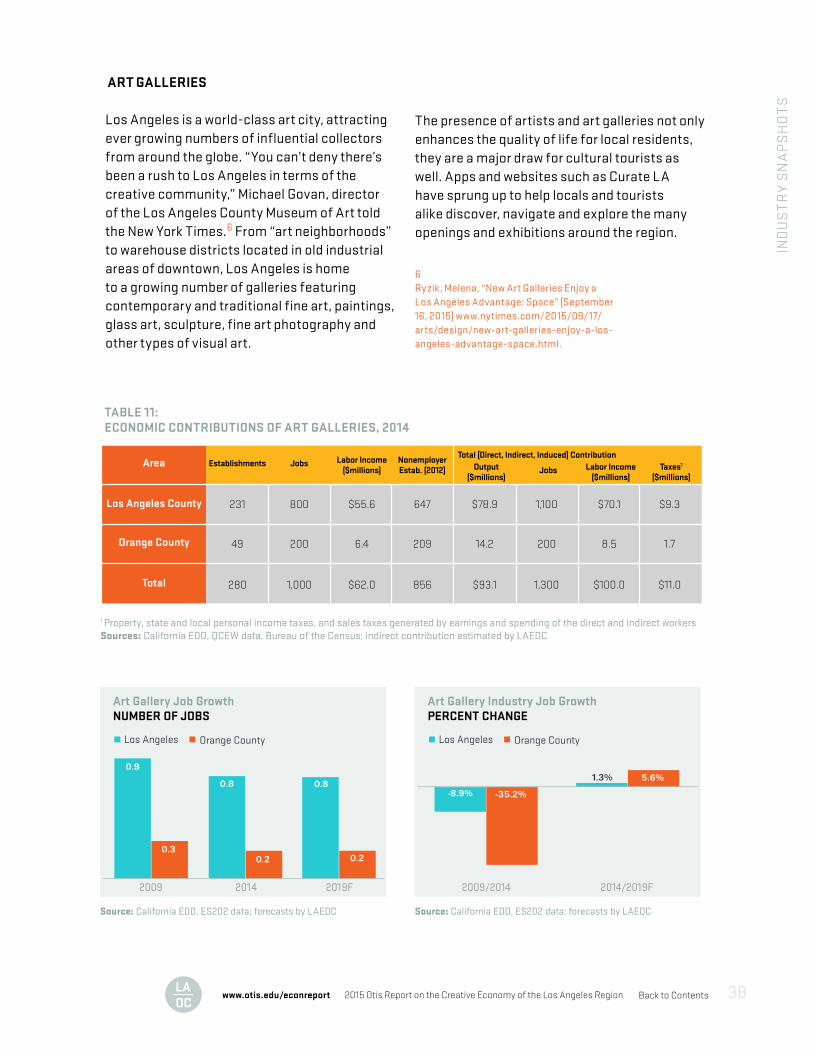
Back to Contents2015 Otis Report on the Creative Economy of the Los Angeles Regionwww.otis.edu/econreport 38
TABLE 11: ECONOMIC CONTRIBUTIONS OF ART GALLERIES, 2014
ART GALLERIES
Los Angeles is a world-class art city, attracting ever growing numbers of influential collectors from around the globe. “You can’t deny there’s been a rush to Los Angeles in terms of the creative community,” Michael Govan, director of the Los Angeles County Museum of Art told the New York Times.6 From “art neighborhoods” to warehouse districts located in old industrial areas of downtown, Los Angeles is home to a growing number of galleries featuring contemporary and traditional fine art, paintings, glass art, sculpture, fine art photography and other types of visual art.
The presence of artists and art galleries not only enhances the quality of life for local residents, they are a major draw for cultural tourists as well. Apps and websites such as Curate LA have sprung up to help locals and tourists alike discover, navigate and explore the many openings and exhibitions around the region.
6Ryzik, Melena, “New Art Galleries Enjoy a Los Angeles Advantage: Space” (September 16, 2015) www.nytimes.com/2015/09/17/arts/design/new-art-galleries-enjoy-a-los-angeles-advantage-space.html.
Area
231 $78.9800 1,100$55.6 $70.1647 $9.3
Establishments Output ($millions)
Total (Direct, Indirect, Induced) ContributionJobs
JobsLabor Income
($millions) Labor Income($millions)
Nonemployer Estab. (2012) Taxes1
($millions)
49 14.2200 2006.4 8.5209 1.7
280 $93.11,000 1,300$62.0 $100.0856 $11.0
Los Angeles County
Orange County
Total
1 Property, state and local personal income taxes, and sales taxes generated by earnings and spending of the direct and indirect workersSources: California EDD, QCEW data, Bureau of the Census; indirect contribution estimated by LAEDC
Source: California EDD, ES202 data; forecasts by LAEDC
Source: California EDD, ES202 data; forecasts by LAEDC
Source: California EDD, ES202 data; forecasts by LAEDC
Source: California EDD, ES202 data; forecasts by LAEDC
Los Angeles Orange County
2009 2014 2019F
0.9
0.3
0.8
0.8
0.2
0.2
Art Gallery Job Growth NUMBER OF JOBS
Los Angeles Orange County
2009 2014 2019F
18.4
3.9
19.9
23.6
4.3
4.9
Communication Arts Industry Job Growth NUMBER OF JOBS
Los Angeles Orange County
2009/2014 2014/2019F
-8.9%
1.3%
-35.2%
5.6%
Art Gallery Industry Job Growth PERCENT CHANGE
Los Angeles Orange County
2009/2014 2014/2019F
7.9%
18.8%
9.6%
13.3%
Communication Arts Industry Job Growth PERCENT CHANGE
TABLE 11: Economic Contribution of the Communication Arts Industry, 2014
Area
2,256 $6.319,900 34,300$1,898.4 $2,606.226,954 $234.6
Establishments Output ($billions)
Total (Direct, Indirect, Induced) ContributionJobs
JobsLabor Income
($millions) Labor Income($millions)
Nonemployer Estab. (2013) Taxes1
($millions)
654 1.24,300 6,900305.7 444.48,477 42.4
2,910 $7.524,200 41,200$2,204.1 $3,050.635,431 $277.0
Los Angeles County
Orange County
Total
1 Property, state and local personal income taxes, and sales taxes generated by earnings and spending of the direct and indirect workersSources: California EDD, QCEW data, Bureau of the Census; indirect contribution estimated by LAEDC
IND
US
TR
Y S
NA
PS
HO
TS
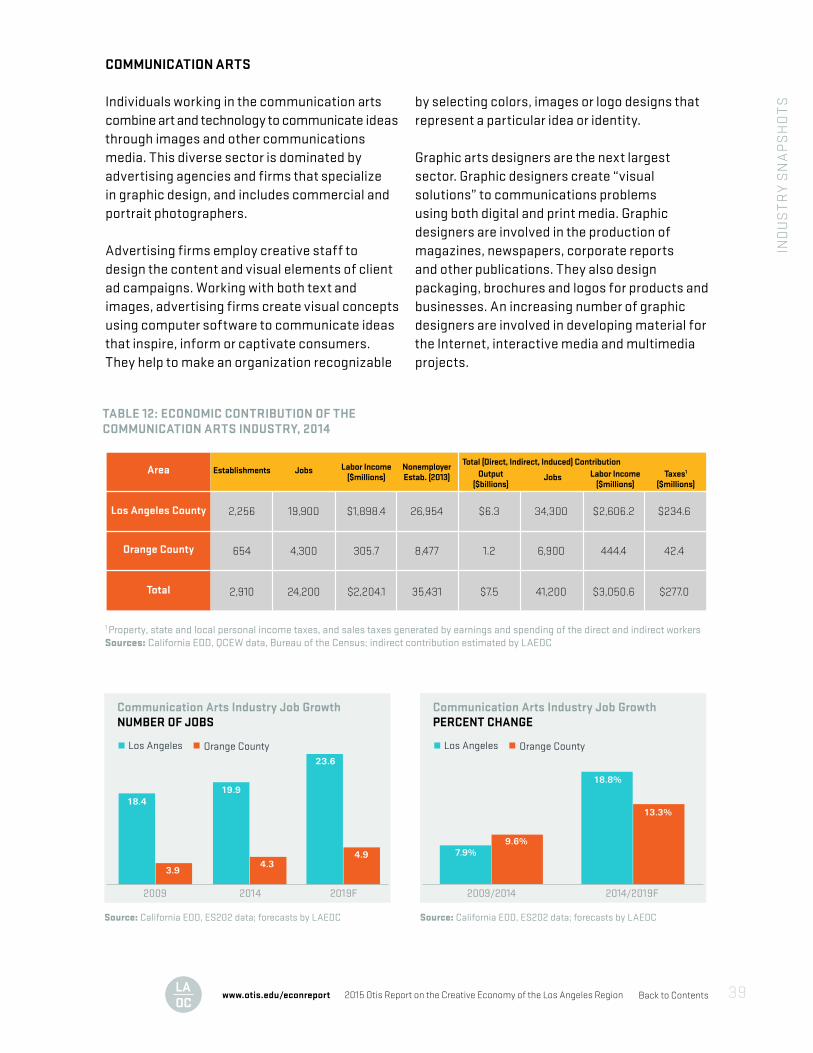
Back to Contents2015 Otis Report on the Creative Economy of the Los Angeles Regionwww.otis.edu/econreport 39
COMMUNICATION ARTS Individuals working in the communication arts combine art and technology to communicate ideas through images and other communications media. This diverse sector is dominated by advertising agencies and firms that specialize in graphic design, and includes commercial and portrait photographers.
Advertising firms employ creative staff to design the content and visual elements of client ad campaigns. Working with both text and images, advertising firms create visual concepts using computer software to communicate ideas that inspire, inform or captivate consumers. They help to make an organization recognizable
by selecting colors, images or logo designs that represent a particular idea or identity.
Graphic arts designers are the next largest sector. Graphic designers create “visual solutions” to communications problems using both digital and print media. Graphic designers are involved in the production of magazines, newspapers, corporate reports and other publications. They also design packaging, brochures and logos for products and businesses. An increasing number of graphic designers are involved in developing material for the Internet, interactive media and multimedia projects.
TABLE 12: ECONOMIC CONTRIBUTION OF THE COMMUNICATION ARTS INDUSTRY, 2014
Area
231 $78.9800 1,100$55.6 $70.1647 $9.3
Establishments Output ($millions)
Total (Direct, Indirect, Induced) ContributionJobs
JobsLabor Income
($millions) Labor Income($millions)
Nonemployer Estab. (2012) Taxes1
($millions)
49 14.2200 2006.4 8.5209 1.7
280 $93.11,000 1,300$62.0 $100.0856 $11.0
Los Angeles County
Orange County
Total
1 Property, state and local personal income taxes, and sales taxes generated by earnings and spending of the direct and indirect workersSources: California EDD, QCEW data, Bureau of the Census; indirect contribution estimated by LAEDC
Source: California EDD, ES202 data; forecasts by LAEDC
Source: California EDD, ES202 data; forecasts by LAEDC
Source: California EDD, ES202 data; forecasts by LAEDC
Source: California EDD, ES202 data; forecasts by LAEDC
Los Angeles Orange County
2009 2014 2019F
0.9
0.3
0.8
0.8
0.2
0.2
Art Gallery Job Growth NUMBER OF JOBS
Los Angeles Orange County
2009 2014 2019F
18.4
3.9
19.9
23.6
4.3
4.9
Communication Arts Industry Job Growth NUMBER OF JOBS
Los Angeles Orange County
2009/2014 2014/2019F
-8.9%
1.3%
-35.2%
5.6%
Art Gallery Industry Job Growth PERCENT CHANGE
Los Angeles Orange County
2009/2014 2014/2019F
7.9%
18.8%
9.6%
13.3%
Communication Arts Industry Job Growth PERCENT CHANGE
TABLE 11: Economic Contribution of the Communication Arts Industry, 2014
Area
2,256 $6.319,900 34,300$1,898.4 $2,606.226,954 $234.6
Establishments Output ($billions)
Total (Direct, Indirect, Induced) ContributionJobs
JobsLabor Income
($millions) Labor Income($millions)
Nonemployer Estab. (2013) Taxes1
($millions)
654 1.24,300 6,900305.7 444.48,477 42.4
2,910 $7.524,200 41,200$2,204.1 $3,050.635,431 $277.0
Los Angeles County
Orange County
Total
1 Property, state and local personal income taxes, and sales taxes generated by earnings and spending of the direct and indirect workersSources: California EDD, QCEW data, Bureau of the Census; indirect contribution estimated by LAEDC
IND
US
TR
Y S
NA
PS
HO
TS
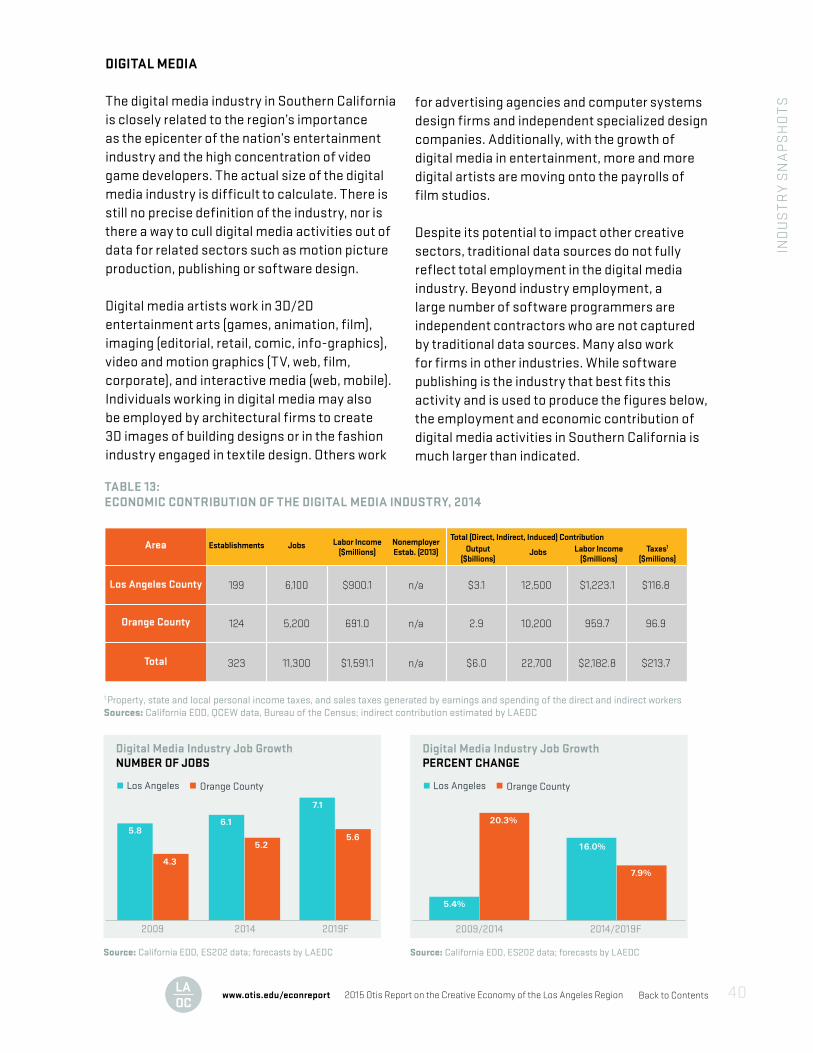
Back to Contents2015 Otis Report on the Creative Economy of the Los Angeles Regionwww.otis.edu/econreport 40
TABLE 13: ECONOMIC CONTRIBUTION OF THE DIGITAL MEDIA INDUSTRY, 2014
DIGITAL MEDIA
The digital media industry in Southern California is closely related to the region’s importance as the epicenter of the nation’s entertainment industry and the high concentration of video game developers. The actual size of the digital media industry is difficult to calculate. There is still no precise definition of the industry, nor is there a way to cull digital media activities out of data for related sectors such as motion picture production, publishing or software design.
Digital media artists work in 3D/2D entertainment arts (games, animation, film), imaging (editorial, retail, comic, info-graphics), video and motion graphics (TV, web, film, corporate), and interactive media (web, mobile). Individuals working in digital media may also be employed by architectural firms to create 3D images of building designs or in the fashion industry engaged in textile design. Others work
for advertising agencies and computer systems design firms and independent specialized design companies. Additionally, with the growth of digital media in entertainment, more and more digital artists are moving onto the payrolls of film studios.
Despite its potential to impact other creative sectors, traditional data sources do not fully reflect total employment in the digital media industry. Beyond industry employment, a large number of software programmers are independent contractors who are not captured by traditional data sources. Many also work for firms in other industries. While software publishing is the industry that best fits this activity and is used to produce the figures below, the employment and economic contribution of digital media activities in Southern California is much larger than indicated.
TABLE 13: Economic Contribution of the Entertainment Industry, 2014
Area
6,696 $83.0135,200 239,000$14,919.0 $20,427.620,084 $2,854.9
Establishments Output ($billions)
Total (Direct, Indirect, Induced) ContributionJobs
JobsLabor Income
($millions) Labor Income($millions)
Nonemployer Estab. (2013) Taxes1
($millions)
248 1.42,100 4,000$149.2 272.71,569 31.7
6,944 $84.4137,300 243,000$15,068.2 20,70021,653 $2,886.6
Los Angeles County
Orange County
Total
1 Property, state and local personal income taxes, and sales taxes generated by earnings and spending of the direct and indirect workersSources: California EDD, QCEW data, Bureau of the Census; indirect contribution estimated by LAEDC
Source: California EDD, ES202 data; forecasts by LAEDC
Los Angeles Orange County
2009 2014 2019F
129.5
2.5
135.2
140.0
2.1
2.6
Entertainment Industry Job Growth NUMBER OF JOBS
Source: California EDD, ES202 data; forecasts by LAEDC
Los Angeles Orange County
2009/2014 2014/2019F
4.4%
3.6%
-18.6%
5.6%
Entertainment Industry Job Growth PERCENT CHANGE
TABLE 12: Economic Contribution of the Digital Media Industry, 2014
Area
199 $3.16,100 12,500$900.1 $1,223.1n/a $116.8
Establishments Output ($billions)
Total (Direct, Indirect, Induced) ContributionJobs
JobsLabor Income
($millions) Labor Income($millions)
Nonemployer Estab. (2013) Taxes1
($millions)
124 2.95,200 10,200691.0 959.7n/a 96.9
323 $6.011,300 22,700$1,591.1 $2,182.8n/a $213.7
Los Angeles County
Orange County
Total
1 Property, state and local personal income taxes, and sales taxes generated by earnings and spending of the direct and indirect workersSources: California EDD, QCEW data, Bureau of the Census; indirect contribution estimated by LAEDC
Source: California EDD, ES202 data; forecasts by LAEDC
Los Angeles Orange County
2009 2014 2019F
5.8
4.3
6.1
7.1
5.2
5.6
Digital Media Industry Job Growth NUMBER OF JOBS
Source: California EDD, ES202 data; forecasts by LAEDC
Los Angeles Orange County
2009/2014 2014/2019F
5.4%
16.0%
20.3%
7.9%
Digital Media Industry Job Growth PERCENT CHANGE
IND
US
TR
Y S
NA
PS
HO
TS
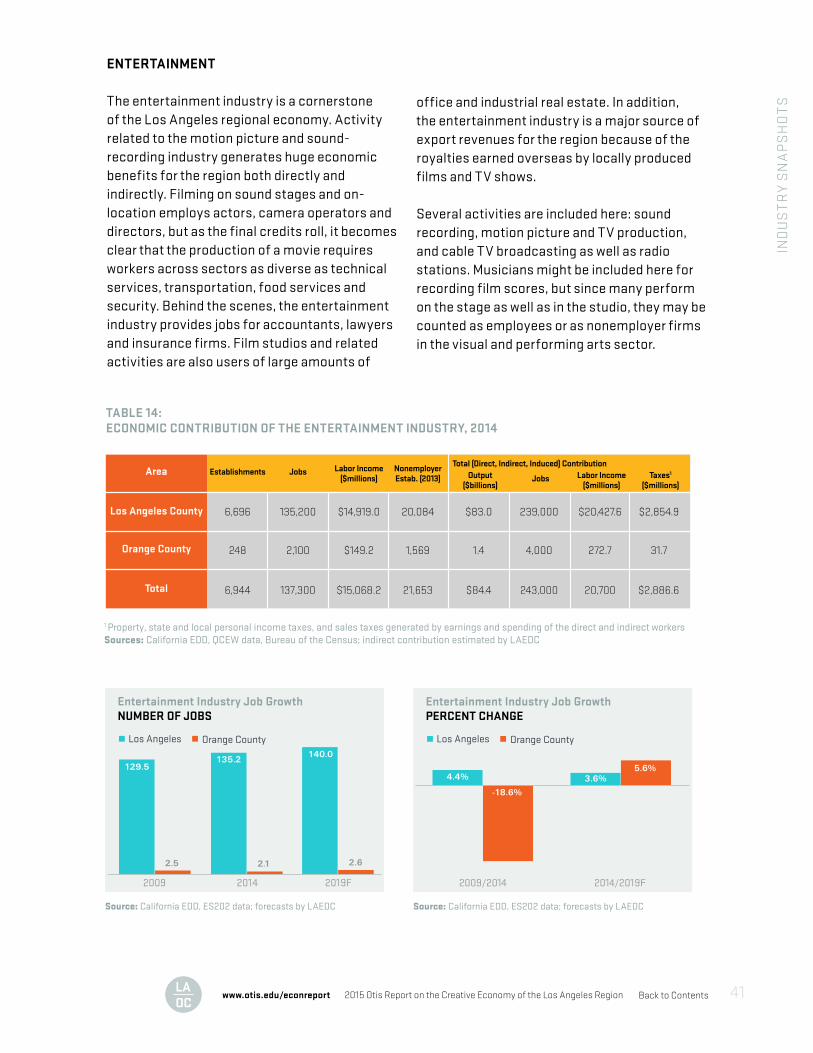
Back to Contents2015 Otis Report on the Creative Economy of the Los Angeles Regionwww.otis.edu/econreport 41
TABLE 14: ECONOMIC CONTRIBUTION OF THE ENTERTAINMENT INDUSTRY, 2014
ENTERTAINMENT
The entertainment industry is a cornerstone of the Los Angeles regional economy. Activity related to the motion picture and sound-recording industry generates huge economic benefits for the region both directly and indirectly. Filming on sound stages and on-location employs actors, camera operators and directors, but as the final credits roll, it becomes clear that the production of a movie requires workers across sectors as diverse as technical services, transportation, food services and security. Behind the scenes, the entertainment industry provides jobs for accountants, lawyers and insurance firms. Film studios and related activities are also users of large amounts of
office and industrial real estate. In addition, the entertainment industry is a major source of export revenues for the region because of the royalties earned overseas by locally produced films and TV shows.
Several activities are included here: sound recording, motion picture and TV production, and cable TV broadcasting as well as radio stations. Musicians might be included here for recording film scores, but since many perform on the stage as well as in the studio, they may be counted as employees or as nonemployer firms in the visual and performing arts sector.
TABLE 13: Economic Contribution of the Entertainment Industry, 2014
Area
6,696 $83.0135,200 239,000$14,919.0 $20,427.620,084 $2,854.9
Establishments Output ($billions)
Total (Direct, Indirect, Induced) ContributionJobs
JobsLabor Income
($millions) Labor Income($millions)
Nonemployer Estab. (2013) Taxes1
($millions)
248 1.42,100 4,000$149.2 272.71,569 31.7
6,944 $84.4137,300 243,000$15,068.2 20,70021,653 $2,886.6
Los Angeles County
Orange County
Total
1 Property, state and local personal income taxes, and sales taxes generated by earnings and spending of the direct and indirect workersSources: California EDD, QCEW data, Bureau of the Census; indirect contribution estimated by LAEDC
Source: California EDD, ES202 data; forecasts by LAEDC
Los Angeles Orange County
2009 2014 2019F
129.5
2.5
135.2
140.0
2.1
2.6
Entertainment Industry Job Growth NUMBER OF JOBS
Source: California EDD, ES202 data; forecasts by LAEDC
Los Angeles Orange County
2009/2014 2014/2019F
4.4%
3.6%
-18.6%
5.6%
Entertainment Industry Job Growth PERCENT CHANGE
TABLE 12: Economic Contribution of the Digital Media Industry, 2014
Area
199 $3.16,100 12,500$900.1 $1,223.1n/a $116.8
Establishments Output ($billions)
Total (Direct, Indirect, Induced) ContributionJobs
JobsLabor Income
($millions) Labor Income($millions)
Nonemployer Estab. (2013) Taxes1
($millions)
124 2.95,200 10,200691.0 959.7n/a 96.9
323 $6.011,300 22,700$1,591.1 $2,182.8n/a $213.7
Los Angeles County
Orange County
Total
1 Property, state and local personal income taxes, and sales taxes generated by earnings and spending of the direct and indirect workersSources: California EDD, QCEW data, Bureau of the Census; indirect contribution estimated by LAEDC
Source: California EDD, ES202 data; forecasts by LAEDC
Los Angeles Orange County
2009 2014 2019F
5.8
4.3
6.1
7.1
5.2
5.6
Digital Media Industry Job Growth NUMBER OF JOBS
Source: California EDD, ES202 data; forecasts by LAEDC
Los Angeles Orange County
2009/2014 2014/2019F
5.4%
16.0%
20.3%
7.9%
Digital Media Industry Job Growth PERCENT CHANGE
IND
US
TR
Y S
NA
PS
HO
TS
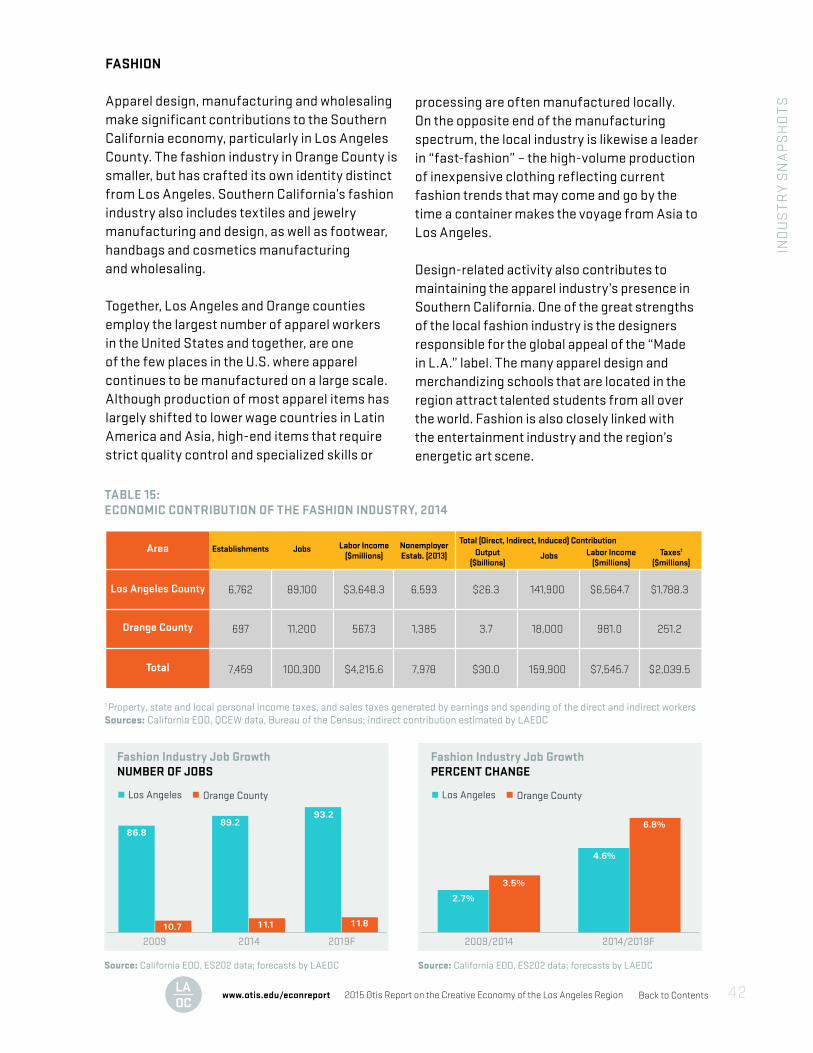
Back to Contents2015 Otis Report on the Creative Economy of the Los Angeles Regionwww.otis.edu/econreport 42
FASHION Apparel design, manufacturing and wholesaling make significant contributions to the Southern California economy, particularly in Los Angeles County. The fashion industry in Orange County is smaller, but has crafted its own identity distinct from Los Angeles. Southern California’s fashion industry also includes textiles and jewelry manufacturing and design, as well as footwear, handbags and cosmetics manufacturing and wholesaling.
Together, Los Angeles and Orange counties employ the largest number of apparel workers in the United States and together, are one of the few places in the U.S. where apparel continues to be manufactured on a large scale. Although production of most apparel items has largely shifted to lower wage countries in Latin America and Asia, high-end items that require strict quality control and specialized skills or
processing are often manufactured locally. On the opposite end of the manufacturing spectrum, the local industry is likewise a leader in “fast-fashion” – the high-volume production of inexpensive clothing reflecting current fashion trends that may come and go by the time a container makes the voyage from Asia to Los Angeles.
Design-related activity also contributes to maintaining the apparel industry’s presence in Southern California. One of the great strengths of the local fashion industry is the designers responsible for the global appeal of the “Made in L.A.” label. The many apparel design and merchandizing schools that are located in the region attract talented students from all over the world. Fashion is also closely linked with the entertainment industry and the region’s energetic art scene.
TABLE 15: ECONOMIC CONTRIBUTION OF THE FASHION INDUSTRY, 2014
TABLE 14: Economic Contribution Of The Fashion Industry, 2014
Area
6,762 $26.389,100 141,900$3,648.3 $6,564.76,593 $1,788.3
Establishments Output ($billions)
Total (Direct, Indirect, Induced) ContributionJobs
JobsLabor Income
($millions) Labor Income($millions)
Nonemployer Estab. (2013) Taxes1
($millions)
697 3.711,200 18,000567.3 981.01,385 251.2
7,459 $30.0100,300 159,900$4,215.6 $7,545.77,978 $2,039.5
Los Angeles County
Orange County
Total
1 Property, state and local personal income taxes, and sales taxes generated by earnings and spending of the direct and indirect workersSources: California EDD, QCEW data, Bureau of the Census; indirect contribution estimated by LAEDC
Source: California EDD, ES202 data; forecasts by LAEDC
Los Angeles Orange County
2009 2014 2019F
86.8
10.7
89.2
93.2
11.1
11.8
Fashion Industry Job Growth NUMBER OF JOBS
Source: California EDD, ES202 data; forecasts by LAEDC
Los Angeles Orange County
2009/2014 2014/2019F
2.7%
4.6%
3.5%
6.8%
Fashion Industry Job Growth PERCENT CHANGE
TABLE 15: Economic Contribution of the Furniture and Decorative Arts Industry, 2014
Area
1,607 $8.628,800 44,700$1,291.7 $2,157.51,601 $495.2
Establishments Output ($billions)
Total (Direct, Indirect, Induced) ContributionJobs
JobsLabor Income
($millions) Labor Income($millions)
Nonemployer Estab. (2013) Taxes1
($millions)
486 2.57,900 12,200393.3 642.6511 121.7
2,093 $11.136,700 56,900$1,685.0 $2,800.12,112 $616.9
Los Angeles County
Orange County
Total
1 Property, state and local personal income taxes, and sales taxes generated by earnings and spending of the direct and indirect workersSources: California EDD, QCEW data, Bureau of the Census; indirect contribution estimated by LAEDC
Source: California EDD, ES202 data; forecasts by LAEDC
Los Angeles Orange County
2009 2014 2019F
29.0
9.0
28.8
33.1
7.9
8.7
Furniture and Decorative Arts Industry Job Growth NUMBER OF JOBS
Source: California EDD, ES202 data; forecasts by LAEDC
Los Angeles Orange County
2009/2014 2014/2019F
-0.4%
14.8%
-12.2%
9.5%
Furniture and Decorative Arts Industry Job Growth PERCENT CHANGE
IND
US
TR
Y S
NA
PS
HO
TS
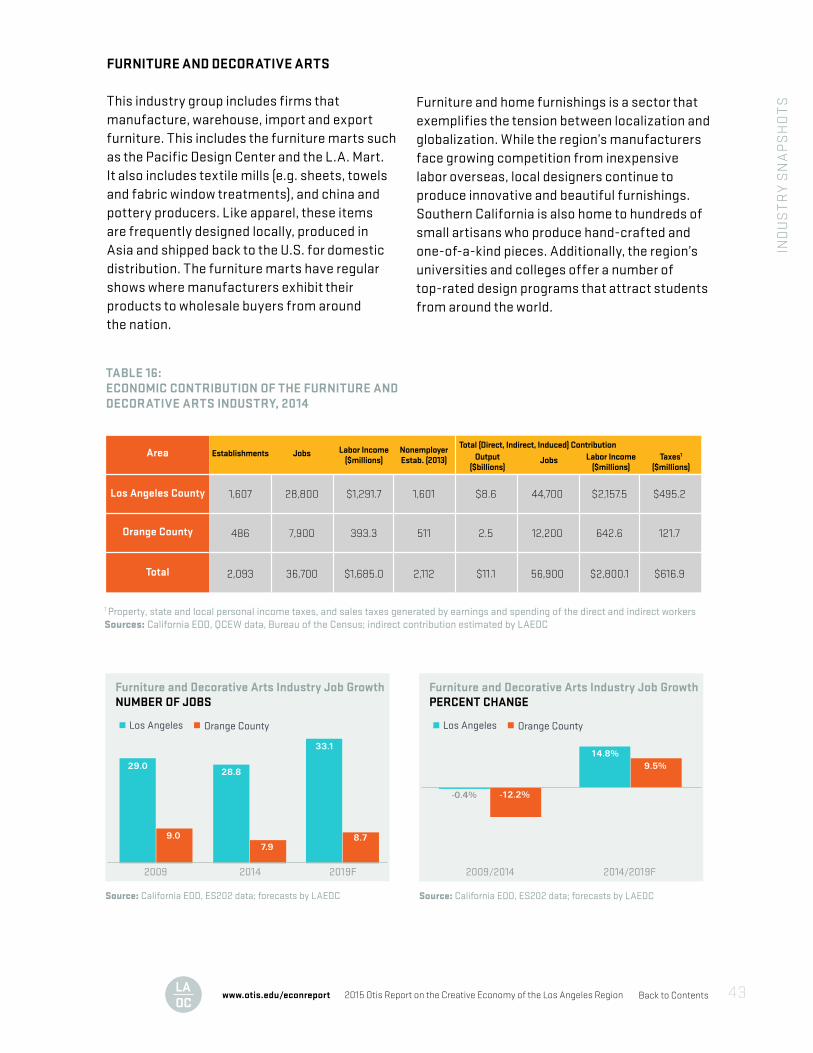
Back to Contents2015 Otis Report on the Creative Economy of the Los Angeles Regionwww.otis.edu/econreport 43
TABLE 16: ECONOMIC CONTRIBUTION OF THE FURNITURE AND DECORATIVE ARTS INDUSTRY, 2014
FURNITURE AND DECORATIVE ARTS
This industry group includes firms that manufacture, warehouse, import and export furniture. This includes the furniture marts such as the Pacific Design Center and the L.A. Mart. It also includes textile mills (e.g. sheets, towels and fabric window treatments), and china and pottery producers. Like apparel, these items are frequently designed locally, produced in Asia and shipped back to the U.S. for domestic distribution. The furniture marts have regular shows where manufacturers exhibit their products to wholesale buyers from around the nation.
Furniture and home furnishings is a sector that exemplifies the tension between localization and globalization. While the region’s manufacturers face growing competition from inexpensive labor overseas, local designers continue to produce innovative and beautiful furnishings. Southern California is also home to hundreds of small artisans who produce hand-crafted and one-of-a-kind pieces. Additionally, the region’s universities and colleges offer a number of top-rated design programs that attract students from around the world.
TABLE 14: Economic Contribution Of The Fashion Industry, 2014
Area
6,762 $26.389,100 141,900$3,648.3 $6,564.76,593 $1,788.3
Establishments Output ($billions)
Total (Direct, Indirect, Induced) ContributionJobs
JobsLabor Income
($millions) Labor Income($millions)
Nonemployer Estab. (2013) Taxes1
($millions)
697 3.711,200 18,000567.3 981.01,385 251.2
7,459 $30.0100,300 159,900$4,215.6 $7,545.77,978 $2,039.5
Los Angeles County
Orange County
Total
1 Property, state and local personal income taxes, and sales taxes generated by earnings and spending of the direct and indirect workersSources: California EDD, QCEW data, Bureau of the Census; indirect contribution estimated by LAEDC
Source: California EDD, ES202 data; forecasts by LAEDC
Los Angeles Orange County
2009 2014 2019F
86.8
10.7
89.2
93.2
11.1
11.8
Fashion Industry Job Growth NUMBER OF JOBS
Source: California EDD, ES202 data; forecasts by LAEDC
Los Angeles Orange County
2009/2014 2014/2019F
2.7%
4.6%
3.5%
6.8%
Fashion Industry Job Growth PERCENT CHANGE
TABLE 15: Economic Contribution of the Furniture and Decorative Arts Industry, 2014
Area
1,607 $8.628,800 44,700$1,291.7 $2,157.51,601 $495.2
Establishments Output ($billions)
Total (Direct, Indirect, Induced) ContributionJobs
JobsLabor Income
($millions) Labor Income($millions)
Nonemployer Estab. (2013) Taxes1
($millions)
486 2.57,900 12,200393.3 642.6511 121.7
2,093 $11.136,700 56,900$1,685.0 $2,800.12,112 $616.9
Los Angeles County
Orange County
Total
1 Property, state and local personal income taxes, and sales taxes generated by earnings and spending of the direct and indirect workersSources: California EDD, QCEW data, Bureau of the Census; indirect contribution estimated by LAEDC
Source: California EDD, ES202 data; forecasts by LAEDC
Los Angeles Orange County
2009 2014 2019F
29.0
9.0
28.8
33.1
7.9
8.7
Furniture and Decorative Arts Industry Job Growth NUMBER OF JOBS
Source: California EDD, ES202 data; forecasts by LAEDC
Los Angeles Orange County
2009/2014 2014/2019F
-0.4%
14.8%
-12.2%
9.5%
Furniture and Decorative Arts Industry Job Growth PERCENT CHANGE
IND
US
TR
Y S
NA
PS
HO
TS
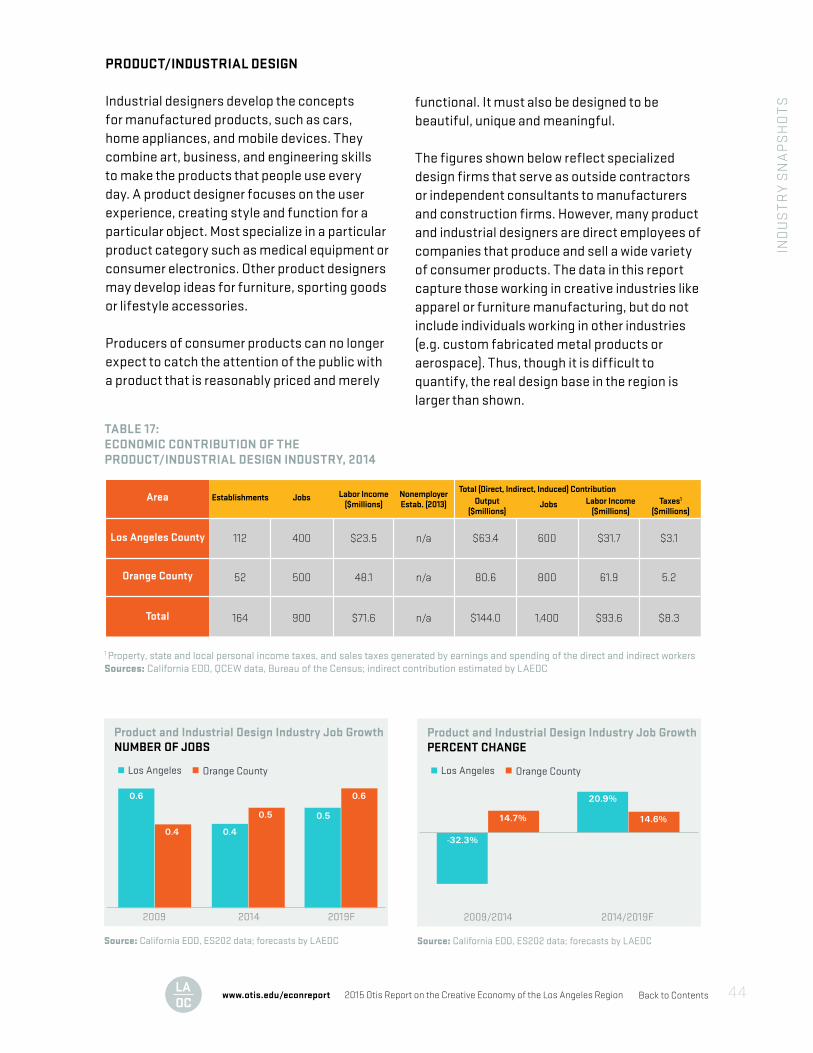
Back to Contents2015 Otis Report on the Creative Economy of the Los Angeles Regionwww.otis.edu/econreport 44
PRODUCT/INDUSTRIAL DESIGN Industrial designers develop the concepts for manufactured products, such as cars, home appliances, and mobile devices. They combine art, business, and engineering skills to make the products that people use every day. A product designer focuses on the user experience, creating style and function for a particular object. Most specialize in a particular product category such as medical equipment or consumer electronics. Other product designers may develop ideas for furniture, sporting goods or lifestyle accessories.
Producers of consumer products can no longer expect to catch the attention of the public with a product that is reasonably priced and merely
functional. It must also be designed to be beautiful, unique and meaningful.
The figures shown below reflect specialized design firms that serve as outside contractors or independent consultants to manufacturers and construction firms. However, many product and industrial designers are direct employees of companies that produce and sell a wide variety of consumer products. The data in this report capture those working in creative industries like apparel or furniture manufacturing, but do not include individuals working in other industries (e.g. custom fabricated metal products or aerospace). Thus, though it is difficult to quantify, the real design base in the region is larger than shown.
TABLE 17: ECONOMIC CONTRIBUTION OF THE PRODUCT/INDUSTRIAL DESIGN INDUSTRY, 2014
TABLE 16: Economic Contribution of the Product/Industrial Design Industry, 2014
Area
112 $63.4400 600$23.5 $31.7n/a $3.1
Establishments Output ($millions)
Total (Direct, Indirect, Induced) ContributionJobs
JobsLabor Income
($millions) Labor Income($millions)
Nonemployer Estab. (2013) Taxes1
($millions)
52 80.6500 80048.1 61.9n/a 5.2
164 $144.0900 1,400$71.6 $93.6n/a $8.3
Los Angeles County
Orange County
Total
1 Property, state and local personal income taxes, and sales taxes generated by earnings and spending of the direct and indirect workersSources: California EDD, QCEW data, Bureau of the Census; indirect contribution estimated by LAEDC
Source: California EDD, ES202 data; forecasts by LAEDC
Los Angeles Orange County
2009 2014 2019F
0.6
0.4 0.4
0.5
0.5
0.6
Product and Industrial Design Industry Job Growth NUMBER OF JOBS
Source: California EDD, ES202 data; forecasts by LAEDC
Los Angeles Orange County
2009/2014 2014/2019F
-32.3%
20.9%
14.7%
14.6%
Product and Industrial Design Industry Job Growth PERCENT CHANGE
TABLE 17: Economic Contribution of the Publishing and Printing Industry, 2014
Area
2,031 $16.632,300 78,500$2,394.7 $4,840.14,147 $519.2
Establishments Output ($billions)
Total (Direct, Indirect, Induced) ContributionJobs
JobsLabor Income
($millions) Labor Income($millions)
Nonemployer Estab. (2013) Taxes1
($millions)
778 4.712,700 24,700726.8 1,397.61,405 150.7
2,809 $21.345,000 103,200$3,121.5 $6,237.75,552 $669.9
Los Angeles County
Orange County
Total
1 Property, state and local personal income taxes, and sales taxes generated by earnings and spending of the direct and indirect workersSources: California EDD, QCEW data, Bureau of the Census; indirect contribution estimated by LAEDC
Source: California EDD, ES202 data; forecasts by LAEDC
Los Angeles Orange County
2009 2014 2019F
37.1
14.4
32.3
33.0
12.7
13.7
Publishing and Printing Industry Job Growth NUMBER OF JOBS
Source: California EDD, ES202 data; forecasts by LAEDC
Los Angeles Orange County
2009/2014 2014/2019F
-12.8%
2.2%
-11.8%
7.5%
Publishing and Printing Industry Job Growth PERCENT CHANGE
IND
US
TR
Y S
NA
PS
HO
TS
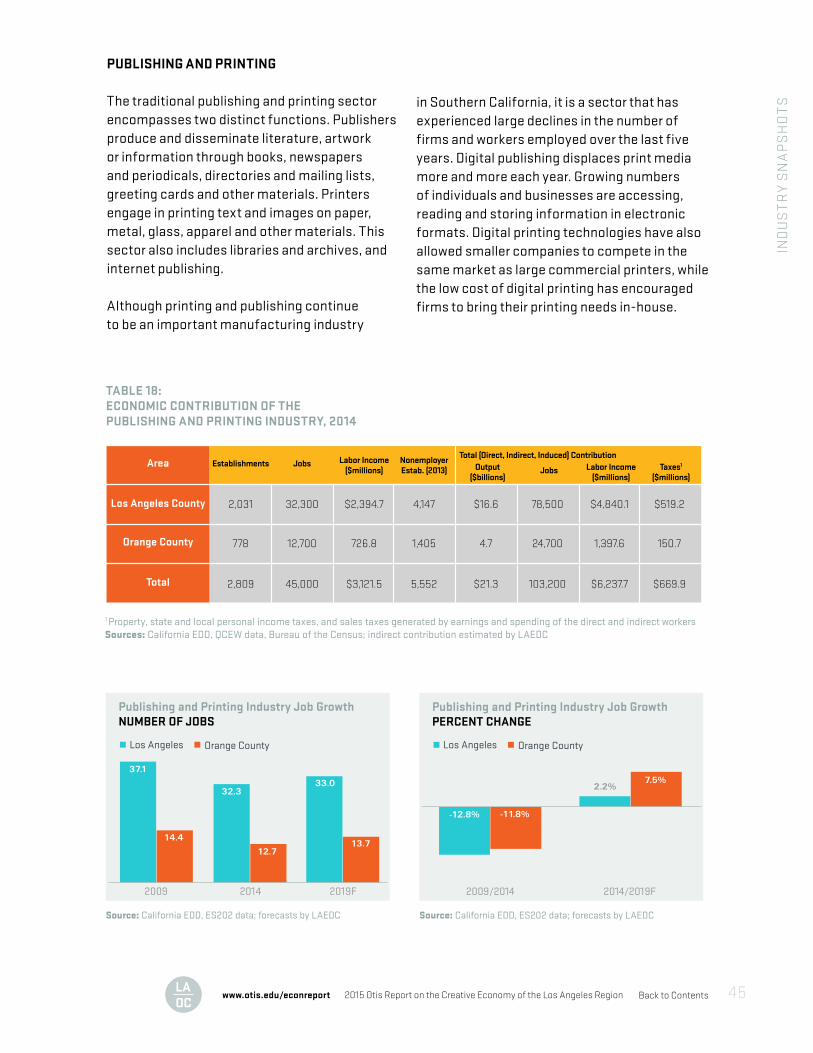
Back to Contents2015 Otis Report on the Creative Economy of the Los Angeles Regionwww.otis.edu/econreport 45
TABLE 18: ECONOMIC CONTRIBUTION OF THE PUBLISHING AND PRINTING INDUSTRY, 2014
PUBLISHING AND PRINTING
The traditional publishing and printing sector encompasses two distinct functions. Publishers produce and disseminate literature, artwork or information through books, newspapers and periodicals, directories and mailing lists, greeting cards and other materials. Printers engage in printing text and images on paper, metal, glass, apparel and other materials. This sector also includes libraries and archives, and internet publishing.
Although printing and publishing continue to be an important manufacturing industry
in Southern California, it is a sector that has experienced large declines in the number of firms and workers employed over the last five years. Digital publishing displaces print media more and more each year. Growing numbers of individuals and businesses are accessing, reading and storing information in electronic formats. Digital printing technologies have also allowed smaller companies to compete in the same market as large commercial printers, while the low cost of digital printing has encouraged firms to bring their printing needs in-house.
TABLE 16: Economic Contribution of the Product/Industrial Design Industry, 2014
Area
112 $63.4400 600$23.5 $31.7n/a $3.1
Establishments Output ($millions)
Total (Direct, Indirect, Induced) ContributionJobs
JobsLabor Income
($millions) Labor Income($millions)
Nonemployer Estab. (2013) Taxes1
($millions)
52 80.6500 80048.1 61.9n/a 5.2
164 $144.0900 1,400$71.6 $93.6n/a $8.3
Los Angeles County
Orange County
Total
1 Property, state and local personal income taxes, and sales taxes generated by earnings and spending of the direct and indirect workersSources: California EDD, QCEW data, Bureau of the Census; indirect contribution estimated by LAEDC
Source: California EDD, ES202 data; forecasts by LAEDC
Los Angeles Orange County
2009 2014 2019F
0.6
0.4 0.4
0.5
0.5
0.6
Product and Industrial Design Industry Job Growth NUMBER OF JOBS
Source: California EDD, ES202 data; forecasts by LAEDC
Los Angeles Orange County
2009/2014 2014/2019F
-32.3%
20.9%
14.7%
14.6%
Product and Industrial Design Industry Job Growth PERCENT CHANGE
TABLE 17: Economic Contribution of the Publishing and Printing Industry, 2014
Area
2,031 $16.632,300 78,500$2,394.7 $4,840.14,147 $519.2
Establishments Output ($billions)
Total (Direct, Indirect, Induced) ContributionJobs
JobsLabor Income
($millions) Labor Income($millions)
Nonemployer Estab. (2013) Taxes1
($millions)
778 4.712,700 24,700726.8 1,397.61,405 150.7
2,809 $21.345,000 103,200$3,121.5 $6,237.75,552 $669.9
Los Angeles County
Orange County
Total
1 Property, state and local personal income taxes, and sales taxes generated by earnings and spending of the direct and indirect workersSources: California EDD, QCEW data, Bureau of the Census; indirect contribution estimated by LAEDC
Source: California EDD, ES202 data; forecasts by LAEDC
Los Angeles Orange County
2009 2014 2019F
37.1
14.4
32.3
33.0
12.7
13.7
Publishing and Printing Industry Job Growth NUMBER OF JOBS
Source: California EDD, ES202 data; forecasts by LAEDC
Los Angeles Orange County
2009/2014 2014/2019F
-12.8%
2.2%
-11.8%
7.5%
Publishing and Printing Industry Job Growth PERCENT CHANGE
IND
US
TR
Y S
NA
PS
HO
TS
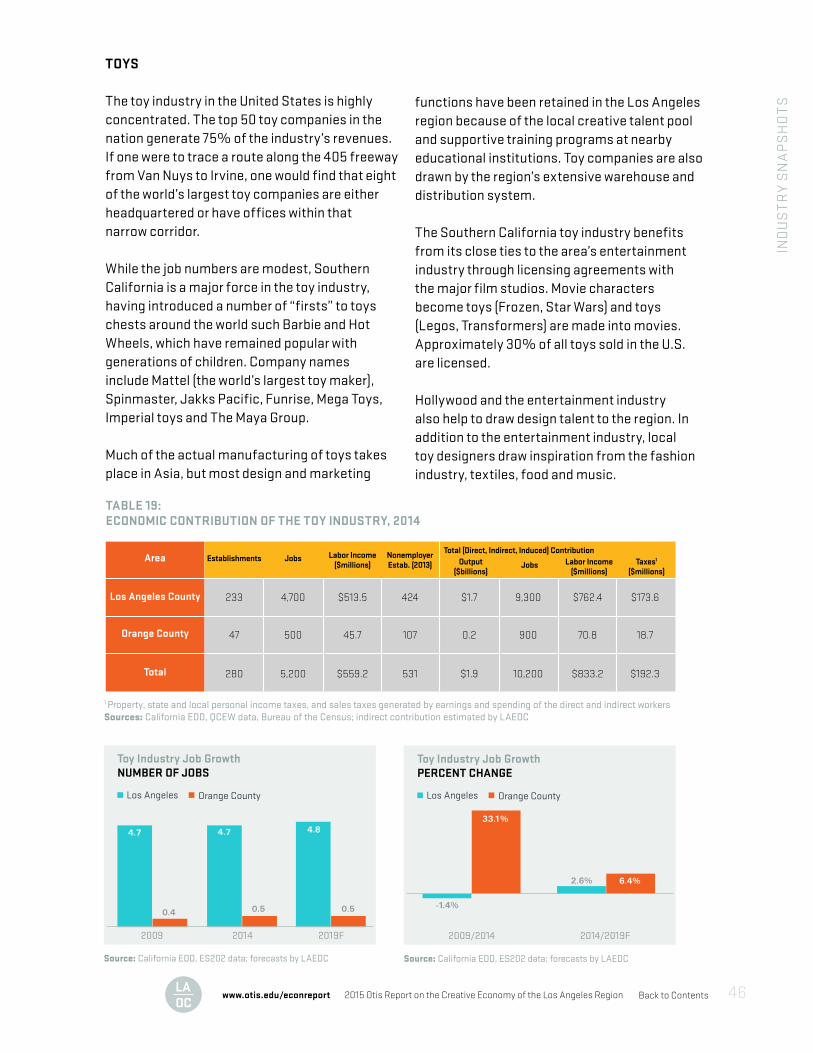
Back to Contents2015 Otis Report on the Creative Economy of the Los Angeles Regionwww.otis.edu/econreport 46
TABLE 19: ECONOMIC CONTRIBUTION OF THE TOY INDUSTRY, 2014
TOYS The toy industry in the United States is highly concentrated. The top 50 toy companies in the nation generate 75% of the industry’s revenues. If one were to trace a route along the 405 freeway from Van Nuys to Irvine, one would find that eight of the world’s largest toy companies are either headquartered or have offices within that narrow corridor.
While the job numbers are modest, Southern California is a major force in the toy industry, having introduced a number of “firsts” to toys chests around the world such Barbie and Hot Wheels, which have remained popular with generations of children. Company names include Mattel (the world’s largest toy maker), Spinmaster, Jakks Pacific, Funrise, Mega Toys, Imperial toys and The Maya Group.
Much of the actual manufacturing of toys takes place in Asia, but most design and marketing
functions have been retained in the Los Angeles region because of the local creative talent pool and supportive training programs at nearby educational institutions. Toy companies are also drawn by the region’s extensive warehouse and distribution system.
The Southern California toy industry benefits from its close ties to the area’s entertainment industry through licensing agreements with the major film studios. Movie characters become toys (Frozen, Star Wars) and toys (Legos, Transformers) are made into movies. Approximately 30% of all toys sold in the U.S. are licensed.
Hollywood and the entertainment industry also help to draw design talent to the region. In addition to the entertainment industry, local toy designers draw inspiration from the fashion industry, textiles, food and music.
TABLE 18: Economic Contribution of the Toy Industry, 2014
Area
233 $1.74,700 9,300$513.5 $762.4424 $173.6
Establishments Output ($billions)
Total (Direct, Indirect, Induced) ContributionJobs
JobsLabor Income
($millions) Labor Income($millions)
Nonemployer Estab. (2013) Taxes1
($millions)
47 0.2500 90045.7 70.8107 18.7
280 $1.95,200 10,200$559.2 $833.2531 $192.3
Los Angeles County
Orange County
Total
1 Property, state and local personal income taxes, and sales taxes generated by earnings and spending of the direct and indirect workersSources: California EDD, QCEW data, Bureau of the Census; indirect contribution estimated by LAEDC
Source: California EDD, ES202 data; forecasts by LAEDC
Los Angeles Orange County
2009 2014 2019F
4.7
0.4
4.7
4.8
0.5 0.5
Toy Industry Job Growth NUMBER OF JOBS
Source: California EDD, ES202 data; forecasts by LAEDC
Los Angeles Orange County
2009/2014 2014/2019F
-1.4%
2.6%
33.1%
6.4%
Toy Industry Job Growth PERCENT CHANGE
TABLE 19: Economic Contribution of the Visual and Performing Arts Industry, 2014
Area
9,416 $9.231,500 64,000$5,902.0 $7,503.076,567 $549.8
Establishments Output ($billions)
Total (Direct, Indirect, Induced) ContributionJobs
JobsLabor Income
($millions) Labor Income($millions)
Nonemployer Estab. (2013) Taxes1
($millions)
349 0.42,600 3,60097.1 153.09,088 17.2
9,765 $9.634,100 67,600$5,999.1 $7,656.085,655 $567.0
Los Angeles County
Orange County
Total
1 Property, state and local personal income taxes, and sales taxes generated by earnings and spending of the direct and indirect workersSources: California EDD, QCEW data, Bureau of the Census; indirect contribution estimated by LAEDC
Source: California EDD, ES202 data; forecasts by LAEDC
Los Angeles Orange County
2009 2014 2019F
25.5
2.4
31.5
35.9
2.6
3.0
Visual and Performing Arts Industry Job Growth NUMBER OF JOBS
Source: California EDD, ES202 data; forecasts by LAEDC
Los Angeles Orange County
2009/2014 2014/2019F
25.3%
13.9%
8.4%
13.8%
Visual and Performing Arts Industry Job Growth PERCENT CHANGE
IND
US
TR
Y S
NA
PS
HO
TS
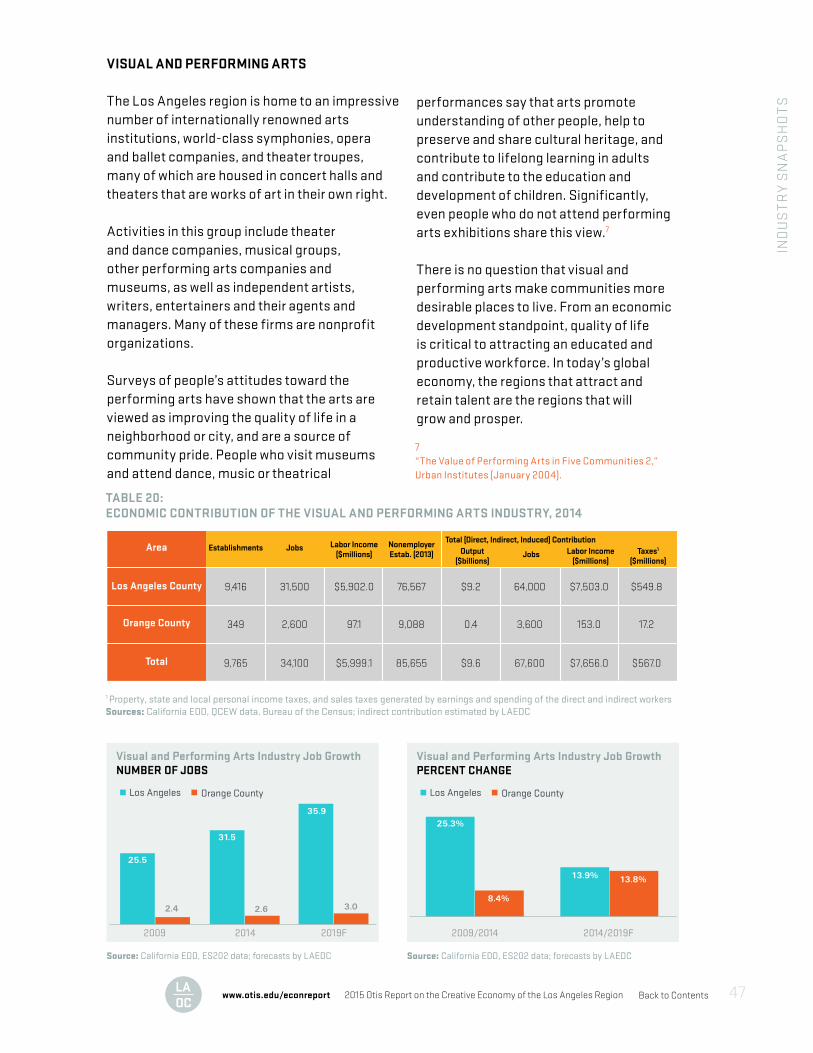
Back to Contents2015 Otis Report on the Creative Economy of the Los Angeles Regionwww.otis.edu/econreport 47
TABLE 20: ECONOMIC CONTRIBUTION OF THE VISUAL AND PERFORMING ARTS INDUSTRY, 2014
TABLE 18: Economic Contribution of the Toy Industry, 2014
Area
233 $1.74,700 9,300$513.5 $762.4424 $173.6
Establishments Output ($billions)
Total (Direct, Indirect, Induced) ContributionJobs
JobsLabor Income
($millions) Labor Income($millions)
Nonemployer Estab. (2013) Taxes1
($millions)
47 0.2500 90045.7 70.8107 18.7
280 $1.95,200 10,200$559.2 $833.2531 $192.3
Los Angeles County
Orange County
Total
1 Property, state and local personal income taxes, and sales taxes generated by earnings and spending of the direct and indirect workersSources: California EDD, QCEW data, Bureau of the Census; indirect contribution estimated by LAEDC
Source: California EDD, ES202 data; forecasts by LAEDC
Los Angeles Orange County
2009 2014 2019F
4.7
0.4
4.7
4.8
0.5 0.5
Toy Industry Job Growth NUMBER OF JOBS
Source: California EDD, ES202 data; forecasts by LAEDC
Los Angeles Orange County
2009/2014 2014/2019F
-1.4%
2.6%
33.1%
6.4%
Toy Industry Job Growth PERCENT CHANGE
TABLE 19: Economic Contribution of the Visual and Performing Arts Industry, 2014
Area
9,416 $9.231,500 64,000$5,902.0 $7,503.076,567 $549.8
Establishments Output ($billions)
Total (Direct, Indirect, Induced) ContributionJobs
JobsLabor Income
($millions) Labor Income($millions)
Nonemployer Estab. (2013) Taxes1
($millions)
349 0.42,600 3,60097.1 153.09,088 17.2
9,765 $9.634,100 67,600$5,999.1 $7,656.085,655 $567.0
Los Angeles County
Orange County
Total
1 Property, state and local personal income taxes, and sales taxes generated by earnings and spending of the direct and indirect workersSources: California EDD, QCEW data, Bureau of the Census; indirect contribution estimated by LAEDC
Source: California EDD, ES202 data; forecasts by LAEDC
Los Angeles Orange County
2009 2014 2019F
25.5
2.4
31.5
35.9
2.6
3.0
Visual and Performing Arts Industry Job Growth NUMBER OF JOBS
Source: California EDD, ES202 data; forecasts by LAEDC
Los Angeles Orange County
2009/2014 2014/2019F
25.3%
13.9%
8.4%
13.8%
Visual and Performing Arts Industry Job Growth PERCENT CHANGE
VISUAL AND PERFORMING ARTS
The Los Angeles region is home to an impressivenumber of internationally renowned artsinstitutions, world-class symphonies, operaand ballet companies, and theater troupes,many of which are housed in concert halls andtheaters that are works of art in their own right.
Activities in this group include theaterand dance companies, musical groups,other performing arts companies andmuseums, as well as independent artists,writers, entertainers and their agents andmanagers. Many of these firms are nonprofitorganizations.
Surveys of people’s attitudes toward theperforming arts have shown that the arts areviewed as improving the quality of life in aneighborhood or city, and are a source ofcommunity pride. People who visit museumsand attend dance, music or theatrical
performances say that arts promoteunderstanding of other people, help topreserve and share cultural heritage, andcontribute to lifelong learning in adultsand contribute to the education anddevelopment of children. Significantly,even people who do not attend performingarts exhibitions share this view.7
There is no question that visual andperforming arts make communities moredesirable places to live. From an economicdevelopment standpoint, quality of lifeis critical to attracting an educated andproductive workforce. In today’s globaleconomy, the regions that attract andretain talent are the regions that willgrow and prosper.
7“The Value of Performing Arts in Five Communities 2,”Urban Institutes (January 2004).
IND
US
TR
Y S
NA
PS
HO
TS
Back to Contents2015 Otis Report on the Creative Economy of the Los Angeles Regionwww.otis.edu/econreport 48
OCCUPATIONS IN THE CREATIVE ECONOMY
EMPLOYMENT There are two ways to think about creative employment: individuals who work in a creative industry and individuals working in creative occupations. Up to this point, this report has concentrated on creative industries. These are the firms that produce and distribute cultural, consumer and commercial goods and services. This section turns from industry analysis to an examination of occupations. Many of these creative occupations may be found within the set of creative industries, but they are also present in significant numbers in the broader set of industries that are outside the creative sector. Data on occupations from the U.S. Bureau of Labor Statistics makes it possible to identify and measure creative occupations within the creative industries and in the rest of the economy. It can also shed light on the extent to which creative industries employ people in functions outside of creative occupations.8
Unlike industry-based definitions of the creative economy, there is greater consensus among researchers regarding creative occupations. The occupational data used in this report are based on the Standard Occupational Classification (SOC) system. Of the 840 detailed occupational codes listed in the SOC system, 746 were included in the data set for the Greater Los Angeles Region, and of those, 80 have been identified as creative.
These 80 creative occupations can be found across a wide array of organizational functions. For example, within the management strata, creative occupations include advertising, marketing and public relations managers. In technical fields, there are software developers and architects, and in production-related occupations, there are tailors, cabinet makers and engravers. It is easy to imagine a marketing manager or graphic designer working in any number of industries, creative or otherwise. This illustrates the fact that creative occupations may often be found outside the creative sectors of the economy. In 2014, there were 200,370 workers in Los Angeles County employed in creative occupations and 50,650 in Orange County. This represents 4.9% of total private occupation-based employment in Los Angeles and 3.4% in Orange County. These numbers include software developers, for which there is no comparable data for
8BLS Occupational Employment Statistics data only include wage and salary employees and do not cover the self-employed or owners and partners in unincorporated firms.
Back to Contents2015 Otis Report on the Creative Economy of the Los Angeles Regionwww.otis.edu/econreport 49
2009 due to a change in how these occupations are coded. Because employment counts for software developers were significant in 2014, meaningful comparisons of occupational employment between 2009 and 2014 are not possible. However, if these jobs are subtracted from the 2014 total (see Table 31 and Table 32 in the appendix), job counts by occupation still increased by 12.9% (19,730 jobs) in Los Angeles County, while in Orange County, employment declined by 8.7% (3,350 jobs), an indication of the greater relative importance of technical occupations in Orange County’s creative economy. In both counties, a large number of individuals employed in creative occupations worked in art, design, entertainment or media: 58% in Los Angeles County and 34% in Orange County. Across both counties, computer and mathematical occupations (the above mentioned software developers) also employed numerous creative individuals (42,670). Many of these workers spend their days creating animated characters for film and TV, or designing video games. Given the current occupational classification system, it is still very difficult to isolate game development employment. However, there were 6,400 individuals employed as multimedia artists and animators (SOC 27-1014), which may also capture some of this activity. The next largest group of creative workers was found in education, training, and library occupations (19,330). Due to data limitations, arts, cultural and creative activity on the region’s college and university campuses is difficult to fully measure since employment data for campus museums, theater and literary publications is not disaggregated. Comparing local employment shares relative to total state employment in each of the three largest occupation groups reveals that the share of art, design, entertainment and media jobs in the Los Angeles region increased from 2013, while the share of computer and mathematical jobs declined, likely due to a higher concentration of these activities in the Bay Area.
That numerous creative occupations may be found across so many industries suggests the potential for large spillover effects from creative industries and occupations to other industries within the regional economy. It also implies that it is in the region’s economic interest to maintain, nurture and grow its deep pool of creative talent.
Individuals employed in creative occupations in California are heavily concentrated in the Los Angeles region. This chart shows Los Angeles and Orange County employment as a percentage of total California employment in the three largest creative occupational groups. In total, 33.3% of persons working in creative occupations in California are located in Los Angeles County and 8.4% are in Orange County.
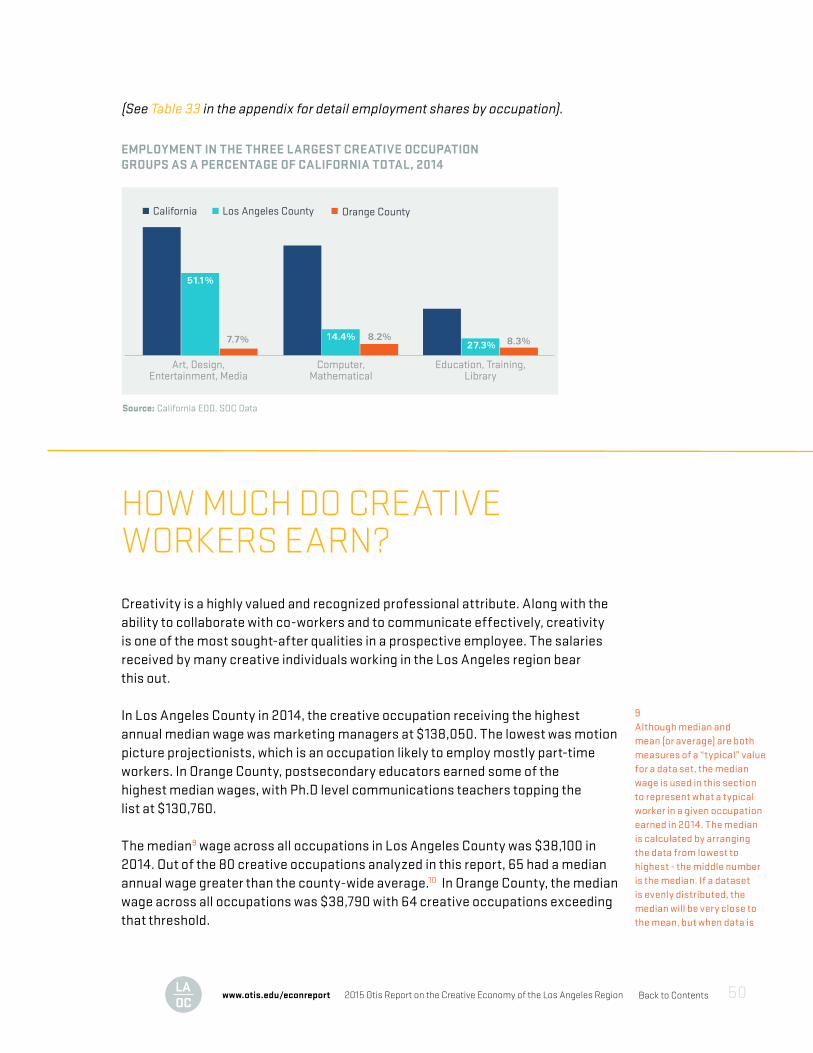
Back to Contents2015 Otis Report on the Creative Economy of the Los Angeles Regionwww.otis.edu/econreport 50
Source: California EDD, SOC Data
Los Angeles CountyCalifornia Orange County
Art, Design, Entertainment, Media
Computer, Mathematical
Education, Training, Library
51.1%
7.7%
14.4%
27.3%
8.2%
8.3%
Employment in the Three Largest Creative Occupation Groups as a Percentage of California Total, 2014EMPLOYMENT IN THE THREE LARGEST CREATIVE OCCUPATIONGROUPS AS A PERCENTAGE OF CALIFORNIA TOTAL, 2014
(See Table 33 in the appendix for detail employment shares by occupation).
HOW MUCH DO CREATIVE WORKERS EARN?
Creativity is a highly valued and recognized professional attribute. Along with the ability to collaborate with co-workers and to communicate effectively, creativity is one of the most sought-after qualities in a prospective employee. The salaries received by many creative individuals working in the Los Angeles region bear this out.
In Los Angeles County in 2014, the creative occupation receiving the highest annual median wage was marketing managers at $138,050. The lowest was motion picture projectionists, which is an occupation likely to employ mostly part-time workers. In Orange County, postsecondary educators earned some of the highest median wages, with Ph.D level communications teachers topping the list at $130,760.
The median9 wage across all occupations in Los Angeles County was $38,100 in 2014. Out of the 80 creative occupations analyzed in this report, 65 had a median annual wage greater than the county-wide average.10 In Orange County, the median wage across all occupations was $38,790 with 64 creative occupations exceeding that threshold.
9Although median and mean (or average) are both measures of a “typical” value for a data set, the median wage is used in this section to represent what a typical worker in a given occupation earned in 2014. The median is calculated by arranging the data from lowest to highest - the middle number is the median. If a dataset is evenly distributed, the median will be very close to the mean, but when data is
Back to Contents2015 Otis Report on the Creative Economy of the Los Angeles Regionwww.otis.edu/econreport 51
The occupations in the following charts and tables were selected because they align closely with the creative industries defined in this report. Between 2013 and 2014, there was a great deal of variation in median annual wage growth, with just over half of the selected occupations posting an increase in annual wage versus a decline. Overall, the median annual wage across all occupations barely moved in 2014 compared with the previous year: up by 0.8% in Los Angeles County and down by 0.2% in Orange County.
While the lack of wage growth throughout the economy has been a concern, there are several reasons why many of the creative occupations listed below in particular might have suffered a decline in wages. The first is a shift from wage and salary employment to independent contractors (nonemployers). Some of these occupations may also be concentrated in industries that are declining or are in the process of transforming through technological change. Another possibility that reflects trends in the labor markets at large, is that more people in creative occupations are working part time, which would cause a decline in the annual wage.
skewed, meaning there are exceptionally high or low values, the mean can differ from the median by a wide margin. For example, agents and business managers of artists and performers in Los Angeles County have a mean annual wage of $130,050, but a median annual wage of $88,620 – a difference of $41,430. This implies there are individuals employed in this occupation earning an exceptionally high annual wage. These individuals skew the mean wage significantly higher than the median, giving an inaccurate impression of what most people can expect to earn in this occupation.
10There were 10 creative occupations for which median annual wage was not reported in Los Angeles County and 15 in Orange County.
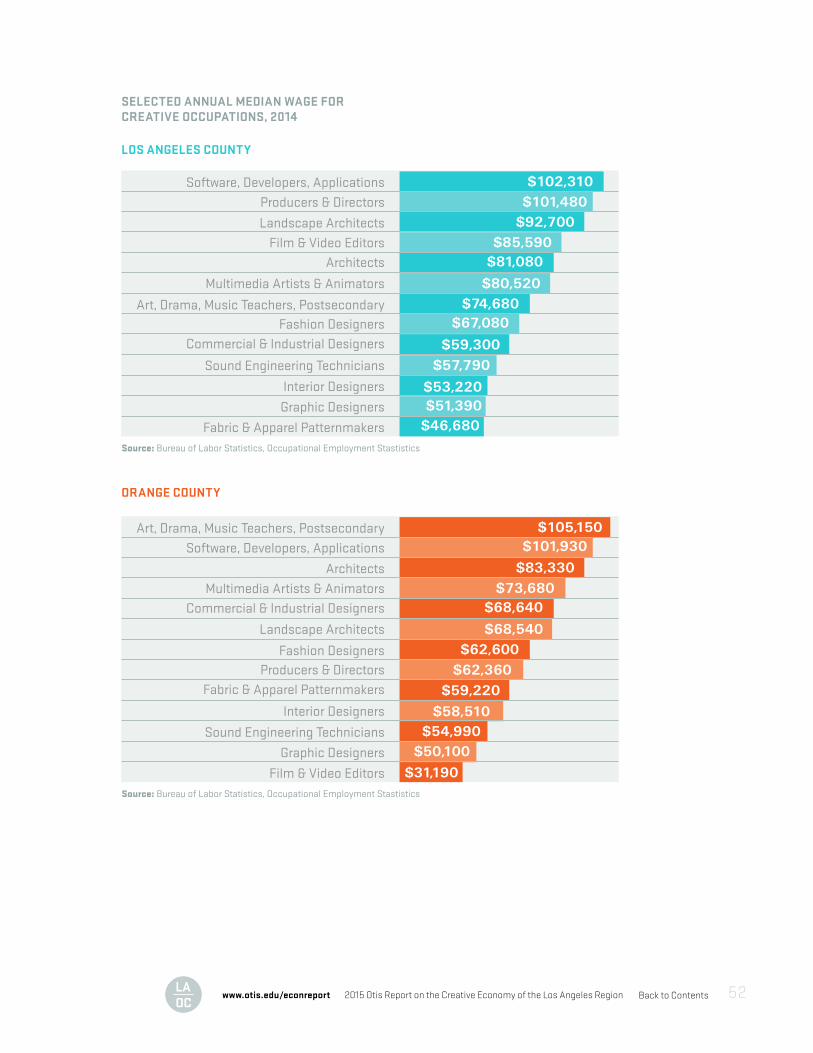
Back to Contents2015 Otis Report on the Creative Economy of the Los Angeles Regionwww.otis.edu/econreport 52
Orange County
$83,330
$101,930
$105,150
$68,640
$62,600
$59,220
$54,990
$50,100
$31,190
$73,680
$68,540
$62,360
$58,510
Sound Engineering Technicians
Film & Video Editors
Graphic Designers
Fabric & Apparel Patternmakers
Fashion Designers
Commercial & Industrial Designers
Architects
Art, Drama, Music Teachers, Postsecondary
Interior Designers
Producers & Directors
Landscape Architects
Multimedia Artists & Animators
Software, Developers, Applications
Source: Bureau of Labor Statistics, Occupational Employment Stastistics
Selected Annual Median Wage for Creative Occupations, 2014Los Angeles County
$92,700
$101,480
$102,310
$81,080
$74,680
$59,300
$53,220
$51,390
$46,680
$85,590
$80,520
$67,080
$57,790
Interior Designers
Fabric & Apparel Patternmakers
Graphic Designers
Commercial & Industrial Designers
Art, Drama, Music Teachers, Postsecondary
Architects
Landscape Architects
Software, Developers, Applications
Sound Engineering Technicians
Fashion Designers
Multimedia Artists & Animators
Film & Video Editors
Producers & Directors
Source: Bureau of Labor Statistics, Occupational Employment Stastistics
SELECTED ANNUAL MEDIAN WAGE FORCREATIVE OCCUPATIONS, 2014
LOS ANGELES COUNTY
ORANGE COUNTY
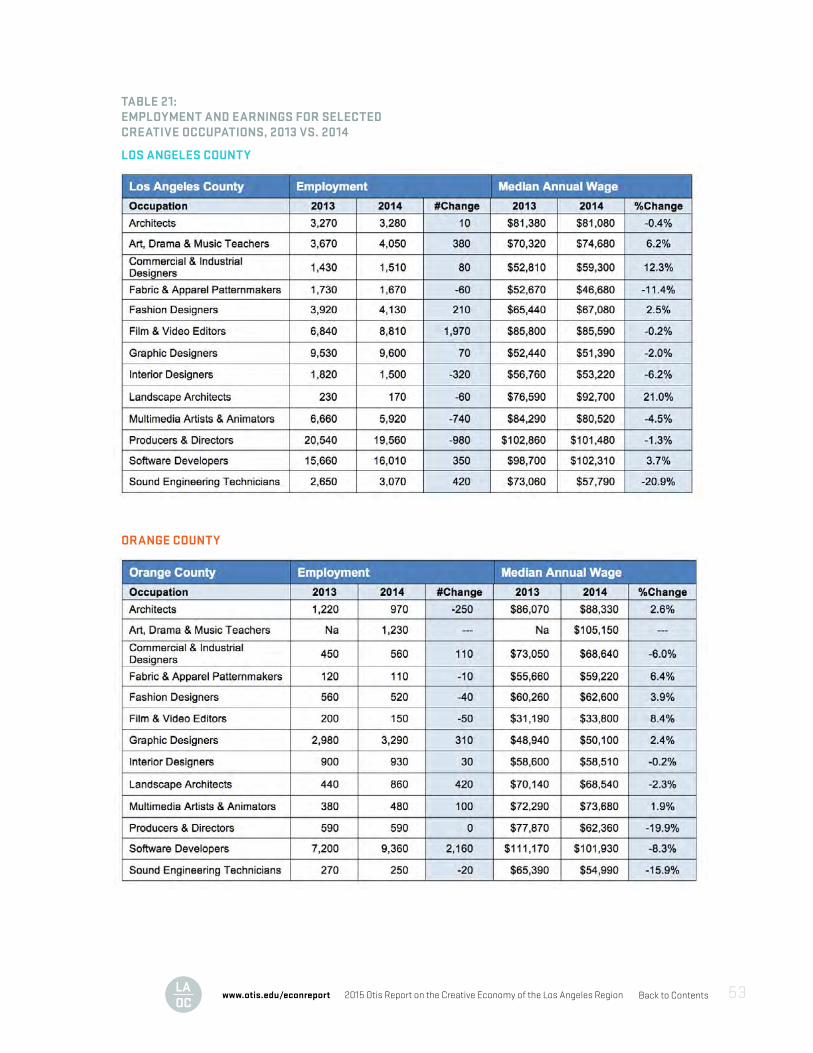
Back to Contents2015 Otis Report on the Creative Economy of the Los Angeles Regionwww.otis.edu/econreport 53
TABLE 21:EMPLOYMENT AND EARNINGS FOR SELECTED CREATIVE OCCUPATIONS, 2013 VS. 2014
LOS ANGELES COUNTY
ORANGE COUNTY
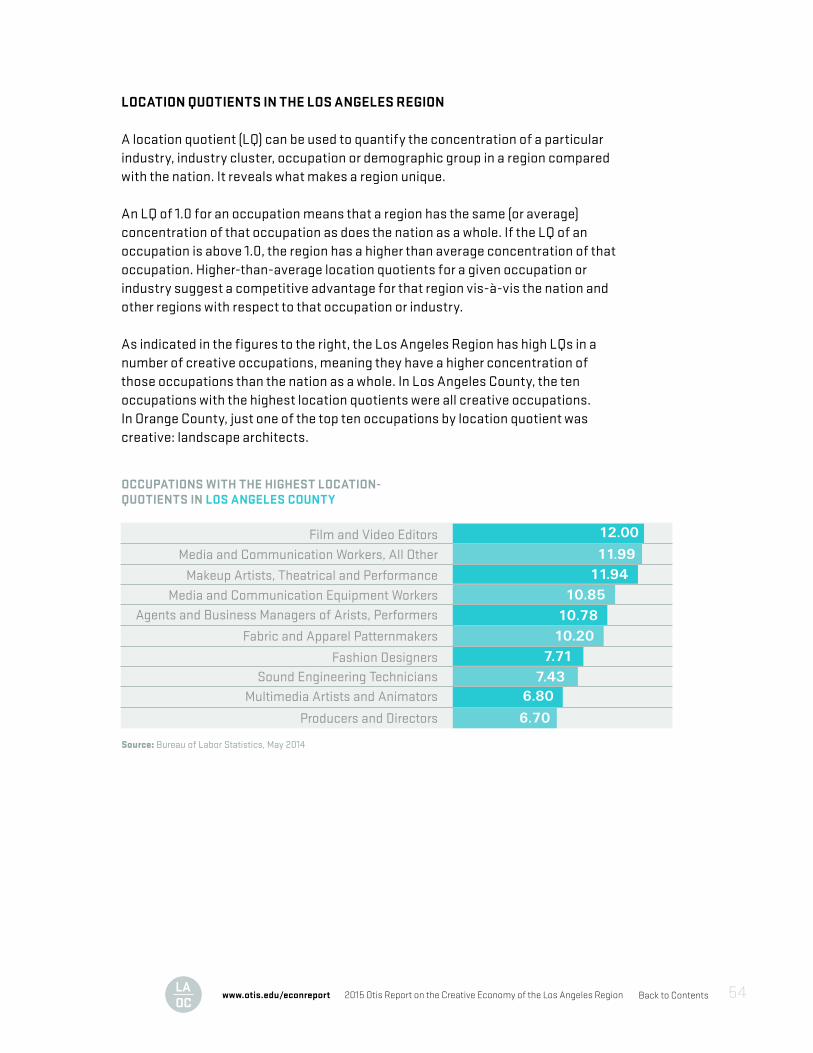
Back to Contents2015 Otis Report on the Creative Economy of the Los Angeles Regionwww.otis.edu/econreport 54
LOCATION QUOTIENTS IN THE LOS ANGELES REGION
A location quotient (LQ) can be used to quantify the concentration of a particularindustry, industry cluster, occupation or demographic group in a region comparedwith the nation. It reveals what makes a region unique.
An LQ of 1.0 for an occupation means that a region has the same (or average)concentration of that occupation as does the nation as a whole. If the LQ of anoccupation is above 1.0, the region has a higher than average concentration of thatoccupation. Higher-than-average location quotients for a given occupation or industry suggest a competitive advantage for that region vis-à-vis the nation and other regions with respect to that occupation or industry.
As indicated in the figures to the right, the Los Angeles Region has high LQs in anumber of creative occupations, meaning they have a higher concentration ofthose occupations than the nation as a whole. In Los Angeles County, the tenoccupations with the highest location quotients were all creative occupations.In Orange County, just one of the top ten occupations by location quotient wascreative: landscape architects.
OCCUPATIONS WITH THE HIGHEST LOCATION-QUOTIENTS IN LOS ANGELES COUNTYOccupations with the Highest Location-Quotients in Los Angeles County
11.94
11.99
12.00
10.78
7.71
6.80
10.85
10.20
7.43
6.70
Multimedia Artists and Animators
Fashion Designers
Agents and Business Managers of Arists, Performers
Makeup Artists, Theatrical and Performance
Film and Video Editors
Producers and Directors
Sound Engineering Technicians
Fabric and Apparel Patternmakers
Media and Communication Equipment Workers
Media and Communication Workers, All Other
Source: Bureau of Labor Statistics, May 2014
5.23
5.89
6.66
4.22
3.97
3.22
4.31
4.00
3.63
3.00
Grinding and Polishing Workers, Hand
Drywall and Ceiling Tile Installers
Carpet Installers
Biomedical Engineers
Painters, Paperhangers, Plasterers, Stucco Masons
Computer Hardware Engineers
Pediatricians, General
Anthropologists and Archeologists
Landscape Architects
Fabric Menders, Except Garment
Source: Bureau of Labor Statistics, May 2014
Orange County
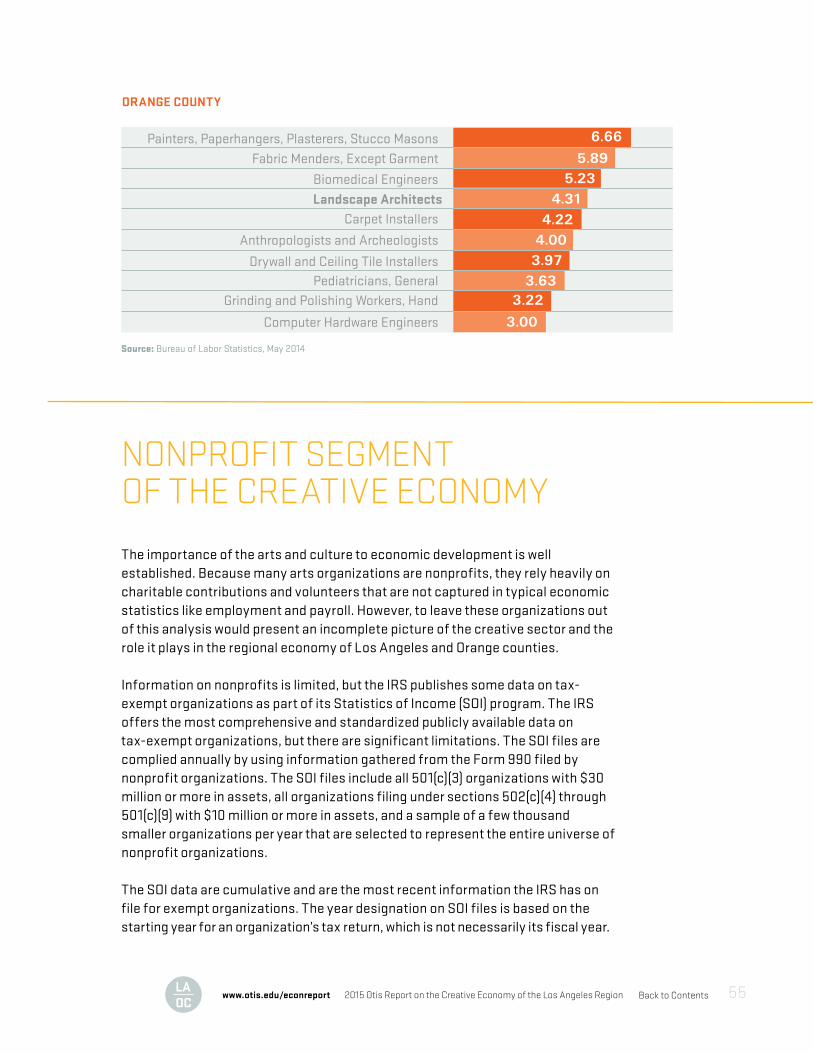
Back to Contents2015 Otis Report on the Creative Economy of the Los Angeles Regionwww.otis.edu/econreport 55
ORANGE COUNTY
Occupations with the Highest Location-Quotients in Los Angeles County
11.94
11.99
12.00
10.78
7.71
6.80
10.85
10.20
7.43
6.70
Multimedia Artists and Animators
Fashion Designers
Agents and Business Managers of Arists, Performers
Makeup Artists, Theatrical and Performance
Film and Video Editors
Producers and Directors
Sound Engineering Technicians
Fabric and Apparel Patternmakers
Media and Communication Equipment Workers
Media and Communication Workers, All Other
Source: Bureau of Labor Statistics, May 2014
5.23
5.89
6.66
4.22
3.97
3.22
4.31
4.00
3.63
3.00
Grinding and Polishing Workers, Hand
Drywall and Ceiling Tile Installers
Carpet Installers
Biomedical Engineers
Painters, Paperhangers, Plasterers, Stucco Masons
Computer Hardware Engineers
Pediatricians, General
Anthropologists and Archeologists
Landscape Architects
Fabric Menders, Except Garment
Source: Bureau of Labor Statistics, May 2014
Orange County
NONPROFIT SEGMENT OF THE CREATIVE ECONOMY
The importance of the arts and culture to economic development is well established. Because many arts organizations are nonprofits, they rely heavily on charitable contributions and volunteers that are not captured in typical economic statistics like employment and payroll. However, to leave these organizations out of this analysis would present an incomplete picture of the creative sector and the role it plays in the regional economy of Los Angeles and Orange counties. Information on nonprofits is limited, but the IRS publishes some data on tax-exempt organizations as part of its Statistics of Income (SOI) program. The IRS offers the most comprehensive and standardized publicly available data on tax-exempt organizations, but there are significant limitations. The SOI files are complied annually by using information gathered from the Form 990 filed by nonprofit organizations. The SOI files include all 501(c)(3) organizations with $30 million or more in assets, all organizations filing under sections 502(c)(4) through 501(c)(9) with $10 million or more in assets, and a sample of a few thousand smaller organizations per year that are selected to represent the entire universe of nonprofit organizations.
The SOI data are cumulative and are the most recent information the IRS has on file for exempt organizations. The year designation on SOI files is based on the starting year for an organization’s tax return, which is not necessarily its fiscal year.
Back to Contents2015 Otis Report on the Creative Economy of the Los Angeles Regionwww.otis.edu/econreport 56
Therefore, this data does not cover a specific calendar year but instead, provides a snapshot at the time it was accessed of the state’s nonprofit arts sector (September 2015). Additionally, the SOI data do not include information pertaining to employment.
The SOI sample contained a total 2,157 nonprofit organizations in Los Angeles County classified as arts, culture and humanities organizations. In Los Angeles County, the nonprofit segment of the creative economy is spread across many types of organizations, but was most highly concentrated in organizations that promote culture and ethnic awareness (13.9% of the total); arts and cultural organizations (10.3%); theater (9.3%); music (6.4%); and film/video-related organizations (5.2%). Nonprofit arts education also has a significant presence in the region. Based on the SOI sample, there were 15 performing arts schools in Los Angeles County and 102 nonprofit organizations dedicated to arts education.
The total income reported by nonprofits in Los Angeles County amounted to $2.2 billion. Art museums earned 21.2% of nonprofit income in the county. History museums earned 12.4% of the total, followed by cultural and ethnic awareness organizations (9.2%), symphony orchestras (7.5%), support organizations (6.7%), and arts education (6.0%).
In Orange County, there were 609 organizations listed in the SOI sample. The largest sector was cultural and ethnic awareness organizations (15.9%), arts and cultural groups (9.5%), and historical societies (8.0%). Arts education also has a visible presence in Orange County with four nonprofit performing arts schools and 25 arts education organizations. In terms of income, Orange County’s performing arts centers earned the largest share (29.3%), followed by arts and cultural organizations (12.9%); symphony orchestras (10.7%) and museums (8.7%). Another way to measure the importance of the nonprofit sector is to look at the collective value of assets owned by nonprofit organizations in the region. Based on the sample data, nonprofits in Los Angeles County reported assets valued at $6.5 billion to the IRS. The largest share of assets was concentrated in art museums and history museums, 33.2% and 16.2% respectively. This is not surprising considering the worth of the region’s collections and the rising value of the real estate on which they are housed. In Orange County, nonprofits reported a total of $939 million in assets, with by far the largest share held by performing arts centers (48.9%).
Creative people, as well as many others, want diverse cultural amenities. High concentrations of cultural workers and attractions make an area more appealing by improving quality of life and by drawing visitors to the area. Additionally, the educational and outreach services provided by nonprofit arts organizations play an important role in training the next generation of creative individuals.
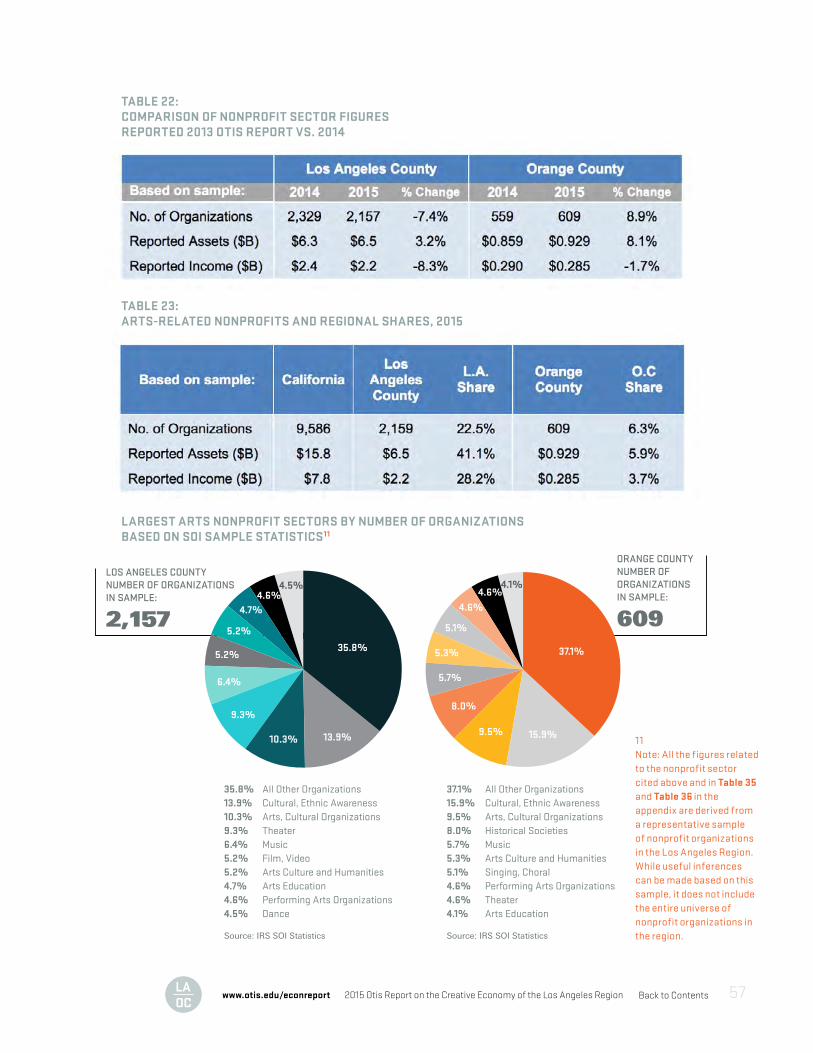
Back to Contents2015 Otis Report on the Creative Economy of the Los Angeles Regionwww.otis.edu/econreport 57
TABLE 22: COMPARISON OF NONPROFIT SECTOR FIGURES REPORTED 2013 OTIS REPORT VS. 2014
TABLE 23: ARTS-RELATED NONPROFITS AND REGIONAL SHARES, 2015
LARGEST ARTS NONPROFIT SECTORS BY NUMBER OF ORGANIZATIONS BASED ON SOI SAMPLE STATISTICS11
LOS ANGELES COUNTY NUMBER OF ORGANIZATIONS IN SAMPLE:
2,157
ORANGE COUNTY NUMBER OF ORGANIZATIONS IN SAMPLE:
60920.7%
19.7%
35.8%
13.9%10.3%
9.3%
6.4%
5.2%
5.2%
4.7%4.6%
4.5%
37.1%
15.9%9.5%
8.0%
5.7%
5.3%
5.1%
4.6%
4.6%4.1%
Based on SOI Sample Statistics
35.8% All Other Organizations13.9% Cultural, Ethnic Awareness10.3% Arts, Cultural Organizations9.3% Theater6.4% Music5.2% Film, Video5.2% Arts Culture and Humanities4.7% Arts Education4.6% Performing Arts Organizations4.5% Dance
37.1% All Other Organizations15.9% Cultural, Ethnic Awareness9.5% Arts, Cultural Organizations8.0% Historical Societies5.7% Music5.3% Arts Culture and Humanities5.1% Singing, Choral4.6% Performing Arts Organizations4.6% Theater4.1% Arts Education
Source: IRS SOI Statistics Source: IRS SOI Statistics
Largest Arts Nonprofit Sectors by Number of Organizations Based on SOI Sample Statistics11
11Note: All the figures relatedto the nonprofit sector cited above and in Table 35 and Table 36 in the appendix are derived from a representative sample of nonprofit organizations in the Los Angeles Region. While useful inferences can be made based on this sample, it does not include the entire universe of nonprofit organizations inthe region.
Back to Contents2015 Otis Report on the Creative Economy of the Los Angeles Regionwww.otis.edu/econreport 58
ARTS EDUCATION: K-12 AND POST SECONDARY
Education in the arts is a necessary part of preparing students to meet the demands of the twenty-first century workforce where workers now have to compete in a global labor market. Much attention is paid to STEM (science, technology, engineering and mathematics) courses as a vehicle for preparing students to meet the challenges of an increasingly interconnected world. There is concern that too few STEM-educated students (especially young women) are entering the workforce at sufficient performance levels to meet labor-market demand. The arts and sciences are still seen as separate educational tracks with students encouraged to specialize in one or the other, but if nurturing creative students is desirable, then this kind of thinking can be limiting. One way to persuade more young people to pursue STEM-related subjects is to incorporate the arts into a STEM course of study, thus moving from STEM to STEAM.
Arts education fosters creative, critical thinking, problem solving and collaboration. In some ways, creativity has become as important in modern education as mastering specific language and computational skills. Technological innovation is moving ahead so rapidly that functional capabilities have become less important to employers than the ability of employees to reinvent and adapt themselves to a dynamic industry and economic environment. In other words, workers of all stripes need to be creative. They also need to be skilled at communicating their ideas to co-workers in a collaborative environment. It then follows that creativity training via arts education may be a component of a successful workforce development strategy.
Additionally, while no one questions the necessity of mastering language, math and science skills, a singular focus on these subjects ignores the needs of students whose talents run in a different direction. Marginalizing the arts risks marginalizing these students. When this happens, they may never develop their unique talents or realize their full potential. In addition to the individual loss, society as a whole is diminished.
There is a body of research that has shown arts education engages students in learning. When students are engaged, truancy and dropout rates decline. Student involvement in the arts is linked to higher academic performance, increased standardized test scores, and greater involvement in community service. Studies have demonstrated that students who attend schools where the arts are integrated into the classroom curriculum outperform their peers in math and
Back to Contents2015 Otis Report on the Creative Economy of the Los Angeles Regionwww.otis.edu/econreport 59
reading who did not have an arts integrated curriculum. Thus, while arts education at the K-12 level may lead to cultural enrichment, it is also very important for both social and economic reasons. California has one of the strongest policies on arts education in the nation, but uneven implementation and funding issues have resulted in huge disparities between schools in affluent areas compared with those in low-income areas. This situation creates opportunity gaps that, down the road, contribute to income and wealth inequality. In an era of tight budgets and a single-minded focus on standardized testing, arts education came to be viewed as a luxury. That mind set is changing, but change has been slow in coming.
The California Department of Education tracks student enrollment in course subject areas. This allows for the analysis of student participation in creative courses at the K-12 level. Beginning with the 2014 Otis Report on the Creative Economy of the Los Angeles Region, this section was expanded from a discussion limited to art, dance, music and theater classes to include media, entertainment, design and information technology. This more inclusive set of creative subject areas aligns closely with the industries and occupations that define the creative economy. What follows below, and in more detail in the appendix tables, is a description of the region’s K-12 creative talent pipeline.12
According to the California Department of Finance, birth projections indicate a decline contributing to lower K-12 enrollment and reduced growth for future total enrollment. Over the next 10 years, K-12 enrollment in California is projected to decline by 0.4% (23,600 students). In Los Angeles County, K-12 enrollment is expected to fall by 100,400 students (-6.5%), while in Orange County, enrollment is forecast to contract by 45,700 students (-9.1%). Los Angeles County: K-12 student enrollment in Los Angeles was down by 0.5% in the 2014-15 academic year (AY) compared with the previous year. Enrollment in creative subject areas was also lower (down by 0.8%) even though the number of creative classes offered was up by 2.2%. The number of creative classes that met UC/CSU entrance requirements also increased, rising by 5.0%. Accounting for the decline in creative class enrollment was a drop in the number of students taking art, drama/theater, English language arts (creative writing, journalism), music, information technology (media design, game development, etc.), and fashion and interior design. Enrollment increases occurred in arts, media and entertainment, dance, engineering and architecture, and product design (graphic production, jewelry design, product design, etc.).
Looking at enrollment in creative subject areas by sex, the distribution between male and female students has been consistent over the last five years with females comprising about 51% of creative course enrollment and males 49%. There is considerable variation by subject area with girls outnumbering boys in
12 The California Department of Education course subject area data changed following the 2012-13 academic year. The data for the years 2013-14 and 2014-15 AY included new subject areas while others were deleted. For list of subject areas and courses see Table 41 in the appendix.
Back to Contents2015 Otis Report on the Creative Economy of the Los Angeles Regionwww.otis.edu/econreport 60
dance, English language arts, drama and fashion. Conversely, there continues to be a wide gap between male and female enrollment in engineering and design, and computer courses although it is starting to narrow. For example, five years ago 31% of students enrolled in computer education courses were female. In the 2014-15 AY, the share of female students had increased to 37%. Similar trends are occurring in engineering and architecture, information and communication technology and manufacturing and product development as more girls take an interest in these subject areas.
Orange County: Total K-12 student enrollment fell by 0.4% in 2014-15 AY compared with the previous year, but creative course enrollment increased by 5.9%. The number of creative classes offered rose by 0.9% while the number of US/CSU eligible classes was unchanged. Of the 13 creative subject areas analyzed, enrollment declined in four: dance, drama, English language arts, and fashion and interior design. There were large increases in art; arts, media and entertainment; computer education; engineering and architecture; and product development.
Looking at Orange County enrollment in creative subject areas by sex, the distribution is similar to Los Angeles County with females comprising 52% of creative course enrollment and males 48%. Again, male-female ratios vary by subject area, but enrollment in engineering and information technology classes in Orange County was even more heavily weighted toward males: 78% versus 22% for females during the 2014-15 AY.
POST-SECONDARY ARTS EDUCATION
Southern California is fortunate to enjoy both the richness and caliber of highereducation programs available in the arts. The number of persons employed in postsecondary arts education is difficult to pin down. Individuals who work at fine and performing arts schools are reported in the EDD employment data (NAICS 61151). However, arts educators at colleges and universities and technical schools that offer degree programs in the visual and performing arts are not separated in the employment data.
Below is a list of universities, colleges, trade and technical schools in Los Angelesand Orange counties offering degree programs in the creative industries:
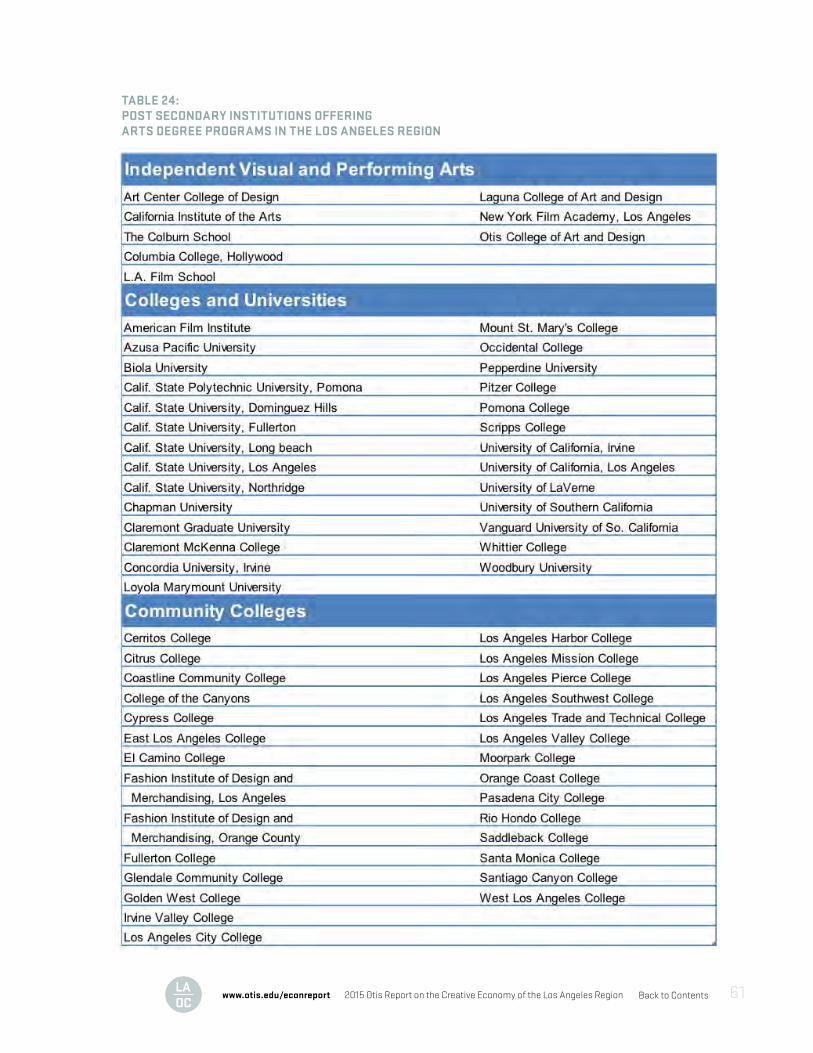
Back to Contents2015 Otis Report on the Creative Economy of the Los Angeles Regionwww.otis.edu/econreport 61
TABLE 24:POST SECONDARY INSTITUTIONS OFFERINGARTS DEGREE PROGRAMS IN THE LOS ANGELES REGION

Back to Contents2015 Otis Report on the Creative Economy of the Los Angeles Regionwww.otis.edu/econreport 62
HOW TO USE THIS REPORT
Why did we write this report? First, understanding the size and contribution of the creative industries to the state economy is a critical first step toward enabling greater statewide coordination of resources and services to support those industries. This could include statewide policies that support the creative industries infrastructure, improve access to financial investment and business support programs and in turn, ensure the sustainability of the arts and cultural assets. It may also be used for other purposes, among them:
• To justify increased emphasis on creative economy career paths through technical and university institution.
• To leverage the creative industries to increase the competitiveness of other businesses where innovation in design and aesthetic content are critical to market share.
• To develop strategies for attracting and retaining creative talent.• To develop marketing and branding to promote creative assets both to
businesses and as cultural tourism.• To develop a support and networking structure that includes convening
leadership and building collaborative connections across industries.
Otis College of Art and Design, a critical component of the creative economy, commissioned the analysis in this report to put real numbers to the business of creativity. Otis and the LAEDC carried out this research because in the state of California, creativity is fundamental to economic growth and prosperity.

Back to Contents
STATISTICAL APPENDIX
Back to Contents2015 Otis Report on the Creative Economy of the Los Angeles Regionwww.otis.edu/econreport 64
NOTES ON METHODOLOGY & DATA
In 2007, Otis College of Art and Design commissioned the LAEDC to undertake the first comprehensive analysis of the creative economy in the Los Angeles region and evaluate its contribution to the overall regional economy. The Otis Report on the Creative Economy of the Los Angeles Region has been produced every year since then.
In 2013, however, the research methodology was changed in three ways. The first two changes involve changes in the definition of the creative economy. First, additional sub-sectors within the creative industries were added to the existing creative industries. Second, a new sector was added: publishing and printing. Both of these changes better align the creative industry definitions used in this research with the definitions that are increasingly being adopted elsewhere in the literature. The creative sectors or industries in this report encompass the following eleven areas: • Architecture and interior design• Art galleries• Arts education• Communications arts• Digital media• Entertainment• Fashion• Furniture and home furnishings• Product and industrial design• Publishing and printing• Toys • Visual and performing arts
The data collected for this report includes employment, the number of establishments, payroll activity, and other measures for all the creative economy’s component sectors in California, which come from the following sources:
• U.S. Bureau of the Census • U.S. Bureau of Labor Statistics• California Employment Development Department• California Department of Education• Internal Revenue Service
Much of the industry-level information in this report comes directly from the California Employment Development Department’s Quarterly Census of Employment and Wages (QCEW) series. These data are based on unemployment tax payments that all firms with employees are required to make into the state unemployment insurance fund. Because the coverage is so comprehensive, this source is the best available for employment and wage information.
Back to Contents2015 Otis Report on the Creative Economy of the Los Angeles Regionwww.otis.edu/econreport 65
The third change relates to data used in the contribution analysis component of this study. As in recent years, the IMPLAN model was used to assess the economic contribution of the creative industries to the overall economy. In conceptual terms, economic contribution analysis evaluates the ripple effect of a specific economic activity throughout the rest of the economy. Contribution analysis captures the direct impact as well as the indirect and induced impacts of that activity on employment, output, and taxes.13
However, in a departure from past years, beginning in 2013, the contribution analysis began using employment and payroll data from the QCEW, rather than estimated sales, shipments, and revenues that were based on data from the Economic Census.
Because the definitions used in this study were expanded and because the methodology has been altered from previous years, the figures contained in this report are not directly comparable to studies conducted by OTIS and the LAEDC prior to 2013.
Note: Statistical information contained herein has been obtained from sources believed to be reliable but such accuracy cannot be guaranteed. The opinions expressed herein are subject to change without notice.
13 Direct employees are the people working in the industry. Indirect employees work for firms in the supplier industries. Induced employment results from household spending that stems from increases in direct and indirect employment.
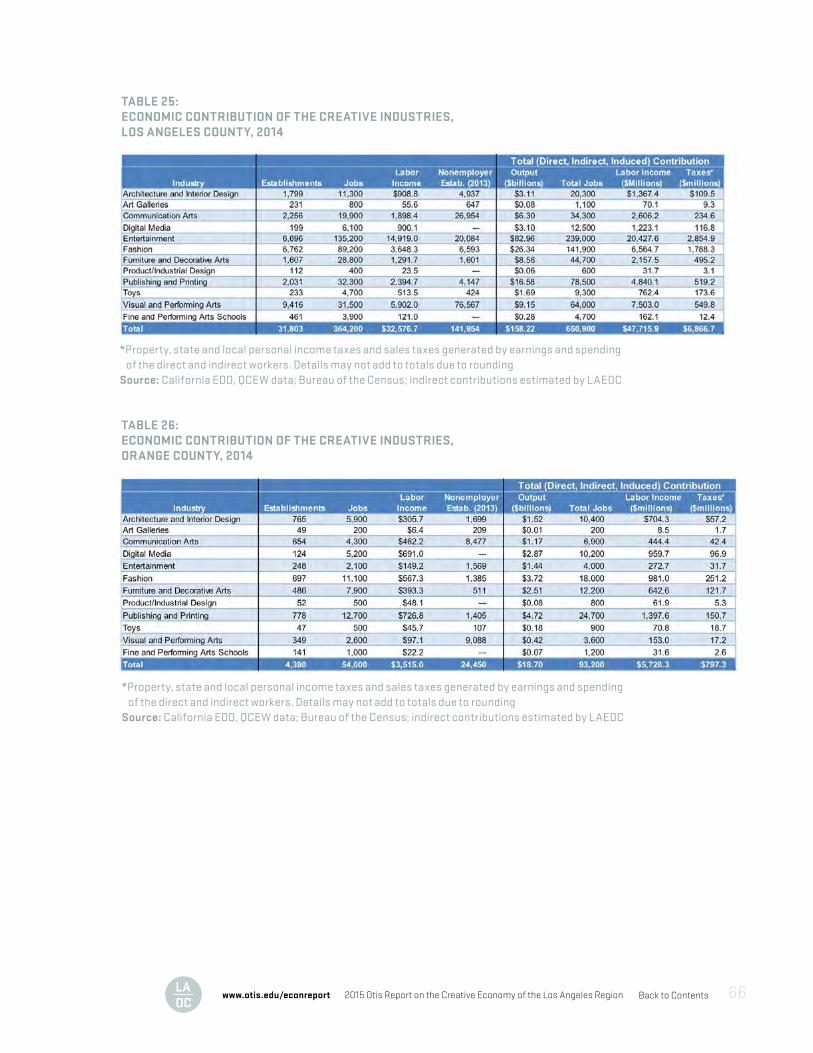
Back to Contents2015 Otis Report on the Creative Economy of the Los Angeles Regionwww.otis.edu/econreport 66
TABLE 25:ECONOMIC CONTRIBUTION OF THE CREATIVE INDUSTRIES, LOS ANGELES COUNTY, 2014
TABLE 26:ECONOMIC CONTRIBUTION OF THE CREATIVE INDUSTRIES, ORANGE COUNTY, 2014
*Property, state and local personal income taxes and sales taxes generated by earnings and spending of the direct and indirect workers. Details may not add to totals due to roundingSource: California EDD, QCEW data; Bureau of the Census; indirect contributions estimated by LAEDC
*Property, state and local personal income taxes and sales taxes generated by earnings and spending of the direct and indirect workers. Details may not add to totals due to roundingSource: California EDD, QCEW data; Bureau of the Census; indirect contributions estimated by LAEDC
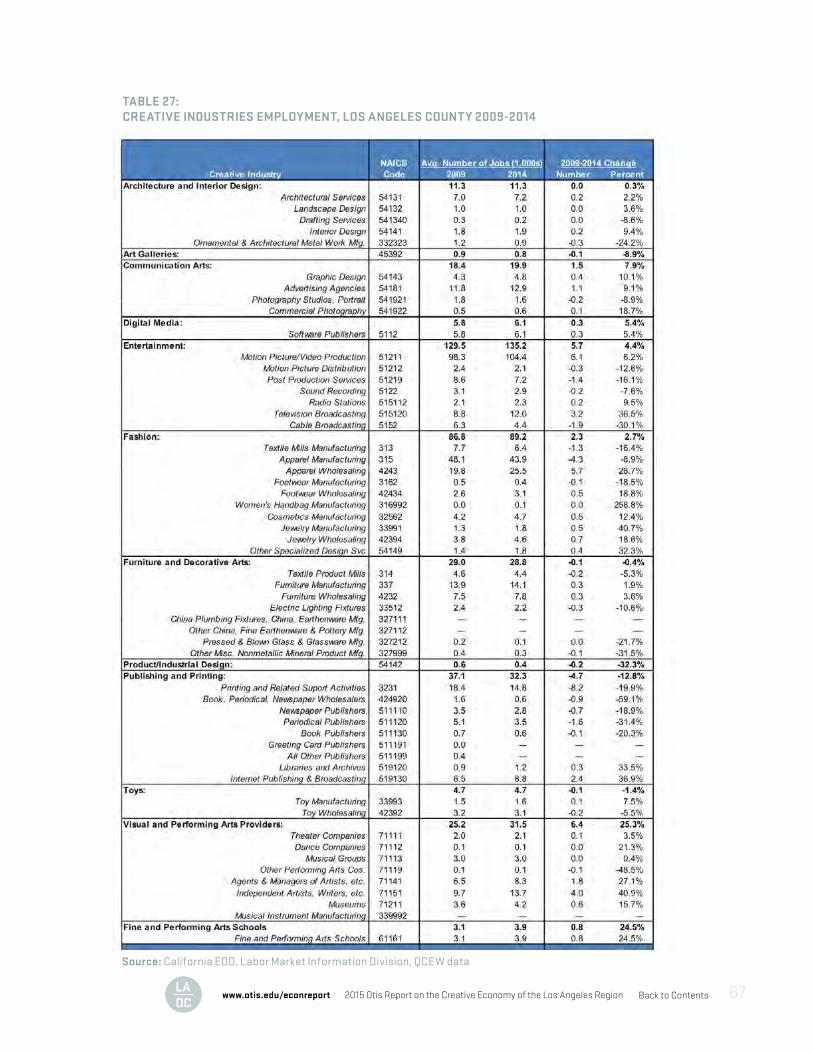
Back to Contents2015 Otis Report on the Creative Economy of the Los Angeles Regionwww.otis.edu/econreport 67
TABLE 27:CREATIVE INDUSTRIES EMPLOYMENT, LOS ANGELES COUNTY 2009-2014
Source: California EDD, Labor Market Information Division, QCEW data
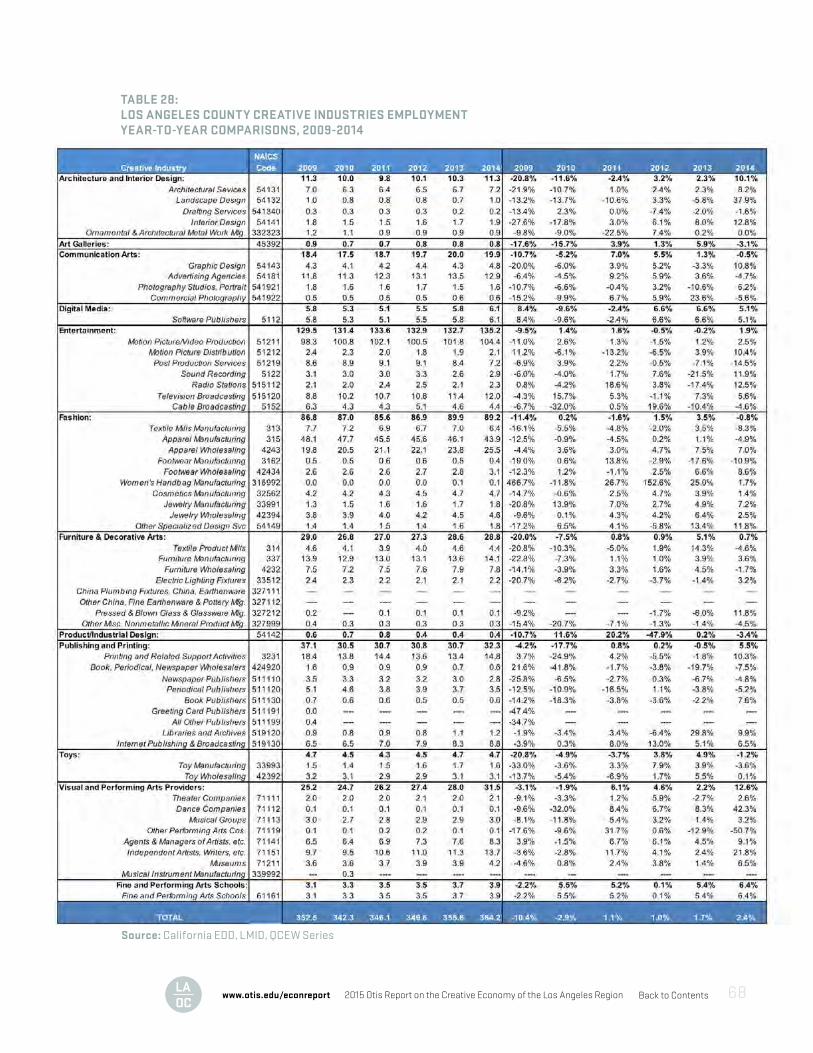
Back to Contents2015 Otis Report on the Creative Economy of the Los Angeles Regionwww.otis.edu/econreport 68
TABLE 28:LOS ANGELES COUNTY CREATIVE INDUSTRIES EMPLOYMENT YEAR-TO-YEAR COMPARISONS, 2009-2014
Source: California EDD, LMID, QCEW Series
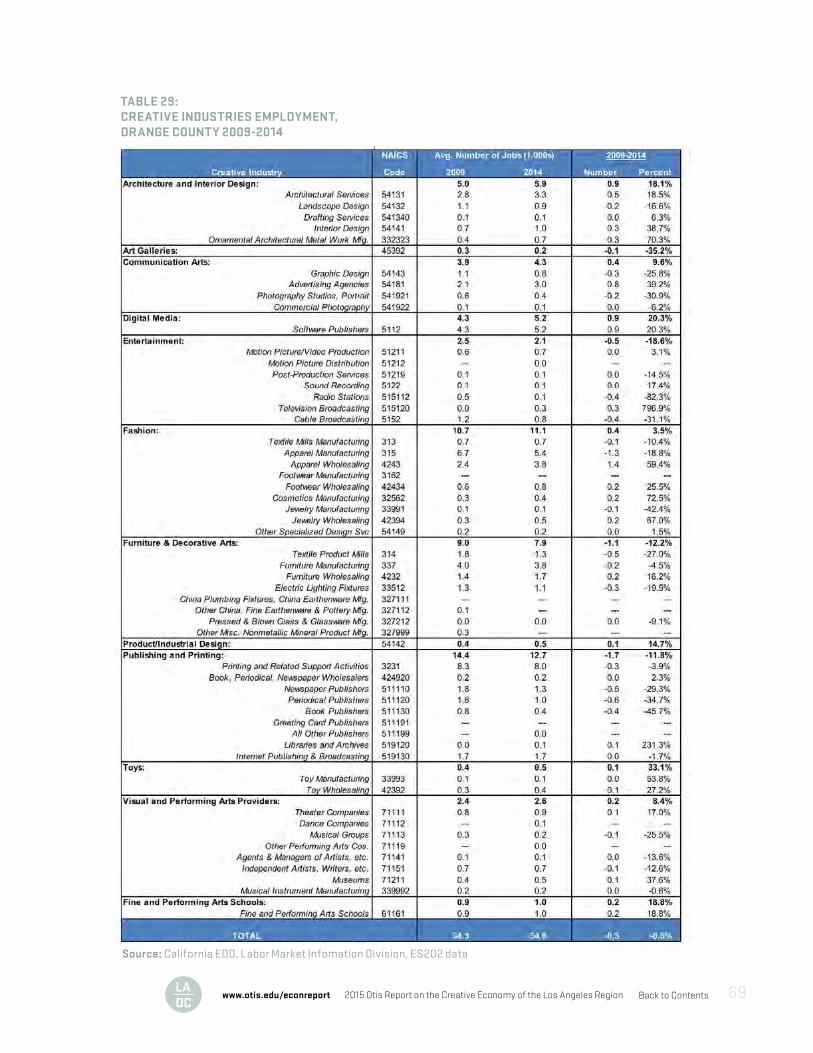
Back to Contents2015 Otis Report on the Creative Economy of the Los Angeles Regionwww.otis.edu/econreport 69
TABLE 29:CREATIVE INDUSTRIES EMPLOYMENT, ORANGE COUNTY 2009-2014
Source: California EDD, Labor Market Infomation Division, ES202 data
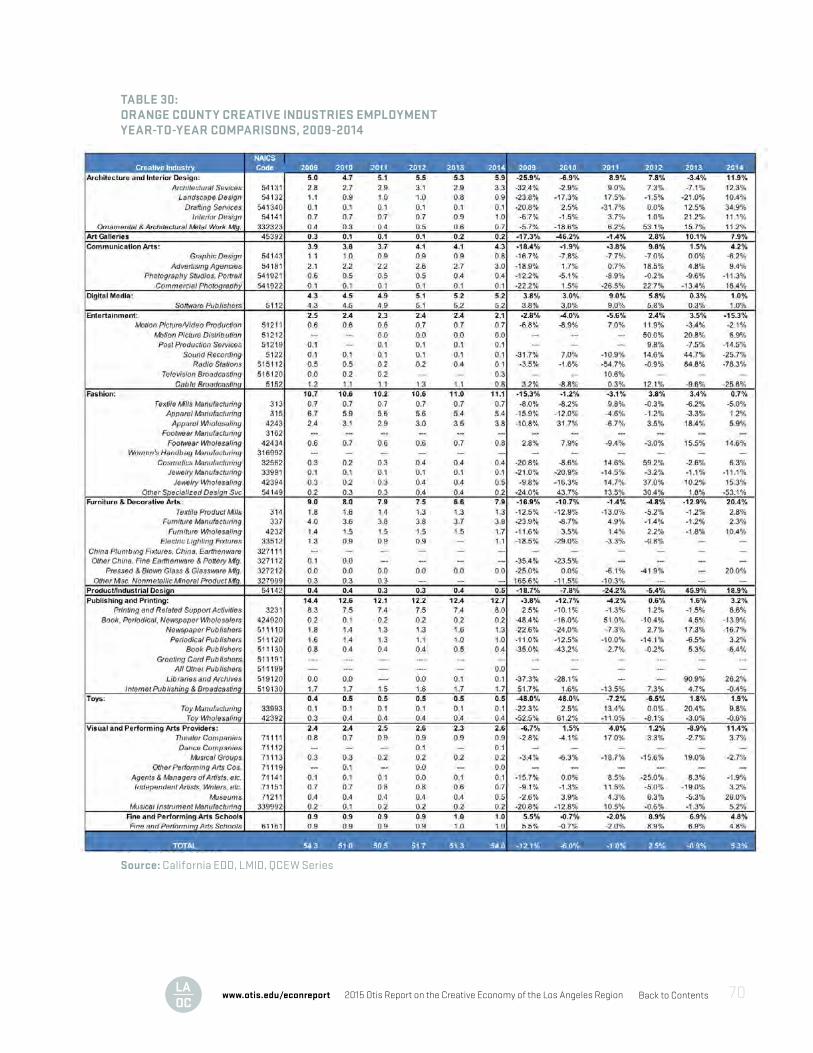
Back to Contents2015 Otis Report on the Creative Economy of the Los Angeles Regionwww.otis.edu/econreport 70
TABLE 30:ORANGE COUNTY CREATIVE INDUSTRIES EMPLOYMENT YEAR-TO-YEAR COMPARISONS, 2009-2014
Source: California EDD, LMID, QCEW Series
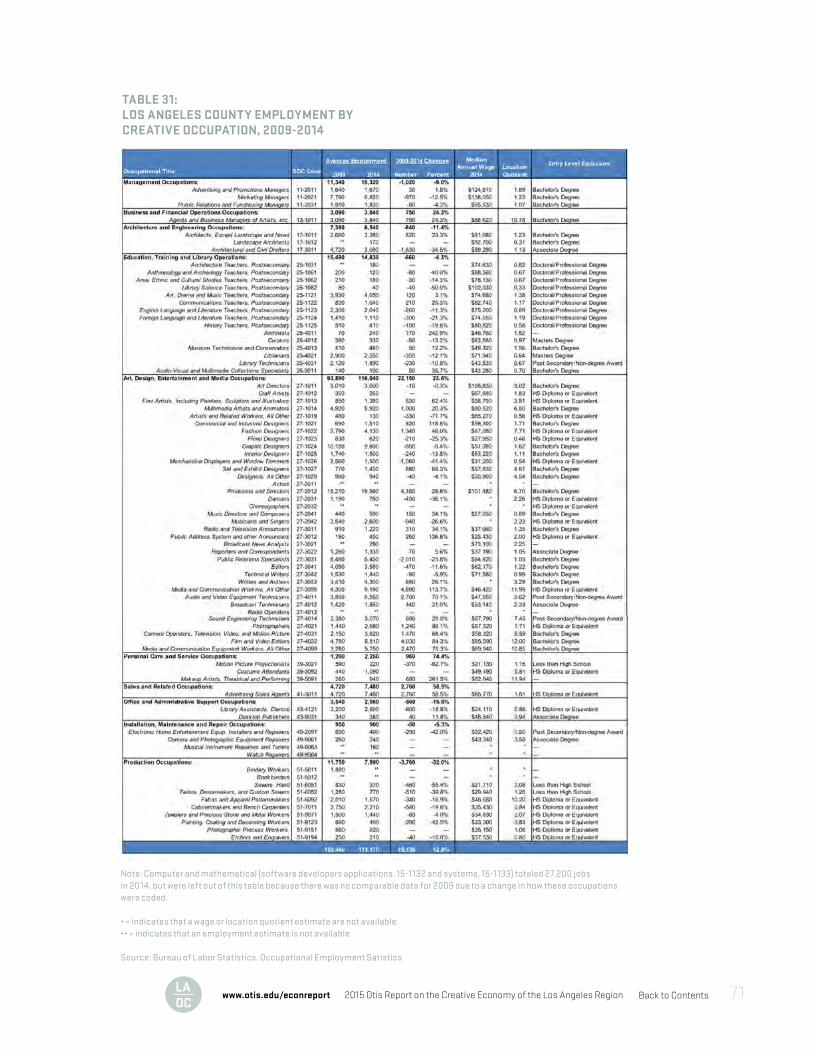
Back to Contents2015 Otis Report on the Creative Economy of the Los Angeles Regionwww.otis.edu/econreport 71
TABLE 31:LOS ANGELES COUNTY EMPLOYMENT BY CREATIVE OCCUPATION, 2009-2014
Note: Computer and mathematical (software developers applications, 15-1132 and systems, 15-1133) totaled 27,200 jobs in 2014, but were left out of this table because there was no comparable data for 2009 due to a change in how these occupations were coded.
• = indicates that a wage or location quotient estimate are not available•• = indicates that an employment estimate is not available
Source: Bureau of Labor Statistics. Occupational Employment Satistics
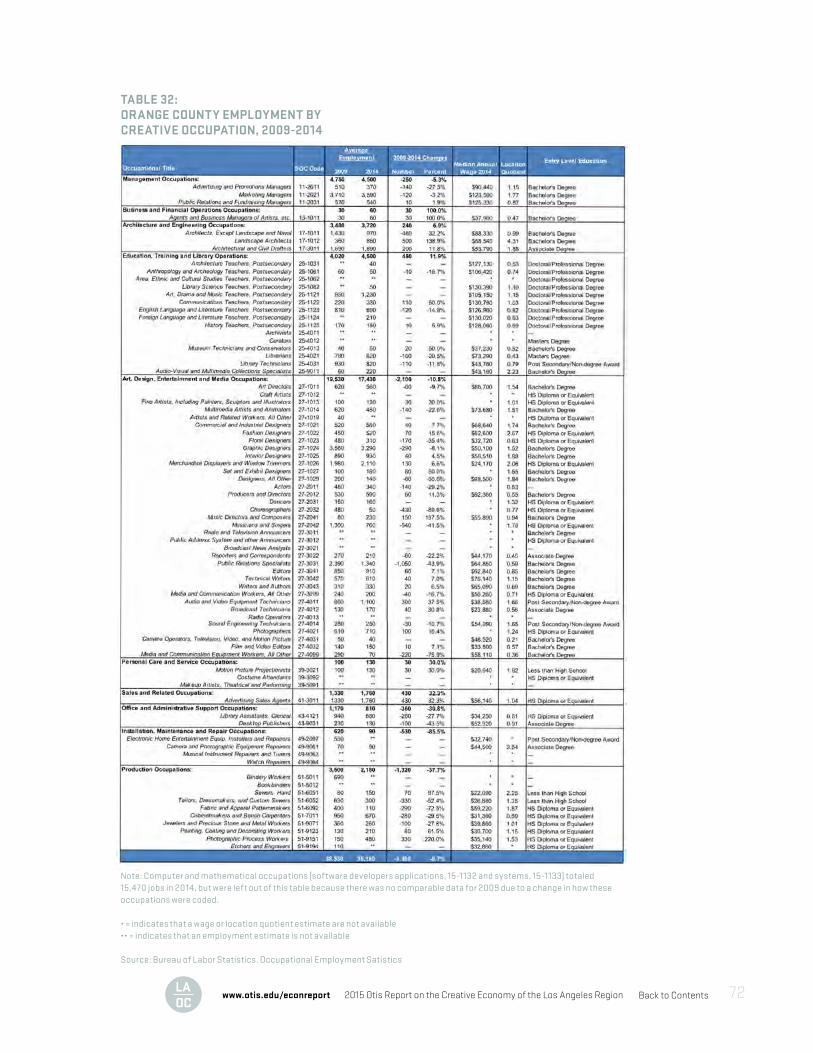
Back to Contents2015 Otis Report on the Creative Economy of the Los Angeles Regionwww.otis.edu/econreport 72
TABLE 32:ORANGE COUNTY EMPLOYMENT BY CREATIVE OCCUPATION, 2009-2014
Note: Computer and mathematical occupations (software developers applications, 15-1132 and systems, 15-1133) totaled 15,470 jobs in 2014, but were left out of this table because there was no comparable data for 2009 due to a change in how these occupations were coded.
• = indicates that a wage or location quotient estimate are not available•• = indicates that an employment estimate is not available
Source: Bureau of Labor Statistics. Occupational Employment Satistics
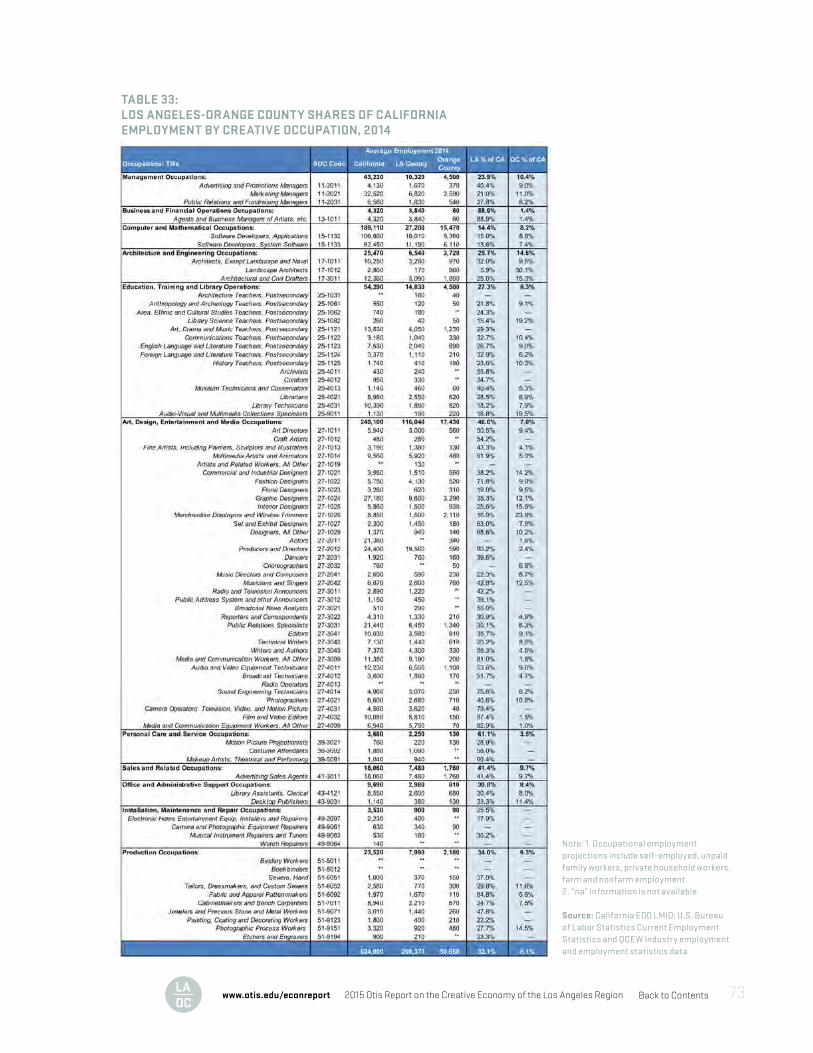
Back to Contents2015 Otis Report on the Creative Economy of the Los Angeles Regionwww.otis.edu/econreport 73
TABLE 33:LOS ANGELES-ORANGE COUNTY SHARES OF CALIFORNIA EMPLOYMENT BY CREATIVE OCCUPATION, 2014
Note: 1. Occupational employmentprojections include self-employed, unpaidfamily workers, private household workers,farm and nonfarm employment.2. “na” information is not available
Source: California EDD LMID; U.S. Bureauof Labor Statistics Current EmploymentStatistics and QCEW industry employmentand employment statistics data
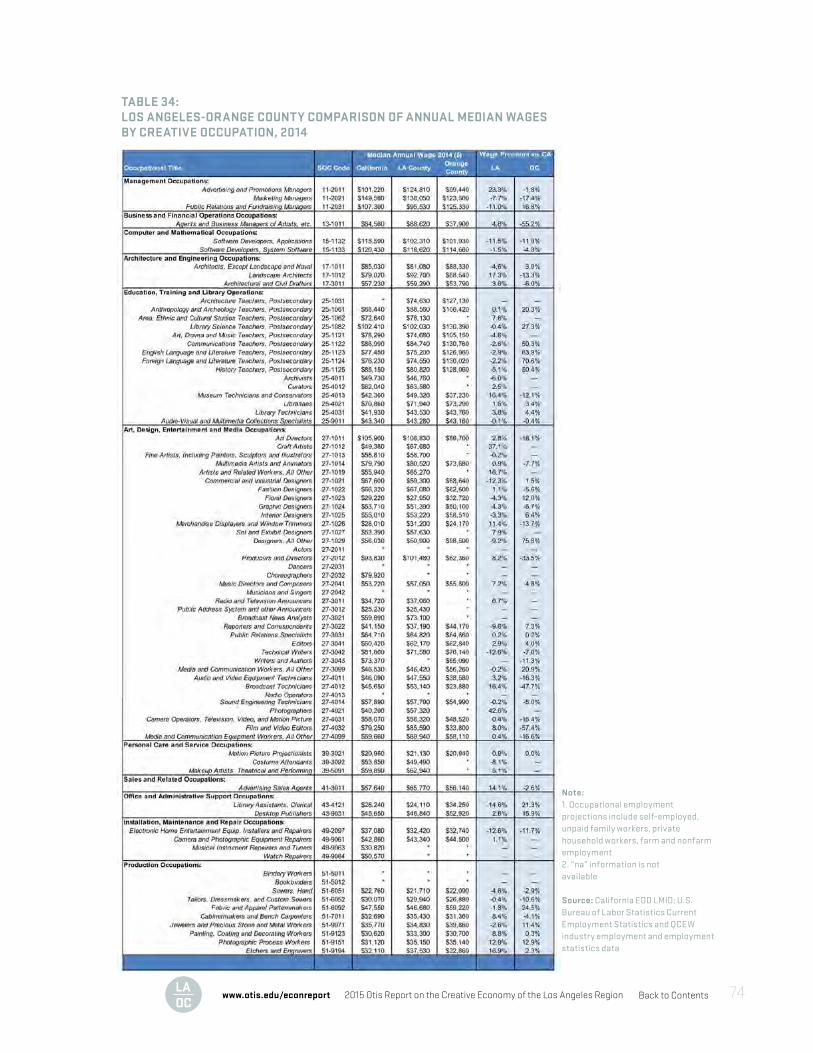
Back to Contents2015 Otis Report on the Creative Economy of the Los Angeles Regionwww.otis.edu/econreport 74
TABLE 34:LOS ANGELES-ORANGE COUNTY COMPARISON OF ANNUAL MEDIAN WAGES BY CREATIVE OCCUPATION, 2014
Note: 1. Occupational employmentprojections include self-employed,unpaid family workers, privatehousehold workers, farm and nonfarmemployment 2. “na” information is notavailable
Source: California EDD LMID; U.S.Bureau of Labor Statistics CurrentEmployment Statistics and QCEWindustry employment and employmentstatistics data
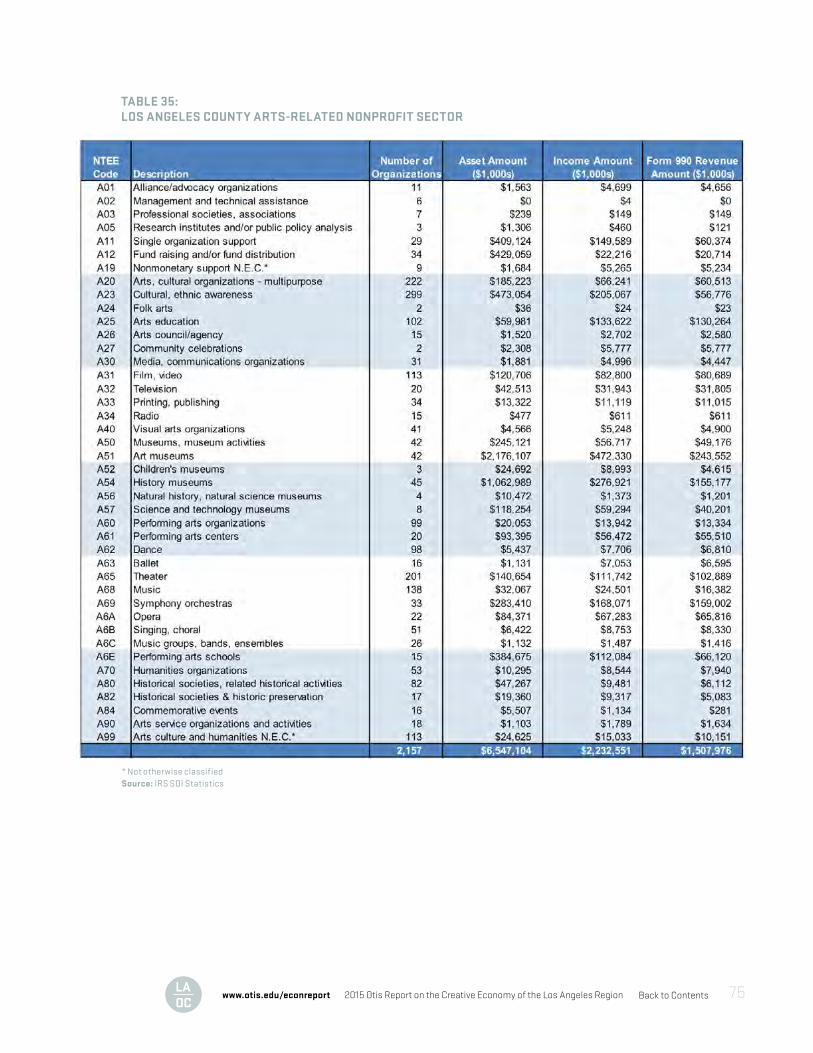
Back to Contents2015 Otis Report on the Creative Economy of the Los Angeles Regionwww.otis.edu/econreport 75
TABLE 35:LOS ANGELES COUNTY ARTS-RELATED NONPROFIT SECTOR
* Not otherwise classifiedSource: IRS SOI Statistics
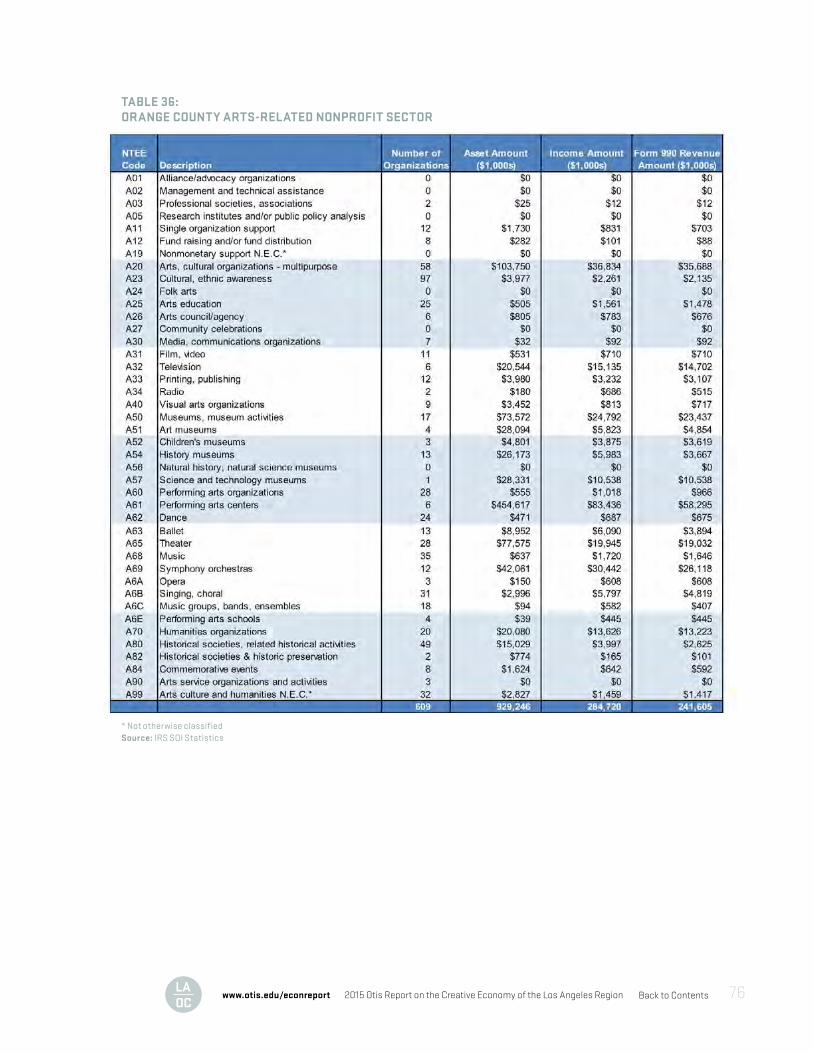
Back to Contents2015 Otis Report on the Creative Economy of the Los Angeles Regionwww.otis.edu/econreport 76
TABLE 36:ORANGE COUNTY ARTS-RELATED NONPROFIT SECTOR
* Not otherwise classifiedSource: IRS SOI Statistics
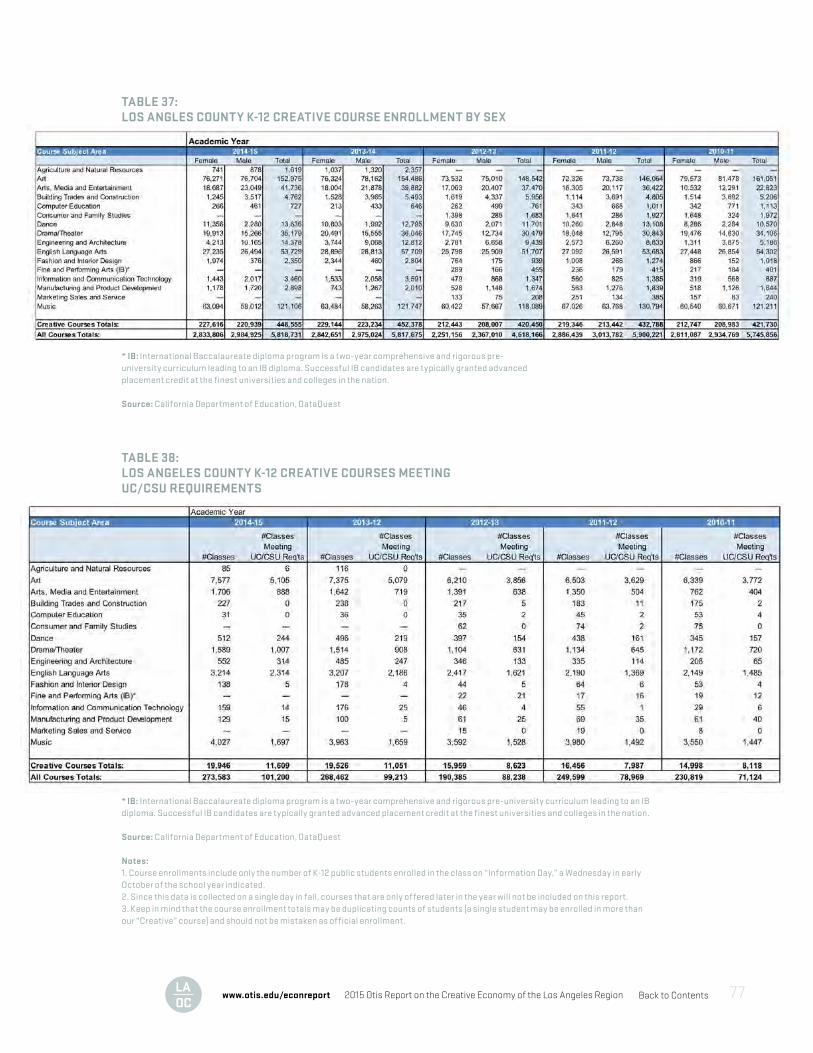
Back to Contents2015 Otis Report on the Creative Economy of the Los Angeles Regionwww.otis.edu/econreport 77
TABLE 37:LOS ANGLES COUNTY K-12 CREATIVE COURSE ENROLLMENT BY SEX
TABLE 38:LOS ANGELES COUNTY K-12 CREATIVE COURSES MEETING UC/CSU REQUIREMENTS
* IB: International Baccalaureate diploma program is a two-year comprehensive and rigorous pre-university curriculum leading to an IB diploma. Successful IB candidates are typically granted advanced placement credit at the finest universities and colleges in the nation.
Source: California Department of Education, DataQuest
* IB: International Baccalaureate diploma program is a two-year comprehensive and rigorous pre-university curriculum leading to an IBdiploma. Successful IB candidates are typically granted advanced placement credit at the finest universities and colleges in the nation.
Source: California Department of Education, DataQuest
Notes:1. Course enrollments include only the number of K-12 public students enrolled in the class on “Information Day,” a Wednesday in earlyOctober of the school year indicated.2. Since this data is collected on a single day in fall, courses that are only offered later in the year will not be included on this report.3. Keep in mind that the course enrollment totals may be duplicating counts of students (a single student may be enrolled in more thanour “Creative” course) and should not be mistaken as official enrollment.
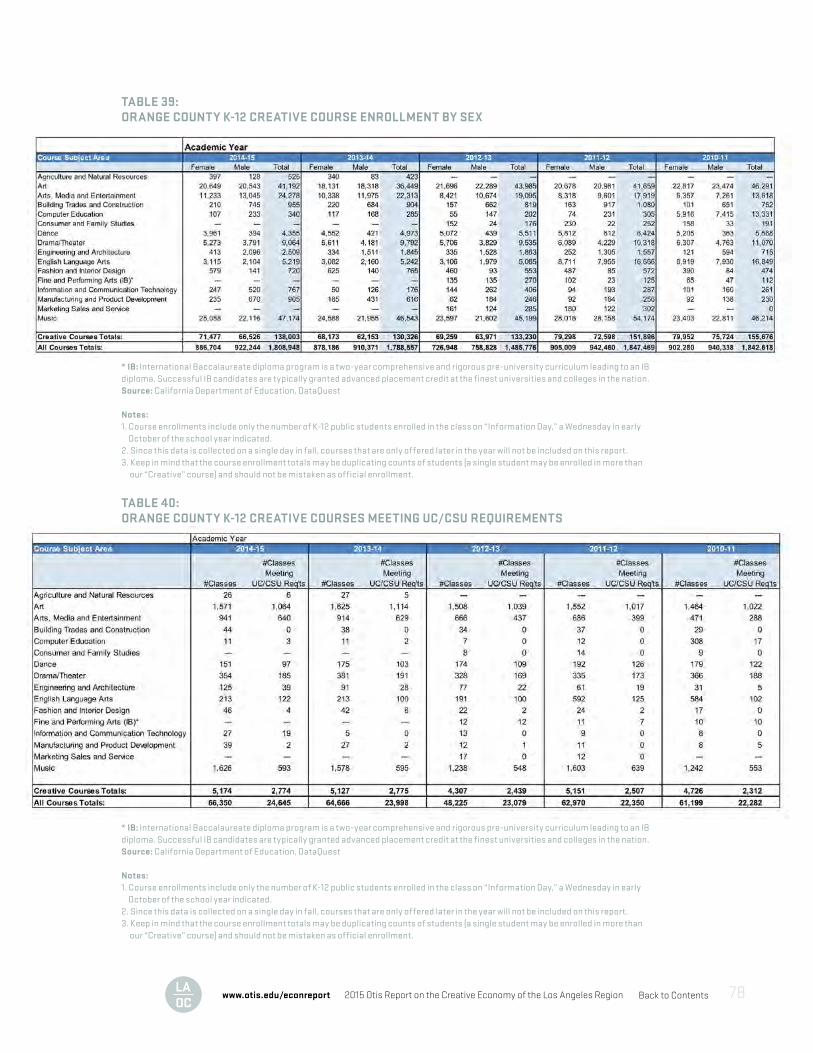
Back to Contents2015 Otis Report on the Creative Economy of the Los Angeles Regionwww.otis.edu/econreport 78
TABLE 39:ORANGE COUNTY K-12 CREATIVE COURSE ENROLLMENT BY SEX
TABLE 40:ORANGE COUNTY K-12 CREATIVE COURSES MEETING UC/CSU REQUIREMENTS
* IB: International Baccalaureate diploma program is a two-year comprehensive and rigorous pre-university curriculum leading to an IBdiploma. Successful IB candidates are typically granted advanced placement credit at the finest universities and colleges in the nation.Source: California Department of Education, DataQuest
Notes:1. Course enrollments include only the number of K-12 public students enrolled in the class on “Information Day,” a Wednesday in early October of the school year indicated.2. Since this data is collected on a single day in fall, courses that are only offered later in the year will not be included on this report.3. Keep in mind that the course enrollment totals may be duplicating counts of students (a single student may be enrolled in more than our “Creative” course) and should not be mistaken as official enrollment.
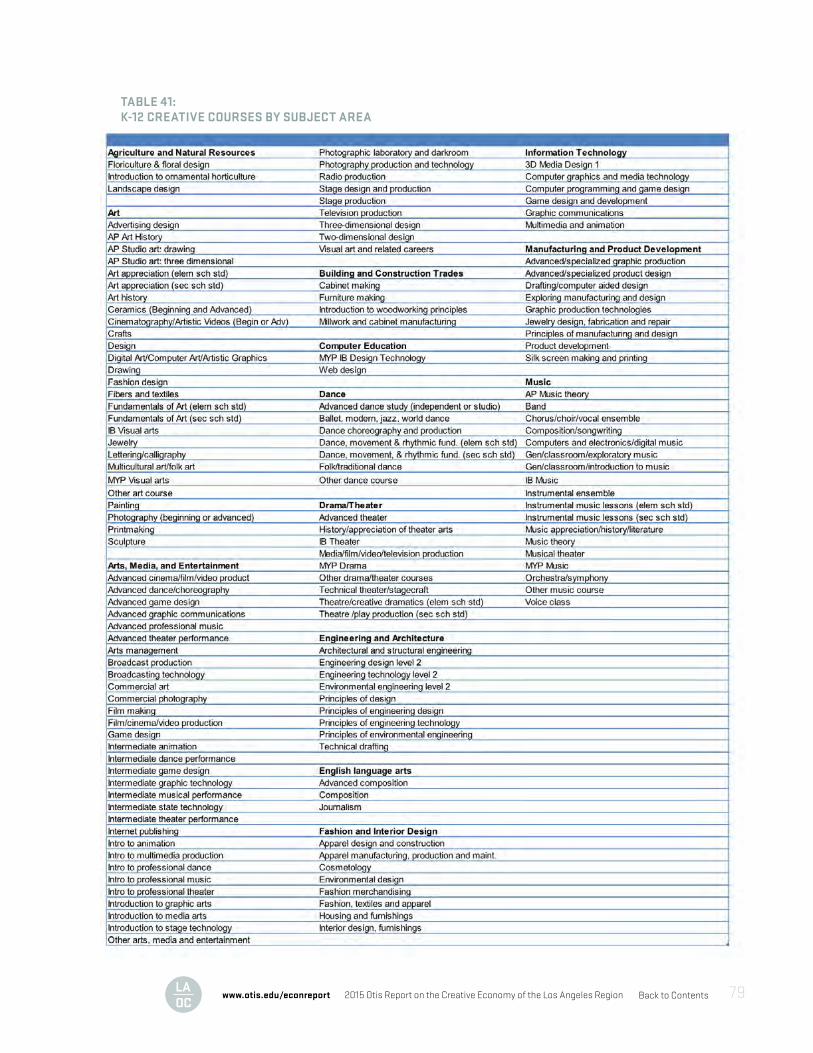
Back to Contents2015 Otis Report on the Creative Economy of the Los Angeles Regionwww.otis.edu/econreport 79
TABLE 41:K-12 CREATIVE COURSES BY SUBJECT AREA
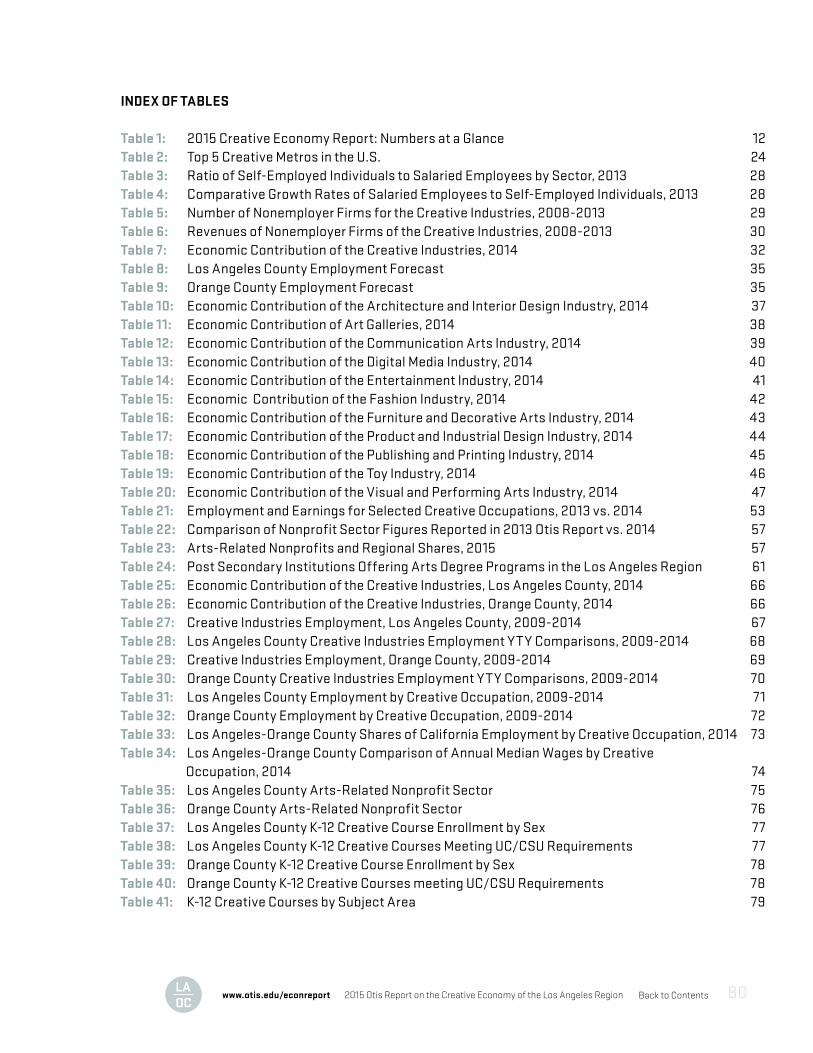
Back to Contents2015 Otis Report on the Creative Economy of the Los Angeles Regionwww.otis.edu/econreport 80
INDEX OF TABLES
Table 1: 2015 Creative Economy Report: Numbers at a Glance 12Table 2: Top 5 Creative Metros in the U.S. 24Table 3: Ratio of Self-Employed Individuals to Salaried Employees by Sector, 2013 28Table 4: Comparative Growth Rates of Salaried Employees to Self-Employed Individuals, 2013 28Table 5: Number of Nonemployer Firms for the Creative Industries, 2008-2013 29Table 6: Revenues of Nonemployer Firms of the Creative Industries, 2008-2013 30 Table 7: Economic Contribution of the Creative Industries, 2014 32Table 8: Los Angeles County Employment Forecast 35Table 9: Orange County Employment Forecast 35Table 10: Economic Contribution of the Architecture and Interior Design Industry, 2014 37Table 11: Economic Contribution of Art Galleries, 2014 38Table 12: Economic Contribution of the Communication Arts Industry, 2014 39Table 13: Economic Contribution of the Digital Media Industry, 2014 40Table 14: Economic Contribution of the Entertainment Industry, 2014 41Table 15: Economic Contribution of the Fashion Industry, 2014 42Table 16: Economic Contribution of the Furniture and Decorative Arts Industry, 2014 43Table 17: Economic Contribution of the Product and Industrial Design Industry, 2014 44Table 18: Economic Contribution of the Publishing and Printing Industry, 2014 45Table 19: Economic Contribution of the Toy Industry, 2014 46Table 20: Economic Contribution of the Visual and Performing Arts Industry, 2014 47Table 21: Employment and Earnings for Selected Creative Occupations, 2013 vs. 2014 53Table 22: Comparison of Nonprofit Sector Figures Reported in 2013 Otis Report vs. 2014 57Table 23: Arts-Related Nonprofits and Regional Shares, 2015 57Table 24: Post Secondary Institutions Offering Arts Degree Programs in the Los Angeles Region 61 Table 25: Economic Contribution of the Creative Industries, Los Angeles County, 2014 66Table 26: Economic Contribution of the Creative Industries, Orange County, 2014 66Table 27: Creative Industries Employment, Los Angeles County, 2009-2014 67Table 28: Los Angeles County Creative Industries Employment YTY Comparisons, 2009-2014 68Table 29: Creative Industries Employment, Orange County, 2009-2014 69Table 30: Orange County Creative Industries Employment YTY Comparisons, 2009-2014 70 Table 31: Los Angeles County Employment by Creative Occupation, 2009-2014 71Table 32: Orange County Employment by Creative Occupation, 2009-2014 72Table 33: Los Angeles-Orange County Shares of California Employment by Creative Occupation, 2014 73Table 34: Los Angeles-Orange County Comparison of Annual Median Wages by Creative Occupation, 2014 74Table 35: Los Angeles County Arts-Related Nonprofit Sector 75Table 36: Orange County Arts-Related Nonprofit Sector 76Table 37: Los Angeles County K-12 Creative Course Enrollment by Sex 77Table 38: Los Angeles County K-12 Creative Courses Meeting UC/CSU Requirements 77Table 39: Orange County K-12 Creative Course Enrollment by Sex 78Table 40: Orange County K-12 Creative Courses meeting UC/CSU Requirements 78 Table 41: K-12 Creative Courses by Subject Area 79
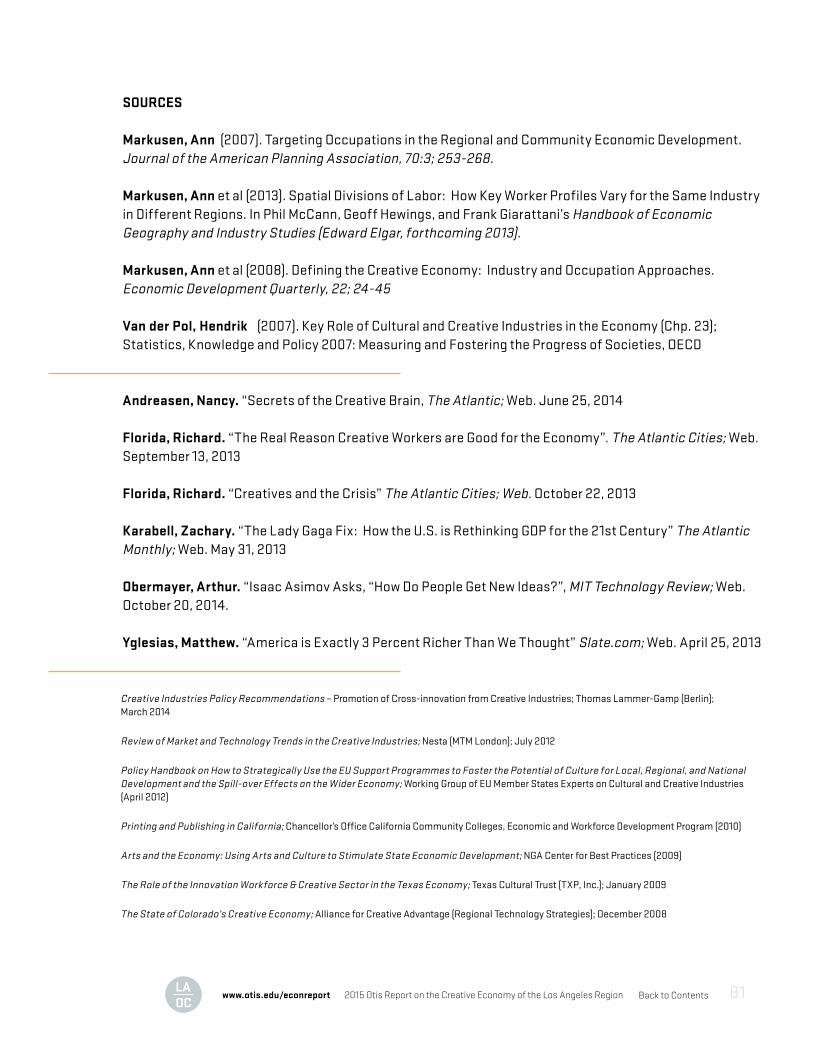
Back to Contents2015 Otis Report on the Creative Economy of the Los Angeles Regionwww.otis.edu/econreport 81
SOURCES
Markusen, Ann (2007). Targeting Occupations in the Regional and Community Economic Development. Journal of the American Planning Association, 70:3; 253-268.
Markusen, Ann et al (2013). Spatial Divisions of Labor: How Key Worker Profiles Vary for the Same Industry in Different Regions. In Phil McCann, Geoff Hewings, and Frank Giarattani’s Handbook of Economic Geography and Industry Studies (Edward Elgar, forthcoming 2013).
Markusen, Ann et al (2008). Defining the Creative Economy: Industry and Occupation Approaches. Economic Development Quarterly, 22; 24-45
Van der Pol, Hendrik (2007). Key Role of Cultural and Creative Industries in the Economy (Chp. 23); Statistics, Knowledge and Policy 2007: Measuring and Fostering the Progress of Societies, OECD
Andreasen, Nancy. “Secrets of the Creative Brain, The Atlantic; Web. June 25, 2014
Florida, Richard. “The Real Reason Creative Workers are Good for the Economy”. The Atlantic Cities; Web. September 13, 2013
Florida, Richard. “Creatives and the Crisis” The Atlantic Cities; Web. October 22, 2013
Karabell, Zachary. “The Lady Gaga Fix: How the U.S. is Rethinking GDP for the 21st Century” The Atlantic Monthly; Web. May 31, 2013
Obermayer, Arthur. “Isaac Asimov Asks, “How Do People Get New Ideas?”, MIT Technology Review; Web. October 20, 2014.
Yglesias, Matthew. “America is Exactly 3 Percent Richer Than We Thought” Slate.com; Web. April 25, 2013
Creative Industries Policy Recommendations – Promotion of Cross-innovation from Creative Industries; Thomas Lammer-Gamp (Berlin); March 2014
Review of Market and Technology Trends in the Creative Industries; Nesta (MTM London); July 2012
Policy Handbook on How to Strategically Use the EU Support Programmes to Foster the Potential of Culture for Local, Regional, and National Development and the Spill-over Effects on the Wider Economy; Working Group of EU Member States Experts on Cultural and Creative Industries (April 2012)
Printing and Publishing in California; Chancellor’s Office California Community Colleges, Economic and Workforce Development Program (2010)
Arts and the Economy: Using Arts and Culture to Stimulate State Economic Development; NGA Center for Best Practices (2009)
The Role of the Innovation Workforce & Creative Sector in the Texas Economy; Texas Cultural Trust (TXP, Inc.); January 2009
The State of Colorado’s Creative Economy; Alliance for Creative Advantage (Regional Technology Strategies); December 2008
Download the full report, view highlights from the creative economy launch event, and learn more about other resources at www.otis.edu/econreport


![OTIS COLLEGE OF ART AND DESIGN · Interior Architecture Student Competition [ Robert Apodaca and Michael Aquino ] AIGA/LA Typecraft Wood & Jones Scholarship [ Sharleen Yoshimi ] Society](https://img.pdfslide.net/doc/110x75/5e810a7039a3ae58ec4afd79/otis-college-of-art-and-design-interior-architecture-student-competition-robert.jpg)


![KAY ROSEN CV › kayrosencv.pdfTen in One Gallery, New York, 2000 “Kay Rosen: Lifeli[k]e,” Los Angeles Museum of Contemporary Art (LA MOCA) and Otis College of Art and Design,](https://img.pdfslide.net/doc/110x75/5f288ee7afe966695f662257/kay-rosen-cv-a-kayrosencvpdf-ten-in-one-gallery-new-york-2000-aoekay-rosen.jpg)