Embed Size (px)
Citation preview

House HHS FinanceHF576
February 25, 2015
1

Community Health CentersThe Basics
17 organizations at 70+ service sites in state serving 180,000 Minnesotans.
Also known as “Federally Qualified Health Centers – FQHCs”
Not-for profit corporations. 51% of Board are patients. Serve a Medically Underserved Area. Comprehensive primary care – medical,
dental and mental health. Enabling services key to model. Serve all regardless of ability to pay. Sliding fee schedule for the uninsured. ROI – 9% of non-disabled MHCP with 1.2%
of budget

Community Health CentersLocations
GREATER MN
Open Door Health Center –Mankato
Lake Superior Community Health Center – Duluth
Sawtooth Mountain Clinic – Grand Marais, Grand Portage, Tofte
Scenic Rivers Health Services – Cook, Bigfork, Big Falls, Floodwood, Northome, Tower
Community Health Service– Moorhead, Rochester, Wilmar, Olivia (*Seasonal), Owatonna*, Breckenridge*, Northern Mobile Unit, Southern Mobile Unit
TWIN CITIES
Minneapolis Axis Medical Center Community-University Health Care
Center Health Care for the Homeless Indian Health Board Native American Community Clinic Neighborhood HealthSource North Point Health & Wellness People’s Center Southside Community Health Services
St. Paul Open Cities Health Center United Family Medicine West Side Community Health Services

CHC Patient Demographics
Uninsured6608437%
MA/MNCare7356441%
Medicare
138518%
Private2421914%
2013 CHC Patient Insurance Status
4
Uninsured7%
MA/MNCare13%
Medicare13%
Private67%
2013 MN Patient Insurance Status
Source: HRSA Uniform Data System, 2013 Source: Kaiser State Health Facts, 2013

CHC Patient Demographics
5
Asian/PI7%
Black/Afr.
Amer.28%
Amer. Ind.5%
White32%
Latino25%
Other/ >1 Race2%
2013 CHC Patient Race/Ethnicity
Asian/PI5%
Black/Afr. Amer.6%
Amer. Ind.1%
White81%
Latino5%
Other/ >1 Race3%
2013 MN Race/Ethnicity
Source: HRSA Uniform Data System, 2013 Source: US Census Bureau, 2013
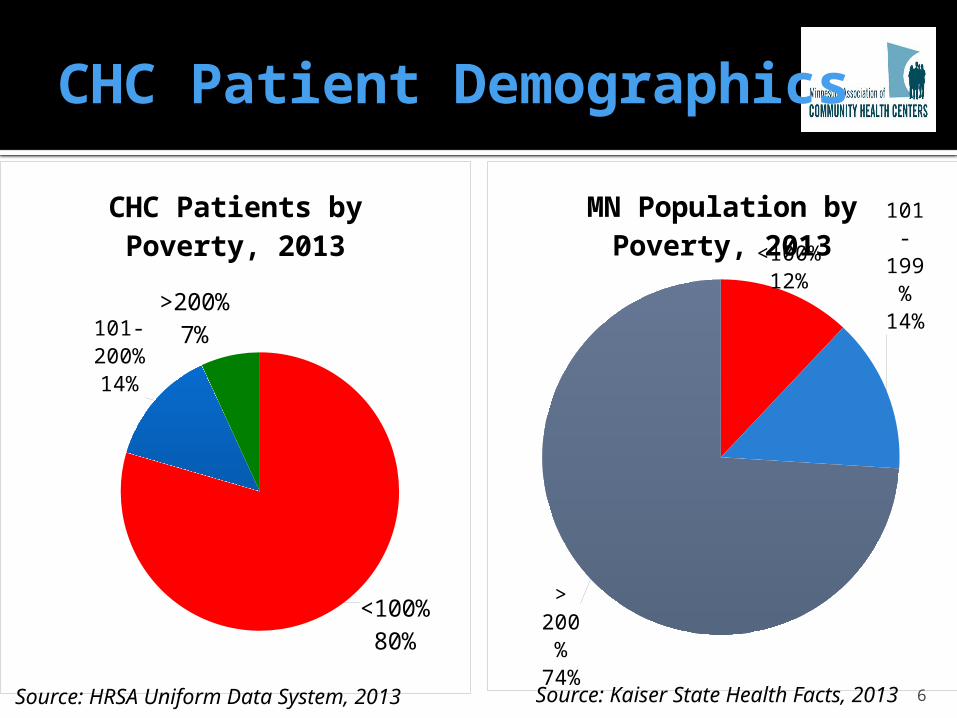
CHC Patient Demographics
<100%80%
101-200%
14%
>200%7%
CHC Patients by Poverty, 2013
<100%12%
101-199%
14%
> 200%
74%
MN Population by Poverty, 2013
6Source: HRSA Uniform Data System, 2013 Source: Kaiser State Health Facts, 2013

CHC Patient Quality Indicators
7
SELECTED QUALITY INDICATORS
88% of CHCs are recognized as federal Patient Centered Medical Homes (PCMH)
78% of pregnant women entered prenatal care during first trimester
90% of patients screened for tobacco-use 86% asthma patients age 5 through 40 have a treatment
plan 71% of diabetic patients have A1c under control (<=9.0%) Lower LBW rates compared to state averages – by every
race/ethnicity

Balancing History and Innovation
Serving the Underserved
Participating in Health
Care Reform
8
• MN DHS – “ACO Demonstrations”
• Moving away from fee-for-service to Total Cost of Care
(TCOC) arrangement – while meeting Financial &
Quality Benchmarks
FFS
Pay for SERVICES
TCOC
Pay for VALUE

FQHC Innovation: Federally Qualified Health Center Urban Health Network (FUHN)
Only FQHC led Medicaid focused Accountable Care Organization in the nation.
1st “virtual” ACO in MN – non affiliated providers
Attributed 25,000 patients Met all patient satisfaction goals and quality
benchmarks 8.6% reduction in ED Visits in Year One, and
currently at 16.2% in Year Two $2.6 million in savings Trending toward 20% reduction in ED Visits in
Year Two “Line of sight” into clinical care picture.
9

Success – ED Visits Reduced
10
Se-ries
1
1,062
1,086
1,071
1,062
1,051
1,063
1,026
1,021
1,022 1,011
1,004
995
993 974
952 938
940
930
924 911
903 890
FUHN ED Visits per 1,000 patients per year
Baseline of 1,062 ED visits per 1,000 pa-tients per Year
End of Year 1:8.6% Reduction in
ED Visits
Most Recently:16.2% Reduction in ED Visits
Compared to Baseline

FQHC Innovation – Hennepin Health
9% reduction in ED Visits 3% reduction in Inpatient
Admissions 2.5% increase in Primary Care
Visits 10.8% increase in patients meeting
Optimal Diabetes Care 23.5% increase in patients meeting
Optimal Vascular Care 7.6% increase in patients meeting
Optimal Asthma Care 11

What We’ve Learned From the Demonstrations
Care coordination is at the core of the model. Ensuring patients with multiple chronic diseases are managed
Data analytics for population health management is critical (and expensive).
Patient Outreach and Education necessary to engage patients in their care.
Value of “connecting” with social services our patients use/need to address the social determinants of health. 20% of outcomes influenced by services “provided within the
4 walls of the clinic”
12

FQHC Priority Areas
Care Coordination
Access
Data Analytics
Oral Healt
h
Reduce health disparities
Reduce avoidable ER & Hospitalizations
Integrate Care
Engage Consumers
13
OUTCOMES

HF576
$2 million increase to CHC appropriation operated under Minn. Stat. 145.9269 “to continue, expand, and improve federally qualified
health center services to low-income populations” Currently at $2.5 million per year and scheduled to
decrease by $125,000 in each year of FY16-17 biennium
Minnesota Department of Health (MDH) – Office of Rural Health and Primary Care (ORPHC)
Established in 2007
14

$2 million increase for FQHCs
• 23,300 patients• 40.00 FTE
Care Coordination
• 25,100 patients• 5.50 FTEData Analytics
• 24,673 patients• 6.50 FTE
Expanded Access
• 12,577 patients• 6.25 FTEOral Health
15
44 Investments
Nearly 60.00 FTE
Impacting 85,000 FQHC
Patients