Embed Size (px)
Citation preview

February 5, 2003
Integrating Fisheries Management Into
Comprehensive Recovery Planning
Jeff Koenings, Randy KinleyMike Grayum, Curt Kraemer, Kit
Rawson

February 5, 2003
Washington's Goals forWashington's Goals forSalmon RecoverySalmon Recovery
Statewide Strategy to Recover Salmon:
“Restore salmon, steelhead, and trout populations to healthy
harvestable levels and improve those habitats on which the fish
rely.”
Shared Strategy Objective:
"Recover and maintain an abundance of naturally spawning
salmon at harvestable levels"
February 5, 2003February 5, 2003
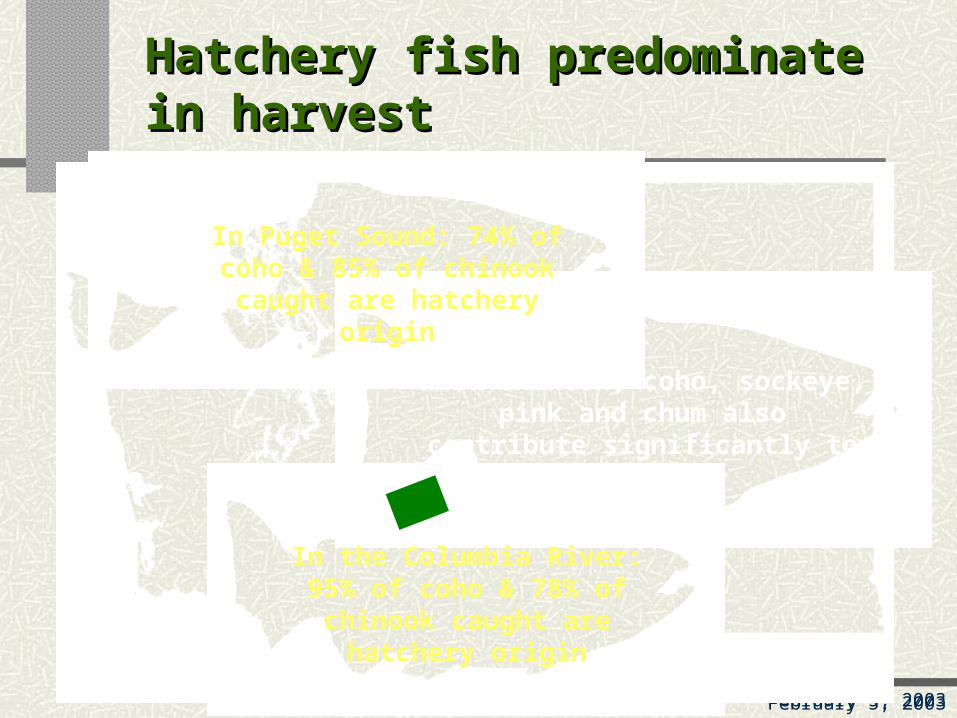
In Puget Sound: 74% of coho & 85% of chinook
caught are hatchery origin
Hatchery fish predominate Hatchery fish predominate in harvestin harvest
Wild chinook, coho, sockeye, pink and chum also contribute significantly to fisheries
In the Columbia River: 95% of coho & 78% of chinook caught are hatchery origin
February 5, 2003February 5, 2003
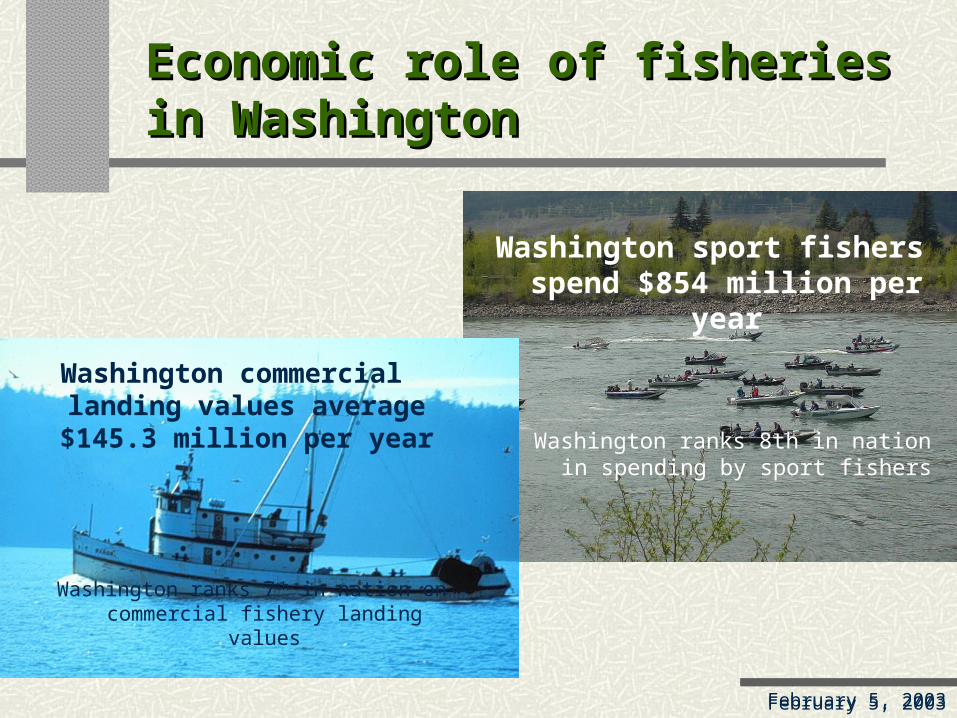
Economic role of fisheries in Economic role of fisheries in WashingtonWashington
Washington sport fishers spend $854
million per year
Washington ranks 8th in nation in spending by sport fishers
Washington commercial landing values average $145.3 million per year
Washington ranks 7th in nation on commercial fishery landing values
February 5, 2003
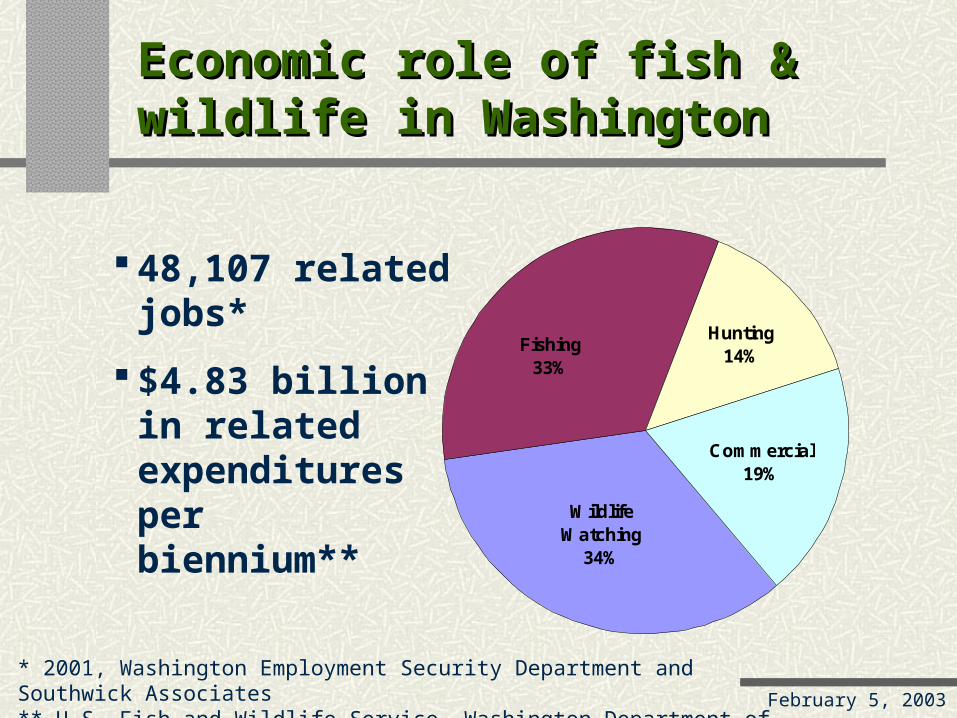
Economic role of fish & Economic role of fish & wildlife in Washingtonwildlife in Washington
48,107 related jobs*
$4.83 billion in relatedexpenditures perbiennium**
Commercial 19%
Hunting14%
Fishing33%
Wildlife Watching
34%
* 2001, Washington Employment Security Department and Southwick Associates** U.S. Fish and Wildlife Service, Washington Department of Fish and Wildlife

February 5, 2003
Where have we been?Where have we been?
Less than half of Snohomish chinook returned to spawn

February 5, 2003February 5, 2003
Pacific Pacific Northwest Northwest
Chinook Salmon Chinook Salmon are Widely are Widely
DistributedDistributed
Less mixture of stocks & species
Least mixture of stocks & species
Greatest mixture of stocks & species
February 5, 2003February 5, 2003
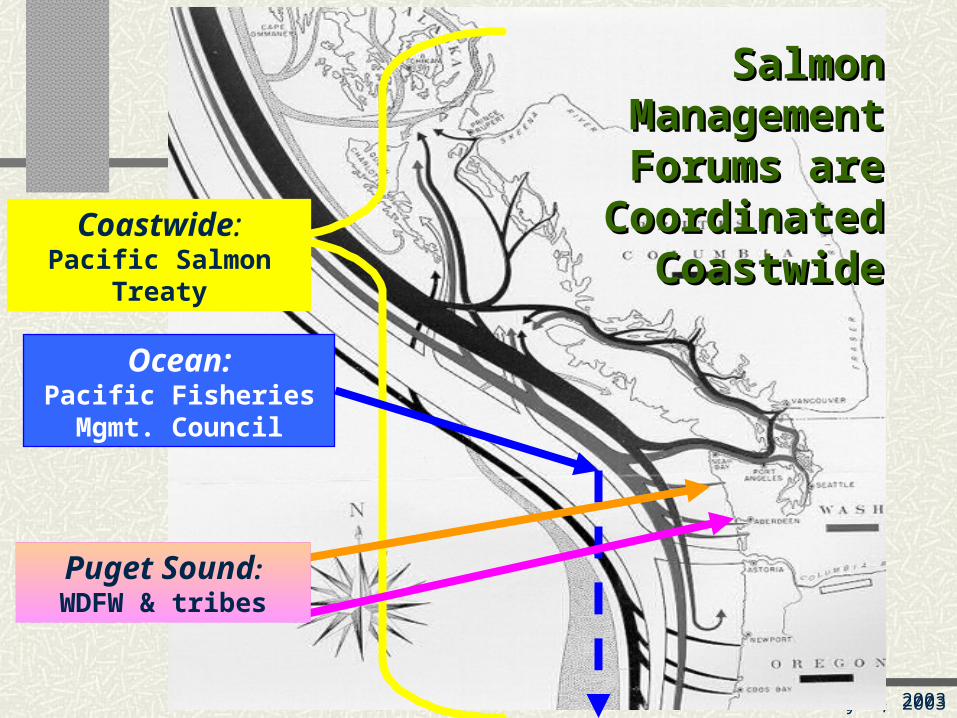
Salmon Salmon Management Management
Forums are Forums are Coordinated Coordinated
CoastwideCoastwideCoastwide:
Pacific Salmon Treaty
Ocean:Pacific Fisheries Mgmt. Council
Puget Sound:WDFW & tribes
February 5, 2003
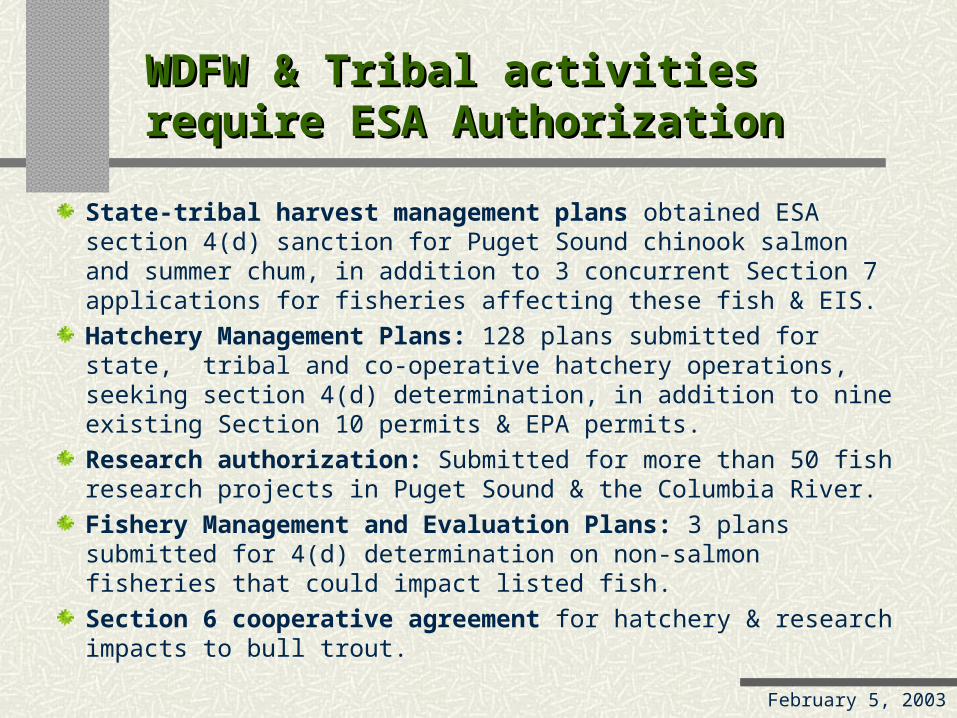
WDFW & Tribal activities WDFW & Tribal activities require ESA Authorizationrequire ESA Authorization
State-tribal harvest management plans obtained ESA section 4(d) sanction for Puget Sound chinook salmon and summer chum, in addition to 3 concurrent Section 7 applications for fisheries affecting these fish & EIS.Hatchery Management Plans: 128 plans submitted for state, tribal and co-operative hatchery operations, seeking section 4(d) determination, in addition to nine existing Section 10 permits & EPA permits.Research authorization: Submitted for more than 50 fish research projects in Puget Sound & the Columbia River.Fishery Management and Evaluation Plans: 3 plans submitted for 4(d) determination on non-salmon fisheries that could impact listed fish.Section 6 cooperative agreement for hatchery & research impacts to bull trout.
February 5, 2003
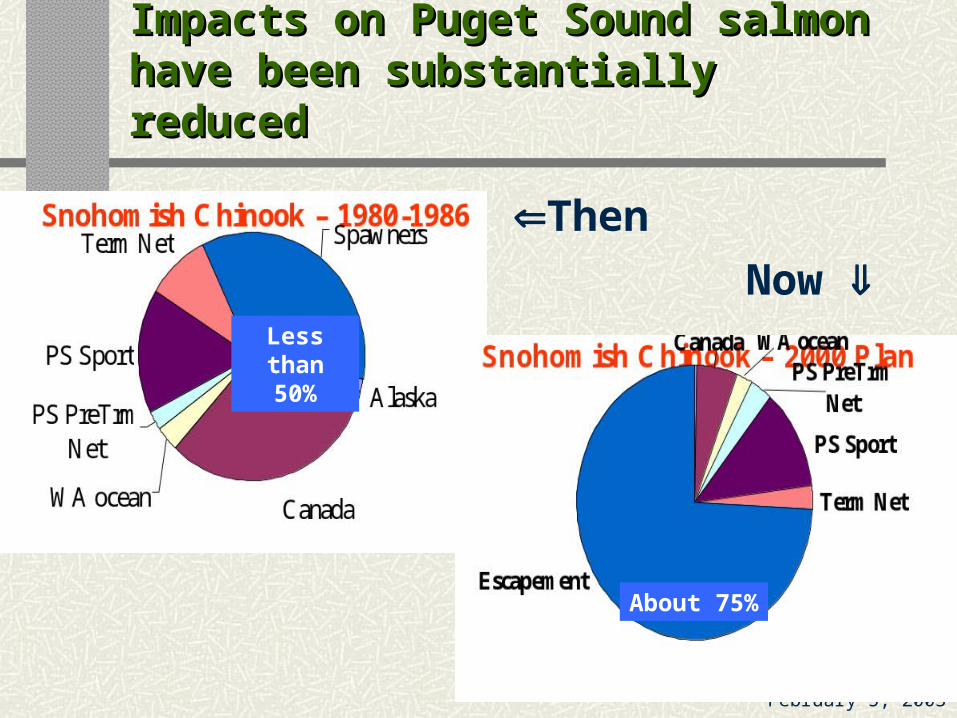
Impacts on Puget Sound salmon Impacts on Puget Sound salmon have been substantially have been substantially reducedreduced
Then
Less than 50%
About 75%
Now
February 5, 2003
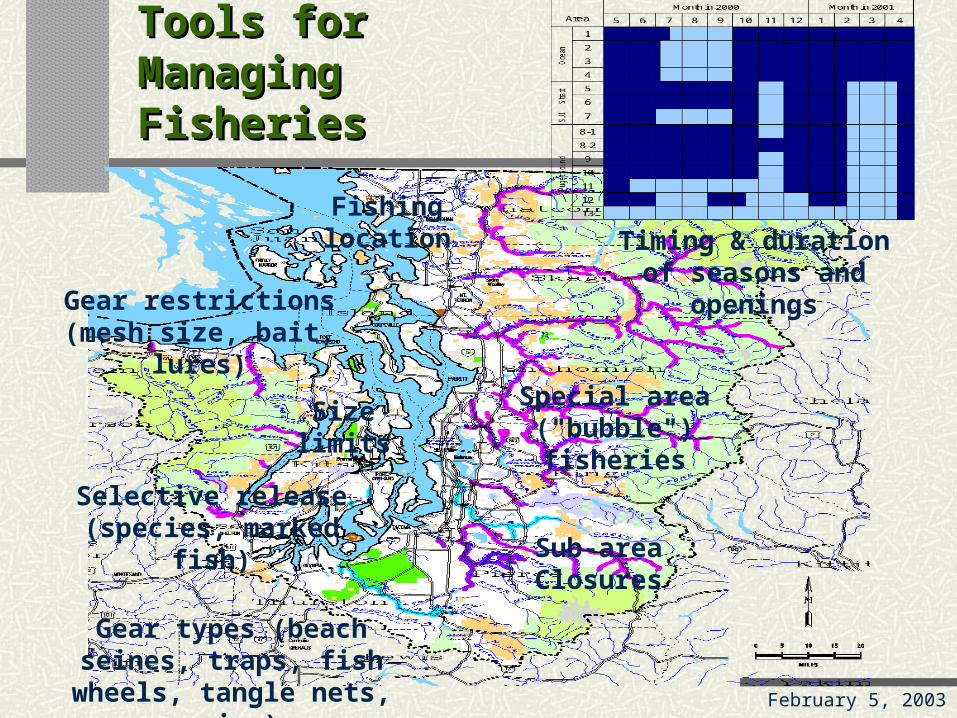
Tools for Tools for Managing Managing FisheriesFisheries
Fishing location Timing & duration
of seasons and openings
Sub-area Closures
Special area ("bubble") fisheries
Size limits
Gear restrictions (mesh size, bait,
lures)
Selective release (species, marked
fish)
Gear types (beach seines, traps, fish
wheels, tangle nets, weirs)
February 5, 2003
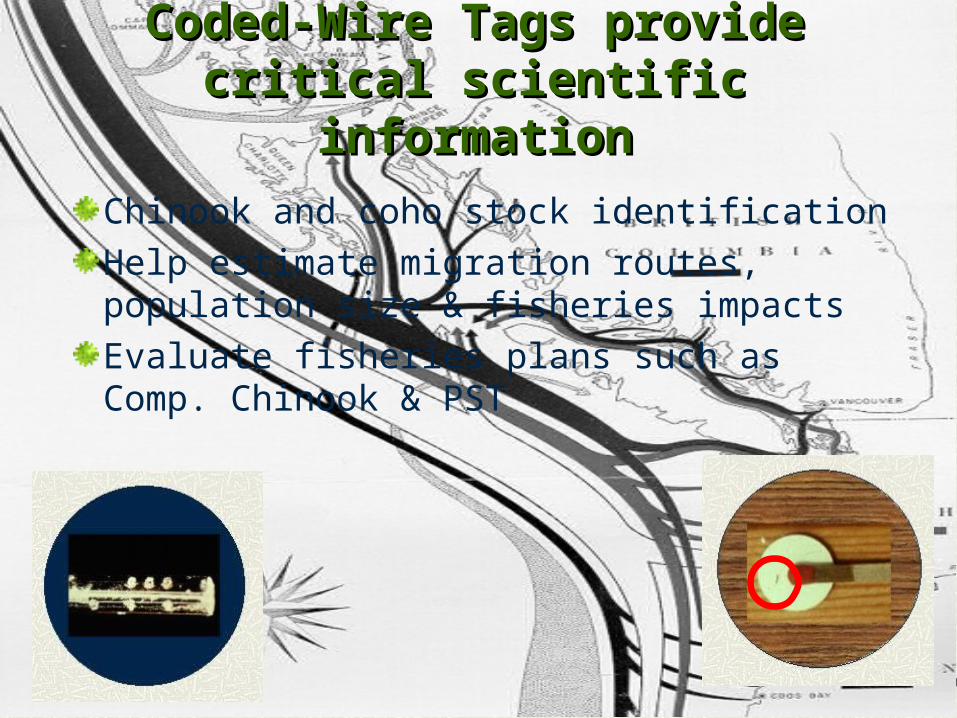
Coded-Wire Tags provide Coded-Wire Tags provide critical scientific critical scientific
informationinformation
Chinook and coho stock identificationHelp estimate migration routes, population size & fisheries impactsEvaluate fisheries plans such as Comp. Chinook & PST
February 5, 2003
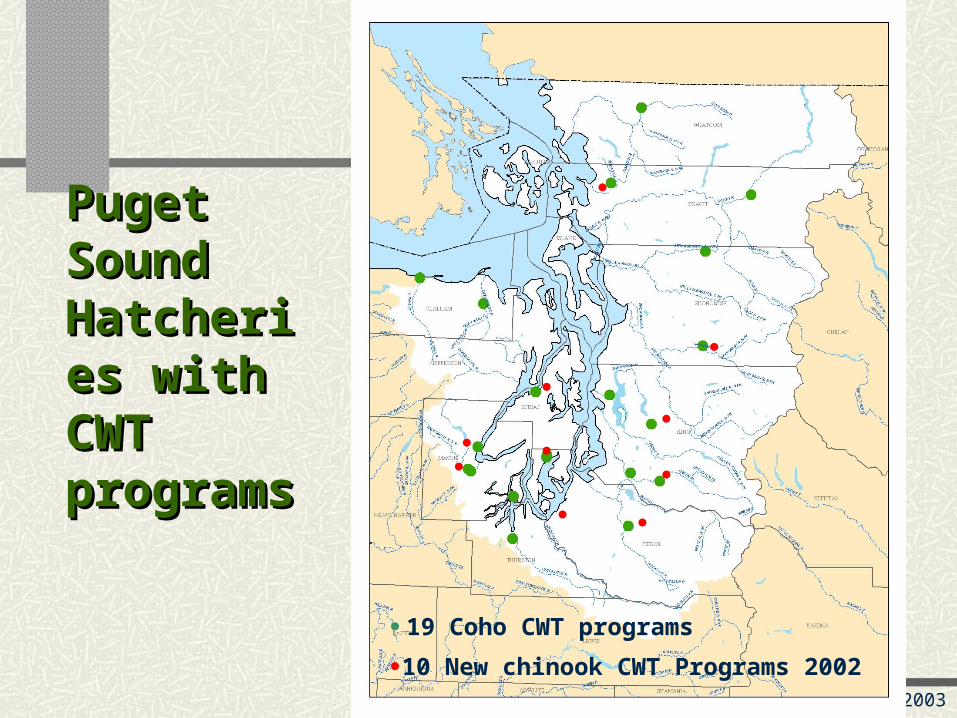
Puget Puget Sound Sound HatcheriHatcheries with es with CWT CWT programprogramss
10 New chinook CWT Programs 2002
19 Coho CWT programs
February 5, 2003
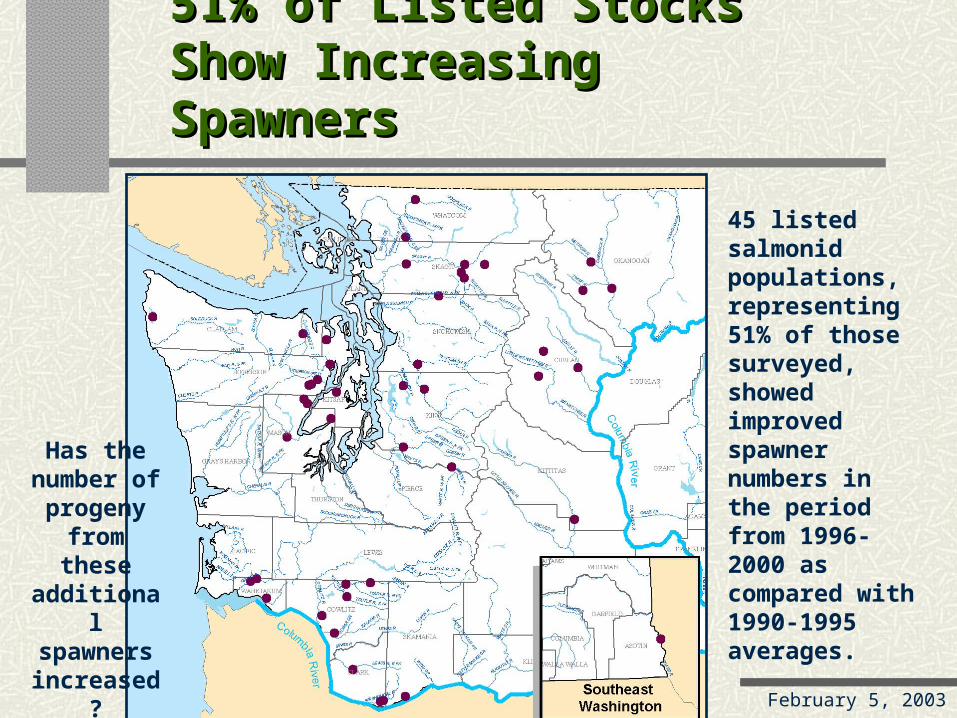
51% of Listed Stocks 51% of Listed Stocks Show Increasing Show Increasing SpawnersSpawners
45 listed salmonid populations, representing 51% of those surveyed, showed improved spawner numbers in the period from 1996-2000 as compared with 1990-1995 averages.
Has the number of progeny
from these
additional spawners increased
?
February 5, 2003
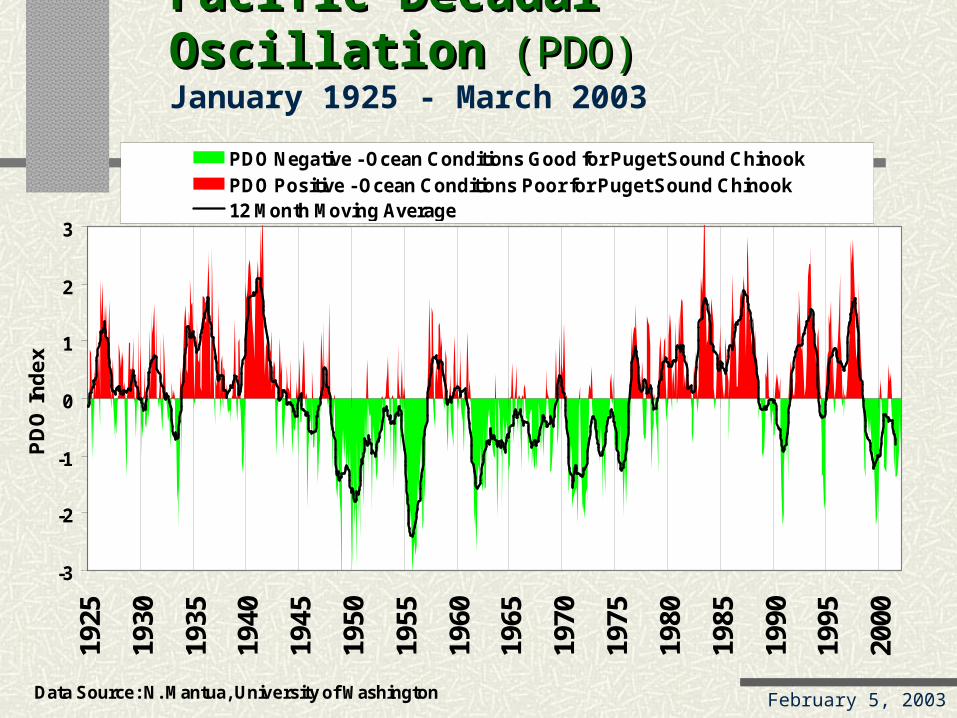
Pacific Decadal OscillationPacific Decadal Oscillation (PDO) (PDO) January 1925 - March 2003
-3
-2
-1
0
1
2
3
1925
1930
1935
1940
1945
1950
1955
1960
1965
1970
1975
1980
1985
1990
1995
2000
PD
O In
de
x
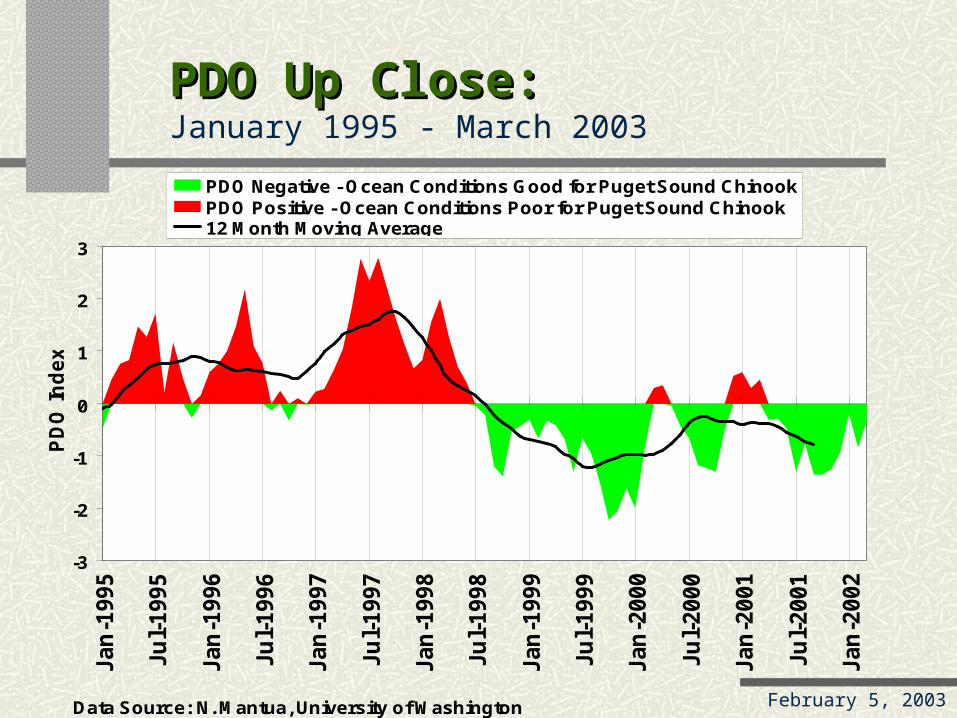
PDO Negative - Ocean Conditions Good for Puget Sound ChinookPDO Positive - Ocean Conditions Poor for Puget Sound Chinook12 Month Moving Average
Data Source: N. Mantua, University of Washington
February 5, 2003
PDO Up Close:PDO Up Close:January 1995 - March 2003
-3
-2
-1
0
1
2
3
Jan
-1995
Ju
l-1995
Jan
-1996
Ju
l-1996
Jan
-1997
Ju
l-1997
Jan
-1998
Ju
l-1998
Jan
-1999
Ju
l-1999
Jan
-2000
Ju
l-2000
Jan
-2001
Ju
l-2001
Jan
-2002
PD
O In
de
x
PDO Negative - Ocean Conditions Good for Puget Sound ChinookPDO Positive - Ocean Conditions Poor for Puget Sound Chinook12 Month Moving Average
Data Source: N. Mantua, University of Washington
February 5, 2003
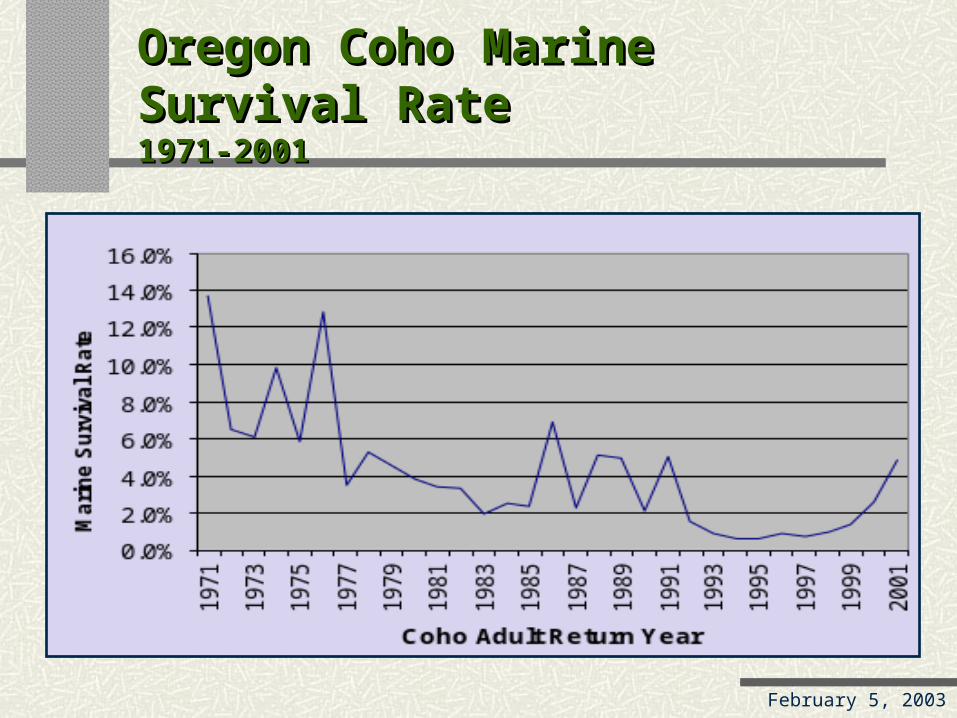
Oregon Coho Marine Oregon Coho Marine Survival RateSurvival Rate1971-20011971-2001
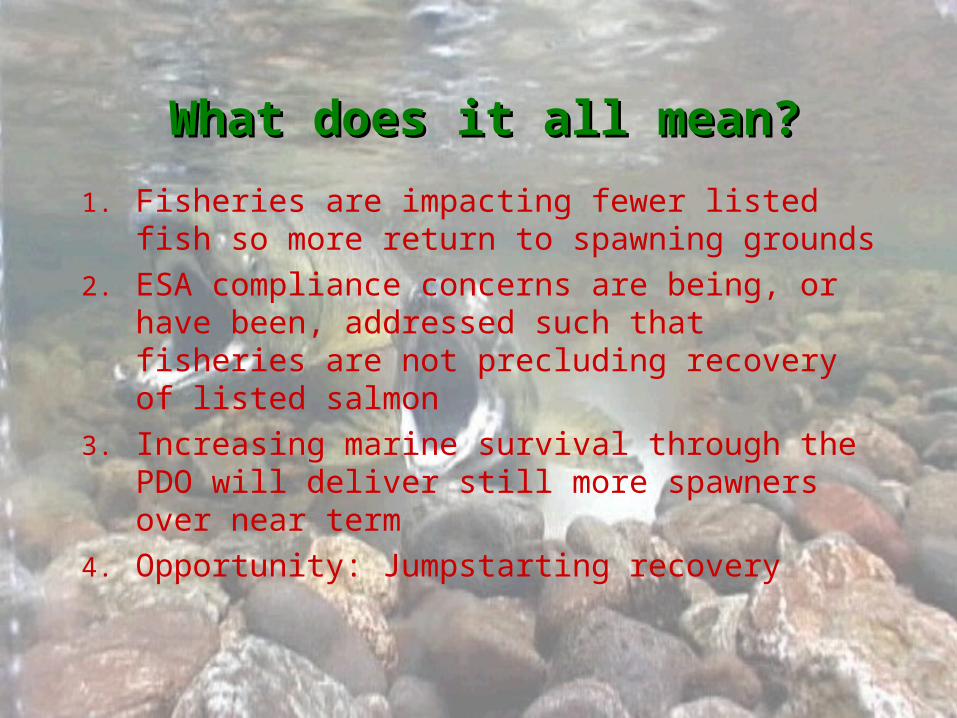
What does it all mean?What does it all mean?
1. Fisheries are impacting fewer listed fish so more return to spawning grounds
2. ESA compliance concerns are being, or have been, addressed such that fisheries are not precluding recovery of listed salmon
3. Increasing marine survival through the PDO will deliver still more spawners over near term
4. Opportunity: Jumpstarting recovery
February 5, 2003
Integrating fisheries Integrating fisheries management into recovery management into recovery planningplanning
Aspects of salmonid life history that are fundamental to how we manage fisheriesHow does the Puget Sound chinook harvest plan work?How does harvest affect recovery?The H's MUST work together!
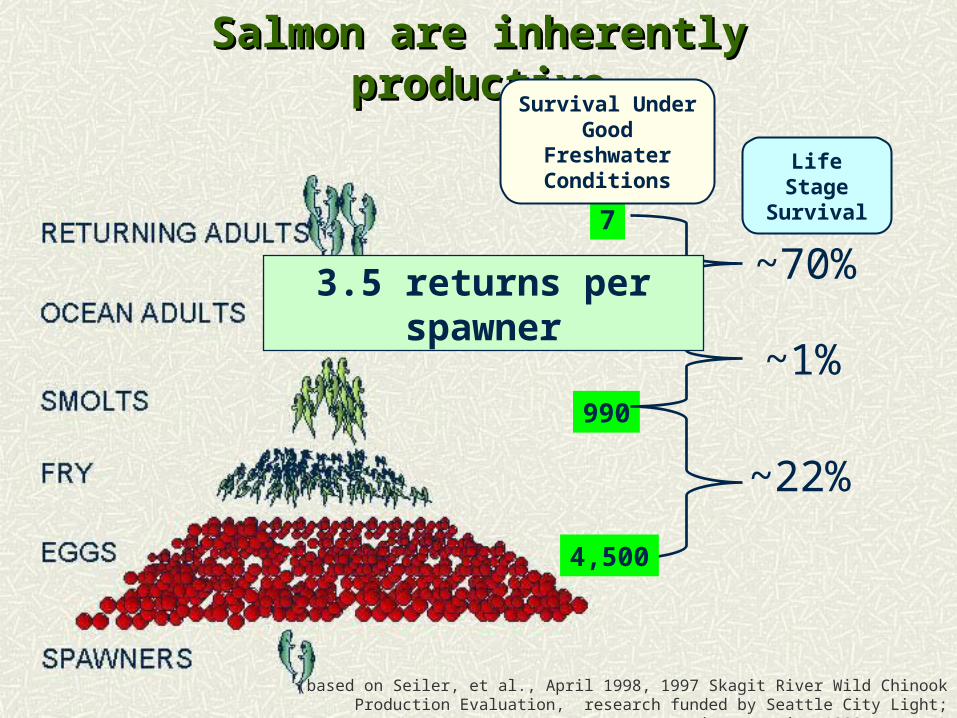
Salmon are inherently Salmon are inherently productiveproductive
10
7
Survival Under Good Freshwater
Conditions
~22%
990
~1%
~70%
(based on Seiler, et al., April 1998, 1997 Skagit River Wild Chinook Production Evaluation, research funded by Seattle City Light; project ongoing 1989-present)
4,500
Life Stage Survival
3.5 returns per spawner

"Capacity" & "Productivity""Capacity" & "Productivity"
Productivity:Proportion of fish that survive from one life
stage to another: e.g., from egg to smolt or
spawner to adult return
Capacity:Number of
spawners that fit into the spawning
habitat
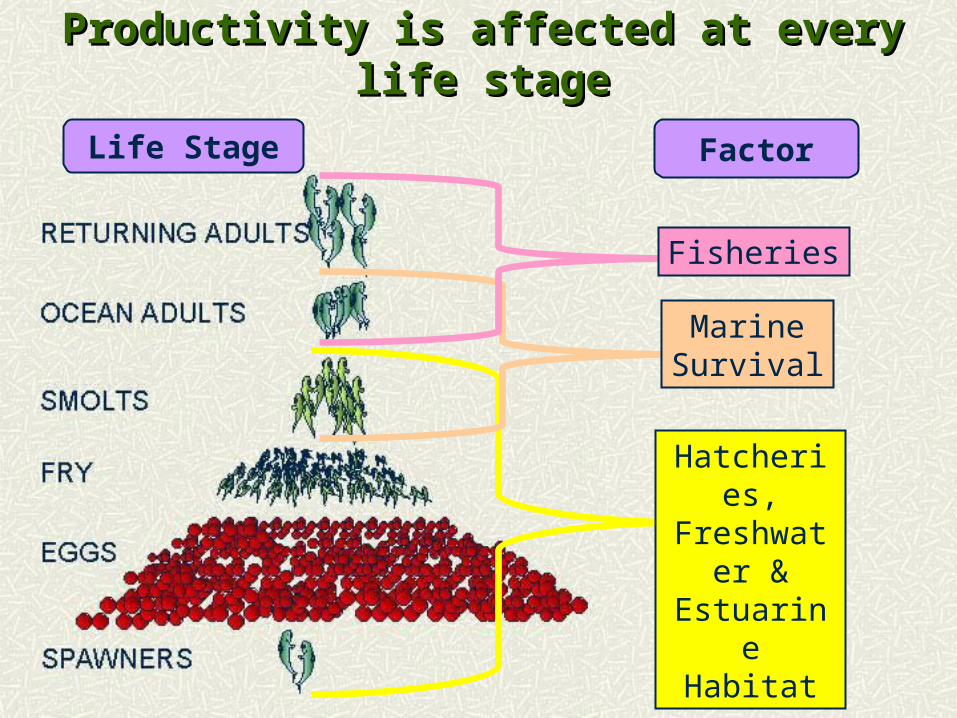
Productivity is affected at every life Productivity is affected at every life stagestage
Life Stage Factor
Hatcheries,Freshwater & Estuarine
Habitat
MarineSurvival
Fisheries

Freshwater conditions have Freshwater conditions have dramatic effects on productivitydramatic effects on productivity
(based on Seiler, et al., April 1998, 1997 Skagit River Wild Chinook Production Evaluation, research funded by Seattle City Light; project ongoing 1989-present)
10
7
Survival Under Good Freshwater
Conditions
~22%
4,500
990
~1%
~70%
~3%
4,500
~1%
<1
135
Poor Freshwater Conditions
Less than 1 return per spawner
Life Stage Survival

Spawners
Retu
rnin
g A
du
lts
1:1 Replacement Line
healthy population
declining population
Harvestable
Salmon populations are Salmon populations are density dependentdensity dependent
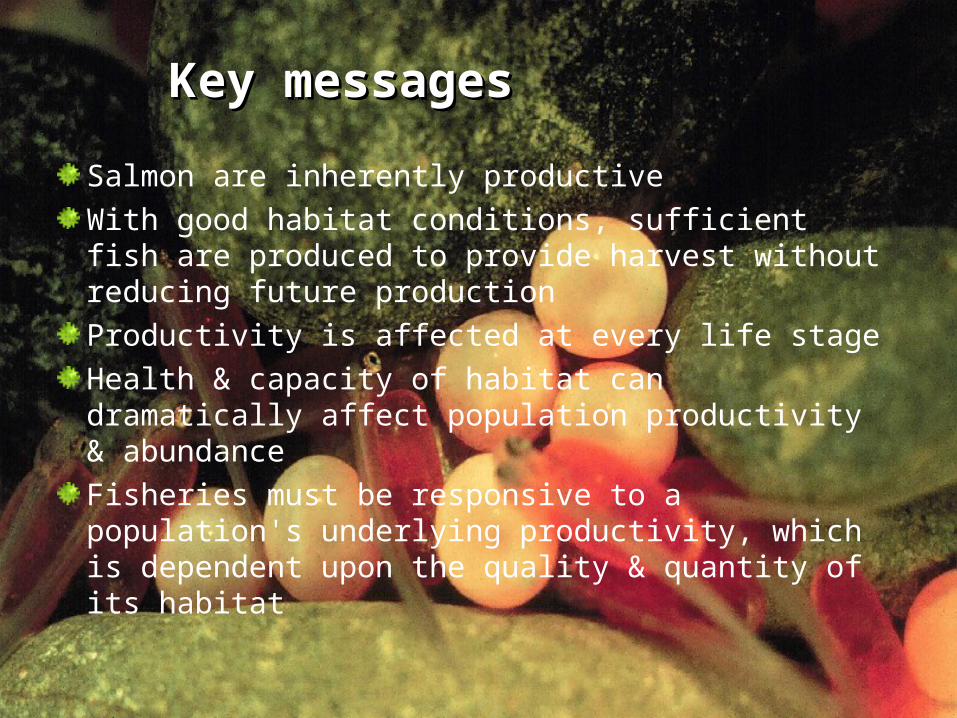
Key messagesKey messages
Salmon are inherently productiveWith good habitat conditions, sufficient fish are produced to provide harvest without reducing future productionProductivity is affected at every life stageHealth & capacity of habitat can dramatically affect population productivity & abundanceFisheries must be responsive to a population's underlying productivity, which is dependent upon the quality & quantity of its habitat
February 5, 2003
What do we mean when we What do we mean when we say “harvest" & "impacts”say “harvest" & "impacts”
Landed CatchFish that die as a result of their encounter with fishing gear:
Hooking mortalityFish dropping out of nets
All fishing-related mortality

February 5, 2003
What do we mean when we What do we mean when we say “harvest" & "impacts”say “harvest" & "impacts”
Each fishery catches fish from many different streamsImpacts are examined at the scale of the population
E.g. Skagit coho impacts differentiated from Hood Canal coho impacts
Impacts are examined throughout migration (Alaska, Canada, southern U.S. coast, Puget Sound, instream)
February 5, 2003
Puget Sound Chinook Puget Sound Chinook Harvest PlanHarvest Plan
To ensure that harvest does not impede recovery, need a plan that …
… Ensures sufficient spawners to maintain population stability, given current habitat productivity… Sets maximum allowable recovery harvest rates
Plan must allow populations to expand as habitat improves

February 5, 2003
Puget Sound Chinook Harvest Puget Sound Chinook Harvest Plan Plan Hypothetical Puget Sound Chinook Stock
Pro
po
rtio
n o
f ad
ult
po
pu
lati
on
har
vest
ed
Extreme low abundanceMax. fishery restrictions
Low abundance threshold
Number of Spawners
February 5, 2003
Low Abundance ThresholdLow Abundance Threshold
Low abundance threshold safeguards against extremely low numbers of spawners
Ensures sufficient spawner numbers to maintain population stability
Low abundance threshold triggers maximum fishery restrictions
February 5, 2003
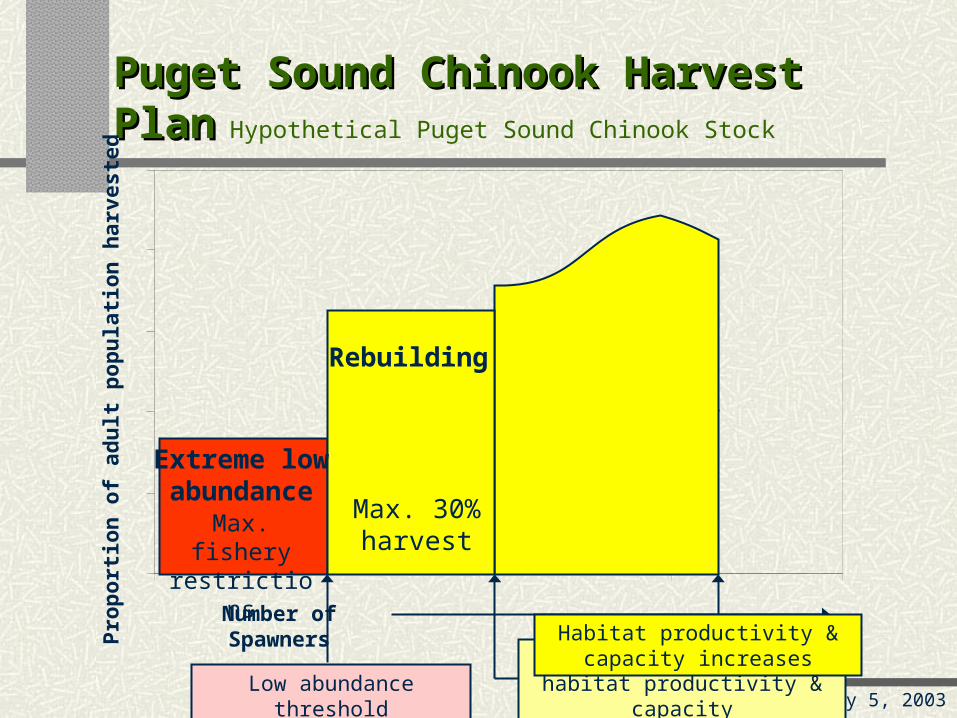
Puget Sound Chinook Harvest Puget Sound Chinook Harvest PlanPlan Hypothetical Puget Sound Chinook StockP
rop
ort
ion
of
adu
lt p
op
ula
tio
n h
arve
sted
Rebuilding
Extreme low abundance
Max. 30% harvest
Max. fishery restrictions
Low abundance thresholdCurrent estimate of habitat
productivity & capacity
Number of SpawnersHabitat productivity & capacity
increases
February 5, 2003
Maximum harvest rates Maximum harvest rates during recovery …during recovery …
Provide sufficient spawners to take advantage of improving quality & quantity of habitat, & ...
Avoid risk of stock instability by employing population size (abundance) thresholds
Provide sufficient spawners to enable recovery even during worst-case marine survivals

February 5, 2003
Puget Sound Chinook Harvest Puget Sound Chinook Harvest PlanPlan Hypothetical Puget Sound Chinook StockP
rop
ort
ion
of
adu
lt p
op
ula
tio
n h
arve
sted
Rebuilding
Extreme low abundance Max. ?%
harvestMax. 30%
harvestMax. fishery restrictions
Recovered
Low abundance thresholdCurrent estimate of habitat
productivity & capacity
Number of SpawnersHabitat productivity & capacity
increases
Recovery is achieved
February 5, 2003
0%
25%
50%
75%
100%
1983 2000
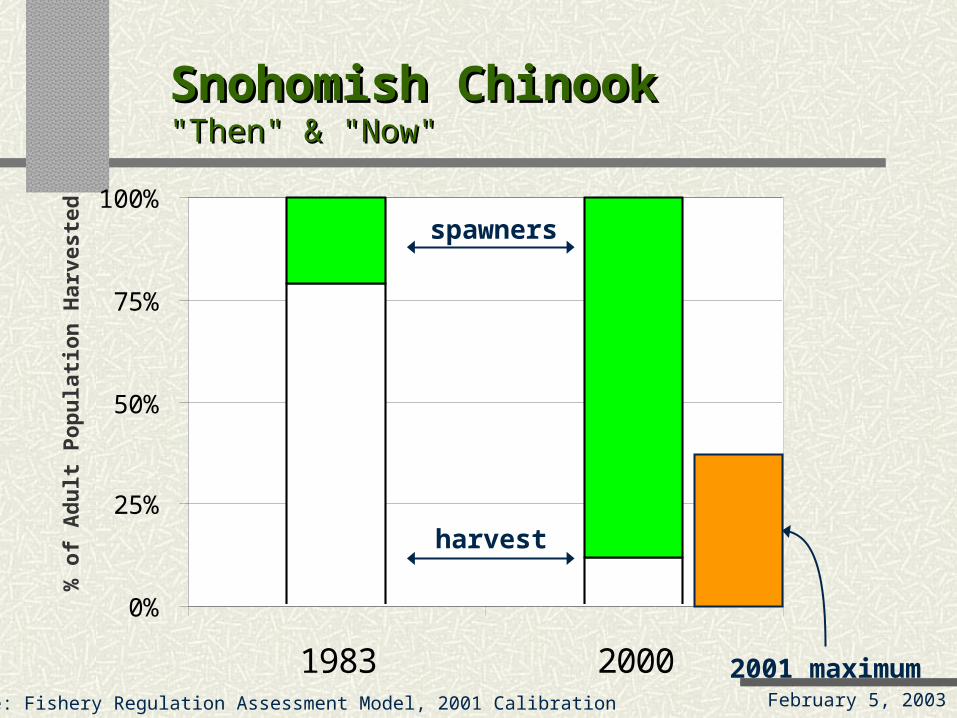
Snohomish ChinookSnohomish Chinook"Then" & "Now""Then" & "Now"
Source: Fishery Regulation Assessment Model, 2001 Calibration
spawners
harvest
2001 maximum
% o
f A
du
lt P
op
ula
tio
n H
arve
sted

February 5, 2003
Current harvest plan provides Current harvest plan provides for recovery of wild salmon …for recovery of wild salmon …
Ensures sufficient spawners to maintain population stabilityEnsures sufficient spawners to take advantage of improving habitat during recoveryAvoids risk of stock instability by employing abundance thresholdsAccounts for all fishing-related impacts across all fisheriesIncorporates uncertainty in data & the environment, & minimizes risk
February 5, 2003
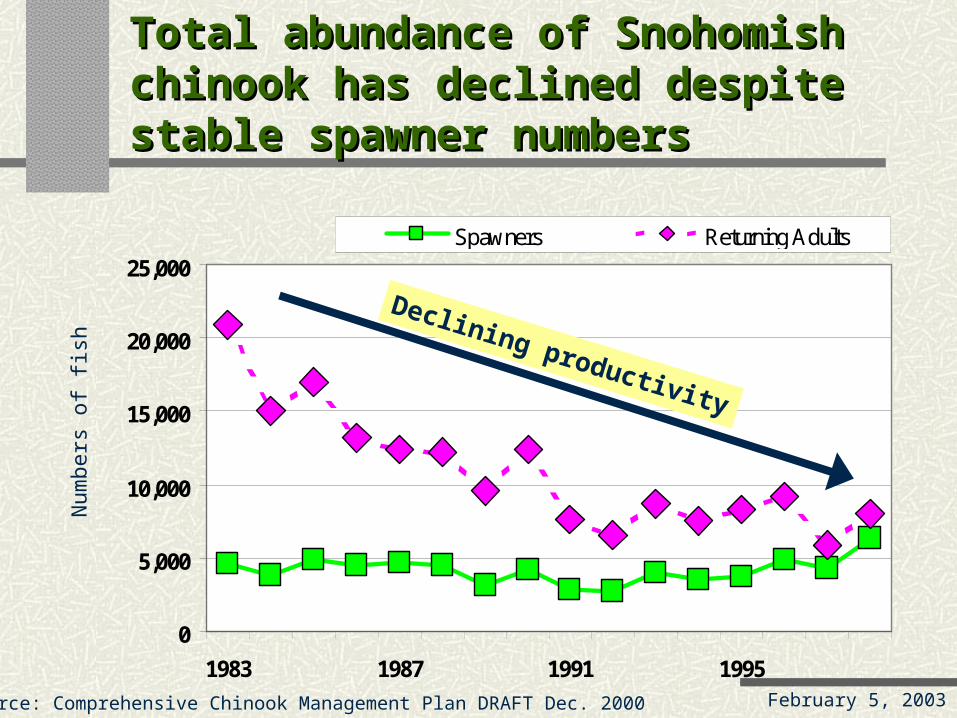
Total abundance of Snohomish Total abundance of Snohomish chinook has declined despite chinook has declined despite stable spawner numbersstable spawner numbers
0
5,000
10,000
15,000
20,000
25,000
1983 1987 1991 1995
Spawners Returning Adults
Source: Comprehensive Chinook Management Plan DRAFT Dec. 2000
Num
bers
of f
ish
Declining productivity
February 5, 2003
photophoto
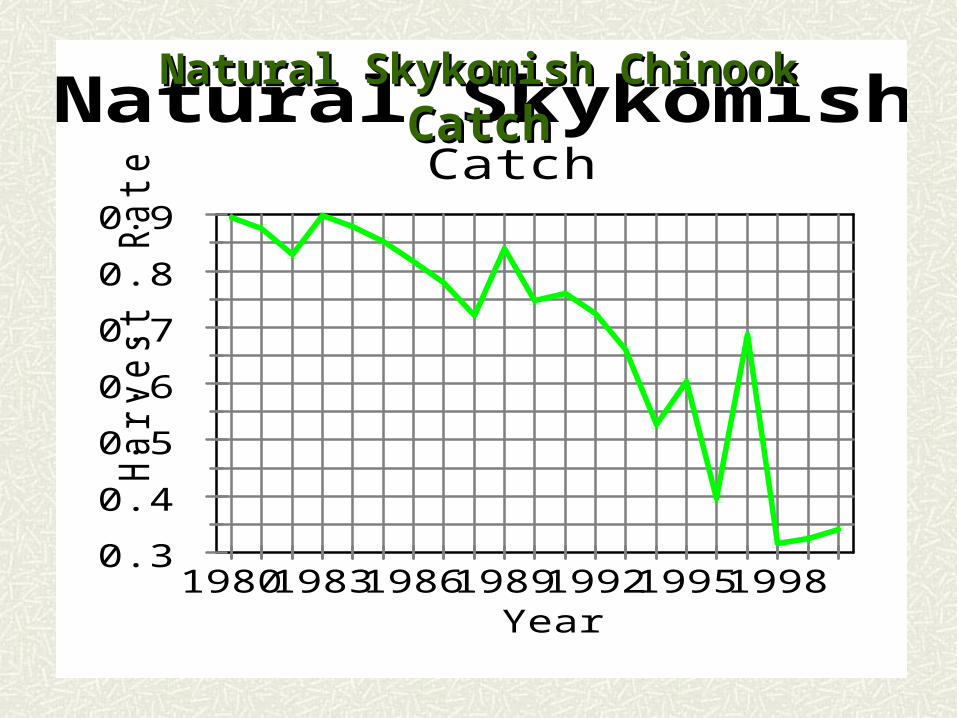
0.3
0.4
0.5
0.6
0.7
0.8
0.9
Harv
est R
ate
1980198319861989199219951998Year
Natural Skykomish ChinookCatch
Natural Skykomish ChinookNatural Skykomish ChinookCatchCatch
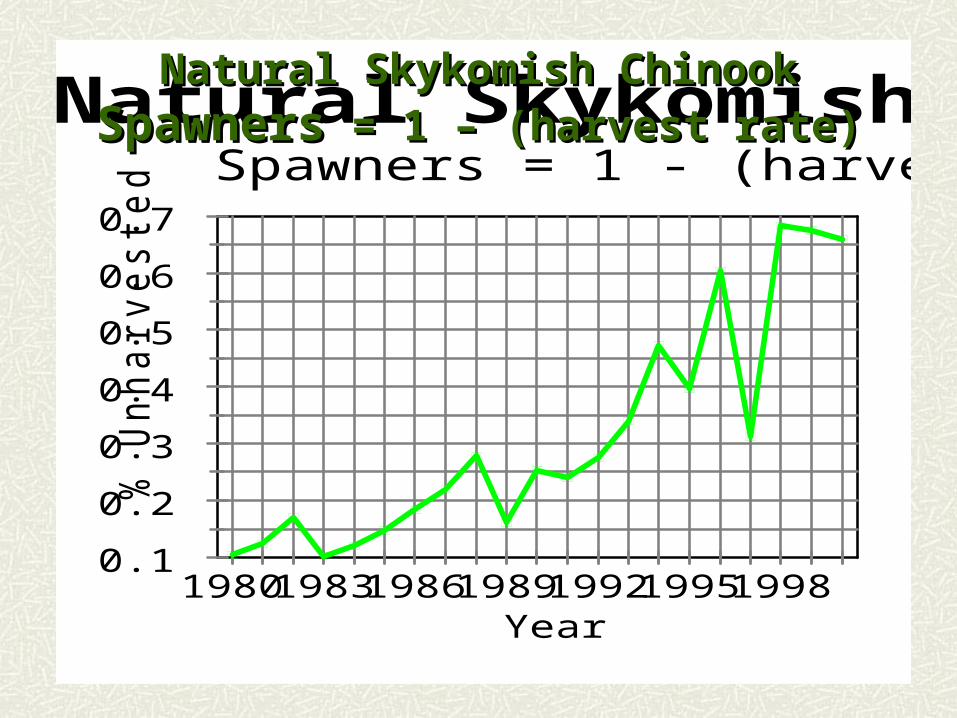
0.1
0.2
0.3
0.4
0.5
0.6
0.7
% U
nharv
este
d
1980198319861989199219951998Year
Natural Skykomish ChinookSpawners = 1 - (harvest rate)
Natural Skykomish ChinookNatural Skykomish ChinookSpawnersSpawners = 1 – (harvest rate) = 1 – (harvest rate)
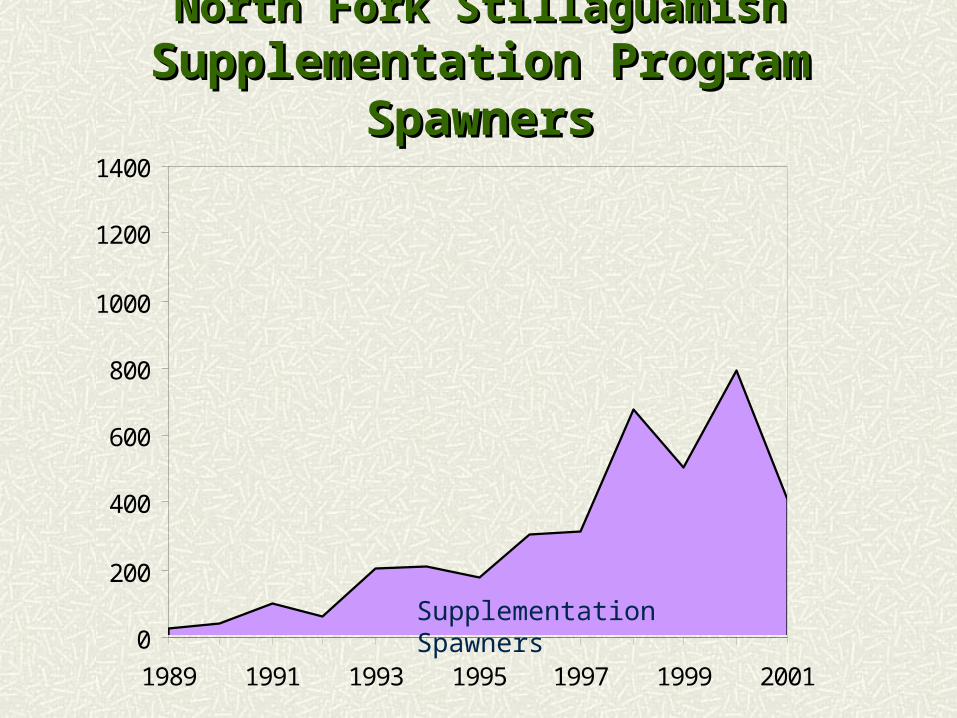
North Fork StillaguamishNorth Fork StillaguamishSupplementation Program Supplementation Program
SpawnersSpawners
0
200
400
600
800
1000
1200
1400
1989 1991 1993 1995 1997 1999 2001
Supplementation Spawners
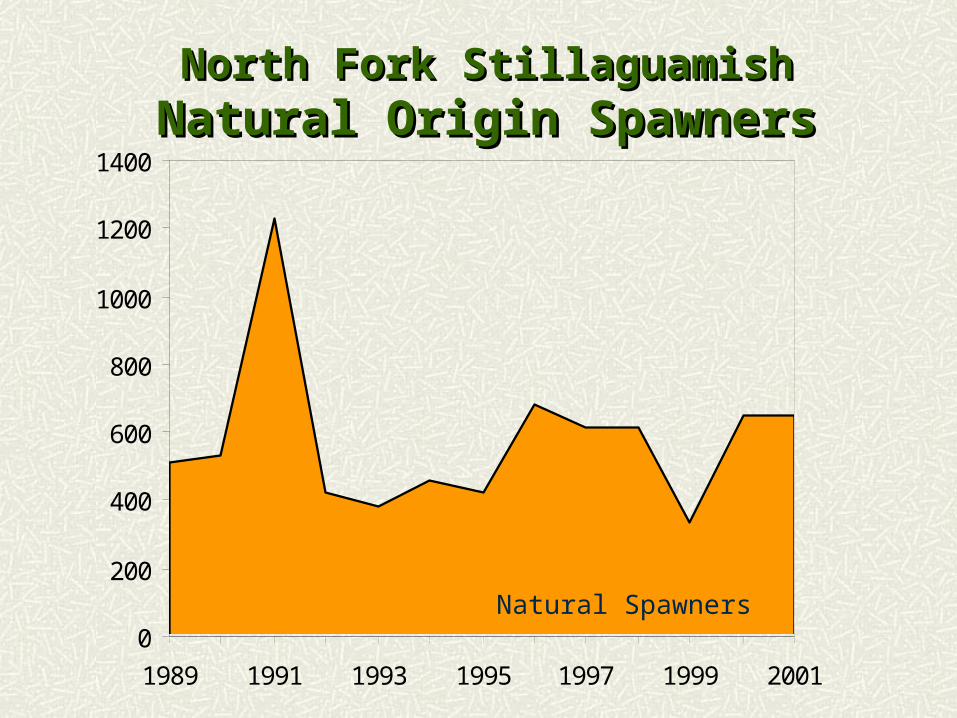
0
200
400
600
800
1000
1200
1400
1989 1991 1993 1995 1997 1999 2001
North Fork StillaguamishNorth Fork StillaguamishNatural Origin SpawnersNatural Origin Spawners
Natural Spawners
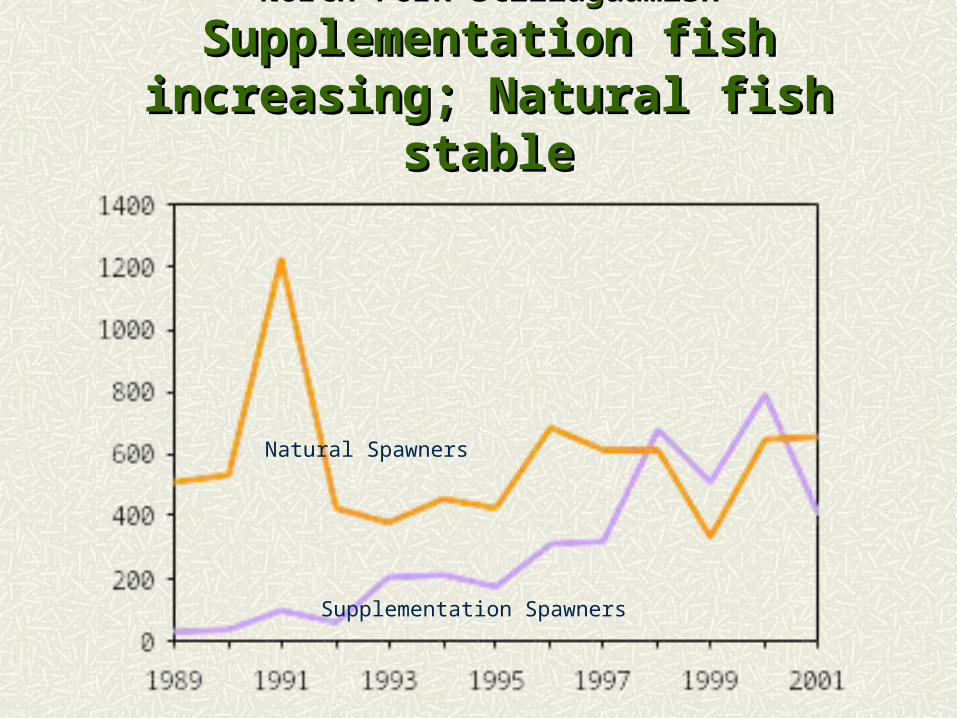
North Fork StillaguamishNorth Fork Stillaguamish
Supplementation fish Supplementation fish increasing; Natural fish increasing; Natural fish
stablestable
Natural Spawners
Supplementation Spawners
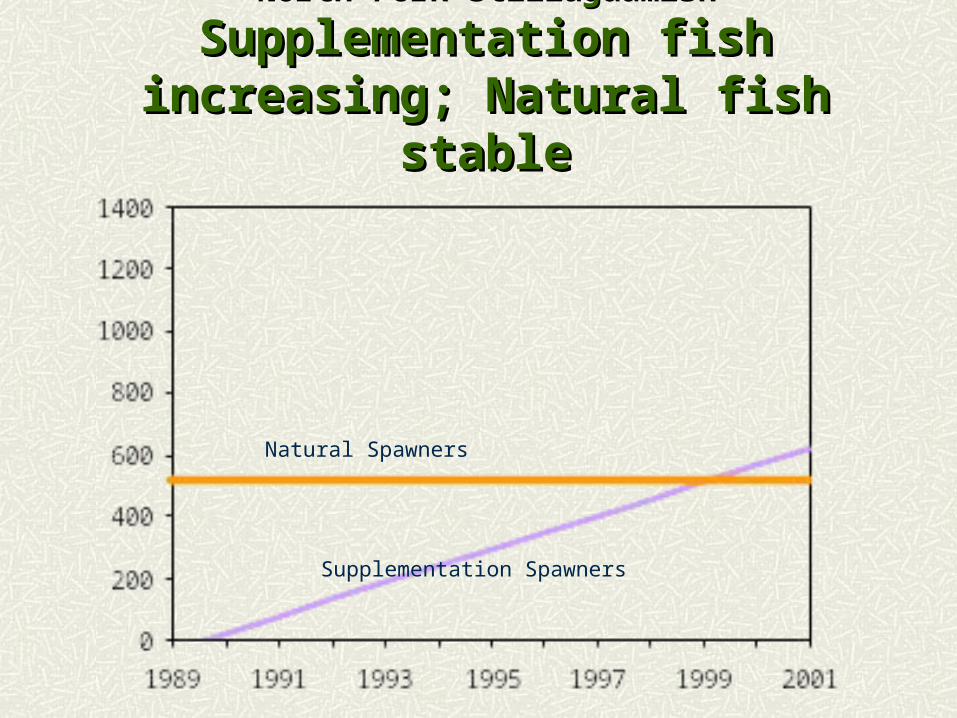
North Fork StillaguamishNorth Fork Stillaguamish
Supplementation fish Supplementation fish increasing; Natural fish increasing; Natural fish
stablestable
Natural Spawners
Supplementation Spawners

North Fork SkykomishNorth Fork SkykomishBull Trout ReddsBull Trout Redds
Num
ber
of
redds
0
100
200
300
400
500
600
1988
1989
1990
1991
1992
1993
1994
1995
1996
1997
1998
1999
2000
2001
2002
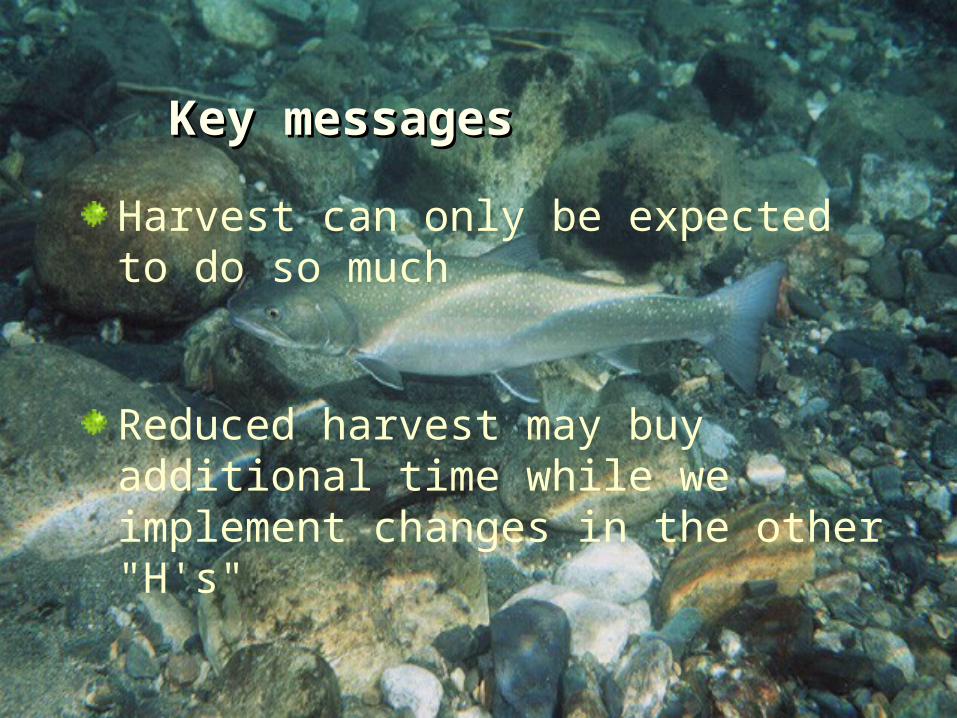
Key messagesKey messages
Harvest can only be expected to do so much
Reduced harvest may buy additional time while we implement changes in the other "H's"
February 5, 2003
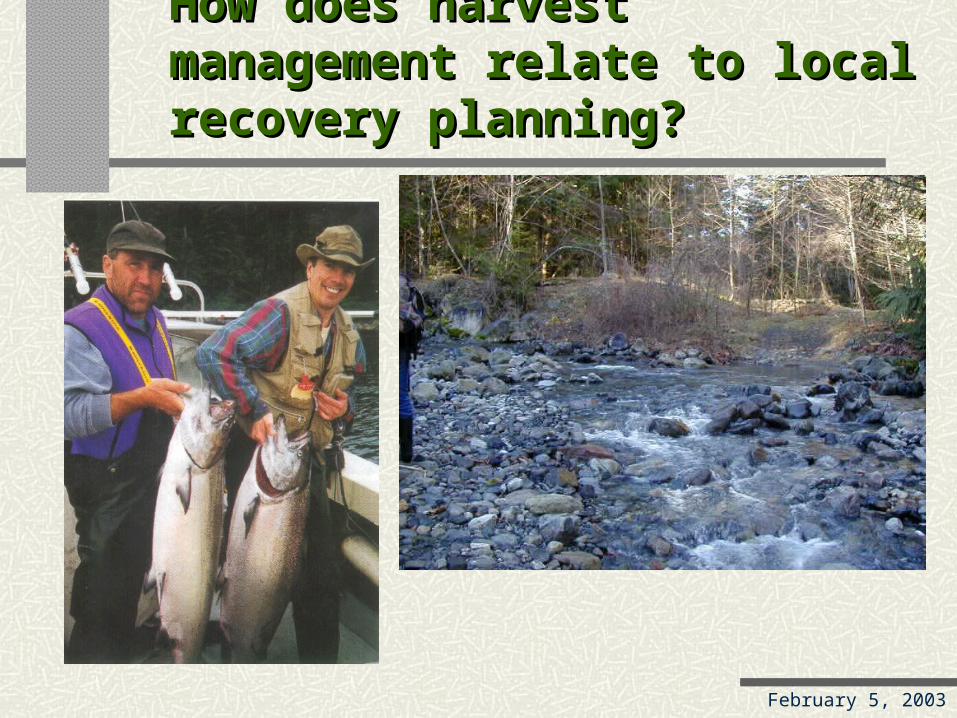
How does harvest How does harvest management relate to local management relate to local recovery planning?recovery planning?

February 5, 2003
Frequently asked Frequently asked questionsquestions
Why should I cut back on
fishing when there isn’t any
decent place in the river for the
fish to go to anyway?

February 5, 2003
Frequently asked Frequently asked questionsquestions
Why should I leave a buffer
when they aren’t letting any fish
through the nets to use the river
anyway?

February 5, 2003
How do harvest and habitat How do harvest and habitat management work together for management work together for recovery?recovery?
Habitat condition determines height of the production curveHarvest determines where you are on the production curve
Both must be managed for recovery to happen
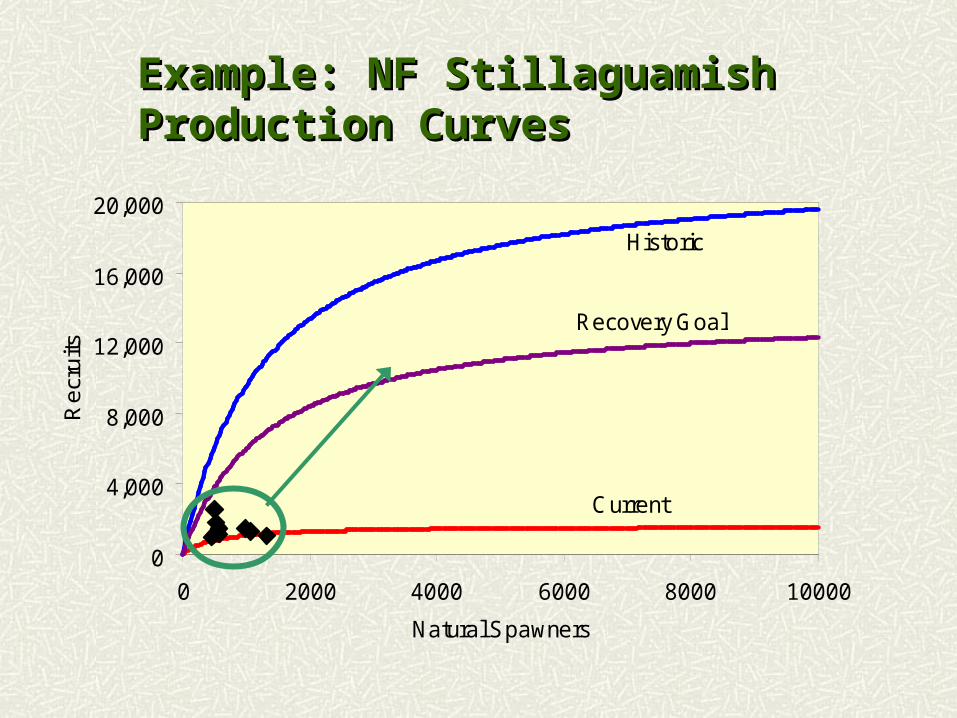
Example: NF Stillaguamish Example: NF Stillaguamish Production CurvesProduction Curves
0
4,000
8,000
12,000
16,000
20,000
0 2000 4000 6000 8000 10000
Natural Spawners
Re
cru
its
Historic
Recovery Goal
Current
February 5, 2003
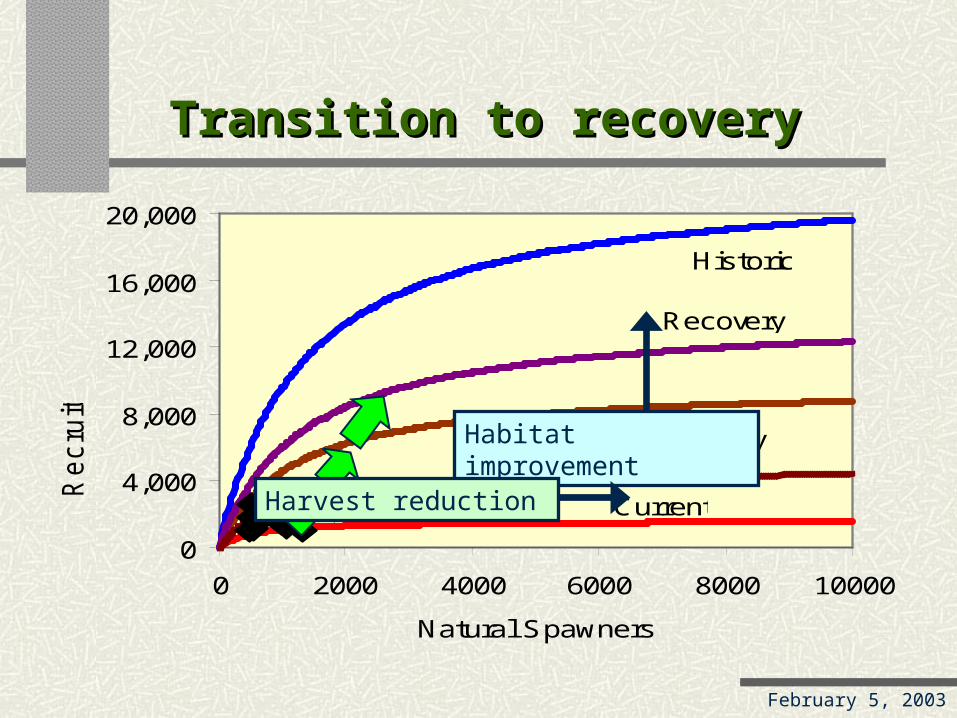
Transition to recoveryTransition to recovery
0
4,000
8,000
12,000
16,000
20,000
0 2000 4000 6000 8000 10000
Natural Spawners
Recru
its
Historic
Recovery
Current
Recovery Habitat improvement
Harvest reduction

February 5, 2003
How do harvest and hatchery How do harvest and hatchery management work together for management work together for recovery?recovery?
Hatchery production can:Maintain fishing opportunitySubstitute for wild fish and therefore reduce harvest of wild fishHelp “jump-start” depressed runs
Hatchery fish must not:Contribute to increased harvest of wild fishOverpopulate limited natural habitat
Therefore: Hatchery/Harvest/Habitat plans must be coordinated
February 5, 2003
Example: Snohomish Example: Snohomish hatchery chinookhatchery chinook
Problem: Low harvest rates lead to high abundance of hatchery fish in river.Solution: Provide selective harvest opportunity on hatchery fish.
Mark all hatchery fish with adipose finclipAllow harvest of marked fish only in limited time and area where hatchery fish predominate
Coordinated management plan must:Account for impacts to wild fishAssure enough hatchery fish pass through to perpetuate hatchery run

February 5, 2003
Example: Tulalip hatchery Example: Tulalip hatchery chinookchinook
Problem: Declining wild runs threaten traditional tribal fisheriesSolution: Provide concentrated return of hatchery fish to Tulalip Bay
Time and area fishery management
Coordinated management plan needs
Account for impacts to wild fish
February 5, 2003
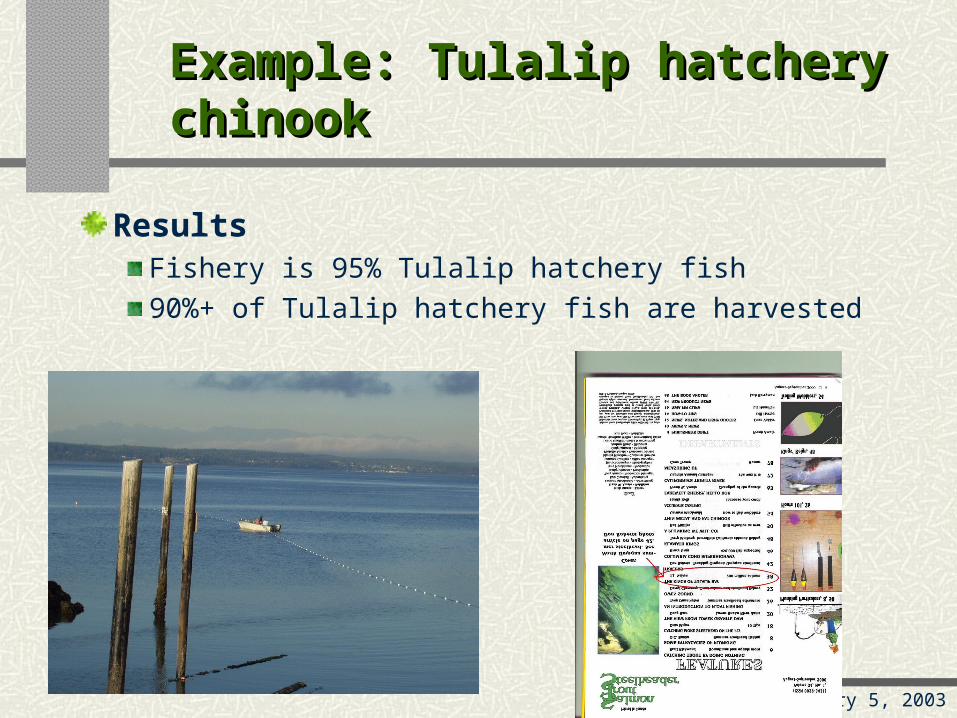
Example: Tulalip hatchery Example: Tulalip hatchery chinookchinook
Results Fishery is 95% Tulalip hatchery fish90%+ of Tulalip hatchery fish are harvested

February 5, 2003
Example: NF Stillaguamish Example: NF Stillaguamish supplementationsupplementation
Problem: Poor productivity suggests Stillaguamish chinook need a “jump start”Solution: Provide hatchery production that can return to natural spawning areasCoordinated management plan needs
Harvest rates on these hatchery fish are kept low – they are not markedAdjust program level appropriate for available habitatScale back program when natural productivity improves

All H’s contribute to All H’s contribute to recovery but at different recovery but at different time scalestime scales
YEARS
POPU
LA
TIO
N S
IZE
DECLINE
STABILIZATION
RECOVERY
Harvest reduction
Habitat improvement
Habitat improvementeffect
Harvest reduction effect
February 5, 2003
The “H’s” work togetherThe “H’s” work together
Harvest plan designed to not impede recoveryHabitat protection and restoration facilitate recoveryHatchery programs do bothA recovery plan must integrate the “H’s”Don’t be fooled by marine survival fluctuations
Jon. Anderson
WDFW Archives
Debbie Preston
For information, contact:
Mike Grayum,
NWIFCCurt
Kraemer, WDFW
Kit Rawson, Tulalip Tribes