Embed Size (px)
Citation preview

February 8, 2017 Atkins North America, Inc. 7604 Technology Way, Suite 400 Denver, Colorado 80237 Attention: Mr. Matt Aguirre, PE Transportation Engineer Subject: Life Cycle Cost Analysis, North I-25 Reconstruction Project – Rural Configuration
from South of Crossroads Boulevard to North of State Highway 392, Larimer County, Colorado, CDOT Project No. IM 0253-255(21506), RockSol Project Number 292.05
Dear Mr. Aguirre:
RockSol Consulting Group, Inc. (RockSol) has performed a Life Cycle Cost Analysis (LCCA) for the subject project as part of the pavement design evaluation. Per Section 13.2 of the 2017 CDOT ME Pavement Design Manual (PDM), a Life Cycle Cost Analysis (LCCA) comparing asphalt and concrete should be prepared for all surface treatment projects with more than $2,000,000 initial pavement cost where both pavement types are considered feasible alternatives as determined by the CDOT Regional Materials Engineer. This LCCA is based on planned reconstruction (new pavement) for northbound and southbound I-25 between approximate Mile Post (MP) 258.0 to MP 263.3, located just south of Crossroads Boulevard and North of State Highway (SH) 392, (Project Station No. 3490+71 to 3770+00). This LCCA does not include I-25 pavement sections for the Crossroads Ramps Project currently under construction. Table 1 lists the approximate widths and lengths by I-25 Station No. based on the typical sections provided in the project plans where new pavement is proposed in the rural configuration project limits.
Table 1 – EIS/Rural Configuration Project Area Description
Project Station No. Width (ft) Length (ft) Area (SF) Area (SY)
3490+71 to 3508+14 152 1712 260224 28913.8
3508+14 to 3522+72 152 1458 221616 24624.0
3522+72 to 3533+22 152 1050 159600 17733.3
3533+22 to 3553+81 and 3561+40 to 3588+37 (Note 1)
12 4756 57072 6341.3
3588+37 to 3596+59 76 822 62472 6941.3
3604 to 3767+16 130 16316 2121080 235675.6
3767+16 to 3770 124 284 35216 3912.9
Total 2,917,280 324,142
NOTE 1: Does not include pavement for the Crossroads Ramps Project currently under construction.
For this project, two pavement types were considered for the LCCA; rigid pavement consisting of portland cement concrete pavement (PCCP) and flexible pavement consisting of hot mix asphalt (HMA) and stone matrix asphalt (SMA). An Annual Growth Rate of 2.6 percent was used for pavement thickness designs. A summary of evaluated pavement sections is presented in Table 2.

Life Cycle Cost Analysis North I-25 Project, Rural Configuration
CDOT Project No. IM 0253-255 (Project Code 21506) CDOT Region 4, Larimer County, Colorado
RockSol Project No. 292.05 2 February 8, 2017
Table 2 – Evaluated Pavement Section Summary (Rural Configuration Limits) North I-25 Mainline Rural Configuration
Station and Mile Post
Full Depth Pavement Section (20 year SMA/HMA and 30 Year PCCP)
Station No. 3490+71 to 3716+00 MP 258.0 to MP 262.3
(Does not include pavement for the Crossroads Ramps Project Currently
Under Construction)
SMA over HMA (inches)
ABC (inches)
R-40 (inches)
13.0 6.0 24
PCCP (inches)
ABC (inches)
R-40 (inches)
14.0 6.0 24
Station No. 3716+00 to 3770+00 MP 262.3 to MP 263.3
SMA over HMA (inches)
ABC (inches)
R-40 (inches)
13.0 6.0 24
PCCP (inches)
ABC (inches)
R-40 (inches)
13.5 6.0 24
HMA = Hot Mix Asphalt Pavement (3 inches of SMA over 10 inches of HMA). PCCP = Portland Cement Concrete Pavement. ABC = CDOT Class 6 Aggregate Base Course. R-40 = R-Value of subgrade material for the minimum designed depth beneath ABC.
All PCCP pavement sections presented in Table 2 include ¼ inch allowance for future diamond grinding.
This LCCA is based on phasing for the initial pavement construction to be completed off the outside shoulder of northbound I-25, then traffic will be shifted onto the newly constructed pavement so new pavement can be constructed for the proposed southbound I-25 configuration. RockSol understands that two lanes of traffic will be required to remain open for northbound and southbound I-25 during construction for this project. Initial pavement construction near overpasses will be governed by the construction phasing of the proposed bridge structures within the limits of the LCCA site. The estimated length of time for pavement construction is estimated to be significantly less than the estimated length of time for the construction of the proposed bridge structures planned for this project. The proposed construction phasing schedule was not developed at the time of this LCCA.
Based on recent construction projects and traffic control permitting requirements for Region 4 along I-25, a workzone speed limit of 65 miles per hour (mph) and a workzone length of 5.3 miles (full project limit) was used for initial construction for long term traffic control purposes and a workzone speed limit of 55 mph and a workzone length of 2 miles was used for rehabilitation construction for short term operations.
LCCA Input Summary
The LCCA was performed using a 40-year analysis period and a 30-year initial design period for rigid pavement, assuming an initial/base construction year of 2020. Based on Section 13.3.3 of the 2017 CDOT ME PDM, a triangular distribution with the most likely value of 27 years (2047) was used for the first rigid pavement rehabilitation cycle. The rigid pavement rehabilitation analysis included a ½ percent slab replacement in the travel lanes and 100 percent diamond grinding of ¼ inch and longitudinal and transverse joint resealing.
Life Cycle Cost Analysis North I-25 Project, Rural Configuration
CDOT Project No. IM 0253-255 (Project Code 21506) CDOT Region 4, Larimer County, Colorado
RockSol Project No. 292.05 3 February 8, 2017
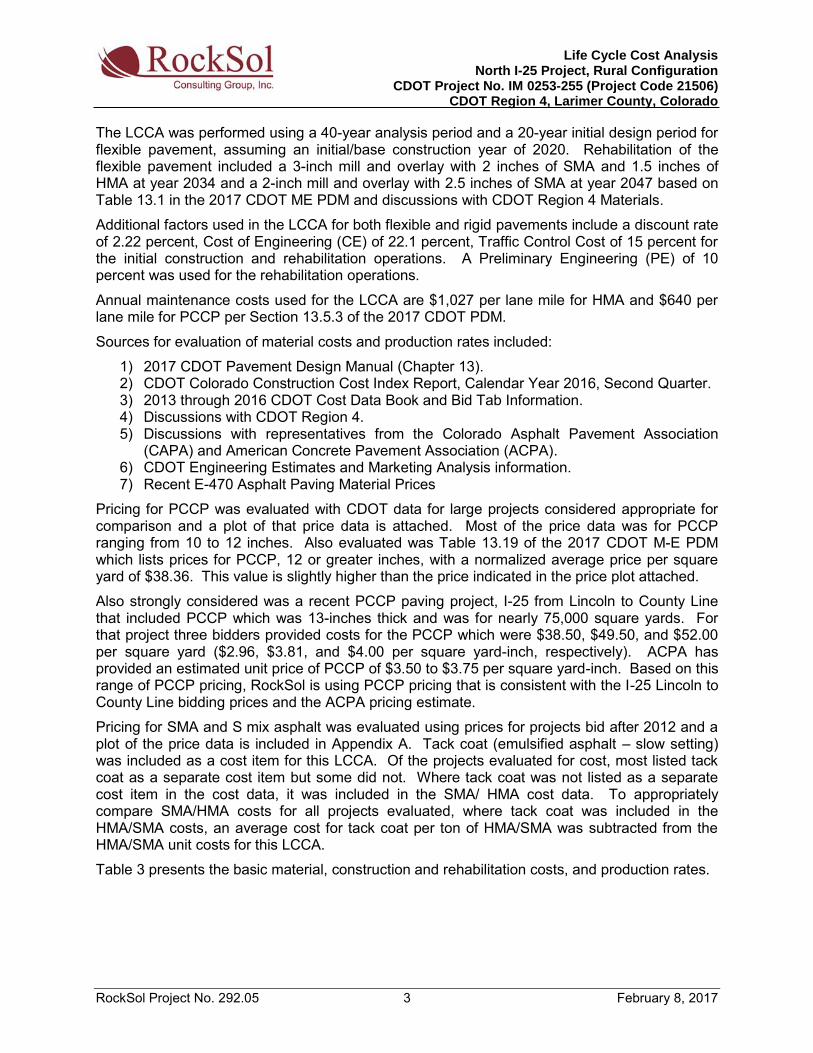
The LCCA was performed using a 40-year analysis period and a 20-year initial design period for flexible pavement, assuming an initial/base construction year of 2020. Rehabilitation of the flexible pavement included a 3-inch mill and overlay with 2 inches of SMA and 1.5 inches of HMA at year 2034 and a 2-inch mill and overlay with 2.5 inches of SMA at year 2047 based on Table 13.1 in the 2017 CDOT ME PDM and discussions with CDOT Region 4 Materials.
Additional factors used in the LCCA for both flexible and rigid pavements include a discount rate of 2.22 percent, Cost of Engineering (CE) of 22.1 percent, Traffic Control Cost of 15 percent for the initial construction and rehabilitation operations. A Preliminary Engineering (PE) of 10 percent was used for the rehabilitation operations.
Annual maintenance costs used for the LCCA are $1,027 per lane mile for HMA and $640 per lane mile for PCCP per Section 13.5.3 of the 2017 CDOT PDM.
Sources for evaluation of material costs and production rates included:
1) 2017 CDOT Pavement Design Manual (Chapter 13). 2) CDOT Colorado Construction Cost Index Report, Calendar Year 2016, Second Quarter. 3) 2013 through 2016 CDOT Cost Data Book and Bid Tab Information. 4) Discussions with CDOT Region 4. 5) Discussions with representatives from the Colorado Asphalt Pavement Association
(CAPA) and American Concrete Pavement Association (ACPA). 6) CDOT Engineering Estimates and Marketing Analysis information. 7) Recent E-470 Asphalt Paving Material Prices
Pricing for PCCP was evaluated with CDOT data for large projects considered appropriate for comparison and a plot of that price data is attached. Most of the price data was for PCCP ranging from 10 to 12 inches. Also evaluated was Table 13.19 of the 2017 CDOT M-E PDM which lists prices for PCCP, 12 or greater inches, with a normalized average price per square yard of $38.36. This value is slightly higher than the price indicated in the price plot attached.
Also strongly considered was a recent PCCP paving project, I-25 from Lincoln to County Line that included PCCP which was 13-inches thick and was for nearly 75,000 square yards. For that project three bidders provided costs for the PCCP which were $38.50, $49.50, and $52.00 per square yard ($2.96, $3.81, and $4.00 per square yard-inch, respectively). ACPA has provided an estimated unit price of PCCP of $3.50 to $3.75 per square yard-inch. Based on this range of PCCP pricing, RockSol is using PCCP pricing that is consistent with the I-25 Lincoln to County Line bidding prices and the ACPA pricing estimate.
Pricing for SMA and S mix asphalt was evaluated using prices for projects bid after 2012 and a plot of the price data is included in Appendix A. Tack coat (emulsified asphalt – slow setting) was included as a cost item for this LCCA. Of the projects evaluated for cost, most listed tack coat as a separate cost item but some did not. Where tack coat was not listed as a separate cost item in the cost data, it was included in the SMA/ HMA cost data. To appropriately compare SMA/HMA costs for all projects evaluated, where tack coat was included in the HMA/SMA costs, an average cost for tack coat per ton of HMA/SMA was subtracted from the HMA/SMA unit costs for this LCCA.
Table 3 presents the basic material, construction and rehabilitation costs, and production rates.

Life Cycle Cost Analysis North I-25 Project, Rural Configuration
CDOT Project No. IM 0253-255 (Project Code 21506) CDOT Region 4, Larimer County, Colorado
RockSol Project No. 292.05 4 February 8, 2017
Table 3 - Material, Construction and Rehabilitation Costs and Production Rates
Operation/Material Production Rate Minimum Cost ($)
Most Likely Cost ($)
Maximum Cost ($)
10-inches - HMA Grading S (100) PG 64-22 (price per ton)
2,200 tons/day (75%) 1,800 tons/day (25%)
60.00 65.00 70.00
3-inches - SMA (Fiber) 1,800 tons/day (75%) 1,500 tons/day (25%)
90.00 95.00 100.00
Tack Coat Material (Emulsified Asphalt – Slow Setting)
(SY)
Performed ahead of paving operations (same day/night)
0.28 0.38 0.48
Rigid Pavement 13.5 to 14.0 inches
(price per SY-in)
5,500 (75%)(SY/day) 2,880 (25%) (SY/day)
[Production rate includes time
required to achieve strength and sealing]
3.25 3.50 3.75
Planing/Milling (HMA) SY 2 days ahead of
paving operations 2.04 2.27 2.50
Rigid Slab Replacement (SY) (includes removal/replacement)
5 Panels per day/night
125 150 175
Grinding Concrete Pavement (SY) 7,040 SY/day 3.00 3.50 4.00
Sawing and Sealing Concrete Joints (linear feet)
10,000 LF/day 2.25 2.75 3.25
The total area for the rural configuration is approximately 324,142 square yards (SY). Using the rigid pavement production rates of 5,500 SY per day for normal production (75 percent of the time) and 2,880 SY per day for lower production (25 percent of the time), the initial construction for the rigid pavement alternative was determined to be 72 days.
A total of 53,483 tons of SMA and 178,278 tons of HMA was determined based the total area and design thicknesses. Tack coat placement was based on total project square yardage, number of lifts for HMA/SMA placement, and an application rate of 0.1 gallons per square yard. Based on 25 percent of the total tons for low production days, 75 percent for normal production days and the production rates listed in Table 3 for SMA and HMA material types, a total of 117 days was determined for initial construction of the flexible pavement alternative.
User costs are included in the LCCA for both pavement alternatives for new pavement construction and for their respective rehabilitation operations. User cost information from the LCCA is attached.
LCCA Output Summary
Based on the results of the LCCA, the probabilistic analysis indicates the rigid pavement option is less costly than the flexible pavement option by a difference of 43.1 percent at the 75 percentile as shown in Table 4. CDOT uses the 75 percentile as the basis for comparison of pavement alternatives. The output results for CDOT User Cost Website and RealCost are included in Appendix B.

Life Cycle Cost Analysis North I-25 Project, Rural Configuration
CDOT Project No. IM 0253-255 (Project Code 21506) CDOT Region 4, Larimer County, Colorado
RockSol Project No. 292.05 5 February 8, 2017
Table 4 – Probabilistic LCCA Results (40 Year Analysis)
Statistics
Alternative 1 – Flexible Pavement Alternative 2 – Rigid Pavement
LCCAOutput: Alternative 1: Agency Cost
LCCAOutput: Alternative 1:
User Cost
Flexible Pavement
Total
LCCAOutput: Alternative 2: Agency Cost
LCCAOutput: Alternative 2:
User Cost
Rigid Pavement
Total
Probability Function
(Thousands) (Thousands) (Thousands) (Thousands) (Thousands) (Thousands)
Minimum 28584.51 373.25 28957.76 20502.24 285.99 20788.23
Maximum 37915.45 539.37 38454.82 25803.83 661.12 26464.95
Mean 33897.50 483.32 34380.82 23547.47 518.42 24065.89
Median 33974.10 485.75 34459.85 23575.63 542.50 24118.13
Standard Deviation 1507.54 24.35 1531.89 929.04 82.81 1011.85
Percentile (5%) 31229.22 441.30 31670.52 22012.52 359.16 22371.69
Percentile (25%) 32942.76 468.74 33411.50 22917.68 458.58 23376.26
Percentile (75%) 34967.31 500.33 35467.65 24198.80 581.57 24780.37
Percentile (95%) 36191.39 518.24 36709.63 25055.22 618.80 25674.03
The cost and duration indicated on the User Cost output sheets are based on the total new pavement area as outlined in Table 1 for EIS/Rural Configuration Project limits. Based on the CDOT User Cost website, user costs for initial and rehabilitation construction operations for the flexible and rigid pavement alternatives are outlined in Table 5.
Table 5 – LCCA User Costs Summary Operation Flexible Pavement Rigid Pavement
Initial Construction (2020) $297,804 $271,926
Rehabilitation 2034 $136,058 ----
Rehabilitation 2047 $158,749 $514,714
Total $592,611 $786,640
Prepared by: RockSol Consulting Group, Inc. Ryan Lepro Donald G. Hunt, P.E. Engineering Geologist Senior Geotechnical Engineer Attachments Appendix A: SMA, HMA, PCCP Unit Cost Information Appendix B: LCCA Input and Output Summary Sheets

Life Cycle Cost Analysis North I-25 Project, Rural Configuration CDOT Project No. IM 0253-255 (21506)
CDOT Region 4, Larimer County, Colorado
RockSol Project No. 292.05 February 8, 2017
APPENDIX A
SMA, HMA, PCCP UNIT COST INFORMATION
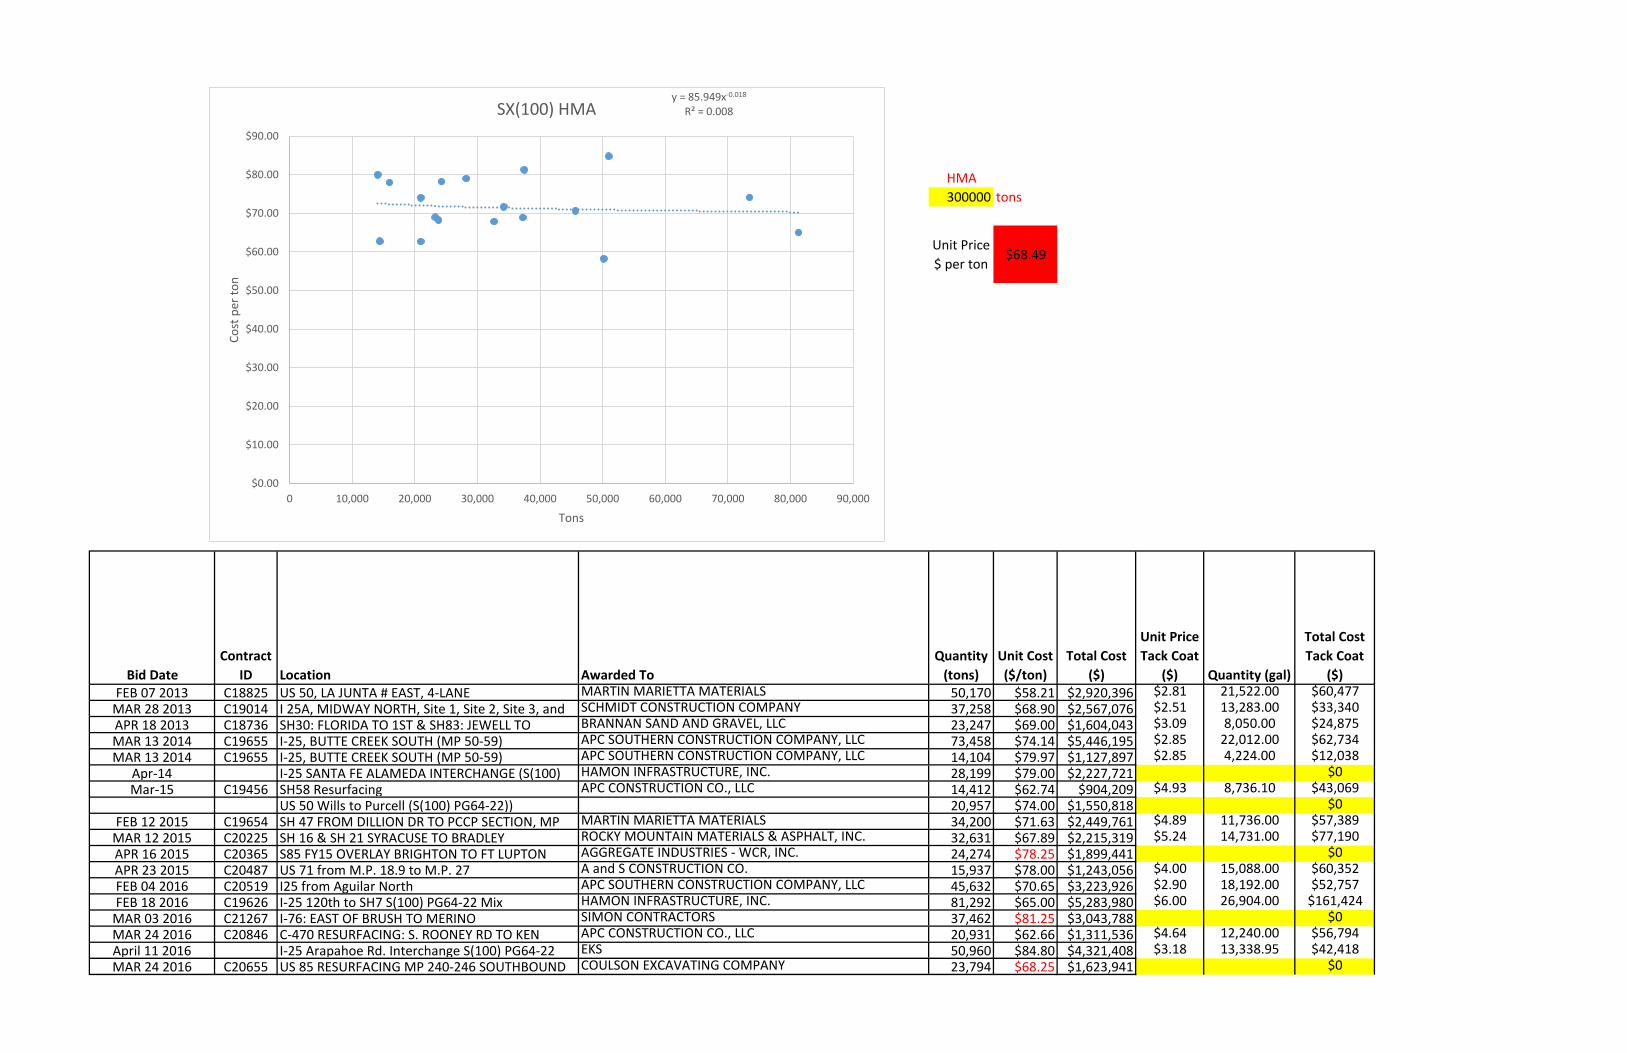
HMA
300000 tons
Unit Price
$ per ton$68.49
FEB 07 2013 C18825 US 50, LA JUNTA # EAST, 4-LANE MARTIN MARIETTA MATERIALS 50,170 $58.21 $2,920,396 $2.81 21,522.00 $60,477MAR 28 2013 C19014 I 25A, MIDWAY NORTH, Site 1, Site 2, Site 3, and SCHMIDT CONSTRUCTION COMPANY 37,258 $68.90 $2,567,076 $2.51 13,283.00 $33,340APR 18 2013 C18736 SH30: FLORIDA TO 1ST & SH83: JEWELL TO BRANNAN SAND AND GRAVEL, LLC 23,247 $69.00 $1,604,043 $3.09 8,050.00 $24,875MAR 13 2014 C19655 I-25, BUTTE CREEK SOUTH (MP 50-59) APC SOUTHERN CONSTRUCTION COMPANY, LLC 73,458 $74.14 $5,446,195 $2.85 22,012.00 $62,734MAR 13 2014 C19655 I-25, BUTTE CREEK SOUTH (MP 50-59) APC SOUTHERN CONSTRUCTION COMPANY, LLC 14,104 $79.97 $1,127,897 $2.85 4,224.00 $12,038
Apr-14 I-25 SANTA FE ALAMEDA INTERCHANGE (S(100) HAMON INFRASTRUCTURE, INC. 28,199 $79.00 $2,227,721 $0Mar-15 C19456 SH58 Resurfacing APC CONSTRUCTION CO., LLC 14,412 $62.74 $904,209 $4.93 8,736.10 $43,069
US 50 Wills to Purcell (S(100) PG64-22)) 20,957 $74.00 $1,550,818 $0FEB 12 2015 C19654 SH 47 FROM DILLION DR TO PCCP SECTION, MP MARTIN MARIETTA MATERIALS 34,200 $71.63 $2,449,761 $4.89 11,736.00 $57,389
MAR 12 2015 C20225 SH 16 & SH 21 SYRACUSE TO BRADLEY ROCKY MOUNTAIN MATERIALS & ASPHALT, INC. 32,631 $67.89 $2,215,319 $5.24 14,731.00 $77,190APR 16 2015 C20365 S85 FY15 OVERLAY BRIGHTON TO FT LUPTON AGGREGATE INDUSTRIES - WCR, INC. 24,274 $78.25 $1,899,441 $0APR 23 2015 C20487 US 71 from M.P. 18.9 to M.P. 27 A and S CONSTRUCTION CO. 15,937 $78.00 $1,243,056 $4.00 15,088.00 $60,352FEB 04 2016 C20519 I25 from Aguilar North APC SOUTHERN CONSTRUCTION COMPANY, LLC 45,632 $70.65 $3,223,926 $2.90 18,192.00 $52,757FEB 18 2016 C19626 I-25 120th to SH7 S(100) PG64-22 Mix HAMON INFRASTRUCTURE, INC. 81,292 $65.00 $5,283,980 $6.00 26,904.00 $161,424
MAR 03 2016 C21267 I-76: EAST OF BRUSH TO MERINO SIMON CONTRACTORS 37,462 $81.25 $3,043,788 $0MAR 24 2016 C20846 C-470 RESURFACING: S. ROONEY RD TO KEN APC CONSTRUCTION CO., LLC 20,931 $62.66 $1,311,536 $4.64 12,240.00 $56,794April 11 2016 I-25 Arapahoe Rd. Interchange S(100) PG64-22 EKS 50,960 $84.80 $4,321,408 $3.18 13,338.95 $42,418MAR 24 2016 C20655 US 85 RESURFACING MP 240-246 SOUTHBOUND COULSON EXCAVATING COMPANY 23,794 $68.25 $1,623,941 $0
Contract
ID
Quantity
(tons)Bid Date Location Awarded To
Unit Price
Tack Coat
($) Quantity (gal)
Total Cost
Tack Coat
($)
Unit Cost
($/ton)
Total Cost
($)
y = 85.949x-0.018
R² = 0.008
$0.00
$10.00
$20.00
$30.00
$40.00
$50.00
$60.00
$70.00
$80.00
$90.00
0 10,000 20,000 30,000 40,000 50,000 60,000 70,000 80,000 90,000
Co
st p
er t
on
Tons
SX(100) HMA

SMA
50000 tons
Unit Price
$ per ton$94.51
MAR 14 2013 C18449 C470: SANTA FE TO WADSWORTH RE APC CONSTRUCTION CO., LLC 25,776 $79.25 $2,042,748 $5.74 4,939.35 $28,35202/14/13 C19258 I-76 Resurfacing MARTIN MARIETTA MATERIALS 23,977 $83.34 $1,998,243 $2.56 9,018.00 $23,086
APR 18 2013 C19314 I-70 WEST OF FLAGLER MARTIN MARIETTA MATERIALS 72,667 $94.50 $6,867,032 $2.40 25,652.00 $61,565FEB 27 2014 C17800S I-25 RUBBLIZATION HARMONY ROAD AGGREGATE INDUSTRIES - WCR, INC. 21,483 $114.00 $2,449,062 $0
04/10/14 C17890 Arapahoe Road Resurfacing (2014) Hamon 31,476 $103.00 $3,242,028 $3.00 10,857.56 $32,57303/05/15 C19456 SH 58 US6-SH93 to I-70 (2015) APC CONSTRUCTION CO., LLC 27,872 $91.55 $2,551,682 $4.93 16,882.92 $83,23302/18/16 C19626 I-25: 120th Ave to SH7 Hamon 70,138 $100.00 $7,013,800 $6.00 22,211.32 $133,26803/24/16 C20846 C470: Resurfacing (2016) STU4701-129 APC CONSTRUCTION CO., LLC 44,772 $79.75 $3,570,567 $4.64 26,145.52 $121,315
E470 70,731 $102.98 $7,283,878 $004/14/16 C20836 I-25, NHPP0252-445 Brannan Sand and Gravel 25,750 $122.00 $3,141,500 $2.00 16,521.00 $33,04202/11/16 C20583 I-25 Climbing Lane (2016) SEMA 22,500 $118.00 $2,655,000 $3.90 7,490.88 $29,21404/11/16 I-25 Arapahoe Road Interchange EKS 17,994 $116.60 $2,098,100 $3.18 4,711.05 $14,981
JUN 02 2016 C20929 I 25 OVERLAY, MLK BYPASS NORTH SCHMIDT CONSTRUCTION COMPANY 22,135 $120.94 $2,677,007 $3.25 8,355.00 $27,154DEC 22 2016 C20902 I-70 MP 158.5 TO 168 OLDCASTLE SW GROUP, INC. 31,096 $73.00 $2,270,008 $2.00 21,447.00 $42,894
Unit Cost
($/ton)
Total Cost
($)
Quantity
(tons)Bid Date Location Awarded To
Contract
ID
Unit Price Tack
Coat ($)
Quantity
(gal)
Total Cost
Tack Coat
($)
y = 267.05x-0.096
R² = 0.0701
$0.00
$20.00
$40.00
$60.00
$80.00
$100.00
$120.00
$140.00
0 10,000 20,000 30,000 40,000 50,000 60,000 70,000 80,000
Co
st p
er t
on
Tons
SMA

PCCP
140000 square yards
Unit Price
$ per Sq
yd
$35.75
JAN 24 2013 C15402 Ft. Morgan to Brush (Phase III) CASTLE ROCK CONST. CO. OF COLO, LLC 137,818 $33.40 $4,603,121JAN 17 2013 C19303 I-70 GLENWOOD CANYON PCCP PHASE 4 INTERSTATE HIGHWAY CONSTRUCTION 84,334 $41.23 $3,477,091AUG 15 2013 C16259- I-70 TOWER TO COLFAX AMES CONSTRUCTION, INC. 113,731 $37.50 $4,264,913JUL 17 2014 C19273 SH86:I-25 TO WOODLANDS BLVD. CONCRETE WORKS OF COLORADO INC. 48,733 $56.50 $2,753,415
MAY 03 2012 C17757 SH 85 IN GREELEY 5TH TO US 34 CASTLE ROCK CONST. CO. OF COLO, LLC 131,455 $33.67 $4,426,090JAN 24 2013 C15402 Ft. Morgan to Brush (Phase III) CASTLE ROCK CONST. CO. OF COLO, LLC 168,771 $37.30 $6,295,158JUN 26 2014 C16602 I-25 LINCOLN TO COUNTY LINE (12.5") INTERSTATE HIGHWAY CONSTRUCTION 67,134 $39.40 $2,645,080
I-25 at Crossroads (12.5") 85,064 $59.00 $5,018,776I-25: Lincoln to County Line (13") INTERSTATE HIGHWAY CONSTRUCTION 74,487 $38.50 $2,867,750
FEB 19 2015 C19029 I-70 SEIBERT-EAST CASTLE ROCK CONST. CO. OF COLO, LLC 67,876 $40.90 $2,776,128
Sq Yd- In
($) Total Cost
Quantity
(SQ YD)Bid Date Location Awarded To
Contract
ID
y = 1604x-0.321
R² = 0.413
$0.00
$10.00
$20.00
$30.00
$40.00
$50.00
$60.00
$70.00
0 20,000 40,000 60,000 80,000 100,000 120,000 140,000 160,000 180,000
Co
st p
er s
qu
are
yard
Square Yards
PCCP (10-12 inches thick)

Life Cycle Cost Analysis North I-25 Project, Rural Configuration CDOT Project No. IM 0253-255 (21506)
CDOT Region 4, Larimer County, Colorado
RockSol Project No. 292.05 February 8, 2017
APPENDIX B
LCCA INPUT AND OUTPUT SUMMARY SHEETS

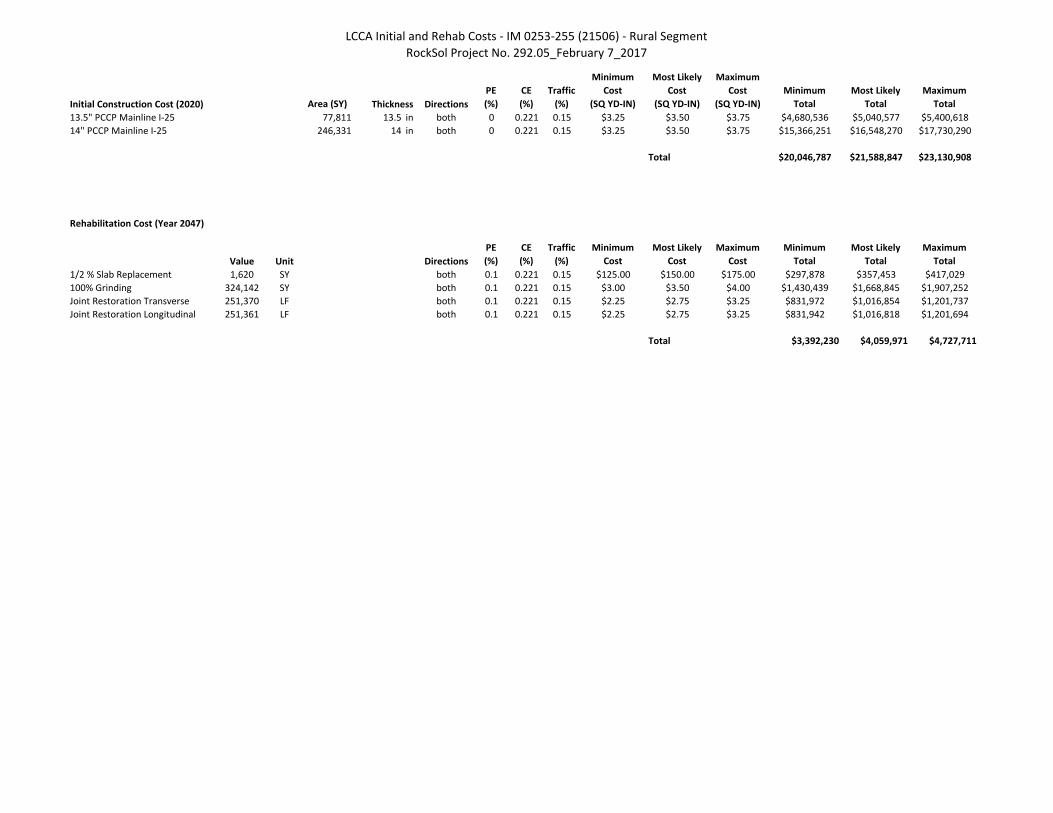
LCCA Initial and Rehab Costs - IM 0253-255 (21506) - Rural Segment
RockSol Project No. 292.05_February 7_2017
Initial Construction Cost (Year 2020) Total Units Directions
PE
(%)
CE
(%)
Traffic
Cost
(%)
Minimum
Cost
Most Likely
Cost
Maximum
Cost
Minimum
Total
Most Likely
Total
Maximum
Total
SMA 53,483 tons both 0 0.221 0.15 $90.00 $95.00 $100.00 $6,599,267 $6,965,893 $7,332,519
HMA S(100)PG 64-22 178,278 tons both 0 0.221 0.15 $60.00 $65.00 $70.00 $14,665,148 $15,887,244 $17,109,340
Tack Coat 972,426 SY both 0 0.221 0.15 $0.28 $0.38 $0.48 $373,295 $506,614 $639,934
Total $21,637,711 $23,359,752 $25,081,793
Rehabilitation Costs (Years 2034 and 2047)
SMA (2034) 35,656 tons both 0.1 0.221 0.15 $90.00 $95.00 $100.00 $4,720,498 $4,982,748 $5,244,998
HMA (2034) 26,741 tons both 0.1 0.221 0.15 $60.00 $65.00 $70.00 $2,360,161 $2,556,841 $2,753,521
Tack Coat (2034) 324,142 SY both 0.1 0.221 0.15 $0.28 $0.38 $0.48 $133,508 $181,189 $228,870
Milling (2034) 324,142 SY both 0.1 0.221 0.15 $2.04 $2.27 $2.50 $972,698 $1,082,365 $1,192,032
Total $8,186,864 $8,803,143 $9,419,421
SMA (2047) 44,570 tons both 0.1 0.221 0.15 $90.00 $95.00 $100.00 $5,900,622 $6,228,435 $6,556,247
Tack Coat (2047) 324,142 SY both 0.1 0.221 0.15 $0.28 $0.38 $0.48 $133,508 $181,189 $228,870
Milling (2047) 324,142 SY both 0.1 0.221 0.15 $2.04 $2.27 $2.50 $972,698 $1,082,365 $1,192,032
Total $7,006,828 $7,491,989 $7,977,149
LCCA Initial and Rehab Costs - IM 0253-255 (21506) - Rural Segment
RockSol Project No. 292.05_February 7_2017
Initial Construction Cost (2020) Area (SY) Directions
PE
(%)
CE
(%)
Traffic
(%)
Minimum
Cost
(SQ YD-IN)
Most Likely
Cost
(SQ YD-IN)
Maximum
Cost
(SQ YD-IN)
Minimum
Total
Most Likely
Total
Maximum
Total
13.5" PCCP Mainline I-25 77,811 13.5 in both 0 0.221 0.15 $3.25 $3.50 $3.75 $4,680,536 $5,040,577 $5,400,618
14" PCCP Mainline I-25 246,331 14 in both 0 0.221 0.15 $3.25 $3.50 $3.75 $15,366,251 $16,548,270 $17,730,290
Total $20,046,787 $21,588,847 $23,130,908
Rehabilitation Cost (Year 2047)
Value Unit Directions
PE
(%)
CE
(%)
Traffic
(%)
Minimum
Cost
Most Likely
Cost
Maximum
Cost
Minimum
Total
Most Likely
Total
Maximum
Total
1/2 % Slab Replacement 1,620 SY both 0.1 0.221 0.15 $125.00 $150.00 $175.00 $297,878 $357,453 $417,029
100% Grinding 324,142 SY both 0.1 0.221 0.15 $3.00 $3.50 $4.00 $1,430,439 $1,668,845 $1,907,252
Joint Restoration Transverse 251,370 LF both 0.1 0.221 0.15 $2.25 $2.75 $3.25 $831,972 $1,016,854 $1,201,737
Joint Restoration Longitudinal 251,361 LF both 0.1 0.221 0.15 $2.25 $2.75 $3.25 $831,942 $1,016,818 $1,201,694
Total $3,392,230 $4,059,971 $4,727,711
Thickness

Probabilistic Life Cycle Cost Analysis Worksheet
INPUT WORKSHEET
1. Economic Variables
Value of Time for Passenger Cars ($/hour) $18.50
Value of Time for Single Unit Trucks ($/hour) $43.50
Value of Time for Combination Trucks ($/hour) $49.50
2. Analysis Options
Include User Costs in Analysis Yes
Include User Cost Remaining Life Value Yes
Use Differential User Costs Yes
User Cost Computation Method Specified
Include Agency Cost Remaining Life Value Yes
Traffic Direction Both
Analysis Period (Years) 40
Beginning of Analysis Period 2020
Discount Rate (%) 2.2
Number of Alternatives 2
3. Project Details
State Route
Project Name
Region
County
Analyzed By
Mileposts
Begin 258.00
End 263.30
Length of Project (miles) 5.30
Comments
4. Traffic Data
AADT Construction Year (total for both directions) 87,462
Cars as Percentage of AADT (%) 89.0
Single Unit Trucks as Percentage of AADT (%) 3.0
Combination Trucks as Percentage of AADT (%) 8.0
Annual Growth Rate of Traffic (%) 2.6
Speed Limit Under Normal Operating Conditions (mph) 75
No of Lanes in Each Direction During Normal Conditions 2
Free Flow Capacity (vphpl) 2085
Rural or Urban Hourly Traffic Distribution Rural
Queue Dissipation Capacity (vphpl) 2057
Maximum AADT (total for both directions) 224,256
Maximum Queue Length (miles) 5.0
5. Construction
Larimer and Weld Counties
RockSol Consulting Group, Inc.
025A
North I-25 Rural Configuration - Segments 7 and 8
Region 4
LCCA Analysis - February 7, 2017
RealCost_(2-07-17)_Rural Configuration - Inputs 1 of 3 2/13/2017

Probabilistic Life Cycle Cost Analysis Worksheet
Alternative 1
Number of Activities 3
Activity 1
Agency Construction Cost ($1000) $23,359.75
User Work Zone Costs ($1000) $297.80
Work Zone Duration (days) 117
No of Lanes Open in Each Direction During Work Zone 2
Activity Service Life (years) 13.7
Activity Structural Life (years) 20.0
Maintenance Frequency (years) 1
Agency Maintenance Cost ($1000) 1.027
Work Zone Length (miles) 5.30
Work Zone Speed Limit (mph) 65
Work Zone Capacity (vphpl) 1700
Traffic Hourly Distribution Week Day 1
Time of Day of Lane Closures (use whole numbers based on a 24-hour clock)
Inbound Start End
First period of lane closure
Second period of lane closure
Third period of lane closure
Outbound Start End
First period of lane closure
Second period of lane closure
Third period of lane closure
Activity 2
Agency Construction Cost ($1000) $8,803.14
User Work Zone Costs ($1000) $136.06
Work Zone Duration (days) 36
No of Lanes Open in Each Direction During Work Zone 2
Activity Service Life (years) 13.3
Activity Structural Life (years) 10.0
Maintenance Frequency (years) 1
Agency Maintenance Cost ($1000) 1.027
Work Zone Length (miles) 2.00
Work Zone Speed Limit (mph) 55
Work Zone Capacity (vphpl) 1400
Traffic Hourly Distribution Week Day 1
Time of Day of Lane Closures (use whole numbers based on a 24-hour clock)
Inbound Start End
First period of lane closure 20 24
Second period of lane closure 0 6
Third period of lane closure
Outbound Start End
First period of lane closure 20 24
Second period of lane closure 0 6
Third period of lane closure
Initial Flexible Construction Completed 2020
2034 Flex Rehab 3" Mill and 2" SMA & 1.5" HMA Fill
Flexible Alternative
RealCost_(2-07-17)_Rural Configuration - Inputs 2 of 3 2/13/2017

Probabilistic Life Cycle Cost Analysis Worksheet
Activity 3
Agency Construction Cost ($1000) $7,491.99
User Work Zone Costs ($1000) $158.75
Work Zone Duration (days) 28
No of Lanes Open in Each Direction During Work Zone 2
Activity Service Life (years) 13.3
Activity Structural Life (years) 10.0
Maintenance Frequency (years) 1
Agency Maintenance Cost ($1000) 1.027
Work Zone Length (miles) 2.00
Work Zone Speed Limit (mph) 55
Work Zone Capacity (vphpl) 1400
Traffic Hourly Distribution Week Day 1
Time of Day of Lane Closures (use whole numbers based on a 24-hour clock)
Inbound Start End
First period of lane closure 20 24
Second period of lane closure 0 6
Third period of lane closure
Outbound Start End
First period of lane closure 20 24
Second period of lane closure 0 6
Third period of lane closure
2047 Flex Rehab 2" Mill and 2.5" SMA Fill
RealCost_(2-07-17)_Rural Configuration - Inputs 3 of 3 2/13/2017
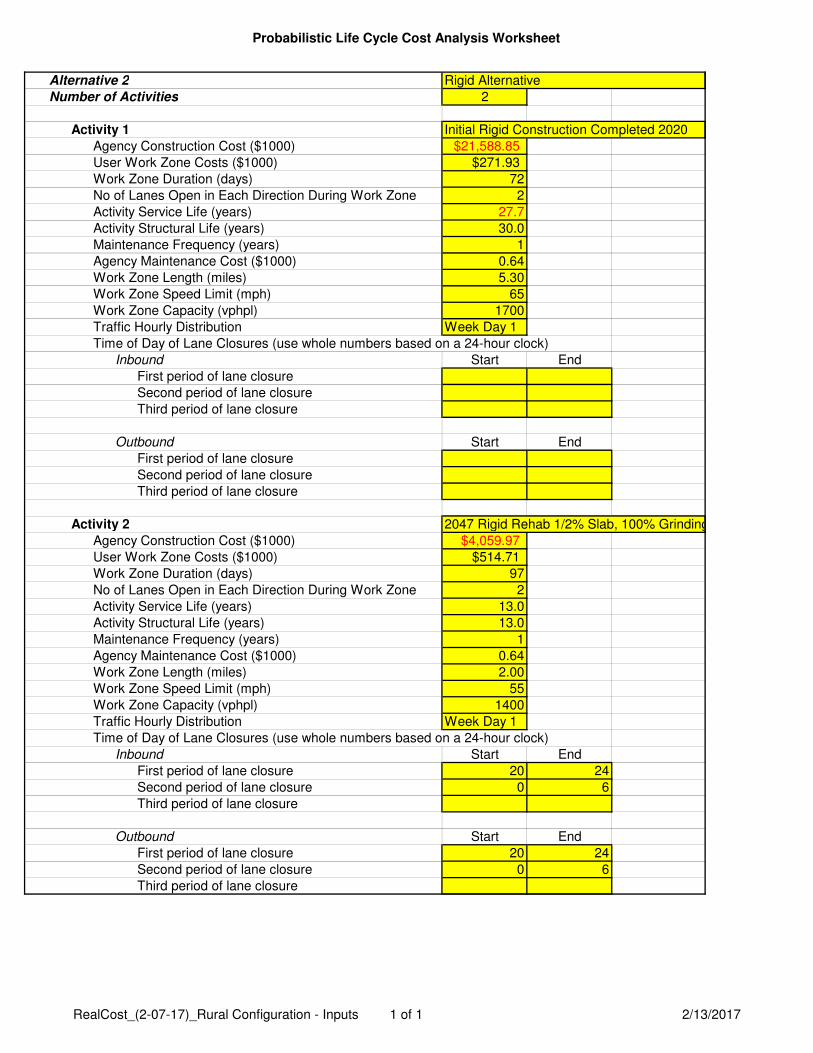
Probabilistic Life Cycle Cost Analysis Worksheet
Alternative 2
Number of Activities 2
Activity 1
Agency Construction Cost ($1000) $21,588.85
User Work Zone Costs ($1000) $271.93
Work Zone Duration (days) 72
No of Lanes Open in Each Direction During Work Zone 2
Activity Service Life (years) 27.7
Activity Structural Life (years) 30.0
Maintenance Frequency (years) 1
Agency Maintenance Cost ($1000) 0.64
Work Zone Length (miles) 5.30
Work Zone Speed Limit (mph) 65
Work Zone Capacity (vphpl) 1700
Traffic Hourly Distribution Week Day 1
Time of Day of Lane Closures (use whole numbers based on a 24-hour clock)
Inbound Start End
First period of lane closure
Second period of lane closure
Third period of lane closure
Outbound Start End
First period of lane closure
Second period of lane closure
Third period of lane closure
Activity 2
Agency Construction Cost ($1000) $4,059.97
User Work Zone Costs ($1000) $514.71
Work Zone Duration (days) 97
No of Lanes Open in Each Direction During Work Zone 2
Activity Service Life (years) 13.0
Activity Structural Life (years) 13.0
Maintenance Frequency (years) 1
Agency Maintenance Cost ($1000) 0.64
Work Zone Length (miles) 2.00
Work Zone Speed Limit (mph) 55
Work Zone Capacity (vphpl) 1400
Traffic Hourly Distribution Week Day 1
Time of Day of Lane Closures (use whole numbers based on a 24-hour clock)
Inbound Start End
First period of lane closure 20 24
Second period of lane closure 0 6
Third period of lane closure
Outbound Start End
First period of lane closure 20 24
Second period of lane closure 0 6
Third period of lane closure
Initial Rigid Construction Completed 2020
2047 Rigid Rehab 1/2% Slab, 100% Grinding, 100% Sawing and Sealing
Rigid Alternative
RealCost_(2-07-17)_Rural Configuration - Inputs 1 of 1 2/13/2017
Probabilistic Life Cycle Cost Analysis Worksheet
Agency Cost
($1000)
User Cost
($1000)
Agency Cost
($1000)
User Cost
($1000)
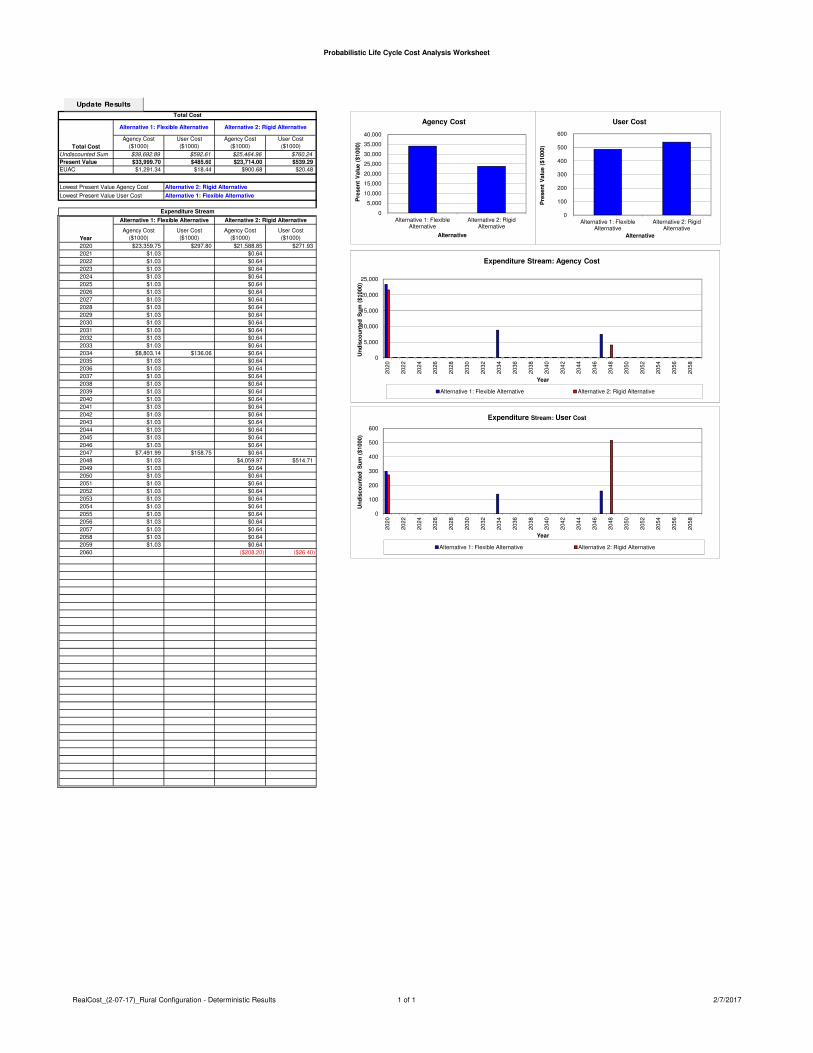
Undiscounted Sum $39,692.89 $592.61 $25,464.96 $760.24
Present Value $33,999.70 $485.60 $23,714.00 $539.29
EUAC $1,291.34 $18.44 $900.68 $20.48
Agency Cost
($1000)
User Cost
($1000)
Agency Cost
($1000)
User Cost
($1000)
2020 $23,359.75 $297.80 $21,588.85 $271.93
2021 $1.03 $0.64
2022 $1.03 $0.64
2023 $1.03 $0.64
2024 $1.03 $0.64
2025 $1.03 $0.64
2026 $1.03 $0.64
2027 $1.03 $0.64
2028 $1.03 $0.64
2029 $1.03 $0.64
2030 $1.03 $0.64
2031 $1.03 $0.64
2032 $1.03 $0.64
2033 $1.03 $0.64
2034 $8,803.14 $136.06 $0.64
2035 $1.03 $0.64
2036 $1.03 $0.64
2037 $1.03 $0.64
2038 $1.03 $0.64
2039 $1.03 $0.64
2040 $1.03 $0.64
2041 $1.03 $0.64
2042 $1.03 $0.64
2043 $1.03 $0.64
2044 $1.03 $0.64
2045 $1.03 $0.64
2046 $1.03 $0.64
2047 $7,491.99 $158.75 $0.64
2048 $1.03 $4,059.97 $514.71
2049 $1.03 $0.64
2050 $1.03 $0.64
2051 $1.03 $0.64
2052 $1.03 $0.64
2053 $1.03 $0.64
2054 $1.03 $0.64
2055 $1.03 $0.64
2056 $1.03 $0.64
2057 $1.03 $0.64
2058 $1.03 $0.64
2059 $1.03 $0.64
2060 ($208.20) ($26.40)
Lowest Present Value User Cost
Alternative 2: Rigid Alternative
Alternative 1: Flexible Alternative
Alternative 2: Rigid Alternative
Alternative 2: Rigid Alternative
Total Cost
Year
Alternative 1: Flexible Alternative
Total Cost
Alternative 1: Flexible Alternative
Expenditure Stream
Lowest Present Value Agency Cost
0
5,000
10,000
15,000
20,000
25,000
2020
2022
2024
2026
2028
2030
2032
2034
2036
2038
2040
2042
2044
2046
2048
2050
2052
2054
2056
2058
Un
dis
co
un
ted
Su
m (
$1000)
Year
Expenditure Stream: Agency Cost
Alternative 1: Flexible Alternative Alternative 2: Rigid Alternative
0
100
200
300
400
500
600
2020
2022
2024
2026
2028
2030
2032
2034
2036
2038
2040
2042
2044
2046
2048
2050
2052
2054
2056
2058
Un
dis
co
un
ted
Su
m (
$1000)
Year
Expenditure Stream: User Cost
Alternative 1: Flexible Alternative Alternative 2: Rigid Alternative
0
5,000
10,000
15,000
20,000
25,000
30,000
35,000
40,000
Alternative 1: FlexibleAlternative
Alternative 2: RigidAlternative
Pre
sen
t V
alu
e (
$1000)
Alternative
Agency Cost
0
100
200
300
400
500
600
Alternative 1: FlexibleAlternative
Alternative 2: RigidAlternative
Pre
sen
t V
alu
e (
$1000)
Alternative
User Cost
Update Results
RealCost_(2-07-17)_Rural Configuration - Deterministic Results 1 of 1 2/7/2017

Agency Cost
($1000)
User Cost
($1000)
Agency Cost
($1000)
User Cost
($1000)
Mean $33,897.50 $483.32 $23,547.47 $518.42
Standard Deviation $1,507.54 $24.35 $929.04 $82.81
Minimum $28,584.51 $373.25 $20,502.24 $285.99
Maximum $37,915.45 $539.37 $25,803.83 $661.12
Total Cost
Total Cost (Present
Value)
Alternative 1: Flexible
AlternativeAlternative 2: Rigid Alternative
0.00
0.10
0.20
0.30
0.40
0.50
0.60
0.70
0.80
0.90
1.00
0 5,000 10,000 15,000 20,000 25,000 30,000 35,000 40,000 45,000
Pro
ba
bilit
y S
ca
le
Present Value ($1000)
Agency Cost
Alternative 1: Agency Cost Alternative 2: Agency Cost
0.00
0.10
0.20
0.30
0.40
0.50
0.60
0.70
0.80
0.90
1.00
0 200 400 600 800
Pro
ba
bilit
y S
ca
le
Present Value ($1000)
User Cost
Alternative 1: User Cost Alternative 2: User Cost
0.00
0.10
0.20
0.30
0.40
0.50
0.60
0.70
0.80
0.90
1.00
0 5,000 10,000 15,000 20,000 25,000 30,000 35,000 40,000 45,000
Pro
ba
bilit
y S
ca
le
Present Value ($1000)
Agency Cost
Alternative 1: Agency Cost Alternative 2: Agency Cost
0.00
0.10
0.20
0.30
0.40
0.50
0.60
0.70
0.80
0.90
1.00
0 100 200 300 400 500 600 700 800
Pro
ba
bilit
y S
ca
le
Present Value ($1000)
User Cost
Alternative 1: User Cost Alternative 2: User Cost

Bin Mid Point Rel. Freq.Cum. Rel.
Freq.Bin Mid Point Rel. Freq.
Cum. Rel.
Freq.Bin Mid Point Rel. Freq.
Cum. Rel.
Freq.Bin Mid Point Rel. Freq.
Cum. Rel.
Freq.
20000 19500 0.00 0.00 300 290 0.00 0.00 20000 19500 0.00 0.00 300 290 0.01 0.01
21000 20500 0.00 0.00 320 310 0.00 0.00 21000 20500 0.01 0.01 320 310 0.01 0.02
22000 21500 0.00 0.00 340 330 0.00 0.00 22000 21500 0.04 0.05 340 330 0.02 0.04
23000 22500 0.00 0.00 360 350 0.00 0.00 23000 22500 0.23 0.28 360 350 0.01 0.05
24000 23500 0.00 0.00 380 370 0.00 0.00 24000 23500 0.41 0.69 380 370 0.03 0.08
25000 24500 0.00 0.00 400 390 0.00 0.00 25000 24500 0.26 0.94 400 390 0.05 0.12
26000 25500 0.00 0.00 420 410 0.01 0.01 26000 25500 0.06 1.00 420 410 0.03 0.16
27000 26500 0.00 0.00 440 430 0.03 0.04 27000 26500 0.00 1.00 440 430 0.04 0.20
28000 27500 0.00 0.00 460 450 0.13 0.18 28000 27500 0.00 1.00 460 450 0.06 0.25
29000 28500 0.00 0.00 480 470 0.22 0.40 29000 28500 0.00 1.00 480 470 0.04 0.29
30000 29500 0.01 0.01 500 490 0.35 0.75 30000 29500 0.00 1.00 500 490 0.05 0.34
31000 30500 0.02 0.04 520 510 0.21 0.96 31000 30500 0.00 1.00 520 510 0.06 0.40
32000 31500 0.07 0.11 540 530 0.04 1.00 32000 31500 0.00 1.00 540 530 0.09 0.49
33000 32500 0.15 0.26 560 550 0.00 1.00 33000 32500 0.00 1.00 560 550 0.11 0.59
34000 33500 0.24 0.51 580 570 0.00 1.00 34000 33500 0.00 1.00 580 570 0.14 0.74
35000 34500 0.25 0.76 600 590 0.00 1.00 35000 34500 0.00 1.00 600 590 0.14 0.87
36000 35500 0.17 0.93 620 610 0.00 1.00 36000 35500 0.00 1.00 620 610 0.08 0.95
37000 36500 0.06 0.99 640 630 0.00 1.00 37000 36500 0.00 1.00 640 630 0.03 0.99
38000 37500 0.01 1.00 660 650 0.00 1.00 38000 37500 0.00 1.00 660 650 0.01 1.00
39000 38500 0.00 1.00 680 670 0.00 1.00 39000 38500 0.00 1.00 680 670 0.00 1.00
Alternative 1: Agency Cost Alternative 1: User Cost Alternative 2: Agency Cost Alternative 2: User Cost
0.00
0.20
0.40
0.60
0.80
1.00
19000 24000 29000 34000 39000
Pro
ba
bilit
y S
ca
le
0.00
0.20
0.40
0.60
0.80
1.00
280 380 480 580 680
Pro
ba
bilit
y S
ca
le
0.00
0.20
0.40
0.60
0.80
1.00
19000 24000 29000 34000 39000
Pro
ba
bilit
y S
ca
le
0.00
0.20
0.40
0.60
0.80
1.00
280 380 480 580 680
Pro
ba
bilit
y S
ca
le
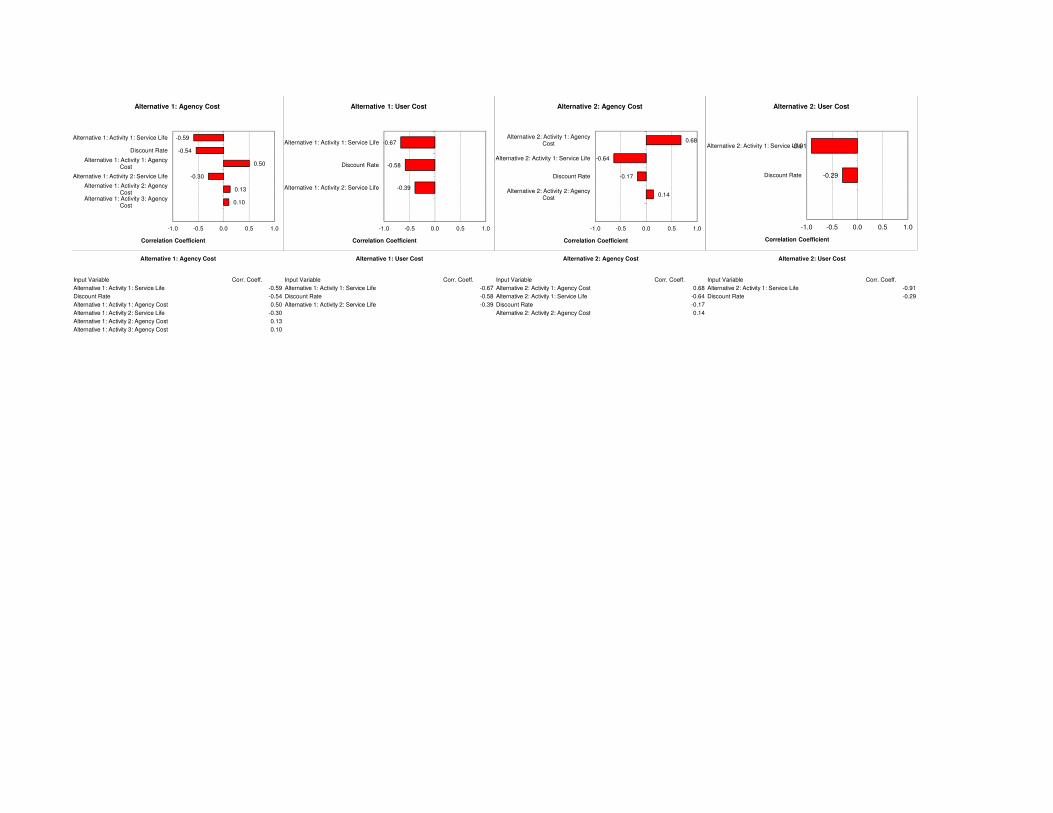
Corr. Coeff. Corr. Coeff. Corr. Coeff. Corr. Coeff.
-0.59 -0.67 0.68 -0.91
-0.54 -0.58 -0.64 -0.29
0.50 -0.39 -0.17
-0.30 0.14
0.13
0.10
Discount Rate
Input Variable
Discount Rate
Alternative 1: Activity 2: Service LifeAlternative 1: Activity 1: Agency Cost
Alternative 1: Activity 1: Service Life
Alternative 2: User Cost
Input Variable
Alternative 1: Activity 1: Service Life
Discount Rate
Alternative 2: Activity 1: Agency Cost
Alternative 2: Activity 1: Service Life
Alternative 2: Activity 1: Service Life
Alternative 1: Agency Cost
Input Variable
Alternative 1: User Cost
Input Variable
Alternative 2: Agency Cost
Alternative 1: Activity 3: Agency Cost
Alternative 2: Activity 2: Agency Cost
Discount Rate
Alternative 1: Activity 2: Service Life
Alternative 1: Activity 2: Agency Cost
-0.59
-0.54
0.50
-0.30
0.13
0.10
-1.0 -0.5 0.0 0.5 1.0
Alternative 1: Activity 1: Service Life
Discount Rate
Alternative 1: Activity 1: AgencyCost
Alternative 1: Activity 2: Service Life
Alternative 1: Activity 2: AgencyCost
Alternative 1: Activity 3: AgencyCost
Correlation Coefficient
Alternative 1: Agency Cost
-0.67
-0.58
-0.39
-1.0 -0.5 0.0 0.5 1.0
Alternative 1: Activity 1: Service Life
Discount Rate
Alternative 1: Activity 2: Service Life
Correlation Coefficient
Alternative 1: User Cost
0.68
-0.64
-0.17
0.14
-1.0 -0.5 0.0 0.5 1.0
Alternative 2: Activity 1: AgencyCost
Alternative 2: Activity 1: Service Life
Discount Rate
Alternative 2: Activity 2: AgencyCost
Correlation Coefficient
Alternative 2: Agency Cost
-0.91
-0.29
-1.0 -0.5 0.0 0.5 1.0
Alternative 2: Activity 1: Service Life
Discount Rate
Correlation Coefficient
Alternative 2: User Cost
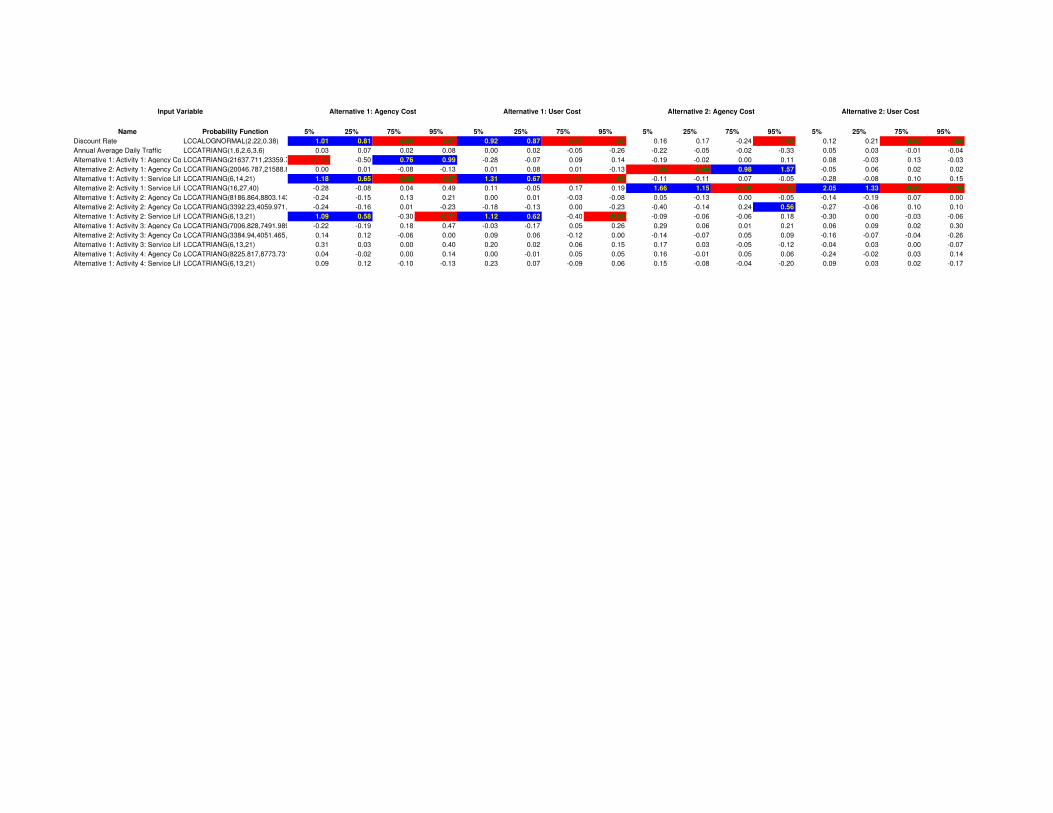
Name Probability Function 5% 25% 75% 95% 5% 25% 75% 95% 5% 25% 75% 95% 5% 25% 75% 95%
Discount Rate LCCALOGNORMAL(2.22,0.38) 1.01 0.81 -0.64 -1.07 0.92 0.87 -0.69 -1.07 0.16 0.17 -0.24 -0.68 0.12 0.21 -0.57 -1.09
Annual Average Daily Traffic LCCATRIANG(1.6,2.6,3.6) 0.03 0.07 0.02 0.08 0.00 0.02 -0.05 -0.26 -0.22 -0.05 -0.02 -0.33 0.05 0.03 -0.01 -0.04
Alternative 1: Activity 1: Agency CostLCCATRIANG(21637.711,23359.752,25081.793)-1.38 -0.50 0.76 0.99 -0.28 -0.07 0.09 0.14 -0.19 -0.02 0.00 0.11 0.08 -0.03 0.13 -0.03
Alternative 2: Activity 1: Agency CostLCCATRIANG(20046.787,21588.847,23130.908)0.00 0.01 -0.08 -0.13 0.01 0.08 0.01 -0.13 -1.28 -0.80 0.98 1.57 -0.05 0.06 0.02 0.02
Alternative 1: Activity 1: Service LifeLCCATRIANG(6,14,21) 1.18 0.65 -0.89 -1.57 1.31 0.67 -1.11 -1.66 -0.11 -0.11 0.07 -0.05 -0.28 -0.08 0.10 0.15
Alternative 2: Activity 1: Service LifeLCCATRIANG(16,27,40) -0.28 -0.08 0.04 0.49 0.11 -0.05 0.17 0.19 1.66 1.15 -0.60 -0.99 2.05 1.33 -0.95 -1.38
Alternative 1: Activity 2: Agency CostLCCATRIANG(8186.864,8803.143,9419.421)-0.24 -0.15 0.13 0.21 0.00 0.01 -0.03 -0.08 0.05 -0.13 0.00 -0.05 -0.14 -0.19 0.07 0.00
Alternative 2: Activity 2: Agency CostLCCATRIANG(3392.23,4059.971,4727.711)-0.24 -0.16 0.01 -0.23 -0.18 -0.13 0.00 -0.23 -0.40 -0.14 0.24 0.56 -0.27 -0.06 0.10 0.10
Alternative 1: Activity 2: Service LifeLCCATRIANG(6,13,21) 1.09 0.58 -0.30 -0.71 1.12 0.62 -0.40 -0.86 -0.09 -0.06 -0.06 0.18 -0.30 0.00 -0.03 -0.06
Alternative 1: Activity 3: Agency CostLCCATRIANG(7006.828,7491.989,7977.149)-0.22 -0.19 0.18 0.47 -0.03 -0.17 0.05 0.26 0.29 0.06 0.01 0.21 0.06 0.09 0.02 0.30
Alternative 2: Activity 3: Agency CostLCCATRIANG(3384.94,4051.465,4717.991)0.14 0.12 -0.06 0.00 0.09 0.06 -0.12 0.00 -0.14 -0.07 0.05 0.09 -0.16 -0.07 -0.04 -0.26
Alternative 1: Activity 3: Service LifeLCCATRIANG(6,13,21) 0.31 0.03 0.00 0.40 0.20 0.02 0.06 0.15 0.17 0.03 -0.05 -0.12 -0.04 0.03 0.00 -0.07
Alternative 1: Activity 4: Agency CostLCCATRIANG(8225.817,8773.731,9321.644)0.04 -0.02 0.00 0.14 0.00 -0.01 0.05 0.05 0.16 -0.01 0.05 0.06 -0.24 -0.02 0.03 0.14
Alternative 1: Activity 4: Service LifeLCCATRIANG(6,13,21) 0.09 0.12 -0.10 -0.13 0.23 0.07 -0.09 0.06 0.15 -0.08 -0.04 -0.20 0.09 0.03 0.02 -0.17
Input Variable Alternative 1: Agency Cost Alternative 1: User Cost Alternative 2: Agency Cost Alternative 2: User Cost

RealCost – Annual Average Daily Traffic Triangular Probability Distribution
NOTE: Following Table 13.7 of the PDM, RockSol used an Annual Growth Rate of 1.6%
(minimum), 2.6% (most likely) and 3.6% (maximum) in the RealCost Triangular Probability
Function.

RealCost – Traffic Data

RealCost – Free Flow Capacity Calculation (12 ft Lane Width)

RealCost – Free Flow Capacity Calculation (11 ft Lane Width)

RealCost – Agency Cost for Initial Flexible Pavement Construction (Alternative 1: Activity 1)
RealCost – Service Life for Initial Flexible Pavement Construction (Alternative 1: Activity 1)
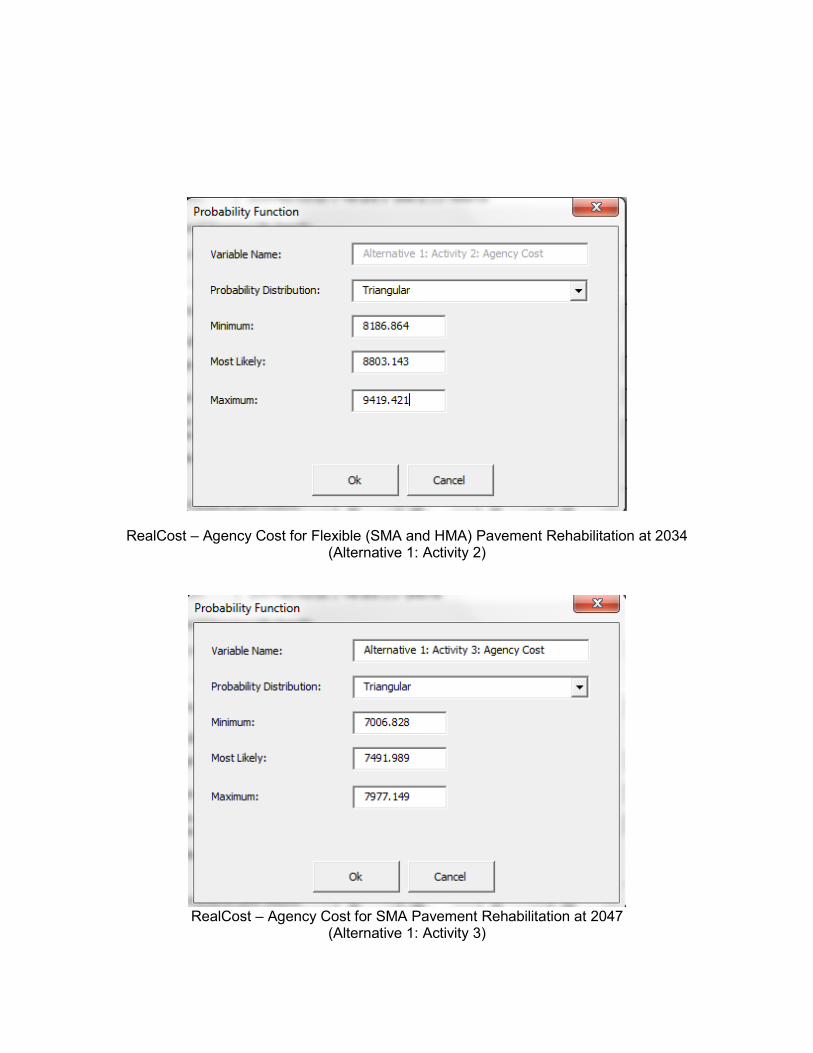
RealCost – Agency Cost for Flexible (SMA and HMA) Pavement Rehabilitation at 2034 (Alternative 1: Activity 2)
RealCost – Agency Cost for SMA Pavement Rehabilitation at 2047
(Alternative 1: Activity 3)

RealCost – Service Life for SMA Pavement Rehabilitation 2034 and 2047 (Alternative 1: Activities 2 and 3)
RealCost – Agency Cost for Initial Rigid Pavement Construction (Alternative 2: Activity 1)

RealCost – Service Life for Initial Rigid Pavement Construction (Alternative 2: Activity 1)
RealCost – Agency Cost for Rigid Pavement Rehabilitation at 2047 (Alternative 2: Activity 2)

CDOT Report - Summary Input and Output for the Crossover Strategy
Project Code 21506Project Name North I-25 - Segments 7 and 8 - Rural ConfigurationFreeway Name 025AInput Filename 2020 (HMA).WZMProject Start Date 2020Project End Date 2020Design Speed 75 mphSpeed Limit 75 mphWorkzone Speed Limit 65 mphGrade 2.0 %Workzone Length 5.29 milesFunctional Class Rural Interstate (Weekday)
PRIMARY SECONDARY Total Number of Lanes 2 2Number of Open Lanes 2 2Number of Temporary Lanes 0 0AADT 43,731 43,731Percentage of Single Unit Trucks 3.0 % 3.0 %Percentage of Combination Trucks 8.0 % 8.0 %
ADDITIONAL USER COST DUE TO WORKZONETYPE OF WORK PRIMARY COST SECONDARY COST DURATION 403-HMA <= 3.0 Inch $148,901.95 $148,901.95 117 TOTAL ADDL. USER COST $148,901.95 $148,901.95 117
TOTAL USER COST FOR NORMAL CONDITION (WITH NO WORKZONE) FOR A DURATION OF 117 DAYS : INBOUND = $23,379,029.71 OUTBOUND = $23,379,029.71
Disclaimer:
The values presented in this program are intended to provide guidelines only. Engineering judgement must be applied to use these values. No one but the user can assure
that these results are properly applied
Page 1 of 1Summary Report
2/3/2017https://usercost.codot.gov/SummaryReport.aspx

User Cost Queue Graph
PRIMARY SECONDARY
Type of Work: 403-HMA <= 3.0 Inch
Page 1 of 1Queue Graph
2/3/2017https://usercost.codot.gov/QueueGraph.aspx

CDOT Report - Summary Input and Output for the Single Lane Closure Strategy
Project Code 21506Project Name North I-25 - Segment 7 and Segment 8 - Rural ConfigurationFreeway Name 025AInput Filename Flex Rehab 2034.WZMProject Start Date 2034Project End Date 2034Design Speed 75 mphSpeed Limit 75 mphWorkzone Speed Limit 55 mphGrade 2.0 %Workzone Length 2.00 milesFunctional Class Rural Interstate (Weekday)
Total Number of Lanes 2Number of Open Lanes 1Number of Temporary Lanes 1AADT, Directional 59,778Percentage of Single Unit Trucks 3.0 %Percentage of Combination Trucks 8.0 %Work in Both Directions NO
ADDITIONAL USER COST DUE TO WORKZONETYPE OF WORK COST DURATION 202-Removal of Asphalt (Planing) $7,489.64 2 403-HMA <= 3.0 Inch $128,568.51 34 TOTAL ADDL. USER COST $136,058.15 36
TOTAL USER COST FOR NORMAL CONDITION (WITH NO WORKZONE) FOR A DURATION OF 36 DAYS = $752,520.03
Disclaimer:
The values presented in this program are intended to provide guidelines only. Engineering judgement must be applied to use these values. No one but the user can assure
that these results are properly applied
Page 1 of 1Summary Report
2/3/2017https://usercost.codot.gov/SummaryReport.aspx

User Cost Queue Graph
Type of Work: 403-HMA <= 3.0 Inch
Page 1 of 1Queue Graph
2/3/2017https://usercost.codot.gov/QueueGraph.aspx

CDOT Report - Summary Input and Output for the Single Lane Closure Strategy
Project Code 21506Project Name North I-25 - Segment 7 and Segment 8 - Rural ConfigurationFreeway Name 025AInput Filename SMA Rehab 2047.WZMProject Start Date 2047Project End Date 2047Design Speed 75 mphSpeed Limit 75 mphWorkzone Speed Limit 55 mphGrade 2.0 %Workzone Length 2.00 milesFunctional Class Rural Interstate (Weekday)
Total Number of Lanes 2Number of Open Lanes 1Number of Temporary Lanes 1AADT, Directional 74,677Percentage of Single Unit Trucks 3.0 %Percentage of Combination Trucks 8.0 %Work in Both Directions NO
ADDITIONAL USER COST DUE TO WORKZONETYPE OF WORK COST DURATION 202-Removal of Asphalt (Planing) $9,664.30 2 403-HMA Stone Matrix Asphalt $149,084.56 26 TOTAL ADDL. USER COST $158,748.86 28
TOTAL USER COST FOR NORMAL CONDITION (WITH NO WORKZONE) FOR A DURATION OF 28 DAYS = $730,568.11
Disclaimer:
The values presented in this program are intended to provide guidelines only. Engineering judgement must be applied to use these values. No one but the user can assure
that these results are properly applied
Page 1 of 1Summary Report
2/3/2017https://usercost.codot.gov/SummaryReport.aspx

User Cost Queue Graph
Type of Work: 403-HMA Stone Matrix Asphalt
Page 1 of 1Queue Graph
2/3/2017https://usercost.codot.gov/QueueGraph.aspx

CDOT Report - Summary Input and Output for the Crossover Strategy
Project Code 21506Project Name North I-25 - Segments 7 and 8 - Rural ConfigurationFreeway Name 025AInput Filename 2020 (PCCP).WZMProject Start Date 2020Project End Date 2020Design Speed 75 mphSpeed Limit 75 mphWorkzone Speed Limit 65 mphGrade 2.0 %Workzone Length 5.29 milesFunctional Class Rural Interstate (Weekday)
PRIMARY SECONDARY Total Number of Lanes 2 2Number of Open Lanes 2 2Number of Temporary Lanes 0 0AADT 43,731 43,731Percentage of Single Unit Trucks 3.0 % 3.0 %Percentage of Combination Trucks 8.0 % 8.0 %
ADDITIONAL USER COST DUE TO WORKZONE
TYPE OF WORKPRIMARY
COSTSECONDARY
COSTDURATION
412-Concrete Pavement <= 14.0 inch
$135,963.16 $135,963.16 72
TOTAL ADDL. USER COST $135,963.16 $135,963.16 72
TOTAL USER COST FOR NORMAL CONDITION (WITH NO WORKZONE) FOR A DURATION OF 72 DAYS : INBOUND = $14,385,041.38 OUTBOUND = $14,385,041.38
Disclaimer:
The values presented in this program are intended to provide guidelines only. Engineering judgement must be applied to use these values. No one but the user can assure
that these results are properly applied
Page 1 of 1Summary Report
2/3/2017https://usercost.codot.gov/SummaryReport.aspx

User Cost Queue Graph
PRIMARY SECONDARY
Type of Work: 412-Concrete Pavement <= 14.0 inch
Page 1 of 1Queue Graph
2/3/2017https://usercost.codot.gov/QueueGraph.aspx

CDOT Report - Summary Input and Output for the Single Lane Closure Strategy
Project Code 21506Project Name North I-25 - Segments 7 and 8 - Rural ConfigurationFreeway Name 025AInput Filename PCCP Rehab 2047.WZMProject Start Date 2047Project End Date 2047Design Speed 75 mphSpeed Limit 75 mphWorkzone Speed Limit 55 mphGrade 2.0 %Workzone Length 2.00 milesFunctional Class Rural Interstate (Weekday)
Total Number of Lanes 2Number of Open Lanes 1Number of Temporary Lanes 1AADT, Directional 74,677Percentage of Single Unit Trucks 3.0 %Percentage of Combination Trucks 8.0 %Work in Both Directions NO
ADDITIONAL USER COST DUE TO WORKZONETYPE OF WORK COST DURATION 202-Removal of Concrete (Diamond Grinding) $222,279.00 46 412-Routing & Sealing PCCP Cracks $292,435.09 51 TOTAL ADDL. USER COST $514,714.09 97
TOTAL USER COST FOR NORMAL CONDITION (WITH NO WORKZONE) FOR A DURATION OF 97 DAYS = $2,530,896.68
Disclaimer:
The values presented in this program are intended to provide guidelines only. Engineering judgement must be applied to use these values. No one but the user can assure
that these results are properly applied
Page 1 of 1Summary Report
2/3/2017https://usercost.codot.gov/SummaryReport.aspx

User Cost Queue Graph
Type of Work: 202-Removal of Concrete (Diamond Grinding)
Page 1 of 1Queue Graph
2/3/2017https://usercost.codot.gov/QueueGraph.aspx
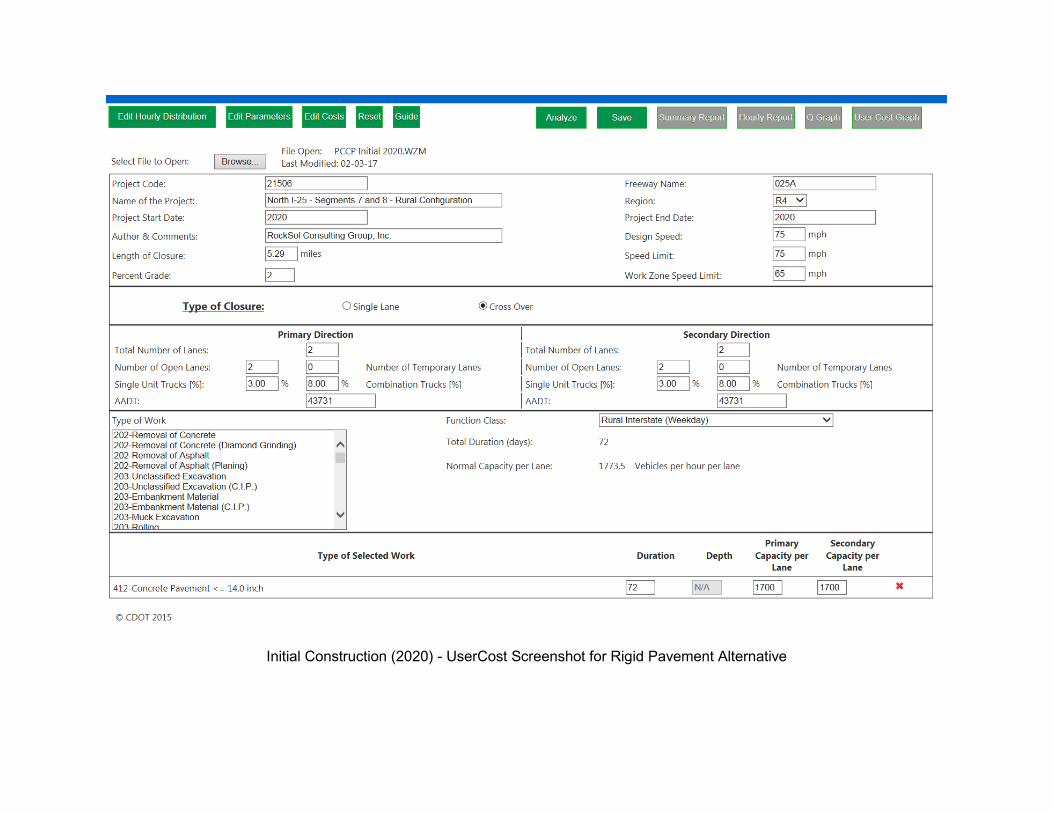
Initial Construction (2020) - UserCost Screenshot for Rigid Pavement Alternative

UserCost Screenshot for Rigid Pavement 2047 Rehabilitation

Initial Construction (2020) - UserCost Screenshot for Flexible Pavement Alternative

UserCost Screenshot for Flexible Pavement 2034 Rehabilitation
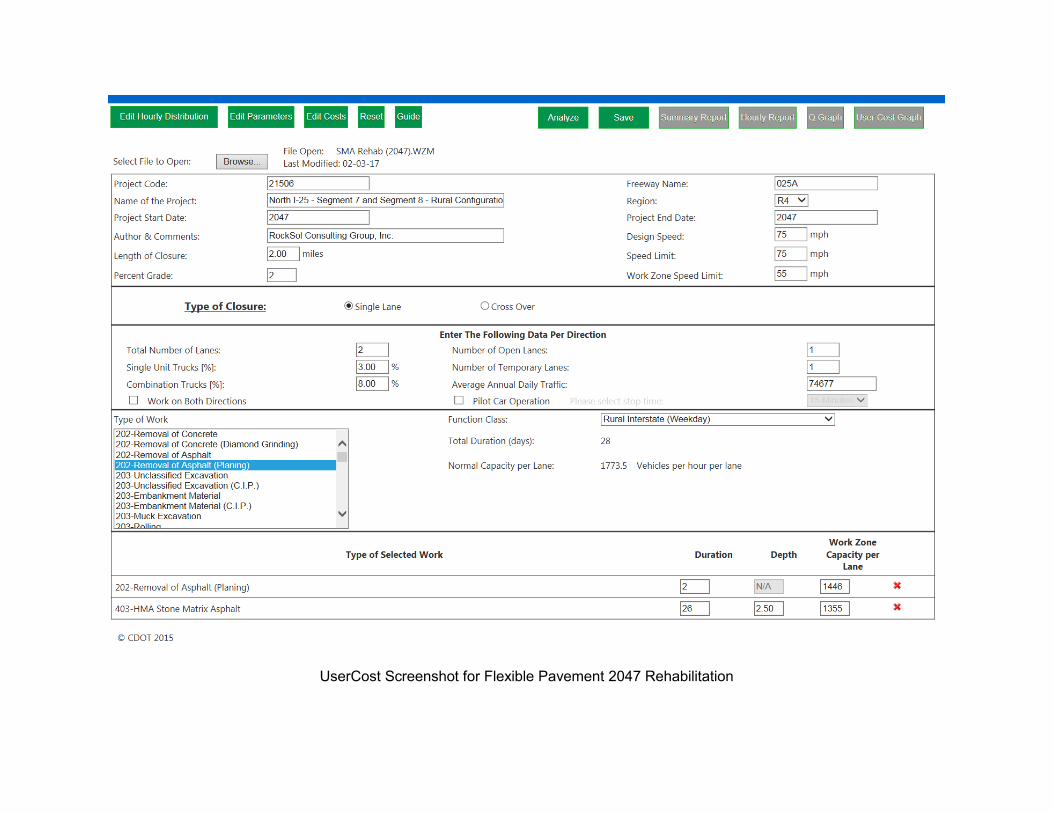
UserCost Screenshot for Flexible Pavement 2047 Rehabilitation

For Future Rehabilitations For Initial Construction
UserCost Screenshot for Hourly Traffic Distibution Factors for Initial and Rehabilitation Pavement Construction Operations