Embed Size (px)
Citation preview
HUNTER ET AL.: SABLEFISH REPRODUCTION CalCOFl Rep., Vol. 30,1989
FECUNDITY AND OTHER ASPECTS OF THE REPRODUCTION OF SABLEFISH, ANOPLOPOMA FIMBRIA, IN CENTRAL CALIFORNIA WATERS
J. ROE HUNTER, BEVERLY J. MACEWICZ, AND CAROL A. KIMBRELL National Marine Fisheries Service
Southwest Fisheries Center P.O. Box 271
La Jolla, California 92038
ABSTRACT Along the central California coast from Point
Conception to Monterey Bay, sablefish specimens were taken in research trawls, in traps, and from the fishery. Sablefish in spawning condition occurred in October through early February. Fifty percent of the females 60 cm long were sexually mature. Most of the females with active ovaries were taken in the oxygen minimum zone; 96% of the reproductively active females occurred at depths of 800 m or deeper. The mean length of males and females taken in trawls increased with depth.
Five lines of evidence indicated that the standing stock of advanced yolked oocytes was equivalent to the total potential annual fecundity; in other words, fecundity is determinate in sablefish. The potential annual fecundity of a 2.5-kg sablefish was 107 oo- cytes per gram female weight; the batch fecundity averaged 24 hydrated oocytes per gram female weight for the last spawn, and 41 for earlier spawn- ings. Thus sablefish would have to spawn about three times to fully use their potential annual fe- cundity.
RESUMEN Varios especimenes de pez sable fueron captura-
dos en arrastres de investigacion, con trampas y por la pesqueria a lo largo de la costa de California, desde Punta Concepci6n hasta la bahia de Monte- rey. Desde el mes de octubre hasta 10s comienzos de febrero se observaron especimenes en condiciones de desove. El 50% de las hembras de 60 cm de lon- gitud se encontraban sexualmente maduras. La mayoria de las hembras con ovarios activos provi- nieron de la zona de minimo oxigeno; el 96% de las hembras reproductoras ocurri6 a profundidades ig- uales o mayores a 10s 800 metros. La longitud pro- medio de 10s machos y las hembras recolectados en 10s arrastres aument6 proporcionalmente con la profundidad de captura.
La evidencia demostro que el stock de ovocitos vitelinos en estadios avanzados fue equivalente a la fecundidad total potencial anual; en otras palabras,
[Manuscript received February 1,1989.1
la fecundidad en el pez sable esth determinada. La fecundidad potencial anual de un pez de 2.5 kg de peso fue de 107 ovocitos por gramo de hembra. La fecundidad parcial promedi6 24 ovocitos hidratados por gramo de hembra para el Gltimo desove y 41 ovocitos para 10s desoves anteriores. De esta ma- nera, el pez sable debiera desovar 3 veces por afio para hacer us0 completo de su fecundidad potencial.
INTRODUCTION The objective of this study was to estimate fe-
cundity, length at first maturity, bathymetric dis- tribution, and frequency of spawning for sablefish, Anoploporna jrnbria, from central California, and to identify the spawning period. Sablefish occur along the northern rim of the Pacific Ocean from the southern tip of Baja California to the north-central Bering Sea and from there to central Honshu, Ja- pan. Most of the U. S. catch is taken between south- eastern Alaska and central California (MBC 1987).
We use our analysis of sablefish fecundity to eval- uate the assumption of determinate fecundity. In fishes with determinate fecundity, the standing stock of advanced oocytes before spawning is equivalent to the total potential fecundity for the year. In many fishes (anchovy, sardine, mackerel, and others) fecundity is indeterminate (Hunter and Macewicz 1985a; Hunter et al. 1985); the standing stock of advanced oocytes is not equivalent to the total potential fecundity because unyolked oocytes are continuously matured and spawned during the reproductive season. Validation of the assumption of determinate fecundity is important because if de- terminate fecundity is wrongly assumed, total fe- cundity estimates are meaningless.
Some reports on sablefish reproduction exist: Mason et al. (1983) thoroughly studied fecundity (standing stock of advanced oocytes), identified the peak spawning period, and determined age and size at maturity of Canadian sablefish; Phillips and Im- amura (1954) give some incidental values of stand- ing stock of advanced oocytes for a few fish from California; Cailliet et al. (1988) estimated seasonal- ity of reproduction, and report on the relation be- tween bathymetry, size, and sexual maturity for
61
HUNTER ET AL.: SABLEFISH REPRODUCTION CalCOFl Rep.,Vol. 30,1989
fish from Monterey Bay, California; Fujiwara and Hankin (1988) report similar information for north- ern California; and Norris et al. (1987) estimated the seasonality of reproduction for fish from the Ore- gon and Washington coasts. N o sablefish study has considered the frequency of spawning or evaluated the assumption of determinate fecundity.
METHODS
Collections and Shipboard Measurements Sablefish were collected along the central Califor-
nia coast (Point Conception to San Francisco Bay) during two research trawl surveys (January-Feb- ruary 1987; February-April 1988), during a trap sur- vey conducted by the NWAFC (October 1986), and from the fishery by the California Department of Fish and Game (October 1986-February 1987). Re- search trawls were about one hour long in 1987, and were taken at fixed and repeated stations at seven depths (100-700 fath., 183-1280 m) in 1987. In 1988, random trawl samples were taken within three depth strata (30-249 fath., 55-455 m; 250-549 fath., 457-1004 m; 550-699 fath., 1006-1278 m) with tow durations of0.5 hr in the first stratum and 1.0 hr in the middle and the deep strata. The trawl used was a 400-mesh Eastern with a mouth width of about 15 m, and height about 1.5 m (Wathne 1977).
In the 1986 trap survey, the females collected for fecundity were weighed and measured (FL, fork length) at the time of capture. In both trawl surveys (1987 and 1988) the total catch of sablefish was weighed; each fish was sexed and measured (FL); and a wet weight of most of the females was taken. The data were used to describe the bathymetric dis- tribution of sablefish. We used the trawl catch of sablefish (kg/hr) to relate abundance to depth, but because the trawl extended only 1.5 m from the bottom, biomass is probably greatly underesti- mated by the catch; the average catch altitude for sablefish caught on setlines by Sullivan (1982) was 12 m off the bottom. In the 1987 survey, bottom temperatures and oxygen concentration were mea- sured over the depth range of the survey (100-700 fath., 183-1280 m).
Reproductive measurements were made only during the 1986 and 1987 surveys. Data from the 1988 survey were used only to define the bathymet- ric distribution of sablefish. In 1988, ovaries were classed on shipboard into three types: hydrated (ovaries containing translucent hydrated yolked 00-
cytes); active (ovaries containing yolked oocytes); and inactive (ovaries containing neither hydrated
nor other yolked oocytes). The inactive class in- cludes stages designated in other classification schemes as “spent,” “immature,” and various “de- veloping” stages. In 1986-87 a five-class table was used, but we believe no useful purpose was served by attempting to make such distinctions, which in some cases are highly subjective. Although “spent” ovaries can be identified with reasonable accuracy immediately after a spawning, we did not use this stage because it is an ephemeral stage of unknown duration. An ovary classified as “spent” transforms into an inactive or active state depending on whether the female has completed all spawnings or will spawn again. Ovaries from females used in fe- cundity estimates were frozen or preserved in 10% neutral buffered Formalin and then weighed in the laboratory.
The length at first maturity was estimated by cal- culating the fraction of the ovaries that were active per length class for fish taken early in the spawning season (October 1986).
The fraction of females with hydrated ovaries taken in research trawls (1987 and 1988) was used to estimate the time of day that sablefish spawn.
Total Fecundity We measured the total fecundity of 45 females
captured in sablefish traps (October 20-27, 1986), and of 41 females taken in research trawls (January 17-February 14, 1987). Total fecundity (FJ is de- fined as the total number of advanced yolked 00-
cytes in the ovary, including all hydrated oocytes. We estimated total fecundity gravimetrically.
Using this method, fecundity ( F T ) is the product of the gonad weight (G) and oocyte density (C). 00- cyte density is the number of oocytes, within a spec- ified diameter range, per gram of ovarian tissue, and is determined by counting the number of advanced oocytes in a weighed sample of ovarian tissue. We looked for differences in oocyte density between the right and left ovary and found none. We then re- moved two tissue samples from the right ovary, and counted all the advanced yolked oocytes in both samples. In one of the samples we also measured the diameters of 30 randomly selected advanced yolked oocytes. Advanced oocytes were identified, counted, and measured using a digitizer linked by a video camera system to a dissection microscope.
Measuring the diameter of the advanced oocytes served several functions. It provided a criterion for selecting ovaries that had matured enough to accu- rately estimate the density of advanced oocytes (see next section). Diameter was also used to determine seasonal changes in maturity of the advanced group
HUNTER ET AL.: SABLEFISH REPRODUCTION CalCOFl Rep.,Vol. 30,1989
of oocytes. Finally, diameter provided an alternate method for estimating oocyte density. Oocyte den- sity (C) can be roughly estimated from the mean diameter (D) of oocytes, because the weight of the advanced oocytes is proportional to their volume (assuming a spherical form and a specific gravity of 1). Hence,
where '/6 r D' is the volume of a sphere, and D is mm/lO.
The coefficient of proportionality K was esti- mated for the October and January-February col- lections to determine if the density of advanced oocytes in the ovarian tissue changed over the spawning season. We did not measure the diameter of hydrated oocytes, nor did we use data from hy- drated ovaries to estimate K.
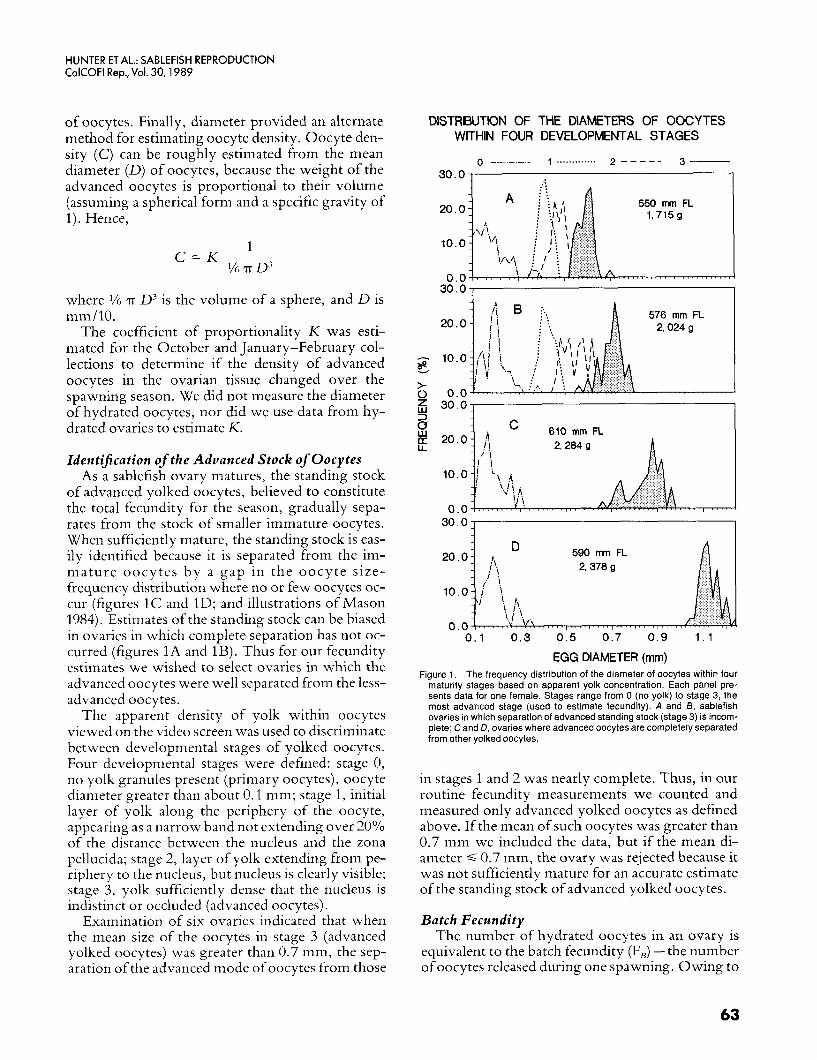
Identijication of the Advanced Stock of Oocytes As a sablefish ovary matures, the standing stock
of advanced yolked oocytes, believed to constitute the total fecundity for the season, gradually sepa- rates from the stock of smaller immature oocytes. When sufficiently mature, the standing stock is eas- ily identified because it is separated from the im- mature oocytes by a gap in the oocyte size- frequency distribution where no or few oocytes oc- cur (figures 1C and ID; and illustrations of Mason 1984). Estimates of the standing stock can be biased in ovaries in which complete separation has not oc- curred (figures 1A and 1B). Thus for our fecundity estimates we wished to select ovaries in which the advanced oocytes were well separated from the less- advanced oocytes.
The apparent density of yolk within oocytes viewed on the video screen was used to discriminate between developmental stages of yolked oocytes. Four developmental stages were defined: stage 0, no yolk granules present (primary oocytes), oocyte diameter greater than about 0.1 mm; stage 1, initial layer of yolk along the periphery of the oocyte, appearing as a narrow band not extending over 20% of the distance between the nucleus and the zona pellucida; stage 2, layer of yolk extending from pe- riphery to the nucleus, but nucleus is clearly visible; stage 3 , yolk sufficiently dense that the nucleus is indistinct or occluded (advanced oocytes).
Examination of six ovaries indicated that when the mean size of the oocytes in stage 3 (advanced yolked oocytes) was greater than 0.7 mm, the sep- aration of the advanced mode of oocytes from those
DISTRBUTDN OF THE DIAMETERS OF OOCYTES WITHIN FOUR DEVELOPMENTAL STAGES
0 1 ............. 2 - - - - - 3- 30.01 1
30.04
0.1 0.3 0.5 0.7 0.9 1 .1
EGG DIAMETER (mrn) Figure 1. The frequency distribution of the diameter of oocytes within four
maturity stages based on apparent yolk concentration. Each panel pre- sents data for one female. Stages range from 0 (no yolk) to stage 3, the most advanced stage (used to estimate fecundity). A and B, sablefish ovaries in which separation of advanced standing stock (stage 3) is incorn- plete; C and D, ovaries where advanced oocytes are completely separated from other yolked oocytes.
in stages 1 and 2 was nearly complete. Thus, in our routine fecundity measurements we counted and measured only advanced yolked oocytes as defined above. If the mean of such oocytes was greater than 0.7 mm we included the data, but if the mean di- ameter 4 0.7 mm, the ovary was rejected because it was not sufficiently mature for an accurate estimate of the standing stock of advanced yolked oocytes.
Batch Fecundity The number of hydrated oocytes in an ovary is
equivalent to the batch fecundity (FB) -the number ofoocytes released during one spawning. Owing to
63
HUNTER ET AL.: SABLEFISH REPRODUCTION CalCOFl Rep., Vol. 30,1989
their large diameter (about 2 mm) and translucent appearance, hydrated oocytes are easily identified. Batch fecundity was estimated for 17 females taken in the 1987 research trawl survey by counting the number of hydrated oocytes in two tissue samples per ovary. We also estimated the number of non- hydrated advanced oocytes present in the same ovary using the procedure described for estimating total fecundity. A sample of 17 ovaries was too small to determine the relation between fish weight ( W, always calculated as ovary-free female weight) and batch fecundity; thus batch fecundity was ex- pressed as relative batch fecundity (F,/W) [batch fecundity/ovary free female weight]. Total fecund- ity (FT) for females with hydrated ovaries was the sum of the hydrated and advanced yolked oocytes.
His to log ica 1 An a ly s is Fresh ovaries from the 1987 research trawl survey
were preserved in 10% neutral buffered Formalin and embedded in Paraplast. Histological sections were cut at 5-6 p m and stained with Harris hema- toxylin followed by eosin counterstain (H&E). We did not histologically examine ovaries from the Oc- tober 1986 survey because most of the fish had been frozen before being preserved in Formalin. Conse- quently, they were unsuitable for detailed histolog- ical analysis. Ovaries of sablefish taken in 1988 were not preserved.
Each ovary was classified histologically in the manner developed for northern anchovy (Engvuulis mordux) by Hunter and Goldberg (1980), and Hunter and Macewicz (1980, 1985a,b), with a few modifications appropriate for sablefish ovarian structure. In the ovary we identified the presence or absence of oocytes in the first vitellogenic stages; advanced yolked oocytes; migratory nucleus stage oocytes (precursor to hydration); hydrated oocytes; postovulatory follicles; and three stages of atretic oocytes. The rate at which postovulatory follicles are resorbed in sablefish is unknown. Thus no ages were assigned to postovulatory follicles. Spent ova- ries usually contained two groups of postovulatory follicles of differing deterioration, indicating two past spawnings. The oldest group of postovulatory follicles had to be at least 48 hr old; we suspect they were older because of their small size and extent of resorption.
RESULTS
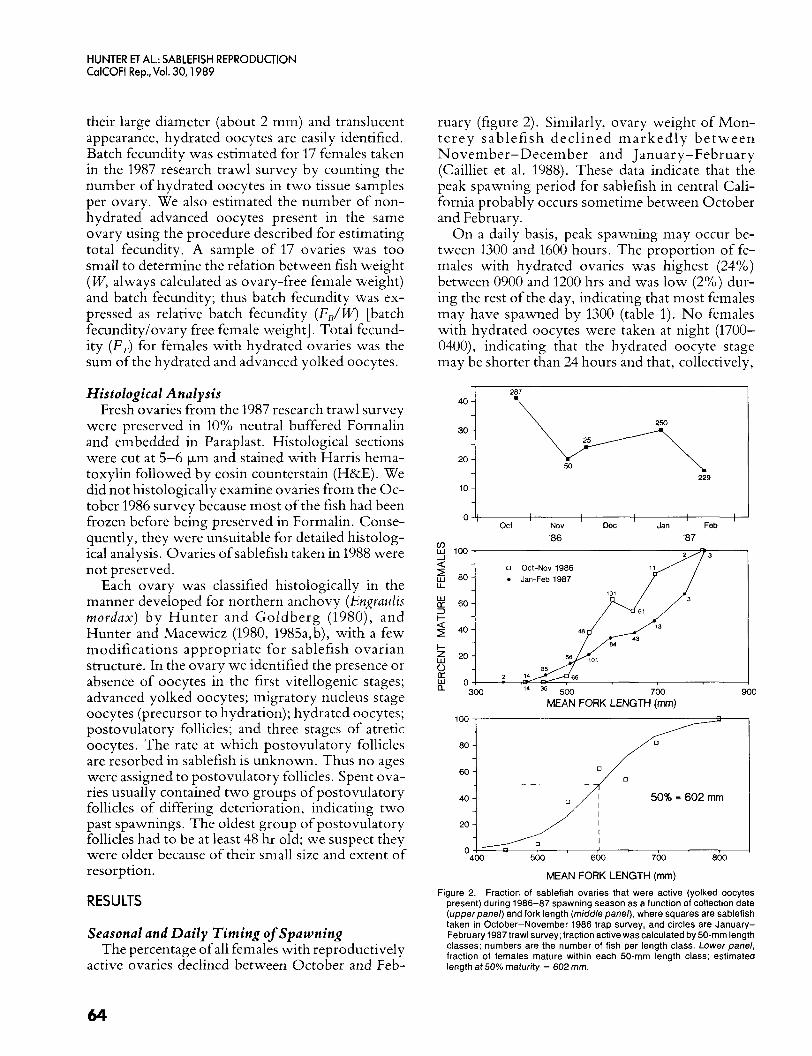
Seasonal and Daily Timing of Spawning The percentage of all females with reproductively
active ovaries declined between October and Feb-
ruary (figure 2). Similarly, ovary weight of Mon- terey sablefish declined marked ly be tween November-December and January-February (Cailliet et al. 1988). These data indicate that the peak spawning period for sablefish in central Cali- fornia probably occurs sometime between October and February.
O n a daily basis, peak spawning may occur be- tween 1300 and 1600 hours. The proportion of fe- males with hydrated ovaries was highest (24%) between 0900 and 1200 hrs and was low (2%) dur- ing the rest of the day, indicating that most females may have spawned by 1300 (table 1). No females with hydrated oocytes were taken at night (1700- 0400), indicating that the hydrated oocyte stage may be shorter than 24 hours and that, collectively,
10 1 229 I 0
Oct Nov DeC Jan Feb '86 '87 E 100
0 Oct-Nov 1986 5 80- Jan-Feb 1987
W IL 60 -
6 z 40-
! MEAN FORK LENGTH (mm)
10
20 , / i I I I
400 500 600 700 800 0
MEAN FORK LENGTH (mm)
Figure 2. Fraction of sablefish ovaries that were active (yolked oocytes present) during 1986-87 spawning season as a function of collection date (upperpanel) and fork length (middle panel), where squares are sablefish taken in October-November 1986 trap survey, and circles are January- February 1987 trawl survey; fraction active was calculated by 50-mm length classes; numbers are the number of fish per length class. Lower panel, fraction of females mature within each 50-mm length class; estimated length at 50% maturity = 602 mm.
64
HUNTER ET AL.: SABLEFISH REPRODUCTION CalCOFl Rep., Vol. 30,1989
1988 .'
TABLE 1 Percentage of Female Sablefish with Ovaries
Containing Hydrated Oocytes
Time of capture
~
0030-0429 0430-0829 0830-1229 1230- 1629 1630-2029 2030-0029 Entire day
Total N
20 50 67
111 30 75
353
Data from January-February 1987 survey.
Percent hydrated
0 2.0
23.9 1.8
0 0
5.4
~~ ~~
~
the processes of hydration, ovulation, and spawn- ing may require less than 24 hours to complete.
Length, Maturity, and Bathymetry The percent maturity of sablefish females (P) as a
function of fork length was estimated using the lo- gistic regression
where x = forklength in mm; a = -11.978, SE(a) = 1.439, [ (a) = -8.322; b = 0.020, SE(b) = 0.00244, t(b) = 8.177; and DF = 335. In October the percentage of females with active ovaries in- creased with length; about 50% of females were reproductively active at 60 cm FL (figure 2). Mis- classification of mature females as immature was unlikely because October was early in the spawning season. Our estimate of female length at first ma- turity (60 cm FL) was similar to that for females from British Columbia, where values ranged from 58 to 62 cm FL (Mason et al. 1983), and to that for females from northern California (56 cm; Fujiwara and Hankin 1988).
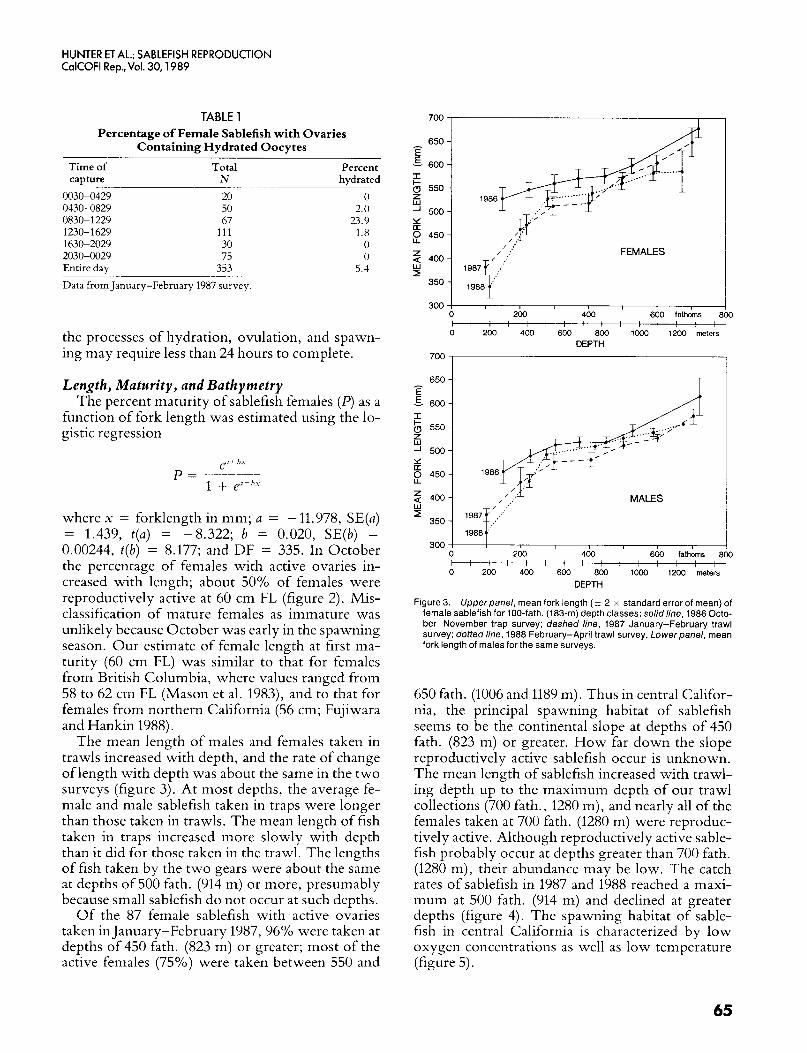
The mean length of males and females taken in trawls increased with depth, and the rate of change of length with depth was about the same in the two surveys (figure 3). At most depths, the average fe- male and male sablefish taken in traps were longer than those taken in trawls. The mean length of fish taken in traps increased more slowly with depth than it did for those taken in the trawl. The lengths of fish taken by the two gears were about the same at depths of 500 fath. (914 m) or more, presumably because small sablefish do not occur at such depths.
Of the 87 female sablefish with active ovaries taken in January-February 1987, 96% were taken at depths of 450 fath. (823 m) or greater; most of the active females (75%) were taken between 550 and
700 I I
650 E E 600 I $ 550
-
5 500 z 2 450
I 350
1 ,: , . FEMALES
300 I 0 200 400 600 fathoms I 0 t I I I I I I I I I I I I ; I 0 200 400 600 800 loo0 1200 meters
DEPTH 700
650 E 5 600 I 6 550
500 Y [r 2 450
-
5
3 400 350
T
0 0 200 400 600 fathoms 8 t I I I : I I I I I I I I I I 0 200 400 600 800 1000 1200 meters
DEPTH
Figure 3. Upper panel, mean fork length (i- 2 x standard error of mean) of female sablefish for 100-fath. (183-m) depth classes: solidline, 1986 Octo- ber-November trap survey; dashed line, 1987 January-February trawl survey; dotted line, 1988 February-April trawl survey. Lowerpanel, mean fork length of males for the same surveys.
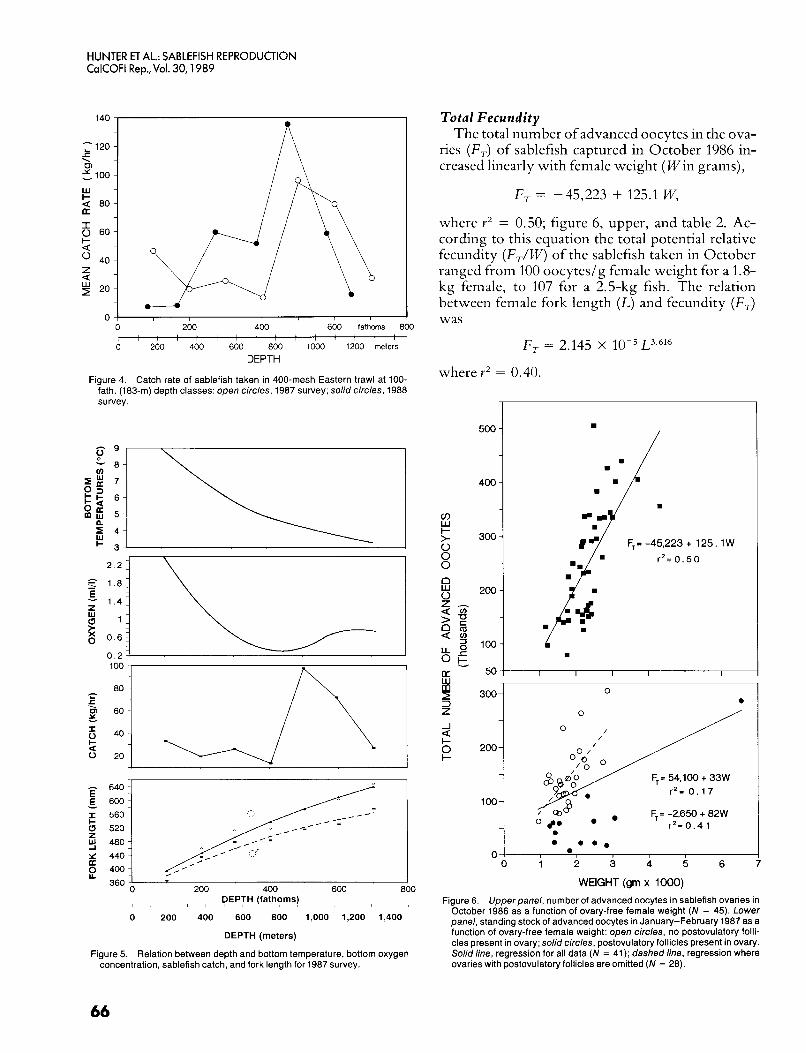
650 fath. (1006 and 1189 m). Thus in central Califor- nia, the principal spawning habitat of sablefish seems to be the continental slope at depths of 450 fath. (823 m) or greater. How far down the slope reproductively active sablefish occur is unknown. The mean length of sablefish increased with trawl- ing depth up to the maximum depth of our trawl collections (700 fath., 1280 m), and nearly all of the females taken at 700 fath. (1280 m) were reproduc- tively active. Although reproductively active sable- fish probably occur at depths greater than 700 fath. (1280 m), their abundance may be low. The catch rates of sablefish in 1987 and 1988 reached a maxi- mum at 500 fath. (914 m) and declined at greater depths (figure 4). The spawning habitat of sable- fish in central California is characterized by low oxygen concentrations as well as low temperature (figure 5).
65
HUNTER ET AL.: SABLEFISH REPRODUCTION CalCOFl Rep., Vol. 30,1989
- 640 E E 600- I 560 ~
& 520 2
Y 440 ~
- y 480-
2 400- a
360
o ! 1 0 200 400 600 fathoms 800 1 ; : ; : ; ; ; ; ; ; ; ; ; ; 0 200 400 600 800 1000 1200 meters
DEPTH
Figure 4. Catch rate of sablefish taken in 400-mesh Eastern trawl at 100- fath. (183-111) depth classes: open circles, 1987 survey; solid circles, 1988 survey.
,
=1 E 1
z w
E 0
-
2.2 1
1.8:
1.4 1
1 1
0.6 1
0 . 2 -,
0 .
100
80
40
20
Total Fecundity The total number of advanced oocytes in the ova-
ries ( F T ) of sablefish captured in October 1986 in- creased linearly with female weight (Win grams),
F , -45,223 + 125.1 W,
where Y’ = 0.50; figure 6, upper, and table 2. Ac- cording to this equation the total potential relative fecundity (F,/W) of the sablefish taken in October ranged from 100 oocytedg female weight for a 1.8- kg female, to 107 for a 2.5-kg fish. The relation between female fork length (L) and fecundity (F,) was
F , = 2.145 x L3.616
wherev’ = 0.40.
500 -
400 - ====/
F,= -45,223 + 125.1W
r 2 = 0 . 5 0
300 -
du I I I 1 I 1 I
300 1 0
F, = 54.100 + 33W r z = 0 . 1 7
F,. = -2.650 + a2w r 2 = 0 . 4 1 0 8 0
0
WEIGHT (gm x 1000) Figure 6. Upperpanel, number of advanced oocytes in sablefish ovaries in
October 1986 as a function of ovary-free female weight (N = 45). Lower panel, standing stock of advanced oocytes in January-February 1987 as a function of ovary-free female weight: open circles, no postovulatory folli- cles present in ovary; solid circles, postovulatory follicles present in ovary. Solid line, regression for all data (N = 41); dashed line, regression where ovaries with postovulatory follicles are omitted (N = 28).
66
HUNTER ET AL.: SABLEFISH REPRODUCTION CalCOFl Rep., Vol. 30,1989
TABLE 2 Standing Stock of Oocytes in Sablefish Ovaries in Order of Female Weight (Ovary-Free) Within a Survey Period
January 16 to February 13,1987 October 20 to 28,1986
Female
Wet weight
(g) 1165 1218 1535 1654 1686 1752 1766 1797 1797 1891 1922 1988 2062 2118 2164 2182 2183 2184 2206 2207 2221 2241 2290 2312 2330 2345 2351 2362 2375 2414 2434 2440 2465 2472 2519 2534 2579 2595 2660 2728 2793 2878 2888 2953 3015 3096 3275 3394 3730 4328
____ -
Fork length
500 510 560 540 550 560 560 550 580 570 570 630 570 590 590 590 620 610 590 600 610 580 610 620 600 590 590 600 600 620 630 610 620 610 650 620 630 610 620 620 640 640 560 640 670 670 650 680 690 720
. LmmL
Ovary weight
(g) 110 49
125 72 29 93 80 63
184 122 128 202 99
122 141 112 97
100 123 178 129 149 126 159 126 145 164 65
111 171 156 121 58 65 96
107 91
251 106 242 264 124 132 127 224 189 145 136 370 409
Standing stock of
advanced oocytes
(thousands)
132 97
146 140 51 80
161 143 224 189 249 505 160 243 28 1 154 141 288 126 232 29 1 336 163 161 171 232 151 270 339 176 155 291 234 388 199 316 295 382 333 261 335 426 201 344 334 40 1 439 556 405 356
Thousands of Female advanced oocytes
~ ~~
Wet Fork Ovary
(g) (mm) (g) hydrated Hydrated Total
944 474 86 62 0 62 1173 528 133 136 0 136 1228 500 172 149 0 149 1262 515 235 0 54 54 1300 520 136 139 0 139 1355 502 281 1 59 60 1394 538 130 0 23 23 1418 552 194 0 41 41 1434 522 148 124 0 124 1441 530 104 80 0 80 1515 540 109 78 0 78
0 112 1525 557 125 112 1529 548 237 6 53 59 1543 550 169 138 0 138
0 132 1568 540 194 132 1645 632 791 103 134 237 1656 540 169 114 0 114 1698 547 171 126 0 126 1722 572 147 21 63 84
64 51 115 1729 545 355 1760 524 245 143 0 143 1779 545 291 14 86 100 1799 577 109 91 0 91 1807 595 77 6 0 6 1892 550 238 182 0 182 1920 560 215 131 0 131 1958 595 134 116 0 116 2003 605 423 74 71 145
0 194 2094 590 268 194 2107 610 153 0 22 22 2143 597 351 264 I, 264 2215 590 163 178 0 178
0 164 2291 594 239 164 28 82 110 2309 620 391
2470 630 315 2 62 63 2501 636 44 22 0 22
0 173 2744 582 296 173 2838 625 122 0 17 17 2866 660 564 207 99 306 3058 665 326 0 69 69 6543 818 938 31 255 286
weight length weight Non-
-
~~
Post- ovulatory follicles
+ = present - = absent
-
-
-
+ + + +
-
-
- -
-
+ -
- -
-
-
- -
- - - + - -
-
-
-
+ - -
-
+ + + + + +
-
-
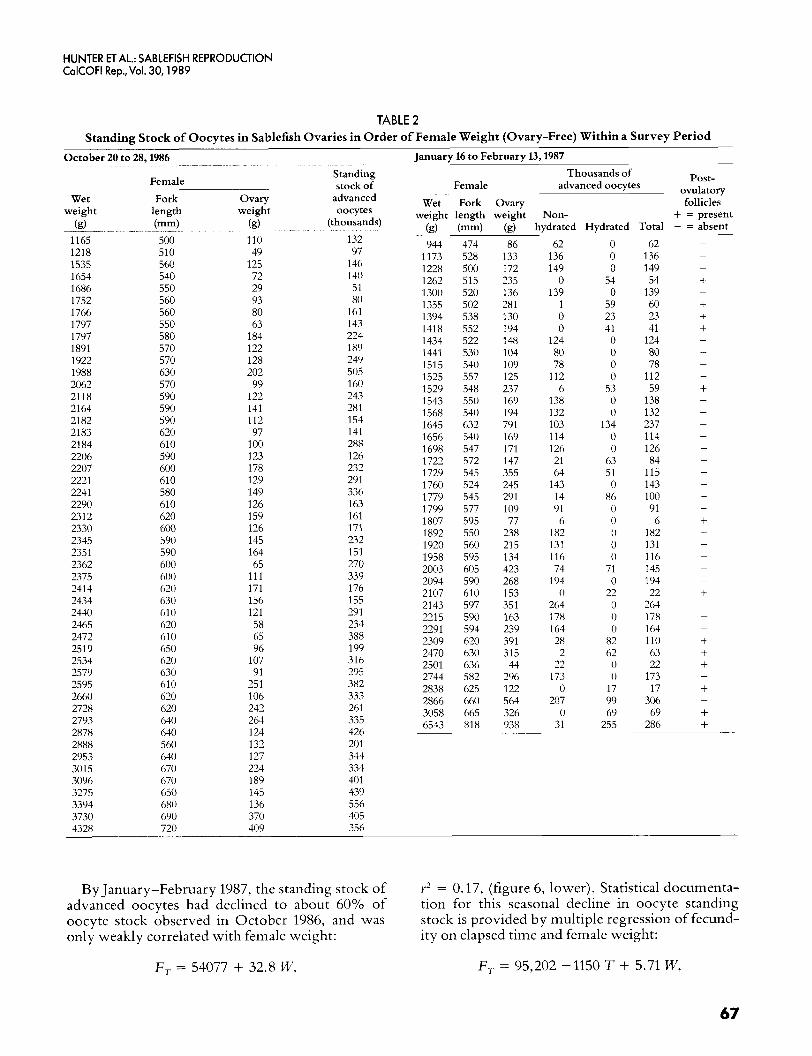
By January-February 1987, the standing stock of advanced oocytes had declined to about 60% of oocyte stock observed in October 1986, and was only weakly correlated with female weight:
Y* = 0.17, (figure 6, lower). Statistical documenta- tion for this seasonal decline in oocyte standing stock is provided by multiple regression of fecund- ity on elapsed time and female weight:
F, = 54077 + 32.8 W, F, = 95,202 -1150 T + 5.71 W,
67
HUNTER ET AL.: SABLEFISH REPRODUCTION CalCOFl Rep., Vol. 30,1989
where Tis elapsed time from October 20, and R2 = 0.50. Relative fecundity (FT/W) declined from 105 oocytes/g (SD = 36.0, N = 45) in October to 64 oocytes/g (SD = 33.9, N = 41) in January- February. A t test showed that the means were sig- nificantly different ( p < 0.05, t = 5.41, DF = 83). This seasonal decline in the standing stock of ad- vanced oocytes indicates that some of the females had spawned part of their advanced stock of oo- cytes, and these oocytes were not replaced. There- fore determinate fecundity is indicated.
The weak relation between fecundity and fish weight in January-February (? = 0.17) was proba- bly caused by variation in the number of spawnings completed by each female. That females with post- ovulatory follicles (solid circles, figure 6, lower) had the lowest fecundity for a given weight sup- ports this conclusion. The relative fecundity of fe- males without postovulatory follicles was 81 oocytes/g (SD = 24, N = 28), whereas that for fish with postovulatory follicles was only 26 oocytes/g (SD = 15, N = 13). Thus, spawning has reduced the standing stock of advanced oocytes and conse- quently supports the assumption of determinate fe- cundity. The relation between fecundity and female weight for January-February is much stronger if females with postovulatory follicles are excluded:
F , = 82.5 W - 2652,
y2 = 0.41 (figure 6, dashed line). This indicates that the high variability in the January-February 1987 data was caused by spawning. The slope of the regression of fecundity on weight for January- February 1987 is lower than the one for October 1986 even when fish with postovulatory follicles are excluded. Thus spawning probably occurred in fe- males in which no postovulatory follicles were de- tected. Presumably, enough time had elapsed before capture for the postovulatory follicles to be resorbed in these fish.
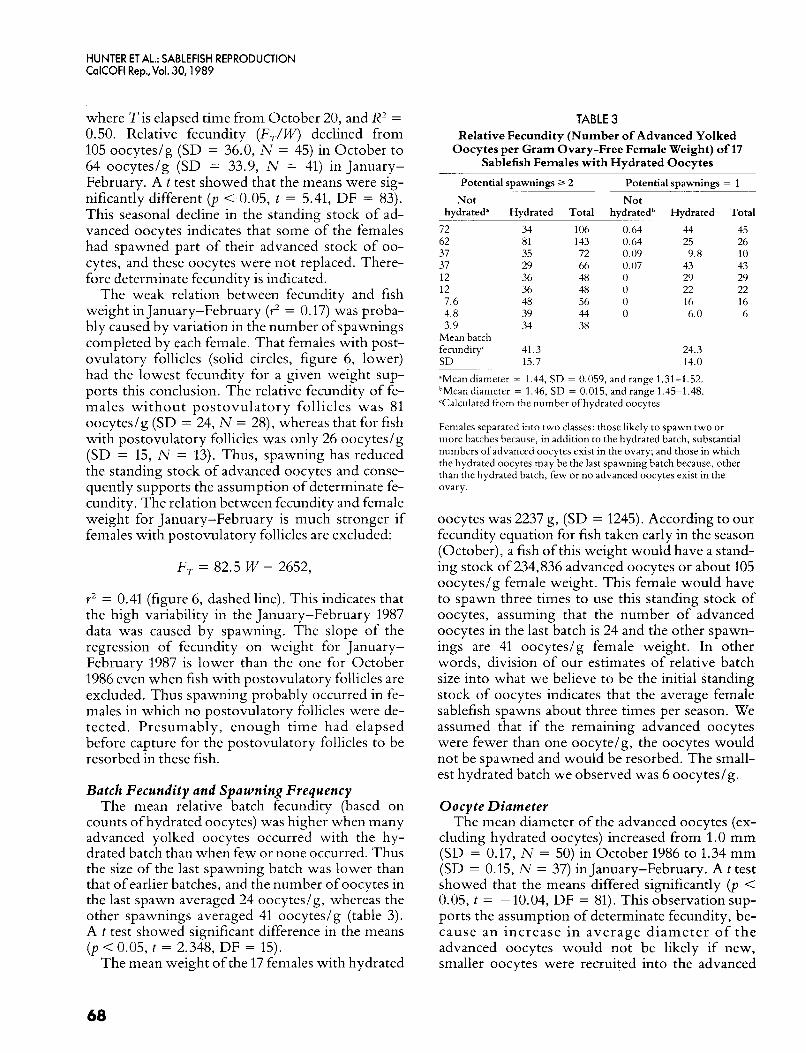
Batch Fecundity and Spawning Frequency The mean relative batch fecundity (based on
counts of hydrated oocytes) was higher when many advanced yolked oocytes occurred with the hy- drated batch than when few or none occurred. Thus the size of the last spawning batch was lower than that of earlier batches, and the number of oocytes in the last spawn averaged 24 oocytes/g, whereas the other spawnings averaged 41 oocytedg (table 3). A t test showed significant difference in the means (p < 0.05, t = 2.348, DF = 15).
The mean weight of the 17 females with hydrated
TABLE 3 Relative Fecundity (Number of Advanced Yolked
Oocytes per Gram Ovary-Free Female Weight) of 17 Sablefish Females with Hydrated Oocytes
Potential spawnings 3 2 Not
hydrated' Hydrated Total
- -~
- ~- -
72 34 106 62 81 143 37 35 72 37 29 66 12 36 48 12 36 48 7 6 48 56 4 8 39 44 3 9 34 38
Mean batch fecundity' 41 3 SD 15 7
Potential spawnings = 1 Not
hydratedb Hydrated Total
0.64 44 45 0.64 25 26 0.09 9.8 10 0.07 43 43 0 29 29 0 22 22 0 16 16 0 6.0 6
___
24.3 14.0
"Mean diameter = 1.44, SD = 0.059, and range 1.31-1.52. hMeandidmeter = 1.46, SD = 0.015, and range 1.45-1.48. Calculated from the number of hydrated oocytes
Females separated into two classes: those likely to spawn two or more batches because, in addition to the hydrated batch, substantial numbers of advanced oocytes exist in the ovary; and those in which the hydrated oocytes may be the last spawning batch because, other than the hydrated batch, few or no advanced oocytes exist in the ovary.
oocytes was 2237 g, (SD = 1245). According to our fecundity equation for fish taken early in the season (October), a fish of this weight would have a stand- ing stock of 234,836 advanced oocytes or about 105 oocytes/g female weight. This female would have to spawn three times to use this standing stock of oocytes, assuming that the number of advanced oocytes in the last batch is 24 and the other spawn- ings are 41 oocytes/g female weight. In other words, division of our estimates of relative batch size into what we believe to be the initial standing stock of oocytes indicates that the average female sablefish spawns about three times per season. We assumed that if the remaining advanced oocytes were fewer than one oocyte/g, the oocytes would not be spawned and would be resorbed. The small- est hydrated batch we observed was 6 oocytes/g.
Oocyte Diameter The mean diameter of the advanced oocytes (ex-
cluding hydrated oocytes) increased from 1.0 mm (SD = 0.17, N = 50) in October 1986 to 1.34 mm (SD = 0.15, N = 37) in January-February. A t test showed that the means differed significantly (p < 0.05, t = - 10.04, DF = 81). This observation sup- ports the assumption of determinate fecundity, be- cause an increase in average diameter o f the advanced oocytes would not be likely if new, smaller oocytes were recruited into the advanced
68
HUNTER ET AL.: SABLEFISH REPRODUCTION CalCOFl Rep., Vol. 30,1989
1 . 7
1 . 6
- E
$ 1 . 4 0 0 1.3
1 .2
a 1 . 1
1 n a
Y >
E 0.9 L
k!! 0 . 8
0 . 7 z G o .6
0 . 5 I 1 1 1 1 1 1 / 1 1 I 1 I I I I I
0 20 40 60 80 100 120 140 160 ELAPSED TIME (days)
I I I I I I I I
Oct Nov Dec Jan Feb '86 '87
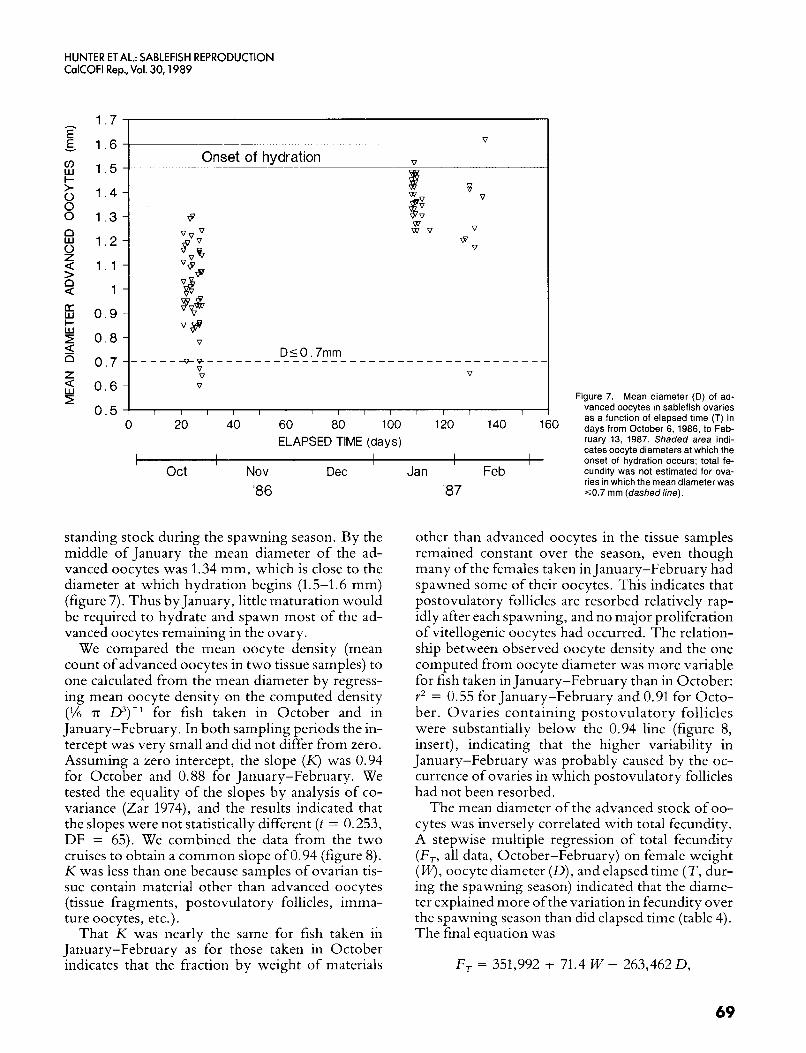
standing stock during the spawning season. By the middle of January the mean diameter of the ad- vanced oocytes was 1.34 mm, which is close to the diameter at which hydration begins (1.5-1.6 mm) (figure 7). Thus by January, little maturation would be required to hydrate and spawn most of the ad- vanced oocytes remaining in the ovary.
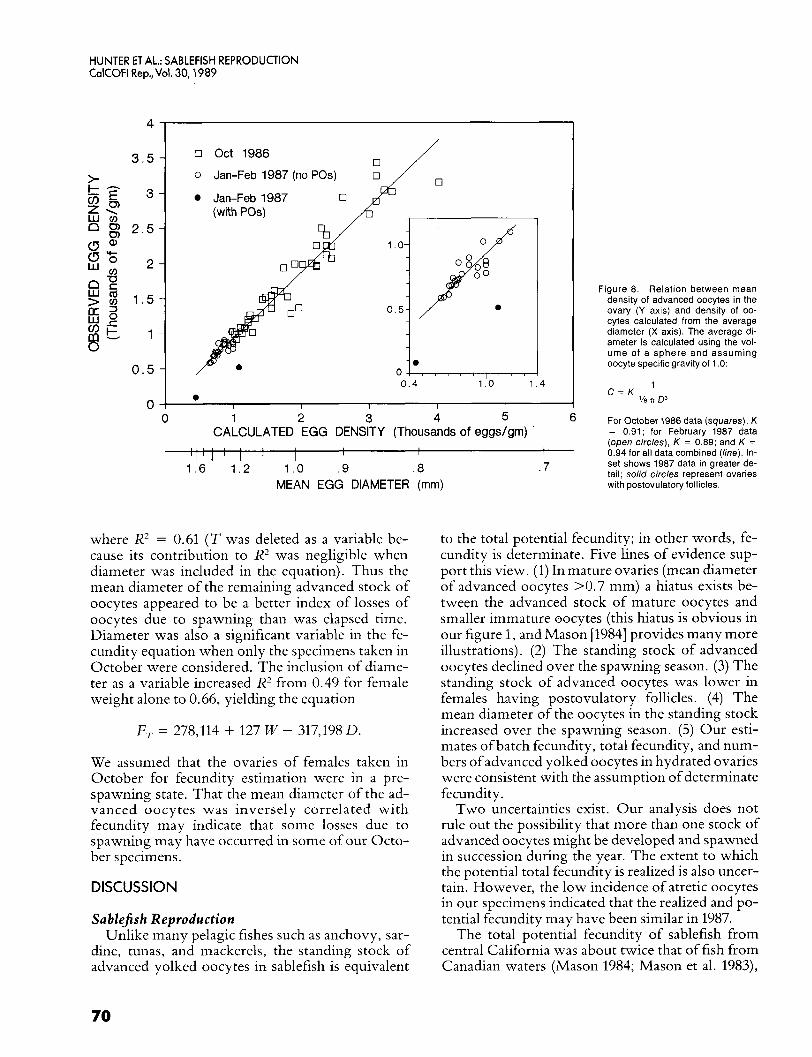
We compared the mean oocyte density (mean count of advanced oocytes in two tissue samples) to one calculated from the mean diameter by regress- ing mean oocyte density on the computed density (% T O3)-l for fish taken in October and in January-February. In both sampling periods the in- tercept was very small and did not differ from zero. Assuming a zero intercept, the slope ( K ) was 0.94 for October and 0.88 for January-February. We tested the equality of the slopes by analysis of co- variance (Zar 1974), and the results indicated that the slopes were not statistically different (t = 0.253, DF = 65). We combined the data from the two cruises to obtain a common slope of 0.94 (figure 8). K was less than one because samples of ovarian tis- sue contain material other than advanced oocytes (tissue fragments, postovulatory follicles, imma- ture oocytes, etc.).
That K was nearly the same for fish taken in January-February as for those taken in October indicates that the fraction by weight of materials
Figure 7. Mean diameter (D) of ad- vanced oocytes in sablefish ovaries as a function of elapsed time (T) in days from October 6, 1986, to Feb- ruary 13, 1987. Shaded area indi- cates oocyte diameters at which the onset of hydration occurs; total fe- cundity was not estimated for ova- ries in which the mean diameter was ~ 0 . 7 mm (dashedline).
other than advanced oocytes in the tissue samples remained constant over the season, even though many of the females taken in January-February had spawned some of their oocytes. This indicates that postovulatory follicles are resorbed relatively rap- idly after each spawning, and no major proliferation of vitellogenic oocytes had occurred. The relation- ship between observed oocyte density and the one computed from oocyte diameter was more variable for fish taken in January-February than in October: Y* = 0.55 for January-February and 0.91 for Octo- ber. Ovaries containing postovulatory follicles were substantially below the 0.94 line (figure 8, insert), indicating that the higher variability in January-February was probably caused by the oc- currence of ovaries in which postovulatory follicles had not been resorbed.
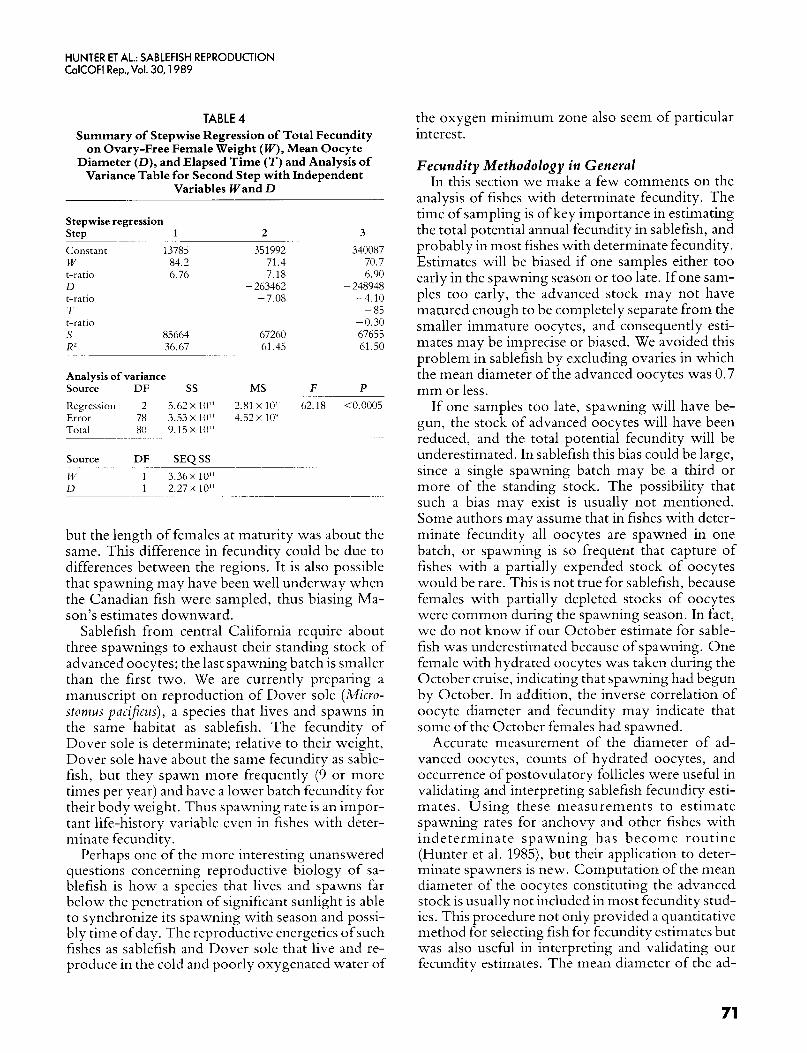
The mean diameter of the advanced stock of oo- cytes was inversely correlated with total fecundity. A stepwise multiple regression of total fecundity (FT , all data, October-February) on female weight ( W), oocyte diameter (D) , and elapsed time ( T , dur- ing the spawning season) indicated that the diame- ter explained more of the variation in fecundity over the spawning season than did elapsed time (table 4). The final equation was
F , = 351,992 + 71.4 W - 263,462D,
69
HUNTER ET AL.: SABLEFISH REPRODUCTION CalCOFl Rep.,Vol. 30,1989
4
3.5 - > b g 3 -
2.5-
*, 5 2 0 2 :: 2 -
E: 1.5- ' 2 6,. p 1 -
0.5 -
0 0
0 Oct 1986
0 Jan-Feb 1987 (no POs)
Jan-Feb 1987 (with POs)
0.4 1 0 1 4 e
I I I I I
1 2 3 4 5 6
where R2 = 0.61 ( T was deleted as a variable be- cause its contribution to R2 was negligible when diameter was included in the equation). Thus the mean diameter of the remaining advanced stock of oocytes appeared to be a better index of losses of oocytes due to spawning than was elapsed time. Diameter was also a significant variable in the fe- cundity equation when only the specimens taken in October were considered. The inclusion of diame- ter as a variable increased R2 from 0.49 for female weight alone to 0.66, yielding the equation
F , = 278,114 + 127 W - 317,198 D.
We assumed that the ovaries of females taken in October for fecundity estimation were in a pre- spawning state. That the mean diameter of the ad- vanced oocytes was inversely correlated with fecundity may indicate that some losses due to spawning may have occurred in some of our Octo- ber specimens.
DISCUSSION
Sablejish Reproduction Unlike many pelagic fishes such as anchovy, sar-
dine, tunas, and mackerels, the standing stock of advanced yolked oocytes in sablefish is equivalent
Figure 8. Relation between mean density of advanced oocytes in the ovary (Y axis) and density of oo- cytes calculated from the average diameter (X axis). The average di- ameter is calculated using the vot- ume of a sphere and assuming oocyte specific gravity of 1 .O:
For October 1986 data (squares), K = 0.91; for February 1987 data (open circles), K = 0.89; and K = 0.94 for all data combined (he) . In- set shows 1987 data in greater de- tail; solid circles represent ovaries with postovulatory follicles.
to the total potential fecundity; in other words, fe- cundity is determinate. Five lines of evidence sup- port this view. (1) In mature ovaries (mean diameter of advanced oocytes >0.7 mm) a hiatus exists be- tween the advanced stock of mature oocytes and smaller immature oocytes (this hiatus is obvious in our figure 1, and Mason [1984] provides many more illustrations). (2) The standing stock of advanced oocytes declined over the spawning season. (3) The standing stock of advanced oocytes was lower in females having postovulatory follicles. (4) The mean diameter of the oocytes in the standing stock increased over the spawning season. (5) Our esti- mates of batch fecundity, total fecundity, and num- bers of advanced yolked oocytes in hydrated ovaries were consistent with the assumption of determinate fecundity.
Two uncertainties exist. Our analysis does not rule out the possibility that more than one stock of advanced oocytes might be developed and spawned in succession during the year. The extent to which the potential total fecundity is realized is also uncer- tain. However, the low incidence of atretic oocytes in our specimens indicated that the realized and po- tential fecundity may have been similar in 1987.
The total potential fecundity of sablefish from central California was about twice that of fish from Canadian waters (Mason 1984; Mason et al. 1983),
70
HUNTER ET AL.: SABLEFISH REPRODUCTION CalCOFl Rep.,Vol. 30,1989
TABLE 4 Summary of Stepwise Regression of Total Fecundity
on Ovary-Free Female Weight (W), Mean Oocyte Diameter (D) , and Elapsed Time ( T ) and Analysis of
Variance Table for Second Step with Independent Variables Wand D
Stepwise regression
Constant 13785 W 84 2 t-ratio 6.76 D t-ratio T t-ratio S 85664 R2 36.67
Step 1 ~
2 351992
71.4 7.18
- 263462 -7.08
67260 61.45
3 ~~
340087 70.7 6.90
- 248948 - 4.10 - 85
-0.30 67655 61.50
Analysis of variance Source
Regression 2 5.62 X 10" 2.81 X 10" 62 18 <0 0005 Error 78 3.53 x 10" 4.52 x 10' Total 80 9 1 5 ~ 1 0 ' ~
DF ss MS F P ~ ~~~~~~~
~~~
but the length of females at maturity was about the same. This difference in fecundity could be due to differences between the regions. It is also possible that spawning may have been well underway when the Canadian fish were sampled, thus biasing Ma- son's estimates downward.
Sablefish from central California require about three spawnings to exhaust their standing stock of advanced oocytes; the last spawning batch is smaller than the first two. We are currently preparing a manuscript on reproduction of Dover sole (Micro- stomcis p ~ c i ~ c c i s ) , a species that lives and spawns in the same habitat as sablefish. The fecundity of Dover sole is determinate; relative to their weight, Dover sole have about the same fecundity as sable- fish, but they spawn more frequently (9 or more times per year) and have a lower batch fecundity for their body weight. Thus spawning rate is an impor- tant life-history variable even in fishes with deter- minate fecundity.
Perhaps one of the more interesting unanswered questions concerning reproductive biology of sa- blefish is how a species that lives and spawns far below the penetration of significant sunlight is able to synchronize its spawning with season and possi- bly time of day. The reproductive energetics of such fishes as sablefish and Dover sole that live and re- produce in the cold and poorly oxygenated water of
the oxygen minimum zone also seem of particular interest.
Fecundity Methodology in General In this section we make a few comments on the
analysis of fishes with determinate fecundity. The time of sampling is of key importance in estimating the total potential annual fecundity in sablefish, and probably in most fishes with determinate fecundity. Estimates will be biased if one samples either too early in the spawning season or too late. If one sam- ples too early, the advanced stock may not have matured enough to be completely separate from the smaller immature oocytes, and consequently esti- mates may be imprecise or biased. We avoided this problem in sablefish by excluding ovaries in which the mean diameter of the advanced oocytes was 0.7 mm or less.
If one samples too late, spawning will have be- gun, the stock of advanced oocytes will have been reduced, and the total potential fecundity will be underestimated. In sablefish this bias could be large, since a single spawning batch may be a third or more of the standing stock. The possibility that such a bias may exist is usually not mentioned. Some authors may assume that in fishes with deter- minate fecundity all oocytes are spawned in one batch, or spawning is so frequent that capture of fishes with a partially expended stock of oocytes would be rare. This is not true for sablefish, because females with partially depleted stocks of oocytes were common during the spawning season. In fact, we do not know if our October estimate for sable- fish was underestimated because of spawning. One female with hydrated oocytes was taken during the October cruise, indicating that spawning had begun by October. In addition, the inverse correlation of oocyte diameter and fecundity may indicate that some of the October females had spawned.
Accurate measurement of the diameter of ad- vanced oocytes, counts of hydrated oocytes, and occurrence of postovulatory follicles were useful in validating and interpreting sablefish fecundity esti- mates. Using these measurements to estimate spawning rates for anchovy and other fishes with indeterminate spawning has become routine (Hunter et al. 1985), but their application to deter- minate spawners is new. Computation of the mean diameter of the oocytes constituting the advanced stock is usually not included in most fecundity stud- ies. This procedure not only provided a quantitative method for selecting fish for fecundity estimates but was also useful in interpreting and validating our fecundity estimates. The mean diameter of the ad-
71
HUNTER ET AL.: SABLEFISH REPRODUCTION CalCOFl Rep.,Vol. 30,1989
vanced oocytes increased during the spawning sea- son, was inversely correlated with fecundity, and the reciprocal of the oocyte diameter was propor- tional to the density of oocytes in the ovary. These relationships helped substantiate the assumption of determinate fecundity. In addition, diameter mea- surement under certain circumstances may be a rapid method for estimating oocyte density and hence fecundity for determinate spawners.
The mean diameter of the advanced stock of oo- cytes is also the most accurate measure of ovarian maturity. Our histological analysis of sablefish ova- ries indicated that hydration begins when the di- ameter of the yolked oocyte is 1.5-1.6 m m ; investment of yolk ceases at this point, and the re- maining increase in oocyte volume is due primarily to water uptake. Thus the ovary can be considered to have a full energy content when all advanced yolked oocytes have a diameter of about 1.5 mm and no oocytes have been spawned. This is a con- dition we rarely, if ever, encountered. Ovaries in which the mean diameter of the advanced oocytes was close to 1.5 mm were taken late in the season, and some batches may have been spawned. The advanced stock of oocytes in ovaries collected early in the season, when spawning was unlikely, had a smaller average diameter (about 1.0 mm). If one were to use the weight of such early ovaries (dia. = 1.0 mm) as a measure of reproductive effort, it would be necessary to about triple the ovary weight to account for future investment of yolk during the spawning season. Thus even in a determinate spawner such as sablefish, gonad weight is an inac- curate measure of reproductive effort unless values are adjusted for maturity (oocyte diameter) and spawning losses.
ACKNOWLEDGMENTS We thank Tom Dark and Norman Parks (North-
west & Alaska Fishery Center) for providing sable- fish specimens and pe rmi t t i ng o u r use of unpublished data from their 1986 sablefish survey. We thank Sandra Owen (California Department of
Fish and Game) and Eric Lynn (Southwest Fisheries Center) for collecting sablefish, and Mark Draw- bridge and Wayne Kicklighter (Southwest Fisheries Center) for laboratory assistance.
LITERATURE CITED Cailliet, G. M., E. K. Osada, and M. Moser. 1988. Ecological studies
of sablefish in Monterey Bay. Calif. Fish Game 74(3):132-153. Fujiwara S., and D. G. Hankin. 1988. Sex ratio, spawning period, and
size and age at maturity of sablefish Anoplopomafimbria off northern California. Nippon Suisan Gakkaisihi 54:1333-1338.
Hunter, J. R., and S. R. Goldberg. 1980. Spawning incidence and batch fecundity in northern anchovy, Engraulis moudax. Fish. Bull., U.S.
Hunter, J. R., and B. J. Macewicz. 1980. Sexual maturity, batch fe- cundity, spawning frequency, and temporal pattern of spawning for the northern anchovy, Engraulis mordax, during the 1979 spawning season. Calif. Coop. Oceanic Fish. Invest. Rep. 21:139-149.
-. 1985a. Measurement of spawning frequency in multiple spawning fishes. In An egg production method for estimating spawning biomass of pelagic fish: application to the northern an- chovy, Etigraulis mordax, R. Lasker, ed. NOAA Tech. Rep. NMFS-
-. 1985b. Rates ofatresia in the ovary of captive and wild northern anchovy, Enguaulir mordax. Fish Bull., U. S. 83:119-136.
Hunter, J. R., N. C. H. Lo, and R. J. H. Leong. 1985. Batch fecundity in multiple spawning fishes. In An egg production method for esti- mating spawning biomass of pelagic fish: application to the northern anchovy, Eflgranlis mordax, R. Lasker, ed. NOAA Tech. Rep.
Mason, J. C. 1984. On the fecundity of the sablefish (Anoplopomafim- buia) in Canadian waters. Can. Tech. Rep. Fish. Aquat. Sci. No. 1290,17 pp.
Mason, J. C., R. J. Beamish, and G. A. McFarlane. 1983. Sexual ma- turity, fecundity, spawning, and early life history of sablefish (Ano- plopomafimbria) off the Pacific coast of Canada. Can. J. Fish. Aquat. Sci. 40:2126-2134.
MBC Applied Environmental Sciences., 947 Newhall St., Costa Mesa, CA 92627. 1987. Ecology of important fisheries species offshore California. Outer Continental Shelf Study, Minerals Management Service, U.S. Dept. Interior, MMS 864093,251 pp.
Norris, J. G., J. Rowley, and S. B. Matthews. 1987. Analysis of four factors affecting the sablefish soft fish problem. Univ. Wash., School of Fish., Fish Res. Inst., FRI-UW 8715,32 pp.
Phillips, J. B., and S. Imamura. 1954. The sablefish fishery ofCalifornia 11. Catch analysis. Pac. Mar. Fish. Comm. Bull. 3:23-37.
Sullivan, K. M. 1982. The bioenergetics of the sablefish (Anoplopoma fimbria) occurring off southern California and energy allocation dur- ing low-frequency feeding in deep-living benthopelagic fishes. Ph.D. thesis, Univ. California, San Diego, 237 pp.
Wathne, F. 1977. Performance of trawls used in resource assessment. Mar. Fish. Rev. 39:16-23.
Zar, J . H. 1974. Biostatistical analysis. Englewood Cliffs, N. J.: Pren- tice-Hall, 620 pp.
77:641-652.
36, pp. 79-94.
NMFS-36, pp. 67-77.
72


![The Fecundity of Freshwater Prawn (Macrobrachiumrosenbergii) … · According to [14], [7] and [9] the fecundity of wild population of giant freshwater prawn is ranged from 60000](https://img.pdfslide.net/doc/110x75/6129d6536ff061635c49ba2f/the-fecundity-of-freshwater-prawn-macrobrachiumrosenbergii-according-to-14.jpg)