Embed Size (px)
Citation preview
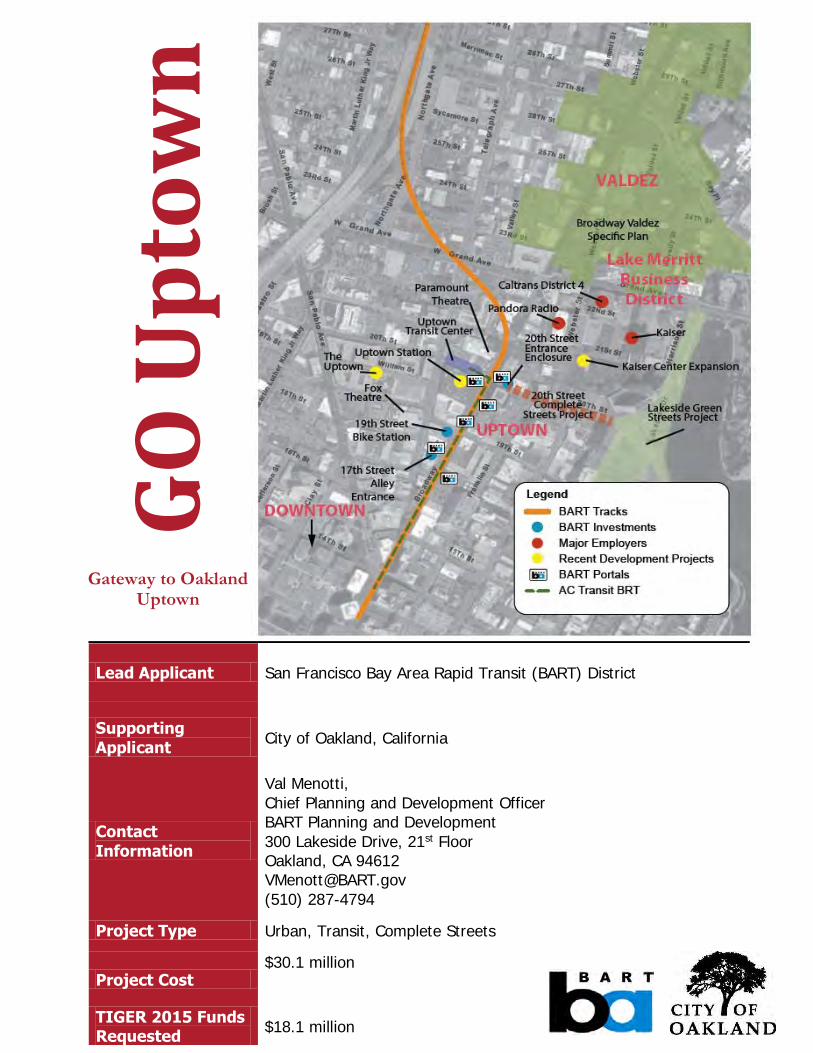
Lead Applicant San Francisco Bay Area Rapid Transit (BART) District
Supporting
Applicant City of Oakland, California
Contact
Information
Val Menotti,
Chief Planning and Development Officer BART Planning and Development
300 Lakeside Drive, 21st Floor Oakland, CA 94612 [email protected]
(510) 287-4794
Project Type Urban, Transit, Complete Streets
Project Cost $30.1 million
TIGER 2015 Funds Requested
$18.1 million
GO
Up
tow
n
Gateway to Oakland Uptown

TIGER 2015 Grant Application: G O Up town
TIGER 2015 Grant Application: G O Up town
TABLE OF CONTENTS
1. PROJECT INTRODUCTION AND DESCRIPTION ......................................................... 1
2. PROJECT LOCATION ......................................................................................... 5
3. PROJECT PARTIES ........................................................................................... 7
4. GRANT FUNDS AND SOURCES/USES OF PROJECT FUNDS .......................................... 8 4.1. Capital Sources of Funds ..................................................................................................................... 8 4.2. Capital Uses of Funds .......................................................................................................................... 8 4.3. Summary of Operating Sources and Uses of Funds ........................................................................ 9
5. SELECTION CRITERIA ....................................................................................... 9 5.1. Primary Selection Criteria .................................................................................................................... 9
5.1.1 State of Good Repair .....................................................................................................................................9 5.1.2 Economic Competitiveness .................................................................................................................... 11 5.1.3 Quality of Life ................................................................................................................................................ 16 5.1.4 Environmental Sustainability ............................................................................................................... 21 5.1.5 Safety ................................................................................................................................................................. 22
5.2. Secondary Criteria ............................................................................................................................... 23 5.2.1 Innovation ....................................................................................................................................................... 23 5.2.2 Partnership ..................................................................................................................................................... 23
6. BCA RESULTS .............................................................................................. 25
7. PROJECT READINESS ...................................................................................... 26 7.1. Technical Feasibility ............................................................................................................................ 26 7.2. Financial Feasibility ............................................................................................................................. 27 7.3. Project Schedule .................................................................................................................................. 27 7.4. Required Approvals ............................................................................................................................ 28
8. FEDERAL WAGE RATE CERTIFICATION ............................................................... 29
APPENDICES .................................................................................................... 30

TIGER 2015 Grant Application: G O Up town
TIGER 2015 Grant Application: G O Up town
San Francisco Bay Area Rapid Transit (BART) District/City of Oakland, California | 1
1. PROJECT INTRODUCTION AND DESCRIPTION
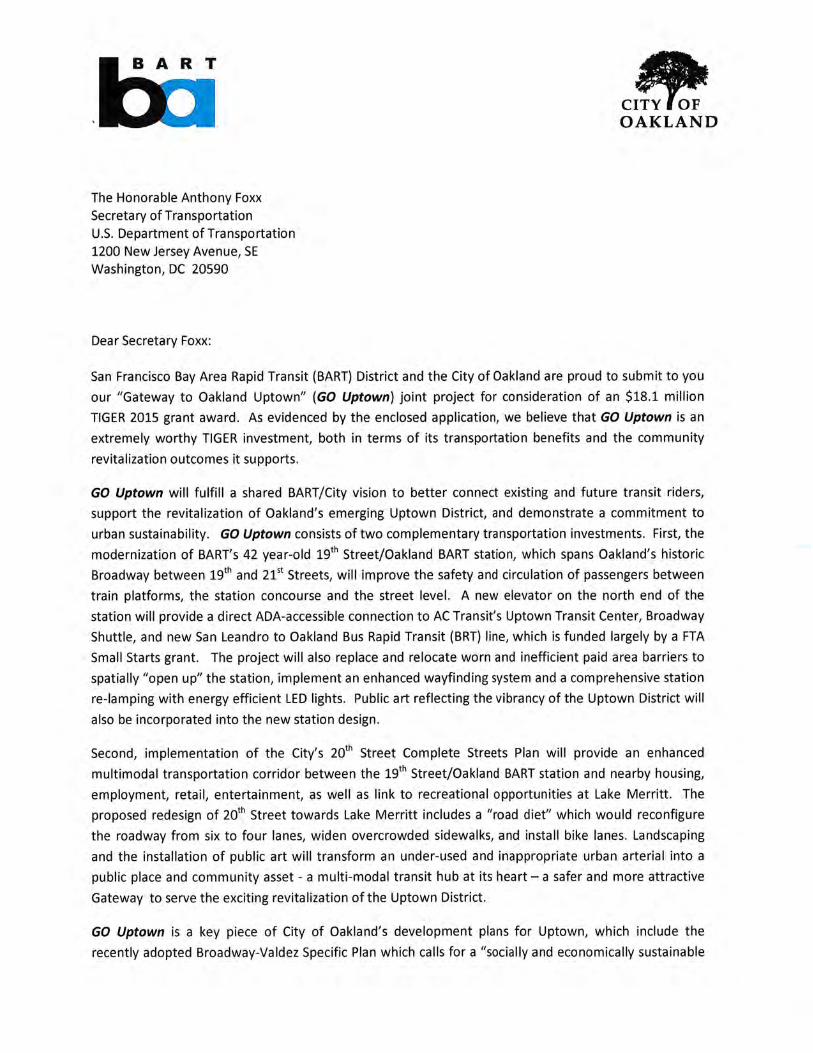
San Francisco Bay Area Rapid Transit (BART) is a critical component to the region’s economy. Each weekday, the BART heavy rail system carries over 430,000 passengers to jobs, education and training, healthcare, and other destinations over a 93 square mile service area. The Bay Area Economic Council has estimated that a temporary loss of BART service costs the region over $73 million per day in lost productivity1. Indeed, BART is the backbone of the 19th largest economy in the world2 - and serves as a lifeline of prosperity to the 27 percent of its daily ridership which does not have access to a private vehicle3.
On a micro scale, BART’s 44 stations are anchors for economic development in the communities they serve. BART’s 19th St/Oakland station is one such community asset. One of the system’s first stations when it opened in September 1972, the 19th St/Oakland station serves the northern end of downtown Oakland – commonly referred to as the “Uptown” neighborhood – as well as the Lake Merritt Business District and surrounding residential areas. The underground station sits between the intersections of 17th and 21st Streets and Broadway – Oakland’s “main street” and historic shopping district. A once thriving commercial area, the area experienced economic stagnation in the 1980’s and ‘90’s, with job growth and development in the region tending to concentrate (often around BART and other high capacity transit services) in the City of San Francisco and throughout the Peninsula, rather than Oakland and other East Bay communities. As recent as 2007, of the 200 largest publicly traded companies in the Bay Area, Oakland was home to only three, despite being the third largest city in the region4
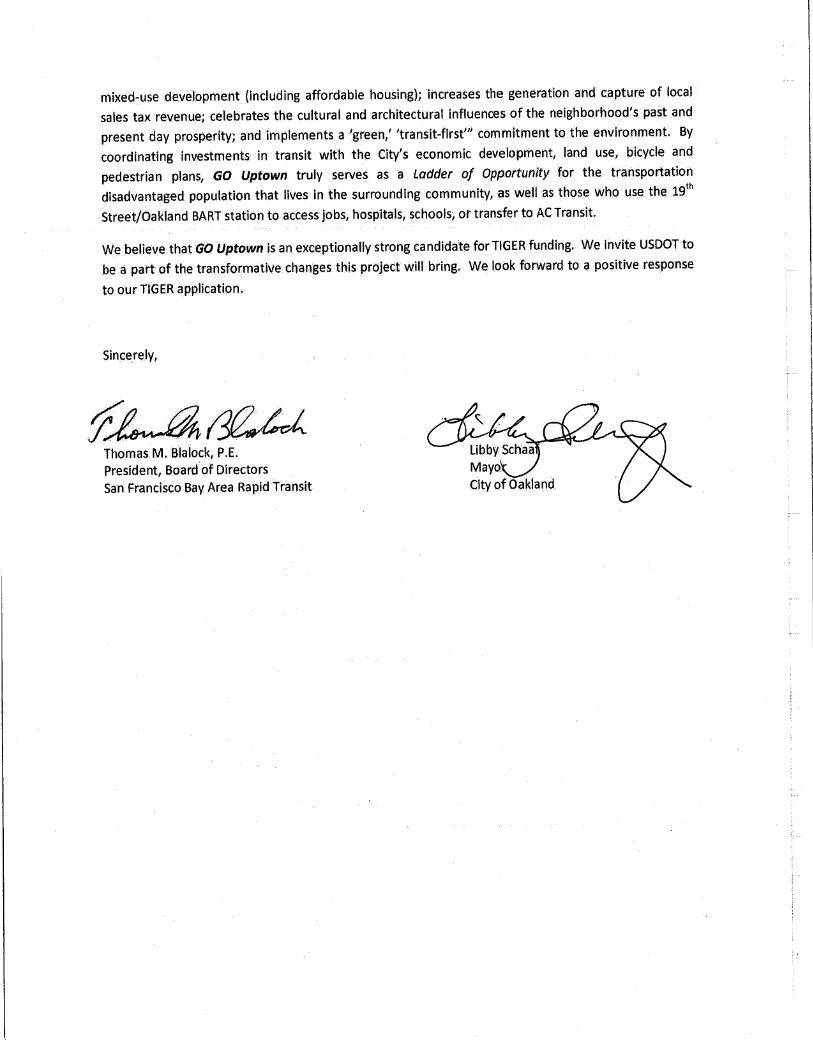
More recently, economic conditions have begun to improve in the Uptown area. Demand for office space is on the rise, and office and retail vacancy rates are declining. It all started in the early 2000’s when former Mayor (and current California Governor) Jerry Brown designated the Uptown District as the entertainment center of the city, and promoted new housing as part of his “10 K Program” to house 10,000 new residents in and around Downtown Oakland. More than 4,000 market rate and affordable housing units were built during that time, followed by a huge influx of new restaurants, bars, and
small entertainment venues. Other significant development projects in the area – as discussed in Sections 5.1.2 Economic Competitiveness and 5.1.3 Quality of Life - include the recent restoration of
1 http://www.bayareacouncil.org/economy/bay-area-council-economic-institute-puts-economic-cost-of-bart-strike-at-73-million-a-day/ 2 http://www.sfgate.com/business/article/S-F-Bay-Area-economy-thriving-despite-challenges-3414997.php 3 2008 BART Station Profile Study. BART. 4 Taking Stock of Oakland’s Economy. Oakland Metropolitan Chamber of Commerce. 2007.
Figure 2: Uptown District
Source: Greg Linhares
Figure 1: 19th St/Oakland Station Platform
Source: 19th St/Oakland BART Station Conceptual Design Plan
TIGER 2015 Grant Application: G O Up town
San Francisco Bay Area Rapid Transit (BART) District/City of Oakland, California | 2
the historic Fox Theater, the current renovation of the iconic Sears building at the corner of 20th Street and B roadway into creative office space, and the planned expansion of the Kaiser Center, expected to result in over 3,200 new jobs. Today there are several thousand units of new housing in the development pipeline.
The emerging revitalization of the area has resulted in an increase in BART ridership. Over the last ten years, the 19th St/Oakland BART station has experienced the most ridership growth of any BART station in Oakland, and second most in the entire East Bay. Moreover, BART forecasts 44,000 entries/exits at the station - an 80 percent increase - by 2040. A subsequent capacity analysis indicated that the 19th St/Oakland station is expected to suffer serious future passenger capacity constraints, particularly on its lower platform5. The analysis further noted the need for the replacement of worn station fixtures as the facility enters its 43rd year of service.
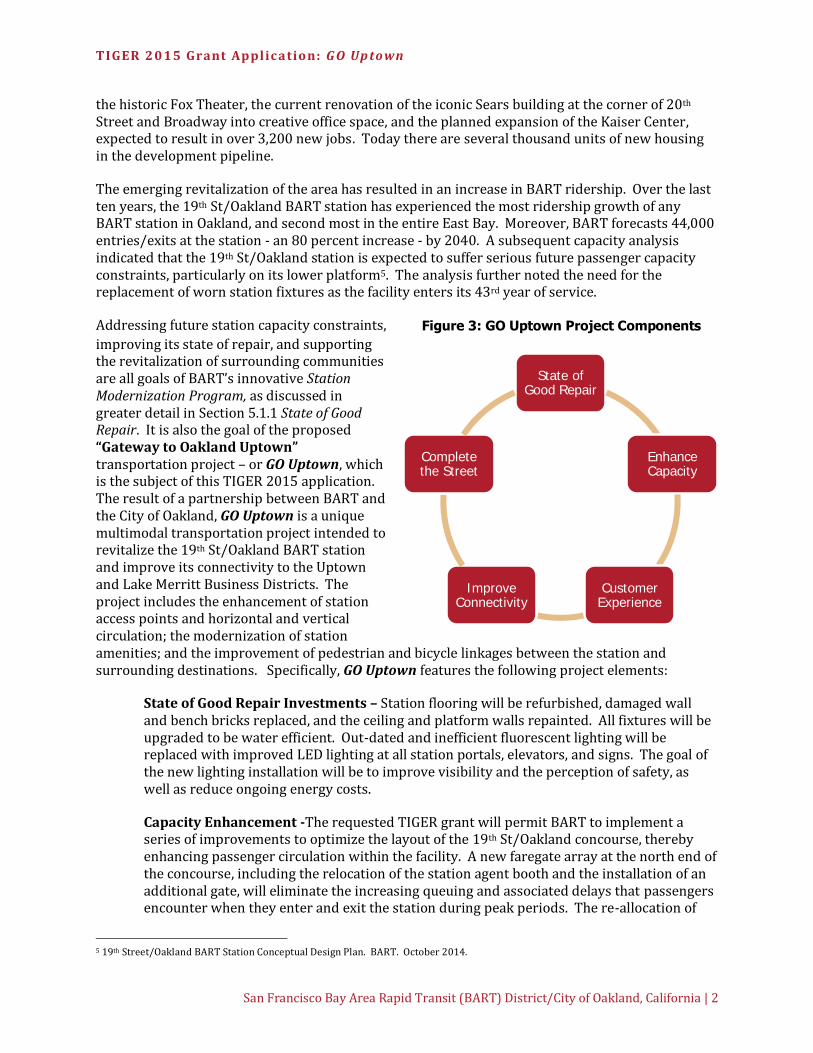
Addressing future station capacity constraints,
improving its state of repair, and supporting the revitalization of surrounding communities are all goals of BART’s innovative Station Modernization Program, as discussed in greater detail in Section 5.1.1 State of Good Repair. It is also the goal of the proposed “Gateway to Oakland Uptown” transportation project – or GO Uptown, which is the subject of this TIGER 2015 application. The result of a partnership between BART and the City of Oakland, GO Uptown is a unique multimodal transportation project intended to revitalize the 19th St/Oakland BART station and improve its connectivity to the Uptown and Lake Merritt Business Districts. The project includes the enhancement of station access points and horizontal and vertical circulation; the modernization of station amenities; and the improvement of pedestrian and bicycle linkages between the station and surrounding destinations. Specifically, GO Uptown features the following project elements:
State of Good Repair Investments – Station flooring will be refurbished, damaged wall and bench bricks replaced, and the ceiling and platform walls repainted. All fixtures will be upgraded to be water efficient. Out-dated and inefficient fluorescent lighting will be replaced with improved LED lighting at all station portals, elevators, and signs. The goal of the new lighting installation will be to improve visibility and the perception of safety, as well as reduce ongoing energy costs.
Capacity Enhancement -The requested TIGER grant will permit BART to implement a series of improvements to optimize the layout of the 19th St/Oakland concourse, thereby enhancing passenger circulation within the facility. A new faregate array at the north end of the concourse, including the relocation of the station agent booth and the installation of an additional gate, will eliminate the increasing queuing and associated delays that passengers encounter when they enter and exit the station during peak periods. The re-allocation of
5 19th Street/Oakland BART Station Conceptual Design Plan. BART. October 2014.
State of Good Repair
Enhance Capacity
Customer Experience
Improve Connectivity
Complete the Street
Figure 3: GO Uptown Project Components
TIGER 2015 Grant Application: G O Up town
San Francisco Bay Area Rapid Transit (BART) District/City of Oakland, California | 3
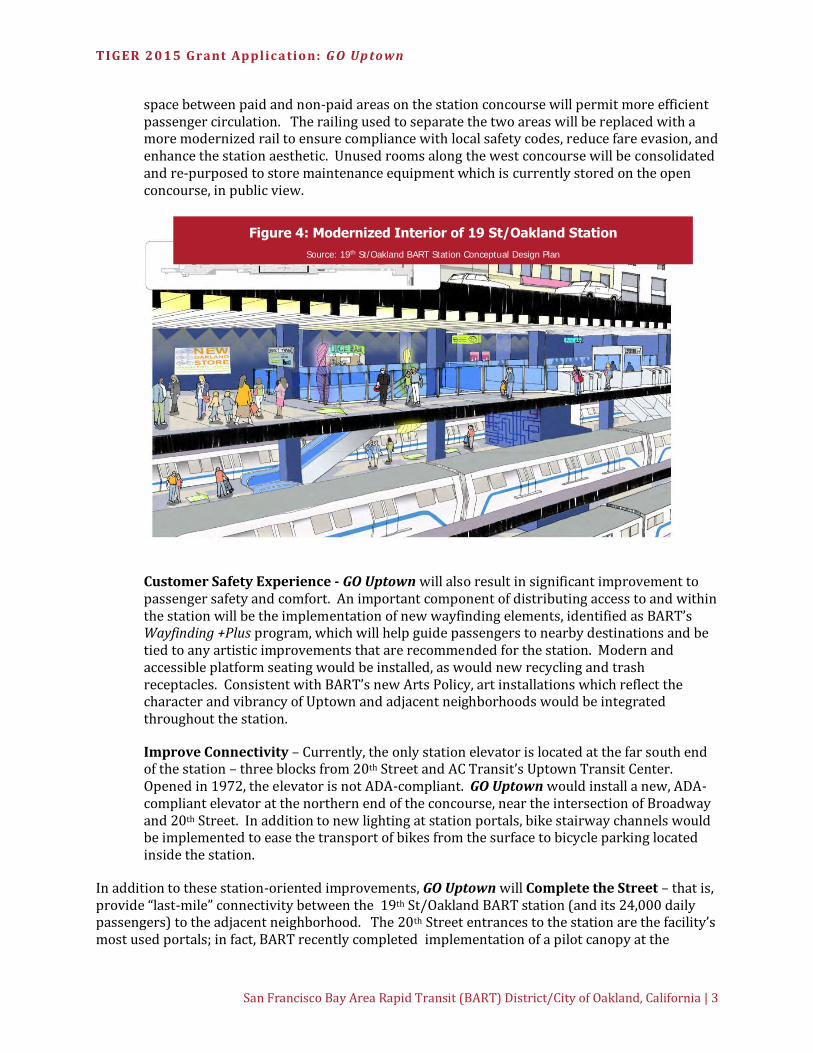
space between paid and non-paid areas on the station concourse will permit more efficient passenger circulation. The railing used to separate the two areas will be replaced with a more modernized rail to ensure compliance with local safety codes, reduce fare evasion, and enhance the station aesthetic. Unused rooms along the west concourse will be consolidated and re-purposed to store maintenance equipment which is currently stored on the open concourse, in public view.
Customer Safety Experience - GO Uptown will also result in significant improvement to passenger safety and comfort. An important component of distributing access to and within the station will be the implementation of new wayfinding elements, identified as BART’s Wayfinding +Plus program, which will help guide passengers to nearby destinations and be tied to any artistic improvements that are recommended for the station. Modern and accessible platform seating would be installed, as would new recycling and trash receptacles. Consistent with BART’s new Arts Policy, art installations which reflect the character and vibrancy of Uptown and adjacent neighborhoods would be integrated throughout the station.
Improve Connectivity – Currently, the only station elevator is located at the far south end of the station – three blocks from 20th Street and AC Transit’s Uptown Transit Center. Opened in 1972, the elevator is not ADA-compliant. GO Uptown would install a new, ADA-compliant elevator at the northern end of the concourse, near the intersection of Broadway and 20th Street. In addition to new lighting at station portals, bike stairway channels would be implemented to ease the transport of bikes from the surface to bicycle parking located inside the station.
In addition to these station-oriented improvements, GO Uptown will Complete the Street – that is, provide “last-mile” connectivity between the 19th St/Oakland BART station (and its 24,000 daily passengers) to the adjacent neighborhood. The 20th Street entrances to the station are the facility’s most used portals; in fact, BART recently completed implementation of a pilot canopy at the
Figure 4: Modernized Interior of 19 St/Oakland Station
Source: 19th St/Oakland BART Station Conceptual Design Plan
TIGER 2015 Grant Application: G O Up town
San Francisco Bay Area Rapid Transit (BART) District/City of Oakland, California | 4
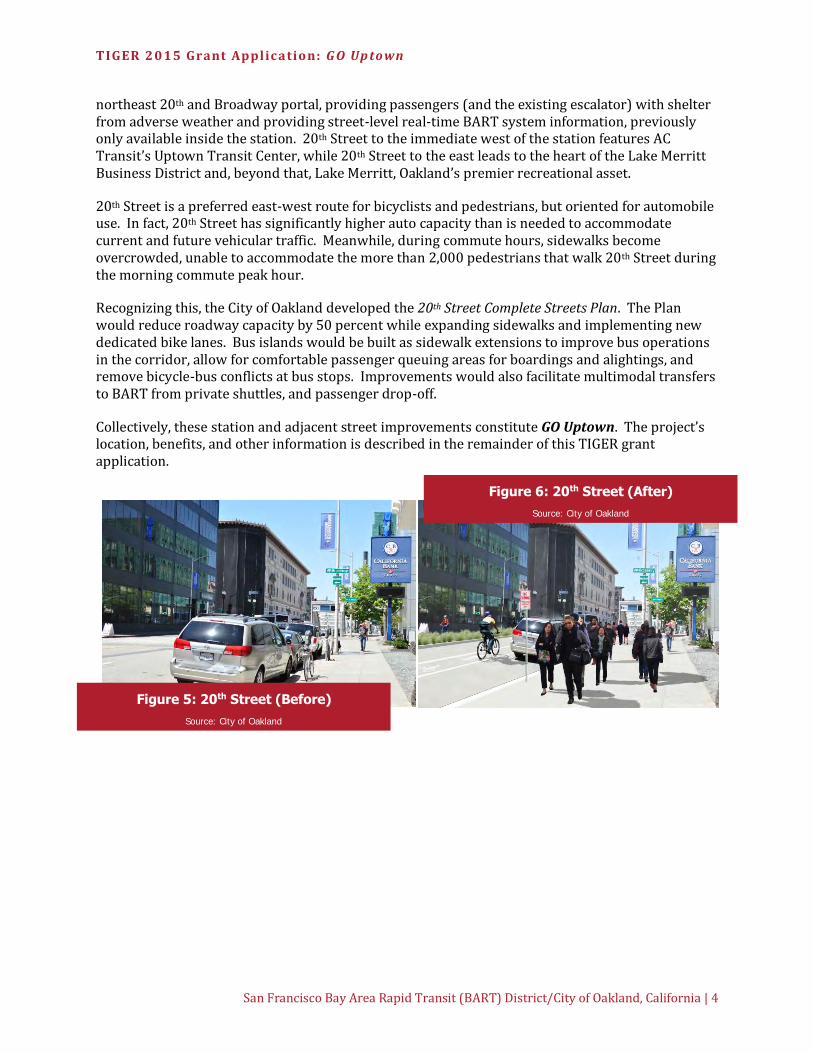
northeast 20th and Broadway portal, providing passengers (and the existing escalator) with shelter from adverse weather and providing street-level real-time BART system information, previously only available inside the station. 20th Street to the immediate west of the station features AC Transit’s Uptown Transit Center, while 20th Street to the east leads to the heart of the Lake Merritt Business District and, beyond that, Lake Merritt, Oakland’s premier recreational asset.
20th Street is a preferred east-west route for bicyclists and pedestrians, but oriented for automobile use. In fact, 20th Street has significantly higher auto capacity than is needed to accommodate current and future vehicular traffic. Meanwhile, during commute hours, sidewalks become overcrowded, unable to accommodate the more than 2,000 pedestrians that walk 20th Street during the morning commute peak hour.
Recognizing this, the City of Oakland developed the 20th Street Complete Streets Plan. The Plan would reduce roadway capacity by 50 percent while expanding sidewalks and implementing new dedicated bike lanes. Bus islands would be built as sidewalk extensions to improve bus operations in the corridor, allow for comfortable passenger queuing areas for boardings and alightings, and remove bicycle-bus conflicts at bus stops. Improvements would also facilitate multimodal transfers to BART from private shuttles, and passenger drop-off.
Collectively, these station and adjacent street improvements constitute GO Uptown. The project’s location, benefits, and other information is described in the remainder of this TIGER grant application.
Figure 5: 20th Street (Before)
Source: City of Oakland
Figure 6: 20th Street (After)
Source: City of Oakland
TIGER 2015 Grant Application: G O Up town
San Francisco Bay Area Rapid Transit (BART) District/City of Oakland, California | 5
2. PROJECT LOCATION
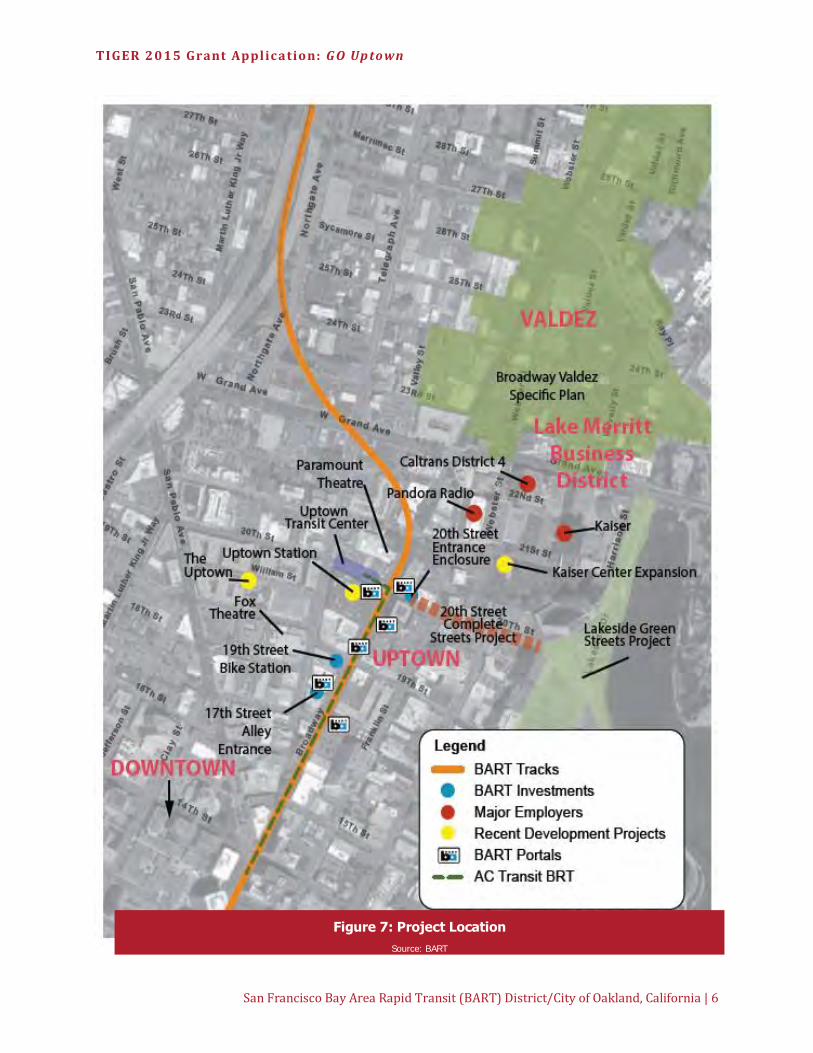
GO Uptown is located between Broadway on the west, 21st Street to the north , Harrison Street on the east, and 17th Street on the south, with the intersection of 20th Street and Broadway serving as the project epicenter. While the project’s physical improvements are limited to this nine-block area, its positive impacts extend to areas far beyond the project border which benefit from the improved access that GO Uptown provides. These locations include Downtown Oakland, Lake Merritt, and the emerging Broadway Valdez neighborhood. Figure 6 on page 6 presents a map of the project area, highlighting not only the 19th St/Oakland BART station and 20th Street Complete Streets project, but several nearby existing or planned multimodal transportation facilities, developments, and major employers discussed later in this application.
GO Uptown is located entirely within the 13th Congressional district in the City of Oakland. Oakland is home to over 406,000 residents with a median household income of $49,721, compared to the San Francisco Bay Area’s median household income of $75,989. The share of Oakland residents’ living below the poverty line is almost twice that experienced across the region (18.7 percent v 9.7 percent).6 The unemployment rate of City residents in 2014 was 8.4 percent, 50 percent higher than the national rate. In the project area, 19 percent of home-end users of the 19th St/ Oakland BART station have an annual household income of less than $25,000, as compared to 13 percent throughout the BART system7. In fact, more than 42 percent of home-end 19th St/Oakland station users come from households below the city’s median household income. In addition, whereas 10 percent of systemwide BART ridership is African American, 18 percent of home-origin 19th St/Oakland riders are African American.
Despite the lower-income profile of area residents, the Uptown District and nearby neighborhoods provide several Ladders of Opportunities for economically disadvantaged populations. In addition to arts and entertainment, Uptown is quickly becoming a center for technology and small business development, while the Lake Merritt Business District is home to Kaiser Permanente and several other large employers . As discussed in Section 5.1.2 Economic Competitiveness, economic development – particularly new jobs – around East Bay BART stations not only contributes to the revitalization of surrounding communities but helps balance travel by transit through the region, resulting in the more efficient use of existing system capacity. The improvements resulting from GO Uptown’s 19th St/Oakland BART station modernization will facilitate safe and convenient travel through and around the station for the growing number of commuters expected to use the facility, while the 20th Street Complete Streets component better connects the station to current and future jobs in the area.
6 U.S. Census Bureau, American Community Survey (2006-2010) 7 BART, 2008 Station Profile Study, Available: https://www.bart.gov/sites/default/files/docs/2008StationProfileReport_web.pdf
TIGER 2015 Grant Application: G O Up town
San Francisco Bay Area Rapid Transit (BART) District/City of Oakland, California | 6
Figure 7: Project Location
Source: BART

TIGER 2015 Grant Application: G O Up town
San Francisco Bay Area Rapid Transit (BART) District/City of Oakland, California | 7
3. PROJECT PARTIES
The following introduces each of the key GO Uptown project partners and supporters. The roles and responsibilities of BART and the City of Oakland in delivering the project are presented in Section 5.2 Partnership.
The San Francisco Bay Area Rapid Transit (BART) District is the project sponsor and TIGER grant applicant. BART is the fifth-busiest heavy rail rapid transit system in the United States, carrying more than 400,000 daily riders. The BART system comprises 104 miles of track, 44 stations, and 669 revenue vehicles to provide access to many of the region’s key destinations for work, school and recreation throughout the San Francisco Bay Area.8 BART has a combined annual capital and operating budget of over $1.5 billion.
The City of Oakland is a project partner, and will be responsible for implementing the 20th Street Complete Streets component of GO Uptown. The City has an annual operating budget of over $982 million for its fiscal year (FY) 2015.
The Alameda-Contra Costa (AC) Transit District is a project supporter, and the third largest public bus system in California. The agency operates a fleet of 575 buses to serve 13 cities and adjacent unincorporated areas in Alameda and Contra Costa counties. AC Transit has an operating budget of over $344 million for FY 2015.
The Lake Merritt/Uptown District Association is a strong supporter of the project. The Association is a Business Improvement District (BID) which supports a 37-block area in the northern section of Downtown Oakland. The BID provides special benefit services such as district maintenance, safety and security management, as well as maintaining its cultural community. The Lake Merritt/Uptown District Association was formed in 2009 by property owners who supported a voluntary property tax which will deliver non-City provided services to the community over the next 10 years. BART is a member of the Association.
In addition, on May 27, 2015, the Metropolitan Transportation Commission (MTC), the metropolitan planning organization for the San Francisco Bay Area endorsed the “19th St/Oakland BART Station Modernization & Multimodal Transit Improvements” (GO Uptown) as one of five regional priority projects for TIGER 2015 funding.
8 BART, System Facts, Available: http://www.bart.gov/about/history/facts
GO Uptown
Figure 8: Project Parties

TIGER 2015 Grant Application: G O Up town
San Francisco Bay Area Rapid Transit (BART) District/City of Oakland, California | 8
4. GRANT FUNDS AND SOURCES/USES OF PROJECT FUNDS
4.1. Capital Sources of Funds
The estimated total cost of GO Uptown is $30.1 million. BART has committed $12.0 million of its dedicated State of California Proposition 1B revenues to cover 40 percent of project costs. Passed in 2006, Proposition 1B has generated nearly $20 billion for transportation capital and safety investments throughout the State of California. BART has received $209 million in Proposition B revenues dedicated to station modernization projects throughout the system. Evidence of BART’s capital match commitment to GO Uptown is provided as Appendix III to this application.
4.2. Capital Uses of Funds
The available Proposition B revenues allows BART to fund some basic state of good repair investments and upgrade lighting at the 19th St/Oakland station. It does not, however, cover the costs of the complete set of GO Uptown improvements that will truly transform the Broadway and 20th Street intersection into the Gateway to Uptown that is envisioned by both BART and the City of Oakland. Specifically, funding is not available to construct the north end ADA-compliant elevator linking the station concourse with the street level (providing an improved connection to AC Transit’s Uptown Transit Center and future BRT service), nor the 20th Street Complete Streets improvements. New faregates and additional station art would also need to be deferred. BART is therefore seeking $18.1 million in TIGER 2015 funding to complete the GO Uptown project.
The GO Uptown project cost, by component, is summarized in Table I. Components which can be funded with BART’s Proposition B funds are presented below, while the transformative project features requiring TIGER 2015 funds are presented on the following page.
Table 1: GO Uptown Project Cost Estimate
Description Cost
Proposition B Funded Costs
Demolition $ 399,412 Refurbish flooring on concourse and platform levels $ 896,171 Repaint ceiling/trackwalls $ 2,134,834
Replace / Repair damaged tile $ 85,223 Consolidated bike parking in concourse at southern end $ 138,584 LED lighting upgrades surrounding station $ 350,000 New Recycling and Trash Receptacles $ 131,250
Replace florescent lights with LED lights with selective switching and new lighting fixtures $ 5,103,932 Upgrade all fixtures to be water efficient $ 131,250
Consolidated storage area for maintenance equipment $ 61,250 Replace paid-area railing within station $ 2,002,112 Bench and passenger waiting upgrades $ 227,500
Stairway lightboxes $ 350,000
TOTAL $ 12,011,518
TIGER 2015 Grant Application: G O Up town
San Francisco Bay Area Rapid Transit (BART) District/City of Oakland, California | 9
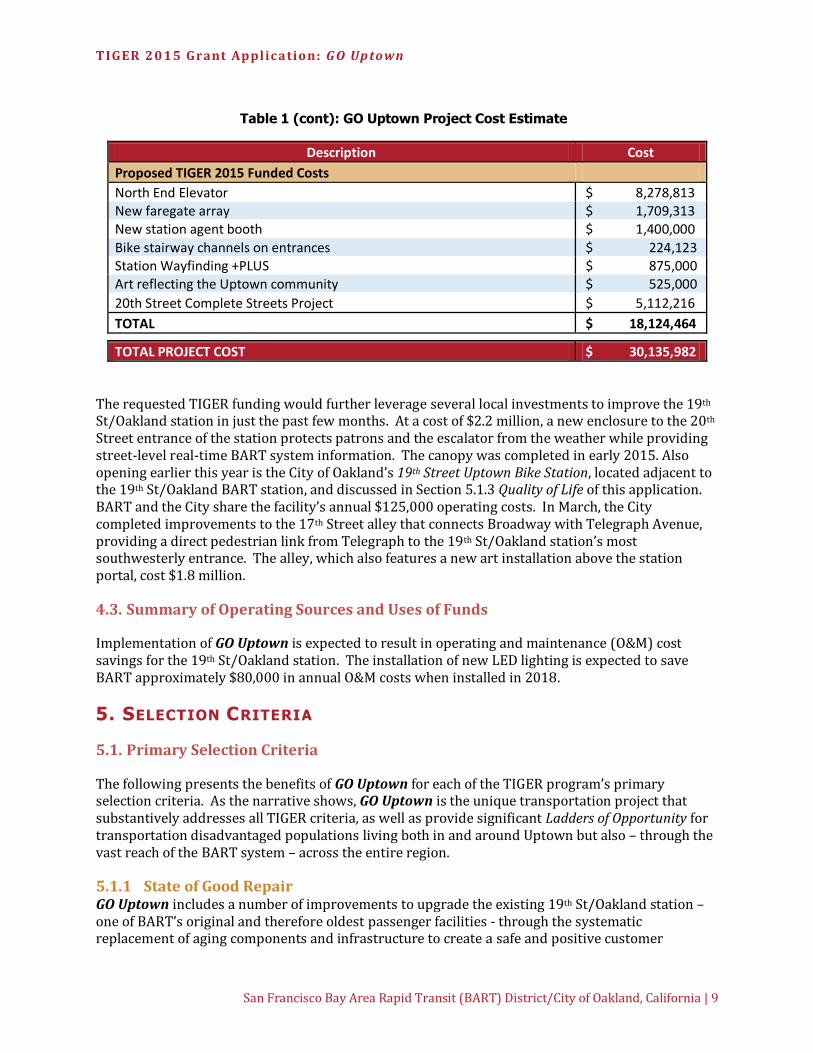
Table 1 (cont): GO Uptown Project Cost Estimate
Description Cost
Proposed TIGER 2015 Funded Costs
North End Elevator $ 8,278,813 New faregate array $ 1,709,313 New station agent booth $ 1,400,000
Bike stairway channels on entrances $ 224,123 Station Wayfinding +PLUS $ 875,000 Art reflecting the Uptown community $ 525,000
20th Street Complete Streets Project $ 5,112,216
TOTAL $ 18,124,464
TOTAL PROJECT COST $ 30,135,982
The requested TIGER funding would further leverage several local investments to improve the 19th St/Oakland station in just the past few months. At a cost of $2.2 million, a new enclosure to the 20th Street entrance of the station protects patrons and the escalator from the weather while providing street-level real-time BART system information. The canopy was completed in early 2015. Also opening earlier this year is the City of Oakland’s 19th Street Uptown Bike Station, located adjacent to the 19th St/Oakland BART station, and discussed in Section 5.1.3 Quality of Life of this application. BART and the City share the facility’s annual $125,000 operating costs. In March, the City completed improvements to the 17th Street alley that connects Broadway with Telegraph Avenue, providing a direct pedestrian link from Telegraph to the 19th St/Oakland station’s most southwesterly entrance. The alley, which also features a new art installation above the station portal, cost $1.8 million.
4.3. Summary of Operating Sources and Uses of Funds
Implementation of GO Uptown is expected to result in operating and maintenance (O&M) cost savings for the 19th St/Oakland station. The installation of new LED lighting is expected to save BART approximately $80,000 in annual O&M costs when installed in 2018.
5. SELECTION CRITERIA
5.1. Primary Selection Criteria
The following presents the benefits of GO Uptown for each of the TIGER program’s primary selection criteria. As the narrative shows, GO Uptown is the unique transportation project that substantively addresses all TIGER criteria, as well as provide significant Ladders of Opportunity for transportation disadvantaged populations living both in and around Uptown but also – through the vast reach of the BART system – across the entire region.
5.1.1 State of Good Repair GO Uptown includes a number of improvements to upgrade the existing 19th St/Oakland station – one of BART’s original and therefore oldest passenger facilities - through the systematic replacement of aging components and infrastructure to create a safe and positive customer
TIGER 2015 Grant Application: G O Up town
San Francisco Bay Area Rapid Transit (BART) District/City of Oakland, California | 10
experience. The project includes not only the rehabilitation or replacement of infrastructure after more than 40 years of service, but the optimization of existing station capacity and the expansion of street-level access to the station concourse to meet future needs. Finally, GO Uptown features reinvestment in high-tech and more efficient infrastructure, including lighting, fare machines, and passenger information systems.
Specific state of good repair investments – as identified on page 2 of this application - total approximately 10 percent of the GO Uptown capital costs. As these assets will be at the beginning of their useful life, some minor operations and maintenance cost reductions are likely. More specifically, the upgrading of lighting to more energy efficient LED technologies is expected to save BART approximately $80,000 per year in station energy costs.
Station Modernization Program
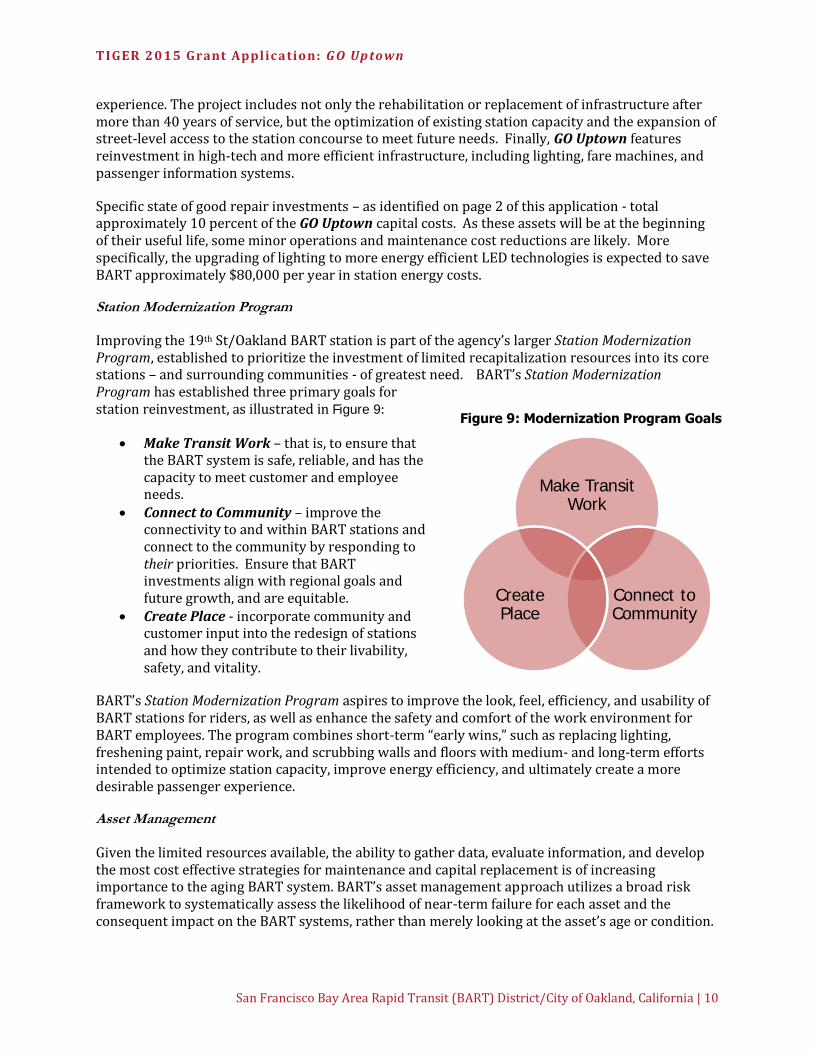
Improving the 19th St/Oakland BART station is part of the agency’s larger Station Modernization Program, established to prioritize the investment of limited recapitalization resources into its core stations – and surrounding communities - of greatest need. BART’s Station Modernization Program has established three primary goals for station reinvestment, as illustrated in Figure 9:
Make Transit Work – that is, to ensure that the BART system is safe, reliable, and has the capacity to meet customer and employee needs.
Connect to Community – improve the connectivity to and within BART stations and connect to the community by responding to their priorities. Ensure that BART investments align with regional goals and future growth, and are equitable.
Create Place - incorporate community and customer input into the redesign of stations and how they contribute to their livability, safety, and vitality.
BART’s Station Modernization Program aspires to improve the look, feel, efficiency, and usability of BART stations for riders, as well as enhance the safety and comfort of the work environment for BART employees. The program combines short-term “early wins,” such as replacing lighting, freshening paint, repair work, and scrubbing walls and floors with medium- and long-term efforts intended to optimize station capacity, improve energy efficiency, and ultimately create a more desirable passenger experience.
Asset Management
Given the limited resources available, the ability to gather data, evaluate information, and develop the most cost effective strategies for maintenance and capital replacement is of increasing importance to the aging BART system. BART’s asset management approach utilizes a broad risk framework to systematically assess the likelihood of near-term failure for each asset and the consequent impact on the BART systems, rather than merely looking at the asset’s age or condition.
Make Transit Work
Connect to Community
Create Place
Figure 9: Modernization Program Goals
TIGER 2015 Grant Application: G O Up town
San Francisco Bay Area Rapid Transit (BART) District/City of Oakland, California | 11
By doing this, the agency is able to prioritize and allocate limited resources to high value investments in order to achieve and maintain a state of good repair. BART considers a number of factors when determining which capital projects are allocated given the limited funding that is available, including whether a project will maximize value for the money spent, help manage and address risk, close an identified need, minimize lifecycle cost, yield operational cost savings through increased efficiency or reduced risk, and align with the agency’s strategy for long-term financial sustainability. In all cases, projects related to worker and customer safety receive priority and immediate attention. Investment in State of Good Repair
BART’s FY 2015 capital budget allocated $312.8 million for system reinvestment, a figure which climbs to $365 million – an increase of 17 percent – in its preliminary FY 2016 budget.9 This increase is attributed to BART’s emphasis on and prioritization of several reinvestment projects in operational areas of high risk exposure (i.e., track condition, traction power transformers and substations, rail tie/switch replacement, wayside equipment, and existing train control rehabilitation). BART’s system reinvestment budget includes improvements identified through BART’s Station Modernization Program, as well as the replacement of its rail fleet, modernization of its obsolete train control system, and passenger and worker safety related projects (e.g., life safety systems, access control, structure fail protection, etc.).
5.1.2 Economic Competitiveness GO Uptown is a gateway for both area residents and commuters from throughout the region to access economic opportunities. These include significant Ladders of Opportunities for economically disadvantaged populations that will benefit from the proposed TIGER investment, as described below.
Regional Competitiveness
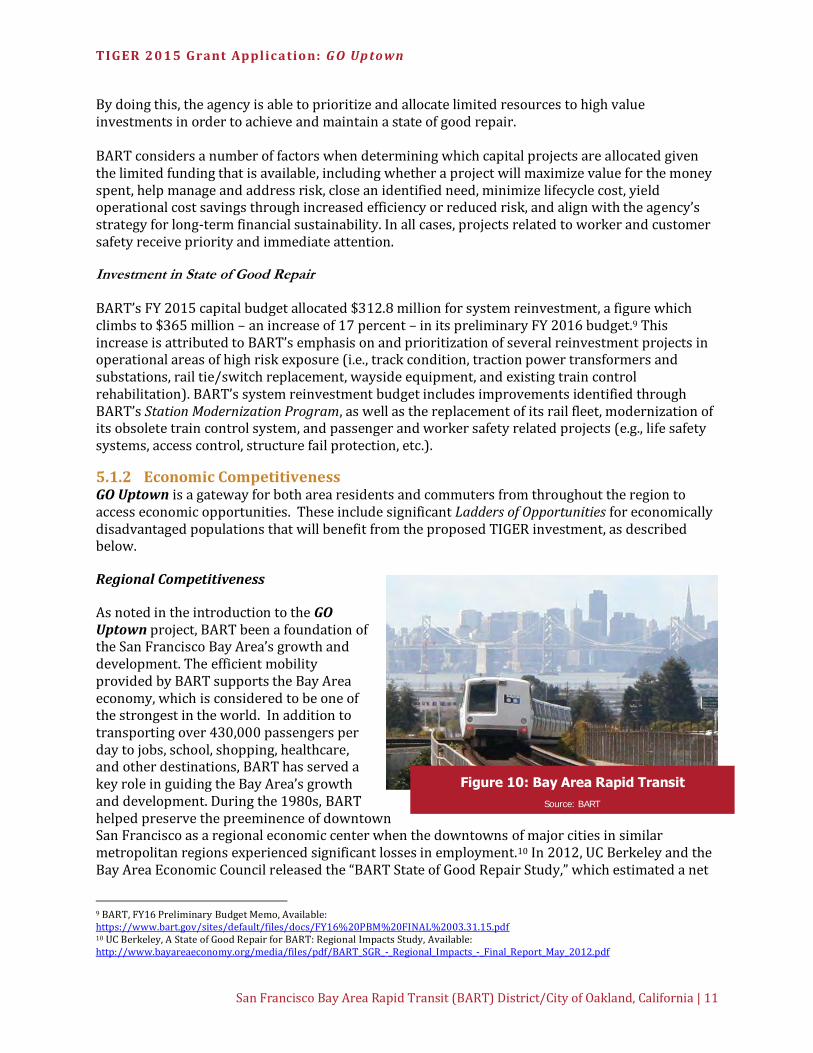
As noted in the introduction to the GO Uptown project, BART been a foundation of the San Francisco Bay Area’s growth and development. The efficient mobility provided by BART supports the Bay Area economy, which is considered to be one of the strongest in the world. In addition to transporting over 430,000 passengers per day to jobs, school, shopping, healthcare, and other destinations, BART has served a key role in guiding the Bay Area’s growth and development. During the 1980s, BART helped preserve the preeminence of downtown San Francisco as a regional economic center when the downtowns of major cities in similar metropolitan regions experienced significant losses in employment.10 In 2012, UC Berkeley and the Bay Area Economic Council released the “BART State of Good Repair Study,” which estimated a net
9 BART, FY16 Preliminary Budget Memo, Available: https://www.bart.gov/sites/default/files/docs/FY16%20PBM%20FINAL%2003.31.15.pdf 10 UC Berkeley, A State of Good Repair for BART: Regional Impacts Study, Available: http://www.bayareaeconomy.org/media/files/pdf/BART_SGR_-_Regional_Impacts_-_Final_Report_May_2012.pdf
Figure 10: Bay Area Rapid Transit
Source: BART
TIGER 2015 Grant Application: G O Up town
San Francisco Bay Area Rapid Transit (BART) District/City of Oakland, California | 12
ya
wdaorB
tS tekr
aM
14th St
7th St
13th A
ve 5th St
Park Blvd
San P
ablo
Ave
evA
hparg
ele
T
evA
dnarG
rraH
tS
nosi
8th St
14th
Ave
Maca
rthur B
lvd
tS e
nile
dA
tS rets
beW
tS h
surB
ykP
ale
dnaM
Per
alta
St
Mandana Blvd
Embarcadero
Moraga Ave
Foothill Blvd
12th St
51st St
Piedm
ont A
ve
evA
ero
hse
kaL
evA
dr3
2
tS k
aO
tS n
oin
U
tS o
rtsa
C
Santa C
lara Ave
18th St
1st A
ve
5th Ave
Hig
hla
nd A
ve
evA
rekcorC
Middle Harbor Rd
yaW
rJ
gniK
rehtu
L n
itraM
Pleasant Valley Ave
40th St
Shattu
ck Ave
evA
yeld
rA
Mountain A
ve
Arroyo Ave
North
gate
Ave
ebuT tS
rets
beW
evA
tnom
uaeB
Lake Park Ave
Estre
lla A
ve
11th St
tS s
serp
yC
Lincoln Ave
8th St
tS tekr
aM
Macarthur Blvd
tS e
nile
dA
Lakeshore Ave
14th St
7th St
Per
alta
St
Grand Ave
8th St
14th St
18th St
evA
hparg
ele
T
WEST OAKLAND
12TH ST/O AKLAND CITY CENTER
Half-mile Station Buffer
19th St. / Oakland Station: Home Locations of BART Riders by Mode
LEGEND
Origins by Mode to Station
Walked all the way 24
Bicycle
Bus, train or other transit
Drove alone / carpooled MACARTHUR
Dropped off
BART Line and Station
One mile Station Buffer
580
Capitol Corridor (Amtrak)
Amtrak (other)
19TH ST/OAKLAND 580
980
880
LAKE MERRITT
880
0 0.5 1Miles
Data Sources: ESRI, 2008 BART Station Profile Study (weekday only; data are weighted from survey sample to represent average weekday ridership)
economic loss of bet ween $22 and $33 billion dollars to the region over the next 30 years if BART is unable to maintain its reliable service. The study also found that BART contributes a number of economic benefits to the region, including:
Travel and vehicle ownership cost savings for riders. Reduce traffic congestion. Business operating cost savings associated with the reliability effects of reduced congestion. Increased business productivity due to expansion in access to labor markets.
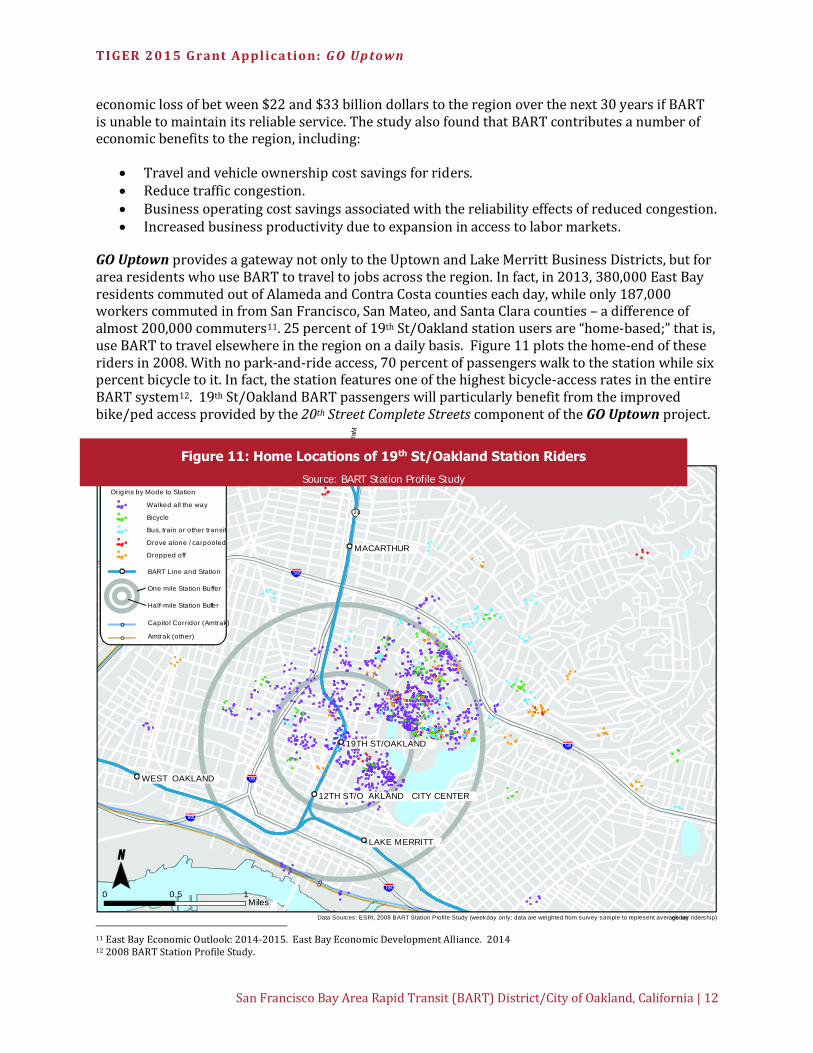
GO Uptown provides a gateway not only to the Uptown and Lake Merritt Business Districts, but for area residents who use BART to travel to jobs across the region. In fact, in 2013, 380,000 East Bay residents commuted out of Alameda and Contra Costa counties each day, while only 187,000 workers commuted in from San Francisco, San Mateo, and Santa Clara counties – a difference of almost 200,000 commuters11. 25 percent of 19th St/Oakland station users are “home-based;” that is, use BART to travel elsewhere in the region on a daily basis. Figure 11 plots the home-end of these riders in 2008. With no park-and-ride access, 70 percent of passengers walk to the station while six percent bicycle to it. In fact, the station features one of the highest bicycle-access rates in the entire BART system12. 19th St/Oakland BART passengers will particularly benefit from the improved bike/ped access provided by the 20th Street Complete Streets component of the GO Uptown project.
11 East Bay Economic Outlook: 2014-2015. East Bay Economic Development Alliance. 2014 12 2008 BART Station Profile Study.
Figure 11: Home Locations of 19th St/Oakland Station Riders
Source: BART Station Profile Study
TIGER 2015 Grant Application: G O Up town
San Francisco Bay Area Rapid Transit (BART) District/City of Oakland, California | 13
Uptown Employment
An important objective of BART is to provide employers an alternative to locating in the crowded San Francisco Market Street corridor, and to redistribute demand to existing job centers that could support job growth and sustainable commutes. For example, shifting commutes from between Contra Costa County and San Francisco to between Contra Costa County and Alameda County – both in the East Bay - relieves the capacity-constrained Transbay BART tunnel from endemic crowding. The presence of BART in Oakland and elsewhere east of the tunnel, coupled with the efforts of local government to focus new development and employment around BART stations, helps to achieve this regional transportation – and economic - balance. Employer proximity to BART also results in strong commercial real estate opportunities. In 2014, approximately 30 million square feet of office space was located within ½ mile of East Bay BART stations, yielding an estimated $80 million in additional rent revenue13.
Proximity to BART results in significant transit mode share for work trips. A survey of workers in Downtown Oakland (surrounding the nearby 12th St/Oakland BART station) for the City’s Downtown Transportation and Parking Plan found that 55 percent commuted by transit14. As employment opportunities grow in and around Uptown (as described below and on the following page), the area may begin to approach similar mode splits.
There are currently approximately 70,000 jobs within a one-half mile walking distance of the 19th St/Oakland station. The area is home to several notable employers, including:
Kaiser Permanente purchased the 1950 Franklin building in 1985 to house its Northern California Region administrative departments and has additional office space in the Kaiser Center Building at 300 Lakeside Drive. Approximately 11,000 employees work at its Lake Merritt offices. A planned expansion includes construction of two new office towers, retail space, additional parking spaces, and reconfiguration of a roof garden. At full build out, the project is expected to result in a total net increase of over 3,200 new employees.15
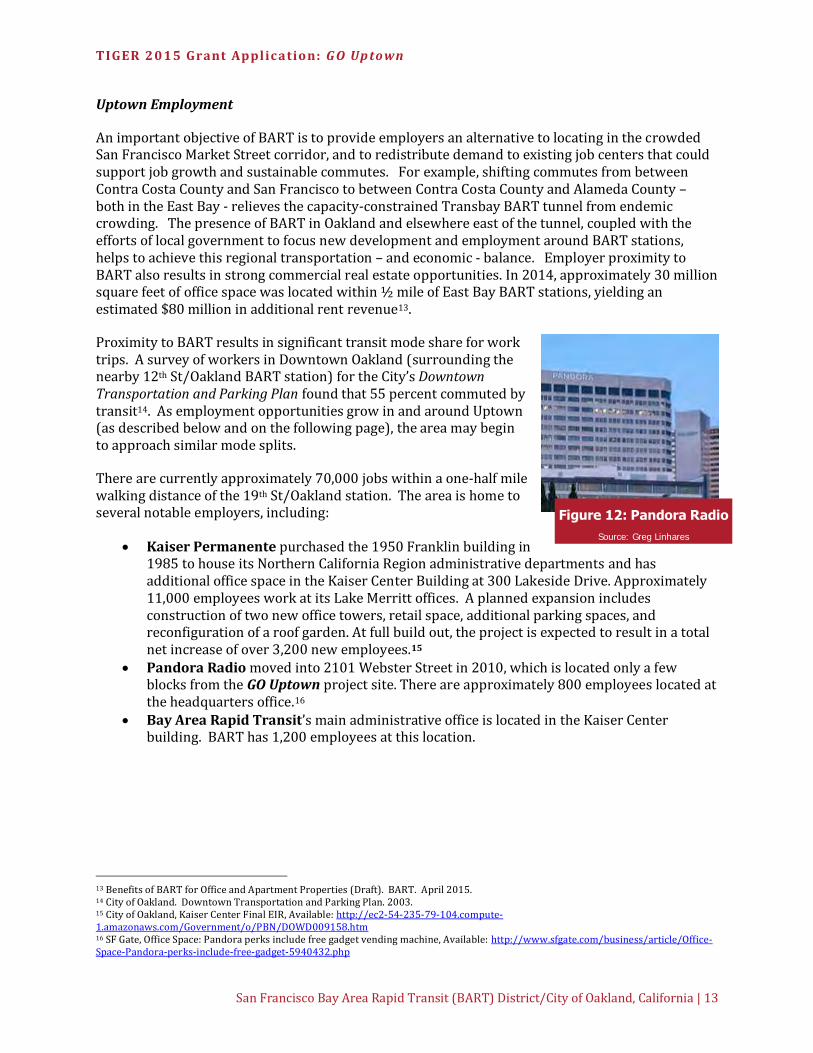
Pandora Radio moved into 2101 Webster Street in 2010, which is located only a few blocks from the GO Uptown project site. There are approximately 800 employees located at the headquarters office.16
Bay Area Rapid Transit’s main administrative office is located in the Kaiser Center building. BART has 1,200 employees at this location.
13 Benefits of BART for Office and Apartment Properties (Draft). BART. April 2015. 14 City of Oakland. Downtown Transportation and Parking Plan. 2003. 15 City of Oakland, Kaiser Center Final EIR, Available: http://ec2-54-235-79-104.compute-1.amazonaws.com/Government/o/PBN/DOWD009158.htm 16 SF Gate, Office Space: Pandora perks include free gadget vending machine, Available: http://www.sfgate.com/business/article/Office-Space-Pandora-perks-include-free-gadget-5940432.php
Figure 12: Pandora Radio
Source: Greg Linhares
TIGER 2015 Grant Application: G O Up town
San Francisco Bay Area Rapid Transit (BART) District/City of Oakland, California | 14
The State of California Department of Transportation (Caltrans) District 4 headquarters is located within four blocks of the 19th St/Oakland BART station. Caltrans District 4 has nearly 3,300 employees in this facility.
Emerging Uptown Tech Sector
The MTC forecasts an increase of 18,500 jobs by 2040 in the area adjacent to the GO Uptown project area. Such growth aligns with BART’s ridership forecasts for the 19th St/Oakland station, thus supporting the need for GO Uptown’s capacity and other station improvements, as well as 20th Street’s enhanced “last-mile” connections.
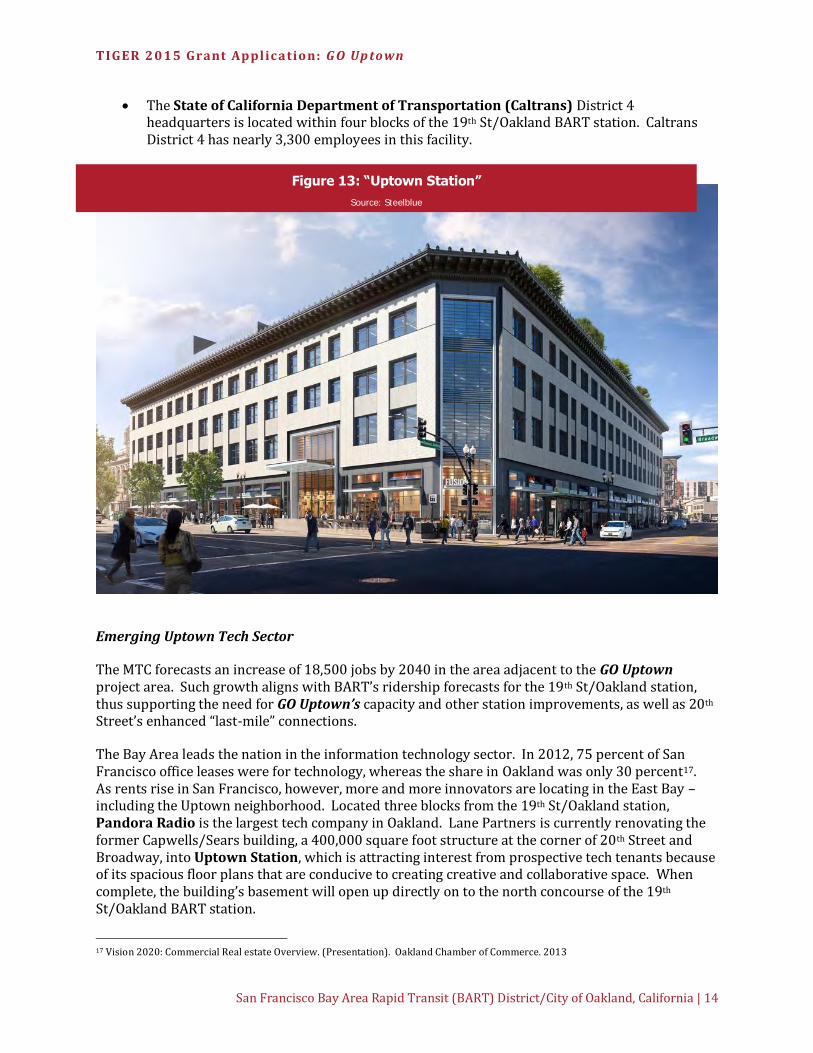
The Bay Area leads the nation in the information technology sector. In 2012, 75 percent of San Francisco office leases were for technology, whereas the share in Oakland was only 30 percent17. As rents rise in San Francisco, however, more and more innovators are locating in the East Bay – including the Uptown neighborhood. Located three blocks from the 19th St/Oakland station, Pandora Radio is the largest tech company in Oakland. Lane Partners is currently renovating the former Capwells/Sears building, a 400,000 square foot structure at the corner of 20th Street and Broadway, into Uptown Station, which is attracting interest from prospective tech tenants because of its spacious floor plans that are conducive to creating creative and collaborative space. When complete, the building’s basement will open up directly on to the north concourse of the 19th St/Oakland BART station.
17 Vision 2020: Commercial Real estate Overview. (Presentation). Oakland Chamber of Commerce. 2013
Figure 13: “Uptown Station”
Source: Steelblue
TIGER 2015 Grant Application: G O Up town
San Francisco Bay Area Rapid Transit (BART) District/City of Oakland, California | 15
Perhaps even more significant are the emerging opportunities for smaller tech business in the Uptown District. Oakland Impact Hub is a 16,000 square foot collaborative at Broadway and 23rd Street whose mission is to build an “entrepreneurial community and co-working space to create solutions for a world that works for all. Impact Hub provides a range of programs to develop and support innovating businesses18. Next door, the Hive houses small businesses, retail space, and restaurants in a converted industrial warehouse.19 These tech incubators are attracting a new class of innovators which contribute to both the economy and the eclectic nature of the area, as described in greater detail in Section 5.3 Quality of Life.
Job Training Although the Bay Area is a national economic driver, its own middle class is shrinking as more jobs are being added at the bottom and very top of the pay scales. The Regional Economic Prosperity Strategy - funded by a US Department of Housing and Urban Development (HUD) Economic Resiliency Regional Planning Grant - found that the share of Bay Area employees earning a middle wage ($18 - $30 per hour) is declining, comprising only 22 percent of job growth versus 27 percent of total jobs in 2010. In part this is because the majority of middle and upper wage jobs require workers to have attained a bachelor's degree. One key strategy to address this decline is to support industries and employers with a higher share of "middle skill jobs," or jobs requiring long term on-the-job training or educational programs that provide specific skills. BART itself is one of the employers ready to support the augmentation of middle skill jobs. Half of current BART jobs are skilled positions that do not require a bachelor's degree, but require some level of longer term on the job training and internal training programs provided by BART. Three-quarters of BART positions do not require a bachelor's degree, and yet pay above the $18/hour target. BART has also applied to FTA for $1 million from its Innovative Public Transportation Workforce Development Program to create a Transit Career Ladders Training (TCLT) Program. In order to meet the growing needs of the transit workforce, this program strives to improve training access for traditionally under-represented individuals by developing streamlined pathways into transportation employment through partnerships with such agencies as local Workforce Investment Boards (WIB) and Bay Area Community Colleges. Program goals include: (1) advertisement and promotion of transportation careers to low income areas, unemployed and underemployed communities, minorities, veterans, and women; (2) support and enhancement of existing college technical training programs with transit agency collaboration; and (3) establishment of an additional career pathway for the transit employment pipeline. Clearly, an investment in BART is an investment in Ladders of Opportunity. Workforce development is a major priority of many East Bay business interests. According to the East Bay Economic Development Alliance (EDA), “the East Bay is creating more job opportunities for both higher-skilled and lower-skilled workers in the region relative to other parts of the State. The millions of dollars which have been invested in the East Bay for workforce development through local community colleges, curricular practical training grants, and trade adjustment assistance career training programs have made a difference." The EDA notes that while elevated,
18 http://oakland.impacthub.net/ 19 http://hiveoakland.com/

TIGER 2015 Grant Application: G O Up town
San Francisco Bay Area Rapid Transit (BART) District/City of Oakland, California | 16
the unemployment rate for East Bay residents under 25 is lower than that for the same age range throughout the State of California20.
Monetized Economic Benefits
Finally, GO Uptown includes a number of improvements which are expected to result in time savings for BART riders traveling through the 19th St/Oakland station. Like travel time, time spent prior or subsequent to boarding the train is considered a cost to users, and its value depends on the disutility that users attribute to time spent traveling. A reduction in station usage time therefore translates into more time available for work, leisure, or other activities.
Time-saving improvements of the project include optimizing the layout of the station concourse, thereby enhancing passenger circulation within the facility, and facilitating faster movement from the train to street level (and vice-versa). When monetized according to USDOT measures for the value of time, these travel time savings can be valued at $26.7 million when discounted at a three percent rate of return, or $52.9 million at a seven percent discount rate. In total, travel time benefits account for 77 percent of all monetized benefits included in the BCA.
5.1.3 Quality of Life The New York Times ranked Uptown Oakland # 5 on its list of “45 Best Places to Go in 2012.” Indeed, recent years have seen considerable investment and increasing activity in the Uptown District surrounding the 19th St/Oakland BART station. The improved transportation access provided by GO Uptown is expected to enhance the economic growth of the area – and region. But more than that, the project seeks to improve the overall quality of life of area residents, and of visitors attracted to the neighborhood’s charm. Specifically, GO Uptown seeks to reflect the energy of the surrounding community and enhance the station’s existing strengths by:
Incorporating art that reflects the creativity of the Uptown District. Coordinating with the City of Oakland and area stakeholders to prioritize further
neighborhood improvements and identify opportunities to integrate placemaking into the community.
Attracting riders to stop and explore the Uptown Neighborhood.
Using investments in transportation to improve the quality of life of the communities they serve is a guiding principle of USDOT’s TIGER program. USDOT – along with the HUD and the US Environmental Protection Agency – have further joined forces in a Partnership for Sustainable Communities. The Partnership has identified six principles for “Livability,” including the enhancement of economic competitiveness, which is addressed in Section 5.1.2 of this application. The following summarizes how GO Uptown supports the attainment of each of the five other Livability tenets.
20 East Bay Economic Outlook: 2015-2016. East Bay Economic Development Alliance. 2015
Figure 14: First Friday Festival
Source: Greg Linhares
TIGER 2015 Grant Application: G O Up town
San Francisco Bay Area Rapid Transit (BART) District/City of Oakland, California | 17
Provide More Affordable and Convenient Transportation Choices
The GO Uptown project is located at the heart of a major transportation hub. BART’s 19th St/Oakland station serves as the system entry for over 24,000 transit trips each weekday, and connects to a number of additional bus lines.
The City’s “Free B” Broadway shuttle offers free circulator service between BART, the San Francisco Bay Ferry, the Amtrak Capitol Corridor, and Downtown Oakland. Service operates as frequently as every 10 minutes during weekday commute and lunch hours, and carried over 720,000 passengers in 2014. The Broadway Shuttle is a program of the City of Oakland's Economic & Workforce Development Department which sees the value of investing in transportation to attract employment and other development to Downtown Oakland.
Nearly a dozen AC Transit bus routes serve the project area, connecting passengers to locations throughout the East Bay. Approximately 16,500 passengers travel on these routes each weekday.
Starting in 2017, the station will be served by AC Transit’s first Bus Rapid Transit (BRT) line, which will provide service between AC Transit’s Uptown Transit Station and the City of San Leandro. The service is expected to carry approximately 27,000 passengers per day, travelling at speeds that are up to 28 percent faster than local bus service. As part of the GO Uptown project, BART has been coordinating with AC Transit on the location and design of the proposed BRT station to facilitate intermodal connectivity. Specifically, the northbound BRT platform would be located in close proximity to the 19th St/Oakland BART station’s central entrance, while the southbound BRT platform would be located adjacent to the proposed location of the elevator that would be implemented as part of the GO Uptown project scope.
The 19th St/Oakland station is also located only three blocks from Greyhound’s Oakland terminal.
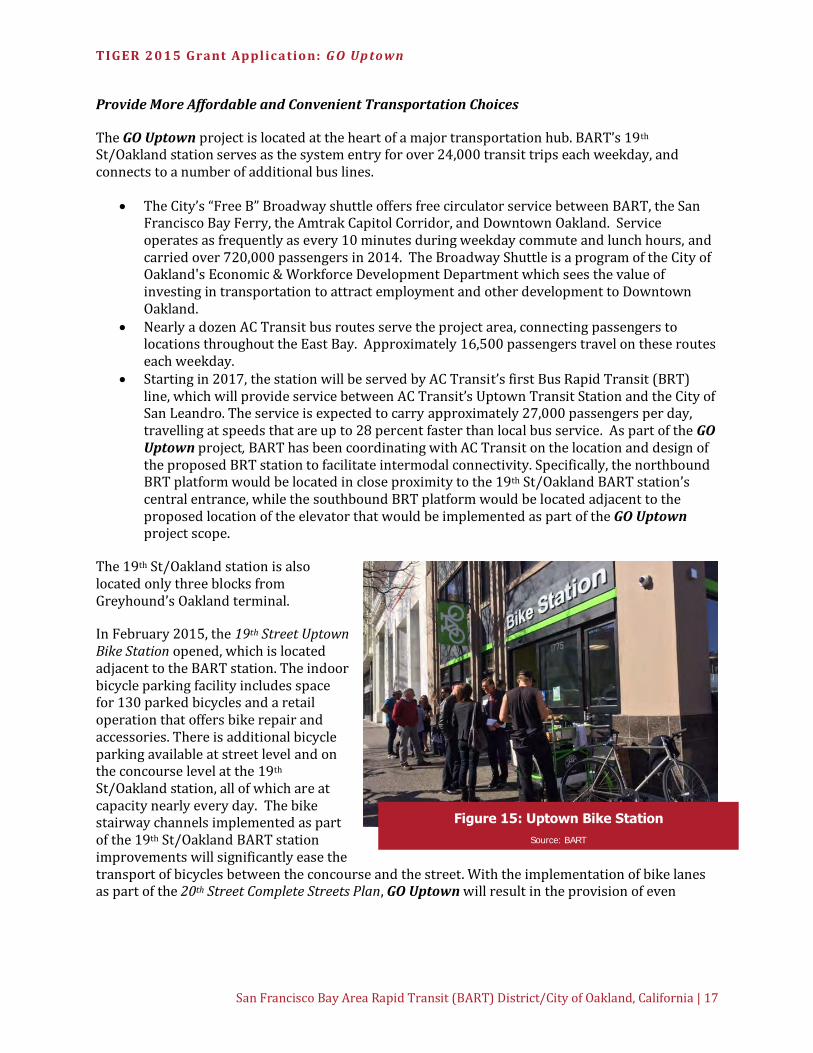
In February 2015, the 19th Street Uptown Bike Station opened, which is located adjacent to the BART station. The indoor bicycle parking facility includes space for 130 parked bicycles and a retail operation that offers bike repair and accessories. There is additional bicycle parking available at street level and on the concourse level at the 19th St/Oakland station, all of which are at capacity nearly every day. The bike stairway channels implemented as part of the 19th St/Oakland BART station improvements will significantly ease the transport of bicycles between the concourse and the street. With the implementation of bike lanes as part of the 20th Street Complete Streets Plan, GO Uptown will result in the provision of even
Figure 15: Uptown Bike Station
Source: BART
TIGER 2015 Grant Application: G O Up town
San Francisco Bay Area Rapid Transit (BART) District/City of Oakland, California | 18
greater access by bicyclists to transit. The City of Oakland estimates the bike lanes added by the project would attract nearly 2,500 bicycle trips in the corridor, 1,350 of which are commute trips21.
Finally, the proposed elevator will provide an entirely new connection between the north end of the 19th St/Oakland station and the Uptown Transit Center, as well as all other destinations on or north of 20th Street. Today, disabled passengers in need of an elevator to travel between the concourse and street must board a non-ADA compliant elevator at 18th Street and then walk north. The new elevator will permit those passengers more direct – and weather protected – access to 20th Street.
Promotion of Equitable Affordable Housing
The City of Oakland is committed to providing affordable housing for its residents and the GO Uptown project will provide improved transportation access to opportunity for these populations. Since 1988, the City has funded the development of over 6,000 units of affordable housing. During the mid- to late 2000s, the $253 million Uptown Residential Project – part of Mayor Brown’s “10 K” downtown housing program - served as a major catalyst for the provision of affordable housing, among other community assets. Phase I of the initiative included the cleanup of a brownfield site to create The Uptown, where 20 percent of the units are affordable to households earning less than 50 percent of area median income. Phase II, spearheaded by the Coalition for Workforce Housing and 15 other community organizations, features 100 percent affordable housing for households earning less than 60 percent of area median income. In total, the project has resulted in 1,200 mixed income apartments and student housing.
Several affordable housing developments are planned or have opened in the past few years near the GO Uptown project site:
Cathedral Gardens is an affordable rental housing community consisting of 100 apartment homes located ¼ mile from the 19th St/Oakland BART station. The development was completed in Fall 2014 and includes two new buildings on either side of a rehabilitated 110 year old historic Rectory building. This development is a public/private joint venture between the Oakland Housing Authority and nonprofit developer EAH.
Satellite Central is a 150 unit high-rise senior community located a short walk from the station. It features 75 studios, 41 jumbo studios and 34 one-bedroom units. A significant rehabilitation began in January 2012 and included a complete make-over of the exterior, renovation and expansion of the interior common spaces, and accessibility and seismic upgrades.
The Savoy building opened in 2013 and is a $25 million project that transformed two rundown hotels into one combined building with 100 studios. The building, which is located just a few blocks from Oakland City Center and the Uptown District, is occupied by residents who earn less than half the area median income or were formerly homeless.22
AvéVista will be a new development located in the Grand Lake District near Lake Merritt. Plans to develop the site include construction of a mid-rise building with four floors of residential use over parking and retail to create 68 affordable rental homes for families and
21 City of Oakland Active Transportation Grant Application. 2015. 22 San Francisco Business Times, Developer turns two rundown Oakland hotels into new housing, Available: http://www.bizjournals.com/sanfrancisco/blog/real-estate/2013/10/satellite-affordable-housing-oakland.html
In 2014, the American Planning Association named Oakland’s Uptown
district the #1 “great neighborhood” in the country
TIGER 2015 Grant Application: G O Up town
San Francisco Bay Area Rapid Transit (BART) District/City of Oakland, California | 19
larger households. The development targets households with maximum incomes of up to 60 percent of the area median income. AvéVista is anticipated to be completed in Fall 2015.
11th and Jackson is a proposed development that will consist of 71 apartments for low income families along with ground floor commercial space. This development is the result of a partnership between the East Bay Asian Local Development Corporation and the Oakland Housing Authority.
It should also be noted that BART is a joint applicant, along with Meta Housing Corporation, for a State of California Affordable Housing and Sustainable Communities grant, a new program born out of the state's innovative “cap-and-trade” revenue plan. The 40-unit affordable housing complex is accessible to both the 12th St and 19th St/Oakland BART stations, and demonstrates the commitment of the City, BART and the community to affordable housing, particularly in Downtown Oakland. Coordination of Policies Which Leverage Investments
GO Uptown is itself an example of a transportation investment which has benefited from the coordination of BART and City of Oakland policies to achieve an outcome which is greater than the sum of its parts. As discussed in Section 5.1.1 State of Good Repair, BART’s Station Modernization Program seeks to invest in station improvement projects which a) Make Transit Work; b) Connect Community; and c) Create Place. Working closely with the City of Oakland and other stakeholders, BART’s planning and current design efforts draw upon these principles to optimize mobility and access while transforming a transit hub into a neighborhood center.
This center is strengthened by the project’s Complete Streets component. The proposed 20th Street redesign involves a road diet which reduces the current cross-section from four to six travel lanes to two travel lanes, new buffered bike lanes, a widened sidewalk, and a landscaped median. Current sidewalk widths vary between four and 11 feet along both sides of 20th Street; this project would double the widths to between eight and 20 feet. This would expand pedestrian space along the congested north side of the street, which serves as one of the primary pedestrian routes to businesses from the 19th St/Oakland station.
The 20th Street Complete Streets Plan is the result of – and consistent with - the City’s 2013 comprehensive Complete Streets Policy to ensure that its streets provide safe, attractive, and comfortable access for all users, including pedestrians, bicyclists, motorists, public transportation operators, and others. The policy recognizes that a more balanced transportation system that offers an array of safe and convenient choices to travelers makes communities more livable.23 The 20th Street Complete Streets component of the GO Uptown project is part of the city’s larger effort to improve transportation safety and comfort. The City has already completed the engineering and design of the Lakeside Green Street Project, which will begin construction in 2016. The project will calm traffic, increase park space, add bike lanes, and create a safer crossing at the pedestrian-hostile intersection of 20th Street, Lakeside Drive, and Harrison Street.24 The City is also implementing a Complete Streets project along Telegraph Avenue between 20th Street and 57th Street, which is a major north-
23 City of Oakland, Complete Streets Policy, Available: http://www2.oaklandnet.com/oakca1/groups/pwa/documents/marketingmaterial/oak039959.pdf 24 City of Oakland, Lakeside Green Street Concept Plan, Available: http://www2.oaklandnet.com/Government/o/PWA/o/EC/s/MeasureDD/OAK025942
In 2012, the New York Times ranked the Uptown District #5 on its list of
“45 Best Places to Go”
TIGER 2015 Grant Application: G O Up town
San Francisco Bay Area Rapid Transit (BART) District/City of Oakland, California | 20
south corridor that provides a critical link between Downtown Oakland and Downtown Berkeley for all travel modes. This project also recommends implementing a road diet to calm traffic and improve conditions for all users.
Support Existing Communities
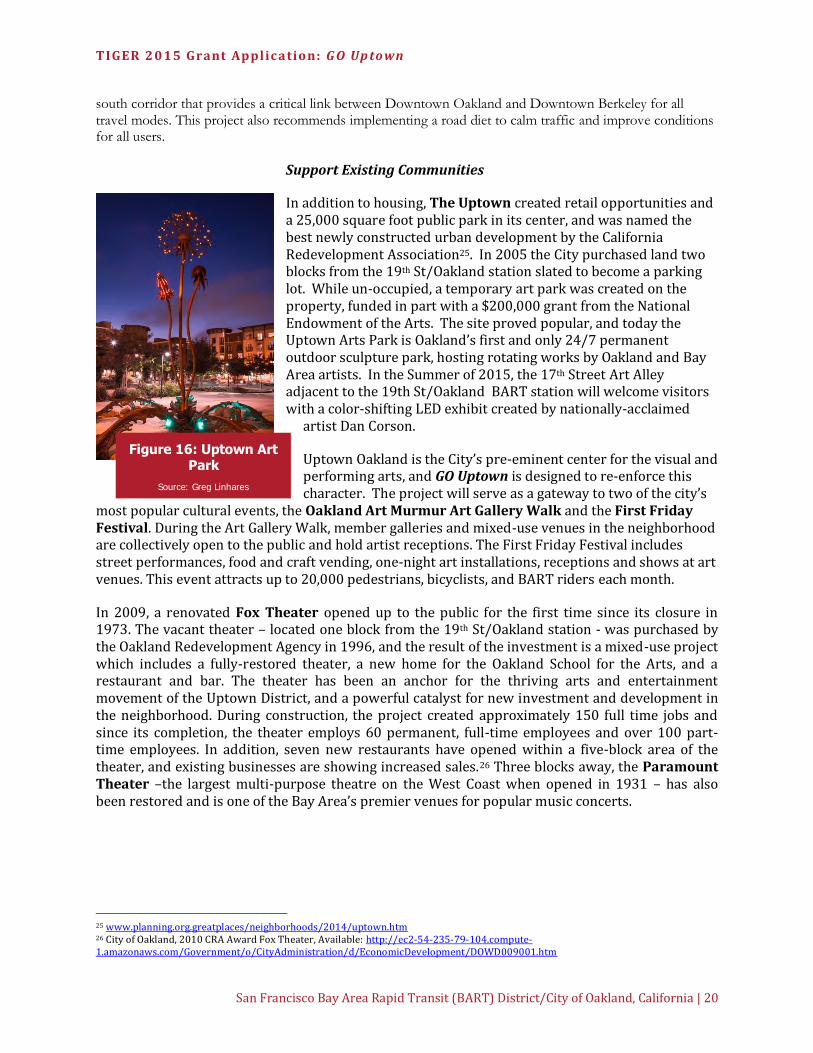
In addition to housing, The Uptown created retail opportunities and a 25,000 square foot public park in its center, and was named the best newly constructed urban development by the California Redevelopment Association25. In 2005 the City purchased land two blocks from the 19th St/Oakland station slated to become a parking lot. While un-occupied, a temporary art park was created on the property, funded in part with a $200,000 grant from the National Endowment of the Arts. The site proved popular, and today the Uptown Arts Park is Oakland’s first and only 24/7 permanent outdoor sculpture park, hosting rotating works by Oakland and Bay Area artists. In the Summer of 2015, the 17th Street Art Alley adjacent to the 19th St/Oakland BART station will welcome visitors with a color-shifting LED exhibit created by nationally-acclaimed
artist Dan Corson.
Uptown Oakland is the City’s pre-eminent center for the visual and performing arts, and GO Uptown is designed to re-enforce this character. The project will serve as a gateway to two of the city’s
most popular cultural events, the Oakland Art Murmur Art Gallery Walk and the First Friday Festival. During the Art Gallery Walk, member galleries and mixed-use venues in the neighborhood are collectively open to the public and hold artist receptions. The First Friday Festival includes street performances, food and craft vending, one-night art installations, receptions and shows at art venues. This event attracts up to 20,000 pedestrians, bicyclists, and BART riders each month.
In 2009, a renovated Fox Theater opened up to the public for the first time since its closure in 1973. The vacant theater – located one block from the 19th St/Oakland station - was purchased by the Oakland Redevelopment Agency in 1996, and the result of the investment is a mixed-use project which includes a fully-restored theater, a new home for the Oakland School for the Arts, and a restaurant and bar. The theater has been an anchor for the thriving arts and entertainment movement of the Uptown District, and a powerful catalyst for new investment and development in the neighborhood. During construction, the project created approximately 150 full time jobs and since its completion, the theater employs 60 permanent, full-time employees and over 100 part-time employees. In addition, seven new restaurants have opened within a five-block area of the theater, and existing businesses are showing increased sales.26 Three blocks away, the Paramount Theater –the largest multi-purpose theatre on the West Coast when opened in 1931 – has also been restored and is one of the Bay Area’s premier venues for popular music concerts.
25 www.planning.org.greatplaces/neighborhoods/2014/uptown.htm 26 City of Oakland, 2010 CRA Award Fox Theater, Available: http://ec2-54-235-79-104.compute-1.amazonaws.com/Government/o/CityAdministration/d/EconomicDevelopment/DOWD009001.htm
Figure 16: Uptown Art Park
Source: Greg Linhares
TIGER 2015 Grant Application: G O Up town
San Francisco Bay Area Rapid Transit (BART) District/City of Oakland, California | 21
GO Uptown will reinforce the neighborhood’s unique arts character. BART is in the process of creating an Arts in Transit Policy intended to enrich the rider experience, strengthen identity, connect to communities, and support a distinctive sense of place at stations and beyond. By including art as a tool in the service of accomplishing BART’s overall mission and strategic goals, BART will advance its reputation as a 21st century transit system. Modernization of the 19th St/Oakland station reflects these objectives, and will serve as a pilot for introducing BART’s Arts in Transit Policy for replication across the entire system.
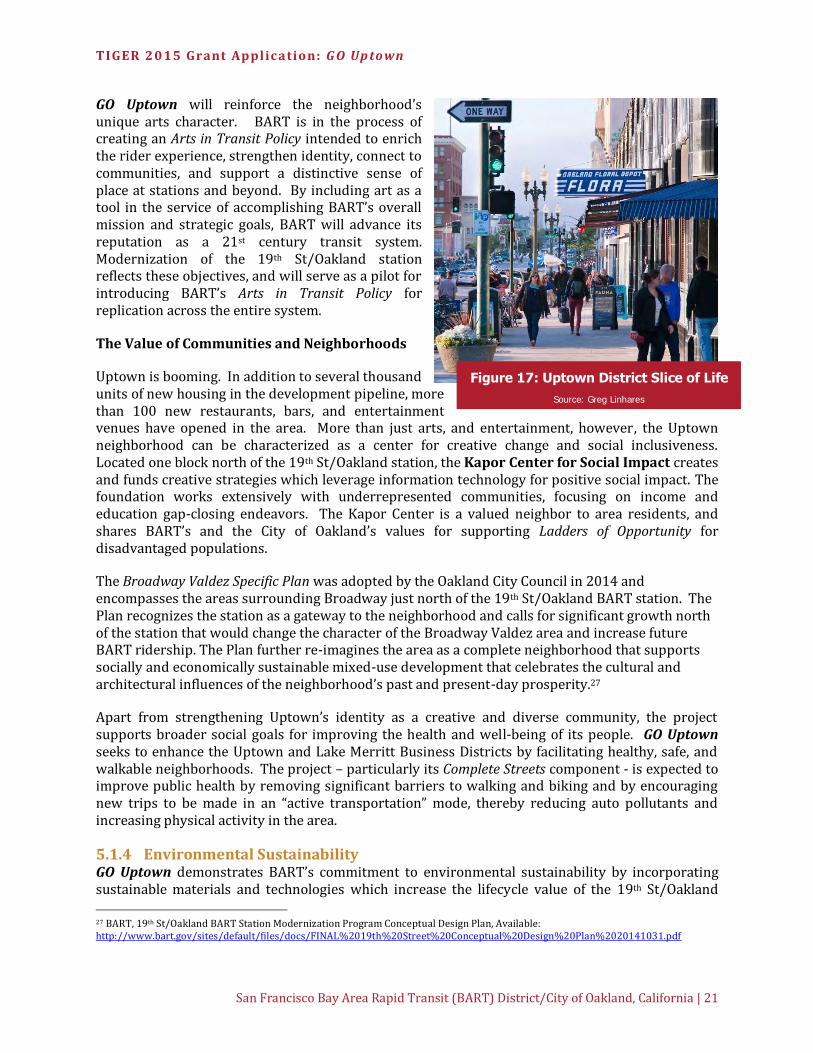
The Value of Communities and Neighborhoods
Uptown is booming. In addition to several thousand units of new housing in the development pipeline, more than 100 new restaurants, bars, and entertainment venues have opened in the area. More than just arts, and entertainment, however, the Uptown neighborhood can be characterized as a center for creative change and social inclusiveness. Located one block north of the 19th St/Oakland station, the Kapor Center for Social Impact creates and funds creative strategies which leverage information technology for positive social impact. The foundation works extensively with underrepresented communities, focusing on income and education gap-closing endeavors. The Kapor Center is a valued neighbor to area residents, and shares BART’s and the City of Oakland’s values for supporting Ladders of Opportunity for disadvantaged populations.
The Broadway Valdez Specific Plan was adopted by the Oakland City Council in 2014 and encompasses the areas surrounding Broadway just north of the 19th St/Oakland BART station. The Plan recognizes the station as a gateway to the neighborhood and calls for significant growth north of the station that would change the character of the Broadway Valdez area and increase future BART ridership. The Plan further re-imagines the area as a complete neighborhood that supports socially and economically sustainable mixed-use development that celebrates the cultural and architectural influences of the neighborhood’s past and present-day prosperity.27
Apart from strengthening Uptown’s identity as a creative and diverse community, the project supports broader social goals for improving the health and well-being of its people. GO Uptown seeks to enhance the Uptown and Lake Merritt Business Districts by facilitating healthy, safe, and walkable neighborhoods. The project – particularly its Complete Streets component - is expected to improve public health by removing significant barriers to walking and biking and by encouraging new trips to be made in an “active transportation” mode, thereby reducing auto pollutants and increasing physical activity in the area.
5.1.4 Environmental Sustainability GO Uptown demonstrates BART’s commitment to environmental sustainability by incorporating sustainable materials and technologies which increase the lifecycle value of the 19th St/Oakland
27 BART, 19th St/Oakland BART Station Modernization Program Conceptual Design Plan, Available: http://www.bart.gov/sites/default/files/docs/FINAL%2019th%20Street%20Conceptual%20Design%20Plan%2020141031.pdf
Figure 17: Uptown District Slice of Life
Source: Greg Linhares
TIGER 2015 Grant Application: G O Up town
San Francisco Bay Area Rapid Transit (BART) District/City of Oakland, California | 22
BART station’s infrastructure, conserves natural resources, and protects the reliability of the public investment.
The following sustainable design strategies are included in the project:
LED lighting fixtures, light timers, daylight sensors. Recycling receptacles. Materials and site furnishings made from recycled products. Water efficient taps, urinals, and toilet flushing systems in restrooms and janitor areas. The
replacement of conventional plumbing fixtures with modern, low-flow designs could achieve water savings of up to 60 percent.28
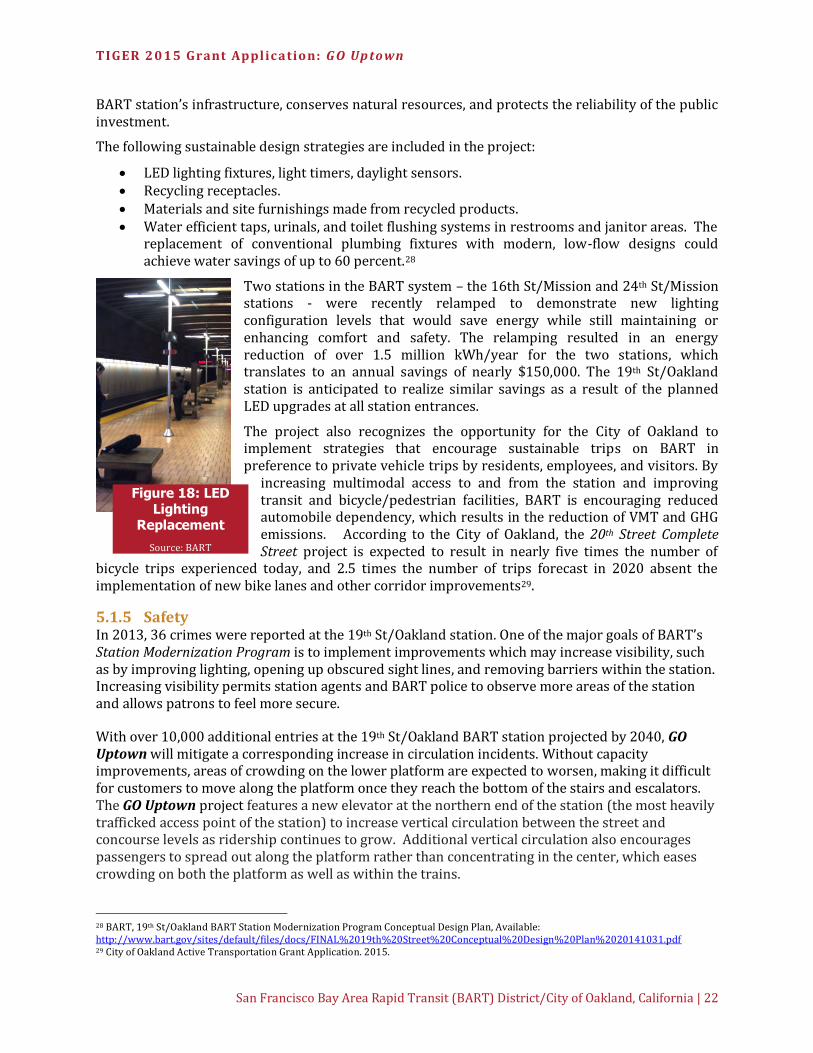
Two stations in the BART system – the 16th St/Mission and 24th St/Mission stations - were recently relamped to demonstrate new lighting configuration levels that would save energy while still maintaining or enhancing comfort and safety. The relamping resulted in an energy reduction of over 1.5 million kWh/year for the two stations, which translates to an annual savings of nearly $150,000. The 19th St/Oakland station is anticipated to realize similar savings as a result of the planned LED upgrades at all station entrances.
The project also recognizes the opportunity for the City of Oakland to implement strategies that encourage sustainable trips on BART in preference to private vehicle trips by residents, employees, and visitors. By
increasing multimodal access to and from the station and improving transit and bicycle/pedestrian facilities, BART is encouraging reduced automobile dependency, which results in the reduction of VMT and GHG emissions. According to the City of Oakland, the 20th Street Complete Street project is expected to result in nearly five times the number of
bicycle trips experienced today, and 2.5 times the number of trips forecast in 2020 absent the implementation of new bike lanes and other corridor improvements29.
5.1.5 Safety In 2013, 36 crimes were reported at the 19th St/Oakland station. One of the major goals of BART’s Station Modernization Program is to implement improvements which may increase visibility, such as by improving lighting, opening up obscured sight lines, and removing barriers within the station. Increasing visibility permits station agents and BART police to observe more areas of the station and allows patrons to feel more secure.
With over 10,000 additional entries at the 19th St/Oakland BART station projected by 2040, GO Uptown will mitigate a corresponding increase in circulation incidents. Without capacity improvements, areas of crowding on the lower platform are expected to worsen, making it difficult for customers to move along the platform once they reach the bottom of the stairs and escalators. The GO Uptown project features a new elevator at the northern end of the station (the most heavily trafficked access point of the station) to increase vertical circulation between the street and concourse levels as ridership continues to grow. Additional vertical circulation also encourages passengers to spread out along the platform rather than concentrating in the center, which eases crowding on both the platform as well as within the trains.
28 BART, 19th St/Oakland BART Station Modernization Program Conceptual Design Plan, Available: http://www.bart.gov/sites/default/files/docs/FINAL%2019th%20Street%20Conceptual%20Design%20Plan%2020141031.pdf 29 City of Oakland Active Transportation Grant Application. 2015.
Figure 18: LED Lighting
Replacement
Source: BART
TIGER 2015 Grant Application: G O Up town
San Francisco Bay Area Rapid Transit (BART) District/City of Oakland, California | 23
In the case of an emergency that requires the closure of the Transbay tunnel, the 19th St/Oakland station serves as the point of departure for BART passengers to access AC Transit’s Transbay Bus Bridge. In such circumstances, significant volumes of passengers are off-loaded at the train-level platform who must then exit north end station portals to access AC Transit’s pulse express service out of the Uptown Transit Center. The reallocated concourse space and relocated and additional faregates made possible by GO Uptown will significantly ease the crowding associated with this security event.
On a nearly daily basis there is also substantial crowding outside of the station during the peak morning commute. The surges in pedestrian flow exiting the station can conflict with an array of activities taking place at the station entrance, include the arrival of passengers entering the station, bicyclists parking and locking their bikes or entering the station, passengers being dropped off and picked up, and passengers waiting to be picked up by AC Transit or employer shuttles. GO Uptown’s 20th Street Complete Streets improvements will address the circulation issues by nearly doubling the width of the sidewalk in the vicinity of the 19th St/Oakland BART station, as well as provide more pedestrian level lighting and buffered bike lanes to relieve the congested north side of the street.
5.2. Secondary Criteria
5.2.1 Innovation The LED relamping of the 19th Street/Oakland station will be based upon BART’s recently updated facility standards, which includes the utilization of lighting technologies, such as selective switching, which are geared towards the efficient use of energy and optimizing the patron’s environment. The Wayfinding +Plus element of the GO Uptown project is also an innovative method of using artistic design elements that help patrons to navigate towards their final destination. A goal of the Wayfinding +Plus program is to facilitate passenger movement within and outside stations, thereby reducing passenger congestion within high-use areas of the station.
The inclusion of art at stations aligns with the Uptown District’s cultural renaissance. There are many opportunities to incorporate and integrate art and placemaking within the station. Many regional riders and visitors may pass through the station with little knowledge of the Uptown neighborhood’s vibrancy and attractions. Integrating art at the platform level that can be seen from passengers on the train presents an innovative opportunity to introduce riders to the area’s vitality and invite them to visit the neighborhoods. Art can also be used to attract customers to underutilized areas of the station and encourage efficient use of the platforms. There is also the opportunity to incorporate art and placemaking into the redesign of functional components of the station, such as lighting, bike racks, and paid area barriers.
5.2.2 Partnership BART’s Station Modernization Program includes a goal to protect the public’s investment in rail transit through strategic partnerships and the leveraging of outside funding to match its own investments. The Station Modernization Design Concept Plan for the 19th St/Oakland BART station was developed in close coordination with the City of Oakland, the Lake Merritt/Uptown District Association, and local business and community stakeholders. Stakeholders provided input in identifying existing conditions and needs, discussed and vetted proposed improvements, and
BART’s Poster Art program aims to enhance the physical
environment of BART stations by featuring artwork that conveys
the experience of riding BART, as
seen through the eyes of local Bay Area artists.

TIGER 2015 Grant Application: G O Up town
San Francisco Bay Area Rapid Transit (BART) District/City of Oakland, California | 24
helped prioritize the recommended improvements. The coordination re-enforced shared goals and helped to strengthen the proposed improvements. Further public meetings are scheduled in June 2015 and throughout the station planning and design process.
The City coordinated with the same partnership in the development of its 20th Street Complete
Streets Plan. BART and the City have also partnered to design and deliver the 19th Street Uptown Bike Station, as well as the 17th Street alley an dart installation adjacent to the southern-most 19th St/Oakland BART station portal.
Bridging the Innovation and Partnership criteria, BART has joined with other regional public agencies (MTC, the Association of Bay Area Governments, and the Bay Area Regional Collaborative), nonprofits (Transform, Nonprofit Housing Association of Northern California, California Housing Partnership Corporation), CDFIs (Enterprise, LIIF), and foundations (San Francisco Foundation) to develop innovative tools that will help implement Plan Bay Area - the region's first sustainable communities strategy. Together, this group is working closely with five cities with BART stations across the Bay Area, including Oakland, to address barriers to sustainable, equitable development. Last year, the group received one of three national grants from the Kresge Foundation to advance its innovative work in the field of Capital Absorption. This TIGER application supports the infrastructure components of that innovative work by accelerating the much-needed transit, pedestrian, and bicycle network to help support nearby development. In addition to strong regional partnerships, BART, AC Transit, and the City of Oakland have all benefitted from an extraordinary relationship with the Federal government. In November 2014, the Federal Transit Administration awarded $81 million – including $50 million in Capital
Figure 19: Uptown District Housing
Source: Greg Linhares
TIGER 2015 Grant Application: G O Up town
San Francisco Bay Area Rapid Transit (BART) District/City of Oakland, California | 25
Investment Grant program Small Starts funding – to AC Transit for its San Leandro to Oakland BRT project. The new BRT route, scheduled to open in 2017, begins service at the Uptown Transit Center, directly adjacent to the 19th St/Oakland BART station. The project includes 7.4 miles of dedicated bus lanes – about 78 percent of the route – as well as 34 new bus stations with real-time arrival information, level boarding platforms, and ticket vending machines. As one terminus of this intra-county bus line, the 19th St/Oakland BART station is likely to see an increase in bus-rail transfers.
More recently, BART requested FTA approval of its Transbay Corridor Core Capacity project into “Project Development.” Peak period ridership travelling through the Transbay Corridor currently exceeds capacity, which can only be expanded through a comprehensive and coordinated program to increase train lengths and frequency on each of the BART lines that pass through the Transbay Tube between San Francisco and Oakland. The Transbay Corridor Core Capacity project includes communication-based train control, expansion of the rail car fleet, added traction power, expansion of the Hayward Maintenance Complex to provide additional maintenance and storage capacity, station capacity improvements at the most heavily used and most crowded stations, and selected track improvements to facilitate movement of trains on closer headways. This program of core capacity improvements would increase BART’s Transbay Tube capacity by greater than 10 percent. BART awaits FTA approval to advance the project into Project Development. BART is also awaiting an FTA decision on its 2014 application for $1.1 million in funding under FTA’s Pilot Program for Transit-Oriented Development Planning. The planning grant would support the development of a strategy to address critical gaps in TOD implementation in the Transbay Corridor. While San Francisco has a robust pipeline of TOD in place, it lacks the capacity needed to absorb planned growth. At the same time, Oakland has more measured growth and available transit capacity. BART’s Transbay Corridor TOD Implementation Strategies project would result in the development of a coordinated TOD strategy across the four Oakland core BART stations – West Oakland, 12th St/Oakland, 19th St/Oakland – and Lake Merritt – to enhance economic development and encourage multi-directional BART ridership to better balance travel demand throughout the region. The results of this TOD study would further enhance the ability of the 19th St/Oakland BART station to help catalyze economic growth and opportunity for the Oakland Uptown community. Finally, BART and AC Transit are partners to the MTC’s successful TIGER 2014 planning grant award for a Bay Area Core Capacity Transit Study. The grant will support the evaluation and prioritization of short-, medium-, and long-term transit investments and other strategies to address existing and forecast capacity constraints in the core of the region. Specifically, the resulting study will result in the identification of a package of investments that expand transit capacity and connectivity to in the Transbay and MUNI Metro corridors.
6. BCA RESULTS
A benefit-cost analysis (BCA) was conducted for the GO Uptown project as a requirement of the discretionary grant application for the TIGER 2015 program. The analysis was conducted in accordance with USDOT’s benefit-cost methodology. The detailed BCA is provided as Appendix I to this application.
In real 2014 dollars, GO Uptown creates $36.0 million in present value benefits when discounted at seven percent and $69.5 million when discounted at three percent. The major benefit categories are passenger time savings for station users traveling within the station, reduction in criminal activities and incidences due to enhanced security measures, O&M savings in the areas of lighting and waste

TIGER 2015 Grant Application: G O Up town
San Francisco Bay Area Rapid Transit (BART) District/City of Oakland, California | 26
management, and elimination of fare evasion. These benefits indicate a project with a benefit cost ratio of 1.33 assuming a seven percent discount rate, and 2.41 at a three percent discount rate.
7. PROJECT READINESS
7.1. Technical Feasibility
BART has planned, designed, built and operates on a daily basis over 104 miles of Heavy Rail Transit. It has experience in the planning and implementation of capital projects of the most complex nature. Most recently, BART has substantially completed its $900 million Warm Springs Extension project, scheduled to open for revenue service in late Fall 2015. The Warm Springs Extension will add 5.4 miles of new heavy rail transit from the existing Fremont station south to a new station in the Warm Springs District of the City of Fremont. The complex project alignment crosses over Walnut Avenue; under Stevenson Boulevard, Fremont Central Park and the Union Pacific Railroad track in a subway; over Paseo Padre Parkway; under Washington Boulevard; under Auto Mall Parkway; and over South Grimmer Boulevard. Systemwide, BART’s FY 2015 capital budget exceeds $711 million.
BART’s Station Modernization Program has already resulted in the implementation of state of good repair improvements to the Ashby, Pleasant Hill, and Union City stations. BART has established a station modernization team that features experienced planners and designers whose sole focus is the rehabilitation and improvement of its existing stations. Current projects include improvements to BART’s Powell Street station in Downtown San Francisco, and the initiation of a Capacity Implementation Plan for the Embarcadero and Montgomery Street stations, the system’s two busiest passenger facilities.
BART manages approximately $150 million in Federal Transit Administration funding each year, and is a grantee in good standing. If selected for an award of TIGER funds, BART will lead the Federal environmental review of the GO Uptown project, administer the TIGER grant, and will implement the 19th St/Oakland station improvements. BART will pass through $5.1 million to the City of Oakland to implement the 20th Street Complete Street Plan, ensuring rigorous oversight of – and ultimate responsibility for -the appropriate use of USDOT discretionary funding.
The City of Oakland adopted a Complete Streets Policy in 2013 and has a Complete Streets Program Manager responsible for enacting it. Each year, the City undertakes hundreds of road infrastructure projects of various complexities. Currently under construction, the $6 million Latham Square urban street and plaza project is located at a prominent and architecturally important intersection of two of Uptown’s most significant streets (Telegraph Avenue & Broadway). The project required the balancing of demand for transit, bicycles, pedestrians, and automobiles, with the provision of a new public gathering space. The City developed and is currently overseeing a scope of work to
Figure 20: BART Construction
Source: BART
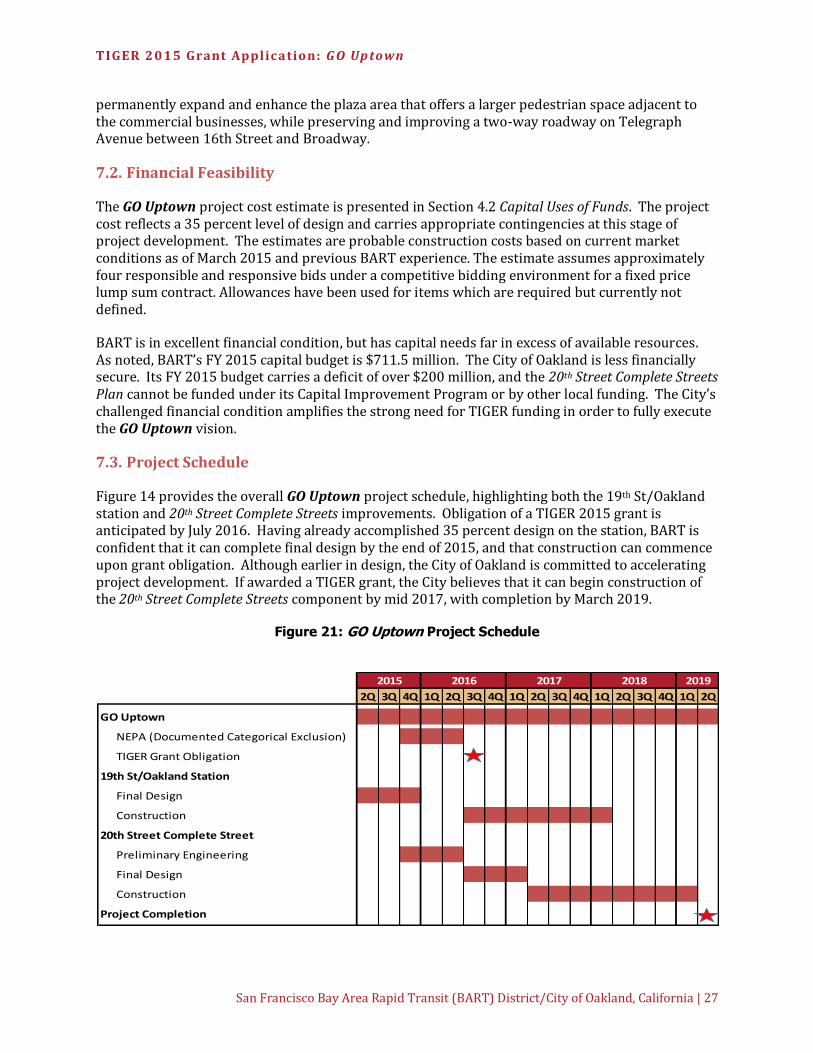
TIGER 2015 Grant Application: G O Up town
San Francisco Bay Area Rapid Transit (BART) District/City of Oakland, California | 27
permanently expand and enhance the plaza area that offers a larger pedestrian space adjacent to the commercial businesses, while preserving and improving a two-way roadway on Telegraph Avenue between 16th Street and Broadway.
7.2. Financial Feasibility
The GO Uptown project cost estimate is presented in Section 4.2 Capital Uses of Funds. The project cost reflects a 35 percent level of design and carries appropriate contingencies at this stage of project development. The estimates are probable construction costs based on current market conditions as of March 2015 and previous BART experience. The estimate assumes approximately four responsible and responsive bids under a competitive bidding environment for a fixed price lump sum contract. Allowances have been used for items which are required but currently not defined.
BART is in excellent financial condition, but has capital needs far in excess of available resources. As noted, BART’s FY 2015 capital budget is $711.5 million. The City of Oakland is less financially secure. Its FY 2015 budget carries a deficit of over $200 million, and the 20th Street Complete Streets Plan cannot be funded under its Capital Improvement Program or by other local funding. The City’s challenged financial condition amplifies the strong need for TIGER funding in order to fully execute the GO Uptown vision.
7.3. Project Schedule
Figure 14 provides the overall GO Uptown project schedule, highlighting both the 19th St/Oakland station and 20th Street Complete Streets improvements. Obligation of a TIGER 2015 grant is anticipated by July 2016. Having already accomplished 35 percent design on the station, BART is confident that it can complete final design by the end of 2015, and that construction can commence upon grant obligation. Although earlier in design, the City of Oakland is committed to accelerating project development. If awarded a TIGER grant, the City believes that it can begin construction of the 20th Street Complete Streets component by mid 2017, with completion by March 2019.
Figure 21: GO Uptown Project Schedule
2015 2016 2017 2018 2019
2Q 3Q 4Q 1Q 2Q 3Q 4Q 1Q 2Q 3Q 4Q 1Q 2Q 3Q 4Q 1Q 2Q
GO Uptown
NEPA (Documented Categorical Exclusion)
TIGER Grant Obligation
19th St/Oakland Station
Final Design
Construction
20th Street Complete Street
Preliminary Engineering
Final Design
Construction
Project Completion
TIGER 2015 Grant Application: G O Up town
San Francisco Bay Area Rapid Transit (BART) District/City of Oakland, California | 28
7.4. Required Approvals
Given the environment in which GO Uptown will be implemented – within and below (but within already constructed infrastructure) the existing transportation right-of way – it is expected that a Documented Categorical Exclusion (DCE) is the appropriate Class of Action for compliance with the National Environmental Policy Act (NEPA) of 1969. BART has sufficient staff and consultant resources under contract to perform the NEPA analysis, which would begin no later than 30 days after being selected by USDOT for a TIGER grant award. A signed DCE would be expected by Summer 2016.
The project is identified in Plan Bay Area, MTC’s financially constrained long range transportation plan. MTC has endorsed the project as a strong candidate for TIGER funding. Should GO Uptown be selected for award of a TIGER 2015 grant, the MTC will take action to place it in its Transportation Improvement Program (TIP) as soon as practicable.
Proposition 1B funds allocated to BART require no further approval for use.

TIGER 2015 Grant Application: G O Up town
San Francisco Bay Area Rapid Transit (BART) District/City of Oakland, California | 29
8. FEDERAL WAGE RATE CERTIFICATION

TIGER 2015 Grant Application: G O Up town
San Francisco Bay Area Rapid Transit (BART) District/City of Oakland, California | 30
APPENDICES
Appendix I Benefit-Cost Analysis
Appendix II Letters of Support
Appendix III Evidence of Proposition 1B Funding Commitment

AppendixI
GO Uptown Project Benefit-CostAnalysis
Prepared for the San Francisco Bay Area Rapid Transit (BART) District
June 4, 2015

ContentsExecutive Summary ................................................................................................................................ iii
Introduction ............................................................................................................................................ 1
Analytical Assumptions ............................................................................................................................ 1
Discount Rates ..................................................................................................................................... 1
Evaluation Period ................................................................................................................................ 1
Annualizing Factor Assumptions .......................................................................................................... 2
Ridership Estimates and Projection Sources ......................................................................................... 2
PRISMTM .................................................................................................................................................. 2
Economic Benefits Included ..................................................................................................................... 2
Economic Competitiveness .................................................................................................................. 2
Travel Time Savings ......................................................................................................................... 2
Safety .................................................................................................................................................. 5
Crime Reduction .............................................................................................................................. 5
State of Good Repair ........................................................................................................................... 7
O&M Savings ................................................................................................................................... 7
Reduced Fare Evasion ...................................................................................................................... 7
ADA Access Improvements .............................................................................................................. 7
Economic Costs Included and Assumptions.............................................................................................. 8
Initial Project Investment Costs ........................................................................................................... 8
Annual Operating and Maintenance Costs ........................................................................................... 8
Residual Value ..................................................................................................................................... 8
Key Benefit-Cost Evaluation Measures ..................................................................................................... 8
Benefit-Cost Analysis Results ................................................................................................................... 9
Results in Brief ..................................................................................................................................... 9
Benefits by Category ............................................................................................................................ 9
Costs over Time ................................................................................................................................. 11
Cumulative Benefits and Costs ........................................................................................................... 11
APPENDIX A - Benefit-Cost Model Detail Tables ..................................................................................... 13

ExecutiveSummaryA benefit-cost analysis (BCA) was conducted for the GO Uptown project for submission to the U.S.Department of Transportation (U.S. DOT) as a requirement of a discretionary grant application for theTIGER 2015 program. The analysis was conducted in accordance with the benefit-cost methodology asrecommended by the U.S. DOT in the Federal Register (80 FR 18283) and conducted for a 30-yearanalysis period after 2018.
GO Uptown consists of the modernization of BART’s 19th St/Oakland station and implementation of theCity of Oakland’s 20th Street Complete Streets Plan. The overall cost of the Project is expected to be$30,135,981 in undiscounted 2014 dollars. At a 7 percent discount rate, the total costs are $26.9million, while at a 3 percent discount rate the total costs are $28.7 million.
Capital Cost CategoryCosts
(2014 $)
Costs(2014 $
discounted at 7%)
Costs(2014 $
discounted at 3%)Total 30,135,981 26,936,111 28,690,113
Source: BART, 2015
In real 2014 dollars, the Project creates $36 million in present value benefits when discounted at 7percent or $69.5 million when discounted at 3 percent. The major benefit categories are: passengertime savings for station users traveling within the station, reduction in criminal activities and incidencesdue to enhanced security measures, O&M savings in the areas of lighting and waste management, andelimination of fare evasion. The overall project benefit matrix can be seen in Table 1. The appendix liststhe detailed benefits and costs by year.
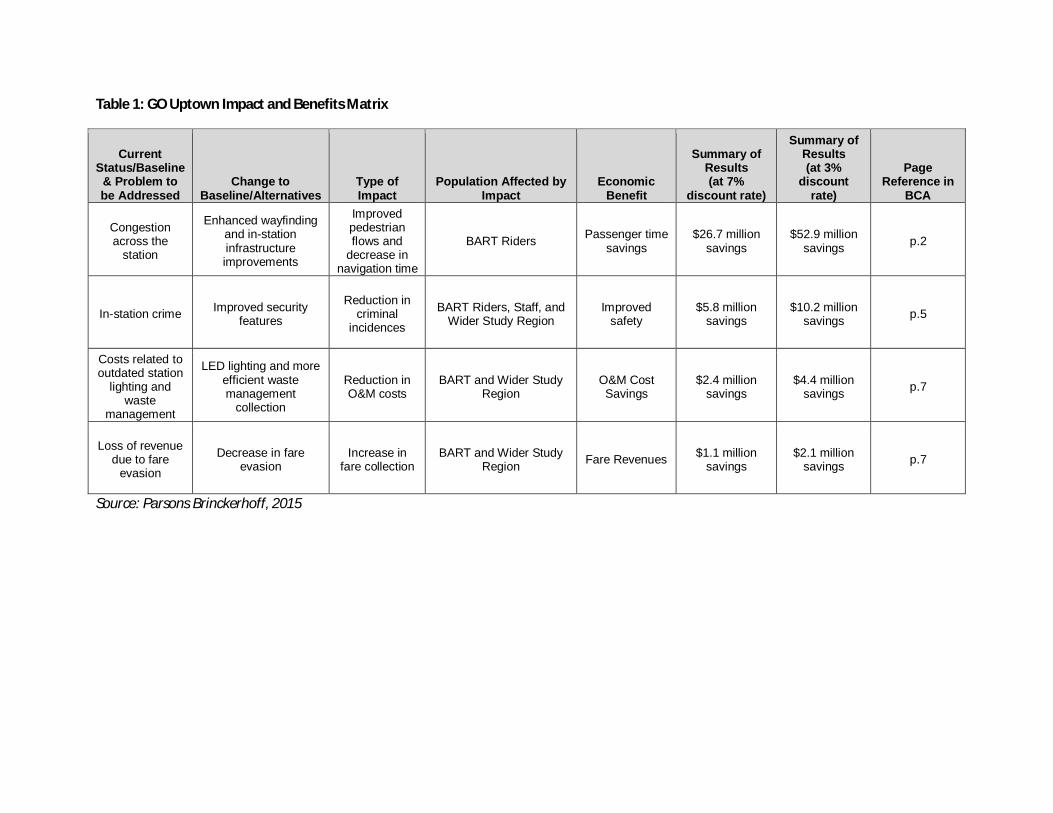
Table 1: GO Uptown Impact and Benefits Matrix
CurrentStatus/Baseline
& Problem tobe Addressed
Change toBaseline/Alternatives
Type ofImpact
Population Affected byImpact
EconomicBenefit
Summary ofResults(at 7%
discount rate)
Summary ofResults(at 3%
discountrate)
PageReference in
BCA
Congestionacross the
station
Enhanced wayfindingand in-stationinfrastructureimprovements
Improvedpedestrianflows and
decrease innavigation time
BART Riders Passenger timesavings
$26.7 millionsavings
$52.9 millionsavings p.2
In-station crime Improved securityfeatures
Reduction incriminal
incidences
BART Riders, Staff, andWider Study Region
Improvedsafety
$5.8 millionsavings
$10.2 millionsavings p.5
Costs related tooutdated station
lighting andwaste
management
LED lighting and moreefficient wastemanagement
collection
Reduction inO&M costs
BART and Wider StudyRegion
O&M CostSavings
$2.4 millionsavings
$4.4 millionsavings p.7
Loss of revenuedue to fare
evasion
Decrease in fareevasion
Increase infare collection
BART and Wider StudyRegion Fare Revenues $1.1 million
savings$2.1 million
savings p.7
Source: Parsons Brinckerhoff, 2015
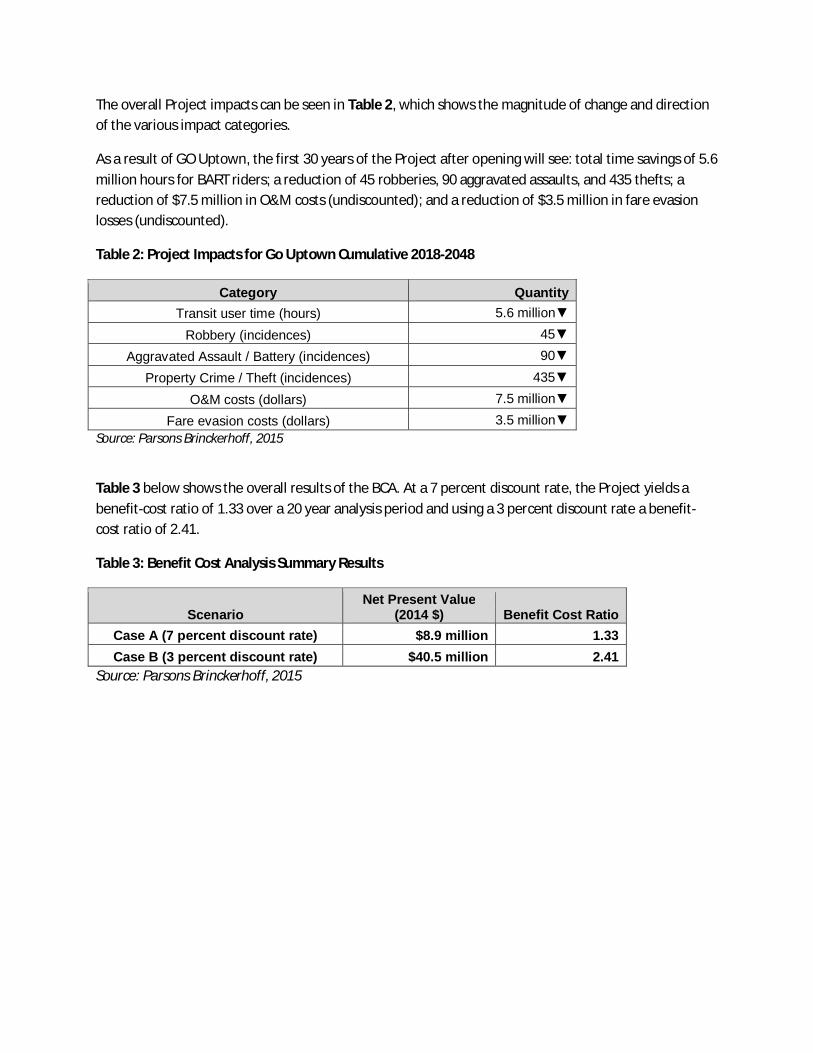
The overall Project impacts can be seen in Table 2, which shows the magnitude of change and directionof the various impact categories.
As a result of GO Uptown, the first 30 years of the Project after opening will see: total time savings of 5.6million hours for BART riders; a reduction of 45 robberies, 90 aggravated assaults, and 435 thefts; areduction of $7.5 million in O&M costs (undiscounted); and a reduction of $3.5 million in fare evasionlosses (undiscounted).
Table 2: Project Impacts for Go Uptown Cumulative 2018-2048
Category QuantityTransit user time (hours) 5.6 million▼
Robbery (incidences) 45▼
Aggravated Assault / Battery (incidences) 90▼
Property Crime / Theft (incidences) 435▼
O&M costs (dollars) 7.5 million▼
Fare evasion costs (dollars) 3.5 million▼Source: Parsons Brinckerhoff, 2015
Table 3 below shows the overall results of the BCA. At a 7 percent discount rate, the Project yields abenefit-cost ratio of 1.33 over a 20 year analysis period and using a 3 percent discount rate a benefit-cost ratio of 2.41.
Table 3: Benefit Cost Analysis Summary Results
ScenarioNet Present Value
(2014 $) Benefit Cost RatioCase A (7 percent discount rate) $8.9 million 1.33Case B (3 percent discount rate) $40.5 million 2.41
Source: Parsons Brinckerhoff, 2015
1
IntroductionA benefit-cost analysis (BCA) was conducted for the GO Uptown project for submission to the U.S.Department of Transportation (U.S. DOT) as a requirement of a discretionary grant application for theTIGER 2015 program. The analysis was conducted in accordance with the benefit-cost methodology asrecommended by the U.S. DOT in the Guide to Preparing Benefit-Cost Analyses for TIGER Grants1 andthe Notice of Funding Availability (80 FR 18283).
AnalyticalAssumptions
DiscountRatesFor project investments, dollar figures in this analysis are expressed in constant 2014 dollars. Ininstances where certain cost estimates or benefit valuations were expressed in dollar values in other(historical) years, the U.S. Bureau of Labor Statistics’ Consumer Price Index for Urban Consumers (CPI-U)was used to adjust them.2
The real discount rates used for this analysis were 3.0 and 7.0 percent, consistent with U.S. DOTguidance for TIGER 2015 grants3 and OMB Circular A-4.4.
EvaluationPeriodFor the GO Uptown project, the evaluation period includes the relevant (post-design) constructionperiod during which capital expenditures are undertaken, plus 30 years of operations beyond theProject completion within which to accrue benefits.
For the purposes of this study, it has been assumed that construction of the project begins as early as2016. The construction period continues through 2017 and 2018. The analysis period, therefore,begins with the first expenditures in 2016 and continues through 30-years of operations, or through2047.
All benefits and costs are assumed to occur at the end of each year, and benefits begin in the calendaryear immediately following the final construction year.
1 TIGER 2015 NOFA: Benefit-Cost Analysis Guidance, Updated March 27, 2015; http://www.dot.gov/tiger/guidance
2 U.S. Bureau of Labor Statistics. Consumer Price Index, All Urban Consumers, U.S. City Average, SeriesCUSR0000SA0. 1982-1984=100
3TIGER 2015 NOFA: Benefit-Cost Analysis Guidance, Updated March 27, 2015; http://www.dot.gov/tiger/guidance
4 White House Office of Management and Budget, Circular A-94, Guidelines and Discount Rates for Benefit-CostAnalysis of Federal Programs (October 29, 1992). (http://www.whitehouse.gov/omb/circulars_a094).
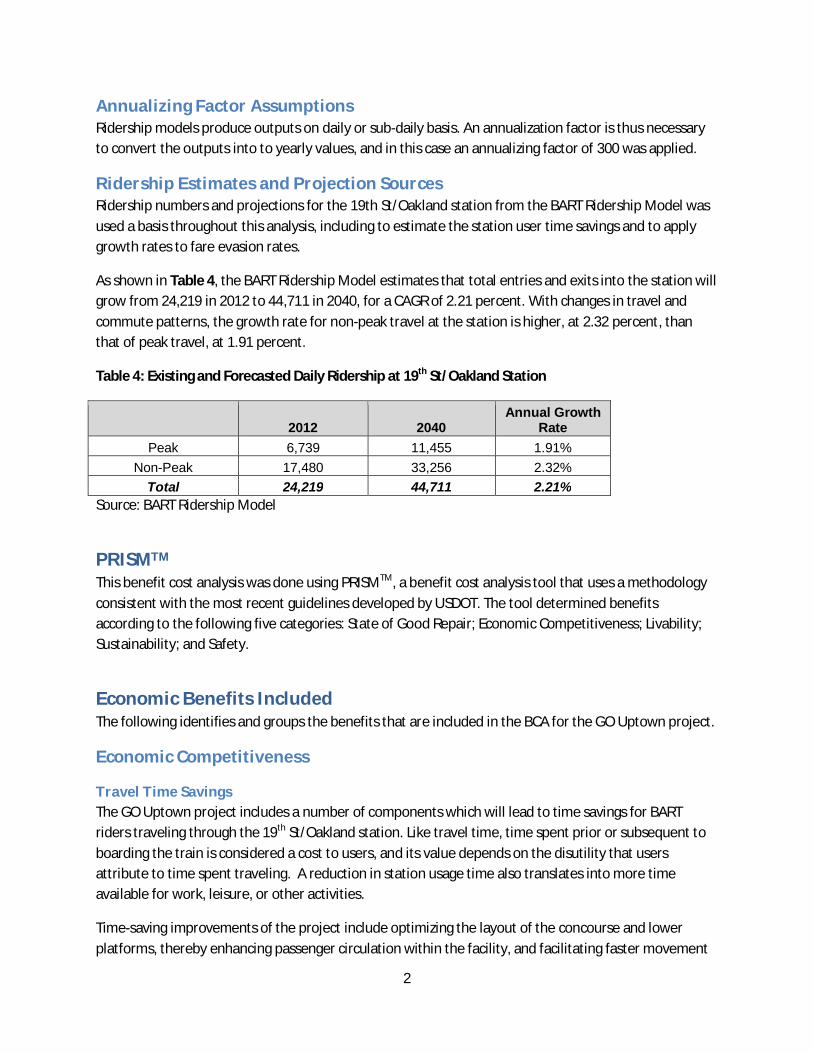
2
AnnualizingFactorAssumptionsRidership models produce outputs on daily or sub-daily basis. An annualization factor is thus necessaryto convert the outputs into to yearly values, and in this case an annualizing factor of 300 was applied.
RidershipEstimatesandProjectionSourcesRidership numbers and projections for the 19th St/Oakland station from the BART Ridership Model wasused a basis throughout this analysis, including to estimate the station user time savings and to applygrowth rates to fare evasion rates.
As shown in Table 4, the BART Ridership Model estimates that total entries and exits into the station willgrow from 24,219 in 2012 to 44,711 in 2040, for a CAGR of 2.21 percent. With changes in travel andcommute patterns, the growth rate for non-peak travel at the station is higher, at 2.32 percent, thanthat of peak travel, at 1.91 percent.
Table 4: Existing and Forecasted Daily Ridership at 19th St/Oakland Station
2012 2040Annual Growth
RatePeak 6,739 11,455 1.91%
Non-Peak 17,480 33,256 2.32%Total 24,219 44,711 2.21%
Source: BART Ridership Model
PRISMTM
This benefit cost analysis was done using PRISMTM, a benefit cost analysis tool that uses a methodologyconsistent with the most recent guidelines developed by USDOT. The tool determined benefitsaccording to the following five categories: State of Good Repair; Economic Competitiveness; Livability;Sustainability; and Safety.
EconomicBenefitsIncludedThe following identifies and groups the benefits that are included in the BCA for the GO Uptown project.
EconomicCompetitiveness
TravelTimeSavingsThe GO Uptown project includes a number of components which will lead to time savings for BARTriders traveling through the 19th St/Oakland station. Like travel time, time spent prior or subsequent toboarding the train is considered a cost to users, and its value depends on the disutility that usersattribute to time spent traveling. A reduction in station usage time also translates into more timeavailable for work, leisure, or other activities.
Time-saving improvements of the project include optimizing the layout of the concourse and lowerplatforms, thereby enhancing passenger circulation within the facility, and facilitating faster movement

3
from the train to street level (and vice-versa). Based on information in the Station Conceptual DesignPlan, an assessment of the station, feedback from BART staff, and benchmarking against other BARTstations, this analysis assumes that the station improvements would equate to 1 minute of total timesavings per peak-time rider and 30 seconds of total time savings per off-peak rider using the station,which in this case, is defined as a rider traveling from the street to the train platform, or vice-versa.These time savings apply to current year riders, and are assumed to grow at the same rate as stationpassenger growth as shown in Table 4 to account for increased congestion.
ValueofTimeAssumptionsTravel time savings must be converted from hours to dollars in order for benefits to be aggregated andcompared against costs. This is performed by assuming that travel time is valued as a percentage of theaverage wage rate, with different percentages assigned to different trip purposes (Table 5).
Values are broken down as low, medium and high for use in the PRISMTM analysis based on thepercentages in Table 6, as recommended by U.S. DOT. 5
Table 5: U.S. DOT Recommended Values of Time, 2014; (per person-hour as a percentage of totalearnings)
Category
Surface Modes(Except High-Speed Rail)
Low Likely HighAir and High-Speed Rail Travel
Low Likely HighLocal Travel
Personal 35% 50% 60% - - -Business 80% 100% 120% - - -
Intercity TravelPersonal 60% 70% 90% 60% 70% 90%Business 80% 100% 120% 80% 100% 120%
Vehicle OperatorsAll 80% 100% 120% 80% 100% 120%
Source: Office of the Secretary of Transportation, 2014.
5 Office of the Secretary of Transportation. (2014). Revised Departmental Guidance: Valuation of Travel Time inEconomic Analysis, p. 11-12. (http://www.dot.gov/sites/dot.gov/files/docs/USDOT%20VOT%20Guidance_0.pdf)
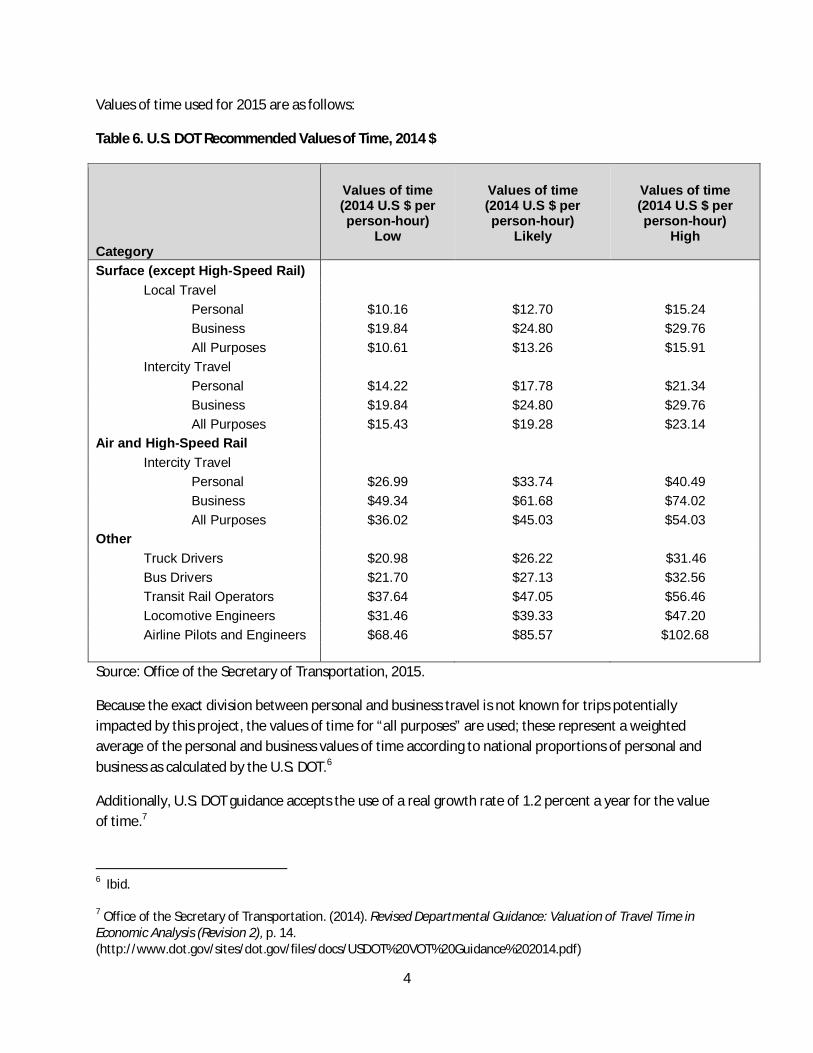
4
Values of time used for 2015 are as follows:
Table 6. U.S. DOT Recommended Values of Time, 2014 $
Category
Values of time(2014 U.S $ perperson-hour)
Low
Values of time(2014 U.S $ perperson-hour)
Likely
Values of time(2014 U.S $ perperson-hour)
High
Surface (except High-Speed Rail)Local Travel
Personal $10.16 $12.70 $15.24Business $19.84 $24.80 $29.76All Purposes $10.61 $13.26 $15.91
Intercity TravelPersonal $14.22 $17.78 $21.34Business $19.84 $24.80 $29.76All Purposes $15.43 $19.28 $23.14
Air and High-Speed RailIntercity Travel
Personal $26.99 $33.74 $40.49Business $49.34 $61.68 $74.02All Purposes $36.02 $45.03 $54.03
OtherTruck Drivers $20.98 $26.22 $31.46Bus Drivers $21.70 $27.13 $32.56Transit Rail Operators $37.64 $47.05 $56.46Locomotive Engineers $31.46 $39.33 $47.20Airline Pilots and Engineers $68.46 $85.57 $102.68
Source: Office of the Secretary of Transportation, 2015.
Because the exact division between personal and business travel is not known for trips potentiallyimpacted by this project, the values of time for “all purposes” are used; these represent a weightedaverage of the personal and business values of time according to national proportions of personal andbusiness as calculated by the U.S. DOT.6
Additionally, U.S. DOT guidance accepts the use of a real growth rate of 1.2 percent a year for the valueof time.7
6 Ibid.
7 Office of the Secretary of Transportation. (2014). Revised Departmental Guidance: Valuation of Travel Time inEconomic Analysis (Revision 2), p. 14.(http://www.dot.gov/sites/dot.gov/files/docs/USDOT%20VOT%20Guidance%202014.pdf)
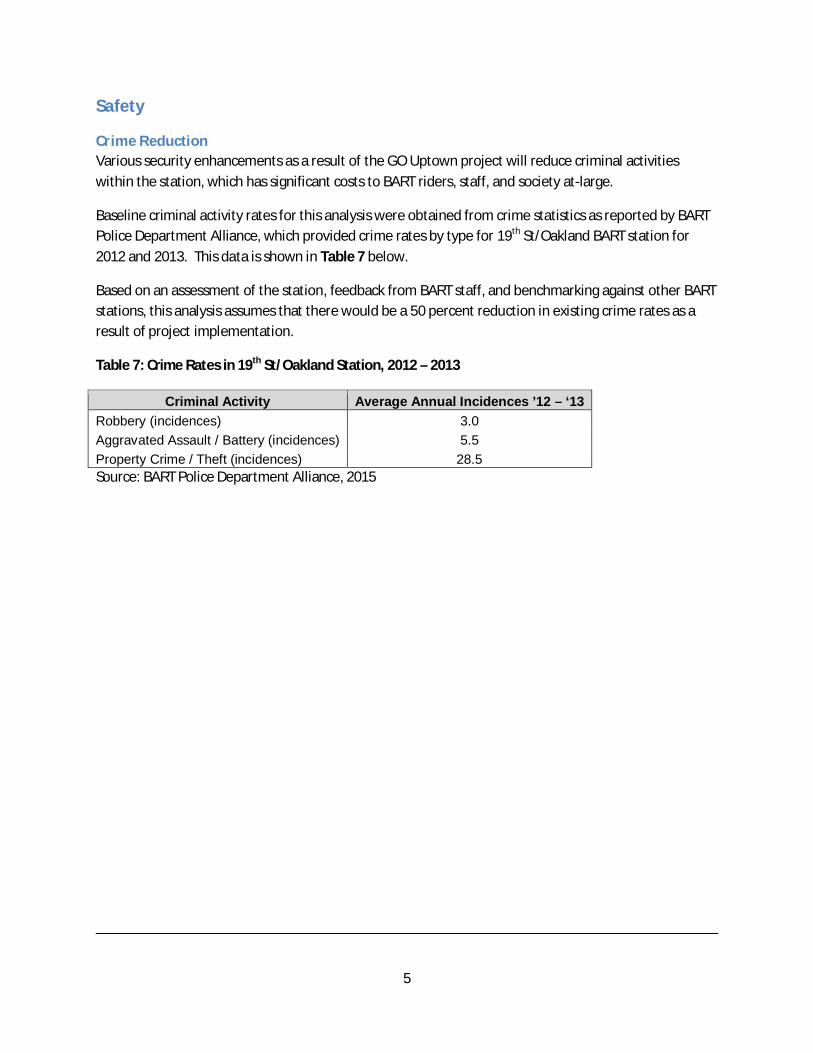
5
Safety
CrimeReductionVarious security enhancements as a result of the GO Uptown project will reduce criminal activitieswithin the station, which has significant costs to BART riders, staff, and society at-large.
Baseline criminal activity rates for this analysis were obtained from crime statistics as reported by BARTPolice Department Alliance, which provided crime rates by type for 19th St/Oakland BART station for2012 and 2013. This data is shown in Table 7 below.
Based on an assessment of the station, feedback from BART staff, and benchmarking against other BARTstations, this analysis assumes that there would be a 50 percent reduction in existing crime rates as aresult of project implementation.
Table 7: Crime Rates in 19th St/Oakland Station, 2012 – 2013
Criminal Activity Average Annual Incidences ’12 – ‘13Robbery (incidences) 3.0Aggravated Assault / Battery (incidences) 5.5Property Crime / Theft (incidences) 28.5Source: BART Police Department Alliance, 2015

6
The cost savings that arise from a reduction in the number of criminal incidences include direct savingsto the victim, as well as significant avoided costs to society. Monetized values for crimes categorizedabove were obtained from the best social science research in the field currently available. In 2010, RANDpublished the report “Hidden in Plain Sight” and an associated cost-of-crime calculator to help policymakers determine the economic return of various crime control investments. This research includesmonetized values of a wide range of criminal activities, shown in Table 8, which was applied in thisanalysis to estimate the benefit of crime reduction related to the GO Uptown project. These values werereported in 2010 dollars, and have been updated to current and future dollars for this analysis using aCPI adjustment.
Table 8: Monetized Crime Values
Criminal Activity Monetized Value (in 2010$)Robbery (incidences) $70,641Aggravated Assault / Battery (incidences) $91,694Property Crime / Theft (incidences) $2,264Source: RAND Corporation, Cost of Crime Calculator, 2010
7
StateofGoodRepairThe GO Uptown project will accrue benefits directly to the agency (BART) in the form of a net decreasein operations and maintenance expenditures, as well as through an expected increase in fare revenuesdue to a decrease in fare evasion rates. Increased farebox recovery and decreased O&M expenditureswill allow BART to direct additional resources elsewhere across its system, including undertakingadditional system maintenance, increasing service levels, decreasing reliance on outside operatingsubsidies, or other potential uses that benefit the transit user base and the entire study region.
O&MSavingsThe project will result in a net benefit in terms of operations and maintenance expenditures over the lifeof the project. O&M benefits accrue from two primary sources: the implementation of LED lighting, andthe outsourcing of waste management services to the “Bigbelly” smart waste and recycling system.According to a Lighting Strategy and Financial Analysis conducted by BART in 2015, LED lightingimplementation at 19th St/Oakland station would lead to $41,354 in annual energy savings and $38,206in annual O&M savings, for a total of $79,560 per year. According to current costs from the 4 BARTstations currently employing the “Bigbelly” waste management services, implementation of this serviceat the 19th St/Oakland Station would lead to annual savings of $65,366. For this analysis, the assumedgrowth rate for all O&M expenditures is 3 percent.
ReducedFareEvasionThe Project will eliminate fare evasion rates attributed to the station through additional fare barriersand enhanced guardrails. According to a Fare Evasion Study conducted by BART, the system-wide lossesattributed to fare evasion was estimated to be approximately $3.45 million, which divided out by the 44stations, equates to $78,409 attributable to each station. The growth rate assumption for fare evasion isassumed to equal to that of ridership growth rates for the station – 2.21 percent.
It should be noted that while included in this analysis, revenue losses from fare evasion are an indirectmeasure of total economic costs. The revenue loss to the agency due to fare evasion is considered an“economic or welfare” gain to the free rider. However at a price of zero, more riders are likely to haveno stake in the system, are likely to abuse transit equipment, may be more prime to committing crimes,and may experience a “shame factor” if caught evading a fare. To accommodate a high percentage offare evaders, the agency must pay their marginal cost, but the economic benefit of the ride to fareevaders is low. As such, the benefit accrued by the agency through increased payment of fares isconsidered an estimate that does not consider the small economic benefit lost by the fare evaders.
ADAAccessImprovementsThis work will improve the experience of ADA users of the facility. However, since the magnitude ofimprovement varies by location and there is limited information on the number of ADA users, thisbenefit is not monetized. Nevertheless, these improvements are important to maintain compliance withADA accessibility standards and ensure access for all persons regardless of ability.
8
EconomicCostsIncludedandAssumptionsIn the benefit-cost analysis, the term “cost” refers to the additional resource costs or expendituresrequired to implement, and maintain the investments associated with the GO Uptown project.
The BCA uses project costs that have been estimated for the GO Uptown project on an annual basis.Operations and maintenance costs were initially expressed in real dollars while the capital costs wereinitially expressed in current dollars. All costs were converted to real dollars based on CPI-Uadjustments.8
InitialProjectInvestmentCostsInitial project investment costs include engineering and design, construction, other capital investments,and contingency factors. These costs were reported by BART and included costs beginning in 2016 andending in 2017. The enhanced facility is expected to be operational in 2018.
AnnualOperatingandMaintenanceCostsO&M costs are reported as marginal operating costs, or the costs above and beyond those expected inthe no-build scenario. Because the proposed project consists of improvement in station operations,including lighting and waste management, but not adding labor or other expenses to the no-buildscenario, the annual costs of operating and maintaining the proposed GO Uptown project results in anet benefit over the no-build scenario. Therefore operations and maintenance costs associated withlighting and waste management are included in this analysis as a net benefit, rather than cost.
ResidualValueThe GO Uptown project is assumed to have a 30-year life cycle, which coincides to the end of this BCA,thus this analysis assumes the residual value, or remaining capital value, to be zero using a straight linedepreciation method.
KeyBenefit-CostEvaluationMeasuresThe benefit-cost analysis converts potential gains (benefits) and losses (costs) from the GO Uptownproject into monetary units and compares them. The following three common benefit-cost evaluationmeasures are included in this BCA.
Net Present Value (NPV): NPV compares the net benefits (benefits minus costs) after beingdiscounted to present values using the real discount rate assumption. The NPV provides aperspective on the overall dollar magnitude of cash flows over time in today’s dollar terms.
Benefit Cost (B/C) Ratio: The evaluation also estimates the benefit-cost ratio; the present value ofincremental benefits is divided by the present value of incremental costs to yield the benefit-costratio. The B/C ratio expresses the relation of discounted benefits to discounted costs as a measureof the extent to which a project’s benefits either exceed or fall short of their associated costs.
8 Bureau of Labor Statistics, Consumer Price Index, All Urban Consumers, U.S. City Average, All Items, SeriesCUSR0000SA0.
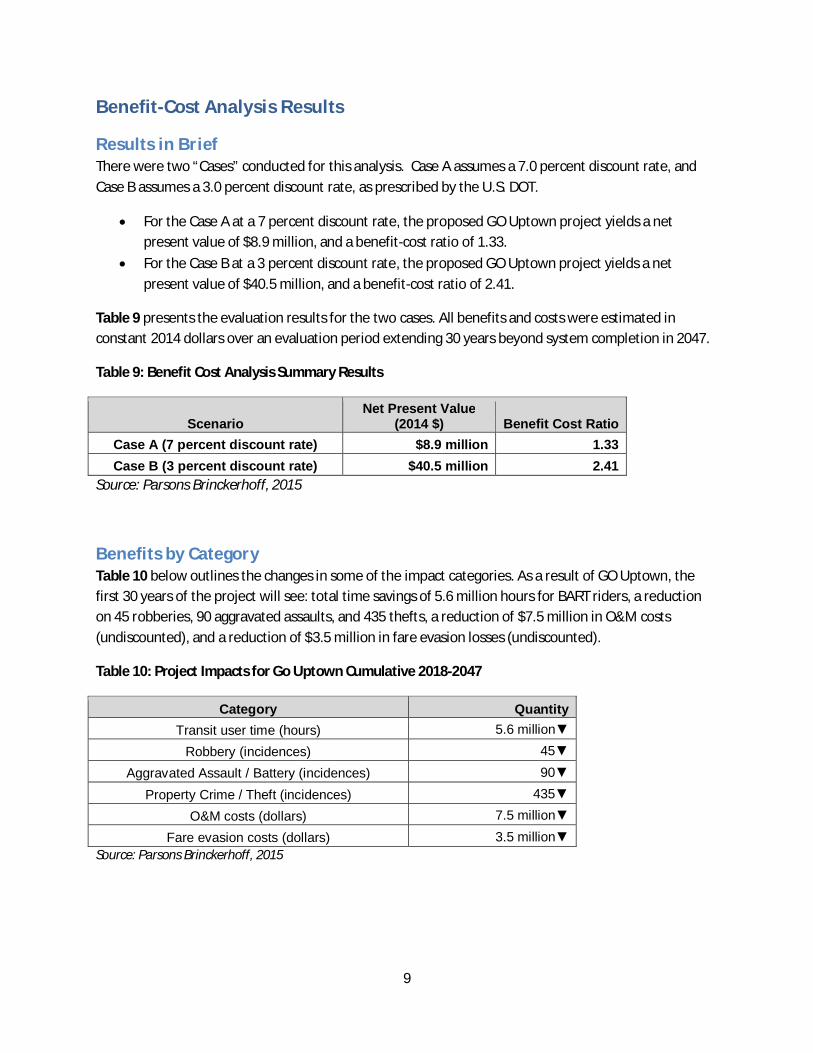
9
Benefit-CostAnalysisResults
ResultsinBriefThere were two “Cases” conducted for this analysis. Case A assumes a 7.0 percent discount rate, andCase B assumes a 3.0 percent discount rate, as prescribed by the U.S. DOT.
· For the Case A at a 7 percent discount rate, the proposed GO Uptown project yields a netpresent value of $8.9 million, and a benefit-cost ratio of 1.33.
· For the Case B at a 3 percent discount rate, the proposed GO Uptown project yields a netpresent value of $40.5 million, and a benefit-cost ratio of 2.41.
Table 9 presents the evaluation results for the two cases. All benefits and costs were estimated inconstant 2014 dollars over an evaluation period extending 30 years beyond system completion in 2047.
Table 9: Benefit Cost Analysis Summary Results
ScenarioNet Present Value
(2014 $) Benefit Cost RatioCase A (7 percent discount rate) $8.9 million 1.33Case B (3 percent discount rate) $40.5 million 2.41
Source: Parsons Brinckerhoff, 2015
BenefitsbyCategoryTable 10 below outlines the changes in some of the impact categories. As a result of GO Uptown, thefirst 30 years of the project will see: total time savings of 5.6 million hours for BART riders, a reductionon 45 robberies, 90 aggravated assaults, and 435 thefts, a reduction of $7.5 million in O&M costs(undiscounted), and a reduction of $3.5 million in fare evasion losses (undiscounted).
Table 10: Project Impacts for Go Uptown Cumulative 2018-2047
Category QuantityTransit user time (hours) 5.6 million▼
Robbery (incidences) 45▼
Aggravated Assault / Battery (incidences) 90▼
Property Crime / Theft (incidences) 435▼
O&M costs (dollars) 7.5 million▼
Fare evasion costs (dollars) 3.5 million▼Source: Parsons Brinckerhoff, 2015
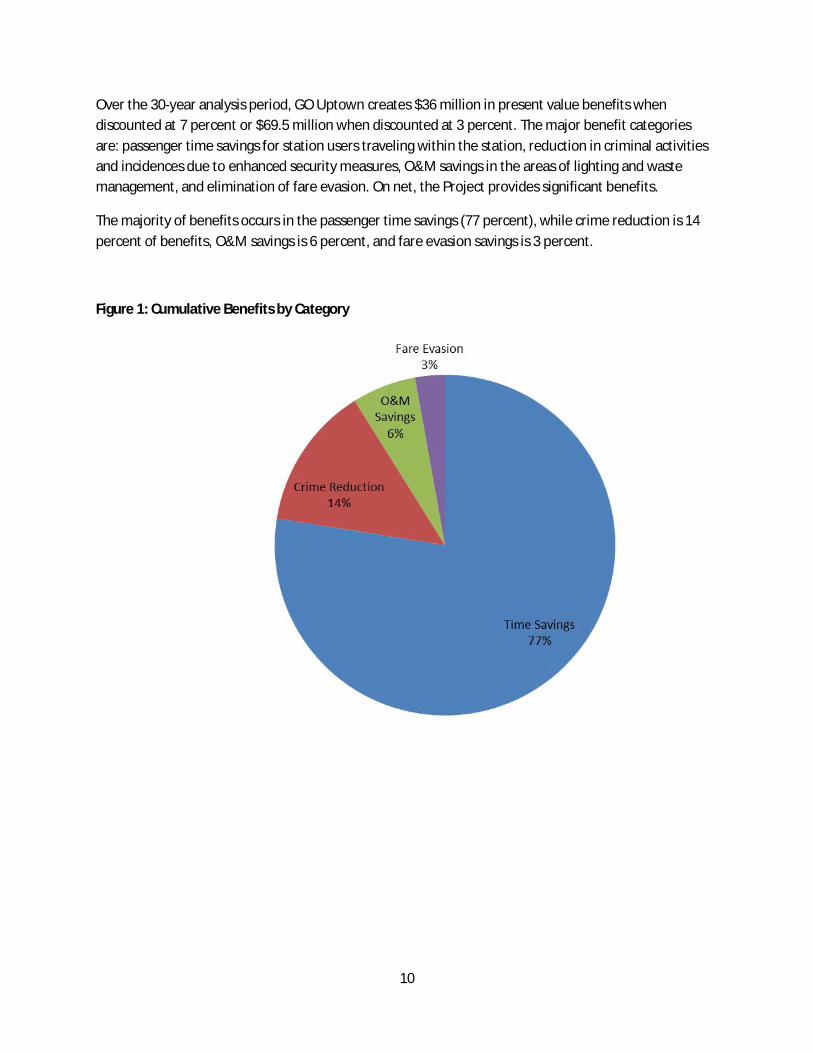
10
Over the 30-year analysis period, GO Uptown creates $36 million in present value benefits whendiscounted at 7 percent or $69.5 million when discounted at 3 percent. The major benefit categoriesare: passenger time savings for station users traveling within the station, reduction in criminal activitiesand incidences due to enhanced security measures, O&M savings in the areas of lighting and wastemanagement, and elimination of fare evasion. On net, the Project provides significant benefits.
The majority of benefits occurs in the passenger time savings (77 percent), while crime reduction is 14percent of benefits, O&M savings is 6 percent, and fare evasion savings is 3 percent.
Figure 1: Cumulative Benefits by Category

11
CostsoverTimeThe total capital investments ($30.1 million) were assumed to begin in 2016 and conclude by the end of2017. These capital costs translate to $26.9 million when discounted at 7 percent and $28.7 millionwhen discounted at 3 percent.
Table 11: GO Uptown Capital Costs
Capital Cost CategoryCosts
(2014 $)
Costs(2014 $
discounted at 7%)
Costs(2014 $
discounted at 3%)Total 30,135,981 26,936,111 28,690,113
Source: BART, 2015
CumulativeBenefitsandCostsFigure 2 and Figure 3 compare the cumulative present value of benefits with the cumulative presentvalue of costs over time for both cases. The figure shows that the cumulative discounted benefitsexceed the cumulative discounted costs by mid-2039 with a 7 percent discount rate, and by mid-2032with a 3 percent discount rate.
Figure 2: Cumulative Benefits and Costs in 2014 Dollars (Discounted at 7 percent)
Source: Parsons Brinckerhoff, 2015
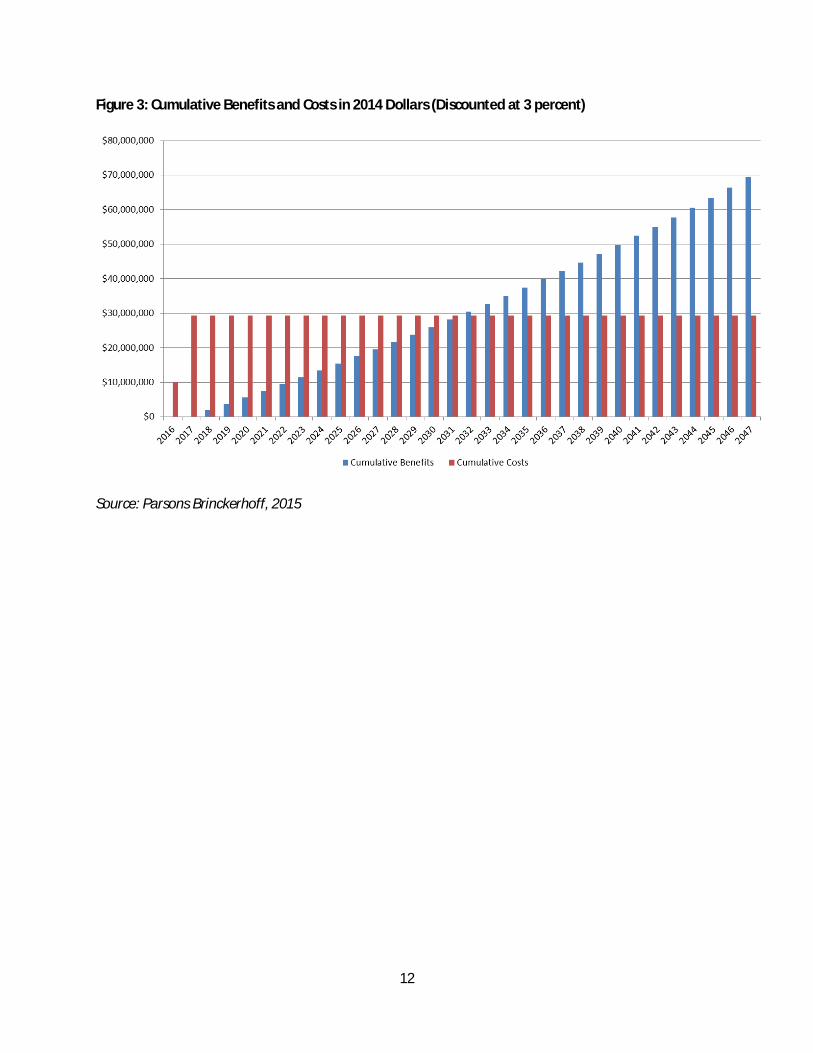
12
Figure 3: Cumulative Benefits and Costs in 2014 Dollars (Discounted at 3 percent)
Source: Parsons Brinckerhoff, 2015
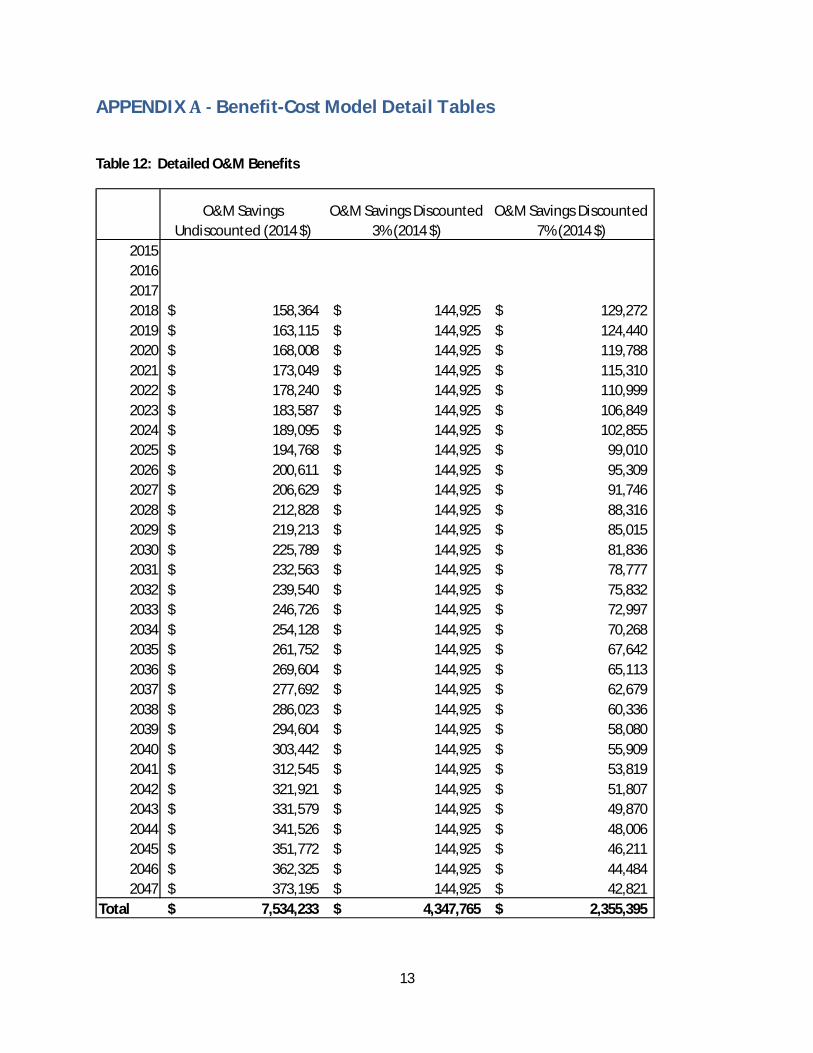
13
APPENDIXA-Benefit-CostModelDetailTables
Table 12: Detailed O&M Benefits
O&M SavingsUndiscounted (2014 $)
O&M Savings Discounted3% (2014 $)
O&M Savings Discounted7% (2014 $)
2015201620172018 158,364$ 144,925$ 129,272$2019 163,115$ 144,925$ 124,440$2020 168,008$ 144,925$ 119,788$2021 173,049$ 144,925$ 115,310$2022 178,240$ 144,925$ 110,999$2023 183,587$ 144,925$ 106,849$2024 189,095$ 144,925$ 102,855$2025 194,768$ 144,925$ 99,010$2026 200,611$ 144,925$ 95,309$2027 206,629$ 144,925$ 91,746$2028 212,828$ 144,925$ 88,316$2029 219,213$ 144,925$ 85,015$2030 225,789$ 144,925$ 81,836$2031 232,563$ 144,925$ 78,777$2032 239,540$ 144,925$ 75,832$2033 246,726$ 144,925$ 72,997$2034 254,128$ 144,925$ 70,268$2035 261,752$ 144,925$ 67,642$2036 269,604$ 144,925$ 65,113$2037 277,692$ 144,925$ 62,679$2038 286,023$ 144,925$ 60,336$2039 294,604$ 144,925$ 58,080$2040 303,442$ 144,925$ 55,909$2041 312,545$ 144,925$ 53,819$2042 321,921$ 144,925$ 51,807$2043 331,579$ 144,925$ 49,870$2044 341,526$ 144,925$ 48,006$2045 351,772$ 144,925$ 46,211$2046 362,325$ 144,925$ 44,484$2047 373,195$ 144,925$ 42,821$
Total 7,534,233$ 4,347,765$ 2,355,395$
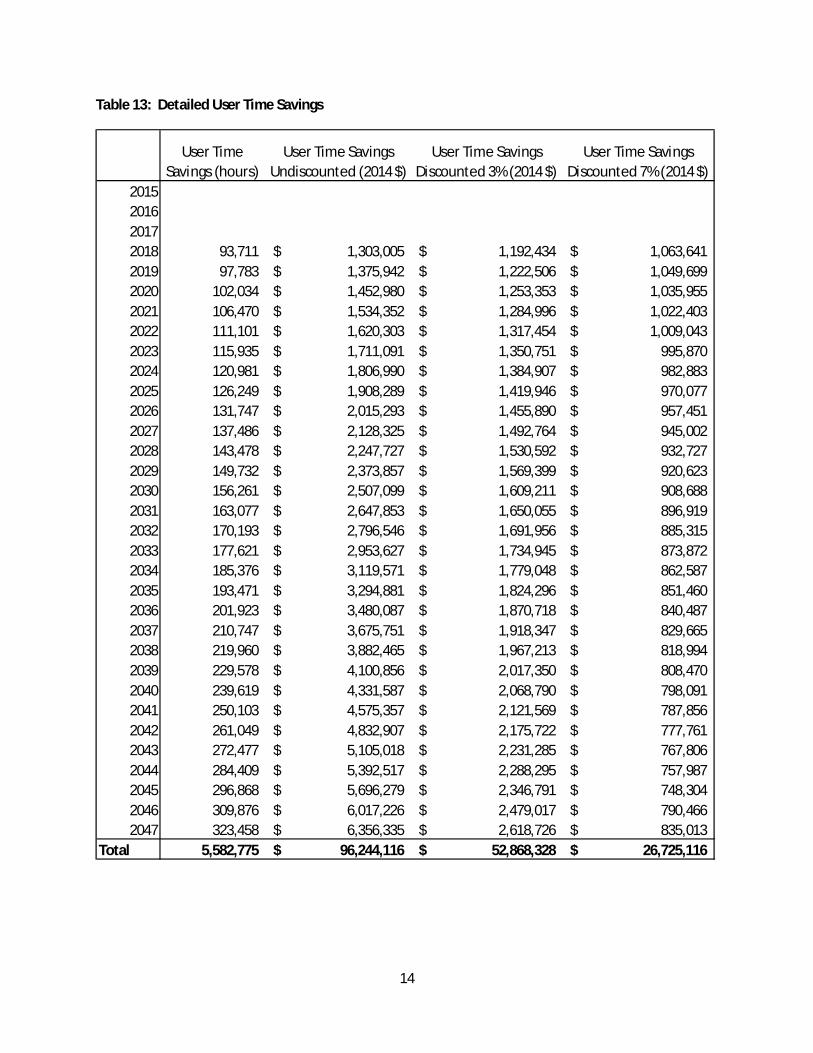
14
Table 13: Detailed User Time Savings
User TimeSavings (hours)
User Time SavingsUndiscounted (2014 $)
User Time SavingsDiscounted 3% (2014 $)
User Time SavingsDiscounted 7% (2014 $)
2015201620172018 93,711 1,303,005$ 1,192,434$ 1,063,641$2019 97,783 1,375,942$ 1,222,506$ 1,049,699$2020 102,034 1,452,980$ 1,253,353$ 1,035,955$2021 106,470 1,534,352$ 1,284,996$ 1,022,403$2022 111,101 1,620,303$ 1,317,454$ 1,009,043$2023 115,935 1,711,091$ 1,350,751$ 995,870$2024 120,981 1,806,990$ 1,384,907$ 982,883$2025 126,249 1,908,289$ 1,419,946$ 970,077$2026 131,747 2,015,293$ 1,455,890$ 957,451$2027 137,486 2,128,325$ 1,492,764$ 945,002$2028 143,478 2,247,727$ 1,530,592$ 932,727$2029 149,732 2,373,857$ 1,569,399$ 920,623$2030 156,261 2,507,099$ 1,609,211$ 908,688$2031 163,077 2,647,853$ 1,650,055$ 896,919$2032 170,193 2,796,546$ 1,691,956$ 885,315$2033 177,621 2,953,627$ 1,734,945$ 873,872$2034 185,376 3,119,571$ 1,779,048$ 862,587$2035 193,471 3,294,881$ 1,824,296$ 851,460$2036 201,923 3,480,087$ 1,870,718$ 840,487$2037 210,747 3,675,751$ 1,918,347$ 829,665$2038 219,960 3,882,465$ 1,967,213$ 818,994$2039 229,578 4,100,856$ 2,017,350$ 808,470$2040 239,619 4,331,587$ 2,068,790$ 798,091$2041 250,103 4,575,357$ 2,121,569$ 787,856$2042 261,049 4,832,907$ 2,175,722$ 777,761$2043 272,477 5,105,018$ 2,231,285$ 767,806$2044 284,409 5,392,517$ 2,288,295$ 757,987$2045 296,868 5,696,279$ 2,346,791$ 748,304$2046 309,876 6,017,226$ 2,479,017$ 790,466$2047 323,458 6,356,335$ 2,618,726$ 835,013$
Total 5,582,775 96,244,116$ 52,868,328$ 26,725,116$
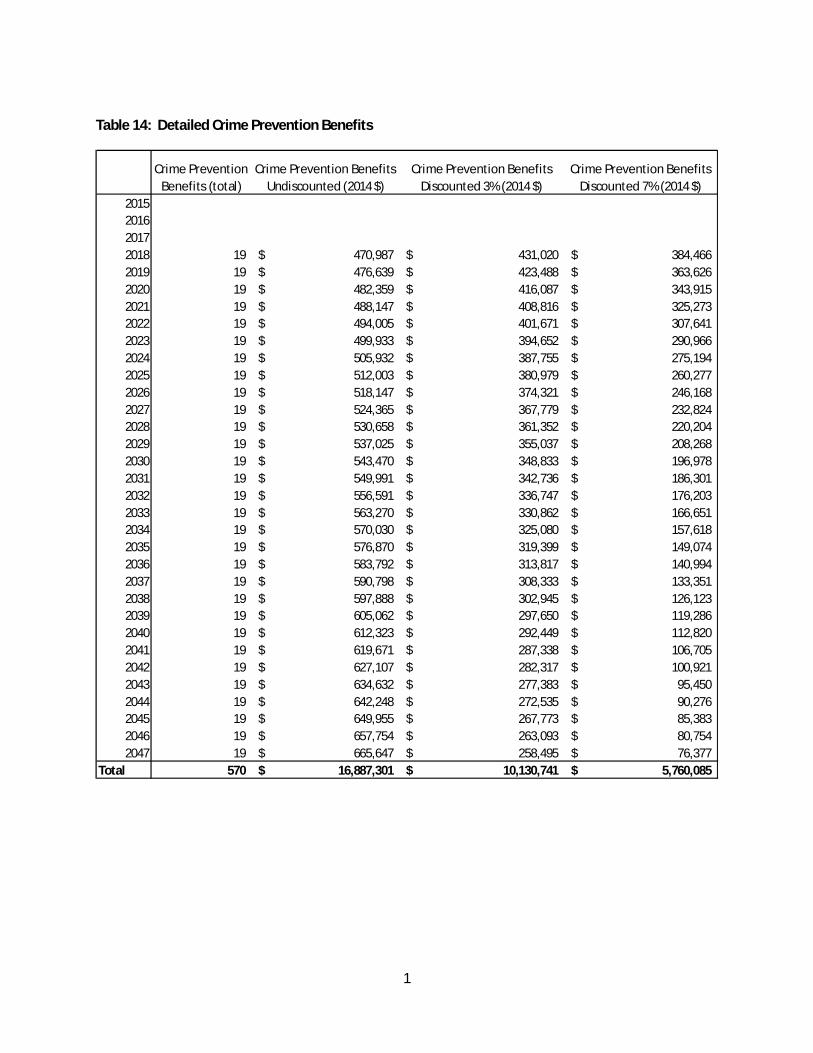
1
Table 14: Detailed Crime Prevention Benefits
Crime PreventionBenefits (total)
Crime Prevention BenefitsUndiscounted (2014 $)
Crime Prevention BenefitsDiscounted 3% (2014 $)
Crime Prevention BenefitsDiscounted 7% (2014 $)
2015201620172018 19 470,987$ 431,020$ 384,466$2019 19 476,639$ 423,488$ 363,626$2020 19 482,359$ 416,087$ 343,915$2021 19 488,147$ 408,816$ 325,273$2022 19 494,005$ 401,671$ 307,641$2023 19 499,933$ 394,652$ 290,966$2024 19 505,932$ 387,755$ 275,194$2025 19 512,003$ 380,979$ 260,277$2026 19 518,147$ 374,321$ 246,168$2027 19 524,365$ 367,779$ 232,824$2028 19 530,658$ 361,352$ 220,204$2029 19 537,025$ 355,037$ 208,268$2030 19 543,470$ 348,833$ 196,978$2031 19 549,991$ 342,736$ 186,301$2032 19 556,591$ 336,747$ 176,203$2033 19 563,270$ 330,862$ 166,651$2034 19 570,030$ 325,080$ 157,618$2035 19 576,870$ 319,399$ 149,074$2036 19 583,792$ 313,817$ 140,994$2037 19 590,798$ 308,333$ 133,351$2038 19 597,888$ 302,945$ 126,123$2039 19 605,062$ 297,650$ 119,286$2040 19 612,323$ 292,449$ 112,820$2041 19 619,671$ 287,338$ 106,705$2042 19 627,107$ 282,317$ 100,921$2043 19 634,632$ 277,383$ 95,450$2044 19 642,248$ 272,535$ 90,276$2045 19 649,955$ 267,773$ 85,383$2046 19 657,754$ 263,093$ 80,754$2047 19 665,647$ 258,495$ 76,377$
Total 570 16,887,301$ 10,130,741$ 5,760,085$

2
Table 15: Detailed Fare Evasion Benefits
Additional Fare RevenueUndiscounted (2014 $)
Additional Fare RevenueDiscounted 3% (2014 $)
Additional Fare RevenueDiscounted 7% (2014 $)
2015201620172018 83,733$ 76,627$ 68,351$2019 85,586$ 76,042$ 65,293$2020 87,481$ 75,462$ 62,373$2021 89,417$ 74,886$ 59,583$2022 91,397$ 74,314$ 56,917$2023 93,420$ 73,747$ 54,371$2024 95,488$ 73,184$ 51,939$2025 97,602$ 72,625$ 49,616$2026 99,763$ 72,071$ 47,397$2027 101,971$ 71,520$ 45,276$2028 104,228$ 70,975$ 43,251$2029 106,536$ 70,433$ 41,316$2030 108,894$ 69,895$ 39,468$2031 111,305$ 69,361$ 37,703$2032 113,769$ 68,832$ 36,016$2033 116,287$ 68,307$ 34,405$2034 118,862$ 67,785$ 32,866$2035 121,493$ 67,268$ 31,396$2036 124,182$ 66,754$ 29,992$2037 126,931$ 66,245$ 28,650$2038 129,741$ 65,739$ 27,369$2039 132,613$ 65,237$ 26,144$2040 135,549$ 64,739$ 24,975$2041 138,550$ 64,245$ 23,858$2042 141,617$ 63,754$ 22,790$2043 144,752$ 63,268$ 21,771$2044 147,956$ 62,785$ 20,797$2045 151,232$ 62,305$ 19,867$2046 154,580$ 61,830$ 18,978$2047 158,002$ 61,358$ 18,129$
Total 3,512,937$ 2,061,591$ 1,140,858$
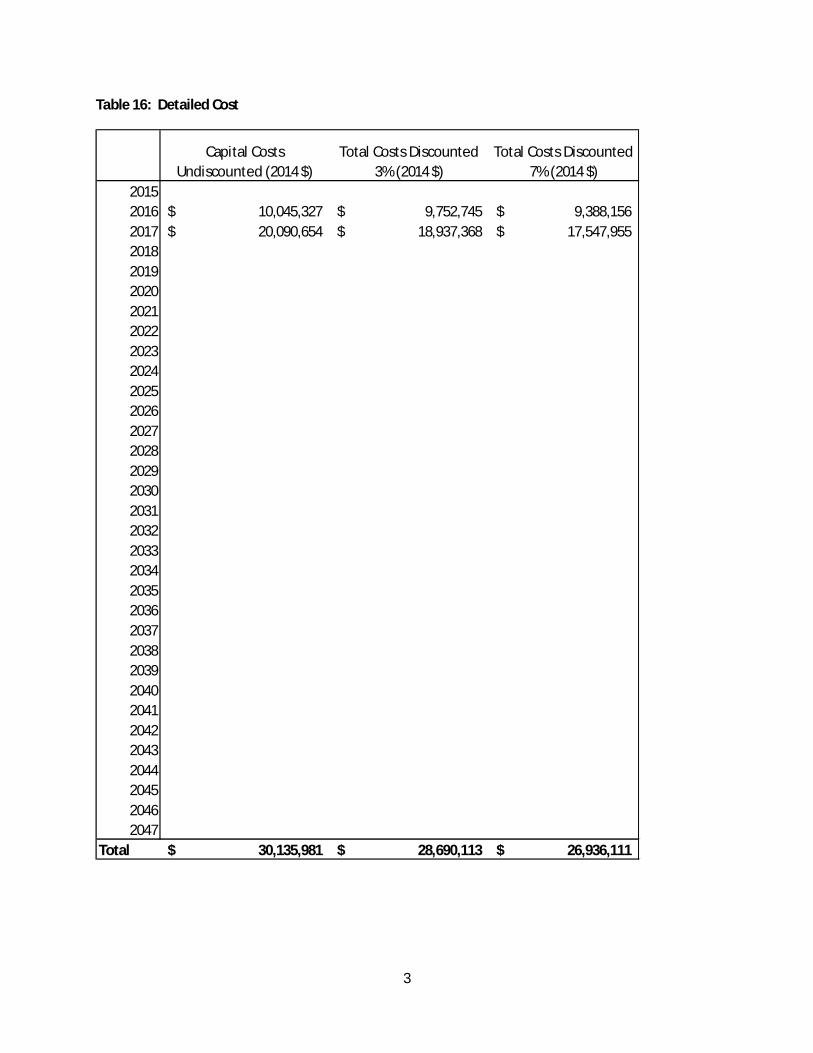
3
Table 16: Detailed Cost
Capital CostsUndiscounted (2014 $)
Total Costs Discounted3% (2014 $)
Total Costs Discounted7% (2014 $)
20152016 10,045,327$ 9,752,745$ 9,388,156$2017 20,090,654$ 18,937,368$ 17,547,955$201820192020202120222023202420252026202720282029203020312032203320342035203620372038203920402041204220432044204520462047
Total 30,135,981$ 28,690,113$ 26,936,111$
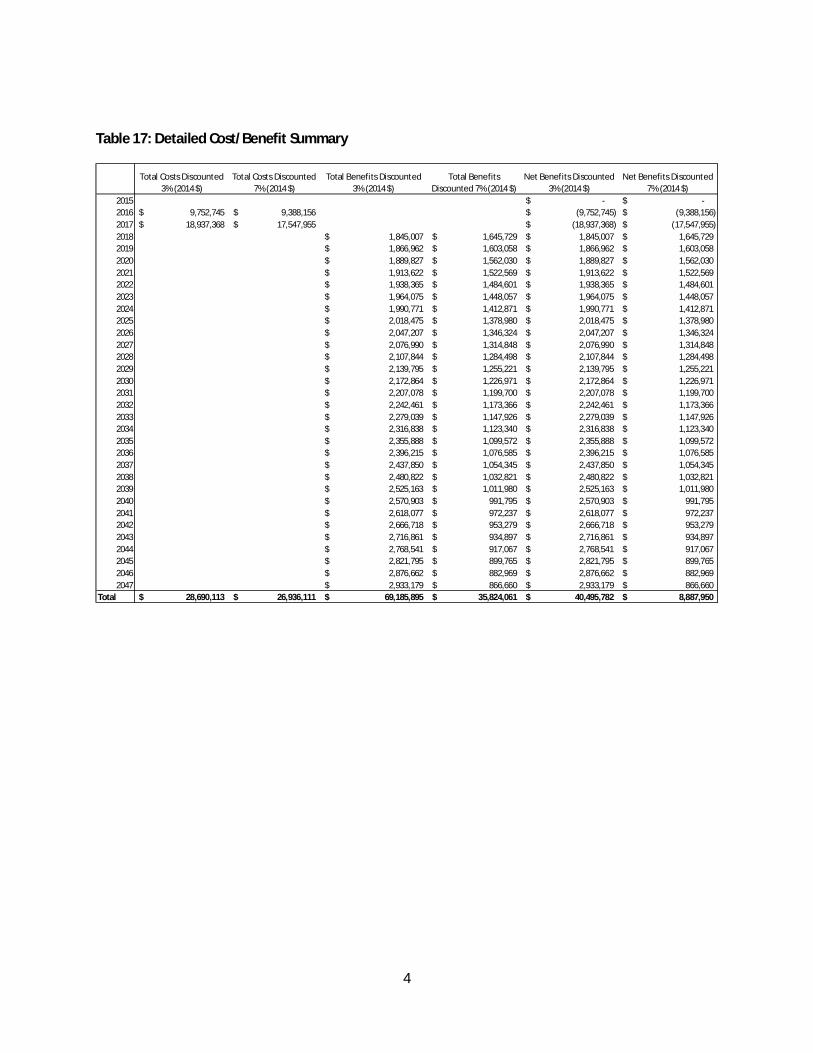
4
Table 17: Detailed Cost/Benefit Summary
Total Costs Discounted3% (2014 $)
Total Costs Discounted7% (2014 $)
Total Benefits Discounted3% (2014 $)
Total BenefitsDiscounted 7% (2014 $)
Net Benefits Discounted3% (2014 $)
Net Benefits Discounted7% (2014 $)
2015 -$ -$2016 9,752,745$ 9,388,156$ (9,752,745)$ (9,388,156)$2017 18,937,368$ 17,547,955$ (18,937,368)$ (17,547,955)$2018 1,845,007$ 1,645,729$ 1,845,007$ 1,645,729$2019 1,866,962$ 1,603,058$ 1,866,962$ 1,603,058$2020 1,889,827$ 1,562,030$ 1,889,827$ 1,562,030$2021 1,913,622$ 1,522,569$ 1,913,622$ 1,522,569$2022 1,938,365$ 1,484,601$ 1,938,365$ 1,484,601$2023 1,964,075$ 1,448,057$ 1,964,075$ 1,448,057$2024 1,990,771$ 1,412,871$ 1,990,771$ 1,412,871$2025 2,018,475$ 1,378,980$ 2,018,475$ 1,378,980$2026 2,047,207$ 1,346,324$ 2,047,207$ 1,346,324$2027 2,076,990$ 1,314,848$ 2,076,990$ 1,314,848$2028 2,107,844$ 1,284,498$ 2,107,844$ 1,284,498$2029 2,139,795$ 1,255,221$ 2,139,795$ 1,255,221$2030 2,172,864$ 1,226,971$ 2,172,864$ 1,226,971$2031 2,207,078$ 1,199,700$ 2,207,078$ 1,199,700$2032 2,242,461$ 1,173,366$ 2,242,461$ 1,173,366$2033 2,279,039$ 1,147,926$ 2,279,039$ 1,147,926$2034 2,316,838$ 1,123,340$ 2,316,838$ 1,123,340$2035 2,355,888$ 1,099,572$ 2,355,888$ 1,099,572$2036 2,396,215$ 1,076,585$ 2,396,215$ 1,076,585$2037 2,437,850$ 1,054,345$ 2,437,850$ 1,054,345$2038 2,480,822$ 1,032,821$ 2,480,822$ 1,032,821$2039 2,525,163$ 1,011,980$ 2,525,163$ 1,011,980$2040 2,570,903$ 991,795$ 2,570,903$ 991,795$2041 2,618,077$ 972,237$ 2,618,077$ 972,237$2042 2,666,718$ 953,279$ 2,666,718$ 953,279$2043 2,716,861$ 934,897$ 2,716,861$ 934,897$2044 2,768,541$ 917,067$ 2,768,541$ 917,067$2045 2,821,795$ 899,765$ 2,821,795$ 899,765$2046 2,876,662$ 882,969$ 2,876,662$ 882,969$2047 2,933,179$ 866,660$ 2,933,179$ 866,660$
Total 28,690,113$ 26,936,111$ 69,185,895$ 35,824,061$ 40,495,782$ 8,887,950$

June 5, 2015 Honorable Anthony Foxx Secretary of Transportation US Department of Transportation 1200 New Jersey, SE Washington, DC 20590 Dear Secretary Foxx, We are writing to express our support for the San Francisco Bay Area Rapid Transit (BART) District’s TIGER application for its Gateway to Oakland Uptown (Go Uptown) Station modernization and complete streets project. TransForm is a nonprofit organization that promotes walkable communities with excellent transportation choices that offers housing to people of all incomes and addresses the climate crisis. With diverse partners, we engage communities in planning, run innovative programs and win transportation and land use policy change at the local, regional and state levels. Funding provided through the TIGER program for the GO Uptown project will greatly improve pedestrian, bicycle, and AC Transit bus connectivity to BART’s 19th Street/Oakland station and better integrate the station into the adjacent Uptown neighborhood. Improvements will focus on the interface of the station with the community above, including a planned Bus Rapid Transit (BRT) station, a new street-to-concourse elevator, new faregates to connect with the redevelopment of the Sears building - a critical project that will anchor the city’s economic and job growth in the area when it opens in 2017 - and implementation of the City of Oakland’s 20th Street Complete Streets plan to maximize pedestrian and bicycle access to jobs along the corridor. Ultimately, GO Uptown will support the integrated transportation-and-land use vision for the Bay Area designed to manage congestion, reduce greenhouse gas (GHG) emissions, facilitate denser land use in the urban core of the Bay Area while preserving open space, and ensure the long-term financial viability of the regional transit network. BART has partnered with other regional public agencies, nonprofits and foundations to develop innovative tools that will help implement Plan Bay Area (the region’s first Sustainable Communities Strategy). Together, this group is working closely with five cities with BART Stations across the bay area, including Oakland, to address barriers to sustainable and equitable development. TransForm is proud to support BART’s and the City’s efforts to implement the GO Uptown vision, and ask for your strong consideration of this exciting investment. Sincerely,
Geoffrey Johnson Community Planner
MAIN OFFICE: 436 14TH STREET, SUITE 600, OAKLAND, CA 94612 | T: 510.740.3150 SACRAMENTO: 717 K STREET, SUITE 330, SACRAMENTO, CA 95814 | T: 916.706.2035
SILICON VALLEY: 48 SOUTH 7TH STREET, SUITE 103, SAN JOSE, CA 95112 | T: 408.406.8074
WWW.TRANSFORMCA.ORG