Embed Size (px)
Citation preview
FEDERAL CONTAMINATED SITES ACTION PLAN (FCSAP)ANNUAL REPORT 2015-2016
Federal Contaminated Sites Action Plan: Annual Report 2015–2016
Issued also in French under title:Plan d’action pour les sites contaminés fédéraux : Rapport annuel 2015-2016
Her Majesty is not responsible for the accuracy or completeness of the information contained in the reproduced material. Her Majesty shall at all times be indemnified and held harmless against any and all claims whatsoever arising out of negligence or other fault in the use of the information contained in this publication or product.
ISSN: 1929-2333Cat. No.: En1-43F-PDF
Unless otherwise specified, you may not reproduce materials in this publication, in whole or in part, for the purposes of commercial redistribution without prior written permission from Environment and Climate Change Canada’s copyright administrator. To obtain permission to reproduce Government of Canada materials for commercial purposes, apply for Crown Copyright Clearance by contacting:
Environment and Climate Change CanadaPublic Inquiries Centre7th floor, Fontaine Building200 Sacré-Coeur BoulevardGatineau QC K1A 0H3Telephone: 819-997-2800Toll free: 1-800-668-6767 (in Canada only)Email: [email protected]
Photos: Cover: Forillon National Park, Quebec © Gettyimages.comPage ii: Wheatfield in Oshawa, Ontario © Gettyimages.comPage 6 and 7: © Parks Canada AgencyPage 10: © Indigenous and Northern Affairs CanadaPage 12: © Department of National DefencePage 18: © Transport CanadaPage 21 and 22: © Indigenous and Northern Affairs CanadaBackcover: © Environment and Climate Change Canada
© Her Majesty the Queen in Right of Canada, represented by the Minister of Environment and Climate Change, 2017
Aussi disponible en français
i
EXECUTIVE SUMMARYEstablished by the Government of Canada in 2005, the Federal Contaminated Sites Action Plan (FCSAP) is a 15-year, $4.33-billion program. Its primary objective is to reduce environmental and human health risks and related financial liabilities from federal contaminated sites.
In Phase I of FCSAP (2005–2011), federal departments, agencies and consolidated Crown corporations (also referred to as custodians) made significant progress in addressing contaminated sites. FCSAP Phase II (2011–2016) was approved in the 2011–2012 fiscal year to continue this work for five years, with a focus on the remediation of the highest-priority sites. A third phase has been approved for 2016–2020. This report describes the progress made in 2015–2016, the last year of Phase II.
Nationally, federal custodians involved in FCSAP reported total expenditures of $278.5 million, including the custodian cost share in 2015–2016. This includes $7.3 million (3%) spent on assessments, $252.4 million (90%) spent on remediation and risk management and $18.8 million (7%) for program management activities related to federal contaminated sites. In 2015–2016, the program achieved the following results:
• Custodians conducted assessments at 200 sites to characterize environmental conditions; of the 126 sites that were fully assessed, 58 sites (46%) require remediation or risk management, while 68 sites (54%) require no further action, as they pose no significant risk. The remaining 74 sites require further assessment.
• Custodians conducted remediation and risk management activities at 374 sites, resulting in the reduction of risks to the environment and human health and reduction of federal financial liability; at 37 of these sites, the remediation process was completed. The remaining 337 sites require further work.
• Approximately 1,350 jobs (person-years) were created or maintained, which is the equivalent of an estimated 5.2 direct jobs resulting from every million dollars spent on FCSAP projects.
Every year, the results of the FCSAP program are reflected in the Federal Contaminated Sites Inventory (FCSI), which is maintained by the Treasury Board of Canada Secretariat. At the end of 2015–2016, there were 23,070 sites listed in the FCSI. When the inventory from 2015–2016 was compared to the inventory from the previous year, the following progress was found: a 10% decrease in the number of suspected sites, an 8% decrease in the number of active sites undergoing assessment or remediation and a 7% increase in the number of closed sites, where no further action is required.
The FCSI includes federal contaminated sites that are not funded by the FCSAP program. In 2015–2016, approximately 85% of expenditures reported to the FCSI were attributable to FCSAP, therefore much of the progress was a result of FCSAP funding, which allowed custodians to conduct assessment and remediation work at their sites.
Contamination of federal sites may translate into liability for the Government of Canada, when certain accounting criteria are met. In 2015–2016, the total liability for the remediation of all federal contaminated sites increased by $463 million from $5.810 billion to $6.273 billion. Adjusted liability, an estimate of the liability for sites that may be eligible for FCSAP funding, increased by $914 million from $4.241 billion to $5.155 billion. Increases in liability can be attributed to adjustments for inflation, the recording of new liabilities for unassessed sites and revised cost estimates for the remediation of federal contaminated sites. Adjusted liability is expected to decline eventually, as fewer new sites are added to the federal inventory and more existing sites are remediated and closed.
For questions or comments on this report, contact:
FCSAP SecretariatContaminated Sites DivisionEnvironmental Protection Operations DirectorateEnvironment and Climate Change Canada351 St. Joseph Boulevard, 17th FloorGatineau QC K1A 0H3Email: [email protected]

iii
APPENDIX
APPENDIx A. PROGRAM ADMINISTRATION ..................................................................... 26
APPENDIx B. FEDERAL APPROACH TO MANAGING CONTAMINATED SITES ................................. 30
APPENDIx C. DATA TABLES ...................................................................................... 33
APPENDIx D. ENVIRONMENTAL LIABILITY FOR FEDERAL CONTAMINATED SITES .......................... 54
TABLE OF CONTENTS
1. INTRODUCTION ............................................................................................... 1
2. PROGRAM RESULTS (2015–2016) ............................................................................ 2
2.1 ASSESSMENT ......................................................................................... 3
2.2 REDUCTION OF RISKS TO HUMAN HEALTH AND THE ENVIRONMENT ......................... 8
2.3 LIABILITY REDUCTION ............................................................................13
2.4 FCSAP SECONDARY BENEFITS .....................................................................15
2.5 IMPACT OF FCSAP ON THE FEDERAL CONTAMINATED SITES INVENTORY ....................15
3. SUMMARY OF FCSAP PHASE II RESULTS ....................................................................20
4. FCSAP APPROVALS AND ExPENDITURES ...................................................................23
4.1 TYPES OF FUNDING ................................................................................23
4.2 FUNDING APPROVALS ..............................................................................23
4.3 FUNDING ALLOCATIONS, ExPENDITURES AND VARIANCES ....................................23
iv
ABBREVIATIONS AND ACRONYMS AAFC Agriculture and Agri-Food Canada
CBSA Canada Border Services Agency
CCME Canadian Council of Ministers of the Environment
CSC Correctional Service of Canada
DFO Fisheries and Oceans Canada
DND Department of National Defence
ECCC Environment and Climate Change Canada
FCSAP Federal Contaminated Sites Action Plan
FCSI Federal Contaminated Sites Inventory
INAC Indigenous and Northern Affairs Canada
JCCBI Jacques Cartier and Champlain Bridges Incorporated
LED Lands and Economic Development
NAO Northern Affairs Organization
NCC National Capital Commission
PCA Parks Canada Agency
PSPC Public Services and Procurement Canada
TBS Treasury Board of Canada Secretariat
TC Transport Canada
1
1 INTRODUCTION
The Federal Contaminated Sites Action Plan (FCSAP) is a $4.33-billion, 15-year program introduced by the Government of Canada in 2005. Its goal is to reduce environmental and human-health risks posed by the highest-priority legacy federal contaminated sites, along with the associated federal financial liabilities. Federal departments, agencies and consolidated Crown corporations are referred to as custodians of the FCSAP program, and share costs with FCSAP.
Federal contaminated sites are located on land or in aquatic areas owned or leased by the federal government, or where the federal government has accepted responsibility for the contamination. FCSAP projects on federal properties can include harbours and ports, military bases, airports, lighthouses, school facilities and fuel-storage tanks on reserve land, and abandoned mines. Contamination at these sites is typically the result of historical activities that took place without an understanding of the environmental consequences.
The FCSAP program provides a consistent approach to dealing with contaminated sites. Since the start of the program in 2005 to April 2016, $2.96 billion, including the custodian cost-share, has been spent on the management of federal contaminated sites.
Environment and Climate Change Canada provides program administration through the FCSAP Secretariat, with support from the Treasury Board of Canada Secretariat. Environment and Climate Change Canada, Fisheries and Oceans Canada, Health Canada and Public Services and Procurement Canada provide expert advice and technical assistance to custodians in support of the program. For more information about the administration of FCSAP, see Appendix A.
FCSAP ObjectiveReduce human-health and environmental risks and associated federal financial liabilities at the highest-priority federal contaminated sites.
Types of FundingFCSAP provides funding for the assessment and remediation of contaminated sites that are under the responsibility of federal departments, agencies or consolidated Crown corporations and have been contaminated by historical activities, defined as occurring before April 1, 1998.
FCSAP funds the remediation of two classes of terrestrial1 and aquatic2 sites:
• Class 1 - sites where there is a high priority for action or where action is required.
• Class 2 - sites where there is a medium priority for action or where action is likely required. To be eligible for funding in FCSAP Phase II, Class 2 sites must have reported FCSAP remediation expenditures before April 1, 2011.
FCSAP is a cost-shared program that funds 85% of total remediation costs for projects under $90 million, with custodians funding the balance. Remediation projects with total cost estimates of more than $90 million may be funded entirely by FCSAP. The program also funds 80% of total site-assessment costs, with custodians funding the balance.
Contaminated SiteAccording to the Treasury Board of Canada’s Policy on Management of Real Property, a contaminated site is “a site at which substances occur at concentrations that: (1) are above background levels and pose, or are likely to pose, an immediate or long-term hazard to human health or the environment, or (2) exceed the levels specified in policies and regulations.”
1. Terrestrial sites are classified in accordance with the Canadian Council of Ministers of the Environment National Classification System for Contaminated Sites (2008): www.ccme.ca/en/resources/contaminated_site_management/management.html2. Aquatic sites are classified in accordance with the FCSAP Aquatic Sites Classification System (2012)
2
The program also provides socio-economic benefits by supporting brownfield redevelopment, promoting innovative and sustainable remediation technologies and creating or maintaining jobs and training opportunities in the Canadian environmental remediation industry. These jobs and training opportunities extend to Indigenous peoples and those living in rural areas.
This report presents program results and achievements from the 2015–2016 fiscal year, which was the last year of Phase II.
More information on FCSAP is available online at www.federalcontaminatedsites.gc.ca
2 PROGRAM RESULTS (2015–2016)
This section describes the achievements of the 13 custodians that conducted assessment and remediation activities in the 2015–2016 fiscal year. It also compares program progress against performance measurement targets established for Phase II of the Federal Contaminated Sites Action Plan (FCSAP). Case studies of assessment and remediation activities undertaken during 2015–2016 at several FCSAP-funded sites are included throughout this report.
The FCSAP Secretariat worked with the Treasury Board of Canada Secretariat and custodians to establish performance indicators and three- and five-year targets to assess the performance against the FCSAP program’s objectives. The Federal Contaminated Sites Director General Steering Committee then approved these indicators and targets.
The indicators and targets, identified in the FCSAP performance measurement strategy, fall into three key program areas:
1. assessment,2. risk reduction and3. liability reduction.
Overview of Program Results for the 2015–2016 Fiscal year• Assessment activities on 200 sites cost $7.3 million,
including the custodians’ share of the costs. Of the 126 sites that were fully assessed, 58 sites (46%) require remediation or risk management, while 68 sites (54%) require no further action. The remaining 74 sites require further assessment.
• Remediation and risk-management activities on 374 sites cost $252.4 million, including the custodians’ share of the costs. Custodians completed remediation activities on 37 of these sites and the remaining 337 sites require further work.
• Adjusted liability, an estimate of liability for contaminated sites that may be eligible for FCSAP funding, increased by $914 million during 2015–2016, mainly due to revised cost estimates for the remediation of large contaminated sites in Canada’s north and adjustments to inflation.
3
2.1 ASSESSMENT
Custodians may suspect a site of being contaminated as a result of past activities – for example, in places where fuel-storage tanks may have leaked. In such cases, custodians can undertake or contract environmental site assessments to determine the nature and extent of contamination, and whether remediation and/or risk management activities are required at the site. In 2015–2016, FCSAP funded assessment activities on 200 sites, at a program cost of $5.2 million; an additional $2.1 million was spent as part of the custodian cost-share requirement.
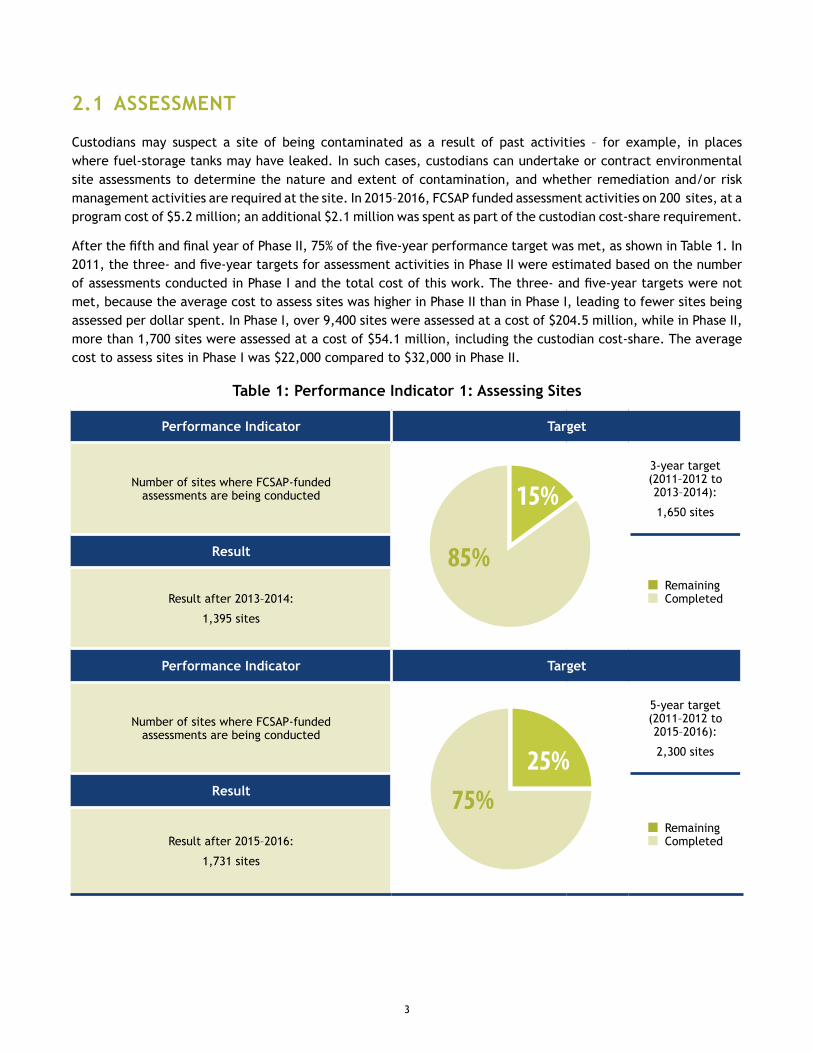
After the fifth and final year of Phase II, 75% of the five-year performance target was met, as shown in Table 1. In 2011, the three- and five-year targets for assessment activities in Phase II were estimated based on the number of assessments conducted in Phase I and the total cost of this work. The three- and five-year targets were not met, because the average cost to assess sites was higher in Phase II than in Phase I, leading to fewer sites being assessed per dollar spent. In Phase I, over 9,400 sites were assessed at a cost of $204.5 million, while in Phase II, more than 1,700 sites were assessed at a cost of $54.1 million, including the custodian cost-share. The average cost to assess sites in Phase I was $22,000 compared to $32,000 in Phase II.
Table 1: Performance Indicator 1: Assessing Sites
Performance Indicator Target
Number of sites where FCSAP-funded assessments are being conducted
85%
15%3-year target (2011–2012 to 2013–2014):
1,650 sites
Result
Remaining Completed Result after 2013–2014:
1,395 sites
Performance Indicator Target
Number of sites where FCSAP-funded assessments are being conducted
75%25%
5-year target (2011–2012 to 2015–2016):
2,300 sites
Result
Remaining Completed Result after 2015–2016:
1,731 sites
4
An environmental site assessment may involve collecting and analyzing samples for levels of contamination. The levels are compared to environmental quality guidelines published by the Canadian Council of Ministers of the Environment (CCME) on the management of contaminants in soils, sediments, freshwater and marine water.1 Federal contaminated sites are classified and prioritized in accordance with the CCME National Classification System for Contaminated Sites and the Aquatic Sites Classification System developed by FCSAP. To ensure that custodians take a common approach to managing federal contaminated sites, FCSAP follows a 10-step process from identification of suspected sites (step 1) to confirmatory sampling (step 9), following any remediation or risk management that was required, and long-term monitoring (step 10). This process is detailed in Appendix B.
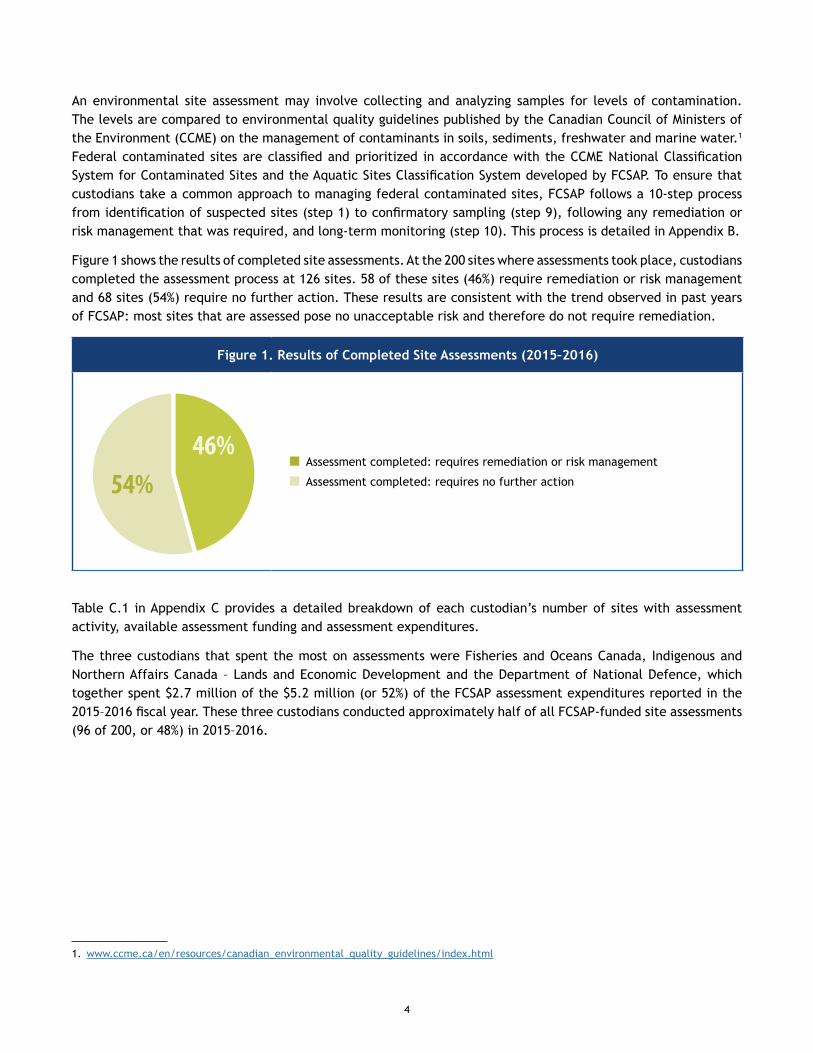
Figure 1 shows the results of completed site assessments. At the 200 sites where assessments took place, custodians completed the assessment process at 126 sites. 58 of these sites (46%) require remediation or risk management and 68 sites (54%) require no further action. These results are consistent with the trend observed in past years of FCSAP: most sites that are assessed pose no unacceptable risk and therefore do not require remediation.
Figure 1. Results of Completed Site Assessments (2015–2016)
54%46%
Assessment completed: requires remediation or risk management
Assessment completed: requires no further action
Table C.1 in Appendix C provides a detailed breakdown of each custodian’s number of sites with assessment activity, available assessment funding and assessment expenditures.
The three custodians that spent the most on assessments were Fisheries and Oceans Canada, Indigenous and Northern Affairs Canada – Lands and Economic Development and the Department of National Defence, which together spent $2.7 million of the $5.2 million (or 52%) of the FCSAP assessment expenditures reported in the 2015–2016 fiscal year. These three custodians conducted approximately half of all FCSAP-funded site assessments (96 of 200, or 48%) in 2015–2016.
1. www.ccme.ca/en/resources/canadian_environmental_quality_guidelines/index.html
5
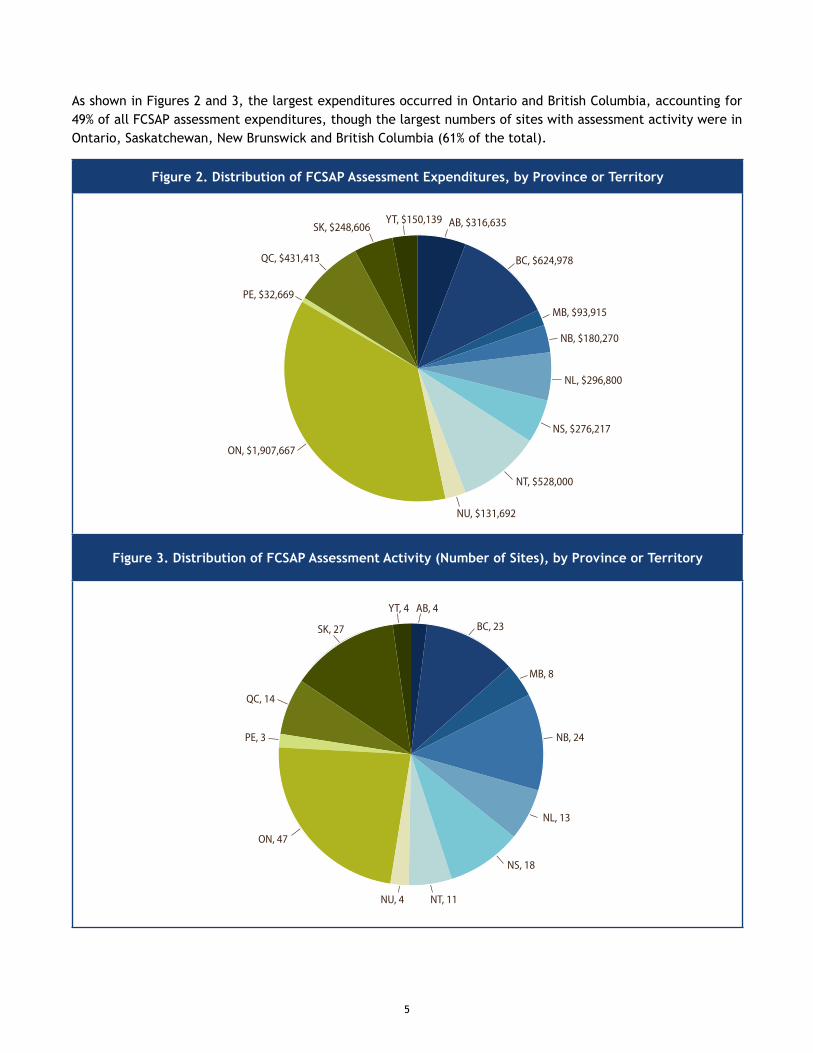
As shown in Figures 2 and 3, the largest expenditures occurred in Ontario and British Columbia, accounting for 49% of all FCSAP assessment expenditures, though the largest numbers of sites with assessment activity were in Ontario, Saskatchewan, New Brunswick and British Columbia (61% of the total).
Figure 2. Distribution of FCSAP Assessment Expenditures, by Province or Territory
BC, $624,978
MB, $93,915
NB, $180,270
NL, $296,800
NS, $276,217
NT, $528,000
NU, $131,692
ON, $1,907,667
PE, $32,669
QC, $431,413
SK, $248,606YT, $150,139 AB, $316,635
Figure 3. Distribution of FCSAP Assessment Activity (Number of Sites), by Province or Territory
BC, 23
MB, 8
NB, 24
NL, 13
NS, 18
NT, 11NU, 4
ON, 47
PE, 3
QC, 14
SK, 27
YT, 4 AB, 4
6
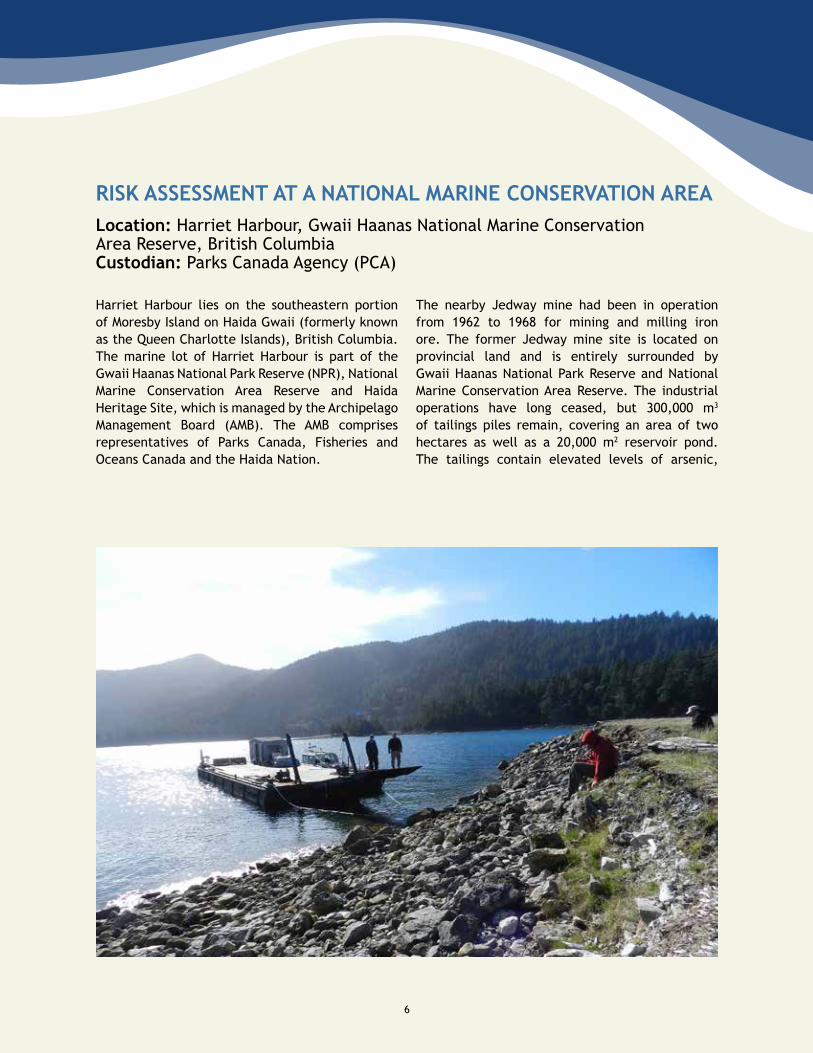
RISK ASSESSMENT AT A NATIONAL MARINE CONSERVATION AREALocation: Harriet Harbour, Gwaii Haanas National Marine Conservation Area Reserve, British Columbia Custodian: Parks Canada Agency (PCA)
Harriet Harbour lies on the southeastern portion of Moresby Island on Haida Gwaii (formerly known as the Queen Charlotte Islands), British Columbia. The marine lot of Harriet Harbour is part of the Gwaii Haanas National Park Reserve (NPR), National Marine Conservation Area Reserve and Haida Heritage Site, which is managed by the Archipelago Management Board (AMB). The AMB comprises representatives of Parks Canada, Fisheries and Oceans Canada and the Haida Nation.
The nearby Jedway mine had been in operation from 1962 to 1968 for mining and milling iron ore. The former Jedway mine site is located on provincial land and is entirely surrounded by Gwaii Haanas National Park Reserve and National Marine Conservation Area Reserve. The industrial operations have long ceased, but 300,000 m3 of tailings piles remain, covering an area of two hectares as well as a 20,000 m2 reservoir pond. The tailings contain elevated levels of arsenic,
7
copper, nickel and zinc, which could enter Harriet Harbour’s waters through erosion and streams. PCA owns the marine lot and is assessing the risks of contaminated sediment from the tailings and reservoir. Moreover, the area of the National Park Reserve lies in an active seismic zone: an earthquake or a tsunami could cause a catastrophic failure in either the tailings piles or reservoir pond.
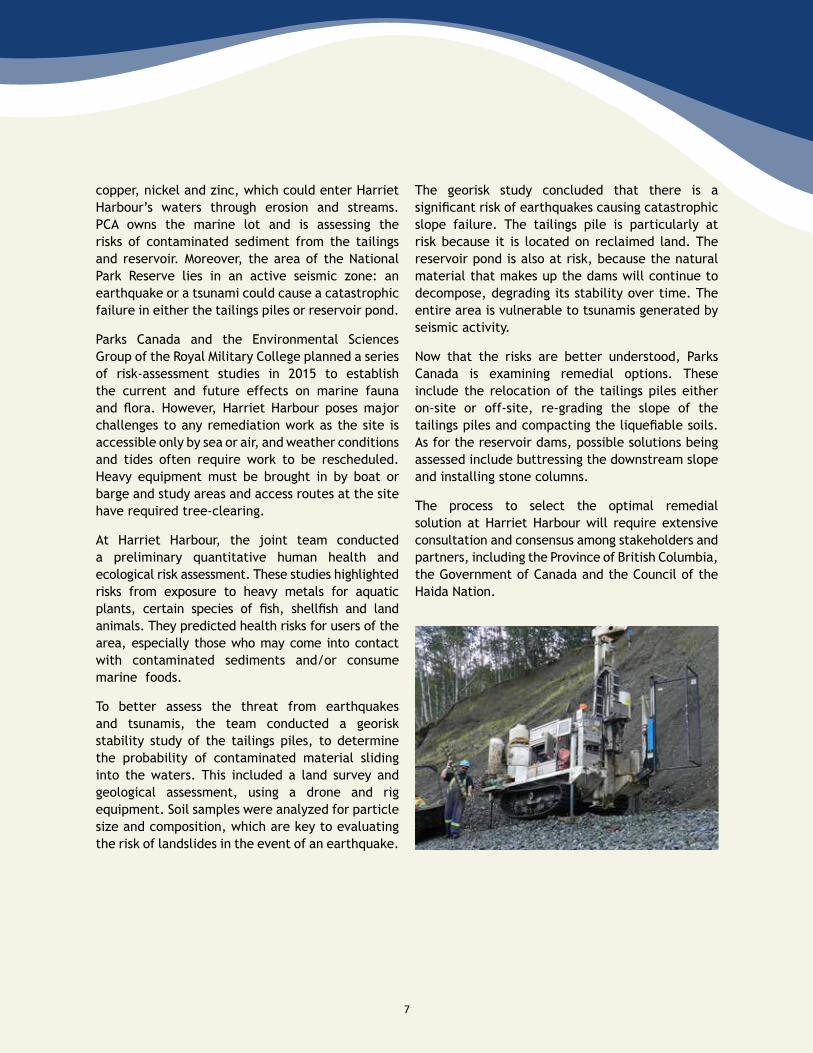
Parks Canada and the Environmental Sciences Group of the Royal Military College planned a series of risk-assessment studies in 2015 to establish the current and future effects on marine fauna and flora. However, Harriet Harbour poses major challenges to any remediation work as the site is accessible only by sea or air, and weather conditions and tides often require work to be rescheduled. Heavy equipment must be brought in by boat or barge and study areas and access routes at the site have required tree-clearing.
At Harriet Harbour, the joint team conducted a preliminary quantitative human health and ecological risk assessment. These studies highlighted risks from exposure to heavy metals for aquatic plants, certain species of fish, shellfish and land animals. They predicted health risks for users of the area, especially those who may come into contact with contaminated sediments and/or consume marine foods.
To better assess the threat from earthquakes and tsunamis, the team conducted a georisk stability study of the tailings piles, to determine the probability of contaminated material sliding into the waters. This included a land survey and geological assessment, using a drone and rig equipment. Soil samples were analyzed for particle size and composition, which are key to evaluating the risk of landslides in the event of an earthquake.
The georisk study concluded that there is a significant risk of earthquakes causing catastrophic slope failure. The tailings pile is particularly at risk because it is located on reclaimed land. The reservoir pond is also at risk, because the natural material that makes up the dams will continue to decompose, degrading its stability over time. The entire area is vulnerable to tsunamis generated by seismic activity.
Now that the risks are better understood, Parks Canada is examining remedial options. These include the relocation of the tailings piles either on-site or off-site, re-grading the slope of the tailings piles and compacting the liquefiable soils. As for the reservoir dams, possible solutions being assessed include buttressing the downstream slope and installing stone columns.
The process to select the optimal remedial solution at Harriet Harbour will require extensive consultation and consensus among stakeholders and partners, including the Province of British Columbia, the Government of Canada and the Council of the Haida Nation.
8
2.2 REDUCTION OF RISKS TO HUMAN HEALTH AND THE ENVIRONMENT
If the completed site-assessment activities have determined that the risks to human health or the environment are unacceptable, in terms of established guidelines for contaminant limits, custodians may conduct remediation and risk management activities. These activities can include the removal, treatment, reduction or containment of contaminants to prevent exposure that could affect human health and the environment. The methods used to address the contamination at each site depend on their efficacy and cost-effectiveness, and on the unique circumstances of the site.
In 2015–2016, FCSAP funded remediation activities at 374 sites, at a cost of $228.4 million. An additional $24.0 million was spent as part of the custodian cost-share requirement.Table C.2 in Appendix C provides a breakdown of each custodian’s share of the costs.
As with the assessment performance target, the remediation performance target for Phase II was based on the number of remediation sites worked on in Phase I and the total cost of this work. After the last year of Phase II, 43% of the five-year performance target was met, as shown in Table 2. The five-year target was not met because custodians focused on fewer but more complex and costly high-priority remediation sites in Phase II than in Phase I. The number of sites with remediation activities being conducted by custodians is limited by the amount of funding that can be spent. Custodians were not able to spend all of the FCSAP funding available to them in 2015–2016, due to reasons such as unpredictable weather conditions and contracting delays.
In Phase I, remediation activities were conducted at 1,400 sites at a cost of $1.248 billion, while in Phase II, remediation activities were conducted at 640 sites at a cost of $1.216 billion, including the custodian cost-share.
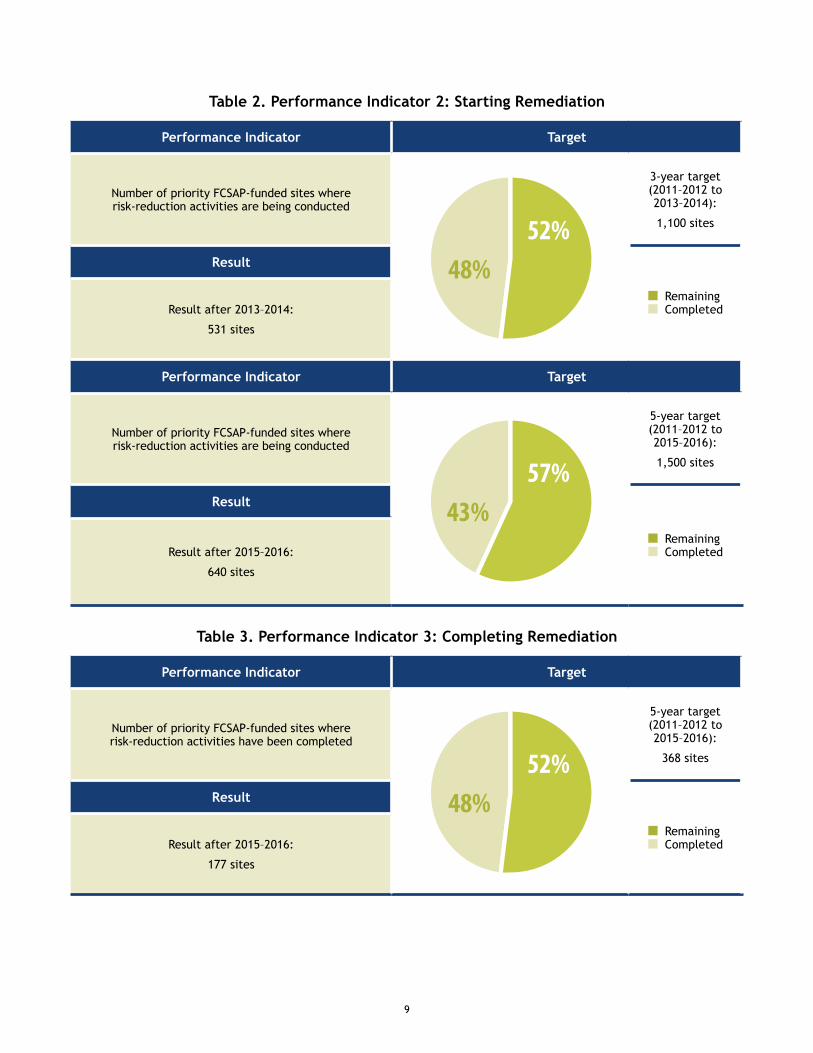
In 2015–2016, remediation was conducted at 374 sites (step 8 of the 10-step Federal Approach to Contaminated Sites, detailed in Appendix B). At 37 sites, remediation was completed and risks to human health and the environment were reduced to safe levels. While the number of sites undergoing remediation varies from year to year, the 2015–2016 result shows that the five-year target of completing risk-reduction activities at 368 sites was not met, as shown in Table 3. The main reason is that implementation of the remediation or risk-management plans took longer than custodians had anticipated when the target was established in 2011–2012. This is not uncommon in contaminated-site projects, because additional contamination can be discovered once the project begins. Weather or unanticipated technical issues also caused delays, especially at remote northern sites. The FCSAP Secretariat has increased performance monitoring and reporting requirements to the Federal Contaminated Sites Director General Steering Committee to assist custodians in meeting the program targets.
9
Table 2. Performance Indicator 2: Starting Remediation
Performance Indicator Target
Number of priority FCSAP-funded sites where risk-reduction activities are being conducted
48%52%
3-year target(2011–2012 to 2013–2014):
1,100 sites
Result
Remaining Completed Result after 2013–2014:
531 sites
Performance Indicator Target
Number of priority FCSAP-funded sites where risk-reduction activities are being conducted
43%57%
5-year target (2011–2012 to 2015–2016):
1,500 sites
Result
Remaining Completed Result after 2015–2016:
640 sites
Table 3. Performance Indicator 3: Completing Remediation
Performance Indicator Target
Number of priority FCSAP-funded sites where risk-reduction activities have been completed
48%52%
5-year target (2011–2012 to 2015–2016):
368 sites
Result
Remaining Completed Result after 2015–2016:
177 sites
10
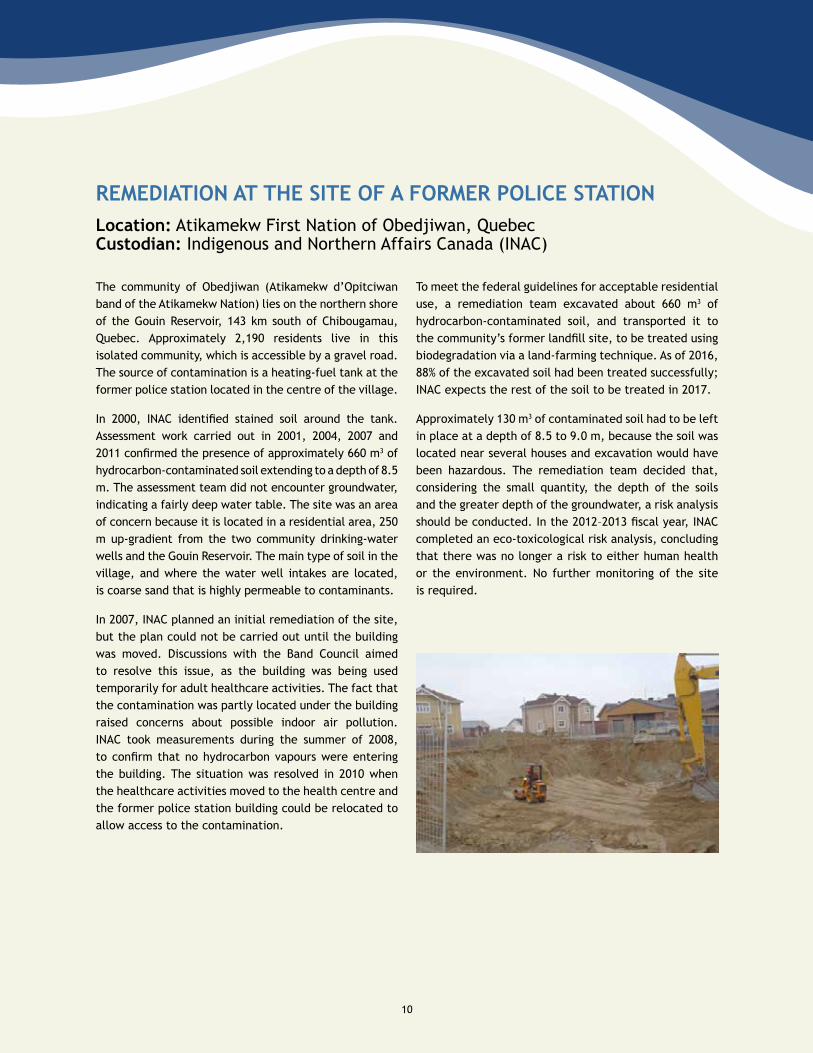
REMEDIATION AT THE SITE OF A FORMER POLICE STATION Location: Atikamekw First Nation of Obedjiwan, Quebec Custodian: Indigenous and Northern Affairs Canada (INAC)
The community of Obedjiwan (Atikamekw d’Opitciwan band of the Atikamekw Nation) lies on the northern shore of the Gouin Reservoir, 143 km south of Chibougamau, Quebec. Approximately 2,190 residents live in this isolated community, which is accessible by a gravel road. The source of contamination is a heating-fuel tank at the former police station located in the centre of the village.
In 2000, INAC identified stained soil around the tank. Assessment work carried out in 2001, 2004, 2007 and 2011 confirmed the presence of approximately 660 m3 of hydrocarbon-contaminated soil extending to a depth of 8.5 m. The assessment team did not encounter groundwater, indicating a fairly deep water table. The site was an area of concern because it is located in a residential area, 250 m up-gradient from the two community drinking-water wells and the Gouin Reservoir. The main type of soil in the village, and where the water well intakes are located, is coarse sand that is highly permeable to contaminants.
In 2007, INAC planned an initial remediation of the site, but the plan could not be carried out until the building was moved. Discussions with the Band Council aimed to resolve this issue, as the building was being used temporarily for adult healthcare activities. The fact that the contamination was partly located under the building raised concerns about possible indoor air pollution. INAC took measurements during the summer of 2008, to confirm that no hydrocarbon vapours were entering the building. The situation was resolved in 2010 when the healthcare activities moved to the health centre and the former police station building could be relocated to allow access to the contamination.
To meet the federal guidelines for acceptable residential use, a remediation team excavated about 660 m3 of hydrocarbon-contaminated soil, and transported it to the community’s former landfill site, to be treated using biodegradation via a land-farming technique. As of 2016, 88% of the excavated soil had been treated successfully; INAC expects the rest of the soil to be treated in 2017.
Approximately 130 m3 of contaminated soil had to be left in place at a depth of 8.5 to 9.0 m, because the soil was located near several houses and excavation would have been hazardous. The remediation team decided that, considering the small quantity, the depth of the soils and the greater depth of the groundwater, a risk analysis should be conducted. In the 2012–2013 fiscal year, INAC completed an eco-toxicological risk analysis, concluding that there was no longer a risk to either human health or the environment. No further monitoring of the site is required.
11
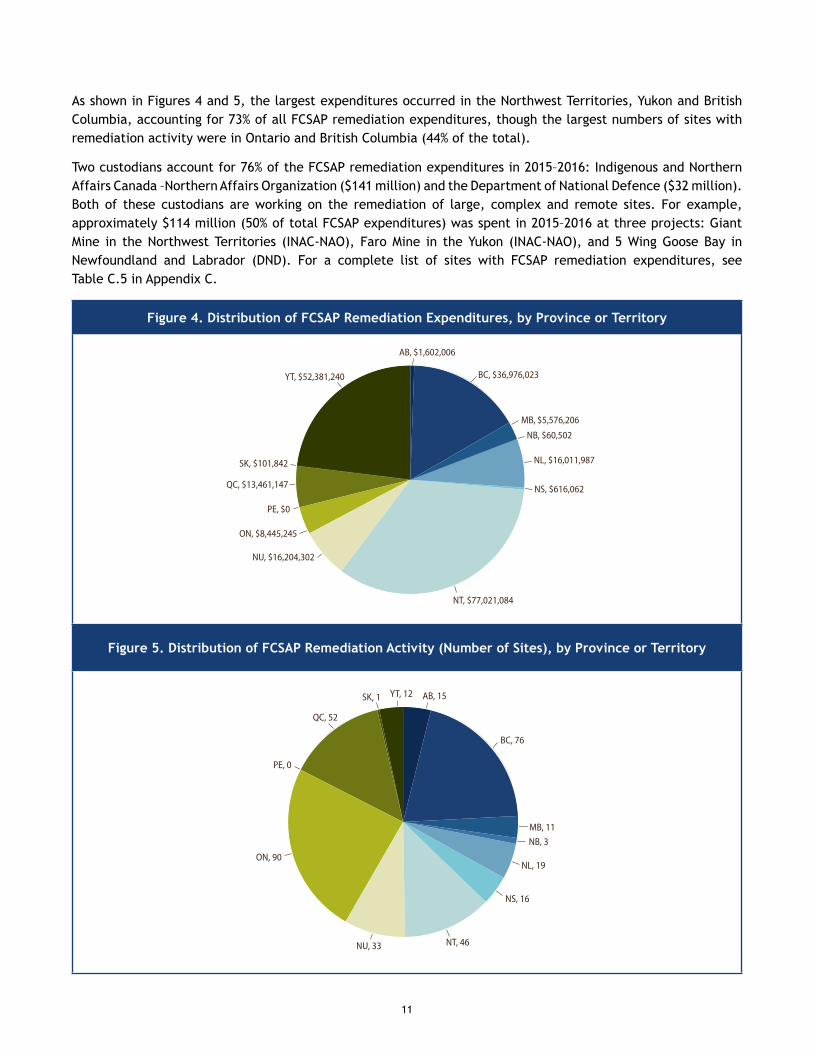
As shown in Figures 4 and 5, the largest expenditures occurred in the Northwest Territories, Yukon and British Columbia, accounting for 73% of all FCSAP remediation expenditures, though the largest numbers of sites with remediation activity were in Ontario and British Columbia (44% of the total).
Two custodians account for 76% of the FCSAP remediation expenditures in 2015–2016: Indigenous and Northern Affairs Canada –Northern Affairs Organization ($141 million) and the Department of National Defence ($32 million). Both of these custodians are working on the remediation of large, complex and remote sites. For example, approximately $114 million (50% of total FCSAP expenditures) was spent in 2015–2016 at three projects: Giant Mine in the Northwest Territories (INAC-NAO), Faro Mine in the Yukon (INAC-NAO), and 5 Wing Goose Bay in Newfoundland and Labrador (DND). For a complete list of sites with FCSAP remediation expenditures, see Table C.5 in Appendix C.
Figure 4. Distribution of FCSAP Remediation Expenditures, by Province or Territory
BC, $36,976,023
MB, $5,576,206
NB, $60,502
NL, $16,011,987
NS, $616,062
NT, $77,021,084
NU, $16,204,302
ON, $8,445,245
PE, $0
QC, $13,461,147
SK, $101,842
YT, $52,381,240
AB, $1,602,006
Figure 5. Distribution of FCSAP Remediation Activity (Number of Sites), by Province or Territory
BC, 76
MB, 11NB, 3
NL, 19
NS, 16
NT, 46NU, 33
ON, 90
PE, 0
QC, 52
SK, 1 YT, 12 AB, 15
12
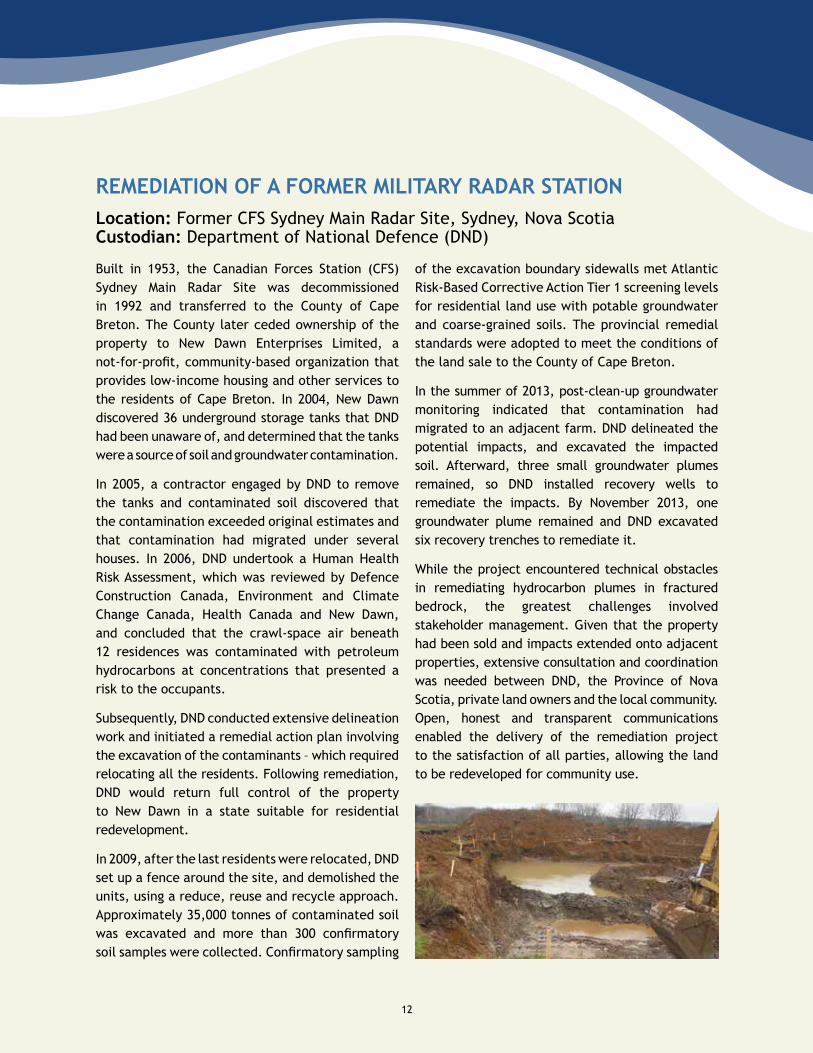
REMEDIATION OF A FORMER MILITARY RADAR STATIONLocation: Former CFS Sydney Main Radar Site, Sydney, Nova Scotia Custodian: Department of National Defence (DND)
Built in 1953, the Canadian Forces Station (CFS) Sydney Main Radar Site was decommissioned in 1992 and transferred to the County of Cape Breton. The County later ceded ownership of the property to New Dawn Enterprises Limited, a not-for-profit, community-based organization that provides low-income housing and other services to the residents of Cape Breton. In 2004, New Dawn discovered 36 underground storage tanks that DND had been unaware of, and determined that the tanks were a source of soil and groundwater contamination.
In 2005, a contractor engaged by DND to remove the tanks and contaminated soil discovered that the contamination exceeded original estimates and that contamination had migrated under several houses. In 2006, DND undertook a Human Health Risk Assessment, which was reviewed by Defence Construction Canada, Environment and Climate Change Canada, Health Canada and New Dawn, and concluded that the crawl-space air beneath 12 residences was contaminated with petroleum hydrocarbons at concentrations that presented a risk to the occupants.
Subsequently, DND conducted extensive delineation work and initiated a remedial action plan involving the excavation of the contaminants – which required relocating all the residents. Following remediation, DND would return full control of the property to New Dawn in a state suitable for residential redevelopment.
In 2009, after the last residents were relocated, DND set up a fence around the site, and demolished the units, using a reduce, reuse and recycle approach. Approximately 35,000 tonnes of contaminated soil was excavated and more than 300 confirmatory soil samples were collected. Confirmatory sampling
of the excavation boundary sidewalls met Atlantic Risk-Based Corrective Action Tier 1 screening levels for residential land use with potable groundwater and coarse-grained soils. The provincial remedial standards were adopted to meet the conditions of the land sale to the County of Cape Breton.
In the summer of 2013, post-clean-up groundwater monitoring indicated that contamination had migrated to an adjacent farm. DND delineated the potential impacts, and excavated the impacted soil. Afterward, three small groundwater plumes remained, so DND installed recovery wells to remediate the impacts. By November 2013, one groundwater plume remained and DND excavated six recovery trenches to remediate it.
While the project encountered technical obstacles in remediating hydrocarbon plumes in fractured bedrock, the greatest challenges involved stakeholder management. Given that the property had been sold and impacts extended onto adjacent properties, extensive consultation and coordination was needed between DND, the Province of Nova Scotia, private land owners and the local community. Open, honest and transparent communications enabled the delivery of the remediation project to the satisfaction of all parties, allowing the land to be redeveloped for community use.
13
2.3 LIABILITY REDUCTION
Environmental liabilities are the estimated remaining costs related to the remediation of contaminated sites where the Government of Canada is obligated, or will likely be obligated, to incur such costs. Liabilities are recorded annually in the Public Accounts of Canada.
Appendix D provides more information on the environmental liability of federal contaminated sites, along with a detailed breakdown by custodian.
FCSAP funds a portion of the sites that make up the total environmental liability reported in the Public Accounts of Canada. Custodians also conduct work at contaminated sites that are not eligible to receive FCSAP funding and they are required to report these expenditures and liabilities to the Public Accounts of Canada. Examples of sites that are not eligible for FCSAP funding include lower-risk sites and sites where the contamination occurred after April 1, 1998. Furthermore, some exceptional sites, such as the low-level radioactive waste sites of the Port Hope Area Initiative, have their own funding sources. To accurately estimate the impact of FCSAP on the Government of Canada’s total liability, Table D.1 in Appendix D provides a calculation of adjusted liability for contaminated sites that may be eligible for FCSAP funding.
From March 31, 2015 to March 31, 2016, the total liability for the remediation of contaminated sites, as reported in the Public Accounts of Canada, increased by $463 million from $5.810 billion for 2,400 sites to $6.273 billion for 2,400 sites. The adjusted liability increased by $914 million over the same period. For the first time in 2015–2016, an estimated liability of $320 million for unassessed sites was reported.
In 2015–2016, the custodian with the largest increase in adjusted liability was Indigenous and Northern Affairs Canada, which reported an increase in liability of $778 million. This increase was attributed to adjustments for inflation, the recording of new liabilities for unassessed sites on reserves, newly recorded liabilities for sites in the North and revised cost estimates for the remediation of large contaminated sites in the North. The Department of National Defence reported an increase in liability of $94 million, which includes the increased liability identified for Esquimalt Harbour, home of Canada’s west coast navy at Canadian Forces Base (CFB) Esquimalt. Among the 11 custodians that reported increases in liability, these two custodians accounted for 90% of the total increase in liability. Three custodians (Canada Border Services Agency, Correctional Service of Canada and Public Services and Procurement Canada) reported decreases in liability. This information is detailed in Table D.2 in Appendix D.
Changes to the liability for the remediation of contaminated sites can be attributed to several factors. While remediation expenditures at contaminated sites contribute to decreases in liability, increases to remediation costs may result from the completion of assessment activities at sites and the subsequent reporting of liabilities for the first time. Changes to the estimated remediation costs occur as more information becomes available at sites. Furthermore, variability in the Consumer Price Index (through inflation) and in lending rates (through calculation of net present value) can affect the liabilities, especially for large projects with high costs.
In 2015–2016, the Public Accounts of Canada included remediation expenditures that reduced liability by $299 million. These reductions were offset by $545 million in increases to liability resulting from changes in site-remediation costs and $217 million in new liability for sites not previously recorded. As detailed in Table D.3 in Appendix D, these were factors in the $463 million increase in liability.
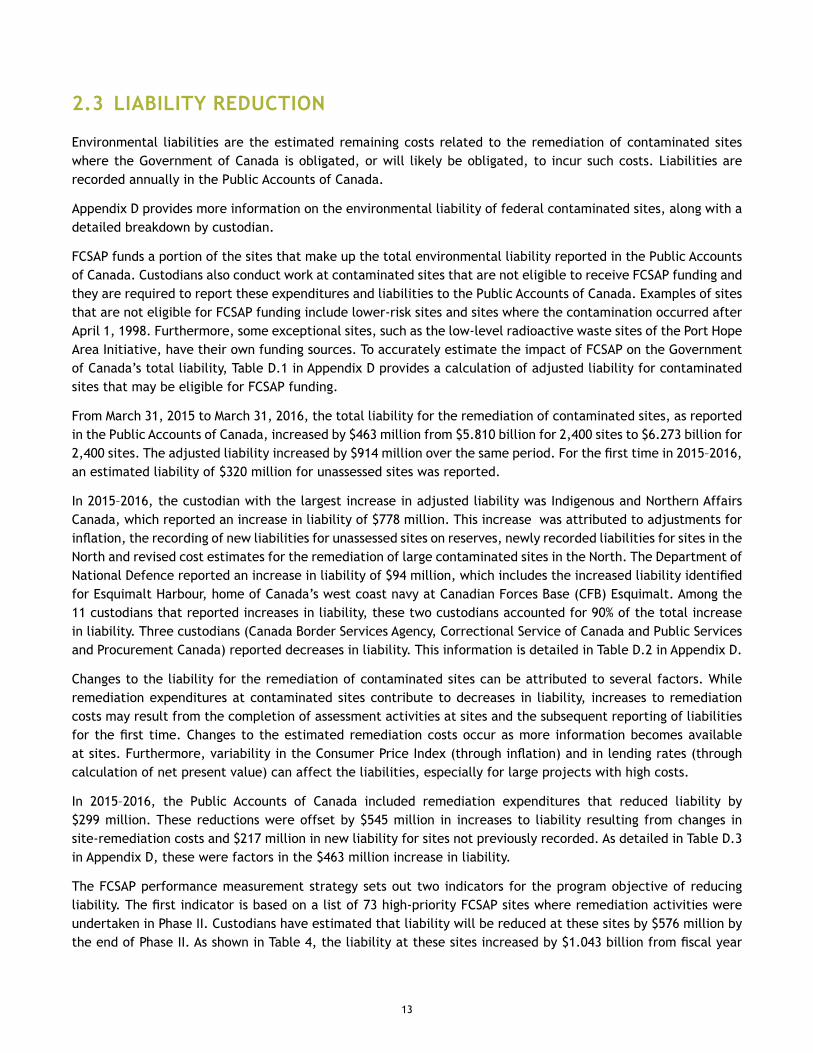
The FCSAP performance measurement strategy sets out two indicators for the program objective of reducing liability. The first indicator is based on a list of 73 high-priority FCSAP sites where remediation activities were undertaken in Phase II. Custodians have estimated that liability will be reduced at these sites by $576 million by the end of Phase II. As shown in Table 4, the liability at these sites increased by $1.043 billion from fiscal year
14
2010–2011 to 2015–2016. Despite the overall increase, liability at 49 of these sites was reduced by $298 million since 2010–2011. This progress was offset by an increase in liability of $1.341 billion at 24 sites, particularly at some large and complex mine remediation projects under the custody of Indigenous and Northern Affairs Canada that will take many years to navigate the 10-step process, detailed in Appendix B. As a result, the multi-year cost projections on larger projects will continue to evolve over time as work progresses and remedial plans are finalized.
Table 4. Performance Indicator 4: Reducing Liability at Key Sites
Performance Indicator Target
Change in total liability for the 73 highest-priority FCSAP sites
-600
-400
-200
0
200
400
600
800
1,000
1,200
($ million)
$1. 043B
-$576M
5-year target (2011–2012 to 2015–2016):
Reduction in liability of $576 million
Result
Result after 2015-2016
5-year target
Result after 2015–2016:
Increase in liability of $1.043 billion
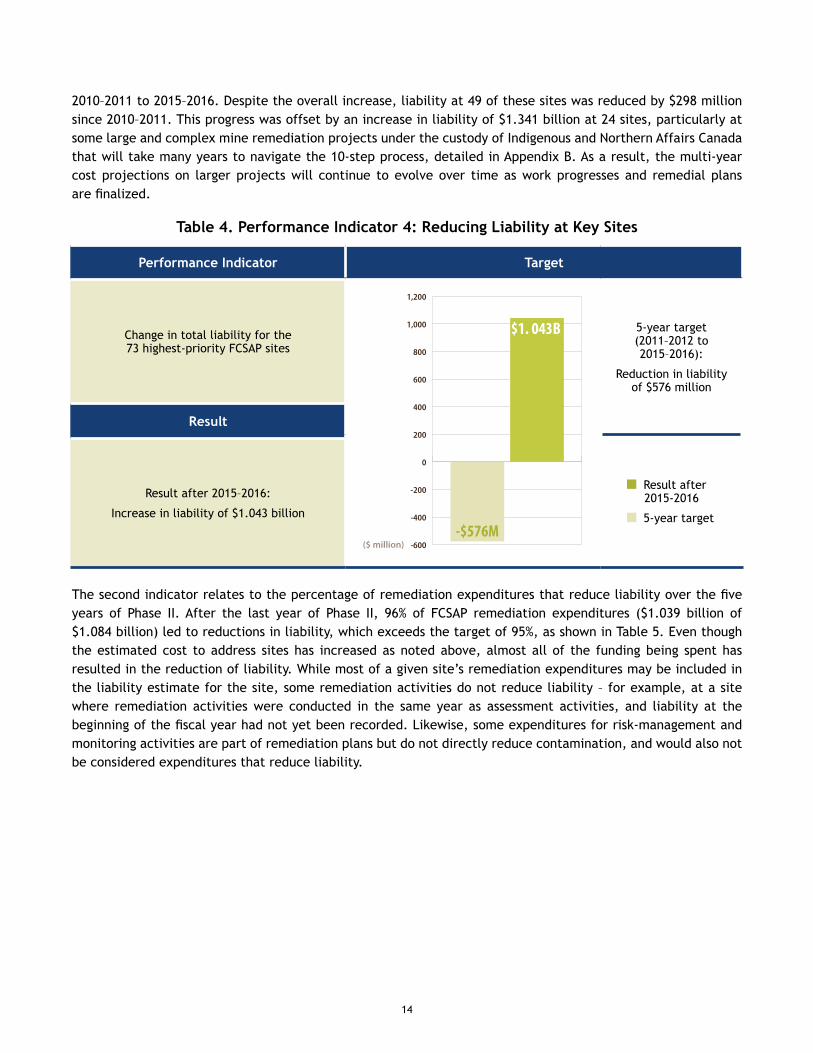
The second indicator relates to the percentage of remediation expenditures that reduce liability over the five years of Phase II. After the last year of Phase II, 96% of FCSAP remediation expenditures ($1.039 billion of $1.084 billion) led to reductions in liability, which exceeds the target of 95%, as shown in Table 5. Even though the estimated cost to address sites has increased as noted above, almost all of the funding being spent has resulted in the reduction of liability. While most of a given site’s remediation expenditures may be included in the liability estimate for the site, some remediation activities do not reduce liability – for example, at a site where remediation activities were conducted in the same year as assessment activities, and liability at the beginning of the fiscal year had not yet been recorded. Likewise, some expenditures for risk-management and monitoring activities are part of remediation plans but do not directly reduce contamination, and would also not be considered expenditures that reduce liability.
15
Table 5. Performance Indicator 5: Liability Reduction Effectiveness
Performance Indicator Target
Percentage of remediation expenditures that reduce liability over the five years
of FCSAP Phase II
$1.039B; 96%
$45M;4%
5-year target (2011–2012 to 2015–2016):
95%
Result Remediation expenditures reducing liability
Other remediation expenditures
Result after 2015–2016:
96%
2.4 FCSAP SECONDARY BENEFITS
Many FCSAP projects have socio-economic benefits, particularly in Indigenous communities and in northern or rural areas. Through joint ventures established between custodians and local communities, work conducted on FCSAP sites offers opportunities for local residents and contractors to learn and develop skills and to build careers and businesses. The partnerships forged among workers and businesses, especially at the local level, help to foster a sense of ownership of project results.
During the 2015–2016 fiscal year, FCSAP activities led to the creation of approximately 1,350 jobs,1 with an estimated 5.2 direct jobs created for every million dollars spent. These jobs provide income and fuel economic growth, as well as developing the skills and training that workers can apply at other contaminated sites or other types of construction and engineering projects. For example, FCSAP remediation projects regularly employ northerners and northern Indigenous Canadians as welders, heavy-duty mechanics, electricians and millwrights.
Through FCSAP, the Canadian remediation industry has an opportunity to advance new solutions when cleaning up federal contaminated sites. The program builds awareness of innovative and sustainable technologies by sharing success stories within the federal community and the private sector. These case studies are profiled on-line, in reports and at workshops for federal contaminated site managers and industry representatives.
2.5 IMPACT OF FCSAP ON THE FEDERAL CONTAMINATED SITES INVENTORY
The Federal Contaminated Sites Inventory (FCSI), managed by the Treasury Board of Canada Secretariat, includes information on federal contaminated sites under the custodianship of departments, agencies and consolidated Crown corporations, and on non-federal contaminated sites for which the Government of Canada has accepted financial responsibility. The FCSI also includes information on federal sites that are being investigated or have been investigated to identify the presence of contamination that could pose risks to human health or the environment.
1. Based on a multiplier from ECO Canada, issued in 2007 and validated in 2014.
16
Before FCSAP was established in 2005–2006, the FCSI contained approximately 2,000 suspected and 4,200 active federal contaminated sites. Since then, custodians have added sites to the inventory when they suspected contamination and have conducted assessment and remediation activities at these sites, if required.
As of March 31, 2016, the FCSI contained more than 23,070 sites, of which 15,380 (67%) have been closed, either due to remediation work completed or was not required after assessment at the sites. Approximately 5,340 sites (23%) are active, meaning that contamination has been confirmed at the site and that remedial action is or may be required. About 2,350 sites (10%) are suspected to be contaminated but have not yet been assessed.
Not all sites on the FCSI are eligible for FCSAP remediation funding in Phase II. Only Class 1 sites and Class 2 sites where remediation had started in Phase I (before April 1, 2011) are eligible; the sites must also have been contaminated by historical activities, defined as having occurred before April 1,1998. FCSAP, however, is the main source of funding for federal contaminated-site management, covering about 85% of all FCSI site expenditures since 2005–2006.
Sites move from “suspected” to “active” status once the contamination has been confirmed. However, suspected sites may also be closed if a desktop review or a Phase I environmental site assessment determines that historical activities would not likely have caused contamination. The number of suspected sites decreased by 10% from 2,606 to 2,353 over the 2015–2016 fiscal year. The number of active sites decreased by 8% from 5,785 to 5,340.
The status of active sites depends on the highest step completed as set out in the federal approach to managing contaminated sites, detailed in Appendix B. The number of active sites in the assessment stage (steps 3 to 6) decreased by 9% from 4,252 to 3,869, while the number of active sites in the remediation stage (steps 7 to 9) decreased by 3% from 1,065 to 1,030. The number of active sites in long-term monitoring (step 10) decreased by 6% from 468 to 441.
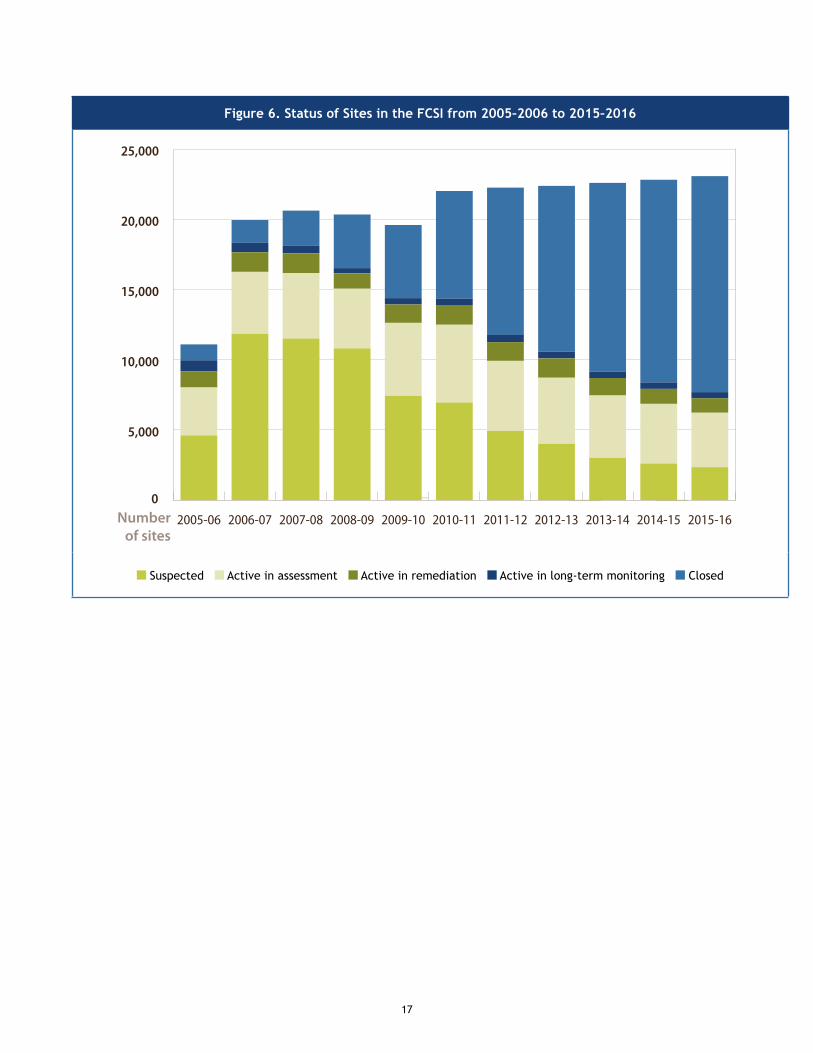
Closed sites require no further action, a conclusion that may be reached at various points in the 10-step process. For example, a suspected site (steps 1 or 2) may be closed when a historical review indicates that past activities would not likely lead to contamination. Sites undergoing assessment (steps 3 to 6) are usually closed if the assessment determines that contaminants are not present or do not pose an unacceptable risk to human health or the environment. Sites are also closed after remediation, risk management or long-term monitoring activities (steps 7 to 10) have reduced the risks to acceptable levels. The number of closed sites increased by 7% in 2015–2016 from 14,429 to 15,381. The total number of closed sites in the FCSI has increased by 1,262% (1,129 to 15,381) since 2005. These results, illustrated in Figure 6, demonstrate that FCSAP is having a significant positive effect on the status of sites in the FCSI.
17
Figure 6. Status of Sites in the FCSI from 2005–2006 to 2015–2016
Numberof sites
0
5,000
10,000
15,000
20,000
25,000
2015-162014-152013-142012-132011-122010-112009-102008-092007-082006-072005-06
Suspected Active in assessment Active in remediation Active in long-term monitoring Closed
18
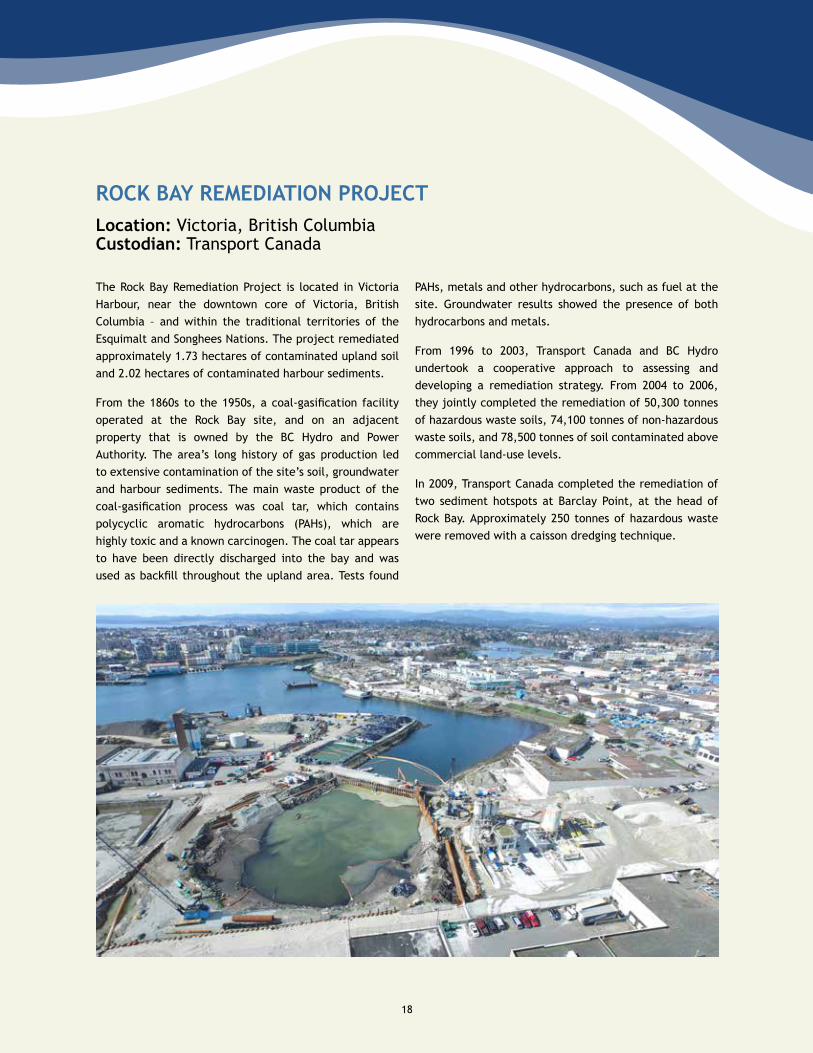
ROCK BAY REMEDIATION PROJECTLocation: Victoria, British Columbia Custodian: Transport Canada
The Rock Bay Remediation Project is located in Victoria Harbour, near the downtown core of Victoria, British Columbia – and within the traditional territories of the Esquimalt and Songhees Nations. The project remediated approximately 1.73 hectares of contaminated upland soil and 2.02 hectares of contaminated harbour sediments.
From the 1860s to the 1950s, a coal-gasification facility operated at the Rock Bay site, and on an adjacent property that is owned by the BC Hydro and Power Authority. The area’s long history of gas production led to extensive contamination of the site’s soil, groundwater and harbour sediments. The main waste product of the coal-gasification process was coal tar, which contains polycyclic aromatic hydrocarbons (PAHs), which are highly toxic and a known carcinogen. The coal tar appears to have been directly discharged into the bay and was used as backfill throughout the upland area. Tests found
PAHs, metals and other hydrocarbons, such as fuel at the site. Groundwater results showed the presence of both hydrocarbons and metals.
From 1996 to 2003, Transport Canada and BC Hydro undertook a cooperative approach to assessing and developing a remediation strategy. From 2004 to 2006, they jointly completed the remediation of 50,300 tonnes of hazardous waste soils, 74,100 tonnes of non-hazardous waste soils, and 78,500 tonnes of soil contaminated above commercial land-use levels.
In 2009, Transport Canada completed the remediation of two sediment hotspots at Barclay Point, at the head of Rock Bay. Approximately 250 tonnes of hazardous waste were removed with a caisson dredging technique.
19
From the spring of 2014 to early 2016, Transport Canada undertook construction for the final stage of the project. This involved the removal and disposal of 78,000 tonnes of contaminated and 15,000 tonnes of non-contaminated soil and sediment from the bay and foreshore. To accomplish this required:• installing shoring along the property boundaries
to permit the safe removal of the contaminated soil to depths of up to 8 m in some locations;
• installing a temporary coffer dam;• draining the bay to remove contaminated
sediments in dry conditions;• temporary diversion of two significant stormwater
outfalls past the work area;
• removal of contaminated sediment and soil for offsite destruction and disposal at approved facilities; and
• restoring the bay and shoreline, following a habitat restoration plan approved by Fisheries and Oceans Canada.
The habitat restoration plan requires five years of post-construction monitoring, to ensure that the restored marine habitat is functioning as intended.
After completion of the post-remediation monitoring and reporting in December 2016, the upland portion of the site will be sold to the Songhees and Esquimalt Nations. A clean Rock Bay will allow a site that sat vacant for many years to be returned safely to the local residents for their community use.
20
3 SUMMARY OF FCSAP PHASE II RESULTS
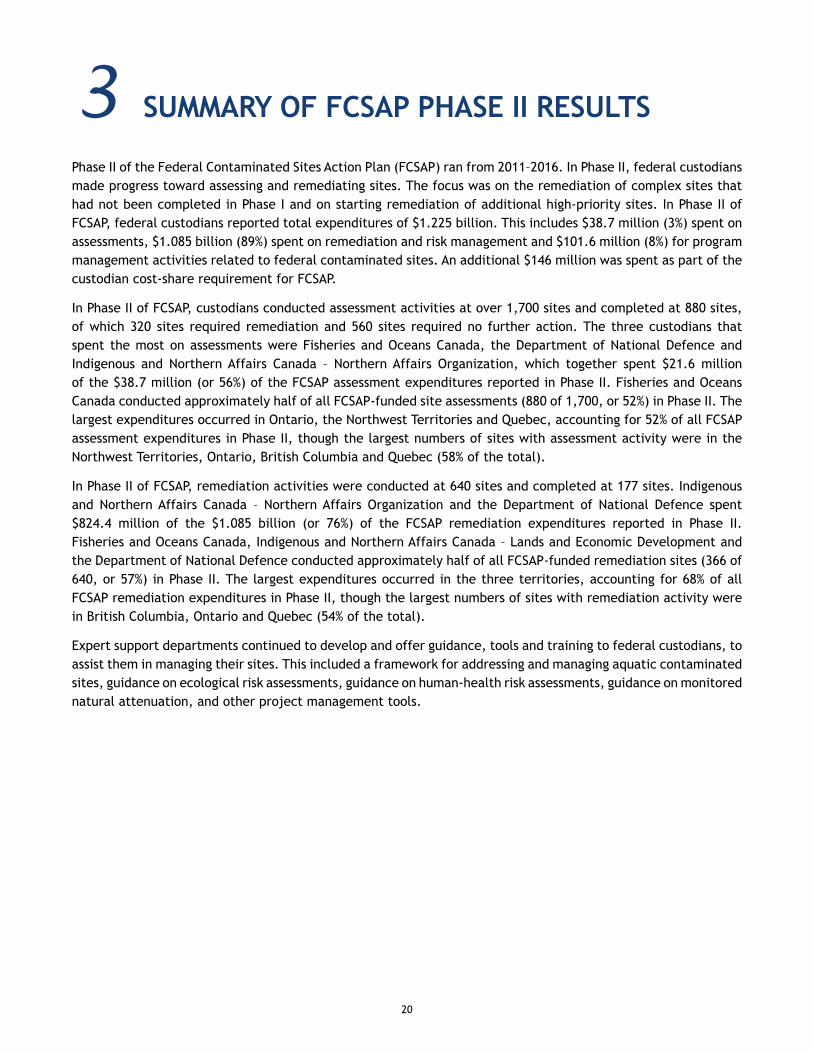
Phase II of the Federal Contaminated Sites Action Plan (FCSAP) ran from 2011–2016. In Phase II, federal custodians made progress toward assessing and remediating sites. The focus was on the remediation of complex sites that had not been completed in Phase I and on starting remediation of additional high-priority sites. In Phase II of FCSAP, federal custodians reported total expenditures of $1.225 billion. This includes $38.7 million (3%) spent on assessments, $1.085 billion (89%) spent on remediation and risk management and $101.6 million (8%) for program management activities related to federal contaminated sites. An additional $146 million was spent as part of the custodian cost-share requirement for FCSAP.
In Phase II of FCSAP, custodians conducted assessment activities at over 1,700 sites and completed at 880 sites, of which 320 sites required remediation and 560 sites required no further action. The three custodians that spent the most on assessments were Fisheries and Oceans Canada, the Department of National Defence and Indigenous and Northern Affairs Canada – Northern Affairs Organization, which together spent $21.6 million of the $38.7 million (or 56%) of the FCSAP assessment expenditures reported in Phase II. Fisheries and Oceans Canada conducted approximately half of all FCSAP-funded site assessments (880 of 1,700, or 52%) in Phase II. The largest expenditures occurred in Ontario, the Northwest Territories and Quebec, accounting for 52% of all FCSAP assessment expenditures in Phase II, though the largest numbers of sites with assessment activity were in the Northwest Territories, Ontario, British Columbia and Quebec (58% of the total).
In Phase II of FCSAP, remediation activities were conducted at 640 sites and completed at 177 sites. Indigenous and Northern Affairs Canada – Northern Affairs Organization and the Department of National Defence spent $824.4 million of the $1.085 billion (or 76%) of the FCSAP remediation expenditures reported in Phase II. Fisheries and Oceans Canada, Indigenous and Northern Affairs Canada – Lands and Economic Development and the Department of National Defence conducted approximately half of all FCSAP-funded remediation sites (366 of 640, or 57%) in Phase II. The largest expenditures occurred in the three territories, accounting for 68% of all FCSAP remediation expenditures in Phase II, though the largest numbers of sites with remediation activity were in British Columbia, Ontario and Quebec (54% of the total).
Expert support departments continued to develop and offer guidance, tools and training to federal custodians, to assist them in managing their sites. This included a framework for addressing and managing aquatic contaminated sites, guidance on ecological risk assessments, guidance on human-health risk assessments, guidance on monitored natural attenuation, and other project management tools.
21
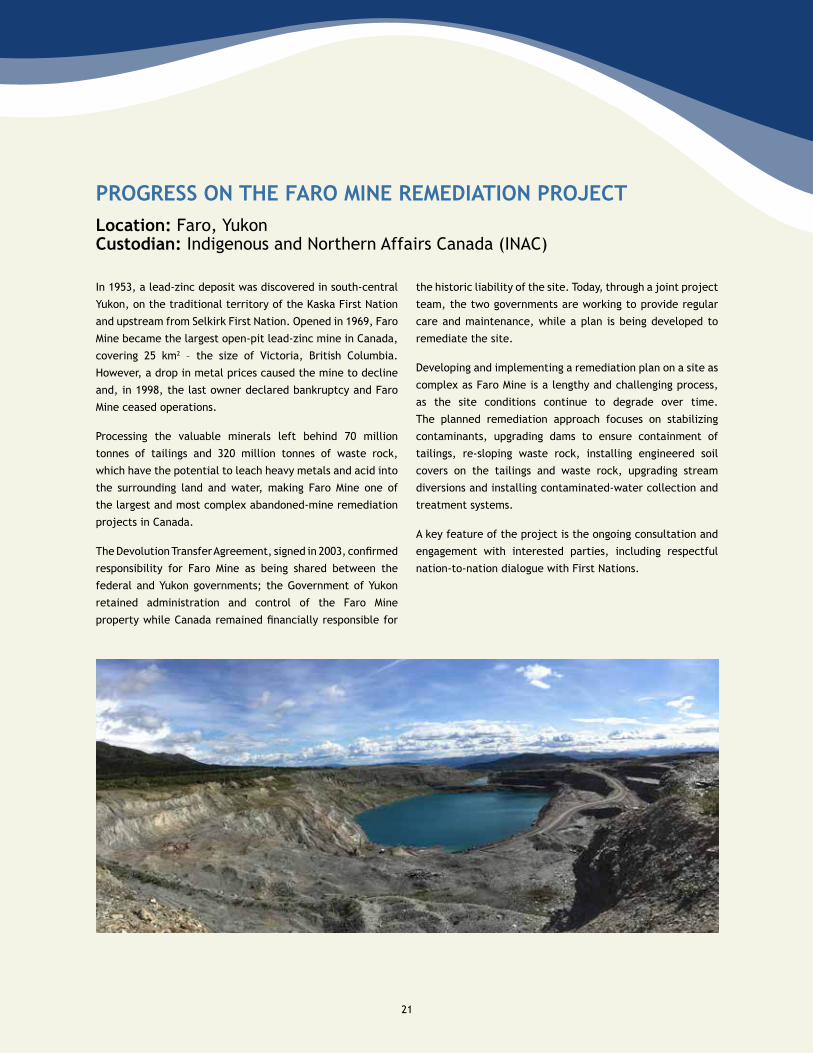
PROGRESS ON THE FARO MINE REMEDIATION PROJECTLocation: Faro, Yukon Custodian: Indigenous and Northern Affairs Canada (INAC)
In 1953, a lead-zinc deposit was discovered in south-central
Yukon, on the traditional territory of the Kaska First Nation
and upstream from Selkirk First Nation. Opened in 1969, Faro
Mine became the largest open-pit lead-zinc mine in Canada,
covering 25 km2 – the size of Victoria, British Columbia.
However, a drop in metal prices caused the mine to decline
and, in 1998, the last owner declared bankruptcy and Faro
Mine ceased operations.
Processing the valuable minerals left behind 70 million
tonnes of tailings and 320 million tonnes of waste rock,
which have the potential to leach heavy metals and acid into
the surrounding land and water, making Faro Mine one of
the largest and most complex abandoned-mine remediation
projects in Canada.
The Devolution Transfer Agreement, signed in 2003, confirmed
responsibility for Faro Mine as being shared between the
federal and Yukon governments; the Government of Yukon
retained administration and control of the Faro Mine
property while Canada remained financially responsible for
the historic liability of the site. Today, through a joint project
team, the two governments are working to provide regular
care and maintenance, while a plan is being developed to
remediate the site.
Developing and implementing a remediation plan on a site as
complex as Faro Mine is a lengthy and challenging process,
as the site conditions continue to degrade over time.
The planned remediation approach focuses on stabilizing
contaminants, upgrading dams to ensure containment of
tailings, re-sloping waste rock, installing engineered soil
covers on the tailings and waste rock, upgrading stream
diversions and installing contaminated-water collection and
treatment systems.
A key feature of the project is the ongoing consultation and
engagement with interested parties, including respectful
nation-to-nation dialogue with First Nations.
22
A critical milestone for the project was the establishment
of the Kaska Faro Secretariat in June 2016. The Secretariat
represents the Kaska Nation’s interests in the project by
coordinating their participation in the planning process
and allowing them to build the capacity and expertise
needed to participate in and contribute to all aspects of the
project. Engagement with the Selkirk First Nation and their
involvement remain priorities for Canada.
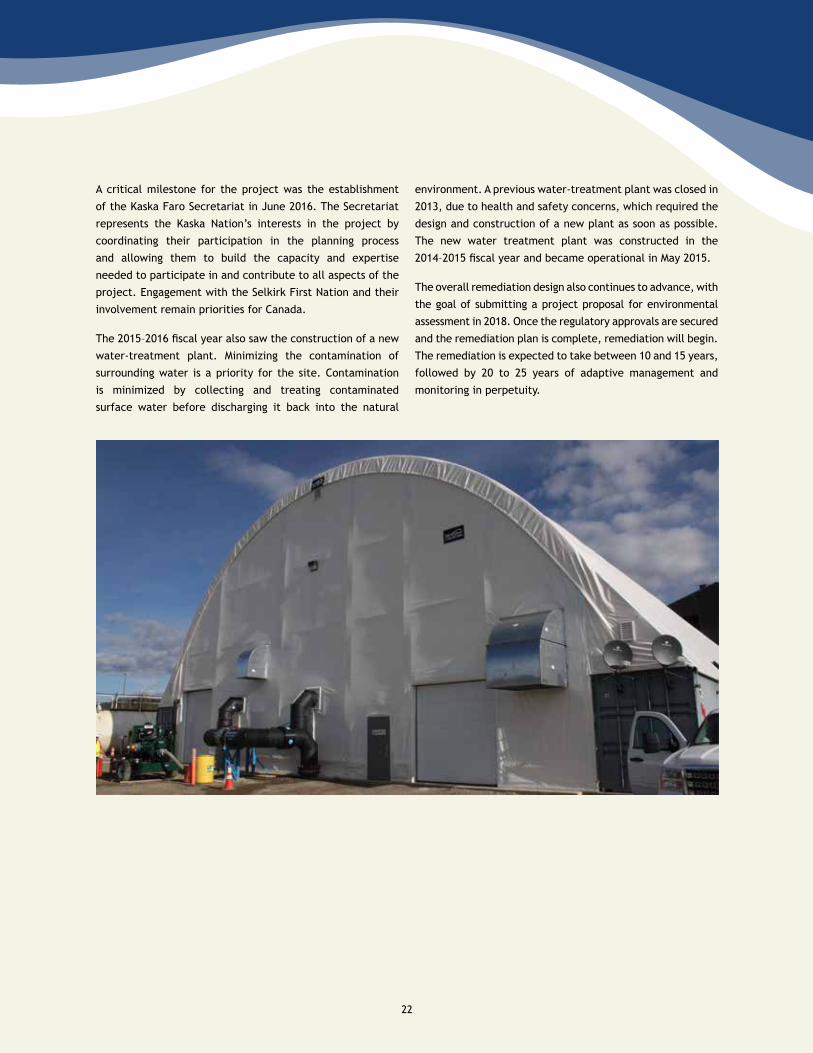
The 2015–2016 fiscal year also saw the construction of a new
water-treatment plant. Minimizing the contamination of
surrounding water is a priority for the site. Contamination
is minimized by collecting and treating contaminated
surface water before discharging it back into the natural
environment. A previous water-treatment plant was closed in
2013, due to health and safety concerns, which required the
design and construction of a new plant as soon as possible.
The new water treatment plant was constructed in the
2014–2015 fiscal year and became operational in May 2015.
The overall remediation design also continues to advance, with
the goal of submitting a project proposal for environmental
assessment in 2018. Once the regulatory approvals are secured
and the remediation plan is complete, remediation will begin.
The remediation is expected to take between 10 and 15 years,
followed by 20 to 25 years of adaptive management and
monitoring in perpetuity.
23
4 FCSAP APPROVALS AND EXPENDITURES
This section describes the three types of funding that the Federal Contaminated Sites Action Plan (FCSAP) provides, the funding-approval process and the amounts of funding allocations, expenditures and variances.
4.1 TYPES OF FUNDING
FCSAP provides three types of funding: assessment, remediation and risk management, and program management. Assessment and remediation/risk-management funding are provided to allow custodians to perform work at contaminated sites. Program management funding is provided by FCSAP to assist custodians with the management of their site portfolios through activities such as procurement, contract management, expert support and reporting.
4.2 FUNDING APPROVALS
Treasury Board approves FCSAP funding on the basis of federal custodians’ planned assessment and remediation activities.
On the advice of the FCSAP Secretariat and the Treasury Board of Canada Secretariat, the Federal Contaminated Sites Director General Steering Committee provides general oversight and direction to the program and approves priority sites for remediation. A committee of Assistant Deputy Ministers also provides strategic direction for FCSAP in areas such as program design and funding parameters.
Federal custodians are accountable for the FCSAP funding they receive and must ensure that their sites meet funding-eligibility requirements. Therefore, custodians must first have grounds to suspect that a site is contaminated (normally on the basis of past activities at the site) before environmental site-assessment activities can be funded. The FCSAP Secretariat has developed a prioritization tool to assist custodians in determining the priority of sites that should undergo assessment, considering that funds or resources might not be available to assess all sites at the same time. Guidance on the eligibility of project costs ensures that remediation or risk-management activities focus on reducing risks associated with contaminants.
4.3 FUNDING ALLOCATIONS, EXPENDITURES AND VARIANCES
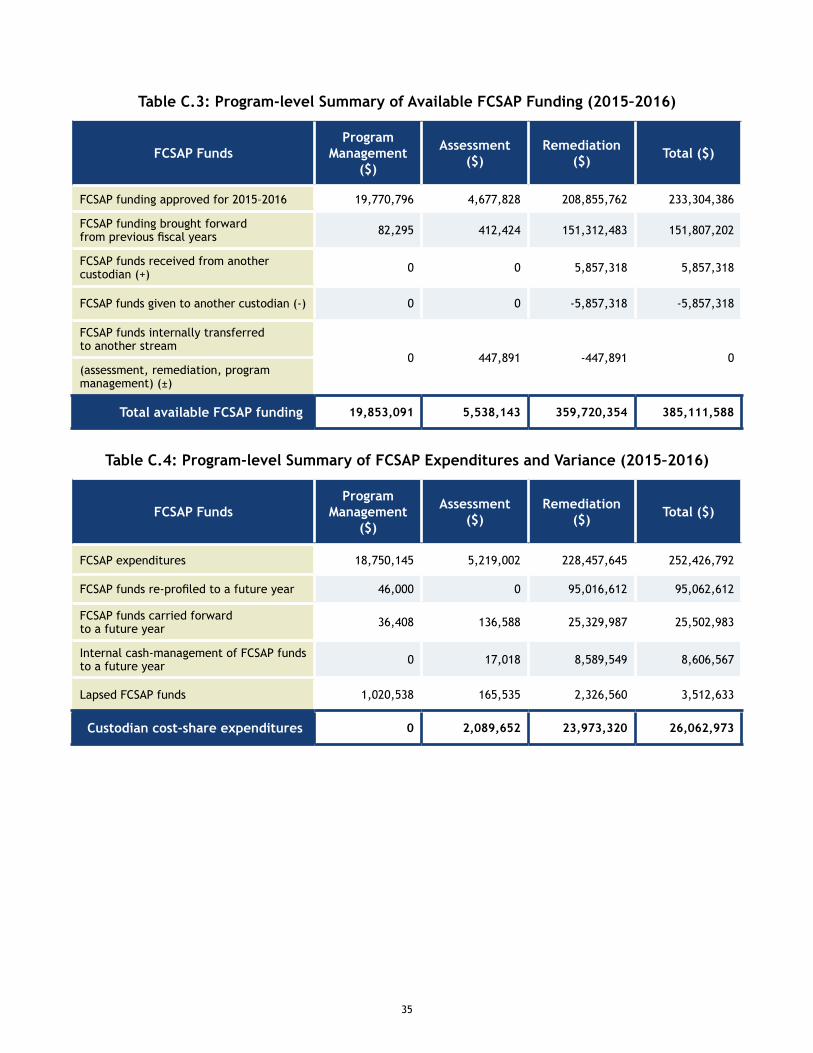
FCSAP expenditures in the 2015–2016 fiscal year were $252.4 million, or 66% of the available funding. This is slightly lower than the five-year average of spending 70% of funding available in FCSAP Phase II. Custodians spent an additional $26.1 million to meet their cost-share requirements.
24
Remediation and risk-management expenditures at federal contaminated sites represented 91% of total FCSAP expenditures ($228.4 million), assessment expenditures represented 2% of the total ($5.2 million) and program management expenditures accounted for 7% ($18.8 million). Table C.3 in Appendix C details the allocations for the three types of FCSAP funding.
The most common reasons why custodians did not spend all of the funds available to them in 2015–2016 involved contracting and project delays, such as weather conditions that either prevented access to the sites or limited the types of work that could be carried out on-site. For example, at several northern sites, remediation work that was not started by the beginning of fall was halted, as there was a low probability of being able to complete the work within the fiscal year due to the limited construction season. Additionally, the tendering of several projects was delayed, postponing the remediation/risk management work to the next fiscal year. The uncertainty of funding availability under FCSAP Phase III (2016–2020) also delayed the tendering of remediation contracts and postponed work to future years.
Custodians used various mechanisms to account for these unspent funds (or variances), which are detailed in Table C.4, along with the associated amounts. The overall variance between the available FCSAP funding and the expenditures was $132.7 million.
Unspent funds can be brought forward for FCSAP activities in future years through:
• government re-profiling, which must be approved by Treasury Board;
• carry-forward processes, which require internal approval from the custodian’s finance group; or
• cash-management processes, which involve the custodian lending the unspent funds to another part of the organization, with the commitment that the funds be returned in the next fiscal year.
These processes allow custodians flexibility in response to unpredictable circumstances, such as weather, that may affect expenditures on FCSAP-eligible sites. The FCSAP Secretariat promotes and facilitates the transfer of funds amongst custodians. Funding that is not brought forward or transferred between custodians is lapsed, meaning that the funds will not be available for FCSAP activities in the future.
In 2015–2016, 72% of the FCSAP funding variance was re-profiled, 19% was carried forward, 6% was internally cash-managed and 3% was lapsed. This means that, of the $132.7 million of available funding that was not spent in 2015–2016, $129.2 million (97%) will be available in future years.

APPENDIX AProgram Administration
26
PROGRAM ADMINISTRATION
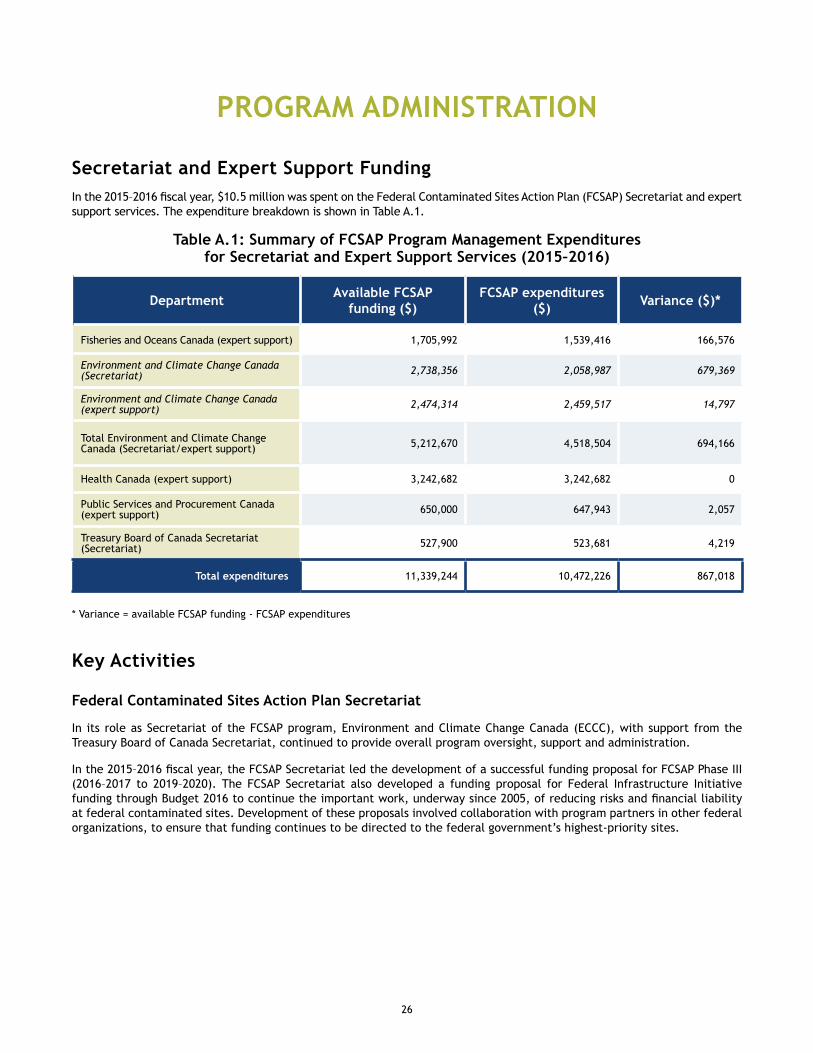
Secretariat and Expert Support FundingIn the 2015–2016 fiscal year, $10.5 million was spent on the Federal Contaminated Sites Action Plan (FCSAP) Secretariat and expert support services. The expenditure breakdown is shown in Table A.1.
Table A.1: Summary of FCSAP Program Management Expenditures for Secretariat and Expert Support Services (2015–2016)
Department Available FCSAP funding ($)
FCSAP expenditures ($) Variance ($)*
Fisheries and Oceans Canada (expert support) 1,705,992 1,539,416 166,576
Environment and Climate Change Canada (Secretariat) 2,738,356 2,058,987 679,369
Environment and Climate Change Canada (expert support) 2,474,314 2,459,517 14,797
Total Environment and Climate Change Canada (Secretariat/expert support) 5,212,670 4,518,504 694,166
Health Canada (expert support) 3,242,682 3,242,682 0
Public Services and Procurement Canada (expert support) 650,000 647,943 2,057
Treasury Board of Canada Secretariat (Secretariat) 527,900 523,681 4,219
Total expenditures 11,339,244 10,472,226 867,018
* Variance = available FCSAP funding - FCSAP expenditures
Key Activities
Federal Contaminated Sites Action Plan Secretariat
In its role as Secretariat of the FCSAP program, Environment and Climate Change Canada (ECCC), with support from the Treasury Board of Canada Secretariat, continued to provide overall program oversight, support and administration.
In the 2015–2016 fiscal year, the FCSAP Secretariat led the development of a successful funding proposal for FCSAP Phase III (2016–2017 to 2019–2020). The FCSAP Secretariat also developed a funding proposal for Federal Infrastructure Initiative funding through Budget 2016 to continue the important work, underway since 2005, of reducing risks and financial liability at federal contaminated sites. Development of these proposals involved collaboration with program partners in other federal organizations, to ensure that funding continues to be directed to the federal government’s highest-priority sites.
27
Other FCSAP Secretariat activities include:
• Program governance – The FCSAP Secretariat organized and co-chaired meetings of both the Contaminated Sites Management Working Group and the Federal Contaminated Sites Director General Steering Committee, which provide operational and strategic support to the program. The Secretariat also reviewed site submissions for eligibility and maintained the priority list of eligible sites. The FCSAP Secretariat also supported Treasury Board of Canada Secretariat in the development of liability estimates for unassessed sites.
• Improvements to data management – The FCSAP Secretariat continued to upgrade the Interdepartmental Data Exchange Application database, to improve tracking of project submissions and to better facilitate reviews by expert support departments, and continued improvement of the performance measurement tracking system.
• Performance monitoring and reporting – The FCSAP Secretariat published the 2012–2013 and 2013–2014 annual reports and prepared a draft version of the 2014–2015 annual report, which present the results of program activities and custodian expenditures against the indicators and targets committed to in the FCSAP performance measurement strategy.
Treasury Board of Canada Secretariat
Throughout 2015–2016, Treasury Board of Canada Secretariat (TBS) supported the activities of the FCSAP Secretariat through the provision of strategic advice and analysis on many program implementation issues, including:
• Program governance – TBS co-chaired, with ECCC, the Federal Contaminated Sites Director General Steering Committee and participated in the Contaminated Sites Management Working Group and other sub-committees, as required. TBS supported Environment and Climate Change Canada in the development and approval of a funding proposal for Phase III of FCSAP and a funding proposal for Budget 2016 infrastructure funding.
• Improvements to data management – TBS maintained and enhanced the Federal Contaminated Sites Inventory.
• Performance monitoring and reporting – TBS supported the activities of the FCSAP Secretariat through participation and oversight on key program initiatives, such as annual reporting, long-term planning, and future funding analysis.
• Community building – TBS coordinated planning for the Real Property Institute of Canada (RPIC) Federal Contaminated Sites National Workshop, held in Montréal, Quebec, April 25–27, 2016.
Expert Support Departments
In 2015–2016, expert support departments focused on developing and delivering guidance documents and training, providing advice, conducting reviews of contaminated-site management projects, and promoting innovative and sustainable remediation technologies.
Details on each of the departments’ activities include the following:
• Fisheries and Oceans Canada (DFO), ECCC and Health Canada reviewed site classifications to ensure that sites were eligible for FCSAP remediation or risk-management funding. These three expert support departments also conducted site visits and reviewed reports to provide advice and guidance to custodians on risk assessments, site classifications, regulations, remedial plans and technical requirements.
• DFO provided scientific and technical advice to custodians on the management of their contaminated sites in relation to risks and impacts to fish and fish habitat. DFO conducted 30 site-classification reviews to confirm eligibility for FCSAP funding and 190 technical document reviews in support of site assessment and remediation and risk management, to ensure that the potential impacts to fish and fish habitat were appropriately considered and to promote compliance with regulations. DFO developed guidance material and provided training on the management of FCSAP sites to custodial departments in the following areas:
a) draft of the Federal Contaminated Sites Action Plan Guidance for Assessing and Managing Aquatic Contaminated Sites in Working Harbours;
b) Working Harbour presentation and workshop;
c) draft updates to the Framework for Addressing and Managing Aquatic Contaminated Sites;
28
d) Monitored Natural Attenuation/Monitored Natural Recovery training course and pilot classroom training session in Vancouver; and
e) Long-Term Monitoring II training course and pilot classroom training session in Winnipeg.
• ECCC provided technical advice to custodial departments on the management of their contaminated sites. ECCC reviewed 30 site-classification scores to confirm eligibility for funding and reviewed 227 technical documents, to assist custodians during assessment and remediation projects and to promote compliance with regulations. ECCC worked with other expert support departments and various custodians on ecological concerns from potential exposure to perfluoroalkyl substances, a group of emerging contaminants associated with some federal contaminated sites. The Department developed draft guidance on ecological risk assessments for amphibians, finalized guidance on monitored natural attenuation, developed several FCSAP advisory bulletins to provide nationally consistent advice to custodians and delivered training courses in areas such as the use of real-time assessment technologies and sampling and characterization quality assurance/quality control.
• Health Canada provided technical advice to custodial departments on the management of their contaminated sites. In particular, Health Canada worked closely with other expert support departments and various custodians on human health-related concerns from potential exposure to perfluoroalkyl substances, a group of emerging contaminants associated with some federal contaminated sites. Other accomplishments included the review of 30 site-classification scores from federal custodians to confirm eligibility for funding and the review of approximately 199 technical documents to assist custodians during assessment and remediation projects. Health Canada also completed final drafts of five technical guidance documents, delivered a “Much to do with Arsenic” Training Webinar and delivered three Human Health Risk Assessment (HHRA) 101 in-class courses.
• Public Services and Procurement Canada (PSPC) developed and updated contaminated-site management tools, including the Guidance and Orientation for the Selection of Technologies, the Sustainable Development Analysis Tool and Project Management Tools. PSPC delivered one in-class training session on the Project Management Tools. PSPC also collected and shared innovative and sustainable/green approaches with custodians, addressed procurement issues and informed the private sector of federal demand for services through the Demand Forecast Analysis.
APPENDIX BFederal Approach to Managing Contaminated Sites
30
FEDERAL APPROACH TO MANAGING CONTAMINATED SITES
A contaminated site is an area in which hazardous substances occur at concentrations above normally occurring background levels and pose, or are likely to pose, an immediate or long-term hazard to human health or the environment. Determining the risk posed by the presence of these substances also involves determining potential exposure pathways and identifying potential receptors. Contamination can come from sources such as storage-tank leaks, long-term use of industrial facilities or accidents – such as spills of polychlorinated biphenyls.
To ensure that custodians take a common approach to managing federal contaminated sites, the Federal Contaminated Sites Action Plan (FCSAP) follows a 10-step process set out in A Federal Approach to Contaminated Sites.1
Step 1: Identify suspected sites – Identify potentially contaminated sites on the basis of past or current activities on or near the site.
Step 2: Historical review – Assemble and review all historical information pertaining to the site.
Step 3: Initial testing program – Provide a preliminary characterization of contamination and site conditions.
Step 4: Classify contaminated site, using the Canadian Council of Ministers of the Environment (CCME) National Classification System – Prioritize the site for future investigations and remediation or risk management actions.
Step 5: Detailed testing program – Focus on specific areas of concern identified in step 3 and provide further in-depth investigations and analysis.
Step 6: Reclassify the site, using the CCME National Classification System – Update the ranking in response to the results of the detailed investigations.
Step 7: Develop remediation and risk management strategy – Develop a site-specific plan to address contamination issues.
Step 8: Implement remediation and risk management strategy – Implement the site-specific plan that addresses contamination issues.
Step 9: Confirmatory sampling and final reporting – Verify and document the success of the remediation and risk management strategy.
Step 10: Long-term monitoring – If required, conduct long-term monitoring to ensure that remediation and long-term risk-management goals are achieved.
These steps indicate the stage of progress at a site. Step 8 tends to require significantly more time, energy and funding than any other step.
Process Walkthrough
Once a site is suspected of being contaminated (Step 1), custodians may seek FCSAP funding to conduct a historical review through a Phase I environmental site assessment (Step 2). The purpose of this work is to determine whether contamination is likely to exist on the property.
The next step consists of an initial testing program (Step 3) to confirm the presence of contamination at the site. If contamination is present above levels specified in policies or guidelines or is above background levels and may cause risk, additional detailed testing (Step 5) must occur to determine the extent of contamination. The results from assessments help to identify risks to human health and the environment to determine what remediation or risk management action is necessary.
1. A Federal Approach to Contaminated Sites (Contaminated Sites Management Working Group, 1999), www.federalcontaminatedsites.gc.ca/default.asp?lang=en&n=B4AC7C22-1
31
To determine the priority of a site for management action, federal sites are classified according to the nature, severity and immediacy of the risk posed to human health and the environment. The CCME National Classification System for Contaminated Sites or the FCSAP Aquatic Sites Classification System is used, depending on whether the contaminated site is on land or in water (Steps 4 and 6). To ensure that available funding is directed to the highest-risk sites, FCSAP funds the remediation or risk management of Class 1 (high priority for action) sites, and Class 2 (medium priority for action) sites that had spent FCSAP remediation expenditures before April 1, 2011. Class 3 (low priority for action) sites are not eligible for FCSAP remediation funding.
Remediation is the act of removing, reducing or destroying contaminants and pollution from the environment (e.g., from soil, groundwater or surface water such as lakes and rivers). Conversely, risk management is a set of actions aimed at controlling and managing contaminants. Both remediation and risk management aim to protect the environment and human health by limiting exposure to hazardous substances leading to improved quality of life, increased wildlife habitat and economic benefits.
Once assessment activities have confirmed that contamination levels pose a risk to human health or the environment, the custodian responsible oversees the development of the remediation plan (Step 7) and updates the federal environmental liability for the site with available information. The custodian then works closely with consultants, contractors and tradespeople to implement the plan (Step 8). Usually, the final stage of the project is to confirm that the remediation or risk-management objectives have been reached (Step 9). The site may then be closed, which indicates that no further action is required and that the federal financial liability has been reduced to zero. However, for sites where the most appropriate course of action is to risk-manage contamination by containing it on a site and reducing exposure to people, plants and animals, long-term monitoring (Step 10) may be necessary to ensure that risks remain at acceptable levels.

APPENDIX CData Tables
33
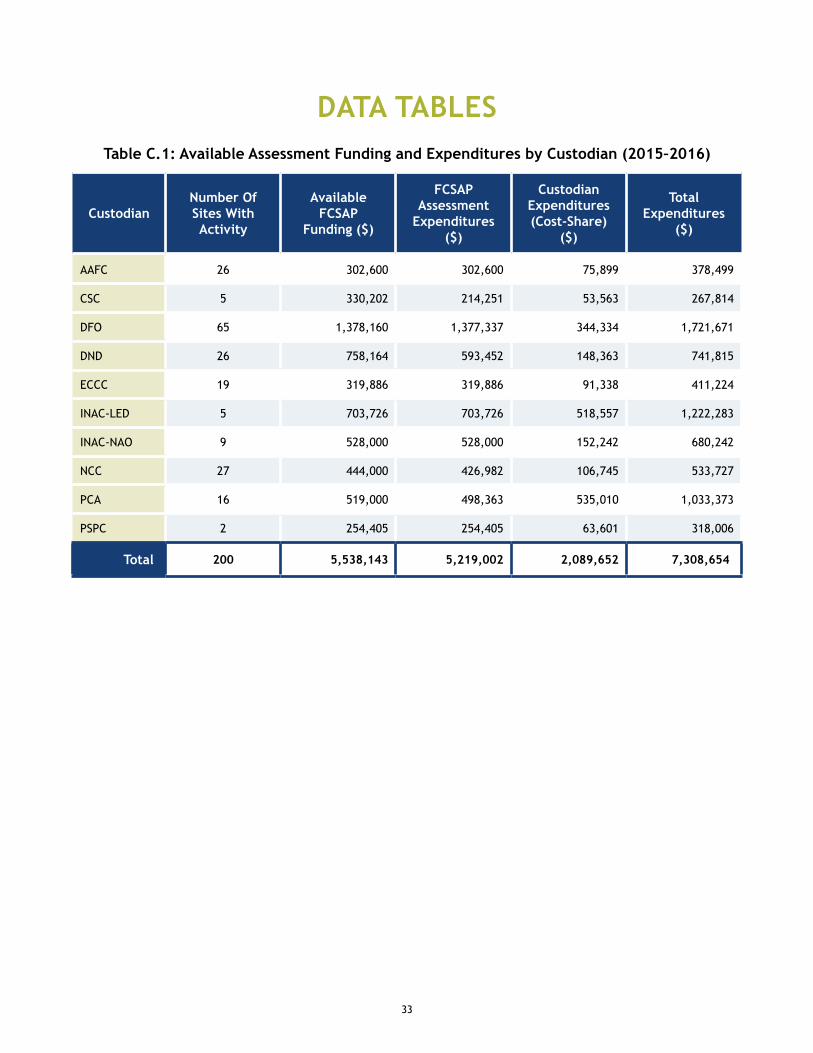
DATA TABLESTable C.1: Available Assessment Funding and Expenditures by Custodian (2015–2016)
CustodianNumber Of Sites With Activity
Available FCSAP
Funding ($)
FCSAP Assessment
Expenditures ($)
Custodian Expenditures (Cost-Share)
($)
Total Expenditures
($)
AAFC 26 302,600 302,600 75,899 378,499
CSC 5 330,202 214,251 53,563 267,814
DFO 65 1,378,160 1,377,337 344,334 1,721,671
DND 26 758,164 593,452 148,363 741,815
ECCC 19 319,886 319,886 91,338 411,224
INAC-LED 5 703,726 703,726 518,557 1,222,283
INAC-NAO 9 528,000 528,000 152,242 680,242
NCC 27 444,000 426,982 106,745 533,727
PCA 16 519,000 498,363 535,010 1,033,373
PSPC 2 254,405 254,405 63,601 318,006
Total 200 5,538,143 5,219,002 2,089,652 7,308,654
34
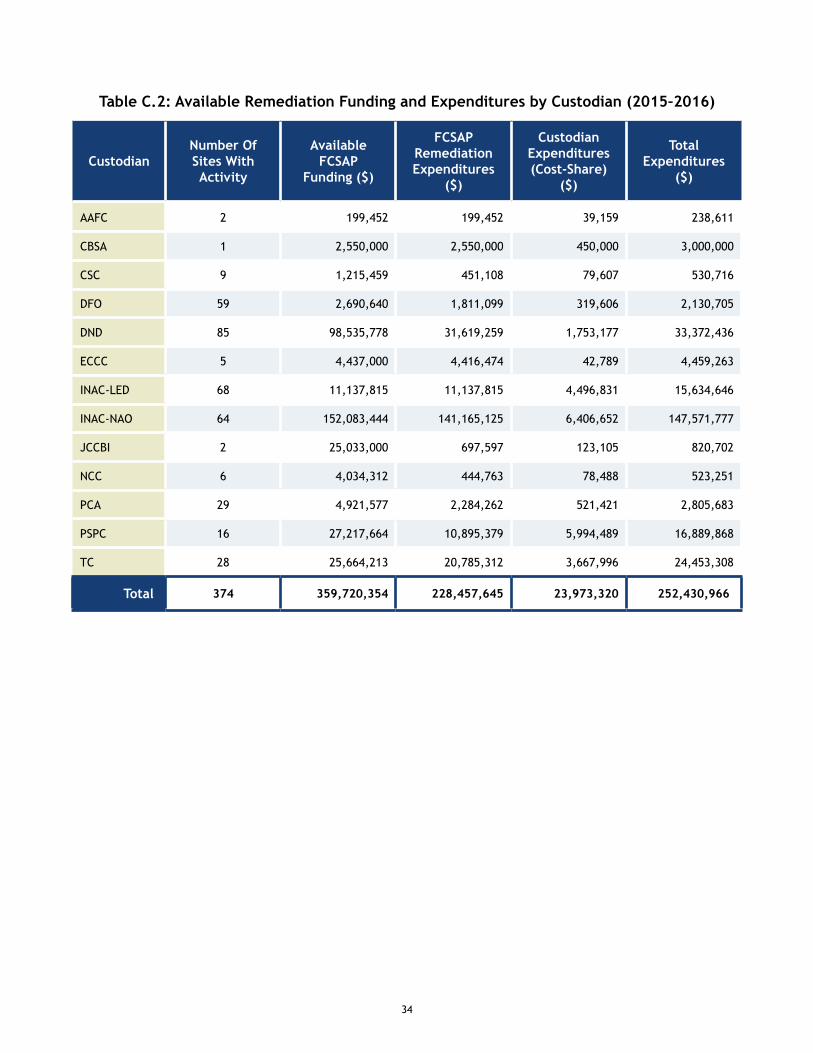
Table C.2: Available Remediation Funding and Expenditures by Custodian (2015–2016)
CustodianNumber Of Sites With Activity
Available FCSAP
Funding ($)
FCSAP Remediation Expenditures
($)
Custodian Expenditures (Cost-Share)
($)
Total Expenditures
($)
AAFC 2 199,452 199,452 39,159 238,611
CBSA 1 2,550,000 2,550,000 450,000 3,000,000
CSC 9 1,215,459 451,108 79,607 530,716
DFO 59 2,690,640 1,811,099 319,606 2,130,705
DND 85 98,535,778 31,619,259 1,753,177 33,372,436
ECCC 5 4,437,000 4,416,474 42,789 4,459,263
INAC-LED 68 11,137,815 11,137,815 4,496,831 15,634,646
INAC-NAO 64 152,083,444 141,165,125 6,406,652 147,571,777
JCCBI 2 25,033,000 697,597 123,105 820,702
NCC 6 4,034,312 444,763 78,488 523,251
PCA 29 4,921,577 2,284,262 521,421 2,805,683
PSPC 16 27,217,664 10,895,379 5,994,489 16,889,868
TC 28 25,664,213 20,785,312 3,667,996 24,453,308
Total 374 359,720,354 228,457,645 23,973,320 252,430,966
35
Table C.3: Program-level Summary of Available FCSAP Funding (2015–2016)
FCSAP FundsProgram
Management ($)
Assessment ($)
Remediation ($) Total ($)
FCSAP funding approved for 2015–2016 19,770,796 4,677,828 208,855,762 233,304,386
FCSAP funding brought forward from previous fiscal years 82,295 412,424 151,312,483 151,807,202
FCSAP funds received from another custodian (+) 0 0 5,857,318 5,857,318
FCSAP funds given to another custodian (-) 0 0 -5,857,318 -5,857,318
FCSAP funds internally transferred to another stream
0 447,891 -447,891 0(assessment, remediation, program management) (±)
Total available FCSAP funding 19,853,091 5,538,143 359,720,354 385,111,588
Table C.4: Program-level Summary of FCSAP Expenditures and Variance (2015–2016)
FCSAP FundsProgram
Management ($)
Assessment ($)
Remediation ($) Total ($)
FCSAP expenditures 18,750,145 5,219,002 228,457,645 252,426,792
FCSAP funds re-profiled to a future year 46,000 0 95,016,612 95,062,612
FCSAP funds carried forward to a future year 36,408 136,588 25,329,987 25,502,983
Internal cash-management of FCSAP funds to a future year 0 17,018 8,589,549 8,606,567
Lapsed FCSAP funds 1,020,538 165,535 2,326,560 3,512,633
Custodian cost-share expenditures 0 2,089,652 23,973,320 26,062,973
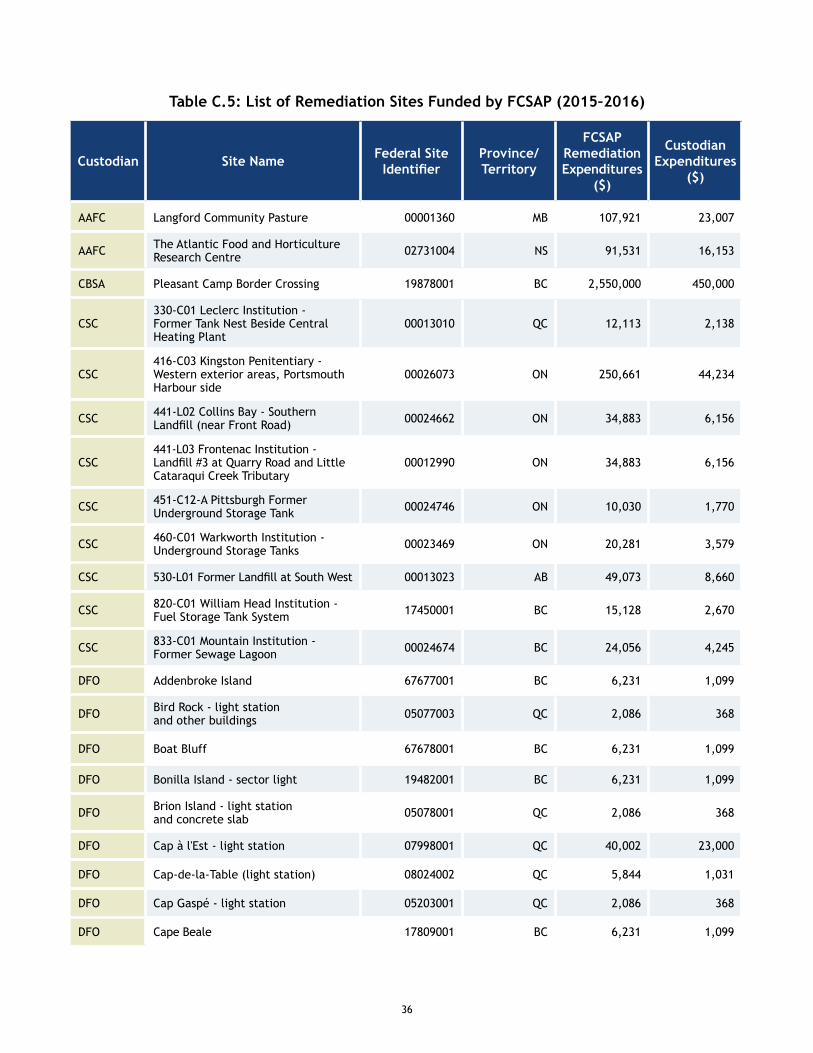
36
Table C.5: List of Remediation Sites Funded by FCSAP (2015–2016)
Custodian Site Name Federal Site Identifier
Province/ Territory
FCSAP Remediation Expenditures
($)
Custodian Expenditures
($)
AAFC Langford Community Pasture 00001360 MB 107,921 23,007
AAFC The Atlantic Food and Horticulture Research Centre 02731004 NS 91,531 16,153
CBSA Pleasant Camp Border Crossing 19878001 BC 2,550,000 450,000
CSC330-C01 Leclerc Institution - Former Tank Nest Beside Central Heating Plant
00013010 QC 12,113 2,138
CSC416-C03 Kingston Penitentiary - Western exterior areas, Portsmouth Harbour side
00026073 ON 250,661 44,234
CSC 441-L02 Collins Bay - Southern Landfill (near Front Road) 00024662 ON 34,883 6,156
CSC441-L03 Frontenac Institution - Landfill #3 at Quarry Road and Little Cataraqui Creek Tributary
00012990 ON 34,883 6,156
CSC 451-C12-A Pittsburgh Former Underground Storage Tank 00024746 ON 10,030 1,770
CSC 460-C01 Warkworth Institution - Underground Storage Tanks 00023469 ON 20,281 3,579
CSC 530-L01 Former Landfill at South West 00013023 AB 49,073 8,660
CSC 820-C01 William Head Institution - Fuel Storage Tank System 17450001 BC 15,128 2,670
CSC 833-C01 Mountain Institution - Former Sewage Lagoon 00024674 BC 24,056 4,245
DFO Addenbroke Island 67677001 BC 6,231 1,099
DFO Bird Rock - light station and other buildings 05077003 QC 2,086 368
DFO Boat Bluff 67678001 BC 6,231 1,099
DFO Bonilla Island - sector light 19482001 BC 6,231 1,099
DFO Brion Island - light station and concrete slab 05078001 QC 2,086 368
DFO Cap à l'Est - light station 07998001 QC 40,002 23,000
DFO Cap-de-la-Table (light station) 08024002 QC 5,844 1,031
DFO Cap Gaspé - light station 05203001 QC 2,086 368
DFO Cape Beale 17809001 BC 6,231 1,099
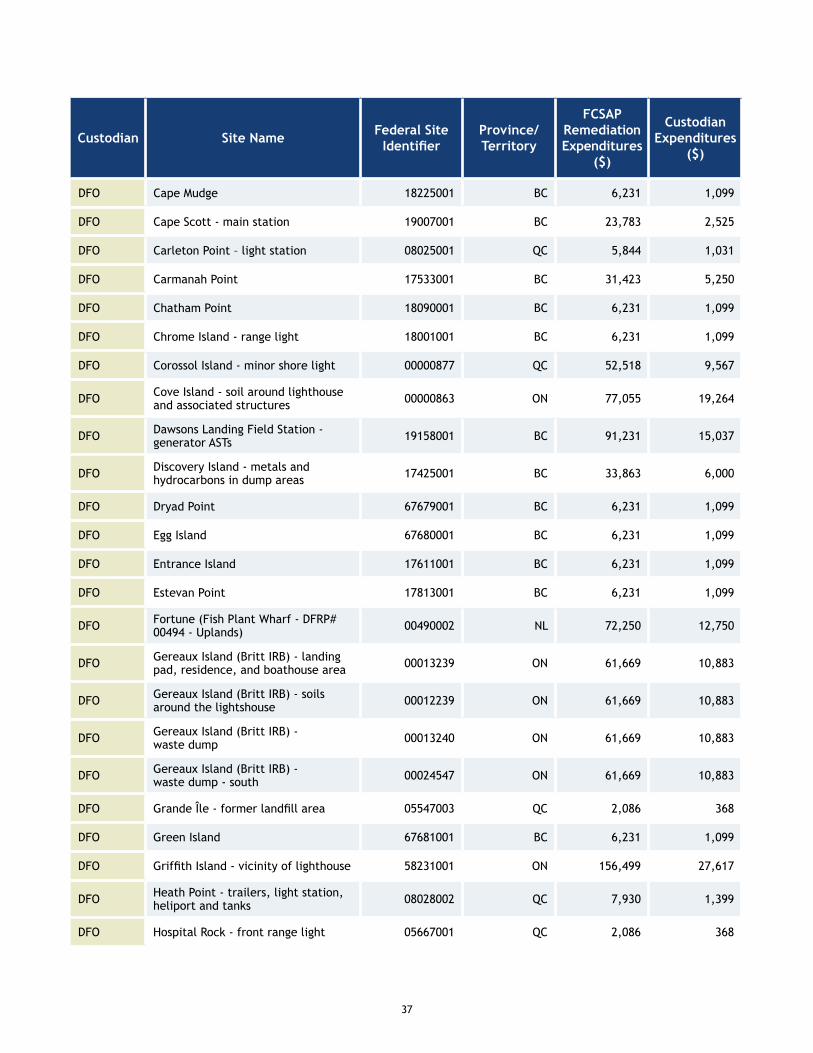
37
Custodian Site Name Federal Site Identifier
Province/ Territory
FCSAP Remediation Expenditures
($)
Custodian Expenditures
($)
DFO Cape Mudge 18225001 BC 6,231 1,099
DFO Cape Scott - main station 19007001 BC 23,783 2,525
DFO Carleton Point – light station 08025001 QC 5,844 1,031
DFO Carmanah Point 17533001 BC 31,423 5,250
DFO Chatham Point 18090001 BC 6,231 1,099
DFO Chrome Island - range light 18001001 BC 6,231 1,099
DFO Corossol Island - minor shore light 00000877 QC 52,518 9,567
DFO Cove Island - soil around lighthouse and associated structures 00000863 ON 77,055 19,264
DFO Dawsons Landing Field Station - generator ASTs 19158001 BC 91,231 15,037
DFO Discovery Island - metals and hydrocarbons in dump areas 17425001 BC 33,863 6,000
DFO Dryad Point 67679001 BC 6,231 1,099
DFO Egg Island 67680001 BC 6,231 1,099
DFO Entrance Island 17611001 BC 6,231 1,099
DFO Estevan Point 17813001 BC 6,231 1,099
DFO Fortune (Fish Plant Wharf - DFRP# 00494 - Uplands) 00490002 NL 72,250 12,750
DFO Gereaux Island (Britt IRB) - landing pad, residence, and boathouse area 00013239 ON 61,669 10,883
DFO Gereaux Island (Britt IRB) - soils around the lightshouse 00012239 ON 61,669 10,883
DFO Gereaux Island (Britt IRB) - waste dump 00013240 ON 61,669 10,883
DFO Gereaux Island (Britt IRB) - waste dump - south 00024547 ON 61,669 10,883
DFO Grande Île - former landfill area 05547003 QC 2,086 368
DFO Green Island 67681001 BC 6,231 1,099
DFO Griffith Island - vicinity of lighthouse 58231001 ON 156,499 27,617
DFO Heath Point - trailers, light station, heliport and tanks 08028002 QC 7,930 1,399
DFO Hospital Rock - front range light 05667001 QC 2,086 368
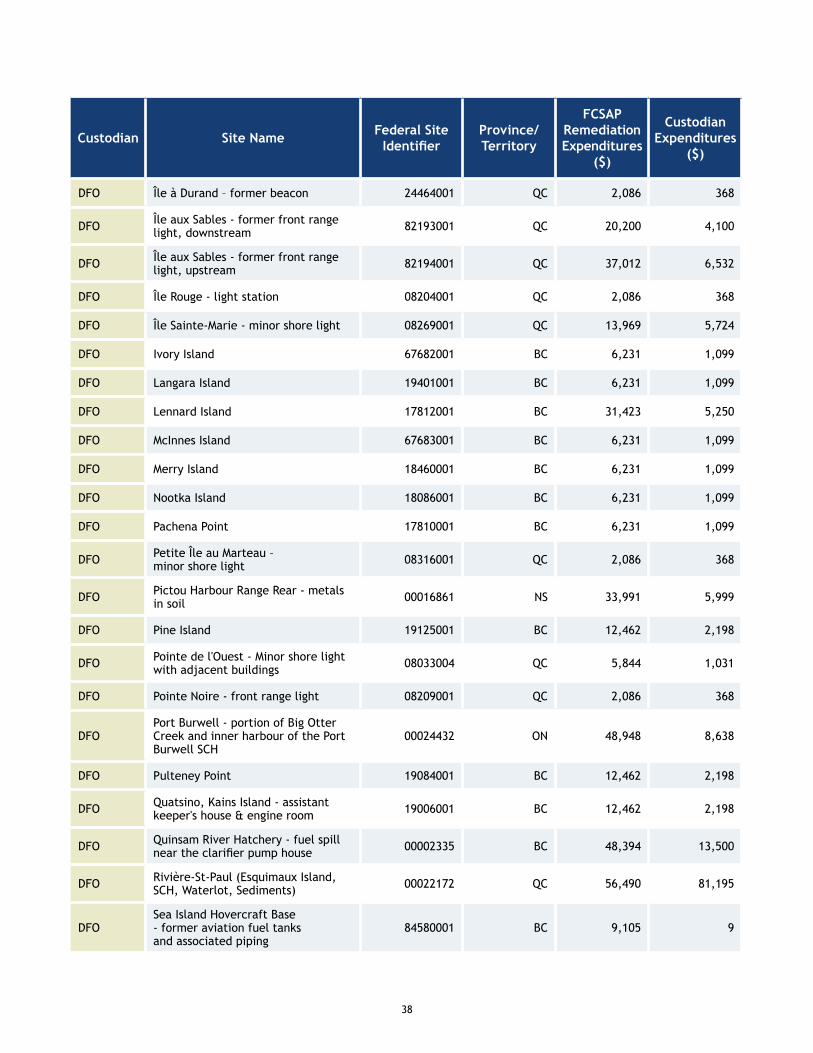
38
Custodian Site Name Federal Site Identifier
Province/ Territory
FCSAP Remediation Expenditures
($)
Custodian Expenditures
($)
DFO Île à Durand – former beacon 24464001 QC 2,086 368
DFO Île aux Sables - former front range light, downstream 82193001 QC 20,200 4,100
DFO Île aux Sables - former front range light, upstream 82194001 QC 37,012 6,532
DFO Île Rouge - light station 08204001 QC 2,086 368
DFO Île Sainte-Marie - minor shore light 08269001 QC 13,969 5,724
DFO Ivory Island 67682001 BC 6,231 1,099
DFO Langara Island 19401001 BC 6,231 1,099
DFO Lennard Island 17812001 BC 31,423 5,250
DFO McInnes Island 67683001 BC 6,231 1,099
DFO Merry Island 18460001 BC 6,231 1,099
DFO Nootka Island 18086001 BC 6,231 1,099
DFO Pachena Point 17810001 BC 6,231 1,099
DFO Petite Île au Marteau – minor shore light 08316001 QC 2,086 368
DFO Pictou Harbour Range Rear - metals in soil 00016861 NS 33,991 5,999
DFO Pine Island 19125001 BC 12,462 2,198
DFO Pointe de l'Ouest - Minor shore light with adjacent buildings 08033004 QC 5,844 1,031
DFO Pointe Noire - front range light 08209001 QC 2,086 368
DFOPort Burwell - portion of Big Otter Creek and inner harbour of the Port Burwell SCH
00024432 ON 48,948 8,638
DFO Pulteney Point 19084001 BC 12,462 2,198
DFO Quatsino, Kains Island - assistant keeper's house & engine room 19006001 BC 12,462 2,198
DFO Quinsam River Hatchery - fuel spill near the clarifier pump house 00002335 BC 48,394 13,500
DFO Rivière-St-Paul (Esquimaux Island, SCH, Waterlot, Sediments) 00022172 QC 56,490 81,195
DFOSea Island Hovercraft Base - former aviation fuel tanks and associated piping
84580001 BC 9,105 9
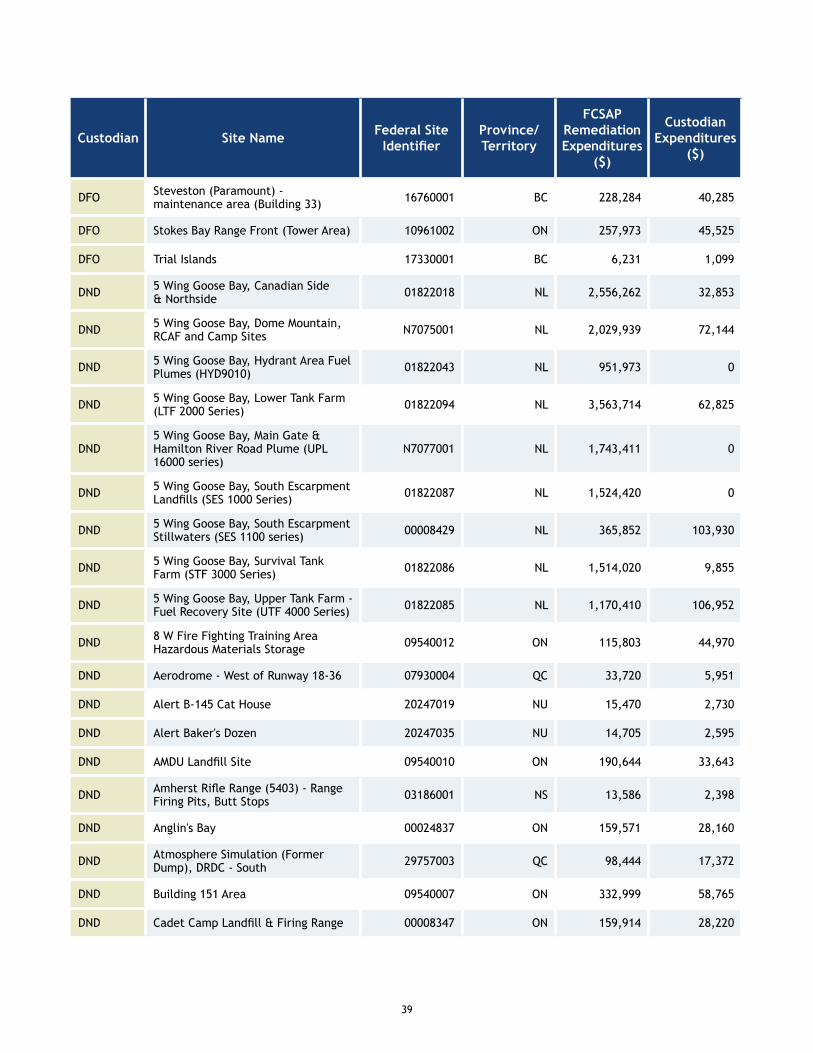
39
Custodian Site Name Federal Site Identifier
Province/ Territory
FCSAP Remediation Expenditures
($)
Custodian Expenditures
($)
DFO Steveston (Paramount) - maintenance area (Building 33) 16760001 BC 228,284 40,285
DFO Stokes Bay Range Front (Tower Area) 10961002 ON 257,973 45,525
DFO Trial Islands 17330001 BC 6,231 1,099
DND 5 Wing Goose Bay, Canadian Side & Northside 01822018 NL 2,556,262 32,853
DND 5 Wing Goose Bay, Dome Mountain, RCAF and Camp Sites N7075001 NL 2,029,939 72,144
DND 5 Wing Goose Bay, Hydrant Area Fuel Plumes (HYD9010) 01822043 NL 951,973 0
DND 5 Wing Goose Bay, Lower Tank Farm (LTF 2000 Series) 01822094 NL 3,563,714 62,825
DND5 Wing Goose Bay, Main Gate & Hamilton River Road Plume (UPL 16000 series)
N7077001 NL 1,743,411 0
DND 5 Wing Goose Bay, South Escarpment Landfills (SES 1000 Series) 01822087 NL 1,524,420 0
DND 5 Wing Goose Bay, South Escarpment Stillwaters (SES 1100 series) 00008429 NL 365,852 103,930
DND 5 Wing Goose Bay, Survival Tank Farm (STF 3000 Series) 01822086 NL 1,514,020 9,855
DND 5 Wing Goose Bay, Upper Tank Farm - Fuel Recovery Site (UTF 4000 Series) 01822085 NL 1,170,410 106,952
DND 8 W Fire Fighting Training Area Hazardous Materials Storage 09540012 ON 115,803 44,970
DND Aerodrome - West of Runway 18-36 07930004 QC 33,720 5,951
DND Alert B-145 Cat House 20247019 NU 15,470 2,730
DND Alert Baker's Dozen 20247035 NU 14,705 2,595
DND AMDU Landfill Site 09540010 ON 190,644 33,643
DND Amherst Rifle Range (5403) - Range Firing Pits, Butt Stops 03186001 NS 13,586 2,398
DND Anglin's Bay 00024837 ON 159,571 28,160
DND Atmosphere Simulation (Former Dump), DRDC - South 29757003 QC 98,444 17,372
DND Building 151 Area 09540007 ON 332,999 58,765
DND Cadet Camp Landfill & Firing Range 00008347 ON 159,914 28,220
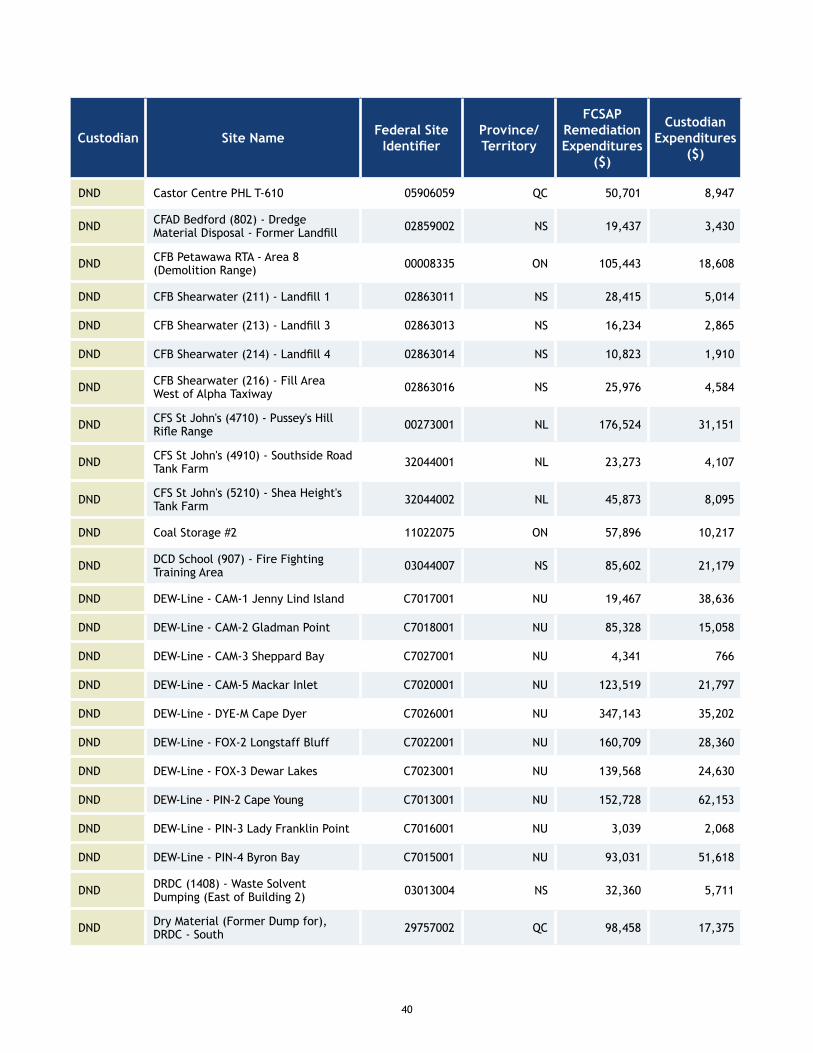
40
Custodian Site Name Federal Site Identifier
Province/ Territory
FCSAP Remediation Expenditures
($)
Custodian Expenditures
($)
DND Castor Centre PHL T-610 05906059 QC 50,701 8,947
DND CFAD Bedford (802) - Dredge Material Disposal - Former Landfill 02859002 NS 19,437 3,430
DND CFB Petawawa RTA - Area 8 (Demolition Range) 00008335 ON 105,443 18,608
DND CFB Shearwater (211) - Landfill 1 02863011 NS 28,415 5,014
DND CFB Shearwater (213) - Landfill 3 02863013 NS 16,234 2,865
DND CFB Shearwater (214) - Landfill 4 02863014 NS 10,823 1,910
DND CFB Shearwater (216) - Fill Area West of Alpha Taxiway 02863016 NS 25,976 4,584
DND CFS St John's (4710) - Pussey's Hill Rifle Range 00273001 NL 176,524 31,151
DND CFS St John's (4910) - Southside Road Tank Farm 32044001 NL 23,273 4,107
DND CFS St John's (5210) - Shea Height's Tank Farm 32044002 NL 45,873 8,095
DND Coal Storage #2 11022075 ON 57,896 10,217
DND DCD School (907) - Fire Fighting Training Area 03044007 NS 85,602 21,179
DND DEW-Line - CAM-1 Jenny Lind Island C7017001 NU 19,467 38,636
DND DEW-Line - CAM-2 Gladman Point C7018001 NU 85,328 15,058
DND DEW-Line - CAM-3 Sheppard Bay C7027001 NU 4,341 766
DND DEW-Line - CAM-5 Mackar Inlet C7020001 NU 123,519 21,797
DND DEW-Line - DYE-M Cape Dyer C7026001 NU 347,143 35,202
DND DEW-Line - FOx-2 Longstaff Bluff C7022001 NU 160,709 28,360
DND DEW-Line - FOx-3 Dewar Lakes C7023001 NU 139,568 24,630
DND DEW-Line - PIN-2 Cape Young C7013001 NU 152,728 62,153
DND DEW-Line - PIN-3 Lady Franklin Point C7016001 NU 3,039 2,068
DND DEW-Line - PIN-4 Byron Bay C7015001 NU 93,031 51,618
DND DRDC (1408) - Waste Solvent Dumping (East of Building 2) 03013004 NS 32,360 5,711
DND Dry Material (Former Dump for), DRDC - South 29757002 QC 98,458 17,375
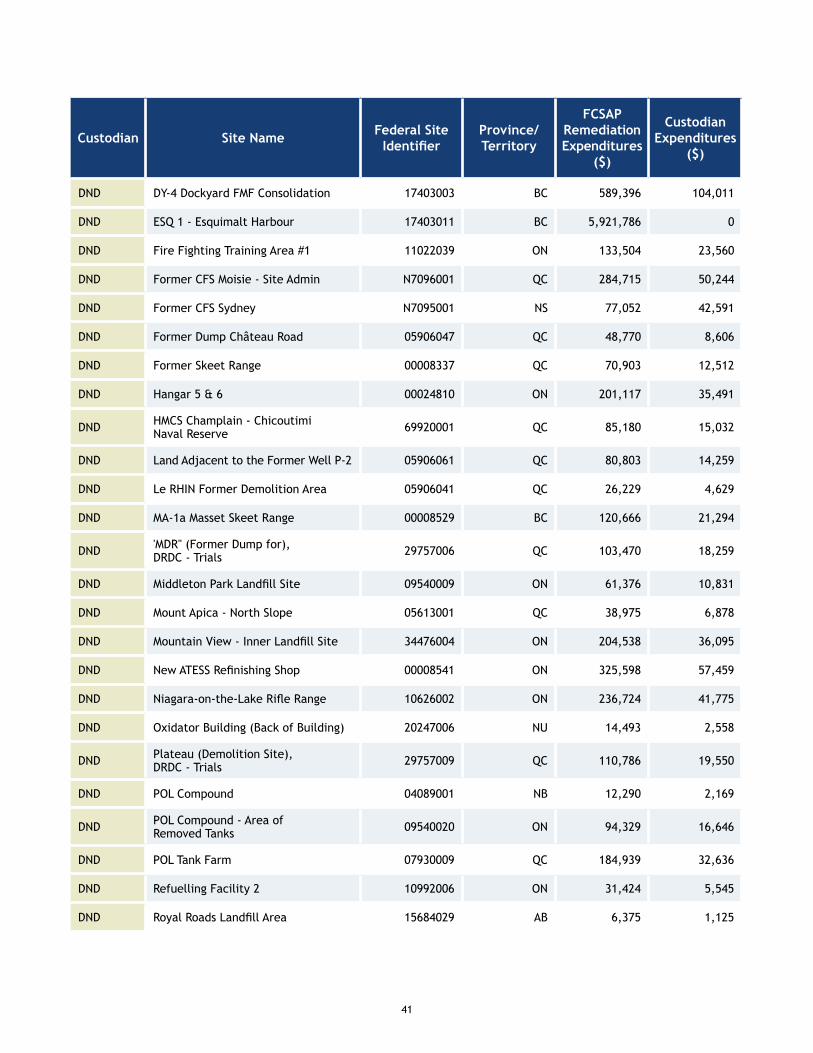
41
Custodian Site Name Federal Site Identifier
Province/ Territory
FCSAP Remediation Expenditures
($)
Custodian Expenditures
($)
DND DY-4 Dockyard FMF Consolidation 17403003 BC 589,396 104,011
DND ESQ 1 - Esquimalt Harbour 17403011 BC 5,921,786 0
DND Fire Fighting Training Area #1 11022039 ON 133,504 23,560
DND Former CFS Moisie - Site Admin N7096001 QC 284,715 50,244
DND Former CFS Sydney N7095001 NS 77,052 42,591
DND Former Dump Château Road 05906047 QC 48,770 8,606
DND Former Skeet Range 00008337 QC 70,903 12,512
DND Hangar 5 & 6 00024810 ON 201,117 35,491
DND HMCS Champlain - Chicoutimi Naval Reserve 69920001 QC 85,180 15,032
DND Land Adjacent to the Former Well P-2 05906061 QC 80,803 14,259
DND Le RHIN Former Demolition Area 05906041 QC 26,229 4,629
DND MA-1a Masset Skeet Range 00008529 BC 120,666 21,294
DND 'MDR'' (Former Dump for), DRDC - Trials 29757006 QC 103,470 18,259
DND Middleton Park Landfill Site 09540009 ON 61,376 10,831
DND Mount Apica - North Slope 05613001 QC 38,975 6,878
DND Mountain View - Inner Landfill Site 34476004 ON 204,538 36,095
DND New ATESS Refinishing Shop 00008541 ON 325,598 57,459
DND Niagara-on-the-Lake Rifle Range 10626002 ON 236,724 41,775
DND Oxidator Building (Back of Building) 20247006 NU 14,493 2,558
DND Plateau (Demolition Site), DRDC - Trials 29757009 QC 110,786 19,550
DND POL Compound 04089001 NB 12,290 2,169
DND POL Compound - Area of Removed Tanks 09540020 ON 94,329 16,646
DND POL Tank Farm 07930009 QC 184,939 32,636
DND Refuelling Facility 2 10992006 ON 31,424 5,545
DND Royal Roads Landfill Area 15684029 AB 6,375 1,125
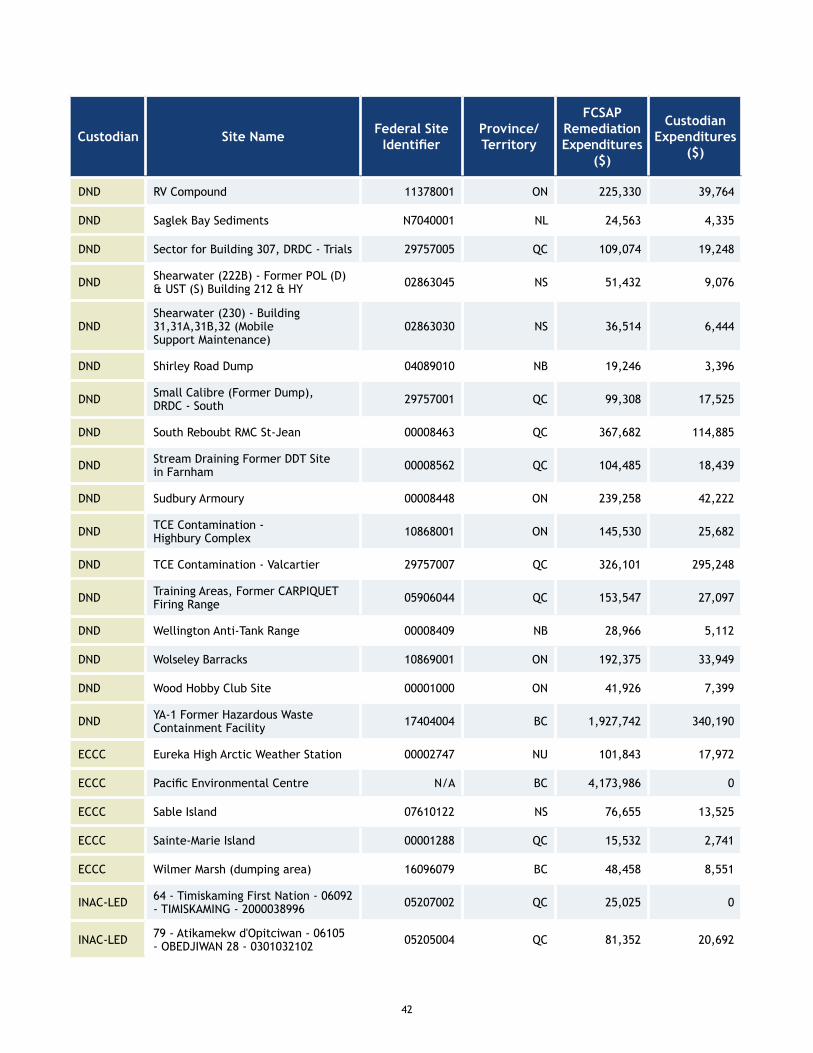
42
Custodian Site Name Federal Site Identifier
Province/ Territory
FCSAP Remediation Expenditures
($)
Custodian Expenditures
($)
DND RV Compound 11378001 ON 225,330 39,764
DND Saglek Bay Sediments N7040001 NL 24,563 4,335
DND Sector for Building 307, DRDC - Trials 29757005 QC 109,074 19,248
DND Shearwater (222B) - Former POL (D) & UST (S) Building 212 & HY 02863045 NS 51,432 9,076
DNDShearwater (230) - Building 31,31A,31B,32 (Mobile Support Maintenance)
02863030 NS 36,514 6,444
DND Shirley Road Dump 04089010 NB 19,246 3,396
DND Small Calibre (Former Dump), DRDC - South 29757001 QC 99,308 17,525
DND South Reboubt RMC St-Jean 00008463 QC 367,682 114,885
DND Stream Draining Former DDT Site in Farnham 00008562 QC 104,485 18,439
DND Sudbury Armoury 00008448 ON 239,258 42,222
DND TCE Contamination - Highbury Complex 10868001 ON 145,530 25,682
DND TCE Contamination - Valcartier 29757007 QC 326,101 295,248
DND Training Areas, Former CARPIQUET Firing Range 05906044 QC 153,547 27,097
DND Wellington Anti-Tank Range 00008409 NB 28,966 5,112
DND Wolseley Barracks 10869001 ON 192,375 33,949
DND Wood Hobby Club Site 00001000 ON 41,926 7,399
DND YA-1 Former Hazardous Waste Containment Facility 17404004 BC 1,927,742 340,190
ECCC Eureka High Arctic Weather Station 00002747 NU 101,843 17,972
ECCC Pacific Environmental Centre N/A BC 4,173,986 0
ECCC Sable Island 07610122 NS 76,655 13,525
ECCC Sainte-Marie Island 00001288 QC 15,532 2,741
ECCC Wilmer Marsh (dumping area) 16096079 BC 48,458 8,551
INAC-LED 64 - Timiskaming First Nation - 06092 - TIMISKAMING - 2000038996 05207002 QC 25,025 0
INAC-LED 79 - Atikamekw d'Opitciwan - 06105 - OBEDJIWAN 28 - 0301032102 05205004 QC 81,352 20,692
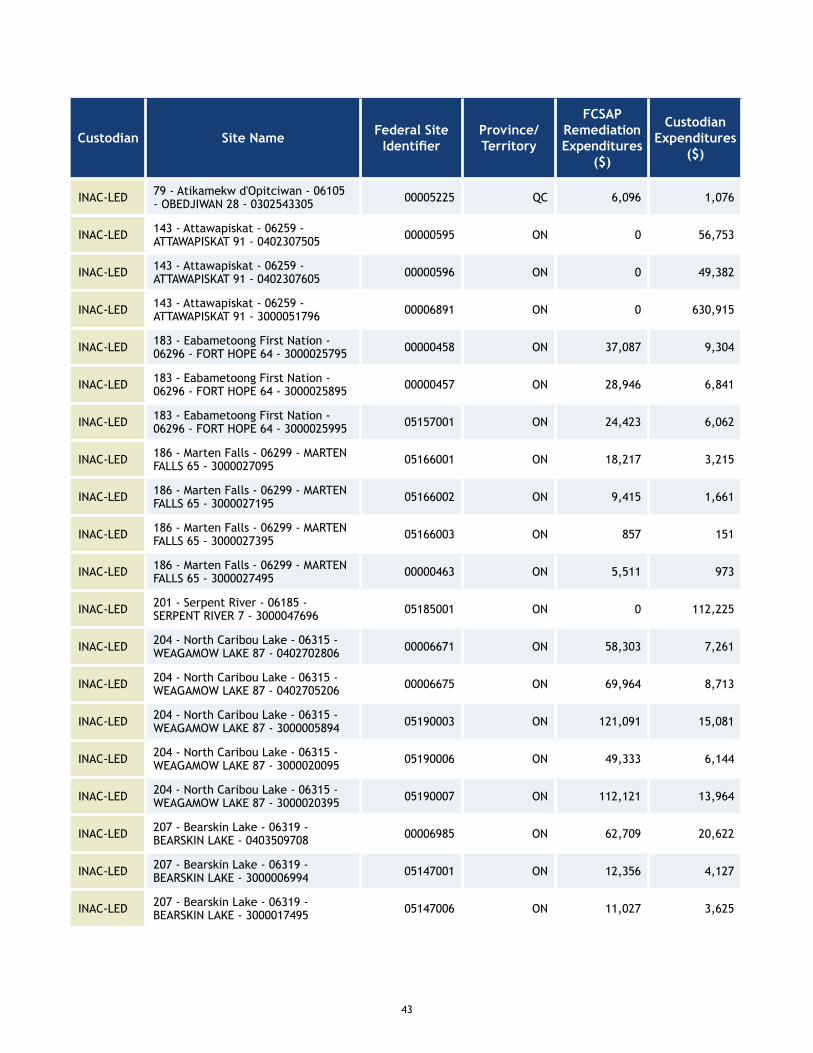
43
Custodian Site Name Federal Site Identifier
Province/ Territory
FCSAP Remediation Expenditures
($)
Custodian Expenditures
($)
INAC-LED 79 - Atikamekw d'Opitciwan - 06105 - OBEDJIWAN 28 - 0302543305 00005225 QC 6,096 1,076
INAC-LED 143 - Attawapiskat - 06259 - ATTAWAPISKAT 91 - 0402307505 00000595 ON 0 56,753
INAC-LED 143 - Attawapiskat - 06259 - ATTAWAPISKAT 91 - 0402307605 00000596 ON 0 49,382
INAC-LED 143 - Attawapiskat - 06259 - ATTAWAPISKAT 91 - 3000051796 00006891 ON 0 630,915
INAC-LED 183 - Eabametoong First Nation - 06296 - FORT HOPE 64 - 3000025795 00000458 ON 37,087 9,304
INAC-LED 183 - Eabametoong First Nation - 06296 - FORT HOPE 64 - 3000025895 00000457 ON 28,946 6,841
INAC-LED 183 - Eabametoong First Nation - 06296 - FORT HOPE 64 - 3000025995 05157001 ON 24,423 6,062
INAC-LED 186 - Marten Falls - 06299 - MARTEN FALLS 65 - 3000027095 05166001 ON 18,217 3,215
INAC-LED 186 - Marten Falls - 06299 - MARTEN FALLS 65 - 3000027195 05166002 ON 9,415 1,661
INAC-LED 186 - Marten Falls - 06299 - MARTEN FALLS 65 - 3000027395 05166003 ON 857 151
INAC-LED 186 - Marten Falls - 06299 - MARTEN FALLS 65 - 3000027495 00000463 ON 5,511 973
INAC-LED 201 - Serpent River - 06185 - SERPENT RIVER 7 - 3000047696 05185001 ON 0 112,225
INAC-LED 204 - North Caribou Lake - 06315 - WEAGAMOW LAKE 87 - 0402702806 00006671 ON 58,303 7,261
INAC-LED 204 - North Caribou Lake - 06315 - WEAGAMOW LAKE 87 - 0402705206 00006675 ON 69,964 8,713
INAC-LED 204 - North Caribou Lake - 06315 - WEAGAMOW LAKE 87 - 3000005894 05190003 ON 121,091 15,081
INAC-LED 204 - North Caribou Lake - 06315 - WEAGAMOW LAKE 87 - 3000020095 05190006 ON 49,333 6,144
INAC-LED 204 - North Caribou Lake - 06315 - WEAGAMOW LAKE 87 - 3000020395 05190007 ON 112,121 13,964
INAC-LED 207 - Bearskin Lake - 06319 - BEARSKIN LAKE - 0403509708 00006985 ON 62,709 20,622
INAC-LED 207 - Bearskin Lake - 06319 - BEARSKIN LAKE - 3000006994 05147001 ON 12,356 4,127
INAC-LED 207 - Bearskin Lake - 06319 - BEARSKIN LAKE - 3000017495 05147006 ON 11,027 3,625
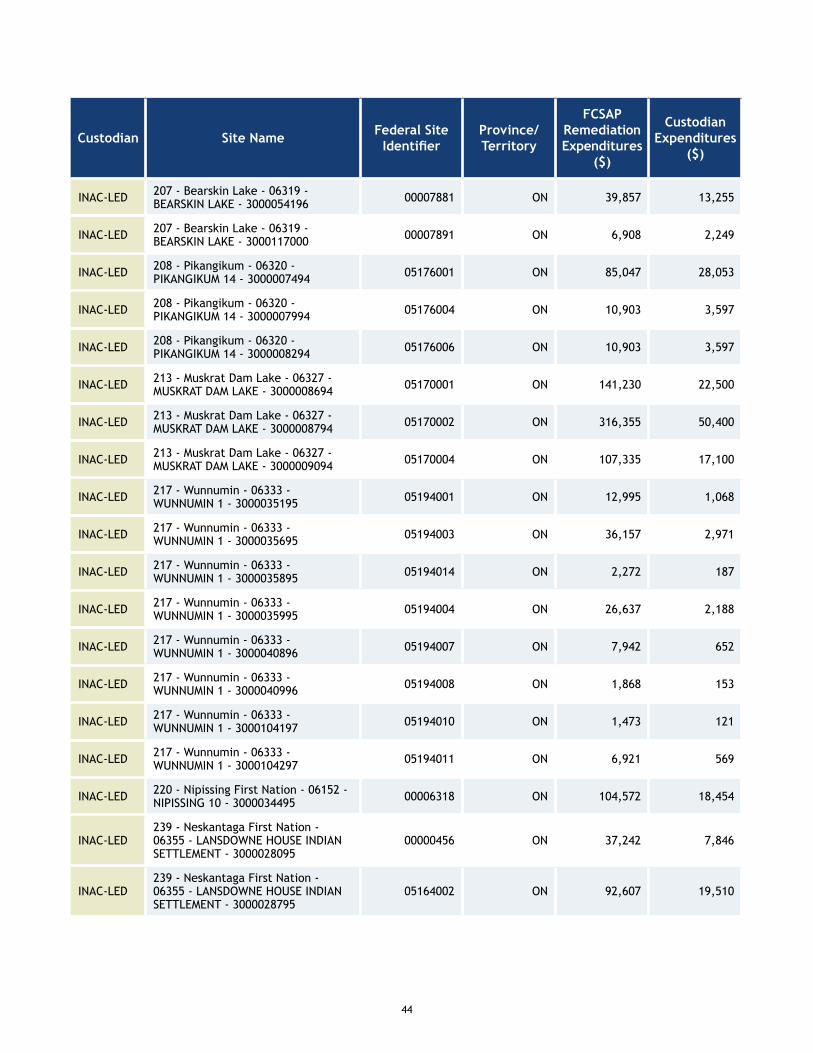
44
Custodian Site Name Federal Site Identifier
Province/ Territory
FCSAP Remediation Expenditures
($)
Custodian Expenditures
($)
INAC-LED 207 - Bearskin Lake - 06319 - BEARSKIN LAKE - 3000054196 00007881 ON 39,857 13,255
INAC-LED 207 - Bearskin Lake - 06319 - BEARSKIN LAKE - 3000117000 00007891 ON 6,908 2,249
INAC-LED 208 - Pikangikum - 06320 - PIKANGIKUM 14 - 3000007494 05176001 ON 85,047 28,053
INAC-LED 208 - Pikangikum - 06320 - PIKANGIKUM 14 - 3000007994 05176004 ON 10,903 3,597
INAC-LED 208 - Pikangikum - 06320 - PIKANGIKUM 14 - 3000008294 05176006 ON 10,903 3,597
INAC-LED 213 - Muskrat Dam Lake - 06327 - MUSKRAT DAM LAKE - 3000008694 05170001 ON 141,230 22,500
INAC-LED 213 - Muskrat Dam Lake - 06327 - MUSKRAT DAM LAKE - 3000008794 05170002 ON 316,355 50,400
INAC-LED 213 - Muskrat Dam Lake - 06327 - MUSKRAT DAM LAKE - 3000009094 05170004 ON 107,335 17,100
INAC-LED 217 - Wunnumin - 06333 - WUNNUMIN 1 - 3000035195 05194001 ON 12,995 1,068
INAC-LED 217 - Wunnumin - 06333 - WUNNUMIN 1 - 3000035695 05194003 ON 36,157 2,971
INAC-LED 217 - Wunnumin - 06333 - WUNNUMIN 1 - 3000035895 05194014 ON 2,272 187
INAC-LED 217 - Wunnumin - 06333 - WUNNUMIN 1 - 3000035995 05194004 ON 26,637 2,188
INAC-LED 217 - Wunnumin - 06333 - WUNNUMIN 1 - 3000040896 05194007 ON 7,942 652
INAC-LED 217 - Wunnumin - 06333 - WUNNUMIN 1 - 3000040996 05194008 ON 1,868 153
INAC-LED 217 - Wunnumin - 06333 - WUNNUMIN 1 - 3000104197 05194010 ON 1,473 121
INAC-LED 217 - Wunnumin - 06333 - WUNNUMIN 1 - 3000104297 05194011 ON 6,921 569
INAC-LED 220 - Nipissing First Nation - 06152 - NIPISSING 10 - 3000034495 00006318 ON 104,572 18,454
INAC-LED239 - Neskantaga First Nation - 06355 - LANSDOWNE HOUSE INDIAN SETTLEMENT - 3000028095
00000456 ON 37,242 7,846
INAC-LED239 - Neskantaga First Nation - 06355 - LANSDOWNE HOUSE INDIAN SETTLEMENT - 3000028795
05164002 ON 92,607 19,510
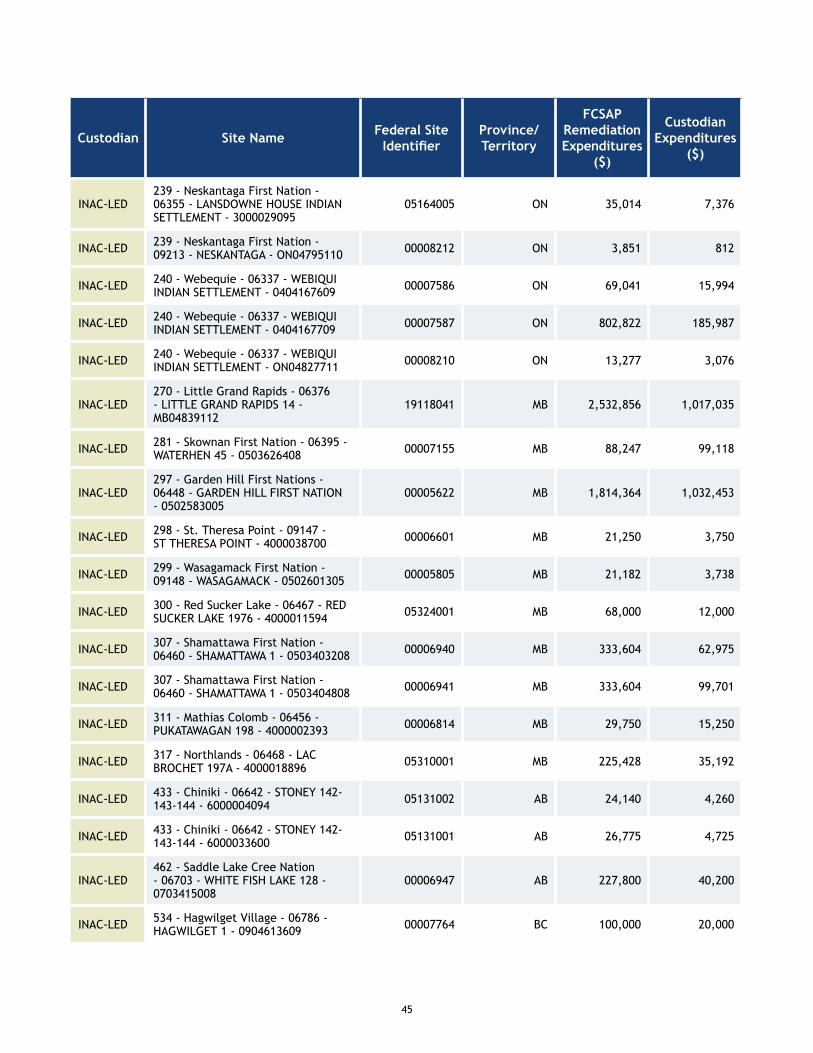
45
Custodian Site Name Federal Site Identifier
Province/ Territory
FCSAP Remediation Expenditures
($)
Custodian Expenditures
($)
INAC-LED239 - Neskantaga First Nation - 06355 - LANSDOWNE HOUSE INDIAN SETTLEMENT - 3000029095
05164005 ON 35,014 7,376
INAC-LED 239 - Neskantaga First Nation - 09213 - NESKANTAGA - ON04795110 00008212 ON 3,851 812
INAC-LED 240 - Webequie - 06337 - WEBIQUI INDIAN SETTLEMENT - 0404167609 00007586 ON 69,041 15,994
INAC-LED 240 - Webequie - 06337 - WEBIQUI INDIAN SETTLEMENT - 0404167709 00007587 ON 802,822 185,987
INAC-LED 240 - Webequie - 06337 - WEBIQUI INDIAN SETTLEMENT - ON04827711 00008210 ON 13,277 3,076
INAC-LED270 - Little Grand Rapids - 06376 - LITTLE GRAND RAPIDS 14 - MB04839112
19118041 MB 2,532,856 1,017,035
INAC-LED 281 - Skownan First Nation - 06395 - WATERHEN 45 - 0503626408 00007155 MB 88,247 99,118
INAC-LED297 - Garden Hill First Nations - 06448 - GARDEN HILL FIRST NATION - 0502583005
00005622 MB 1,814,364 1,032,453
INAC-LED 298 - St. Theresa Point - 09147 - ST THERESA POINT - 4000038700 00006601 MB 21,250 3,750
INAC-LED 299 - Wasagamack First Nation - 09148 - WASAGAMACK - 0502601305 00005805 MB 21,182 3,738
INAC-LED 300 - Red Sucker Lake - 06467 - RED SUCKER LAKE 1976 - 4000011594 05324001 MB 68,000 12,000
INAC-LED 307 - Shamattawa First Nation - 06460 - SHAMATTAWA 1 - 0503403208 00006940 MB 333,604 62,975
INAC-LED 307 - Shamattawa First Nation - 06460 - SHAMATTAWA 1 - 0503404808 00006941 MB 333,604 99,701
INAC-LED 311 - Mathias Colomb - 06456 - PUKATAWAGAN 198 - 4000002393 00006814 MB 29,750 15,250
INAC-LED 317 - Northlands - 06468 - LAC BROCHET 197A - 4000018896 05310001 MB 225,428 35,192
INAC-LED 433 - Chiniki - 06642 - STONEY 142-143-144 - 6000004094 05131002 AB 24,140 4,260
INAC-LED 433 - Chiniki - 06642 - STONEY 142-143-144 - 6000033600 05131001 AB 26,775 4,725
INAC-LED462 - Saddle Lake Cree Nation - 06703 - WHITE FISH LAKE 128 - 0703415008
00006947 AB 227,800 40,200
INAC-LED 534 - Hagwilget Village - 06786 - HAGWILGET 1 - 0904613609 00007764 BC 100,000 20,000
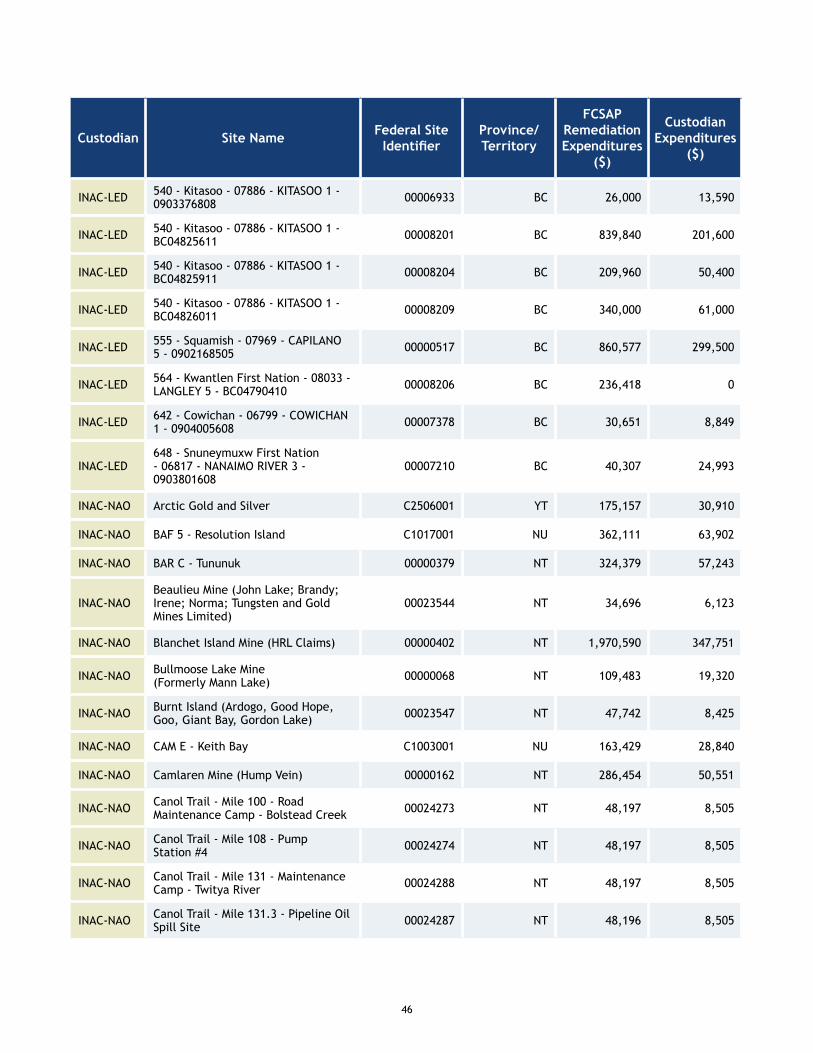
46
Custodian Site Name Federal Site Identifier
Province/ Territory
FCSAP Remediation Expenditures
($)
Custodian Expenditures
($)
INAC-LED 540 - Kitasoo - 07886 - KITASOO 1 - 0903376808 00006933 BC 26,000 13,590
INAC-LED 540 - Kitasoo - 07886 - KITASOO 1 - BC04825611 00008201 BC 839,840 201,600
INAC-LED 540 - Kitasoo - 07886 - KITASOO 1 - BC04825911 00008204 BC 209,960 50,400
INAC-LED 540 - Kitasoo - 07886 - KITASOO 1 - BC04826011 00008209 BC 340,000 61,000
INAC-LED 555 - Squamish - 07969 - CAPILANO 5 - 0902168505 00000517 BC 860,577 299,500
INAC-LED 564 - Kwantlen First Nation - 08033 - LANGLEY 5 - BC04790410 00008206 BC 236,418 0
INAC-LED 642 - Cowichan - 06799 - COWICHAN 1 - 0904005608 00007378 BC 30,651 8,849
INAC-LED648 - Snuneymuxw First Nation - 06817 - NANAIMO RIVER 3 - 0903801608
00007210 BC 40,307 24,993
INAC-NAO Arctic Gold and Silver C2506001 YT 175,157 30,910
INAC-NAO BAF 5 - Resolution Island C1017001 NU 362,111 63,902
INAC-NAO BAR C - Tununuk 00000379 NT 324,379 57,243
INAC-NAOBeaulieu Mine (John Lake; Brandy; Irene; Norma; Tungsten and Gold Mines Limited)
00023544 NT 34,696 6,123
INAC-NAO Blanchet Island Mine (HRL Claims) 00000402 NT 1,970,590 347,751
INAC-NAO Bullmoose Lake Mine (Formerly Mann Lake) 00000068 NT 109,483 19,320
INAC-NAO Burnt Island (Ardogo, Good Hope, Goo, Giant Bay, Gordon Lake) 00023547 NT 47,742 8,425
INAC-NAO CAM E - Keith Bay C1003001 NU 163,429 28,840
INAC-NAO Camlaren Mine (Hump Vein) 00000162 NT 286,454 50,551
INAC-NAO Canol Trail - Mile 100 - Road Maintenance Camp - Bolstead Creek 00024273 NT 48,197 8,505
INAC-NAO Canol Trail - Mile 108 - Pump Station #4 00024274 NT 48,197 8,505
INAC-NAO Canol Trail - Mile 131 - Maintenance Camp - Twitya River 00024288 NT 48,197 8,505
INAC-NAO Canol Trail - Mile 131.3 - Pipeline Oil Spill Site 00024287 NT 48,196 8,505
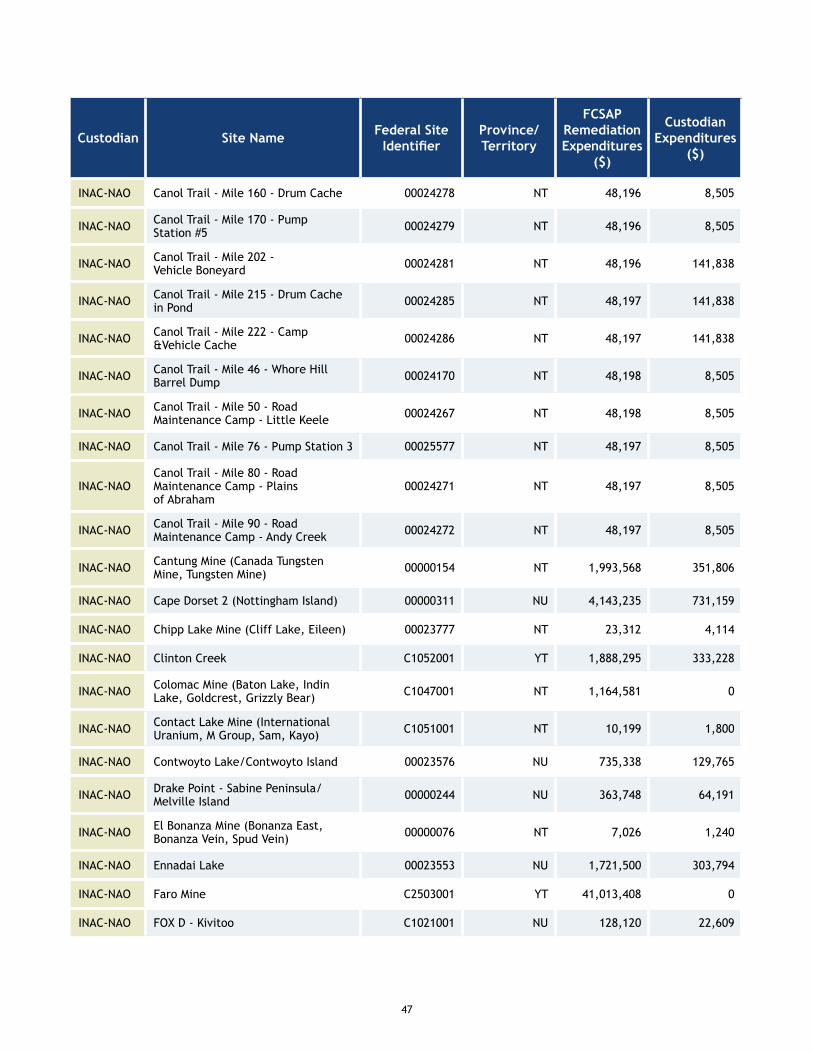
47
Custodian Site Name Federal Site Identifier
Province/ Territory
FCSAP Remediation Expenditures
($)
Custodian Expenditures
($)
INAC-NAO Canol Trail - Mile 160 - Drum Cache 00024278 NT 48,196 8,505
INAC-NAO Canol Trail - Mile 170 - Pump Station #5 00024279 NT 48,196 8,505
INAC-NAO Canol Trail - Mile 202 - Vehicle Boneyard 00024281 NT 48,196 141,838
INAC-NAO Canol Trail - Mile 215 - Drum Cache in Pond 00024285 NT 48,197 141,838
INAC-NAO Canol Trail - Mile 222 - Camp &Vehicle Cache 00024286 NT 48,197 141,838
INAC-NAO Canol Trail - Mile 46 - Whore Hill Barrel Dump 00024170 NT 48,198 8,505
INAC-NAO Canol Trail - Mile 50 - Road Maintenance Camp - Little Keele 00024267 NT 48,198 8,505
INAC-NAO Canol Trail - Mile 76 - Pump Station 3 00025577 NT 48,197 8,505
INAC-NAOCanol Trail - Mile 80 - Road Maintenance Camp - Plains of Abraham
00024271 NT 48,197 8,505
INAC-NAO Canol Trail - Mile 90 - Road Maintenance Camp - Andy Creek 00024272 NT 48,197 8,505
INAC-NAO Cantung Mine (Canada Tungsten Mine, Tungsten Mine) 00000154 NT 1,993,568 351,806
INAC-NAO Cape Dorset 2 (Nottingham Island) 00000311 NU 4,143,235 731,159
INAC-NAO Chipp Lake Mine (Cliff Lake, Eileen) 00023777 NT 23,312 4,114
INAC-NAO Clinton Creek C1052001 YT 1,888,295 333,228
INAC-NAO Colomac Mine (Baton Lake, Indin Lake, Goldcrest, Grizzly Bear) C1047001 NT 1,164,581 0
INAC-NAO Contact Lake Mine (International Uranium, M Group, Sam, Kayo) C1051001 NT 10,199 1,800
INAC-NAO Contwoyto Lake/Contwoyto Island 00023576 NU 735,338 129,765
INAC-NAO Drake Point - Sabine Peninsula/Melville Island 00000244 NU 363,748 64,191
INAC-NAO El Bonanza Mine (Bonanza East, Bonanza Vein, Spud Vein) 00000076 NT 7,026 1,240
INAC-NAO Ennadai Lake 00023553 NU 1,721,500 303,794
INAC-NAO Faro Mine C2503001 YT 41,013,408 0
INAC-NAO FOx D - Kivitoo C1021001 NU 128,120 22,609
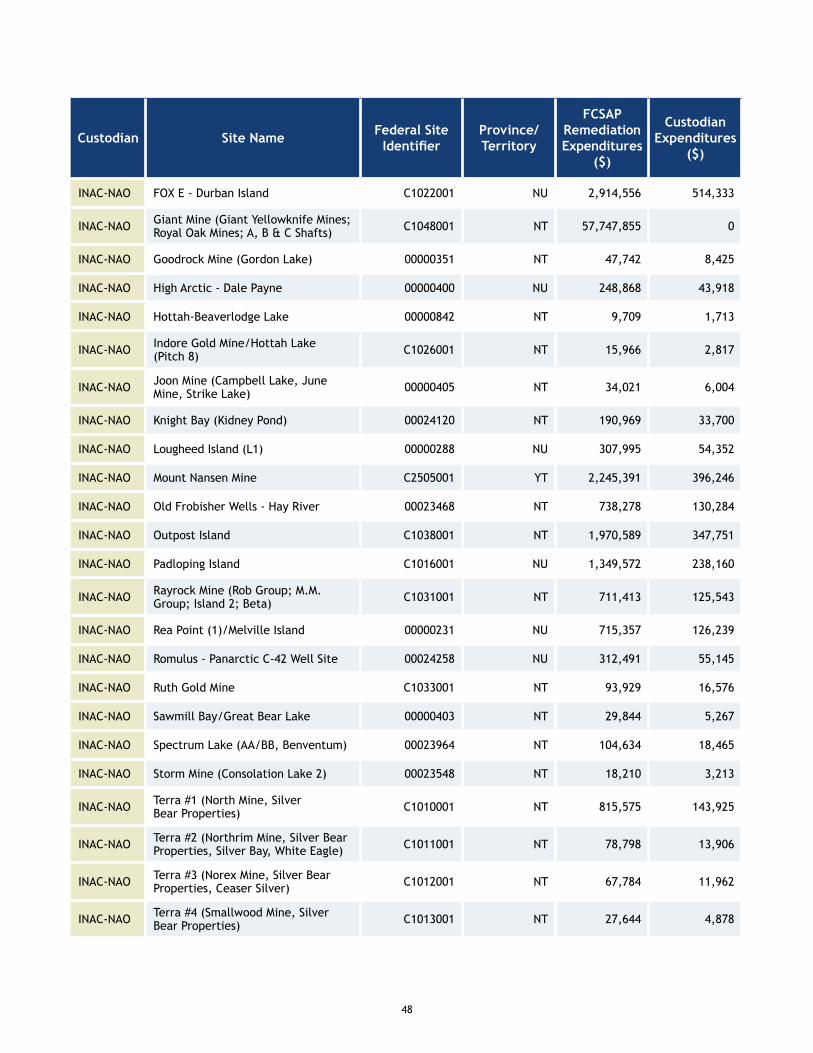
48
Custodian Site Name Federal Site Identifier
Province/ Territory
FCSAP Remediation Expenditures
($)
Custodian Expenditures
($)
INAC-NAO FOx E - Durban Island C1022001 NU 2,914,556 514,333
INAC-NAO Giant Mine (Giant Yellowknife Mines; Royal Oak Mines; A, B & C Shafts) C1048001 NT 57,747,855 0
INAC-NAO Goodrock Mine (Gordon Lake) 00000351 NT 47,742 8,425
INAC-NAO High Arctic - Dale Payne 00000400 NU 248,868 43,918
INAC-NAO Hottah-Beaverlodge Lake 00000842 NT 9,709 1,713
INAC-NAO Indore Gold Mine/Hottah Lake (Pitch 8) C1026001 NT 15,966 2,817
INAC-NAO Joon Mine (Campbell Lake, June Mine, Strike Lake) 00000405 NT 34,021 6,004
INAC-NAO Knight Bay (Kidney Pond) 00024120 NT 190,969 33,700
INAC-NAO Lougheed Island (L1) 00000288 NU 307,995 54,352
INAC-NAO Mount Nansen Mine C2505001 YT 2,245,391 396,246
INAC-NAO Old Frobisher Wells - Hay River 00023468 NT 738,278 130,284
INAC-NAO Outpost Island C1038001 NT 1,970,589 347,751
INAC-NAO Padloping Island C1016001 NU 1,349,572 238,160
INAC-NAO Rayrock Mine (Rob Group; M.M. Group; Island 2; Beta) C1031001 NT 711,413 125,543
INAC-NAO Rea Point (1)/Melville Island 00000231 NU 715,357 126,239
INAC-NAO Romulus - Panarctic C-42 Well Site 00024258 NU 312,491 55,145
INAC-NAO Ruth Gold Mine C1033001 NT 93,929 16,576
INAC-NAO Sawmill Bay/Great Bear Lake 00000403 NT 29,844 5,267
INAC-NAO Spectrum Lake (AA/BB, Benventum) 00023964 NT 104,634 18,465
INAC-NAO Storm Mine (Consolation Lake 2) 00023548 NT 18,210 3,213
INAC-NAO Terra #1 (North Mine, Silver Bear Properties) C1010001 NT 815,575 143,925
INAC-NAO Terra #2 (Northrim Mine, Silver Bear Properties, Silver Bay, White Eagle) C1011001 NT 78,798 13,906
INAC-NAO Terra #3 (Norex Mine, Silver Bear Properties, Ceaser Silver) C1012001 NT 67,784 11,962
INAC-NAO Terra #4 (Smallwood Mine, Silver Bear Properties) C1013001 NT 27,644 4,878
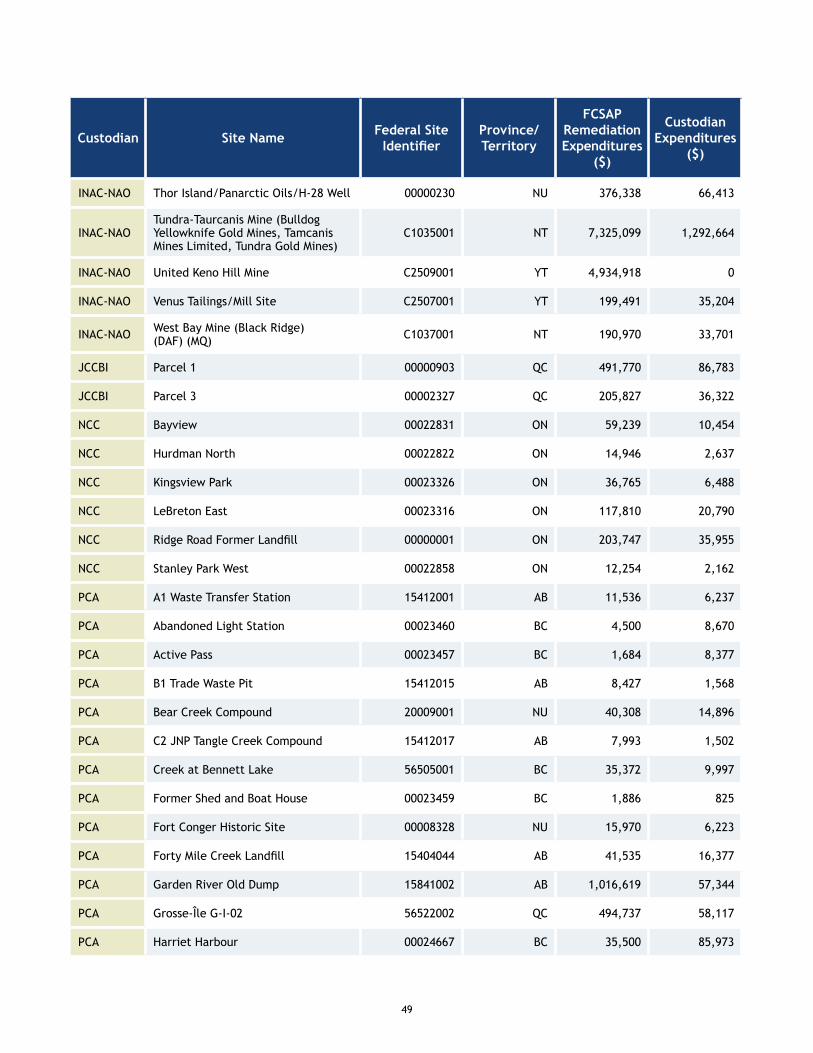
49
Custodian Site Name Federal Site Identifier
Province/ Territory
FCSAP Remediation Expenditures
($)
Custodian Expenditures
($)
INAC-NAO Thor Island/Panarctic Oils/H-28 Well 00000230 NU 376,338 66,413
INAC-NAOTundra-Taurcanis Mine (Bulldog Yellowknife Gold Mines, Tamcanis Mines Limited, Tundra Gold Mines)
C1035001 NT 7,325,099 1,292,664
INAC-NAO United Keno Hill Mine C2509001 YT 4,934,918 0
INAC-NAO Venus Tailings/Mill Site C2507001 YT 199,491 35,204
INAC-NAO West Bay Mine (Black Ridge) (DAF) (MQ) C1037001 NT 190,970 33,701
JCCBI Parcel 1 00000903 QC 491,770 86,783
JCCBI Parcel 3 00002327 QC 205,827 36,322
NCC Bayview 00022831 ON 59,239 10,454
NCC Hurdman North 00022822 ON 14,946 2,637
NCC Kingsview Park 00023326 ON 36,765 6,488
NCC LeBreton East 00023316 ON 117,810 20,790
NCC Ridge Road Former Landfill 00000001 ON 203,747 35,955
NCC Stanley Park West 00022858 ON 12,254 2,162
PCA A1 Waste Transfer Station 15412001 AB 11,536 6,237
PCA Abandoned Light Station 00023460 BC 4,500 8,670
PCA Active Pass 00023457 BC 1,684 8,377
PCA B1 Trade Waste Pit 15412015 AB 8,427 1,568
PCA Bear Creek Compound 20009001 NU 40,308 14,896
PCA C2 JNP Tangle Creek Compound 15412017 AB 7,993 1,502
PCA Creek at Bennett Lake 56505001 BC 35,372 9,997
PCA Former Shed and Boat House 00023459 BC 1,886 825
PCA Fort Conger Historic Site 00008328 NU 15,970 6,223
PCA Forty Mile Creek Landfill 15404044 AB 41,535 16,377
PCA Garden River Old Dump 15841002 AB 1,016,619 57,344
PCA Grosse-Île G-I-02 56522002 QC 494,737 58,117
PCA Harriet Harbour 00024667 BC 35,500 85,973
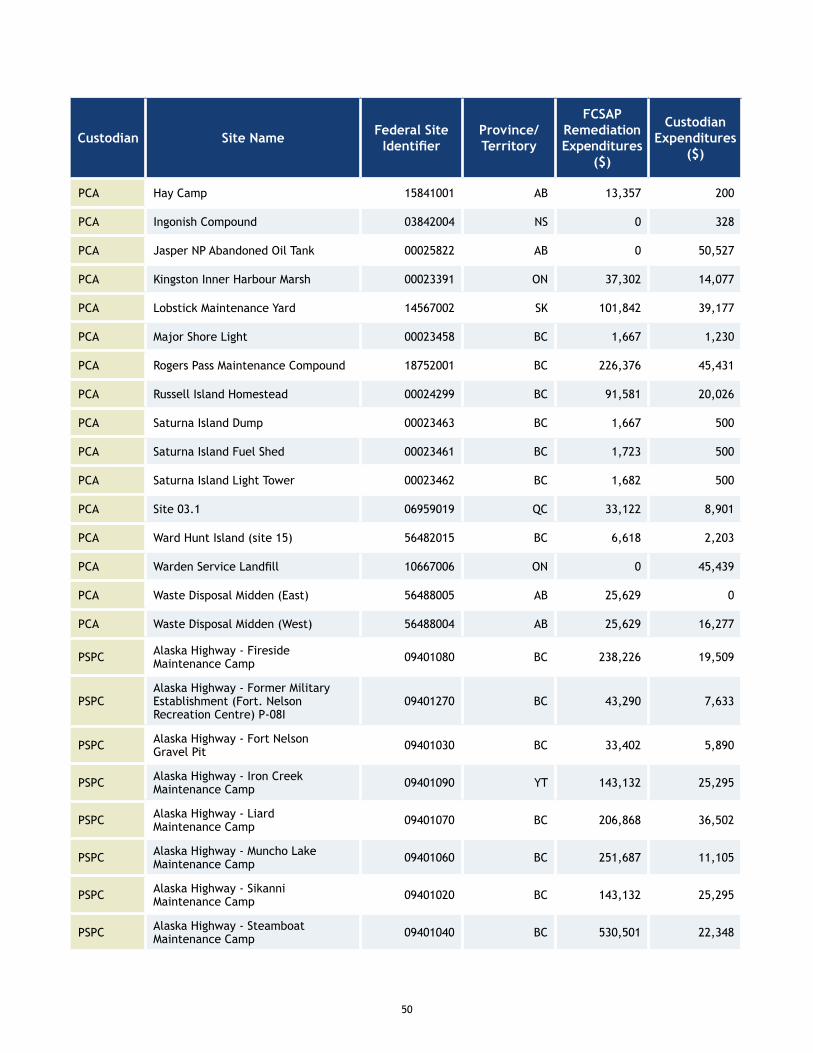
50
Custodian Site Name Federal Site Identifier
Province/ Territory
FCSAP Remediation Expenditures
($)
Custodian Expenditures
($)
PCA Hay Camp 15841001 AB 13,357 200
PCA Ingonish Compound 03842004 NS 0 328
PCA Jasper NP Abandoned Oil Tank 00025822 AB 0 50,527
PCA Kingston Inner Harbour Marsh 00023391 ON 37,302 14,077
PCA Lobstick Maintenance Yard 14567002 SK 101,842 39,177
PCA Major Shore Light 00023458 BC 1,667 1,230
PCA Rogers Pass Maintenance Compound 18752001 BC 226,376 45,431
PCA Russell Island Homestead 00024299 BC 91,581 20,026
PCA Saturna Island Dump 00023463 BC 1,667 500
PCA Saturna Island Fuel Shed 00023461 BC 1,723 500
PCA Saturna Island Light Tower 00023462 BC 1,682 500
PCA Site 03.1 06959019 QC 33,122 8,901
PCA Ward Hunt Island (site 15) 56482015 BC 6,618 2,203
PCA Warden Service Landfill 10667006 ON 0 45,439
PCA Waste Disposal Midden (East) 56488005 AB 25,629 0
PCA Waste Disposal Midden (West) 56488004 AB 25,629 16,277
PSPC Alaska Highway - Fireside Maintenance Camp 09401080 BC 238,226 19,509
PSPCAlaska Highway - Former Military Establishment (Fort. Nelson Recreation Centre) P-08I
09401270 BC 43,290 7,633
PSPC Alaska Highway - Fort Nelson Gravel Pit 09401030 BC 33,402 5,890
PSPC Alaska Highway - Iron Creek Maintenance Camp 09401090 YT 143,132 25,295
PSPC Alaska Highway - Liard Maintenance Camp 09401070 BC 206,868 36,502
PSPC Alaska Highway - Muncho Lake Maintenance Camp 09401060 BC 251,687 11,105
PSPC Alaska Highway - Sikanni Maintenance Camp 09401020 BC 143,132 25,295
PSPC Alaska Highway - Steamboat Maintenance Camp 09401040 BC 530,501 22,348
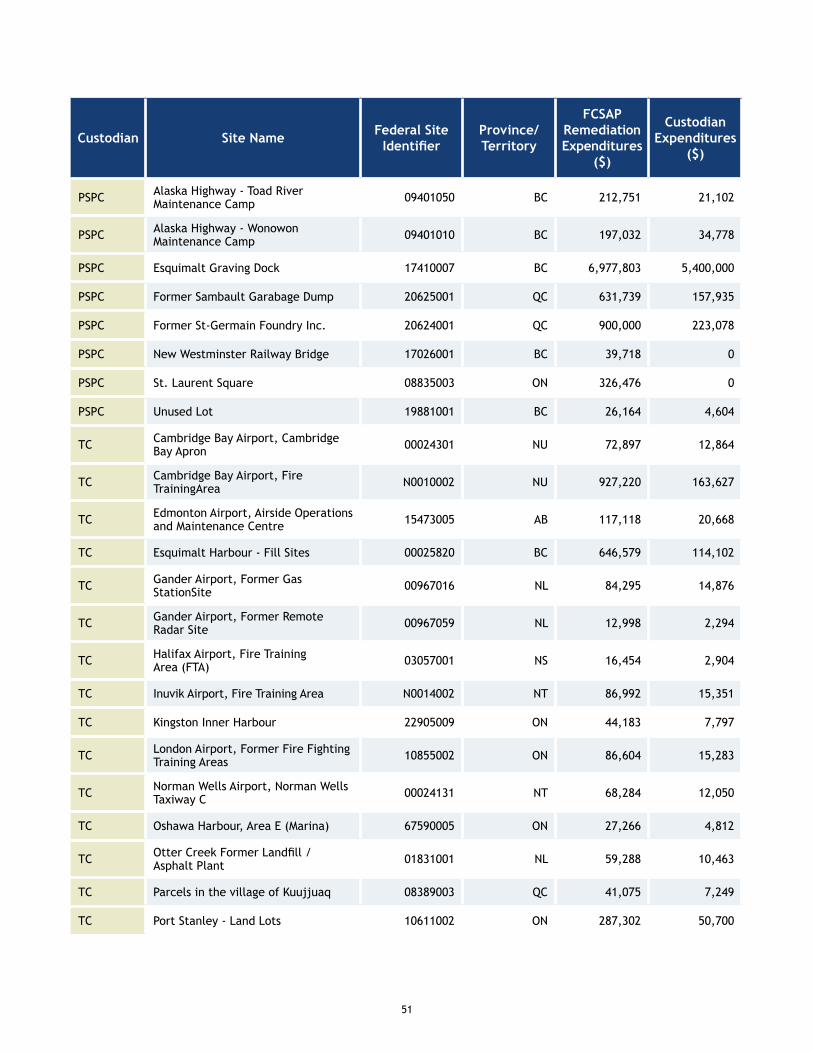
51
Custodian Site Name Federal Site Identifier
Province/ Territory
FCSAP Remediation Expenditures
($)
Custodian Expenditures
($)
PSPC Alaska Highway - Toad River Maintenance Camp 09401050 BC 212,751 21,102
PSPC Alaska Highway - Wonowon Maintenance Camp 09401010 BC 197,032 34,778
PSPC Esquimalt Graving Dock 17410007 BC 6,977,803 5,400,000
PSPC Former Sambault Garabage Dump 20625001 QC 631,739 157,935
PSPC Former St-Germain Foundry Inc. 20624001 QC 900,000 223,078
PSPC New Westminster Railway Bridge 17026001 BC 39,718 0
PSPC St. Laurent Square 08835003 ON 326,476 0
PSPC Unused Lot 19881001 BC 26,164 4,604
TC Cambridge Bay Airport, Cambridge Bay Apron 00024301 NU 72,897 12,864
TC Cambridge Bay Airport, Fire TrainingArea N0010002 NU 927,220 163,627
TC Edmonton Airport, Airside Operations and Maintenance Centre 15473005 AB 117,118 20,668
TC Esquimalt Harbour - Fill Sites 00025820 BC 646,579 114,102
TC Gander Airport, Former Gas StationSite 00967016 NL 84,295 14,876
TC Gander Airport, Former Remote Radar Site 00967059 NL 12,998 2,294
TC Halifax Airport, Fire Training Area (FTA) 03057001 NS 16,454 2,904
TC Inuvik Airport, Fire Training Area N0014002 NT 86,992 15,351
TC Kingston Inner Harbour 22905009 ON 44,183 7,797
TC London Airport, Former Fire Fighting Training Areas 10855002 ON 86,604 15,283
TC Norman Wells Airport, Norman Wells Taxiway C 00024131 NT 68,284 12,050
TC Oshawa Harbour, Area E (Marina) 67590005 ON 27,266 4,812
TC Otter Creek Former Landfill / Asphalt Plant 01831001 NL 59,288 10,463
TC Parcels in the village of Kuujjuaq 08389003 QC 41,075 7,249
TC Port Stanley - Land Lots 10611002 ON 287,302 50,700
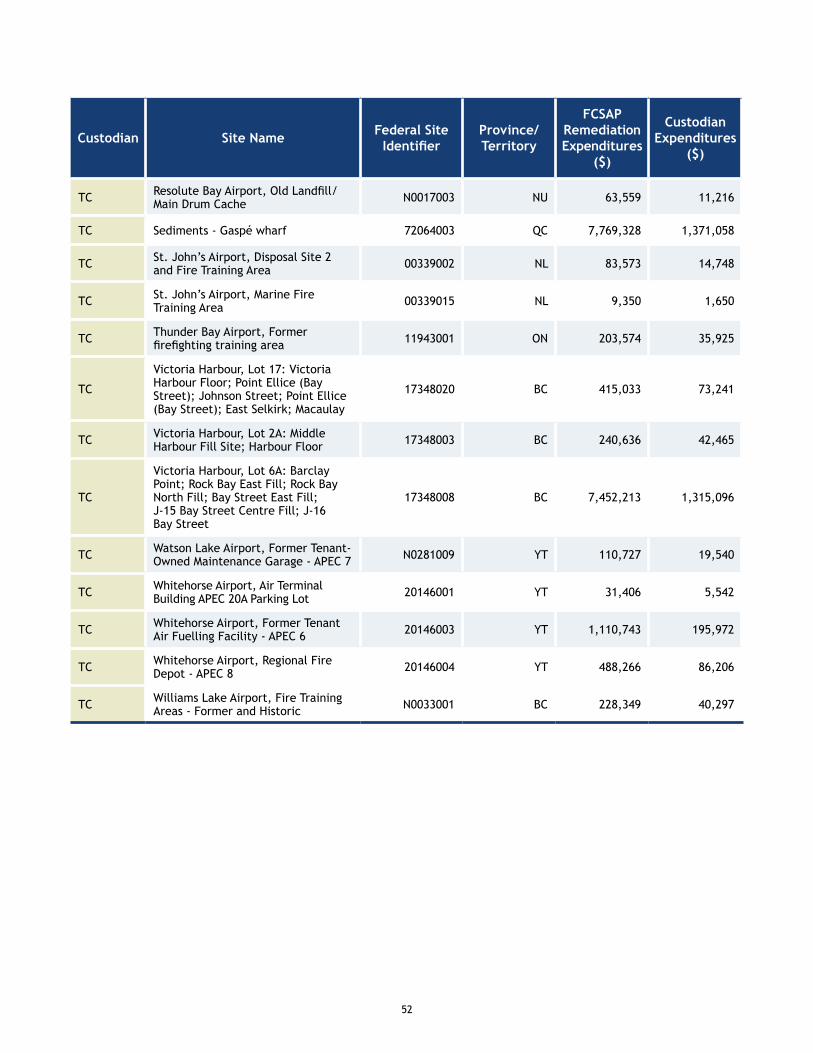
52
Custodian Site Name Federal Site Identifier
Province/ Territory
FCSAP Remediation Expenditures
($)
Custodian Expenditures
($)
TC Resolute Bay Airport, Old Landfill/Main Drum Cache N0017003 NU 63,559 11,216
TC Sediments - Gaspé wharf 72064003 QC 7,769,328 1,371,058
TC St. John’s Airport, Disposal Site 2 and Fire Training Area 00339002 NL 83,573 14,748
TC St. John’s Airport, Marine Fire Training Area 00339015 NL 9,350 1,650
TC Thunder Bay Airport, Former firefighting training area 11943001 ON 203,574 35,925
TC
Victoria Harbour, Lot 17: Victoria Harbour Floor; Point Ellice (Bay Street); Johnson Street; Point Ellice (Bay Street); East Selkirk; Macaulay
17348020 BC 415,033 73,241
TC Victoria Harbour, Lot 2A: Middle Harbour Fill Site; Harbour Floor 17348003 BC 240,636 42,465
TC
Victoria Harbour, Lot 6A: Barclay Point; Rock Bay East Fill; Rock Bay North Fill; Bay Street East Fill; J-15 Bay Street Centre Fill; J-16 Bay Street
17348008 BC 7,452,213 1,315,096
TC Watson Lake Airport, Former Tenant-Owned Maintenance Garage - APEC 7 N0281009 YT 110,727 19,540
TC Whitehorse Airport, Air Terminal Building APEC 20A Parking Lot 20146001 YT 31,406 5,542
TC Whitehorse Airport, Former Tenant Air Fuelling Facility - APEC 6 20146003 YT 1,110,743 195,972
TC Whitehorse Airport, Regional Fire Depot - APEC 8 20146004 YT 488,266 86,206
TC Williams Lake Airport, Fire Training Areas - Former and Historic N0033001 BC 228,349 40,297
APPENDIX DEnvironmental Liability for Federal Contaminated Sites
54
ENVIRONMENTAL LIABILITY FOR FEDERAL CONTAMINATED SITES
Environmental liabilities are the estimated costs related to the remediation or risk management of contaminated sites for which the Government of Canada is obligated, or will likely be obligated, to incur costs. A contingent liability is disclosed when the Government’s obligation to a contaminated site is unknown and where future events are expected to resolve the uncertainty. Recording environmental liability is a requirement found in the Treasury Board Directive on Contingencies; liabilities are reported annually in the Public Accounts of Canada.1
According to Treasury Board of Canada Secretariat guidance, a liability for remediation of contaminated sites should be recognized when, at the financial reporting date, the following applies:
• an environmental standard exists; • contamination exceeds the environmental standard; • the Government:
― owns the land;― is directly responsible; or― accepts responsibility (e.g., when there is little, if any, discretion to avoid the obligation);
• it is expected that future economic benefits will be given up; and• a reasonable estimate of the amount can be made.
An obligation for remediation or risk management of contaminated sites cannot be recognized as a liability unless all these criteria are satisfied.
In 2016, a statistical model was developed to estimate the liability for a group of unassessed sites on the basis of projections using historical costs at similar types of sites. As a result, there are 4,300 unassessed sites for which a total liability estimate of $320 million has been recorded prospectively in the Public Accounts of Canada.
1. Public Accounts of Canada, 2016, Volume I (PSPC, 2016), www.tpsgc-pwgsc.gc.ca/recgen/cpc-pac/index-eng.html.
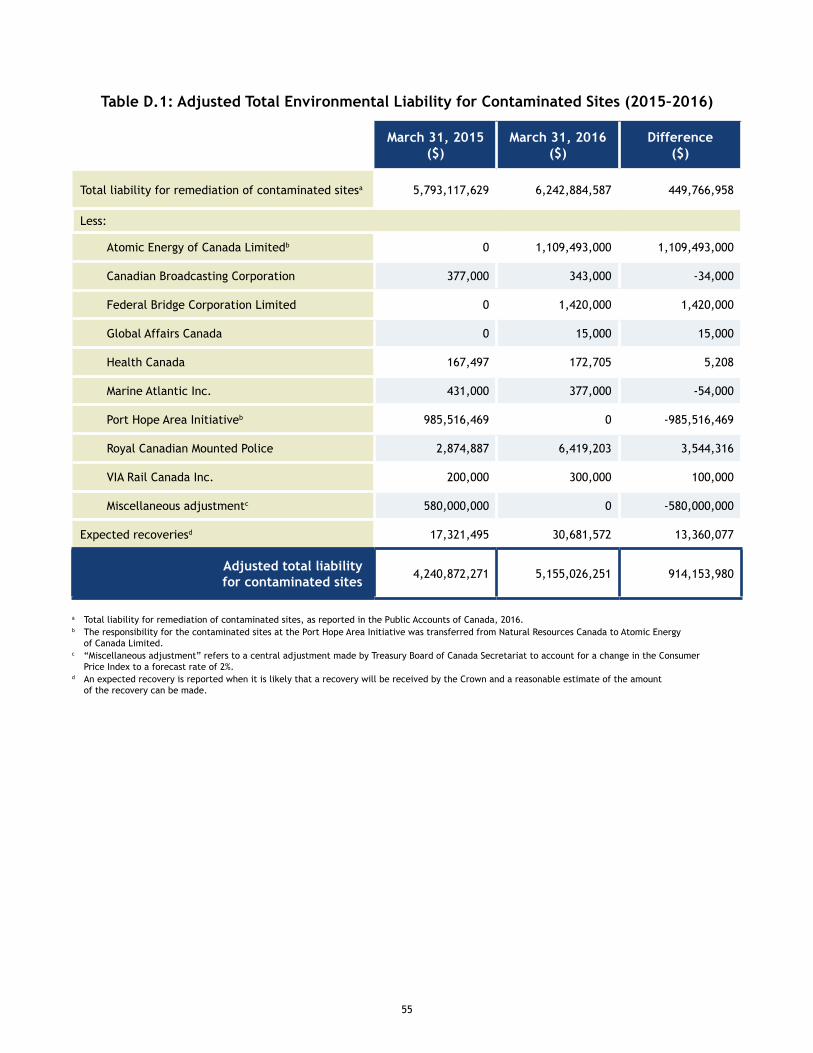
55
Table D.1: Adjusted Total Environmental Liability for Contaminated Sites (2015–2016)
March 31, 2015 ($)
March 31, 2016 ($)
Difference ($)
Total liability for remediation of contaminated sitesa 5,793,117,629 6,242,884,587 449,766,958
Less:
Atomic Energy of Canada Limitedb 0 1,109,493,000 1,109,493,000
Canadian Broadcasting Corporation 377,000 343,000 -34,000
Federal Bridge Corporation Limited 0 1,420,000 1,420,000
Global Affairs Canada 0 15,000 15,000
Health Canada 167,497 172,705 5,208
Marine Atlantic Inc. 431,000 377,000 -54,000
Port Hope Area Initiativeb 985,516,469 0 -985,516,469
Royal Canadian Mounted Police 2,874,887 6,419,203 3,544,316
VIA Rail Canada Inc. 200,000 300,000 100,000
Miscellaneous adjustmentc 580,000,000 0 -580,000,000
Expected recoveriesd 17,321,495 30,681,572 13,360,077
Adjusted total liability for contaminated sites
4,240,872,271 5,155,026,251 914,153,980
a Total liability for remediation of contaminated sites, as reported in the Public Accounts of Canada, 2016.b The responsibility for the contaminated sites at the Port Hope Area Initiative was transferred from Natural Resources Canada to Atomic Energy
of Canada Limited.c “Miscellaneous adjustment” refers to a central adjustment made by Treasury Board of Canada Secretariat to account for a change in the Consumer
Price Index to a forecast rate of 2%.d An expected recovery is reported when it is likely that a recovery will be received by the Crown and a reasonable estimate of the amount
of the recovery can be made.
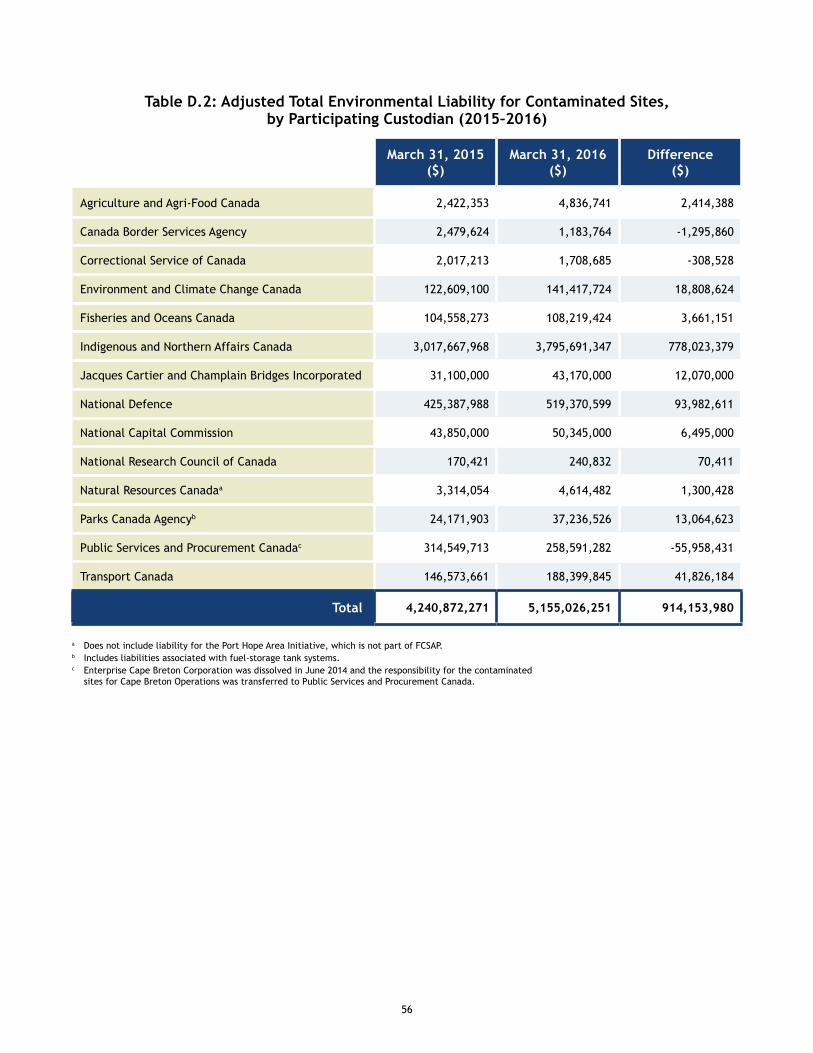
56
Table D.2: Adjusted Total Environmental Liability for Contaminated Sites, by Participating Custodian (2015–2016)
March 31, 2015 ($)
March 31, 2016 ($)
Difference ($)
Agriculture and Agri-Food Canada 2,422,353 4,836,741 2,414,388
Canada Border Services Agency 2,479,624 1,183,764 -1,295,860
Correctional Service of Canada 2,017,213 1,708,685 -308,528
Environment and Climate Change Canada 122,609,100 141,417,724 18,808,624
Fisheries and Oceans Canada 104,558,273 108,219,424 3,661,151
Indigenous and Northern Affairs Canada 3,017,667,968 3,795,691,347 778,023,379
Jacques Cartier and Champlain Bridges Incorporated 31,100,000 43,170,000 12,070,000
National Defence 425,387,988 519,370,599 93,982,611
National Capital Commission 43,850,000 50,345,000 6,495,000
National Research Council of Canada 170,421 240,832 70,411
Natural Resources Canadaa 3,314,054 4,614,482 1,300,428
Parks Canada Agencyb 24,171,903 37,236,526 13,064,623
Public Services and Procurement Canadac 314,549,713 258,591,282 -55,958,431
Transport Canada 146,573,661 188,399,845 41,826,184
Total 4,240,872,271 5,155,026,251 914,153,980
a Does not include liability for the Port Hope Area Initiative, which is not part of FCSAP.b Includes liabilities associated with fuel-storage tank systems. c Enterprise Cape Breton Corporation was dissolved in June 2014 and the responsibility for the contaminated
sites for Cape Breton Operations was transferred to Public Services and Procurement Canada.
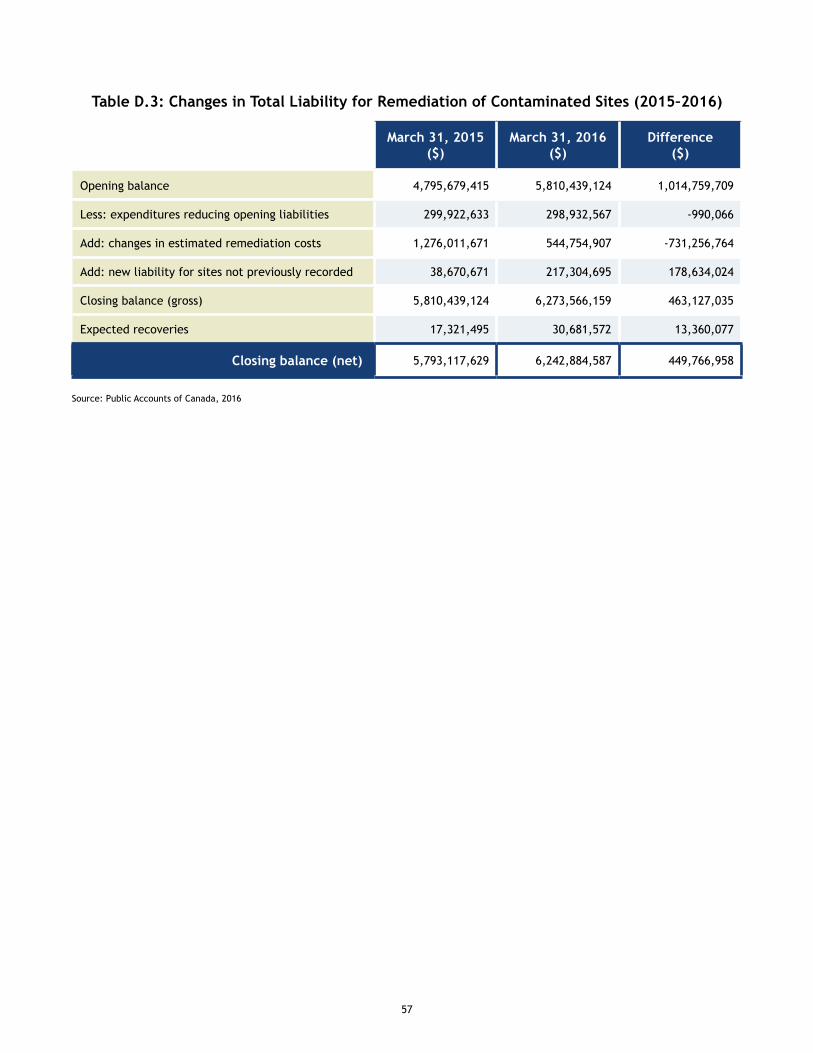
57
Table D.3: Changes in Total Liability for Remediation of Contaminated Sites (2015–2016)
March 31, 2015 ($)
March 31, 2016 ($)
Difference ($)
Opening balance 4,795,679,415 5,810,439,124 1,014,759,709
Less: expenditures reducing opening liabilities 299,922,633 298,932,567 -990,066
Add: changes in estimated remediation costs 1,276,011,671 544,754,907 -731,256,764
Add: new liability for sites not previously recorded 38,670,671 217,304,695 178,634,024
Closing balance (gross) 5,810,439,124 6,273,566,159 463,127,035
Expected recoveries 17,321,495 30,681,572 13,360,077
Closing balance (net) 5,793,117,629 6,242,884,587 449,766,958
Source: Public Accounts of Canada, 2016