Embed Size (px)
Citation preview

Vol. 81 Friday,
No. 98 May 20, 2016
Part III
Federal Deposit Insurance Corporation 12 CFR Part 327 Assessments; Final Rule
VerDate Sep<11>2014 19:17 May 19, 2016 Jkt 238001 PO 00000 Frm 00001 Fmt 4717 Sfmt 4717 E:\FR\FM\20MYR3.SGM 20MYR3mst
ocks
till o
n D
SK
3G9T
082P
RO
D w
ith R
ULE
S3
32180 Federal Register / Vol. 81, No. 98 / Friday, May 20, 2016 / Rules and Regulations
1 12 U.S.C. 1817(b). A ‘‘risk-based assessment system’’ means a system for calculating an insured depository institution’s deposit insurance assessment based on the institution’s probability of causing a loss to the DIF due to the composition and concentration of the institution’s assets and liabilities, the likely amount of any such loss, and the revenue needs of the DIF. See 12 U.S.C. 1817(b)(1)(C).
As used in this final rule, the term ‘‘bank’’ is synonymous with the term ‘‘insured depository institution’’ as it is used in section 3(c)(2) of the Federal Deposit Insurance Act (FDI Act), 12 U.S.C. 1813(c)(2). As used in this final rule, the term ‘‘small bank’’ is synonymous with the term ‘‘small institution’’ as it is used in 12 CFR 327.8. In general, a ‘‘small bank’’ is one with less than $10 billion in total assets.
2 See 80 FR at 40838 and 40842 (July 13, 2015). 3 Subject to exceptions, an established insured
depository institution is one that has been federally
insured for at least five years as of the last day of any quarter for which it is being assessed. 12 CFR 327.8(k).
4 On January 1, 2007, the FDIC instituted separate assessment systems for small and large banks. 71 FR 69282 (Nov. 30, 2006). See 12 U.S.C. 1817(b)(1)(D) (granting the Board the authority to establish separate risk-based assessment systems for large and small insured depository institutions).
5 The common equity tier 1 capital ratio was incorporated into the deposit insurance assessment system effective January 1, 2015. 79 FR 70427 (November 26, 2014). Beginning January 1, 2018, a supplementary leverage ratio will also be used to determine whether an advanced approaches bank is: (a) Well capitalized, if the bank is subject to the enhanced supplementary leverage ratio standards under 12 CFR 6.4(c)(1)(iv)(B), 12 CFR 208.43(c)(1)(iv)(B), or 12 CFR 324.403(b)(1)(vi), as each may be amended from time to time; and (b) adequately capitalized, if the bank is subject to the
advanced approaches risk-based capital rules under 12 CFR 6.4(c)(2)(iv)(B), 12 CFR 208.43(c)(2)(iv)(B), or 12 CFR 324.403(b)(2)(vi), as each may be amended from time to time. 79 FR 70427, 70437 (November 26, 2014). The supplementary leverage ratio is expected to affect the capital group assignment of few, if any, small banks.
6 The term ‘‘primary federal regulator’’ is synonymous with the term ‘‘appropriate federal banking agency’’ as it is used in section 3(q) of the FDI Act, 12 U.S.C. 1813(q).
7 A financial institution is assigned a CAMELS composite rating based on an evaluation and rating of six essential components of an institution’s financial condition and operations. These component factors address the adequacy of capital (C), the quality of assets (A), the capability of management (M), the quality and level of earnings (E), the adequacy of liquidity (L), and sensitivity to market risk (S).
FEDERAL DEPOSIT INSURANCE CORPORATION
12 CFR Part 327
RIN 3064–AE37
Assessments
AGENCY: Federal Deposit Insurance Corporation (FDIC). ACTION: Final rule.
SUMMARY: The FDIC is amending its rules to refine the deposit insurance assessment system for small insured depository institutions that have been federally insured for at least five years (established small banks) by: Revising the financial ratios method so that it is based on a statistical model estimating the probability of failure over three years; updating the financial measures used in the financial ratios method consistent with the statistical model; and eliminating risk categories for established small banks and using the financial ratios method to determine assessment rates for all such banks (subject to minimum or maximum initial assessment rates based upon a bank’s CAMELS composite rating). Under current regulations, deposit insurance assessment rates will decrease once the deposit insurance fund (DIF or fund) reserve ratio reaches 1.15 percent. The final rule preserves the range of initial assessment rates authorized under current regulations. DATES: The final rule is effective July 1, 2016.
Applicability date: If the reserve ratio reaches 1.15 percent before that date, the assessment system described in the final rule will become operative July 1, 2016. If the reserve ratio has not reached 1.15 percent by that date, the assessment system described in the final rule will become operative the first day of the calendar quarter after the reserve ratio reaches 1.15 percent. FOR FURTHER INFORMATION CONTACT: Munsell St. Clair, Chief, Banking and Regulatory Policy, Division of Insurance and Research, 202–898–8967; Ashley Mihalik, Senior Policy Analyst, Division of Insurance and Research, 202–898– 3793; Nefretete Smith, Counsel, Legal Division, 202–898–6851; Thomas Hearn, Counsel, Legal Division, 202–898–6967. SUPPLEMENTARY INFORMATION:
I. Background
Policy Objectives The primary purpose of the final rule
is to improve the risk-based deposit insurance assessment system applicable to established small banks to more accurately reflect risk.1 Additional discussion of the policy objectives of the final rule can be found in the notice of proposed rulemaking adopted by the FDIC’s Board of Directors (Board) on June 6, 2015.2
Risk-Based Deposit Insurance Assessments for Established Small Banks
Since 2007, assessment rates for established small banks (that is, small
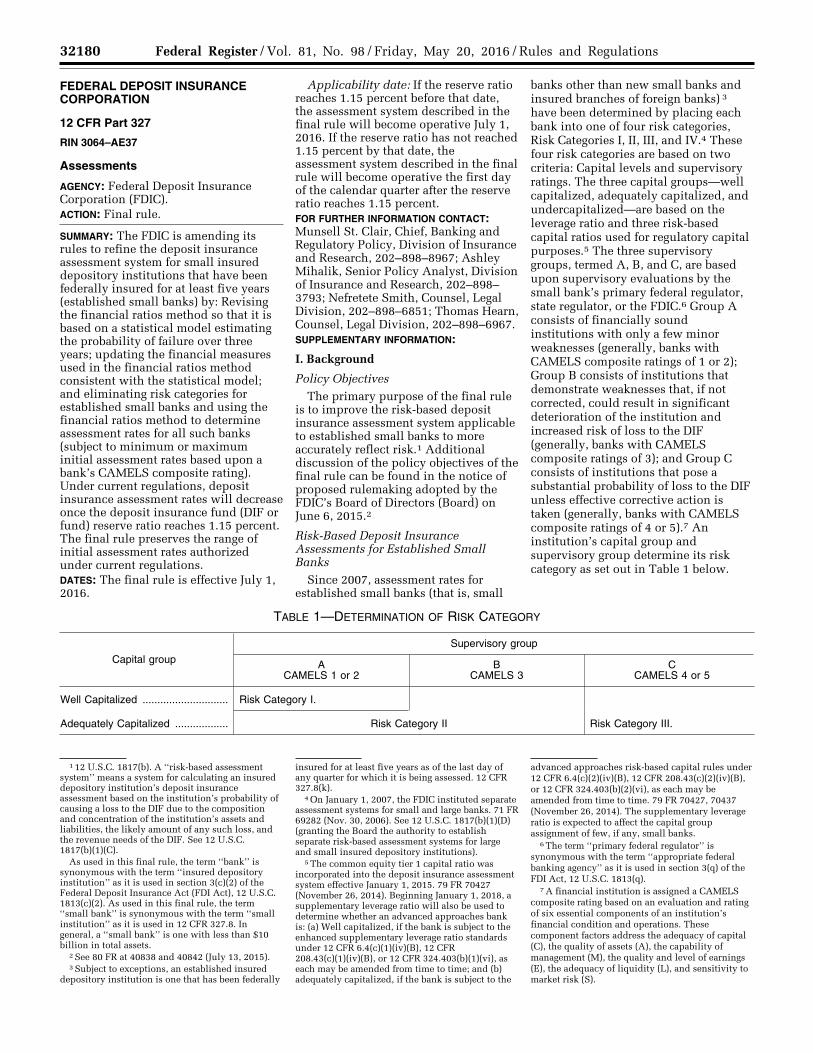
banks other than new small banks and insured branches of foreign banks) 3 have been determined by placing each bank into one of four risk categories, Risk Categories I, II, III, and IV.4 These four risk categories are based on two criteria: Capital levels and supervisory ratings. The three capital groups—well capitalized, adequately capitalized, and undercapitalized—are based on the leverage ratio and three risk-based capital ratios used for regulatory capital purposes.5 The three supervisory groups, termed A, B, and C, are based upon supervisory evaluations by the small bank’s primary federal regulator, state regulator, or the FDIC.6 Group A consists of financially sound institutions with only a few minor weaknesses (generally, banks with CAMELS composite ratings of 1 or 2); Group B consists of institutions that demonstrate weaknesses that, if not corrected, could result in significant deterioration of the institution and increased risk of loss to the DIF (generally, banks with CAMELS composite ratings of 3); and Group C consists of institutions that pose a substantial probability of loss to the DIF unless effective corrective action is taken (generally, banks with CAMELS composite ratings of 4 or 5).7 An institution’s capital group and supervisory group determine its risk category as set out in Table 1 below.
TABLE 1—DETERMINATION OF RISK CATEGORY
Capital group
Supervisory group
A CAMELS 1 or 2
B CAMELS 3
C CAMELS 4 or 5
Well Capitalized ............................. Risk Category I.
Adequately Capitalized .................. Risk Category II Risk Category III.
VerDate Sep<11>2014 19:17 May 19, 2016 Jkt 238001 PO 00000 Frm 00002 Fmt 4701 Sfmt 4700 E:\FR\FM\20MYR3.SGM 20MYR3mst
ocks
till o
n D
SK
3G9T
082P
RO
D w
ith R
ULE
S3

32181 Federal Register / Vol. 81, No. 98 / Friday, May 20, 2016 / Rules and Regulations
8 The weights applied to CAMELS components are as follows: 25 percent each for Capital and Management; 20 percent for Asset quality; and 10 percent each for Earnings, Liquidity, and Sensitivity to market risk. These weights reflect the view of the FDIC regarding the relative importance of each of the CAMELS components for differentiating risk among institutions for deposit insurance assessment purposes. The FDIC and other bank supervisors do not use such a system to determine CAMELS composite ratings.
9 New small banks in Risk Category I, however, are charged the highest initial assessment rate in effect for that risk category. Subject to exceptions, a new bank is one that has been federally insured for less than five years as of the last day of any quarter for which it is being assessed. 12 CFR 327.8(j).
10 In 2011, the Board revised and approved regular assessment rate schedules. See 76 FR 10672 (Feb. 25, 2011); 12 CFR 327.10.
11 See 71 FR 41910, 41913 (July 24, 2006).
12 Insured branches are deemed small banks for purposes of the deposit insurance assessment system.
13 See 76 FR 10672. Among other things, the Dodd-Frank Wall Street Reform and Consumer Protection Act (the Dodd-Frank Act), enacted in July 2010: (1) Raised the minimum designated reserve ratio (DRR), which the FDIC must set each year, to 1.35 percent (from the former minimum of 1.15 percent) and removed the upper limit on the DRR (which was formerly capped at 1.5 percent), 12 U.S.C. 1817(b)(3)(B); (2) required that the fund reserve ratio reach 1.35 percent by September 30, 2020 (rather than 1.15 percent by the end of 2016, as formerly required), 12 U.S.C. 1817(note); and (3) required that, in setting assessments, the FDIC ‘‘offset the effect of [requiring that the reserve ratio reach 1.35 percent by September 30, 2020] on insured depository institutions with total consolidated assets of less than $10,000,000,000,’’ 12 U.S.C. 1817(note). On March 15, 2016, the FDIC adopted a final rule to implement the Dodd-Frank Act requirements that the fund reserve ratio reach 1.35 percent by September 30, 2020, and that the
effect of the higher minimum reserve ratio on insured depository institutions with total consolidated assets of less than $10 billion be offset. See 81 FR 16059 (Mar. 25, 2016).
14 Before adopting the assessment rate schedules currently in effect, the FDIC undertook a historical analysis to determine how high the reserve ratio would have to have been to have maintained both a positive balance and stable assessment rates from 1950 through 2010. The historical analysis and long-term fund management plan are described at 76 FR at 10675 and 75 FR 66272, 66272–66281 (Oct. 27, 2010). The analysis shows that the fund reserve ratio would have needed to be approximately 2 percent or more before the onset of the 1980s and 2008 crises to maintain both a positive fund balance and stable assessment rates, assuming, in lieu of dividends, that the long-term industry average nominal assessment rate would have been reduced by 25 percent when the reserve ratio reached 2 percent, and by 50 percent when the reserve ratio reached 2.5 percent.
TABLE 1—DETERMINATION OF RISK CATEGORY—Continued
Capital group
Supervisory group
A CAMELS 1 or 2
B CAMELS 3
C CAMELS 4 or 5
Under Capitalized .......................... Risk Category III Risk Category IV.
To further differentiate risk within Risk Category I (which includes most small banks), the FDIC uses the financial ratios method, which combines a weighted average of supervisory CAMELS component ratings 8 with current financial ratios to determine a small Risk Category I bank’s initial assessment rate.9
Within Risk Category I, those institutions that pose the least risk are charged a minimum initial assessment rate and those that pose the greatest risk are charged an initial assessment rate that is four basis points higher than the minimum. All other banks within Risk Category I are charged a rate that varies between these rates. In contrast, all banks in Risk Category II are charged the same initial assessment rate, which is higher than the maximum initial rate for Risk Category I. A single, higher, initial assessment rate applies to each bank in
Risk Category III and another, higher, rate to each bank in Risk Category IV.10
To determine a Risk Category I bank’s initial assessment rate, the weighted CAMELS components and financial ratios are multiplied by statistically derived pricing multipliers, the products are summed, and the sum is added to a uniform amount that applies to all Risk Category I banks. If, however, the rate is below the minimum initial assessment rate for Risk Category I, the bank will pay the minimum initial assessment rate; if the rate derived is above the maximum initial assessment rate for Risk Category I, then the bank will pay the maximum initial rate for the risk category.
The financial ratios used to determine rates come from a statistical model that predicts the probability that a Risk Category I institution will be downgraded from a CAMELS composite rating of 1 or 2 to a rating of 3 or worse
within one year. The probability of a CAMELS downgrade is intended as a proxy for the bank’s probability of failure. When the model was developed in 2006, the FDIC decided not to attempt to determine a bank’s probability of failure because of the lack of bank failures in the years between the end of the bank and thrift crisis in the early 1990s and 2006.11
The financial ratios method does not apply to new small banks or to insured branches of foreign banks (insured branches).12
Assessment Rates Under Current Rules
In 2011, the FDIC adopted a schedule of assessment rates designed to ensure that the reserve ratio reaches 1.15 percent by September 30, 2020.13
The initial assessment rates currently in effect for small and large banks are set forth in Table 2 below.14
TABLE 2—INITIAL BASE ASSESSMENT RATES [In basis points per annum]
Risk category
I * II III IV
Large & highly complex
institutions ** Minimum Maximum
Annual Rates (in basis points) ......... 5 9 14 23 35 5–35
* Initial base rates that are not the minimum or maximum will vary between these rates. ** See 12 CFR 327.8(f) and 12 CFR 327.8(g) for the definition of large and highly complex institutions.
VerDate Sep<11>2014 19:17 May 19, 2016 Jkt 238001 PO 00000 Frm 00003 Fmt 4701 Sfmt 4700 E:\FR\FM\20MYR3.SGM 20MYR3mst
ocks
till o
n D
SK
3G9T
082P
RO
D w
ith R
ULE
S3

32182 Federal Register / Vol. 81, No. 98 / Friday, May 20, 2016 / Rules and Regulations
15 A bank’s total base assessment rate can vary from its initial base assessment rate as the result of three possible adjustments. Two of these adjustments—the unsecured debt adjustment and the depository institution debt adjustment (DIDA)— apply to all banks (except that the unsecured debt adjustment does not apply to new banks or insured branches). The unsecured debt adjustment lowers a bank’s assessment rate based on the bank’s ratio of long-term unsecured debt to the bank’s assessment
base. The DIDA increases a bank’s assessment rate when it holds long-term, unsecured debt issued by another insured depository institution. The third possible adjustment—the brokered deposit adjustment—applies only to small banks in Risk Category II, III and IV and to large and highly complex institutions that are not well capitalized or that are not CAMELS composite 1 or 2-rated. It does not apply to insured branches. The brokered deposit adjustment increases a bank’s assessment
when it holds significant amounts of brokered deposits. 12 CFR 327.9 (d).
16 See 76 FR at 10717–720. 17 For new banks, however, the rates will remain
in effect even if the reserve ratio equals or exceeds 2 percent (or 2.5 percent).
18 The reserve ratio for the immediately prior assessment period must also be less than 2 percent.
19 See 12 CFR 327.10(f); 76 FR at 10684. 20 See 80 FR 40838 (July 13, 2015).
An institution’s total assessment rate may vary from the initial assessment rate as the result of possible
adjustments.15 After applying all possible adjustments, minimum and maximum total assessment rates for
each risk category are set forth in Table 3 below.
TABLE 3—TOTAL BASE ASSESSMENT RATES * [In basis points per annum]
Risk category I
Risk category II
Risk category III
Risk category IV
Large & highly complex
institutions **
Initial Base Assessment Rate ................................................. 5–9 ................ 14 .................. 23 .................. 35 .................. 5–35. Unsecured Debt Adjustment *** .............................................. ¥4.5 to 0 ...... ¥5 to 0 ......... ¥5 to 0 ......... ¥5 to 0 ......... ¥5 to 0. Brokered Deposit Adjustment ................................................. N/A ................ 0 to 10 .......... 0 to 10 ........... 0 to 10 ........... 0 to 10. Total Base Assessment Rate ................................................. 2.5 to 9 ......... 9 to 24 ........... 18 to 33 ......... 30 to 45 ........ 2.5 to 45.
* Total base assessment rates do not include the DIDA. ** See 12 CFR 327.8(f) and (g) for the definition of large and highly complex institutions. *** The unsecured debt adjustment cannot exceed the lesser of 5 basis points or 50 percent of an insured depository institution’s initial base
assessment rate. The unsecured debt adjustment does not apply to new banks or insured branches.
In 2011, consistent with the FDIC’s long-term fund management plan, the Board adopted lower, moderate assessment rates that will go into effect when the DIF reserve ratio reaches 1.15 percent.16 Pursuant to the FDIC’s
authority to set assessments, the regulations currently provide that the initial and total base assessment rates set forth in Table 4 below will take effect beginning the assessment period after the fund reserve ratio first meets or
exceeds 1.15 percent, without the necessity of further action by the Board. The rates are to remain in effect unless and until the reserve ratio meets or exceeds 2 percent.17
TABLE 4—INITIAL AND TOTAL BASE ASSESSMENT RATES * [In basis points per annum]
[Once the reserve ratio reaches 1.15 percent 18]
Risk category I
Risk category II
Risk category III
Risk category IV
Large & highly complex
institutions **
Initial Base Assessment Rate ................................................. 3–7 ................ 12 .................. 19 .................. 30 .................. 3–30. Unsecured Debt Adjustment *** .............................................. ¥3.5 to 0 ...... ¥5 to 0 ......... ¥5 to 0 ......... ¥5 to 0 ......... ¥5 to 0. Brokered Deposit Adjustment ................................................. N/A ................ 0 to 10 .......... 0 to 10 ........... 0 to 10 ........... 0 to 10. Total Base Assessment Rate ................................................. 1.5 to 7 ......... 7 to 22 ........... 14 to 29 ......... 25 to 40 ........ 1.5 to 40.
* Total base assessment rates do not include the DIDA. ** See 12 CFR 327.8(f) and (g) for the definition of large and highly complex institutions. *** The unsecured debt adjustment cannot exceed the lesser of 5 basis points or 50 percent of an insured depository institution’s initial base
assessment rate; thus, for example, an insured depository institution with an initial base assessment rate of 3 basis points will have a maximum unsecured debt adjustment of 1.5 basis points and cannot have a total base assessment rate lower than 1.5 basis points. The unsecured debt adjustment does not apply to new banks or insured branches.
In lieu of dividends, and pursuant to the FDIC’s authority to set assessments and consistent with the FDIC’s long- term fund management plan, the Board also adopted a lower schedule of assessment rates that will take effect without further action by the Board when the fund reserve ratio at the end of the prior assessment period meets or exceeds 2 percent, but is less than 2.5 percent, and another, still lower, schedule of assessment rates that will take effect, again, without further action by the Board, when the fund reserve
ratio at the end of the prior assessment period meets or exceeds 2.5 percent.
The Board, by regulation, may adopt rates without further notice and comment rulemaking that are higher or lower than the total assessment rates (also known as the total base assessment rates), provided that: (1) The Board cannot increase or decrease rates from one quarter to the next by more than two basis points; and (2) cumulative increases and decreases cannot be more than two basis points higher or lower than the total base assessment rates.19
The 2015 Notice of Proposed Rulemaking
On June 16, 2015, the Board authorized publication of a notice of proposed rulemaking (2015 NPR) to refine the deposit insurance assessment system for established small banks. The 2015 NPR was published in the Federal Register on July 13, 2015.20 In the 2015 NPR, the FDIC proposed to improve the assessment system applicable to established small banks by: (1) Revising the financial ratios method so that it would be based on a statistical model
VerDate Sep<11>2014 19:17 May 19, 2016 Jkt 238001 PO 00000 Frm 00004 Fmt 4701 Sfmt 4700 E:\FR\FM\20MYR3.SGM 20MYR3mst
ocks
till o
n D
SK
3G9T
082P
RO
D w
ith R
ULE
S3
32183 Federal Register / Vol. 81, No. 98 / Friday, May 20, 2016 / Rules and Regulations
21 See 81 FR 6108 (Feb. 4, 2016). 22 The tier 1 leverage ratio is now known as the
leverage ratio. 23 For certain lagged variables, such as one-year
asset growth rates, the statistical analysis also used bank financial data from 1984.
24 See 80 FR at 40857–872 (Appendix 1 in 2015 NPR), 81 FR at 6124–35 (Appendix 1 in 2016 revised NPR), and 81 FR at 6153–55 (appendix E in 2016 revised NPR).
25 The denominator in the net income before taxes/total assets measure is total assets rather than
risk-weighted assets as under current rules. Also, the definition of the net income measure no longer refers to extraordinary items. The numerator of the net income measure definition is income before applicable income taxes and discontinued operations for the most recent twelve months, rather than income before income taxes and extraordinary items and other adjustments for the most recent twelve months as in the 2015 NPR and current rules. In the current Call Report, extraordinary items and discontinued operations are combined for reporting purposes. Income for the
net income ratio is currently determined before both extraordinary items and discontinued operations. In January 2015, the Financial Accounting Standards Board (FASB) eliminated from U.S. generally accepted accounting principles (GAAP) the concept of extraordinary items, effective for fiscal years and interim periods within those fiscal years, beginning after December 15, 2015. In September 2015, the FDIC, the Office of the Comptroller of the Currency, and the Board of Governors of the Federal Reserve System (collectively, the Federal banking agencies)
Continued
estimating the probability of failure over three years; (2) updating the financial measures used in the financial ratios method consistent with the statistical model; and (3) eliminating risk categories for all established small banks and using the financial ratios method to determine assessment rates for all such banks. CAMELS composite ratings, however, would be used to place a maximum on the assessment rates that CAMELS composite 1- and 2- rated banks could be charged and minimums on the assessment rates that CAMELS composite 3-, 4- and 5-rated banks could be charged.
The FDIC received a total of 484 comment letters in response to the 2015 NPR. Of these, 45 were from trade groups and 439 were from individuals or banks. These comments addressed many aspects of the proposal, including the loan mix index and the one-year asset growth measure, but the majority of comments expressed concern regarding the proposed treatment of reciprocal deposits in the 2015 NPR.
The 2016 Notice of Proposed Rulemaking
On January 21, 2016, the Board authorized publication of a second notice of proposed rulemaking (the 2016 revised NPR) to revise the 2015 NPR in
response to comments received. The 2016 revised NPR was published in the Federal Register on February 4, 2016.21 The broad outline of the 2016 revised NPR remained the same as the 2015 NPR, but revised the proposal by: (1) Using a brokered deposit ratio (that treats reciprocal deposits the same as under current regulations)—rather than the core deposit ratio proposed in the 2015 NPR—as a measure in the proposed financial ratios method for calculating assessment rates for all established small banks; (2) removing the existing brokered deposit adjustment applicable to certain established small banks, which is made duplicative by the new brokered deposit ratio; (3) revising the one-year asset growth measure, another of the financial ratios method measures proposed in the 2015 NPR; (4) re-estimating the statistical model underlying the established small bank deposit insurance assessment system; (5) revising the uniform amount and pricing multipliers used in the financial ratios method; and (6) providing that any future changes to the statistical model underlying the established small bank deposit insurance assessment system would go through notice-and- comment rulemaking.
The FDIC received a total of 19 comment letters in response to the 2016 revised NPR. Of these, 7 were from trade groups and 12 were from individuals or banks. Comments addressed both the revisions to the proposal made by the 2016 revised NPR and aspects of the proposal that remained unchanged from the 2015 NPR, such as the loan mix index.
All comments, those received on the 2015 NPR and the 2016 revised NPR, were considered in developing this final rule. Comments are discussed in the relevant sections that follow.
II. The Final Rule
Description of the Final Rule
The final rule adopts the proposals in the 2016 revised NPR as proposed.
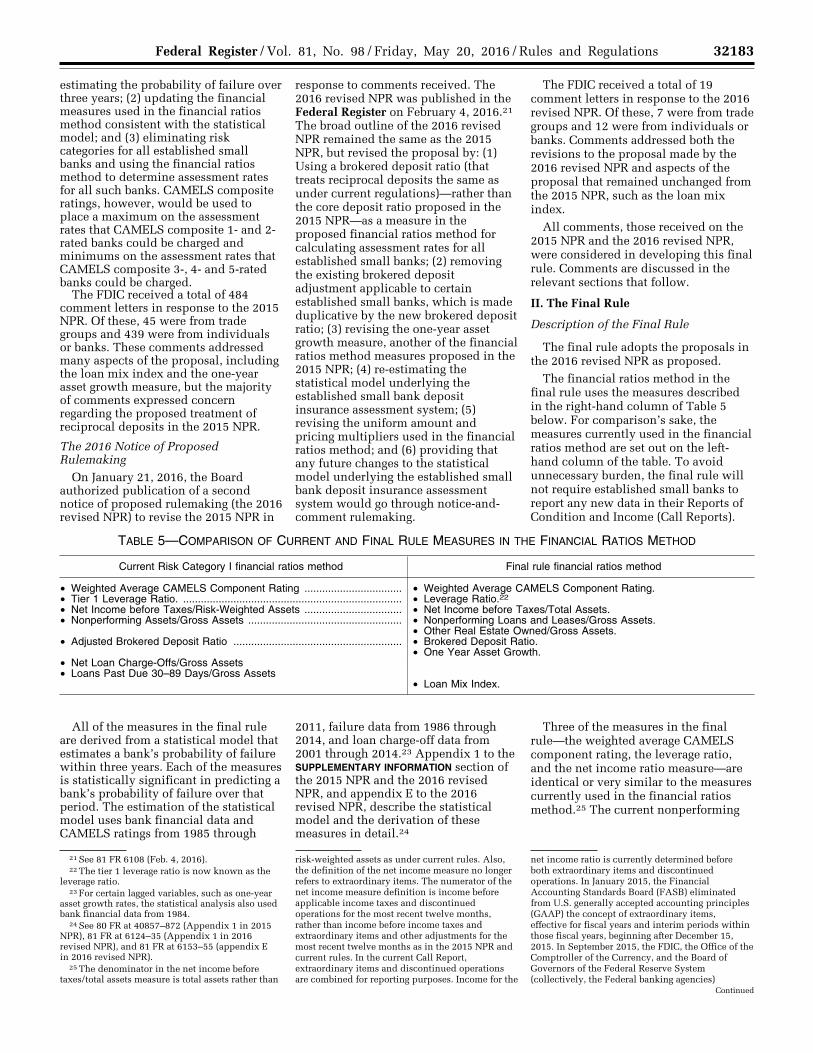
The financial ratios method in the final rule uses the measures described in the right-hand column of Table 5 below. For comparison’s sake, the measures currently used in the financial ratios method are set out on the left- hand column of the table. To avoid unnecessary burden, the final rule will not require established small banks to report any new data in their Reports of Condition and Income (Call Reports).
TABLE 5—COMPARISON OF CURRENT AND FINAL RULE MEASURES IN THE FINANCIAL RATIOS METHOD
Current Risk Category I financial ratios method Final rule financial ratios method
• Weighted Average CAMELS Component Rating ................................. • Weighted Average CAMELS Component Rating. • Tier 1 Leverage Ratio. .......................................................................... • Leverage Ratio.22 • Net Income before Taxes/Risk-Weighted Assets ................................. • Net Income before Taxes/Total Assets. • Nonperforming Assets/Gross Assets .................................................... • Nonperforming Loans and Leases/Gross Assets.
• Other Real Estate Owned/Gross Assets. • Adjusted Brokered Deposit Ratio ......................................................... • Brokered Deposit Ratio.
• One Year Asset Growth. • Net Loan Charge-Offs/Gross Assets • Loans Past Due 30–89 Days/Gross Assets
• Loan Mix Index.
All of the measures in the final rule are derived from a statistical model that estimates a bank’s probability of failure within three years. Each of the measures is statistically significant in predicting a bank’s probability of failure over that period. The estimation of the statistical model uses bank financial data and CAMELS ratings from 1985 through
2011, failure data from 1986 through 2014, and loan charge-off data from 2001 through 2014.23 Appendix 1 to the SUPPLEMENTARY INFORMATION section of the 2015 NPR and the 2016 revised NPR, and appendix E to the 2016 revised NPR, describe the statistical model and the derivation of these measures in detail.24
Three of the measures in the final rule—the weighted average CAMELS component rating, the leverage ratio, and the net income ratio measure—are identical or very similar to the measures currently used in the financial ratios method.25 The current nonperforming
VerDate Sep<11>2014 19:17 May 19, 2016 Jkt 238001 PO 00000 Frm 00005 Fmt 4701 Sfmt 4700 E:\FR\FM\20MYR3.SGM 20MYR3mst
ocks
till o
n D
SK
3G9T
082P
RO
D w
ith R
ULE
S3

32184 Federal Register / Vol. 81, No. 98 / Friday, May 20, 2016 / Rules and Regulations
published a joint Paperwork Reduction Act (PRA) notice and request for comment on proposed changes to the Call Report, including the elimination of the concept of extraordinary items and revision of affected data items. See 80 FR 56539 (Sept. 18, 2015). That PRA process is still in progress and the FDIC expects that, at some future time, references to extraordinary items will be removed from the Call Report. Nevertheless, items that would have met the criteria for classification as extraordinary before the effective date of the FASB’s accounting change will no longer be reported as such in the Call Report income statement after the effective date of the change. Discontinued operations, however, will continue to be reported in the Call Report income statement as a separate item in the future, and income for the net income ratio will be determined before discontinued operations. Therefore, the FDIC is defining the net income measure to reflect the anticipated Call Report changes. The FDIC recognizes that this final rule may become effective before the Federal banking agencies finalize the proposed Call Report changes.
Because the numerator of the net income measure is defined to include income for the most recent twelve months, there may be a transition period in which income for the most recent twelve months may include income from periods before the elimination from GAAP of the concept of extraordinary items has taken effect. For those portions of the most recent twelve months before this elimination has taken effect, income will be determined as income before income taxes and extraordinary items and other adjustments.
26 Two measures in the current financial ratios method—net loan charge-offs/gross assets and loans past due 30–89 days/gross assets—were analyzed but are not used in the final statistical analysis and are not among the measures in this final rule.
27 The adjusted brokered deposit ratio can affect assessment rates only if a bank’s brokered deposits (excluding reciprocal deposits) exceed 10 percent of its domestic deposits and its assets have grown more than 40 percent in the previous 4 years. 12 CFR part 327, appendix A to subpart A.
Few Risk Category I banks have both high levels of non-reciprocal brokered deposits and high asset growth, so the adjusted brokered deposit ratio affects relatively few banks. As of December 31, 2015, the adjusted brokered deposit ratio affected the assessment rate of 111 banks.
28 Reciprocal deposits are deposits that an insured depository institution receives through a deposit placement network on a reciprocal basis, such that: (1) For any deposit received, the institution (as agent for depositors) places the same amount with other insured depository institutions through the network; and (2) each member of the network sets the interest rate to be paid on the entire amount of funds it places with other network members. See 12 CFR 327.8(q).
29 12 CFR 327.9(d)(3); 12 U.S.C. 1831f. 30 FDIC Study on Core Deposits and Brokered
Deposits (2011), 54.
assets/gross assets measure includes other real estate owned. In the final rule, other real estate owned/gross assets is a separate measure from nonperforming loans and leases/gross assets.
The remaining three financial measures—the brokered deposit ratio, the one-year asset growth measure and the loan mix index—are described in detail below.26 The brokered deposit ratio and the one-year asset growth measure replace the current adjusted brokered deposit ratio.
Brokered Deposit Ratio
Under current assessment rules, brokered deposits affect a small bank’s assessment rate based on its risk category. For established small banks that are assigned to Risk Category I (those that are well capitalized and have a CAMELS composite rating of 1 or 2), the adjusted brokered deposit ratio is one of the financial ratios used to determine a bank’s initial assessment rate. The adjusted brokered deposit ratio increases a bank’s initial assessment rate when a bank has both brokered deposits that exceed 10 percent of its domestic deposits and a high asset growth rate.27
Reciprocal deposits are not included with other brokered deposits in the adjusted brokered deposit ratio.28
Established small banks in Risk Categories II, III, and IV (those that are less than well capitalized or that have a CAMELS composite rating of 3, 4, or 5) are subject to the brokered deposit adjustment, one of three possible adjustments that can increase or decrease a bank’s initial assessment rate. The brokered deposit adjustment increases a bank’s assessment rate if it has brokered deposits in excess of 10 percent of its domestic deposits.29 Unlike the adjusted brokered deposit ratio, the brokered deposit adjustment includes all brokered deposits, including reciprocal deposits, and is not affected by asset growth rates.
The final rule replaces the adjusted brokered deposit ratio currently used in the financial ratios method with a brokered deposit ratio, defined as the ratio of brokered deposits to total assets, and with a one-year asset growth measure, which is discussed later. The final rule also eliminates the existing brokered deposit adjustment applicable to established small banks outside Risk Category I. Under the new brokered deposit ratio applicable to all established small banks, brokered deposits in excess of 10 percent of total assets may increase assessment rates. For a bank that is well capitalized and has a CAMELS composite rating of 1 or 2, reciprocal deposits will be deducted from brokered deposits. For a bank that is less than well capitalized or has a CAMELS composite rating of 3, 4 or 5, however, reciprocal deposits will be included with other brokered deposits.
Most commenters on the 2016 revised NPR discussed the changes related to the brokered deposit ratio. Some commenters supported using a brokered deposit ratio and some expressed support for excluding reciprocal deposits from the brokered deposit ratio for banks that are well capitalized and have a CAMELS composite rating of 1 or 2. This treatment of reciprocal deposits is generally consistent with the
442 comment letters on the 2015 NPR arguing that reciprocal deposits should not be treated as brokered deposits for assessment purposes or, similarly, that the final rule should reflect the current treatment of reciprocal deposits.
The brokered deposit ratio as defined in the final rule is also consistent with the 16 comment letters on the 2015 NPR cautioning against penalizing the use of Federal Home Loan Bank advances in determining assessment rates. The final rule does not change the current treatment of Federal Home Loan Bank advances in the small bank deposit insurance assessment system. The FDIC received two comments on the 2016 revised NPR supporting the FDIC’s responsiveness to these concerns.
The FDIC received two comment letters on the 2016 revised NPR reiterating the argument made in 40 comment letters on the 2015 NPR that reciprocal deposits should be treated as core deposits or are the functional equivalent of core deposits. Commenters argued that reciprocal deposits do not present the same risks as brokered deposits, such as excessive growth or liquidity problems, and therefore should be formally recognized as a low risk, desirable source of funds. One commenter on the 2016 revised NPR argued that reciprocal deposits should not be included with brokered deposits even for banks that are less than well capitalized or have a CAMELS composite rating of 3, 4 or 5, because a bank’s deposits are already adequately accounted for under the ‘‘L’’ (‘‘Liquidity’’) component of a bank’s CAMELS rating.
As stated in the 2016 revised NPR, however, the FDIC analyzed the characteristics of reciprocal deposits in its Study on Core Deposits and Brokered Deposits and concluded that, ‘‘While the FDIC agrees that reciprocal deposits do not present all of the problems that traditional brokered deposits present, they pose sufficient potential problems—particularly their dependence on a network and the network’s continued willingness to allow a bank to participate, and the potential of supporting rapid growth if not based upon a relationship—that they should not be considered core . . .’’ 30 (Emphasis added.) As the FDIC noted when it adopted the current brokered deposit adjustment and included reciprocal deposits with other brokered deposits in the adjustment, ‘‘The statutory restrictions on accepting, renewing or rolling over brokered deposits when an institution becomes
VerDate Sep<11>2014 19:17 May 19, 2016 Jkt 238001 PO 00000 Frm 00006 Fmt 4701 Sfmt 4700 E:\FR\FM\20MYR3.SGM 20MYR3mst
ocks
till o
n D
SK
3G9T
082P
RO
D w
ith R
ULE
S3

32185 Federal Register / Vol. 81, No. 98 / Friday, May 20, 2016 / Rules and Regulations
31 74 FR 9525, 9541 (Mar. 9, 2009). 12 U.S.C. 1831f.
32 See FDIC Study on Core Deposits and Brokered Deposits (2011), 38–44, 46–47 and 66–68 (Appendix A: Excerpts from Material Loss Reviews And Summaries of OIG Semiannual Reports to Congress).
33 From 1985 through 2014, one-year asset growth rates greater than 10 percent represented approximately the 70th percentile of small banks. A 10 percent one-year asset growth rate measure is generally consistent with the adjusted brokered deposit ratio in the current Risk Category I financial ratios method, which raises assessment rates only when small banks have both four-year asset growth rates in excess of 40 percent and high levels of brokered deposits.
34 Furthermore, some of the results of the analyses suggest that assessment rates would increase for a bank with a better component ratings, rather than decrease.
35 In the analysis of the alternative suggested by commenters, the weighted average of CAMELS component ratings was revised to exclude the components that were included as separate variables.
36 The FDIC tested how well the assessment system in the final rule, which uses separate measures for brokered deposits and asset growth, would have differentiated during the recent crisis between banks that failed and those that did not compared to an assessment system that used a combined measure (based on the interaction between brokered deposits and asset growth). In each case, the FDIC, unlike the commenter, was able to use CAMELS component ratings. The FDIC determined out-of-sample accuracy ratios for the assessment system in the final rule and compared these accuracy ratios with accuracy ratios for an assessment system using separate measures to determine how well each version of the system would have differentiated between banks that failed within the projection period and those that did not. The projection period in each case was the three years following the date of the projection; the dates of projection were the last day of the years 2006 through 2011. (An accuracy ratio compares how well a model would have discriminated between banks that failed within the projection period and banks that did not.) For each year’s projection, the assessment system in the final rule had accuracy ratios that were equal to or better than the accuracy ratios for the system using a combined measure. In most years of the backtest, the accuracy ratios were similar; in the 2006 projection (predicting failures from 2007 through 2009), however, the accuracy ratio for the assessment system using separate measures was significantly better than the accuracy ratio for the assessment system using a combined measure. (Accuracy ratios are discussed in more detail later.)
37 See FDIC Study on Core Deposits and Brokered Deposits (2011), 38–44 and 46–47.
less than well capitalized apply to all brokered deposits, including reciprocal deposits. Market restrictions may also apply to these reciprocal deposits when an institution’s condition declines.’’ 31 The brokered deposit ratio, which deducts reciprocal deposits for well- capitalized, well-rated banks, is consistent with these statutory restrictions and with the FDIC Study on Core Deposits and Brokered Deposits.
Three commenters on the 2016 revised NPR reiterated the argument they made in their comments on the 2015 NPR that the FDIC should not charge higher assessment rates to banks that hold brokered deposits, but should instead consider how banks use brokered deposits and whether they remain profitable and well capitalized. The FDIC also received letters on both the 2016 revised NPR and the 2015 NPR suggesting that specific types of brokered deposits—including stable retail deposits, certain custodial accounts, and longer maturing brokered CDs used to manage interest rate risk— be excluded from the brokered deposit ratio, and arguing that these deposits have similar characteristics to reciprocal deposits and are less risky than other brokered deposits.
Small banks do not report data on particular types of brokered deposits (other than reciprocal deposits). Because of this lack of data, the FDIC cannot analyze individual types of brokered deposits statistically. In any event, the FDIC’s statistical analyses and other studies have found that brokered deposits in general are correlated with a higher probability of failure and, as was acknowledged by one commenter, higher losses upon failure.32 Collecting additional data on particular types of brokered deposits is not likely to improve the assessment system’s ability to distinguish risk enough to warrant the additional reporting burden it would impose on small banks.
One-Year Asset Growth Measure In response to comments on the 2015
NPR that the one-year asset growth measure should not penalize normal asset growth, the final rule uses a one- year asset growth measure that increases an established small bank’s assessment rate only if it has had one-year asset growth greater than 10 percent.
The FDIC received 6 comments on the 2016 revised NPR supporting the change
from the asset growth measure as proposed in the 2015 NPR. Some commenters, however, remained concerned that the measure inappropriately penalizes banks for growth that may not be risky, arguing that a bank can exceed the 10 percent threshold for reasons such as the failure of a competitor, economic conditions, or an influx of deposits invested in high- quality assets. A few commenters suggested using CAMELS component ratings, such as a bank’s rating for the ‘‘A’’ (‘‘Asset quality’’) or ‘‘S’’ (‘‘Sensitivity to market risk’’) components, in place of or to limit the effect of the one-year asset growth measure.
The one-year asset growth measure will raise assessment rates for established small banks that grow rapidly (other than through merger or by acquiring failed banks), but will not increase assessments for normal asset growth.33 The FDIC analyzed whether replacing the one-year asset growth measure with the CAMELS component ratings suggested by some commenters would improve the statistical model underlying the small bank assessment system adopted in this final rule. The FDIC’s analyses show that, when the asset growth measure is replaced by the CAMELS components suggested by commenters, the components are highly statistically insignificant.34 35 Thus, these CAMELS components cannot be used to substitute for the one-year asset growth measure.
Combining the Brokered Deposit Ratio and One-Year Asset Growth Measure
The FDIC received 4 comment letters on the 2016 revised NPR suggesting that the FDIC use a measure that increases assessments only for banks that have both rapid asset growth and high levels of brokered deposits, similar to the current adjusted brokered deposit ratio. Commenters asserted that using separate variables is not supported by the nature of brokered deposit risk or by the
statistical model underlying the proposed small bank deposit insurance system. One commenter submitted the results of a statistical analysis it had undertaken that, in the commenter’s view, demonstrates that a combined measure performed better in more recent years. (The commenter was unable to use CAMELS ratings in its statistical analysis, since these ratings are confidential.)
The FDIC conducted its own backtest of the assessment system in the final rule and compared it with a backtest of an assessment system using a combined measure, as suggested by commenters. The FDIC’s comparison revealed that, overall, the assessment system in the final rule actually performed better in recent years, particularly immediately before the recent banking crisis, in discriminating between banks that failed within three years and those that did not.36
Moreover, as discussed earlier, brokered deposits pose risks other than enabling banks to engage in rapid asset growth. Brokered deposits increase a bank’s probability of failure (even after controlling for asset growth) and increase the loss to the DIF in the event of failure.37 In addition, rapid asset growth can be funded by liabilities other than brokered deposits. The FDIC’s analysis of the 354 banks that, during the recent crisis, grew rapidly in the years before they failed reveals that, while brokered deposits funded a
VerDate Sep<11>2014 19:17 May 19, 2016 Jkt 238001 PO 00000 Frm 00007 Fmt 4701 Sfmt 4700 E:\FR\FM\20MYR3.SGM 20MYR3mst
ocks
till o
n D
SK
3G9T
082P
RO
D w
ith R
ULE
S3

32186 Federal Register / Vol. 81, No. 98 / Friday, May 20, 2016 / Rules and Regulations
38 ‘‘Industry-wide’’ charge-off rates are charge-off rates for all small banks.
39 Credit card loans were excluded from the loan mix index because they produced anomalously high assessment rates for banks with significant credit card loans. Credit card loans have very high charge- off rates, but they also tend to have very high interest rates to compensate. In addition, few small
banks have significant concentrations of credit card loans.
40 As discussed above, the loan mix index uses loan charge-off data from 2001 through 2014.
The table shows industry-wide weighted charge- off percentage rates, the loan category as a percentage of total assets, and the products to two
decimal places. In fact, the final rule uses seven decimal places for industry-wide weighted charge- off percentage rates, and as many decimal places as permitted by the FDIC’s computer systems for the loan category as a percentage of total assets and the products. The total (the loan mix index itself) uses three decimal places.
significant amount of growth, other funding sources also contributed significantly to growth. Increasing assessments only for banks that have both high levels of brokered deposits and rapid asset growth would allow small banks to have large amounts of brokered deposits or rapid asset growth without any effect on their assessment rates.
Loan Mix Index The loan mix index is a measure of
the extent to which a bank’s total assets include higher-risk categories of loans. The index uses historical industry-wide charge-off rates to identify loan types with higher risk.38 Each category of loan in a bank’s loan portfolio is divided by
the bank’s total assets to determine the percentage of the bank’s assets represented by that category of loan. Each percentage is then multiplied by that category of loan’s historical weighted average industry-wide charge- off rate. The products are then summed to determine the loan mix index value for that bank.
The loan categories in the loan mix index were selected based on the availability of category-specific charge- off rates over a sufficiently lengthy period (2001 through 2014) to be representative. The loan categories exclude credit card loans.39 For each loan category’s weighted-average industry-wide charge-off rate, the
weight for each year’s charge-off rate is proportional to the number of bank failures in that year. Thus, charge-off rates from 2008 through 2014, during the recent banking crisis, have a much greater influence on the weighted- average charge-off rate than do charge- off rates from the years before the crisis, when few failures occurred. The weighted averages assure that types of loans that have high charge-off rates during downturns (i.e., periods marked by significant DIF losses) have an appropriate influence on assessment rates.
Table 6 below illustrates how the loan mix index is calculated for a hypothetical bank.
TABLE 6—LOAN MIX INDEX FOR A HYPOTHETICAL BANK 40
Weighted charge-off
rate percent
Loan category as a percent of
hypothetical bank’s
total assests
Product of two columns
to the left
Construction & Development ................................................................................................... 4.50 1.40 6.29 Commercial & Industrial .......................................................................................................... 1.60 24.24 38.75 Leases ..................................................................................................................................... 1.50 0.64 0.96 Other Consumer ...................................................................................................................... 1.46 14.93 21.74 Loans to Foreign Government ................................................................................................. 1.34 0.24 0.32 Real Estate Loans Residual .................................................................................................... 1.02 0.11 0.11 Multifamily Residential ............................................................................................................. 0.88 2.42 2.14 Nonfarm Nonresidential ........................................................................................................... 0.73 13.71 9.99 1–4 Family Residential ............................................................................................................ 0.70 2.27 1.58 Loans to Depository banks ...................................................................................................... 0.58 1.15 0.66 Agricultural Real Estate ........................................................................................................... 0.24 3.43 0.82 Agriculture ................................................................................................................................ 0.24 5.91 1.44
SUM (Loan Mix Index) ..................................................................................................... ........................ 70.45 84.79
The weighted charge-off rates in the table are the same for all established small banks. The remaining two columns vary from bank to bank, depending on the bank’s loan portfolio. For each loan type, the value in the rightmost column is calculated by multiplying the weighted charge-off rate by the bank’s loans of that type as a percent of its total assets. In this illustration, the sum of the right-hand column (84.79) is the loan mix index for this bank.
The FDIC received 30 comments on the 2015 NPR and 11 comments on the revised 2016 NPR (10 from the same commenters who responded to the 2015 NPR) on the loan mix index. These comments expressed views that the loan
mix index is a poor indicator of risk because it does not account for factors such as the quality of loan underwriting, geographic variation, risk mitigating factors such as collateral or guarantees, and an individual bank’s historical loss ratios. Commenters argued that these factors are more relevant to an individual bank’s risk than industry- wide charge-off rates for each loan type based on the most recent financial crisis. Several commenters argued for modifying the loan mix index, while others argued for eliminating the loan mix index and instead using measures of a bank’s own average asset quality over time (delinquencies, nonperforming assets, and net charge- offs, for example, as suggested by a
banking trade group) or CAMELS component ratings.
For several reasons, the loan mix index does not incorporate a bank’s quality of loan underwriting, geographic variation, risk mitigating factors, or individual historical loss rates on types of loans. First, as some commenters noted, the data that banks report in the Call Report are not sufficient or specific enough to distinguish these risk factors by loan category. Collecting the data needed to take these factors into account likely would not improve the assessment system’s ability to distinguish for risk enough to warrant the additional reporting burden it would impose on small banks.
VerDate Sep<11>2014 19:17 May 19, 2016 Jkt 238001 PO 00000 Frm 00008 Fmt 4701 Sfmt 4700 E:\FR\FM\20MYR3.SGM 20MYR3mst
ocks
till o
n D
SK
3G9T
082P
RO
D w
ith R
ULE
S3

32187 Federal Register / Vol. 81, No. 98 / Friday, May 20, 2016 / Rules and Regulations
41 Although the measures suggested by the commenters reflect loan quality, including them in the statistical model does not add information beyond that already provided by other measures, since the statistical model in the final rule also relies on six other measures based on a banks’ own balance sheet and income statement.
42 Under the suggested alternative, the ‘‘A’’ component was not statistically significant, and some of the results of the analysis suggested that
assessment rates should increase for a bank with a better ‘‘A’’ component ratings, rather than decrease. Estimation problems of this nature can occur when new variables are added that are strongly correlated with variables already in a model.
43 See FDIC Study on Core Deposits and Brokered Deposits (2011), Appendix A: Excerpts from Material Loss Reviews And Summaries of OIG Semiannual Reports to Congress (66–68).
44 FDIC. (December 1997). History of the Eighties—Lessons for the Future, www.fdic.gov/bank/historical/history/contents.html.
45 The FDIC tested how well the assessment system in the final rule would have differentiated between banks that failed and those that did not during the recent crisis compared to an assessment system that used a loan mix index based upon simple averages of annual charge-off rates for each loan type. The FDIC used out-of-sample accuracy ratios to test how well each version of the system would have differentiated between banks that failed within the projection period and those that did not. The projection period in each case was the three years following the date of the projection; the dates of projection were the last day of the years 2006 through 2011. (An accuracy ratio compares how well a model would have discriminated between banks that failed within the projection period and banks that did not.) For the projections from the end of 2006 and 2007, accuracy ratios for the assessment system in the final rule were significantly better. For other years, the accuracy ratios were not materially different. (Accuracy ratios are discussed in more detail later.)
46 The effect on assessment rates of an incremental increase in a loan category balance in the loan mix index varies depending on whether a small bank is paying the minimum or maximum rate applicable to the bank’s CAMELS composite rating or is paying a rate between the minimum and maximum under the final rule. For example, a small bank that is paying the maximum assessment rate for a bank with its CAMELS composite rating will continue to pay the maximum rate even if it
Continued
Second, underwriting quality directly or indirectly affects, and is reflected in, several other measures in the financial ratios method, including the weighted average CAMELS component rating, the nonperforming loans and leases measure, the other real estate owned measure, and the net income measure. Therefore, the final rule should not deter a bank from making well underwritten loans of any type, since good underwriting quality will be reflected in other financial and supervisory measures and will reduce the bank’s assessment rate.
Third, an individual bank’s loss rates on the types of loans in the loan mix index do not necessarily demonstrate how the bank will fare in the future. Low loss rates may result from lending in areas that suffered less in the recent downturn. If a bank’s low loss rates simply reflect comparatively less stressful conditions in the bank’s primary lending area during the past crisis, they will not reveal how the bank would fare during a period of severe stress similar to that recently observed in other areas of the country. Since it is not possible to predict which areas of the country will be affected by the next downturn, the loan mix index uses industry-wide average annual charge-off rates for each category of loan, including commercial and development (C&D) and commercial and industrial (C&I) loans, weighted by the number of bank failures in each year.
Although these reasons are sufficient to preclude replacing the loan mix index, the FDIC nevertheless undertook statistical analyses of a trade group’s suggestion to replace the loan mix index with a bank’s own recent history of delinquencies, nonperforming assets, and net charge-offs. The FDIC tried various combinations of these measures, but the measures did not perform as well as the measures in the statistical model in the final rule in estimating the likelihood of failure.41
The FDIC also analyzed whether replacing the loan mix index with the ‘‘A’’ CAMELS component, as suggested by some commenters, would improve the statistical model. Again, the statistical model in the final rule performed better in estimating failure probability than this alternative.42
Several commenters argued that the loan mix index, which uses charge-off rates from 2001 through 2014, is weighted too heavily by the most recent recession. For example, some commenters cited the failure of agricultural and residential mortgage lenders in the 1980s and early 1990s. Several commenters said that the weighted charge-off rates assigned to C&D and C&I loans are inappropriately high.
The loan mix index uses loan charge- off data from 2001 through 2014 to calculate weights for each loan category because charge-off data for some of the loan categories in the loan mix index is not available before 2001. Nevertheless, asset concentrations in commercial real estate (CRE) loans—in particular, C&D loans—have been found to contribute to bank failures in both the recent crisis and the earlier crisis of the 1980s and early 1990s. For example, Material Loss Reviews and Reports to Congress from the FDIC Office of Inspector General (OIG) have concluded that significant concentrations in riskier assets, such as C&D loans (also termed acquisition, development, and construction, or ADC loans), and other CRE loans, contribute to bank failure.43 The FDIC’s analysis of the banking crisis of the 1980s and early 1990s also finds that concentrations of CRE loans (including C&D loans) relative to total assets were higher for banks that subsequently failed than for banks that did not fail.44 FDIC analysis finds that established small banks that had a ratio of C&D loans to assets of 50 percent or more as of the end of 2008 failed over the next five years at ten times the rate of established small banks with lower ratios.
One banking trade group suggested that the annual industry-wide charge-off rates used to determine charge-off rates in the loan mix index should not be weighted more heavily in years with many bank failures than in years with few bank failures.
Annual industry-wide charge-off rates for each type of loan in the loan mix index are weighted by the number of bank failures in each year to assure that types of loans that have high charge-off rates during downturns have an appropriate influence on assessment
rates. Loss rates observed in periods characterized by a higher rate of bank failures are more relevant to the risk of loss to the DIF than loss experience in other periods.
Nevertheless, the FDIC conducted a backtest of the assessment system in the final rule and compared it with a backtest of an assessment system that uses a loan mix index based on a simple average of industry-wide annual charge- off rates (where each annual charge-off rate is weighted equally) for each loan type, as suggested by the commenter. The FDIC’s comparison revealed that the assessment system in the final rule would have performed better, particularly in the early part of the last crisis, in discriminating between banks that subsequently failed within three years and those that did not fail.45
According to 24 commenters, the use of annual industry-wide charge-off rates weighted by bank failures during the recent crisis could lead banks to reduce certain types of lending and increase others.
The loan mix index reflects the performance of loan types over many years and appropriately assigns higher assessment rates to banks with concentrations in types of loans that have been demonstrated over two crises to be more costly to the DIF than to banks that do not have such concentrations. FDIC analysis finds only a small effect—or none at all—on a small bank’s assessment rate from an incremental increase in the balance of any loan category (including C&D loans) in the loan mix index.46 Consequently,
VerDate Sep<11>2014 19:17 May 19, 2016 Jkt 238001 PO 00000 Frm 00009 Fmt 4701 Sfmt 4700 E:\FR\FM\20MYR3.SGM 20MYR3mst
ocks
till o
n D
SK
3G9T
082P
RO
D w
ith R
ULE
S3

32188 Federal Register / Vol. 81, No. 98 / Friday, May 20, 2016 / Rules and Regulations
increases its loan balances, so the marginal effect is zero. Similarly, most small banks that are paying the minimum assessment rate for banks with their CAMELS composite rating will continue to do so even with an incremental increase in any particular type of lending. For a small bank whose assessment rate is between the minimum and maximum rate, an incremental increase in a particular type of lending will, at most, result in only a small increase in a bank’s assessment rate.
Since the effect of an incremental increase in a loan category balance on a bank’s assessment rate will be small, the loan mix index is not likely to have a material effect on a bank’s lending decisions.
47 See 80 FR at 40858.
48 For CAMELS 1- and 2-rated institutions, examinations generally occur on a 12- or 18-month cycle. 12 U.S.C.1820(d). Under interim final rules published on February 29, 2016, the Federal
banking agencies increased the number of small banks eligible for an 18-month examination cycle rather than a 12-month cycle to reduce regulatory burden on small, well-capitalized and well- managed institutions and allow the agencies to better focus their supervisory resources on those institutions that present capital, managerial, or other issues of supervisory concern. Qualifying well-capitalized and well-managed banks with less than $1 billion in total assets are eligible for an 18- month examination cycle. See 81 FR 10063 (Feb. 29, 2016).
49 See 80 FR at 40858. 50 See FDIC Study on Core Deposits and Brokered
Deposits (2011), Appendix A: Excerpts from Material Loss Reviews And Summaries of OIG Semiannual Reports to Congress, 66–68.
the loan mix index should not materially affect banks’ lending decisions.
Several commenters on both the 2015 NPR and the 2016 revised NPR criticized the assumption that the future will follow the path of any single past period, noting that future bank failures may be characterized by different portfolio mixes than in the last recession.
As discussed above, the method adopted in the final rule is based upon a statistical analysis of the available data. Any empirical analysis necessarily relies upon past data. While there is no guarantee that the risks that led to past failures will necessarily be identical to those that lead to future failures, past experience still provides a sound basis for evaluating risk.
As also discussed above, each of the measures used in the final rule, including the loan mix index, is a statistically significant predictor of bank failure. Use of a loan portfolio measure is also consistent with numerous academic papers.47
Leverage Ratio
The FDIC received 4 comments on the 2016 revised NPR and 14 comments on the 2015 NPR asserting that the weight (or multiplier) assigned to the leverage ratio was too high compared to the current system and ‘‘would unfairly penalize banks that meet the ’well capitalized’ standard but do not hold excess capital . . . ’’ Commenters argued that there is no statistical evidence that well-managed banks with strong capital are significantly weakened by not holding more capital and further, excessive capital can be counterproductive. For banks that are well-capitalized and have a CAMELS composite rating of 1 or 2, two commenters suggested reducing the weight of the leverage ratio and capping the benefit at 8 percent.
The FDIC disagrees. The greater a bank’s capital, the better the bank is able to withstand stress and avoid failure. Consequently, reducing the assessment rate for a bank that holds capital above
the minimum level necessary to be considered well capitalized is appropriate. Further, as stated above, each of the measures in the established small bank assessment system is a statistically significant predictor of bank failure, and the multipliers used in the final rule for the leverage ratio and for all of the measures are derived from an empirical, statistical analysis. As also described above, because the final rule eliminates risk categories, applies the financial ratios method to all established small banks, and uses some new measures, the multipliers assigned to the financial measures, including the leverage ratio, are necessarily different from the multipliers in the current Risk Category I financial ratios method.
CAMELS Ratings
The FDIC received 17 comments on the 2015 NPR and 11 comments on the revised 2016 NPR (5 from commenters who had similar comments on the 2015 NPR) related to the role of CAMELS ratings in determining a bank’s assessment rate. The commenters suggested that the FDIC should more heavily weight CAMELS supervisory ratings over other measures, including the loan mix index, the one-year asset growth ratio, and the brokered deposit ratio, because CAMELS ratings reflect more current, bank specific data and judgments by examiners who are familiar with each bank’s business model and risks. Some commenters suggested using individual CAMELS component ratings in place of or to limit the effect of other measures. For example, as described above, some commenters suggested using the ‘‘A’’ CAMELS component in place of a loan mix index.
For several reasons, these comments have not led to changes in the final rule. First, compared to the current system, the value of the multiplier for the weighted average CAMELS component rating has increased. CAMELS ratings are among the useful predictors of a bank’s probability of failure and, as under current rules, continue to be a significant determinant of assessment rates under the final rule. The final rule uses both a bank’s financial measures and its weighted average CAMELS component rating to determine an assessment rate. Financial ratios can provide updated information on an institution’s risk profile between bank examinations and allow greater differentiation in risk.48 To take into
account idiosyncratic and unquantifiable risks and risk mitigators that are reflected in CAMELS composite ratings, the final rule also establishes minimum and maximum assessment rates for established small banks based on these ratings. Thus, the final rule prevents the assessment system from assigning a rate that reflects either too little risk (for a bank with a CAMELS composite 3, 4, or 5 rating) or too much risk (for a bank with a CAMELS composite 1 or 2 rating).
Second, the variables selected and used in the underlying statistical model are consistent with other existing models of bank risk, including FDIC offsite monitoring models and academic literature. For example, FDIC offsite monitoring models measure bank conditions and monitor bank risk using variables that include: The ratio of charge-offs to total assets, asset growth, an index measuring changes in loan mix, and capital. Numerous academic papers discussing models that predict bank failures include explanatory variables that include loan portfolio ratios, rapid asset growth, the ratio of core deposits to total assets, and capital.49 Rapid asset growth, reliance on brokered deposits, and significant concentrations in riskier assets have all been found to contribute to bank failure.50
Third, as stated above, each of the measures in the established small bank assessment system is a statistically significant predictor of bank failure, and the multipliers used in the final rule for weighted average CAMELS component ratings and for all of the financial measures are derived from an empirical, statistical analysis. Commenters did not cite or provide empirical evidence to support their suggestion that a greater weight be assigned to CAMELS supervisory ratings, or that a lower weight (or effectively no weight) be assigned to various financial measures.
As described above, because the final rule eliminates risk categories and applies the financial ratios method to all established small banks, and uses some
VerDate Sep<11>2014 19:17 May 19, 2016 Jkt 238001 PO 00000 Frm 00010 Fmt 4701 Sfmt 4700 E:\FR\FM\20MYR3.SGM 20MYR3mst
ocks
till o
n D
SK
3G9T
082P
RO
D w
ith R
ULE
S3

32189 Federal Register / Vol. 81, No. 98 / Friday, May 20, 2016 / Rules and Regulations
51 Current rules provide that: (1) Under specified conditions, certain subsidiary small banks will be considered established rather than new, 12 CFR 327.8(k)(4); and (2) the time that a bank has spent as a federally insured credit union is included in determining whether a bank is established, 12 CFR 327.8(k)(5). If a Risk Category I small bank is considered established under these rules, but has no CAMELS component ratings, its initial assessment rate is 2 basis points above the minimum initial assessment rate applicable to Risk Category I (which is equivalent to 2 basis points above the minimum initial assessment rate for established small banks) until it receives CAMELS component ratings. Thereafter, the assessment rate is determined by annualizing, where appropriate, financial ratios obtained from all quarterly Call Reports that have been filed, until the bank files four quarterly Call Reports.
Under the final rule, for small banks that are considered established under these rules, but do not have a CAMELS composite rating or do not have CAMELS component ratings:
1. If the bank has no CAMELS composite rating, its initial assessment rate will be 2 basis points above the minimum initial assessment rate for established small banks until it receives a CAMELS composite rating; and
2. If the bank has a CAMELS composite rating but no CAMELS component ratings, its initial assessment rate will be determined using the financial ratios method by substituting its CAMELS composite rating for its weighted average CAMELS component rating and, if the bank has not yet filed four quarterly Call Reports, by annualizing, where appropriate, financial ratios obtained from all quarterly Call Reports that have been filed.
52 As under rules currently in effect, the brokered deposit adjustment will continue to apply to all new small institutions in Risk Categories II, III, and IV, and all large and highly complex institutions, except large and highly complex institutions that are well capitalized and have a CAMELS composite rating of 1 or 2. As under rules currently in effect, the brokered deposit adjustment will not apply to insured branches.
53 As under rules currently in effect, however, no adjustments apply to bridge banks or
conservatorships. These banks will continue to be charged the minimum assessment rate applicable to small banks.
54 See 12 CFR 327.10(b); 76 FR at 10718. 55 The reserve ratio for the immediately prior
assessment period must also be less than 2 percent.
new measures, the multipliers assigned to the financial measures, including the weighted average CAMELS component rating, are necessarily different from the multipliers in the current Risk Category I financial ratios method.
In sum, the financial ratios method in the final rule, including the multipliers assigned to the financial measures and weighted average CAMELS component ratings, predicts failures significantly better than the current system.
Calculating the Initial Assessment Rate As in the current methodology for
Risk Category I small banks, under the final rule the weighted CAMELS components and financial ratios will be multiplied by statistically derived pricing multipliers, the products summed, and the sum added to a uniform amount that is: (a) Derived from the statistical analysis; (b) adjusted for assessment rates set by the FDIC; and (c) applied to all established small banks.51 The total will equal the bank’s initial assessment rate. If, however, the resulting rate is below the minimum
initial assessment rate for established small banks, the bank’s initial assessment rate will be the minimum initial assessment rate; if the rate is above the maximum, then the bank’s initial assessment rate will be the maximum initial rate for established small banks. In addition, if the resulting rate for an established small bank is below the minimum or above the maximum initial assessment rate applicable to banks with the bank’s CAMELS composite rating, the bank’s initial assessment rate will be the respective minimum or maximum assessment rate for an established small bank with its CAMELS composite rating. This approach allows rates to vary incrementally across a wide range of rates for all established small banks. The conversion of the statistical model to pricing multipliers and the uniform amount is discussed further below and in detail in appendix E to the 2016 revised NPR.
Adjustments to Initial Base Assessment Rates
As discussed above, the final rule eliminates the existing brokered deposit adjustment for established small banks.52 Under current rules, the brokered deposit adjustment applies to small banks only if they are in Risk Category II, III, and IV. The brokered deposit adjustment increases a bank’s assessment when it holds significant amounts of brokered deposits. To avoid assessing banks twice for holding brokered deposits (because the brokered deposit ratio will apply to all established small banks), the final rule eliminates the brokered deposit adjustment for established small banks.
As under current rules, the DIDA continues to apply to all banks, and the unsecured debt adjustment continues to apply to all banks except new banks and insured branches.53
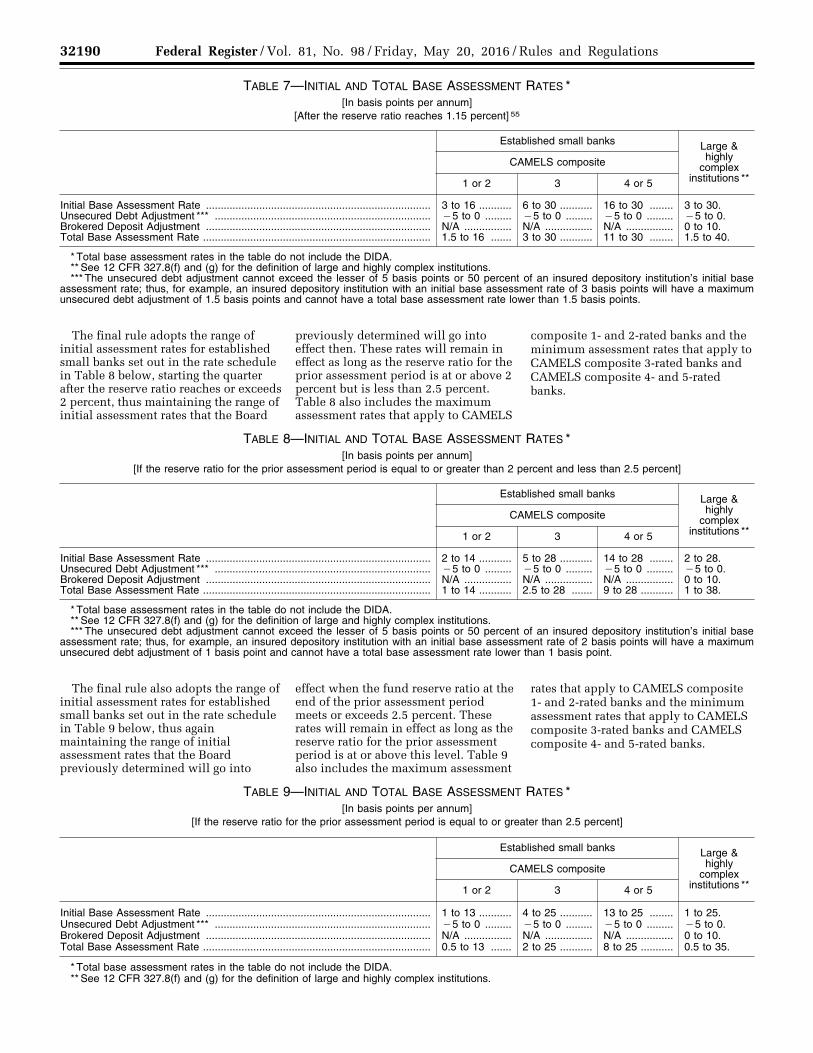
Assessment Rates
The final rule preserves the lower overall range of initial base assessment rates previously adopted by the Board. Under current regulations, once the reserve ratio reaches 1.15 percent, initial base assessment rates will decline automatically from the current range of 5 basis points to 35 basis points to a range of 3 basis points to 30 basis points, as reflected in Table 4. The FDIC adopted the range of initial assessment rates in this rate schedule pursuant to its long-term fund management plan as the FDIC’s best estimate of the assessment rates that would have been needed from 1950 to 2010 to maintain a positive fund balance during the past two banking crises. This assessment rate schedule remains the FDIC’s best estimate of the long-term rates needed. Consequently, and as discussed in greater detail further below and in appendix E to the 2016 revised NPR, the final rule converts the statistical model to assessment rates within this range of 3 basis points to 30 basis points in a revenue neutral way; that is, in a manner that does not materially change the aggregate assessment revenue collected from established small banks.
The final rule eliminates risk categories and adopts the range of initial assessment rates for established small banks set out in Table 7 below, thus maintaining the range of initial assessment rates that the Board has previously determined will go into effect starting the quarter after the reserve ratio reaches 1.15 percent.54 These rates will remain in effect as long as the reserve ratio is less than 2 percent. Table 7 also includes the maximum assessment rates that apply to CAMELS composite 1- and 2-rated banks and the minimum assessment rates that apply to CAMELS composite 3-rated banks and CAMELS composite 4- and 5-rated banks.
VerDate Sep<11>2014 19:17 May 19, 2016 Jkt 238001 PO 00000 Frm 00011 Fmt 4701 Sfmt 4700 E:\FR\FM\20MYR3.SGM 20MYR3mst
ocks
till o
n D
SK
3G9T
082P
RO
D w
ith R
ULE
S3
32190 Federal Register / Vol. 81, No. 98 / Friday, May 20, 2016 / Rules and Regulations
TABLE 7—INITIAL AND TOTAL BASE ASSESSMENT RATES * [In basis points per annum]
[After the reserve ratio reaches 1.15 percent] 55
Established small banks Large & highly
complex institutions **
CAMELS composite
1 or 2 3 4 or 5
Initial Base Assessment Rate ............................................................................ 3 to 16 ........... 6 to 30 ........... 16 to 30 ........ 3 to 30. Unsecured Debt Adjustment *** ......................................................................... ¥5 to 0 ......... ¥5 to 0 ......... ¥5 to 0 ......... ¥5 to 0. Brokered Deposit Adjustment ............................................................................ N/A ................ N/A ................ N/A ................ 0 to 10. Total Base Assessment Rate ............................................................................. 1.5 to 16 ....... 3 to 30 ........... 11 to 30 ........ 1.5 to 40.
* Total base assessment rates in the table do not include the DIDA. ** See 12 CFR 327.8(f) and (g) for the definition of large and highly complex institutions. *** The unsecured debt adjustment cannot exceed the lesser of 5 basis points or 50 percent of an insured depository institution’s initial base
assessment rate; thus, for example, an insured depository institution with an initial base assessment rate of 3 basis points will have a maximum unsecured debt adjustment of 1.5 basis points and cannot have a total base assessment rate lower than 1.5 basis points.
The final rule adopts the range of initial assessment rates for established small banks set out in the rate schedule in Table 8 below, starting the quarter after the reserve ratio reaches or exceeds 2 percent, thus maintaining the range of initial assessment rates that the Board
previously determined will go into effect then. These rates will remain in effect as long as the reserve ratio for the prior assessment period is at or above 2 percent but is less than 2.5 percent. Table 8 also includes the maximum assessment rates that apply to CAMELS
composite 1- and 2-rated banks and the minimum assessment rates that apply to CAMELS composite 3-rated banks and CAMELS composite 4- and 5-rated banks.
TABLE 8—INITIAL AND TOTAL BASE ASSESSMENT RATES * [In basis points per annum]
[If the reserve ratio for the prior assessment period is equal to or greater than 2 percent and less than 2.5 percent]
Established small banks Large & highly
complex institutions **
CAMELS composite
1 or 2 3 4 or 5
Initial Base Assessment Rate ............................................................................ 2 to 14 ........... 5 to 28 ........... 14 to 28 ........ 2 to 28. Unsecured Debt Adjustment *** ......................................................................... ¥5 to 0 ......... ¥5 to 0 ......... ¥5 to 0 ......... ¥5 to 0. Brokered Deposit Adjustment ............................................................................ N/A ................ N/A ................ N/A ................ 0 to 10. Total Base Assessment Rate ............................................................................. 1 to 14 ........... 2.5 to 28 ....... 9 to 28 ........... 1 to 38.
* Total base assessment rates in the table do not include the DIDA. ** See 12 CFR 327.8(f) and (g) for the definition of large and highly complex institutions. *** The unsecured debt adjustment cannot exceed the lesser of 5 basis points or 50 percent of an insured depository institution’s initial base
assessment rate; thus, for example, an insured depository institution with an initial base assessment rate of 2 basis points will have a maximum unsecured debt adjustment of 1 basis point and cannot have a total base assessment rate lower than 1 basis point.
The final rule also adopts the range of initial assessment rates for established small banks set out in the rate schedule in Table 9 below, thus again maintaining the range of initial assessment rates that the Board previously determined will go into
effect when the fund reserve ratio at the end of the prior assessment period meets or exceeds 2.5 percent. These rates will remain in effect as long as the reserve ratio for the prior assessment period is at or above this level. Table 9 also includes the maximum assessment
rates that apply to CAMELS composite 1- and 2-rated banks and the minimum assessment rates that apply to CAMELS composite 3-rated banks and CAMELS composite 4- and 5-rated banks.
TABLE 9—INITIAL AND TOTAL BASE ASSESSMENT RATES * [In basis points per annum]
[If the reserve ratio for the prior assessment period is equal to or greater than 2.5 percent]
Established small banks Large & highly
complex institutions **
CAMELS composite
1 or 2 3 4 or 5
Initial Base Assessment Rate ............................................................................ 1 to 13 ........... 4 to 25 ........... 13 to 25 ........ 1 to 25. Unsecured Debt Adjustment *** ......................................................................... ¥5 to 0 ......... ¥5 to 0 ......... ¥5 to 0 ......... ¥5 to 0. Brokered Deposit Adjustment ............................................................................ N/A ................ N/A ................ N/A ................ 0 to 10. Total Base Assessment Rate ............................................................................. 0.5 to 13 ....... 2 to 25 ........... 8 to 25 ........... 0.5 to 35.
* Total base assessment rates in the table do not include the DIDA. ** See 12 CFR 327.8(f) and (g) for the definition of large and highly complex institutions.
VerDate Sep<11>2014 19:17 May 19, 2016 Jkt 238001 PO 00000 Frm 00012 Fmt 4701 Sfmt 4700 E:\FR\FM\20MYR3.SGM 20MYR3mst
ocks
till o
n D
SK
3G9T
082P
RO
D w
ith R
ULE
S3

32191 Federal Register / Vol. 81, No. 98 / Friday, May 20, 2016 / Rules and Regulations
56 The final rule converts a linear version of the model, which was estimated in a non-linear manner. (See appendix E to the 2016 revised NPR.) The conversion using a linear version of the model preserves the same rank ordering as the non-linear model, but using the linear version of the model allows initial assessment rates to be expressed as a linear function of the model variables. The FDIC also used a linear version of its original non-linear
downgrade probability statistical model when it instituted variable rates within Risk Category 1 effective January 1, 2007. See 71 FR 69282 (Nov. 30, 2006).
57 Initial assessment rates under the rate schedule actually in effect for the fourth quarter of 2015 ranged from 5 basis points to 35 basis points, since the DIF reserve ratio was under 1.15 percent.
58 Table 10 assumes that the assessment rate schedule in Table 7 is in effect. The uniform amount and pricing multipliers differ for the assessment rates in Tables 8 and 9.
59 Also as discussed above, for certain lagged variables, such as one-year asset growth rates, the statistical analysis also used bank financial data from 1984.
*** The unsecured debt adjustment cannot exceed the lesser of 5 basis points or 50 percent of an insured depository institution’s initial base assessment rate; thus, for example, an insured depository institution with an initial base assessment rate of 1 basis point will have a maximum unsecured debt adjustment of 0.5 basis points and cannot have a total base assessment rate lower than 0.5 basis points.
With respect to each of the three assessment rate schedules (Tables 7, 8 and 9), the Board retains its authority to uniformly adjust assessment rates up or down from the total base assessment rate schedule without further rulemaking, as long as the adjustment does not exceed 2 basis points. Also, with respect to each of the three schedules, if a bank’s CAMELS composite or component ratings change during a quarter in a way that changes the institution’s initial base assessment rate, then its assessment rate will be determined separately for each portion of the quarter in which it had different CAMELS composite or component ratings.
Conversion of Statistical Model to Pricing Multipliers and Uniform Amount
As discussed above, the final rule converts the statistical model to the assessment rates set out in Table 7 in a revenue neutral manner.56 Specifically, and as described in detail in appendix E to the 2016 revised NPR, the final rule converts the statistical model to assessment rates to ensure that aggregate assessments under the final rule for the assessment period ending December 31, 2015, would have been approximately the same as they would have been under the assessment rate schedule set forth in Table 4 (the rates that, under current rules, will automatically go into effect when the reserve ratio reaches 1.15 percent).57
Table 10 below sets out the pricing multipliers and uniform amounts that result when the FDIC converts the statistical model to the assessment rate schedule set out in Table 7 (with a range of assessment rates from 3 basis points to 30 basis points).
TABLE 10—PRICING MULTIPLIERS AND THE UNIFORM AMOUNT 58
Model measures Pricing multiplier
Weighted Average CAMELS Component Rating ................ 1.519
Leverage Ratio ......................... ¥1.264 Net Income Before Taxes/Total
Assets ................................... ¥0.720 Nonperforming Loans and
Leases/Gross Assets ............ 0.942 Other Real Estate Owned/
Gross Assets ......................... 0.533 Brokered Deposit Ratio ............ 0.264 One Year Asset Growth ........... 0.061 Loan Mix Index ......................... 0.081 Uniform Amount ........................ 7.352
Updating the Statistical Model, Pricing Multipliers and Uniform Amount
As discussed above, the statistical analysis used bank financial data and CAMELS ratings from 1985 through 2011, failure data from 1986 through 2014, and loan charge-off data from 2001 through 2014.59 The FDIC does not anticipate the need for frequent updates, since variables and coefficients in the underlying model are not likely to change much absent a significant number of failures. In any event, any changes to the small bank deposit insurance pricing model will go through notice-and-comment rulemaking. The FDIC received two comments on the 2016 revised NPR supporting the use of notice-and-comment rulemaking for any future changes to the small bank deposit insurance pricing model.
Insured Branches of Foreign Banks and New Small Banks
The final rule makes no changes to the current rules governing the assessment rate schedules applicable to insured branches or to the assessment rate schedule applicable to new small banks. The final rule also makes no changes to the way in which assessment rates for insured branches and new small banks are determined.
III. Expected Effects of the Final Rule
Effect on Assessment Rates
To illustrate the effects of the final rule on established small bank assessment rates, the FDIC compared actual assessment rates under the current system for established small banks for the fourth quarter of 2015, using a range of initial assessment rates of 5 basis points to 35 basis points, with the assessment rates in Table 7 of this final rule, which has an overall range of initial assessment rates of 3 basis points to 30 basis points; the assessment rates in Table 7 will take effect the quarter after the DIF reserve ratio reaches 1.15 percent. The proportion (and number) of established small banks paying the minimum initial assessment rate would have increased significantly, from 27 percent (1,632 small banks) to 58 percent under the final rule (3,552 small banks). The proportion (and number) of established small banks paying the maximum initial assessment rate would have decreased from 0.6 percent of established small banks (35 small banks) to 0.1 percent of established small banks under the final rule (6 small banks). Chart 1 below graphically compares the distribution of established small bank initial assessment rates under this illustration. The horizontal axis in the chart represents established small banks ranked by risk, from the least risky on the left to the most risky on the right. Because actual risk rankings under the current system differ from risk rankings under the final rule, a particular point on the horizontal axis is not likely to represent the same bank for the current system and the final rule. Thus, the chart does not show how an individual bank’s assessment would change under the final rule; it simply compares the distribution of assessment rates under the current system to the distribution under the final rule.
VerDate Sep<11>2014 19:17 May 19, 2016 Jkt 238001 PO 00000 Frm 00013 Fmt 4701 Sfmt 4700 E:\FR\FM\20MYR3.SGM 20MYR3mst
ocks
till o
n D
SK
3G9T
082P
RO
D w
ith R
ULE
S3

32192 Federal Register / Vol. 81, No. 98 / Friday, May 20, 2016 / Rules and Regulations
60 As discussed above, a bank’s total assessment rate may vary from the initial assessment rate as the result of possible adjustments. Under the current
system, there are three possible adjustments: the unsecured debt adjustment, the DIDA, and the brokered deposit adjustment. Under the final rule,
the brokered deposit adjustment is eliminated for established small banks, but the unsecured debt adjustment and the DIDA remain.
Due in large part to the overall decline in rates once the reserve ratio reaches 1.15 percent reflected in Table 7, most established small banks (5,655 or 93 percent) would have had lower total assessment rates under the final rule.60 Among Risk Category I established small banks, 93 percent would have had rate decreases; the average decrease for these banks would have been 2.6 basis points. Of the Risk Category II, III, and IV established small banks, 97 percent would have had rate decreases; the average decrease would have been 7.1 basis points. A total of 423 established small banks (7 percent of established small banks) would have had rate increases. Of the Risk Category I
established small banks, 7 percent would have had rate increases; the average increase would have been 1.6 basis points. Of the Risk Category II, III, and IV established small banks, 3 percent would have had rate increases; the average increase would have been 3.0 basis points. The results of the comparison are similar to those that resulted from like comparisons in the 2015 NPR and 2016 revised NPR.
To further illustrate the effects of the final rule on small bank assessment rates, the FDIC compared hypothetical assessment rates under the final rule with the assessment rates established small banks would have been charged for the fourth quarter of 2015 if the
assessment rate schedule in Table 4, which, under current rules, will go into effect when the reserve ratio reaches 1.15 percent, had been in effect. The proportion of established small banks paying the minimum initial assessment rate would also have increased from 27 percent to 58 percent under the final rule, and the proportion of established small banks paying the maximum initial assessment rate would also have decreased from 0.6 percent of established small banks to 0.1 percent of established small banks under the final rule. Chart 2 below graphically compares the distribution of established small bank initial assessment rates under this illustration.
VerDate Sep<11>2014 19:17 May 19, 2016 Jkt 238001 PO 00000 Frm 00014 Fmt 4701 Sfmt 4700 E:\FR\FM\20MYR3.SGM 20MYR3 ER
20M
Y16
.164
</G
PH
>
mst
ocks
till o
n D
SK
3G9T
082P
RO
D w
ith R
ULE
S3

32193 Federal Register / Vol. 81, No. 98 / Friday, May 20, 2016 / Rules and Regulations
Most established small banks (3,400 or 56 percent) would have had lower total assessment rates. Among Risk Category I established small banks, 52 percent would have had rate decreases; the average decrease for these banks would have been 1.3 basis points. Of the Risk Category II, III, and IV established small banks, 93 percent would have had rate decreases; the average decrease would have been 4.6 basis points. 1,235 established small banks (20 percent of established small banks) would have had rate increases. Of the Risk Category I established small banks, 22 percent would have had rate increases; the average increase would have been 1.8 basis points. Of the Risk Category II, III, and IV established small banks, 6 percent would have had rate increases; the average increase would have been 3.3 basis points. Again, the results of the comparison are similar to like comparisons in the 2015 NPR and the 2016 revised NPR.
Effect on Capital and Earnings
Summary
Using balance sheet and trailing twelve month income data as of the fourth quarter of 2015, the FDIC analyzed the effects of the final rule on capital and income in two ways: (1) The effect of the final rule under the rate schedule in Table 7 (with an initial assessment rate range of 3 basis points to 30 basis points (F330)) compared to the current small bank deposit insurance assessment system under the rate schedule in Table 3 (with an initial assessment rate range of 5 basis points to 35 basis points (C535)) (the first comparison); and (2) the effect of the final rule compared to the current small bank deposit insurance assessment system under the rate schedule in Table 4 (with an initial assessment rate range of 3 basis points to 30 basis points; under current rules, this rate schedule will go into effect the quarter after the DIF reserve ratio reaches 1.15 percent (C330)) (the second comparison).
Under either comparison, the final rule will cause no small bank to fall below a 4 percent or 2 percent leverage ratio if the bank would otherwise be above these thresholds. Under the first comparison, the final rule will cause no small bank to rise above a 2 percent leverage ratio if the bank would otherwise be below this threshold, but will cause one bank to rise above a 4 percent leverage ratio. Under the second comparison, the final rule will cause no small bank to rise above a 2 percent or 4 percent leverage ratio if the bank would otherwise be below these thresholds.
In the first comparison, only approximately 7 percent of profitable established small banks and approximately 5 percent of unprofitable small banks will face a rate increase. All but a very few (20) of these banks will have resulting declines in income (or increases in losses, where the bank is unprofitable) of 5 percent or less. As discussed above, assessment rates for approximately 93 percent of established
VerDate Sep<11>2014 19:17 May 19, 2016 Jkt 238001 PO 00000 Frm 00015 Fmt 4701 Sfmt 4700 E:\FR\FM\20MYR3.SGM 20MYR3 ER
20M
Y16
.165
</G
PH
>
mst
ocks
till o
n D
SK
3G9T
082P
RO
D w
ith R
ULE
S3

32194 Federal Register / Vol. 81, No. 98 / Friday, May 20, 2016 / Rules and Regulations
61 As discussed earlier, at present, the Call Report combines extraordinary items with two other adjustments: (1) The results of discontinued operations; and (2) the cumulative effect of changes in accounting principles not reported elsewhere in the Call Report. As discussed in a previous footnote, however, in January 2015, the concept of extraordinary items was eliminated from GAAP for fiscal years and interim periods within those fiscal
years beginning after December 15, 2015, and extraordinary items will no longer be reported as such in the Call Report. In addition, the cumulative effect of changes in accounting principles will no longer be reported as an adjustment. The results of discontinued operations, however, will continue to be reported as an adjustment. Because the three adjustments cannot be disaggregate in Call Report data, income in the analysis is measured before all
three adjustments, even though only one adjustment will apply in the future. In any event, extraordinary items and the cumulative effect of changes in accounting principles are rarely reported and should have little effect on the analysis.
small banks will decline, resulting in increases in income (or decreases in losses), some of which will be substantial. The effects on earnings of established small banks under the final rule in this comparison do not differ materially from the effects discussed in the 2015 NPR and 2016 NPR.
In the second comparison, approximately 21 percent of profitable established small banks and approximately 13 percent of unprofitable established small banks will face a rate increase. All but 76 of these banks will have resulting declines in income (or increases in losses, where the bank is unprofitable) of 5 percent or less. As discussed above, assessment rates for approximately 56 percent of established small banks will decline, resulting in increases in income (or decreases in losses), some of which will be substantial. The effects on earnings of established small banks under the final rule in this comparison do not differ materially from the effects discussed in the 2015 NPR and 2016 revised NPR.
In sum, because the final rule is intended to generate the same total revenue from small banks as would have been generated absent the final rule, the final rule should, overall, have no material effect on the capital and earnings of the banking industry, although the final rule will affect the earnings and capital of individual institutions.
Detailed Analysis
Assumptions and Data The analysis assumes that annual pre-
tax income for each established small bank is equal to trailing twelve month income as of the fourth quarter of 2015. The analysis also assumes that the
effects of changes in assessments are not transferred to customers in the form of changes in borrowing rates, deposit rates, or service fees. Since deposit insurance assessments are a tax- deductible operating expense, increases in the assessment expense can lower taxable income and decreases in the assessment expense can increase taxable income. Therefore, the analysis considers the effective after-tax cost of assessments in calculating the effect on capital.
The effect of the change in assessments on an established small bank’s income is measured by the change in deposit insurance assessments as a percent of income before assessments, taxes, and extraordinary items and other adjustments (hereafter referred to as ‘‘income’’).61 This income measure is used to eliminate the potentially transitory effects of extraordinary items and taxes on profitability. To facilitate a comparison of the effect of assessment changes, established small banks were assigned to one of two groups: Those that were profitable and those that were unprofitable for the twelve months ending December 31, 2015. For this analysis, data as of December 31, 2015, are used to calculate each bank’s assessment base and risk-based assessment rate. The base and rate are assumed to remain constant throughout the one-year projection period. An established small bank’s earnings retention and dividend policies also influence the extent to which assessments affect equity levels. If an established small bank maintains the same dollar amount of dividends when it pays a higher deposit insurance assessment under the proposed rule,
equity (retained earnings) will be less by the full amount of the after-tax cost of the increase in the assessment. This analysis instead assumes that an established small bank will maintain its dividend rate (that is, dividends as a fraction of net income) unchanged from the weighted average rate reported over the four quarters ending December 31, 2015.
Projected Effects on Capital and Earnings Assuming a Change in the Initial Assessment Rate Range From 5 Basis Points to 35 Basis Points to 3 Basis Points to 30 Basis Points (Assessment Change F330–C535)
Under this scenario, the FDIC projects that no established small bank facing an increase in assessments will, as a result of the assessment increase, fall below a 4 percent or 2 percent leverage ratio. No established small bank facing a decrease in assessments will, as a result of the decrease, have its leverage ratio rise above a 2 percent leverage ratio, but one bank will rise above a 4 percent leverage ratio.
The FDIC projects that approximately 85 percent of established small banks that were profitable during the 12 months ending December 31, 2015, will have a decrease in assessments in an amount between 0 and 10 percent of income. Table 11 shows that another 8 percent of profitable established small banks will have a reduction in assessments exceeding 10 percent of their income. A total of 407 profitable established small banks will have an increase in assessments, with all but 10 of them facing assessment increases between 0 and 10 percent of their income.
TABLE 11—EFFECT OF THE FINAL RULE ON INCOME FOR PROFITABLE ESTABLISHED SMALL BANKS [F330 compared to C535]
Change in assessments relative to income
Institutions Assets
Number
Percent of total profitable
established small banks
Assets ($ billions)
Percent of total assets of profitable established small banks
Decrease over 40% ......................................................................................... 88 2 18 1 Decrease 20% to 40% ..................................................................................... 96 2 18 1 Decrease 10% to 20% ..................................................................................... 283 5 66 2 Decrease 5% to 10% ....................................................................................... 572 10 154 5
VerDate Sep<11>2014 19:17 May 19, 2016 Jkt 238001 PO 00000 Frm 00016 Fmt 4701 Sfmt 4700 E:\FR\FM\20MYR3.SGM 20MYR3mst
ocks
till o
n D
SK
3G9T
082P
RO
D w
ith R
ULE
S3
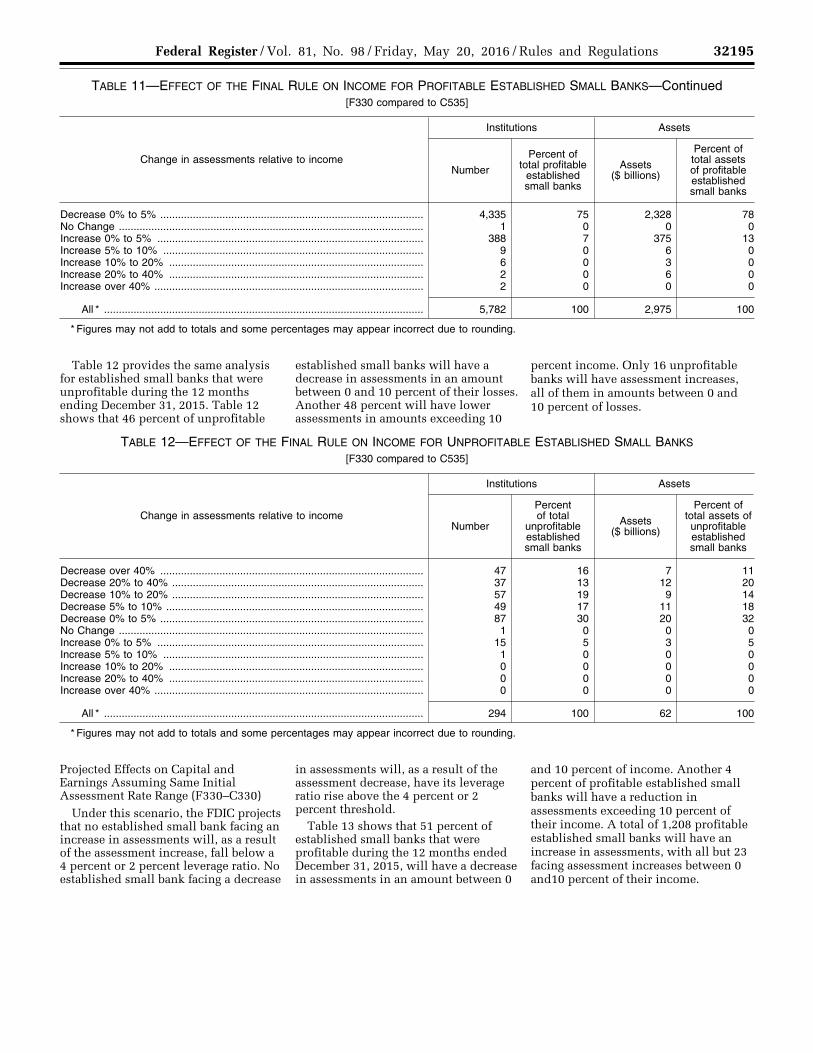
32195 Federal Register / Vol. 81, No. 98 / Friday, May 20, 2016 / Rules and Regulations
TABLE 11—EFFECT OF THE FINAL RULE ON INCOME FOR PROFITABLE ESTABLISHED SMALL BANKS—Continued [F330 compared to C535]
Change in assessments relative to income
Institutions Assets
Number
Percent of total profitable
established small banks
Assets ($ billions)
Percent of total assets of profitable established small banks
Decrease 0% to 5% ......................................................................................... 4,335 75 2,328 78 No Change ....................................................................................................... 1 0 0 0 Increase 0% to 5% .......................................................................................... 388 7 375 13 Increase 5% to 10% ........................................................................................ 9 0 6 0 Increase 10% to 20% ...................................................................................... 6 0 3 0 Increase 20% to 40% ...................................................................................... 2 0 6 0 Increase over 40% ........................................................................................... 2 0 0 0
All * ............................................................................................................ 5,782 100 2,975 100
* Figures may not add to totals and some percentages may appear incorrect due to rounding.
Table 12 provides the same analysis for established small banks that were unprofitable during the 12 months ending December 31, 2015. Table 12 shows that 46 percent of unprofitable
established small banks will have a decrease in assessments in an amount between 0 and 10 percent of their losses. Another 48 percent will have lower assessments in amounts exceeding 10
percent income. Only 16 unprofitable banks will have assessment increases, all of them in amounts between 0 and 10 percent of losses.
TABLE 12—EFFECT OF THE FINAL RULE ON INCOME FOR UNPROFITABLE ESTABLISHED SMALL BANKS [F330 compared to C535]
Change in assessments relative to income
Institutions Assets
Number
Percent of total
unprofitable established small banks
Assets ($ billions)
Percent of total assets of unprofitable established small banks
Decrease over 40% ......................................................................................... 47 16 7 11 Decrease 20% to 40% ..................................................................................... 37 13 12 20 Decrease 10% to 20% ..................................................................................... 57 19 9 14 Decrease 5% to 10% ....................................................................................... 49 17 11 18 Decrease 0% to 5% ......................................................................................... 87 30 20 32 No Change ....................................................................................................... 1 0 0 0 Increase 0% to 5% .......................................................................................... 15 5 3 5 Increase 5% to 10% ........................................................................................ 1 0 0 0 Increase 10% to 20% ...................................................................................... 0 0 0 0 Increase 20% to 40% ...................................................................................... 0 0 0 0 Increase over 40% ........................................................................................... 0 0 0 0
All * ............................................................................................................ 294 100 62 100
* Figures may not add to totals and some percentages may appear incorrect due to rounding.
Projected Effects on Capital and Earnings Assuming Same Initial Assessment Rate Range (F330–C330)
Under this scenario, the FDIC projects that no established small bank facing an increase in assessments will, as a result of the assessment increase, fall below a 4 percent or 2 percent leverage ratio. No established small bank facing a decrease
in assessments will, as a result of the assessment decrease, have its leverage ratio rise above the 4 percent or 2 percent threshold.
Table 13 shows that 51 percent of established small banks that were profitable during the 12 months ended December 31, 2015, will have a decrease in assessments in an amount between 0
and 10 percent of income. Another 4 percent of profitable established small banks will have a reduction in assessments exceeding 10 percent of their income. A total of 1,208 profitable established small banks will have an increase in assessments, with all but 23 facing assessment increases between 0 and10 percent of their income.
VerDate Sep<11>2014 19:17 May 19, 2016 Jkt 238001 PO 00000 Frm 00017 Fmt 4701 Sfmt 4700 E:\FR\FM\20MYR3.SGM 20MYR3mst
ocks
till o
n D
SK
3G9T
082P
RO
D w
ith R
ULE
S3

32196 Federal Register / Vol. 81, No. 98 / Friday, May 20, 2016 / Rules and Regulations
62 The current small bank deposit insurance assessment system did not exist at the end of 2006 and existed in somewhat different forms in years before 2011. The comparison assumes that the small bank deposit insurance assessment system in its current form existed in each year of the comparison.
63 A ‘‘perfect’’ projection is defined as one where the projection rates every bank that fails over the projection period as more risky than every bank that does not fail. A random projection is one where the
TABLE 13—EFFECT OF THE FINAL RULE ON INCOME FOR PROFITABLE ESTABLISHED SMALL BANKS [F330 compared to C330]
Change in assessments relative to income
Institutions Assets
Number
Percent of total profitable
established small banks
Assets ($ billions)
Percent of total assets of profitable established small banks
Decrease over 40% ......................................................................................... 43 1 7 0 Decrease 20% to 40% ..................................................................................... 50 1 11 0 Decrease 10% to 20% ..................................................................................... 121 2 22 1 Decrease 5% to 10% ....................................................................................... 282 5 79 3 Decrease 0% to 5% ......................................................................................... 2,655 46 1,160 39 No Change ....................................................................................................... 1,423 25 591 20 Increase 0% to 5% .......................................................................................... 1,139 20 1,057 36 Increase 5% to 10% ........................................................................................ 46 1 34 1 Increase 10% to 20% ...................................................................................... 12 0 7 0 Increase 20% to 40% ...................................................................................... 7 0 7 0 Increase over 40% ........................................................................................... 4 0 1 0
All * ............................................................................................................ 5,782 100 2,975 100
* Figures may not add to totals and some percentages may appear incorrect due to rounding.
Table 14 provides the same analysis for established small banks that were unprofitable during the 12 months ending December 31, 2015. Table 14 shows that 54 percent of unprofitable
established small banks will have a decrease in assessments in an amount between 0 and 10 percent of their losses. Another 30 percent will have lower assessments in amounts exceeding 10
percent of their losses. Only 39 unprofitable banks will face assessment increases, all but 3 of them in amounts between 0 and 10 percent of losses.
TABLE 14—EFFECT OF THE FINAL RULE ON INCOME FOR UNPROFITABLE ESTABLISHED SMALL BANKS [F330 compared to C330]
Change in assessments relative to losses
Institutions Assets
Number
Percent of total
unprofitable established small banks
Assets ($ billions)
Percent of total assets of unprofitable established small banks
Decrease over 40% ......................................................................................... 28 10 5 7 Decrease 20% to 40% ..................................................................................... 23 8 2 4 Decrease 10% to 20% ..................................................................................... 38 13 14 22 Decrease 5% to 10% ....................................................................................... 54 18 7 11 Decrease 0% to 5% ......................................................................................... 105 36 26 41 No Change ....................................................................................................... 7 2 1 2 Increase 0% to 5% .......................................................................................... 32 11 6 9 Increase 5% to 10% ........................................................................................ 4 1 1 2 Increase 10% to 20% ...................................................................................... 2 1 0 1 Increase 20% to 40% ...................................................................................... 1 0 0 0 Increase over 40% ........................................................................................... 0 0 0 0
All * ............................................................................................................ 294 100 62 100
* Figures may not add to totals and some percentages may appear incorrect due to rounding.
IV. Backtesting To evaluate the final rule, the FDIC
tested how well the assessment system in the final rule would have differentiated between banks that failed and those that did not during the recent crisis compared to the current small bank deposit insurance assessment system.
Table 15 compares accuracy ratios for the assessment system in the final rule and the current system. An accuracy ratio compares how well each approach
would have discriminated between banks that failed within the projection period and those that did not. The projection period in each case is the three years following the date of the projection (the first column), which is the last day of the year given. Thus, for example, the accuracy ratios for 2006 reflect how well each approach would have discriminated in its projection between banks that failed and those that
did not from 2007 through 2009.62 A ‘‘perfect’’ projection would receive an accuracy ratio of 1; a random projection would receive an accuracy ratio of 0.63
VerDate Sep<11>2014 19:17 May 19, 2016 Jkt 238001 PO 00000 Frm 00018 Fmt 4701 Sfmt 4700 E:\FR\FM\20MYR3.SGM 20MYR3mst
ocks
till o
n D
SK
3G9T
082P
RO
D w
ith R
ULE
S3
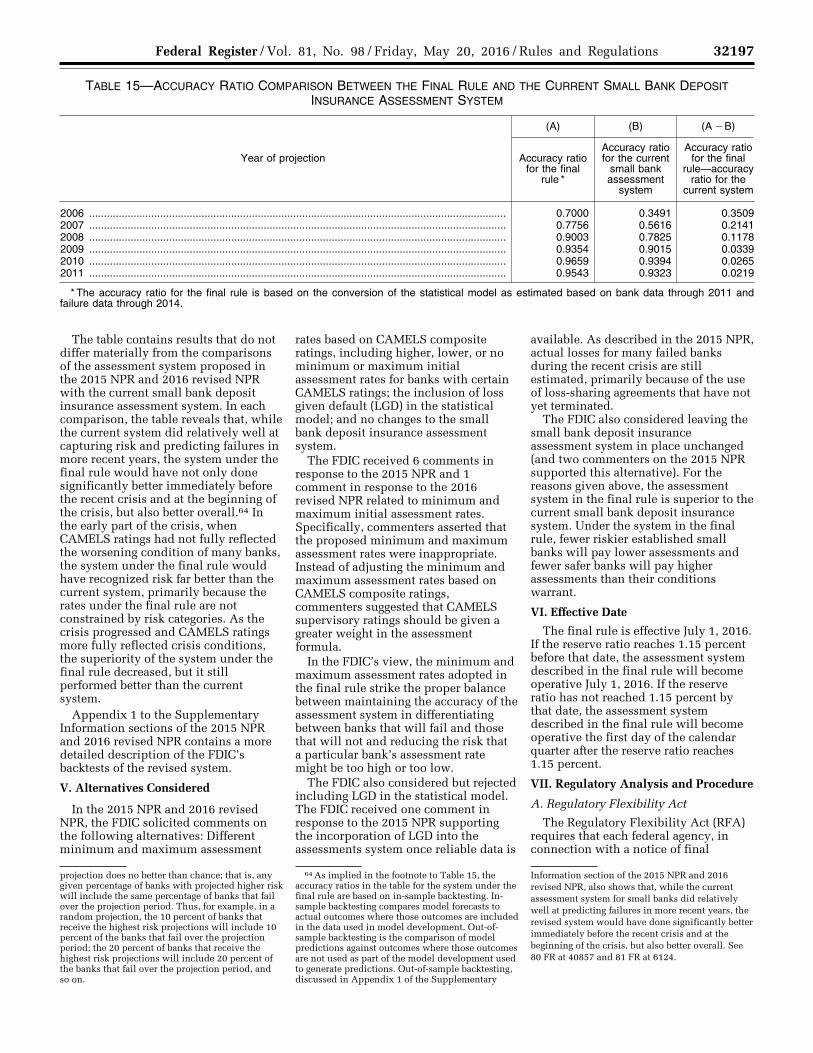
32197 Federal Register / Vol. 81, No. 98 / Friday, May 20, 2016 / Rules and Regulations
projection does no better than chance; that is, any given percentage of banks with projected higher risk will include the same percentage of banks that fail over the projection period. Thus, for example, in a random projection, the 10 percent of banks that receive the highest risk projections will include 10 percent of the banks that fail over the projection period; the 20 percent of banks that receive the highest risk projections will include 20 percent of the banks that fail over the projection period, and so on.
64 As implied in the footnote to Table 15, the accuracy ratios in the table for the system under the final rule are based on in-sample backtesting. In- sample backtesting compares model forecasts to actual outcomes where those outcomes are included in the data used in model development. Out-of- sample backtesting is the comparison of model predictions against outcomes where those outcomes are not used as part of the model development used to generate predictions. Out-of-sample backtesting, discussed in Appendix 1 of the Supplementary
Information section of the 2015 NPR and 2016 revised NPR, also shows that, while the current assessment system for small banks did relatively well at predicting failures in more recent years, the revised system would have done significantly better immediately before the recent crisis and at the beginning of the crisis, but also better overall. See 80 FR at 40857 and 81 FR at 6124.
TABLE 15—ACCURACY RATIO COMPARISON BETWEEN THE FINAL RULE AND THE CURRENT SMALL BANK DEPOSIT INSURANCE ASSESSMENT SYSTEM
Year of projection
(A) (B) (A ¥B)
Accuracy ratio for the final
rule *
Accuracy ratio for the current
small bank assessment
system
Accuracy ratio for the final
rule—accuracy ratio for the
current system
2006 ............................................................................................................................................. 0.7000 0.3491 0.3509 2007 ............................................................................................................................................. 0.7756 0.5616 0.2141 2008 ............................................................................................................................................. 0.9003 0.7825 0.1178 2009 ............................................................................................................................................. 0.9354 0.9015 0.0339 2010 ............................................................................................................................................. 0.9659 0.9394 0.0265 2011 ............................................................................................................................................. 0.9543 0.9323 0.0219
* The accuracy ratio for the final rule is based on the conversion of the statistical model as estimated based on bank data through 2011 and failure data through 2014.
The table contains results that do not differ materially from the comparisons of the assessment system proposed in the 2015 NPR and 2016 revised NPR with the current small bank deposit insurance assessment system. In each comparison, the table reveals that, while the current system did relatively well at capturing risk and predicting failures in more recent years, the system under the final rule would have not only done significantly better immediately before the recent crisis and at the beginning of the crisis, but also better overall.64 In the early part of the crisis, when CAMELS ratings had not fully reflected the worsening condition of many banks, the system under the final rule would have recognized risk far better than the current system, primarily because the rates under the final rule are not constrained by risk categories. As the crisis progressed and CAMELS ratings more fully reflected crisis conditions, the superiority of the system under the final rule decreased, but it still performed better than the current system.
Appendix 1 to the Supplementary Information sections of the 2015 NPR and 2016 revised NPR contains a more detailed description of the FDIC’s backtests of the revised system.
V. Alternatives Considered
In the 2015 NPR and 2016 revised NPR, the FDIC solicited comments on the following alternatives: Different minimum and maximum assessment
rates based on CAMELS composite ratings, including higher, lower, or no minimum or maximum initial assessment rates for banks with certain CAMELS ratings; the inclusion of loss given default (LGD) in the statistical model; and no changes to the small bank deposit insurance assessment system.
The FDIC received 6 comments in response to the 2015 NPR and 1 comment in response to the 2016 revised NPR related to minimum and maximum initial assessment rates. Specifically, commenters asserted that the proposed minimum and maximum assessment rates were inappropriate. Instead of adjusting the minimum and maximum assessment rates based on CAMELS composite ratings, commenters suggested that CAMELS supervisory ratings should be given a greater weight in the assessment formula.
In the FDIC’s view, the minimum and maximum assessment rates adopted in the final rule strike the proper balance between maintaining the accuracy of the assessment system in differentiating between banks that will fail and those that will not and reducing the risk that a particular bank’s assessment rate might be too high or too low.
The FDIC also considered but rejected including LGD in the statistical model. The FDIC received one comment in response to the 2015 NPR supporting the incorporation of LGD into the assessments system once reliable data is
available. As described in the 2015 NPR, actual losses for many failed banks during the recent crisis are still estimated, primarily because of the use of loss-sharing agreements that have not yet terminated.
The FDIC also considered leaving the small bank deposit insurance assessment system in place unchanged (and two commenters on the 2015 NPR supported this alternative). For the reasons given above, the assessment system in the final rule is superior to the current small bank deposit insurance system. Under the system in the final rule, fewer riskier established small banks will pay lower assessments and fewer safer banks will pay higher assessments than their conditions warrant.
VI. Effective Date
The final rule is effective July 1, 2016. If the reserve ratio reaches 1.15 percent before that date, the assessment system described in the final rule will become operative July 1, 2016. If the reserve ratio has not reached 1.15 percent by that date, the assessment system described in the final rule will become operative the first day of the calendar quarter after the reserve ratio reaches 1.15 percent.
VII. Regulatory Analysis and Procedure
A. Regulatory Flexibility Act
The Regulatory Flexibility Act (RFA) requires that each federal agency, in connection with a notice of final
VerDate Sep<11>2014 19:17 May 19, 2016 Jkt 238001 PO 00000 Frm 00019 Fmt 4701 Sfmt 4700 E:\FR\FM\20MYR3.SGM 20MYR3mst
ocks
till o
n D
SK
3G9T
082P
RO
D w
ith R
ULE
S3
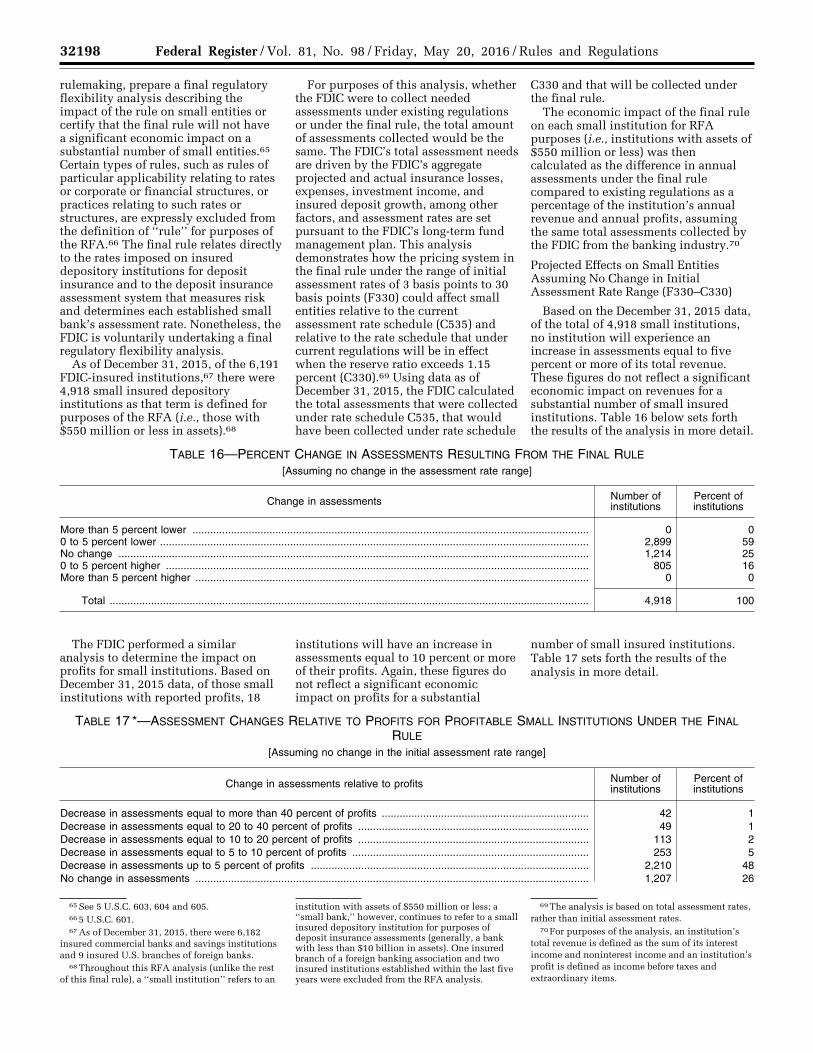
32198 Federal Register / Vol. 81, No. 98 / Friday, May 20, 2016 / Rules and Regulations
65 See 5 U.S.C. 603, 604 and 605. 66 5 U.S.C. 601. 67 As of December 31, 2015, there were 6,182
insured commercial banks and savings institutions and 9 insured U.S. branches of foreign banks.
68 Throughout this RFA analysis (unlike the rest of this final rule), a ‘‘small institution’’ refers to an
institution with assets of $550 million or less; a ‘‘small bank,’’ however, continues to refer to a small insured depository institution for purposes of deposit insurance assessments (generally, a bank with less than $10 billion in assets). One insured branch of a foreign banking association and two insured institutions established within the last five years were excluded from the RFA analysis.
69 The analysis is based on total assessment rates, rather than initial assessment rates.
70 For purposes of the analysis, an institution’s total revenue is defined as the sum of its interest income and noninterest income and an institution’s profit is defined as income before taxes and extraordinary items.
rulemaking, prepare a final regulatory flexibility analysis describing the impact of the rule on small entities or certify that the final rule will not have a significant economic impact on a substantial number of small entities.65 Certain types of rules, such as rules of particular applicability relating to rates or corporate or financial structures, or practices relating to such rates or structures, are expressly excluded from the definition of ‘‘rule’’ for purposes of the RFA.66 The final rule relates directly to the rates imposed on insured depository institutions for deposit insurance and to the deposit insurance assessment system that measures risk and determines each established small bank’s assessment rate. Nonetheless, the FDIC is voluntarily undertaking a final regulatory flexibility analysis.
As of December 31, 2015, of the 6,191 FDIC-insured institutions,67 there were 4,918 small insured depository institutions as that term is defined for purposes of the RFA (i.e., those with $550 million or less in assets).68
For purposes of this analysis, whether the FDIC were to collect needed assessments under existing regulations or under the final rule, the total amount of assessments collected would be the same. The FDIC’s total assessment needs are driven by the FDIC’s aggregate projected and actual insurance losses, expenses, investment income, and insured deposit growth, among other factors, and assessment rates are set pursuant to the FDIC’s long-term fund management plan. This analysis demonstrates how the pricing system in the final rule under the range of initial assessment rates of 3 basis points to 30 basis points (F330) could affect small entities relative to the current assessment rate schedule (C535) and relative to the rate schedule that under current regulations will be in effect when the reserve ratio exceeds 1.15 percent (C330).69 Using data as of December 31, 2015, the FDIC calculated the total assessments that were collected under rate schedule C535, that would have been collected under rate schedule
C330 and that will be collected under the final rule.
The economic impact of the final rule on each small institution for RFA purposes (i.e., institutions with assets of $550 million or less) was then calculated as the difference in annual assessments under the final rule compared to existing regulations as a percentage of the institution’s annual revenue and annual profits, assuming the same total assessments collected by the FDIC from the banking industry.70
Projected Effects on Small Entities Assuming No Change in Initial Assessment Rate Range (F330–C330)
Based on the December 31, 2015 data, of the total of 4,918 small institutions, no institution will experience an increase in assessments equal to five percent or more of its total revenue. These figures do not reflect a significant economic impact on revenues for a substantial number of small insured institutions. Table 16 below sets forth the results of the analysis in more detail.
TABLE 16—PERCENT CHANGE IN ASSESSMENTS RESULTING FROM THE FINAL RULE [Assuming no change in the assessment rate range]
Change in assessments Number of institutions
Percent of institutions
More than 5 percent lower ...................................................................................................................................... 0 0 0 to 5 percent lower ................................................................................................................................................. 2,899 59 No change ............................................................................................................................................................... 1,214 25 0 to 5 percent higher ............................................................................................................................................... 805 16 More than 5 percent higher ..................................................................................................................................... 0 0
Total .................................................................................................................................................................. 4,918 100
The FDIC performed a similar analysis to determine the impact on profits for small institutions. Based on December 31, 2015 data, of those small institutions with reported profits, 18
institutions will have an increase in assessments equal to 10 percent or more of their profits. Again, these figures do not reflect a significant economic impact on profits for a substantial
number of small insured institutions. Table 17 sets forth the results of the analysis in more detail.
TABLE 17 *—ASSESSMENT CHANGES RELATIVE TO PROFITS FOR PROFITABLE SMALL INSTITUTIONS UNDER THE FINAL RULE
[Assuming no change in the initial assessment rate range]
Change in assessments relative to profits Number of institutions
Percent of institutions
Decrease in assessments equal to more than 40 percent of profits ...................................................................... 42 1 Decrease in assessments equal to 20 to 40 percent of profits .............................................................................. 49 1 Decrease in assessments equal to 10 to 20 percent of profits .............................................................................. 113 2 Decrease in assessments equal to 5 to 10 percent of profits ................................................................................ 253 5 Decrease in assessments up to 5 percent of profits .............................................................................................. 2,210 48 No change in assessments ..................................................................................................................................... 1,207 26
VerDate Sep<11>2014 19:17 May 19, 2016 Jkt 238001 PO 00000 Frm 00020 Fmt 4701 Sfmt 4700 E:\FR\FM\20MYR3.SGM 20MYR3mst
ocks
till o
n D
SK
3G9T
082P
RO
D w
ith R
ULE
S3

32199 Federal Register / Vol. 81, No. 98 / Friday, May 20, 2016 / Rules and Regulations
TABLE 17 *—ASSESSMENT CHANGES RELATIVE TO PROFITS FOR PROFITABLE SMALL INSTITUTIONS UNDER THE FINAL RULE—Continued
[Assuming no change in the initial assessment rate range]
Change in assessments relative to profits Number of institutions
Percent of institutions
Increase in assessments up to 5 percent of profits ................................................................................................ 716 15 Increase in assessments equal to 5 to 10 percent of profits .................................................................................. 34 1 Increase in assessments equal to 10 to 20 percent of profits ................................................................................ 9 0 Increase in assessments equal to 20 to 40 percent of profits ................................................................................ 5 0 Increase in assessments equal to more than 40 percent of profits ........................................................................ 4 0
Total .................................................................................................................................................................. 4,642 ** 100
* Institutions with negative or no profit were excluded. These institutions are shown in Table 14. ** Figures may not add to totals due to rounding.
Table 17 excludes small institutions that either show no profit or show a loss, because a percentage cannot be calculated. The FDIC analyzed the effect of the final rule on these institutions by determining the annual assessment
change (either an increase or a decrease) that will result. Table 18 below shows that 18 (seven percent) of the 276 small insured institutions with negative or no reported profits will have an increase of $20,000 or more in their annual
assessments. Again, these figures do not reflect a significant economic impact on profits for a substantial number of small insured institutions.
TABLE 18—CHANGE IN ASSESSMENTS FOR UNPROFITABLE SMALL INSTITUTIONS RESULTING FROM THE FINAL RULE [Assuming no change in the initial assessment rate range]
Change in assessments Number of institutions
Percent of institutions
$20,000 or more decrease ...................................................................................................................................... 115 42 $10,000–$20,000 decrease ..................................................................................................................................... 53 19 $5,000–$10,000 decrease ....................................................................................................................................... 28 10 $1,000–$5,000 decrease ......................................................................................................................................... 30 11 $0–$1,000 decrease ................................................................................................................................................ 7 3 No change ............................................................................................................................................................... 7 3 $0–$1,000 increase ................................................................................................................................................. 5 2 $1,000–$5,000 increase .......................................................................................................................................... 3 1 $5,000–$10,000 increase ........................................................................................................................................ 4 1 $10,000–$20,000 increase ...................................................................................................................................... 6 2 $20,000 increase or more ....................................................................................................................................... 18 7
Total .................................................................................................................................................................. 276 * 100
* Figures may not add to totals due to rounding.
Projected Effects on Small Entities Assuming Change in the Initial Assessment Rate Range From 5–35 Bps to 3–30 Bps (F330–C535)
Based on the December 31, 2015 data, of the total of 4,918 small institutions,
no institution will experience an increase in assessments equal to five percent or more of its total revenue. These figures do not reflect a significant economic impact on revenues for a substantial number of small insured
institutions. Table 19 below sets forth the results of the analysis in more detail.
TABLE 19—PERCENT CHANGE IN ASSESSMENTS RESULTING FROM THE FINAL RULE [Assuming change in the initial assessment rate range from 5–35 bps to 3–30 bps]
Change in assessments
Number of institutions
Percent of institutions
More than 5 percent lower ...................................................................................................................................... 0 0 0 to 5 percent lower ................................................................................................................................................. 4,660 95 No change ............................................................................................................................................................... 2 0 0 to 5 percent higher ............................................................................................................................................... 256 5 More than 5 percent higher ..................................................................................................................................... 0 0
Total .................................................................................................................................................................. 4,918 100
The FDIC performed a similar analysis to determine the impact on
profits for small institutions. Based on December 31, 2015 data, of those small
institutions with reported profits, 7 institutions will have an increase in
VerDate Sep<11>2014 19:17 May 19, 2016 Jkt 238001 PO 00000 Frm 00021 Fmt 4701 Sfmt 4700 E:\FR\FM\20MYR3.SGM 20MYR3mst
ocks
till o
n D
SK
3G9T
082P
RO
D w
ith R
ULE
S3

32200 Federal Register / Vol. 81, No. 98 / Friday, May 20, 2016 / Rules and Regulations
71 5 U.S.C. 605.
assessments equal to 10 percent or more of their profits. Again, these figures do not reflect a significant economic
impact on profits for a substantial number of small insured institutions.
Table 20 sets forth the results of the analysis in more detail.
TABLE 20*—ASSESSMENT CHANGES RELATIVE TO PROFITS FOR PROFITABLE SMALL INSTITUTIONS UNDER THE FINAL RULE
[Assuming change in the initial assessment rate range from 5–35 Bps to 3–30 Bps]
Change in assessments relative to profits
Number of institutions
Percent of institutions
Decrease in assessments equal to more than 40 percent of profits ...................................................................... 85 2 Decrease in assessments equal to 20 to 40 percent of profits .............................................................................. 90 2 Decrease in assessments equal to 10 to 20 percent of profits .............................................................................. 259 6 Decrease in assessments equal to 5 to 10 percent of profits ................................................................................ 527 11 Decrease in assessments up to 5 percent of profits .............................................................................................. 3,440 74 No change in assessments ..................................................................................................................................... 1 0 Increase in assessments up to 5 percent of profits ................................................................................................ 226 5 Increase in assessments equal to 5 to 10 percent of profits .................................................................................. 7 0 Increase in assessments equal to 10 to 20 percent of profits ................................................................................ 5 0 Increase in assessments equal to 20 to 40 percent of profits ................................................................................ 0 0 Increase in assessments equal to more than 40 percent of profits ........................................................................ 2 0
Total .................................................................................................................................................................. 4,642 ** 100
* Institutions with negative or no profit were excluded. These institutions are shown in Table 17. ** Figures may not add to totals due to rounding.
Table 20 excludes small institutions that either show no profit or show a loss, because a percentage cannot be calculated. The FDIC analyzed the effect of the final rule on these institutions by determining the annual assessment
change (either an increase or a decrease) that will result. Table 21 below shows that just 7 (3 percent) of the 276 small insured institutions with negative or no reported profits will have an increase of $20,000 or more in their annual
assessments. Again, these figures do not reflect a significant economic impact on profits for a substantial number of small insured institutions.
TABLE 21—CHANGE IN ASSESSMENTS FOR UNPROFITABLE SMALL INSTITUTIONS RESULTING FROM THE FINAL RULE [Assuming assessment change in the initial assessment rate range from 5–35 bps to 3–30 bps]
Change in assessments
Number of institutions
Percent of institutions
$20,000 or more decrease ...................................................................................................................................... 181 66 $10,000–$20,000 decrease ..................................................................................................................................... 44 16 $5,000–$10,000 decrease ....................................................................................................................................... 28 10 $1,000–$5,000 decrease ......................................................................................................................................... 5 2 $0–$1,000 decrease ................................................................................................................................................ 2 1 No change ............................................................................................................................................................... 1 0 $0–$1,000 increase ................................................................................................................................................. 0 0 $1,000–$5,000 increase .......................................................................................................................................... 2 1 $5,000–$10,000 increase ........................................................................................................................................ 5 2 $10,000–$20,000 increase ...................................................................................................................................... 1 0 $20,000 increase or more ....................................................................................................................................... 7 3
Total .................................................................................................................................................................. 276 * 100
* Figures may not add to totals due to rounding.
The final rule does not directly impose any ‘‘reporting’’ or ‘‘recordkeeping’’ requirements within the meaning of the Paperwork Reduction Act. The compliance requirements for the final rule will not exceed (and, in fact, will be the same as) existing compliance requirements for the current risk-based deposit insurance assessment system for small banks. The FDIC is unaware of any duplicative, overlapping or conflicting federal rules. The final RFA analysis set forth above demonstrates that the final rule will not
have a significant economic impact on a substantial number of small institutions within the meaning of those terms as used in the RFA.71
B. Small Business Regulatory Enforcement Fairness Act
The Office of Management and Budget has determined that the final rule is not a ‘‘major rule’’ within the meaning of the Small Business Regulatory
Enforcement Fairness Act of 1996 (Title II, Pub. L. 104–121).
C. Riegle Community Development and Regulatory Improvement Act
The Riegle Community Development and Regulatory Improvement Act (RCDRIA) requires that the FDIC, in determining the effective date and administrative compliance requirements of new regulations that impose additional reporting, disclosure, or other requirements on insured depository institutions, consider, consistent with
VerDate Sep<11>2014 19:17 May 19, 2016 Jkt 238001 PO 00000 Frm 00022 Fmt 4701 Sfmt 4700 E:\FR\FM\20MYR3.SGM 20MYR3mst
ocks
till o
n D
SK
3G9T
082P
RO
D w
ith R
ULE
S3
32201 Federal Register / Vol. 81, No. 98 / Friday, May 20, 2016 / Rules and Regulations
72 12 U.S.C. 4802(a). 73 12 U.S.C. 4802(b). 74 44 U.S.C. 3501 et seq.
principles of safety and soundness and the public interest, any administrative burdens that such regulations would place on depository institutions, including small depository institutions, and customers of depository institutions, as well as the benefits of such regulations.72 Subject to certain exceptions, new regulations and amendments to regulations prescribed by a Federal banking agency which impose additional reporting, disclosures, or other new requirements on insured depository institutions shall take effect on the first day of a calendar quarter which begins on or after the date on which the regulations are published in final form.73
In accordance with these provisions and as discussed above, the FDIC considered any administrative burdens, as well as benefits, that the final rule would place on depository institutions and their customers in determining the effective date and administrative compliance requirements of the final rule. Thus, the final rule will be effective no earlier than the first day of a calendar quarter that begins after publication of the rule.
C. Paperwork Reduction Act
In accordance with the requirements of the Paperwork Reduction Act (‘‘PRA’’) of 1995,74 the FDIC may not conduct or sponsor, and the respondent is not required to respond to, an information collection unless it displays a currently valid Office of Management and Budget (‘‘OMB’’) control number.
The final rule does not create any new, or revise any existing, collections of information pursuant to PRA.
D. The Treasury and General Government Appropriations Act, 1999— Assessment of Federal Regulations and Policies on Families
The FDIC has determined that the final rule will not affect family well- being within the meaning of section 654 of the Treasury and General Government Appropriations Act, enacted as part of the Omnibus Consolidated and Emergency Supplemental Appropriations Act of 1999 (Pub. L. 105–277, 112 Stat. 2681).
E. Solicitation of Comments on Use of Plain Language
Section 722 of the Gramm-Leach- Bliley Act, Public Law 106–102, 113 Stat. 1338, 1471 (Nov. 12, 1999), requires the Federal banking agencies to use plain language in all proposed and
final rules published after January 1, 2000. The FDIC invited comments on how to make this proposal easier to understand. No comments addressing this issue were received.
List of Subjects in 12 CFR Part 327
Bank deposit insurance, Banks, Savings associations.
For the reasons set forth above, the FDIC amends part 327 as follows:
PART 327—ASSESSMENTS
■ 1. The authority for 12 CFR part 327 continues to read as follows:
Authority: 12 U.S.C. 1441, 1813, 1815, 1817–19, 1821.
§ 327.3 [Amended]
■ 2. Amend § 327.3, in paragraph (b)(1), by removing ‘‘§§ 327.4(a) and 327.9’’ and adding in its place ‘‘§ 327.4(a) and § 327.9 or § 327.16’’.
§ 327.4 [Amended]
■ 3. Amend § 327.4: ■ a. In paragraph (a), by removing ‘‘§ 327.9’’ and adding in its place ‘‘§ 327.9 or § 327.16’’. ■ b. In paragraph (c), by removing ‘‘§ 327.9(e)(3)’’ and adding in its place ‘‘§§ 327.9(e)(3) and 327.16(f)(3)’’. ■ c. In paragraph (c), by removing ‘‘§ 327.9(f)(5)’’ and adding in its place ‘‘§§ 327.9(f)(5) and 327.16(g)(5)’’. ■ 4. Amend § 327.8: ■ a. In paragraphs (e) and (f), by removing ‘‘§ 327.9(e)’’ and adding in its place ‘‘§§ 327.9(e) and 327.16(f)’’. ■ b. In paragraph (k)(1), by removing ‘‘§ 327.9(f)(3) and (4)’’ and adding in its place ‘‘§§ 327.9(f)(3) and (4) and 327.16 (g)(3) and (4)’’. ■ c. By revising paragraph (l). ■ d. In paragraphs (m), (n), (o), and (p), by removing ‘‘§ 327.9(d)(1)’’ and adding in its place ‘‘§§ 327.9(d)(1) and 327.16(e)(1)’’ and removing ‘‘§ 327.9(d)(2)’’ and adding in its place ‘‘§§ 327.9(d)(2) and 327.16(e)(2).’’ ■ e. By adding paragraphs (v) through (y).
The revision and additions read as follows:
§ 327.8 Definitions.
* * * * * (l) Risk assignment. Under § 327.9, for
all small institutions and insured branches of foreign banks, risk assignment includes assignment to Risk Category I, II, III, or IV and, within Risk Category I, assignment to an assessment rate. Under § 327.16, for all new small institutions and insured branches of foreign banks, risk assignment includes assignment to Risk Category I, II, III, or IV, and for insured branches of foreign
banks within Risk Category I, assignment to an assessment rate or rates. For all established small institutions, and all large institutions and all highly complex institutions, risk assignment includes assignment to an assessment rate. * * * * *
(v) Established small institution. An established small institution is a ‘‘small institution’’ as defined under paragraph (e) of this section that meets the definition of ‘‘established depository institution’’ under paragraph (k) of this section.
(w) New small institution. A new small institution is a ‘‘small institution’’ as defined under paragraph (e) of this section that meets the definition of ‘‘new depository institution’’ under paragraph (j) of this section.
(x) Deposit Insurance Fund and DIF. The Deposit Insurance Fund as defined in 12 U.S.C. 1813(y)(1).
(y) Reserve ratio of the DIF. The reserve ratio as defined in 12 U.S.C. 1813(y)(3). ■ 5. Amend § 327.9 by adding introductory text to read as follows:
§ 327.9 Assessment pricing methods. The following pricing methods shall
apply through the later of June 30, 2016, or the subsequent calendar quarter in which the reserve ratio of the DIF reaches 1.15 percent. * * * * * ■ 6. In § 327.10, revise paragraphs (b) through (f) to read as follows:
§ 327.10 Assessment rate schedules.
* * * * * (b) Assessment rate schedules for
established small institutions and large and highly complex institutions applicable in the first assessment period after June 30, 2016, where the reserve ratio of the DIF as of the end of the prior assessment period has reached or exceeded 1.15 percent, and in all subsequent assessment periods where the reserve ratio of the DIF as of the end of the prior assessment period is less than 2 percent.
(1) Initial base assessment rate schedule for established small institutions and large and highly complex institutions. In the first assessment period after June 30, 2016, where the reserve ratio of the DIF as of the end of the prior assessment period has reached or exceeded 1.15 percent, and for all subsequent assessment periods where the reserve ratio as of the end of the prior assessment period is less than 2 percent, the initial base assessment rate for established small institutions and large and highly
VerDate Sep<11>2014 19:17 May 19, 2016 Jkt 238001 PO 00000 Frm 00023 Fmt 4701 Sfmt 4700 E:\FR\FM\20MYR3.SGM 20MYR3mst
ocks
till o
n D
SK
3G9T
082P
RO
D w
ith R
ULE
S3

32202 Federal Register / Vol. 81, No. 98 / Friday, May 20, 2016 / Rules and Regulations
complex institutions, except as provided in paragraph (f) of this section,
shall be the rate prescribed in the following schedule:
INITIAL BASE ASSESSMENT RATE SCHEDULE BEGINNING THE FIRST ASSESSMENT PERIOD AFTER JUNE 30, 2016, WHERE THE RESERVE RATIO AS OF THE END OF THE PRIOR ASSESSMENT PERIOD HAS REACHED 1.15 PERCENT, AND FOR ALL SUBSEQUENT ASSESSMENT PERIODS WHERE THE RESERVE RATIO AS OF THE END OF THE PRIOR ASSESSMENT PERIOD IS LESS THAN 2 PERCENT 1
Established small institutions Large & highly
complex institutions
CAMELS composite
1 or 2 3 4 or 5
Initial Base Assessment Rate ......................................................................... 3 to 16 ........... 6 to 30 ........... 16 to 30 ......... 3 to 30.
1 All amounts for all risk categories are in basis points annually. Initial base rates that are not the minimum or maximum rate will vary between these rates.
(i) CAMELS composite 1- and 2-rated established small institutions initial base assessment rate schedule. The annual initial base assessment rates for all established small institutions with a CAMELS composite rating of 1 or 2 shall range from 3 to 16 basis points.
(ii) CAMELS composite 3-rated established small institutions initial base assessment rate schedule. The annual initial base assessment rates for all established small institutions with a CAMELS composite rating of 3 shall range from 6 to 30 basis points.
(iii) CAMELS composite 4- and 5- rated established small institutions initial base assessment rate schedule. The annual initial base assessment rates for all established small institutions with a CAMELS composite rating of 4 or 5 shall range from 16 to 30 basis points.
(iv) Large and highly complex institutions initial base assessment rate schedule. The annual initial base assessment rates for all large and highly complex institutions shall range from 3 to 30 basis points.
(2) Total base assessment rate schedule after adjustments. In the first
assessment period after June 30, 2016, that the reserve ratio of the DIF as of the end of the prior assessment period has reached or exceeded 1.15 percent, and for all subsequent assessment periods where the reserve ratio for the prior assessment period is less than 2 percent, the total base assessment rates after adjustments for established small institutions and large and highly complex institutions, except as provided in paragraph (f) of this section, shall be as prescribed in the following schedule:
TOTAL BASE ASSESSMENT RATE SCHEDULE (AFTER ADJUSTMENTS) 1 BEGINNING THE FIRST ASSESSMENT PERIOD AFTER JUNE 30, 2016, WHERE THE RESERVE RATIO AS OF THE END OF THE PRIOR ASSESSMENT PERIOD HAS REACHED 1.15 PERCENT, AND FOR ALL SUBSEQUENT ASSESSMENT PERIODS WHERE THE RESERVE RATIO AS OF THE END OF THE PRIOR ASSESSMENT PERIOD IS LESS THAN 2 PERCENT 2
Established small institutions Large & highly
complex institutions
CAMELS composite
1 or 2 3 4 or 5
Initial Base Assessment Rate ......................................................................... 3 to 16 ........... 6 to 30 ........... 16 to 30 ......... 3 to 30. Unsecured Debt Adjustment ........................................................................... ¥5 to 0 .......... ¥5 to 0 .......... ¥5 to 0 .......... ¥5 to 0. Brokered Deposit Adjustment ......................................................................... N/A ................. N/A ................. N/A ................. 0 to 10.
Total Base Assessment Rate .................................................................. 1.5 to 16 ........ 3 to 30 ........... 11 to 30 ......... 1.5 to 40.
1 The depository institution debt adjustment, which is not included in the table, can increase total base assessment rates above the maximum assessment rates shown in the table.
2 All amounts for all risk categories are in basis points annually. Total base rates that are not the minimum or maximum rate will vary between these rates.
(i) CAMELS composite 1- and 2-rated established small institutions total base assessment rate schedule. The annual total base assessment rates for all established small institutions with a CAMELS composite rating of 1 or 2 shall range from 1.5 to 16 basis points.
(ii) CAMELS composite 3-rated established small institutions total base assessment rate schedule. The annual total base assessment rates for all established small institutions with a CAMELS composite rating of 3 shall range from 3 to 30 basis points.
(iii) CAMELS composite 4- and 5- rated established small institutions total base assessment rate schedule. The annual total base assessment rates for all established small institutions with a CAMELS composite rating of 4 or 5 shall range from 11 to 30 basis points.
(iv) Large and highly complex institutions total base assessment rate schedule. The annual total base assessment rates for all large and highly complex institutions shall range from 1.5 to 40 basis points.
(c) Assessment rate schedules if the reserve ratio of the DIF as of the end of the prior assessment period is equal to or greater than 2 percent and less than 2.5 percent—(1) Initial base assessment rate schedule for established small institutions and large and highly complex institutions. If the reserve ratio of the DIF as of the end of the prior assessment period is equal to or greater than 2 percent and less than 2.5 percent, the initial base assessment rate for established small institutions and large and highly complex institutions, except
VerDate Sep<11>2014 19:17 May 19, 2016 Jkt 238001 PO 00000 Frm 00024 Fmt 4701 Sfmt 4700 E:\FR\FM\20MYR3.SGM 20MYR3mst
ocks
till o
n D
SK
3G9T
082P
RO
D w
ith R
ULE
S3

32203 Federal Register / Vol. 81, No. 98 / Friday, May 20, 2016 / Rules and Regulations
as provided in paragraph (f) of this section, shall be the rate prescribed in the following schedule:
INITIAL BASE ASSESSMENT RATE SCHEDULE IF THE RESERVE RATIO AS OF THE END OF THE PRIOR ASSESSMENT PERIOD IS EQUAL TO OR GREATER THAN 2 PERCENT BUT LESS THAN 2.5 PERCENT 1
Established small institutions Large & highly
complex institutions
CAMELS composite
1 or 2 3 4 or 5
Initial Base Assessment Rate ......................................................................... 2 to 14 ........... 5 to 28 ........... 14 to 28 ......... 2 to 28.
1 All amounts for all risk categories are in basis points annually. Initial base rates that are not the minimum or maximum rate will vary between these rates.
(i) CAMELS composite 1- and 2-rated established small institutions initial base assessment rate schedule. The annual initial base assessment rates for all established small institutions with a CAMELS composite rating of 1 or 2 shall range from 2 to 14 basis points.
(ii) CAMELS composite 3-rated established small institutions initial base assessment rate schedule. The annual initial base assessment rates for all established small institutions with a CAMELS composite rating of 3 shall range from 5 to 28 basis points.
(iii) CAMELS composite 4- and 5- rated established small institutions initial base assessment rate schedule. The annual initial base assessment rates for all established small institutions with a CAMELS composite rating of 4 or 5 shall range from 14 to 28 basis points.
(iv) Large and highly complex institutions initial base assessment rate schedule. The annual initial base assessment rates for all large and highly complex institutions shall range from 2 to 28 basis points.
(2) Total base assessment rate schedule after adjustments for established small institutions and large and highly complex institutions. If the reserve ratio of the DIF as of the end of the prior assessment period is equal to or greater than 2 percent and less than 2.5 percent, the total base assessment rates after adjustments for established small institutions and large and highly complex institutions, except as provided in paragraph (f) of this section, shall be as prescribed in the following schedule:
TOTAL BASE ASSESSMENT RATE SCHEDULE (AFTER ADJUSTMENTS) 1 IF THE RESERVE RATIO AS OF THE END OF THE PRIOR ASSESSMENT PERIOD IS EQUAL TO OR GREATER THAN 2 PERCENT BUT LESS THAN 2.5 PERCENT 2
Established small institutions Large & highly
complex institutions
CAMELS composite
1 or 2 3 4 or 5
Initial Base Assessment Rate ......................................................................... 2 to 14 ........... 5 to 28 ........... 14 to 28 ......... 2 to 28. Unsecured Debt Adjustment ........................................................................... ¥5 to 0 .......... ¥5 to 0 .......... ¥5 to 0 .......... ¥5 to 0. Brokered Deposit Adjustment ......................................................................... N/A ................. N/A ................. N/A ................. 0 to 10.
Total Base Assessment Rate .................................................................. 1 to 14 ........... 2.5 to 28 ........ 9 to 28 ........... 1 to 38.
1 The depository institution debt adjustment, which is not included in the table, can increase total base assessment rates above the maximum assessment rates shown in the table.
2 All amounts for all risk categories are in basis points annually. Total base rates that are not the minimum or maximum rate will vary between these rates.
(i) CAMELS composite 1- and 2-rated established small institutions total base assessment rate schedule. The annual total base assessment rates for all established small institutions with a CAMELS composite rating of 1 or 2 shall range from 1 to 14 basis points.
(ii) CAMELS composite 3-rated established small institutions total base assessment rate schedule. The annual total base assessment rates for all established small institutions with a CAMELS composite rating of 3 shall range from 2.5 to 28 basis points.
(iii) CAMELS composite 4- and 5- rated established small institutions total base assessment rate schedule. The annual total base assessment rates for all established small institutions with a CAMELS composite rating of 4 or 5 shall range from 9 to 28 basis points.
(iv) Large and highly complex institutions total base assessment rate schedule. The annual total base assessment rates for all large and highly complex institutions shall range from 1 to 38 basis points.
(d) Assessment rate schedules if the reserve ratio of the DIF as of the end of the prior assessment period is greater than 2.5 percent—(1) Initial base assessment rate schedule. If the reserve ratio of the DIF as of the end of the prior assessment period is greater than 2.5 percent, the initial base assessment rate for established small institutions and large and highly complex institutions, except as provided in paragraph (f) of this section, shall be the rate prescribed in the following schedule:
VerDate Sep<11>2014 19:17 May 19, 2016 Jkt 238001 PO 00000 Frm 00025 Fmt 4701 Sfmt 4700 E:\FR\FM\20MYR3.SGM 20MYR3mst
ocks
till o
n D
SK
3G9T
082P
RO
D w
ith R
ULE
S3
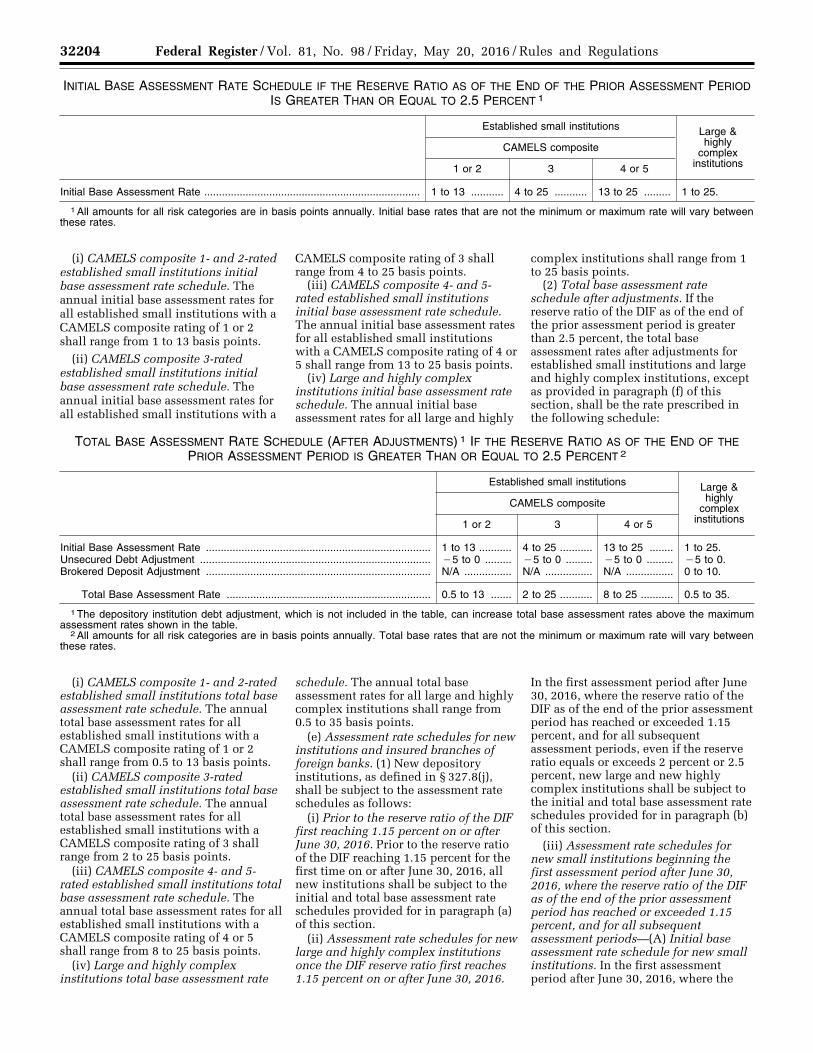
32204 Federal Register / Vol. 81, No. 98 / Friday, May 20, 2016 / Rules and Regulations
INITIAL BASE ASSESSMENT RATE SCHEDULE IF THE RESERVE RATIO AS OF THE END OF THE PRIOR ASSESSMENT PERIOD IS GREATER THAN OR EQUAL TO 2.5 PERCENT 1
Established small institutions Large & highly
complex institutions
CAMELS composite
1 or 2 3 4 or 5
Initial Base Assessment Rate ......................................................................... 1 to 13 ........... 4 to 25 ........... 13 to 25 ......... 1 to 25.
1 All amounts for all risk categories are in basis points annually. Initial base rates that are not the minimum or maximum rate will vary between these rates.
(i) CAMELS composite 1- and 2-rated established small institutions initial base assessment rate schedule. The annual initial base assessment rates for all established small institutions with a CAMELS composite rating of 1 or 2 shall range from 1 to 13 basis points.
(ii) CAMELS composite 3-rated established small institutions initial base assessment rate schedule. The annual initial base assessment rates for all established small institutions with a
CAMELS composite rating of 3 shall range from 4 to 25 basis points.
(iii) CAMELS composite 4- and 5- rated established small institutions initial base assessment rate schedule. The annual initial base assessment rates for all established small institutions with a CAMELS composite rating of 4 or 5 shall range from 13 to 25 basis points.
(iv) Large and highly complex institutions initial base assessment rate schedule. The annual initial base assessment rates for all large and highly
complex institutions shall range from 1 to 25 basis points.
(2) Total base assessment rate schedule after adjustments. If the reserve ratio of the DIF as of the end of the prior assessment period is greater than 2.5 percent, the total base assessment rates after adjustments for established small institutions and large and highly complex institutions, except as provided in paragraph (f) of this section, shall be the rate prescribed in the following schedule:
TOTAL BASE ASSESSMENT RATE SCHEDULE (AFTER ADJUSTMENTS) 1 IF THE RESERVE RATIO AS OF THE END OF THE PRIOR ASSESSMENT PERIOD IS GREATER THAN OR EQUAL TO 2.5 PERCENT 2
Established small institutions Large & highly
complex institutions
CAMELS composite
1 or 2 3 4 or 5
Initial Base Assessment Rate ............................................................................ 1 to 13 ........... 4 to 25 ........... 13 to 25 ........ 1 to 25. Unsecured Debt Adjustment .............................................................................. ¥5 to 0 ......... ¥5 to 0 ......... ¥5 to 0 ......... ¥5 to 0. Brokered Deposit Adjustment ............................................................................ N/A ................ N/A ................ N/A ................ 0 to 10.
Total Base Assessment Rate ..................................................................... 0.5 to 13 ....... 2 to 25 ........... 8 to 25 ........... 0.5 to 35.
1 The depository institution debt adjustment, which is not included in the table, can increase total base assessment rates above the maximum assessment rates shown in the table.
2 All amounts for all risk categories are in basis points annually. Total base rates that are not the minimum or maximum rate will vary between these rates.
(i) CAMELS composite 1- and 2-rated established small institutions total base assessment rate schedule. The annual total base assessment rates for all established small institutions with a CAMELS composite rating of 1 or 2 shall range from 0.5 to 13 basis points.
(ii) CAMELS composite 3-rated established small institutions total base assessment rate schedule. The annual total base assessment rates for all established small institutions with a CAMELS composite rating of 3 shall range from 2 to 25 basis points.
(iii) CAMELS composite 4- and 5- rated established small institutions total base assessment rate schedule. The annual total base assessment rates for all established small institutions with a CAMELS composite rating of 4 or 5 shall range from 8 to 25 basis points.
(iv) Large and highly complex institutions total base assessment rate
schedule. The annual total base assessment rates for all large and highly complex institutions shall range from 0.5 to 35 basis points.
(e) Assessment rate schedules for new institutions and insured branches of foreign banks. (1) New depository institutions, as defined in § 327.8(j), shall be subject to the assessment rate schedules as follows:
(i) Prior to the reserve ratio of the DIF first reaching 1.15 percent on or after June 30, 2016. Prior to the reserve ratio of the DIF reaching 1.15 percent for the first time on or after June 30, 2016, all new institutions shall be subject to the initial and total base assessment rate schedules provided for in paragraph (a) of this section.
(ii) Assessment rate schedules for new large and highly complex institutions once the DIF reserve ratio first reaches 1.15 percent on or after June 30, 2016.
In the first assessment period after June 30, 2016, where the reserve ratio of the DIF as of the end of the prior assessment period has reached or exceeded 1.15 percent, and for all subsequent assessment periods, even if the reserve ratio equals or exceeds 2 percent or 2.5 percent, new large and new highly complex institutions shall be subject to the initial and total base assessment rate schedules provided for in paragraph (b) of this section.
(iii) Assessment rate schedules for new small institutions beginning the first assessment period after June 30, 2016, where the reserve ratio of the DIF as of the end of the prior assessment period has reached or exceeded 1.15 percent, and for all subsequent assessment periods—(A) Initial base assessment rate schedule for new small institutions. In the first assessment period after June 30, 2016, where the
VerDate Sep<11>2014 19:17 May 19, 2016 Jkt 238001 PO 00000 Frm 00026 Fmt 4701 Sfmt 4700 E:\FR\FM\20MYR3.SGM 20MYR3mst
ocks
till o
n D
SK
3G9T
082P
RO
D w
ith R
ULE
S3

32205 Federal Register / Vol. 81, No. 98 / Friday, May 20, 2016 / Rules and Regulations
reserve ratio of the DIF as of the end of the prior assessment period has reached or exceeded 1.15 percent, and for all
subsequent assessment periods, the initial base assessment rate for a new small institution shall be the rate
prescribed in the following schedule, even if the reserve ratio equals or exceeds 2 percent or 2.5 percent:
INITIAL BASE ASSESSMENT RATE SCHEDULE BEGINNING THE FIRST ASSESSMENT PERIOD AFTER JUNE 30, 2016, WHERE THE RESERVE RATIO AS OF THE END OF THE PRIOR ASSESSMENT PERIOD HAS REACHED 1.15 PERCENT, AND FOR ALL SUBSEQUENT ASSESSMENT PERIODS 1
Risk Category I
Risk Category II
Risk Category III
Risk Category IV
Initial Assessment Rate ................................................................................... 7 12 19 30
1 All amounts for all risk categories are in basis points annually.
(1) Risk category I initial base assessment rate schedule. The annual initial base assessment rates for all new small institutions in Risk Category I shall be 7 basis points.
(2) Risk category II, III, and IV initial base assessment rate schedule. The annual initial base assessment rates for
all new small institutions in Risk Categories II, III, and IV shall be 12, 19, and 30 basis points, respectively.
(B) Total base assessment rate schedule for new small institutions. In the first assessment period after June 30, 2016, that the reserve ratio of the DIF as of the end of the prior assessment
period has reached or exceeded 1.15 percent, and for all subsequent assessment periods, the total base assessment rates after adjustments for a new small institution shall be the rate prescribed in the following schedule, even if the reserve ratio equals or exceeds 2 percent or 2.5 percent:
TOTAL BASE ASSESSMENT RATE SCHEDULE (AFTER ADJUSTMENTS) 1 BEGINNING THE FIRST ASSESSMENT PERIOD AFTER JUNE 30, 2016, WHERE THE RESERVE RATIO AS OF THE END OF THE PRIOR ASSESSMENT PERIOD HAS REACHED 1.15 PERCENT, AND FOR ALL SUBSEQUENT ASSESSMENT PERIODS WHERE THE RESERVE RATIO AS OF THE END OF THE PRIOR ASSESSMENT PERIOD IS LESS THAN 2 PERCENT 2
Risk Category I
Risk Category II
Risk Category III
Risk Category IV
Initial Assessment Rate .................................................................................. 7 ..................... 12 ................... 19 ................... 30. Brokered Deposit Adjustment (added) ........................................................... N/A ................. 0 to 10 ........... 0 to 10 ........... 0 to 10.
Total Assessment Rate ........................................................................... 7 ..................... 12 to 22 ......... 19 to 29 ......... 30 to 40.
1 The depository institution debt adjustment, which is not included in the table, can increase total base assessment rates above the maximum assessment rates shown in the table.
2 All amounts for all risk categories are in basis points annually. Total base rates that are not the minimum or maximum rate will vary between these rates.
(1) Risk category I total assessment rate schedule. The annual total base assessment rates for all new small institutions in Risk Category I shall be 7 basis points.
(2) Risk category II total assessment rate schedule. The annual total base assessment rates for all new small institutions in Risk Category II shall range from 12 to 22 basis points.
(3) Risk category III total assessment rate schedule. The annual total base assessment rates for all new small institutions in Risk Category III shall range from 19 to 29 basis points.
(4) Risk category IV total assessment rate schedule. The annual total base assessment rates for all new small institutions in Risk Category IV shall range from 30 to 40 basis points.
(2) Insured branches of foreign banks—(i) Beginning the first assessment period after June 30, 2016, where the reserve ratio of the DIF as of the end of the prior assessment period has reached or exceeded 1.15 percent, and for all subsequent assessment periods where the reserve ratio as of the end of the prior assessment period is
less than 2 percent. In the first assessment period after June 30, 2016, where the reserve ratio of the DIF as of the end of the prior assessment period has reached or exceeded 1.15 percent, and for all subsequent assessment periods where the reserve ratio as of the end of the prior assessment period is less than 2 percent, the initial and total base assessment rates for an insured branch of a foreign bank, except as provided in paragraph (f) of this section, shall be the rate prescribed in the following schedule:
INITIAL AND TOTAL BASE ASSESSMENT RATE SCHEDULE 1 BEGINNING THE FIRST ASSESSMENT PERIOD AFTER JUNE 30, 2016, WHERE THE RESERVE RATIO AS OF THE END OF THE PRIOR ASSESSMENT PERIOD HAS REACHED 1.15 PER-CENT, AND FOR ALL SUBSEQUENT ASSESSMENT PERIODS WHERE THE RESERVE RATIO AS OF THE END OF THE PRIOR ASSESSMENT PERIOD IS LESS THAN 2 PERCENT 2
Risk Category I
Risk Category II
Risk Category III
Risk Category IV
Initial and Total Assessment Rate ................................................................... 3 to 7 ............. 12 19 30
1 The depository institution debt adjustment, which is not included in the table, can increase total base assessment rates above the maximum assessment rates shown in the table.
VerDate Sep<11>2014 19:17 May 19, 2016 Jkt 238001 PO 00000 Frm 00027 Fmt 4701 Sfmt 4700 E:\FR\FM\20MYR3.SGM 20MYR3mst
ocks
till o
n D
SK
3G9T
082P
RO
D w
ith R
ULE
S3

32206 Federal Register / Vol. 81, No. 98 / Friday, May 20, 2016 / Rules and Regulations
2 All amounts for all risk categories are in basis points annually. Initial and total base rates that are not the minimum or maximum rate will vary between these rates.
(A) Risk category I initial and total base assessment rate schedule. The annual initial and total base assessment rates for an insured branch of a foreign bank in Risk Category I shall range from 3 to 7 basis points.
(B) Risk category II, III, and IV initial and total base assessment rate schedule. The annual initial and total base assessment rates for Risk Categories II,
III, and IV shall be 12, 19, and 30 basis points, respectively.
(C) All insured branches of foreign banks in any one risk category, other than Risk Category I, will be charged the same initial base assessment rate, subject to adjustment as appropriate.
(ii) Assessment rate schedule for insured branches of foreign banks if the reserve ratio of the DIF as of the end of the prior assessment period is equal to
or greater than 2 percent and less than 2.5 percent. If the reserve ratio of the DIF as of the end of the prior assessment period is equal to or greater than 2 percent and less than 2.5 percent, the initial and total base assessment rates for an insured branch of a foreign bank, except as provided in paragraph (f) of this section, shall be the rate prescribed in the following schedule:
INITIAL AND TOTAL BASE ASSESSMENT RATE SCHEDULE 1 IF THE RESERVE RATIO AS OF THE END OF THE PRIOR ASSESSMENT PERIOD IS EQUAL TO OR GREATER THAN 2 PERCENT BUT LESS THAN 2.5 PERCENT 2
Risk Category I
Risk Category II
Risk Category III
Risk Category IV
Initial and Total Assessment Rate ................................................................... 2 to 6 ............. 10 17 28
1 The depository institution debt adjustment, which is not included in the table, can increase total base assessment rates above the maximum assessment rates shown in the table.
2 All amounts for all risk categories are in basis points annually. Initial and total base rates that are not the minimum or maximum rate will vary between these rates.
(A) Risk category I initial and total base assessment rate schedule. The annual initial and total base assessment rates for an insured branch of a foreign bank in Risk Category I shall range from 2 to 6 basis points.
(B) Risk category II, III, and IV initial and total base assessment rate schedule. The annual initial and total base assessment rates for Risk Categories II,
III, and IV shall be 10, 17, and 28 basis points, respectively.
(C) All insured branches of foreign banks in any one risk category, other than Risk Category I, will be charged the same initial base assessment rate, subject to adjustment as appropriate.
(iii) Assessment rate schedule for insured branches of foreign banks if the reserve ratio of the DIF as of the end of
the prior assessment period is greater than 2.5 percent. If the reserve ratio of the DIF as of the end of the prior assessment period is greater than 2.5 percent, the initial and total base assessment rate for an insured branch of foreign bank, except as provided in paragraph (f) of this section, shall be the rate prescribed in the following schedule:
INITIAL AND TOTAL BASE ASSESSMENT RATE SCHEDULE 1 IF THE RESERVE RATIO AS OF THE END OF THE PRIOR ASSESSMENT PERIOD IS GREATER THAN OR EQUAL TO 2.5 PERCENT 2
Risk Category I
Risk Category II
Risk Category III
Risk Category IV
Initial Assessment Rate .................................................................................... 1 to 5 ............ 9 15 25
1 The depository institution debt adjustment, which is not included in the table, can increase total base assessment rates above the maximum assessment rates shown in the table.
2 All amounts for all risk categories are in basis points annually. Initial and total base rates that are not the minimum or maximum rate will vary between these rates.
(A) Risk category I initial and total base assessment rate schedule. The annual initial and total base assessment rates for an insured branch of a foreign bank in Risk Category I shall range from 1 to 5 basis points.
(B) Risk category II, III, and IV initial and total base assessment rate schedule. The annual initial and total base assessment rates for Risk Categories II, III, and IV shall be 9, 15, and 25 basis points, respectively.
(C) All insured branches of foreign banks in any one risk category, other than Risk Category I, will be charged the same initial base assessment rate, subject to adjustment as appropriate.
(f) Total base assessment rate schedule adjustments and procedures— (1) Board rate adjustments. The Board may increase or decrease the total base assessment rate schedule in paragraphs (a) through (e) of this section up to a maximum increase of 2 basis points or a fraction thereof or a maximum decrease of 2 basis points or a fraction thereof (after aggregating increases and decreases), as the Board deems necessary. Any such adjustment shall apply uniformly to each rate in the total base assessment rate schedule. In no case may such rate adjustments result in a total base assessment rate that is mathematically less than zero or in a total base assessment rate schedule that,
at any time, is more than 2 basis points above or below the total base assessment schedule for the Deposit Insurance Fund in effect pursuant to paragraph (b) of this section, nor may any one such adjustment constitute an increase or decrease of more than 2 basis points.
(2) Amount of revenue. In setting assessment rates, the Board shall take into consideration the following:
(i) Estimated operating expenses of the Deposit Insurance Fund;
(ii) Case resolution expenditures and income of the Deposit Insurance Fund;
(iii) The projected effects of assessments on the capital and earnings of the institutions paying assessments to the Deposit Insurance Fund;
VerDate Sep<11>2014 19:17 May 19, 2016 Jkt 238001 PO 00000 Frm 00028 Fmt 4701 Sfmt 4700 E:\FR\FM\20MYR3.SGM 20MYR3mst
ocks
till o
n D
SK
3G9T
082P
RO
D w
ith R
ULE
S3

32207 Federal Register / Vol. 81, No. 98 / Friday, May 20, 2016 / Rules and Regulations
(iv) The risk factors and other factors taken into account pursuant to 12 U.S.C. 1817(b)(1); and
(v) Any other factors the Board may deem appropriate.
(3) Adjustment procedure. Any adjustment adopted by the Board pursuant to this paragraph (f) will be adopted by rulemaking, except that the Corporation may set assessment rates as necessary to manage the reserve ratio, within set parameters not exceeding cumulatively 2 basis points, pursuant to paragraph (f)(1) of this section, without further rulemaking.
(4) Announcement. The Board shall announce the assessment schedules and the amount and basis for any adjustment thereto not later than 30 days before the quarterly certified statement invoice date specified in § 327.3(b) for the first assessment period for which the adjustment shall be effective. Once set, rates will remain in effect until changed by the Board. ■ 7. Add § 327.16 to read as follows:
§ 327.16 Assessment pricing methods— beginning the first assessment period after June 30, 2016, where the reserve ratio of the DIF as of the end of the prior assessment period has reached or exceeded 1.15 percent.
(a) Established small institutions. Beginning the first assessment period after June 30, 2016, where the reserve ratio of the DIF as of the end of the prior assessment period has reached or exceeded 1.15 percent, and for all subsequent assessment periods, an established small institution shall have its initial base assessment rate determined by using the financial ratios methods set forth in paragraph (a)(1) of this section.
(1) Under the financial ratios method, each of seven financial ratios and a weighted average of CAMELS component ratings will be multiplied by a corresponding pricing multiplier. The sum of these products will be added to a uniform amount. The resulting sum shall equal the institution’s initial base assessment rate; provided, however, that no institution’s initial base assessment rate shall be less than the minimum initial base assessment rate in effect for established small institutions with a particular CAMELS composite rating for that assessment period nor greater than the maximum initial base assessment rate in effect for established small institutions with a particular CAMELS composite rating for that assessment period. An institution’s initial base assessment rate, subject to adjustment pursuant to paragraphs (e)(1) and (2) of
this section, as appropriate (resulting in the institution’s total base assessment rate, which in no case can be lower than 50 percent of the institution’s initial base assessment rate), and adjusted for the actual assessment rates set by the Board under § 327.10(f), will equal an institution’s assessment rate. The seven financial ratios are: Leverage Ratio (%); Net Income before Taxes/Total Assets (%); Nonperforming Loans and Leases/ Gross Assets (%); Other Real Estate Owned/Gross Assets (%); Brokered Deposit Ratio (%); One Year Asset Growth (%); and Loan Mix Index. The ratios and the weighted average of CAMELS component ratings are defined in paragraph (a)(1)(ii) of this section. The ratios will be determined for an assessment period based upon information contained in an institution’s report of condition filed as of the last day of the assessment period as set out in paragraph (a)(2) of this section. The weighted average of CAMELS component ratings is created by multiplying each component by the following percentages and adding the products: Capital adequacy—25%, Asset quality—20%, Management—25%, Earnings—10%, Liquidity—10%, and Sensitivity to market risk—10%. The following tables set forth the values of the pricing multipliers:
PRICING MULTIPLIERS APPLICABLE BE-GINNING THE FIRST ASSESSMENT PERIOD AFTER JUNE 30, 2016, WHERE THE RESERVE RATIO AS OF THE END OF THE PRIOR ASSESS-MENT PERIOD HAS REACHED 1.15 PERCENT, AND FOR ALL SUBSE-QUENT ASSESSMENT PERIODS WHERE THE RESERVE RATIO AS OF THE END OF THE PRIOR ASSESS-MENT PERIOD IS LESS THAN 2 PER-CENT
Risk measures 1 Pricing multipliers 2
Leverage ratio ....................... ¥1.264 Net Income before Taxes/
Total Assets ...................... ¥0.720 Nonperforming Loans and
Leases/Gross Assets ........ 0.942 Other Real Estate Owned/
Gross Assets ..................... 0.533 Brokered Deposit Ratio ........ 0.264 One Year Asset Growth ....... 0.061 Loan Mix Index ..................... 0.081 Weighted Average CAMELS
Component Rating ............ 1.519
1 Ratios are expressed as percentages. 2 Multipliers are rounded to three decimal
places.
PRICING MULTIPLIERS APPLICABLE WHEN THE RESERVE RATIO AS OF THE END OF THE PRIOR ASSESS-MENT PERIOD IS EQUAL TO OR GREATER THAN 2 PERCENT BUT LESS THAN 2.5 PERCENT
Risk measures 1 Pricing multipliers 2
Leverage Ratio ..................... ¥1.217 Net Income before Taxes/
Total Assets ...................... ¥0.694 Nonperforming Loans and
Leases/Gross Assets ........ 0.907 Other Real Estate Owned/
Gross Assets ..................... 0.513 Brokered Deposit Ratio ........ 0.254 One Year Asset Growth ....... 0.059 Loan Mix Index ..................... 0.078 Weighted Average CAMELS
Component Rating ............ 1.463
1 Ratios are expressed as percentages. 2 Multipliers are rounded to three decimal
places.
PRICING MULTIPLIERS APPLICABLE WHEN THE RESERVE RATIO AS OF THE END OF THE PRIOR ASSESS-MENT PERIOD IS GREATER THAN OR EQUAL TO 2.5 PERCENT
Risk measures 1 Pricing multipliers 2
Leverage Ratio ..................... ¥1.123 Net Income before Taxes/
Total Assets ...................... ¥0.640 Nonperforming Loans and
Leases/Gross Assets ........ 0.837 Other Real Estate Owned/
Gross Assets ..................... 0.474 Brokered Deposit Ratio ........ 0.235 One Year Asset Growth ....... 0.054 Loan Mix Index ..................... 0.072 Weighted Average CAMELS
Component Rating ............ 1.350
1 Ratios are expressed as percentages. 2 Multipliers are rounded to three decimal
places.
(i) Uniform amount. Except as adjusted for the actual assessment rates set by the Board under § 327.10(f), the uniform amount shall be:
(A) 7.352 whenever the assessment rate schedule set forth in § 327.10(b) is in effect;
(B) 6.188 whenever the assessment rate schedule set forth in § 327.10(c) is in effect; or
(C) 4.870 whenever the assessment rate schedule set forth in § 327.10(d) is in effect.
(ii) Definitions of measures used in the financial ratios method—(A) Definitions. The following table lists and defines the measures used in the financial ratios method:
VerDate Sep<11>2014 19:17 May 19, 2016 Jkt 238001 PO 00000 Frm 00029 Fmt 4701 Sfmt 4700 E:\FR\FM\20MYR3.SGM 20MYR3mst
ocks
till o
n D
SK
3G9T
082P
RO
D w
ith R
ULE
S3
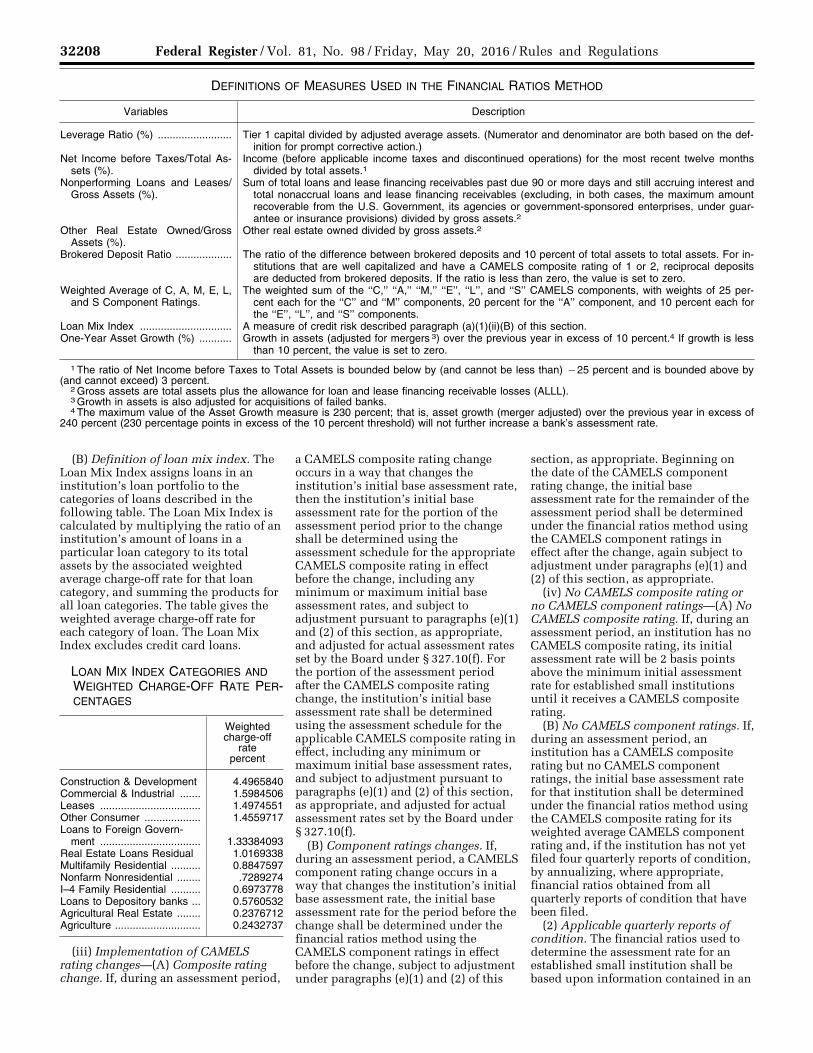
32208 Federal Register / Vol. 81, No. 98 / Friday, May 20, 2016 / Rules and Regulations
DEFINITIONS OF MEASURES USED IN THE FINANCIAL RATIOS METHOD
Variables Description
Leverage Ratio (%) ......................... Tier 1 capital divided by adjusted average assets. (Numerator and denominator are both based on the def-inition for prompt corrective action.)
Net Income before Taxes/Total As-sets (%).
Income (before applicable income taxes and discontinued operations) for the most recent twelve months divided by total assets.1
Nonperforming Loans and Leases/Gross Assets (%).
Sum of total loans and lease financing receivables past due 90 or more days and still accruing interest and total nonaccrual loans and lease financing receivables (excluding, in both cases, the maximum amount recoverable from the U.S. Government, its agencies or government-sponsored enterprises, under guar-antee or insurance provisions) divided by gross assets.2
Other Real Estate Owned/Gross Assets (%).
Other real estate owned divided by gross assets.2
Brokered Deposit Ratio ................... The ratio of the difference between brokered deposits and 10 percent of total assets to total assets. For in-stitutions that are well capitalized and have a CAMELS composite rating of 1 or 2, reciprocal deposits are deducted from brokered deposits. If the ratio is less than zero, the value is set to zero.
Weighted Average of C, A, M, E, L, and S Component Ratings.
The weighted sum of the ‘‘C,’’ ‘‘A,’’ ‘‘M,’’ ‘‘E’’, ‘‘L’’, and ‘‘S’’ CAMELS components, with weights of 25 per-cent each for the ‘‘C’’ and ‘‘M’’ components, 20 percent for the ‘‘A’’ component, and 10 percent each for the ‘‘E’’, ‘‘L’’, and ‘‘S’’ components.
Loan Mix Index ............................... A measure of credit risk described paragraph (a)(1)(ii)(B) of this section. One-Year Asset Growth (%) ........... Growth in assets (adjusted for mergers 3) over the previous year in excess of 10 percent.4 If growth is less
than 10 percent, the value is set to zero.
1 The ratio of Net Income before Taxes to Total Assets is bounded below by (and cannot be less than) ¥25 percent and is bounded above by (and cannot exceed) 3 percent.
2 Gross assets are total assets plus the allowance for loan and lease financing receivable losses (ALLL). 3 Growth in assets is also adjusted for acquisitions of failed banks. 4 The maximum value of the Asset Growth measure is 230 percent; that is, asset growth (merger adjusted) over the previous year in excess of
240 percent (230 percentage points in excess of the 10 percent threshold) will not further increase a bank’s assessment rate.
(B) Definition of loan mix index. The Loan Mix Index assigns loans in an institution’s loan portfolio to the categories of loans described in the following table. The Loan Mix Index is calculated by multiplying the ratio of an institution’s amount of loans in a particular loan category to its total assets by the associated weighted average charge-off rate for that loan category, and summing the products for all loan categories. The table gives the weighted average charge-off rate for each category of loan. The Loan Mix Index excludes credit card loans.
LOAN MIX INDEX CATEGORIES AND WEIGHTED CHARGE-OFF RATE PER-CENTAGES
Weighted charge-off
rate percent
Construction & Development 4.4965840 Commercial & Industrial ....... 1.5984506 Leases .................................. 1.4974551 Other Consumer ................... 1.4559717 Loans to Foreign Govern-
ment .................................. 1.33384093 Real Estate Loans Residual 1.0169338 Multifamily Residential .......... 0.8847597 Nonfarm Nonresidential ........ .7289274 I–4 Family Residential .......... 0.6973778 Loans to Depository banks ... 0.5760532 Agricultural Real Estate ........ 0.2376712 Agriculture ............................. 0.2432737
(iii) Implementation of CAMELS rating changes—(A) Composite rating change. If, during an assessment period,
a CAMELS composite rating change occurs in a way that changes the institution’s initial base assessment rate, then the institution’s initial base assessment rate for the portion of the assessment period prior to the change shall be determined using the assessment schedule for the appropriate CAMELS composite rating in effect before the change, including any minimum or maximum initial base assessment rates, and subject to adjustment pursuant to paragraphs (e)(1) and (2) of this section, as appropriate, and adjusted for actual assessment rates set by the Board under § 327.10(f). For the portion of the assessment period after the CAMELS composite rating change, the institution’s initial base assessment rate shall be determined using the assessment schedule for the applicable CAMELS composite rating in effect, including any minimum or maximum initial base assessment rates, and subject to adjustment pursuant to paragraphs (e)(1) and (2) of this section, as appropriate, and adjusted for actual assessment rates set by the Board under § 327.10(f).
(B) Component ratings changes. If, during an assessment period, a CAMELS component rating change occurs in a way that changes the institution’s initial base assessment rate, the initial base assessment rate for the period before the change shall be determined under the financial ratios method using the CAMELS component ratings in effect before the change, subject to adjustment under paragraphs (e)(1) and (2) of this
section, as appropriate. Beginning on the date of the CAMELS component rating change, the initial base assessment rate for the remainder of the assessment period shall be determined under the financial ratios method using the CAMELS component ratings in effect after the change, again subject to adjustment under paragraphs (e)(1) and (2) of this section, as appropriate.
(iv) No CAMELS composite rating or no CAMELS component ratings—(A) No CAMELS composite rating. If, during an assessment period, an institution has no CAMELS composite rating, its initial assessment rate will be 2 basis points above the minimum initial assessment rate for established small institutions until it receives a CAMELS composite rating.
(B) No CAMELS component ratings. If, during an assessment period, an institution has a CAMELS composite rating but no CAMELS component ratings, the initial base assessment rate for that institution shall be determined under the financial ratios method using the CAMELS composite rating for its weighted average CAMELS component rating and, if the institution has not yet filed four quarterly reports of condition, by annualizing, where appropriate, financial ratios obtained from all quarterly reports of condition that have been filed.
(2) Applicable quarterly reports of condition. The financial ratios used to determine the assessment rate for an established small institution shall be based upon information contained in an
VerDate Sep<11>2014 19:17 May 19, 2016 Jkt 238001 PO 00000 Frm 00030 Fmt 4701 Sfmt 4700 E:\FR\FM\20MYR3.SGM 20MYR3mst
ocks
till o
n D
SK
3G9T
082P
RO
D w
ith R
ULE
S3

32209 Federal Register / Vol. 81, No. 98 / Friday, May 20, 2016 / Rules and Regulations
institution’s Consolidated Reports of Condition and Income (or successor report, as appropriate) dated as of March 31 for the assessment period beginning the preceding January 1; dated as of June 30 for the assessment period beginning the preceding April 1; dated
as of September 30 for the assessment period beginning the preceding July 1; and dated as of December 31 for the assessment period beginning the preceding October 1.
(b) Large and highly complex institutions—(1) Assessment scorecard
for large institutions (other than highly complex institutions). (i) A large institution other than a highly complex institution shall have its initial base assessment rate determined using the scorecard for large institutions.
SCORECARD FOR LARGE INSTITUTIONS
Scorecard measures and components Measure weights
(percent)
Component weights
(percent)
P .................. Performance Score ........................................................................................................................ ........................ ........................P.1 ............... Weighted Average CAMELS Rating .............................................................................................. 100 30 P.2 ............... Ability to Withstand Asset-Related Stress ..................................................................................... ........................ 50
Leverage ratio ................................................................................................................................ 10 ........................Concentration Measure .................................................................................................................. 35 ........................Core Earnings/Average Quarter-End Total Assets 1 ..................................................................... 20 ........................Credit Quality Measure .................................................................................................................. 35 ........................
P.3 ............... Ability to Withstand Funding-Related Stress ................................................................................. ........................ 20 Core Deposits/Total Liabilities ....................................................................................................... 60 ........................Balance Sheet Liquidity Ratio ........................................................................................................ 40 ........................
L .................. Loss Severity Score ....................................................................................................................... ........................ ........................L.1 ............... Loss Severity Measure .................................................................................................................. ........................ 100
1 Average of five quarter-end total assets (most recent and four prior quarters).
(ii) The scorecard for large institutions produces two scores: Performance score and loss severity score.
(A) Performance score for large institutions. The performance score for large institutions is a weighted average of the scores for three measures: The weighted average CAMELS rating score, weighted at 30 percent; the ability to withstand asset-related stress score, weighted at 50 percent; and the ability to withstand funding-related stress score, weighted at 20 percent.
(1) Weighted average CAMELS rating score. (i) To compute the weighted average CAMELS rating score, a weighted average of an institution’s CAMELS component ratings is calculated using the following weights:
CAMELS component Weight (%)
C ............................................... 25 A ............................................... 20 M ............................................... 25 E ............................................... 10 L ................................................ 10 S ............................................... 10
(ii) A weighted average CAMELS rating converts to a score that ranges from 25 to 100. A weighted average rating of 1 equals a score of 25 and a weighted average of 3.5 or greater equals a score of 100. Weighted average CAMELS ratings between 1 and 3.5 are assigned a score between 25 and 100. The score increases at an increasing rate as the weighted average CAMELS rating increases. Appendix B of this subpart describes the conversion of a weighted average CAMELS rating to a score.
(2) Ability to withstand asset-related stress score. (i) The ability to withstand asset-related stress score is a weighted average of the scores for four measures: Leverage ratio; concentration measure; the ratio of core earnings to average quarter-end total assets; and the credit quality measure. Appendices A and C of this subpart define these measures.
(ii) The Leverage ratio and the ratio of core earnings to average quarter-end total assets are described in appendix A and the method of calculating the scores is described in appendix C of this subpart.
(iii) The score for the concentration measure is the greater of the higher-risk assets to Tier 1 capital and reserves score or the growth-adjusted portfolio concentrations score. Both ratios are described in appendix C of this subpart.
(iv) The score for the credit quality measure is the greater of the criticized and classified items to Tier 1 capital and reserves score or the underperforming assets to Tier 1 capital and reserves score.
(v) The following table shows the cutoff values and weights for the measures used to calculate the ability to withstand asset-related stress score. Appendix B of this subpart describes how each measure is converted to a score between 0 and 100 based upon the minimum and maximum cutoff values, where a score of 0 reflects the lowest risk and a score of 100 reflects the highest risk.
CUTOFF VALUES AND WEIGHTS FOR MEASURES TO CALCULATE ABILITY TO WITHSTAND ASSET-RELATED STRESS SCORE
Measures of the ability to withstand asset-related stress
Cutoff values Weights (percent) Minimum
(percent) Maximum (percent)
Leverage ratio .............................................................................................................................. 6 13 10 Concentration Measure ............................................................................................................... ........................ ........................ 35
Higher-Risk Assets to Tier 1 Capital and Reserves; or ....................................................... 0 135 ........................Growth-Adjusted Portfolio Concentrations ........................................................................... 4 56 ........................
Core Earnings/Average Quarter-End Total Assets 1 ................................................................... 0 2 20 Credit Quality Measure ................................................................................................................ ........................ ........................ 35
VerDate Sep<11>2014 19:17 May 19, 2016 Jkt 238001 PO 00000 Frm 00031 Fmt 4701 Sfmt 4700 E:\FR\FM\20MYR3.SGM 20MYR3mst
ocks
till o
n D
SK
3G9T
082P
RO
D w
ith R
ULE
S3
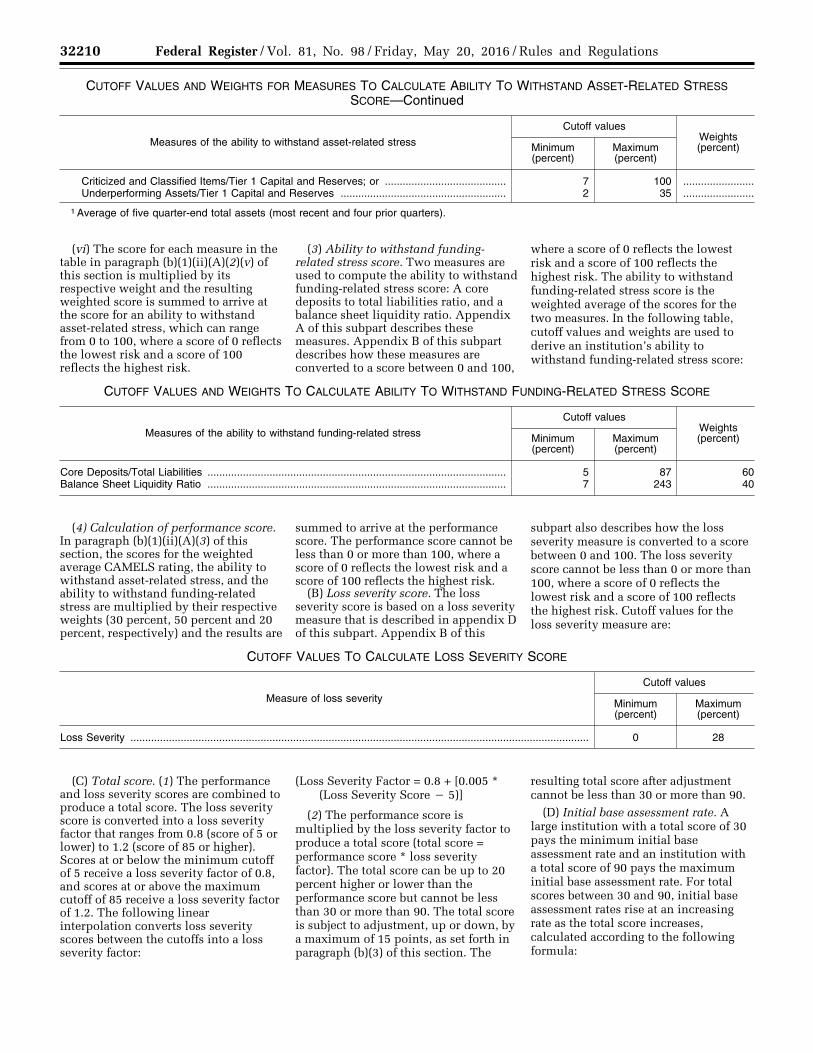
32210 Federal Register / Vol. 81, No. 98 / Friday, May 20, 2016 / Rules and Regulations
CUTOFF VALUES AND WEIGHTS FOR MEASURES TO CALCULATE ABILITY TO WITHSTAND ASSET-RELATED STRESS SCORE—Continued
Measures of the ability to withstand asset-related stress
Cutoff values Weights (percent) Minimum
(percent) Maximum (percent)
Criticized and Classified Items/Tier 1 Capital and Reserves; or ......................................... 7 100 ........................Underperforming Assets/Tier 1 Capital and Reserves ........................................................ 2 35 ........................
1 Average of five quarter-end total assets (most recent and four prior quarters).
(vi) The score for each measure in the table in paragraph (b)(1)(ii)(A)(2)(v) of this section is multiplied by its respective weight and the resulting weighted score is summed to arrive at the score for an ability to withstand asset-related stress, which can range from 0 to 100, where a score of 0 reflects the lowest risk and a score of 100 reflects the highest risk.
(3) Ability to withstand funding- related stress score. Two measures are used to compute the ability to withstand funding-related stress score: A core deposits to total liabilities ratio, and a balance sheet liquidity ratio. Appendix A of this subpart describes these measures. Appendix B of this subpart describes how these measures are converted to a score between 0 and 100,
where a score of 0 reflects the lowest risk and a score of 100 reflects the highest risk. The ability to withstand funding-related stress score is the weighted average of the scores for the two measures. In the following table, cutoff values and weights are used to derive an institution’s ability to withstand funding-related stress score:
CUTOFF VALUES AND WEIGHTS TO CALCULATE ABILITY TO WITHSTAND FUNDING-RELATED STRESS SCORE
Measures of the ability to withstand funding-related stress
Cutoff values Weights (percent) Minimum
(percent) Maximum (percent)
Core Deposits/Total Liabilities ..................................................................................................... 5 87 60 Balance Sheet Liquidity Ratio ..................................................................................................... 7 243 40
(4) Calculation of performance score. In paragraph (b)(1)(ii)(A)(3) of this section, the scores for the weighted average CAMELS rating, the ability to withstand asset-related stress, and the ability to withstand funding-related stress are multiplied by their respective weights (30 percent, 50 percent and 20 percent, respectively) and the results are
summed to arrive at the performance score. The performance score cannot be less than 0 or more than 100, where a score of 0 reflects the lowest risk and a score of 100 reflects the highest risk.
(B) Loss severity score. The loss severity score is based on a loss severity measure that is described in appendix D of this subpart. Appendix B of this
subpart also describes how the loss severity measure is converted to a score between 0 and 100. The loss severity score cannot be less than 0 or more than 100, where a score of 0 reflects the lowest risk and a score of 100 reflects the highest risk. Cutoff values for the loss severity measure are:
CUTOFF VALUES TO CALCULATE LOSS SEVERITY SCORE
Measure of loss severity
Cutoff values
Minimum (percent)
Maximum (percent)
Loss Severity ........................................................................................................................................................... 0 28
(C) Total score. (1) The performance and loss severity scores are combined to produce a total score. The loss severity score is converted into a loss severity factor that ranges from 0.8 (score of 5 or lower) to 1.2 (score of 85 or higher). Scores at or below the minimum cutoff of 5 receive a loss severity factor of 0.8, and scores at or above the maximum cutoff of 85 receive a loss severity factor of 1.2. The following linear interpolation converts loss severity scores between the cutoffs into a loss severity factor:
(Loss Severity Factor = 0.8 + [0.005 * (Loss Severity Score ¥ 5)]
(2) The performance score is multiplied by the loss severity factor to produce a total score (total score = performance score * loss severity factor). The total score can be up to 20 percent higher or lower than the performance score but cannot be less than 30 or more than 90. The total score is subject to adjustment, up or down, by a maximum of 15 points, as set forth in paragraph (b)(3) of this section. The
resulting total score after adjustment cannot be less than 30 or more than 90.
(D) Initial base assessment rate. A large institution with a total score of 30 pays the minimum initial base assessment rate and an institution with a total score of 90 pays the maximum initial base assessment rate. For total scores between 30 and 90, initial base assessment rates rise at an increasing rate as the total score increases, calculated according to the following formula:
VerDate Sep<11>2014 19:17 May 19, 2016 Jkt 238001 PO 00000 Frm 00032 Fmt 4701 Sfmt 4700 E:\FR\FM\20MYR3.SGM 20MYR3mst
ocks
till o
n D
SK
3G9T
082P
RO
D w
ith R
ULE
S3

32211 Federal Register / Vol. 81, No. 98 / Friday, May 20, 2016 / Rules and Regulations
Where: Rate is the initial base assessment rate
(expressed in basis points); Maximum Rate is the maximum initial base
assessment rate then in effect (expressed in basis points); and
Minimum Rate is the minimum initial base assessment rate then in effect (expressed in basis points). Initial base assessment
rates are subject to adjustment pursuant to paragraphs (b)(3) and (e)(1) and (2) of this section; large institutions that are not well capitalized or have a CAMELS composite rating of 3, 4 or 5 shall be subject to the adjustment at paragraph (e)(3) of this section; these adjustments shall result in the institution’s total base assessment rate, which in no case can be
lower than 50 percent of the institution’s initial base assessment rate.
(2) Assessment scorecard for highly complex institutions. (i) A highly complex institution shall have its initial base assessment rate determined using the scorecard for highly complex institutions.
SCORECARD FOR HIGHLY COMPLEX INSTITUTIONS
Measures and components Measure weights
(percent)
Component weights
(percent)
P ....................... Performance Score ................................................................................................................... ........................ ........................P.1 .................... Weighted Average CAMELS Rating ......................................................................................... 100 30 P.2 .................... Ability To Withstand Asset-Related Stress ............................................................................... ........................ 50
Leverage ratio ........................................................................................................................... 10 ........................Concentration Measure ............................................................................................................ 35 ........................Core Earnings/Average Quarter-End Total Assets .................................................................. 20 ........................Credit Quality Measure and Market Risk Measure .................................................................. 35 ........................
P.3 .................... Ability To Withstand Funding-Related Stress ........................................................................... ........................ 20 Core Deposits/Total Liabilities .................................................................................................. 50 ........................Balance Sheet Liquidity Ratio .................................................................................................. 30 ........................Average Short-Term Funding/Average Total Assets ............................................................... 20 ........................
L ........................ Loss Severity Score .................................................................................................................. ........................ ........................L.1 ..................... Loss Severity ............................................................................................................................ ........................ 100
(ii) The scorecard for highly complex institutions produces two scores: Performance and loss severity.
(A) Performance score for highly complex institutions. The performance score for highly complex institutions is the weighted average of the scores for three components: Weighted average CAMELS rating, weighted at 30 percent; ability to withstand asset-related stress score, weighted at 50 percent; and ability to withstand funding-related stress score, weighted at 20 percent.
(1) Weighted average CAMELS rating score. (i) To compute the score for the weighted average CAMELS rating, a weighted average of an institution’s CAMELS component ratings is calculated using the following weights:
CAMELS component Weight (%)
C ................................................. 25 A ................................................. 20 M ................................................. 25 E ................................................. 10 L .................................................. 10 S ................................................. 10
(ii) A weighted average CAMELS rating converts to a score that ranges from 25 to 100. A weighted average rating of 1 equals a score of 25 and a weighted average of 3.5 or greater equals a score of 100. Weighted average
CAMELS ratings between 1 and 3.5 are assigned a score between 25 and 100. The score increases at an increasing rate as the weighted average CAMELS rating increases. Appendix B of this subpart describes the conversion of a weighted average CAMELS rating to a score.
(2) Ability to withstand asset-related stress score. (i) The ability to withstand asset-related stress score is a weighted average of the scores for four measures: Leverage ratio; concentration measure; ratio of core earnings to average quarter- end total assets; credit quality measure and market risk measure. Appendix A of this subpart describes these measures.
(ii) The Leverage ratio and the ratio of core earnings to average quarter-end total assets are described in appendix A of this subpart and the method of calculating the scores is described in appendix B of this subpart.
(iii) The score for the concentration measure for highly complex institutions is the greatest of the higher-risk assets to the sum of Tier 1 capital and reserves score, the top 20 counterparty exposure to the sum of Tier 1 capital and reserves score, or the largest counterparty exposure to the sum of Tier 1 capital and reserves score. Each ratio is described in appendix A of this subpart. The method used to convert the concentration measure into a score is described in appendix C of this subpart.
(iv) The credit quality score is the greater of the criticized and classified items to Tier 1 capital and reserves score or the underperforming assets to Tier 1 capital and reserves score. The market risk score is the weighted average of three scores—the trading revenue volatility to Tier 1 capital score, the market risk capital to Tier 1 capital score, and the level 3 trading assets to Tier 1 capital score. All of these ratios are described in appendix A of this subpart and the method of calculating the scores is described in appendix B of this subpart. Each score is multiplied by its respective weight, and the resulting weighted score is summed to compute the score for the market risk measure. An overall weight of 35 percent is allocated between the scores for the credit quality measure and market risk measure. The allocation depends on the ratio of average trading assets to the sum of average securities, loans and trading assets (trading asset ratio) as follows:
(v) Weight for credit quality score = 35 percent * (1¥trading asset ratio); and,
(vi) Weight for market risk score = 35 percent * trading asset ratio.
(vii) Each of the measures used to calculate the ability to withstand asset- related stress score is assigned the following cutoff values and weights:
VerDate Sep<11>2014 19:17 May 19, 2016 Jkt 238001 PO 00000 Frm 00033 Fmt 4701 Sfmt 4700 E:\FR\FM\20MYR3.SGM 20MYR3 ER
20M
Y16
.166
</G
PH
>
mst
ocks
till o
n D
SK
3G9T
082P
RO
D w
ith R
ULE
S3

32212 Federal Register / Vol. 81, No. 98 / Friday, May 20, 2016 / Rules and Regulations
CUTOFF VALUES AND WEIGHTS FOR MEASURES TO CALCULATE THE ABILITY TO WITHSTAND ASSET-RELATED STRESS SCORE
Measures of the ability to withstand asset-related stress
Cutoff values Market risk measure (percent)
Weights (percent) Minimum
(percent) Maximum (percent)
Leverage ratio ...................................................................... 6 13 ........................ 10. Concentration Measure ........................................................ ........................ ........................ ........................ 35.
Higher Risk Assets/Tier 1 Capital and Reserves; ........ 0 135 Top 20 Counterparty Exposure/Tier 1 Capital and Re-
serves; or.0 125
Largest Counterparty Exposure/Tier 1 Capital and Re-serves.
0 20
Core Earnings/Average Quarter-end Total Assets .............. 0 2 ........................ 20. Credit Quality Measure 1 ...................................................... ........................ ........................ ........................ 35* (1¥Trading Asset Ratio).
Criticized and Classified Items to Tier 1 Capital and Reserves; or.
7 100
Underperforming Assets/Tier 1 Capital and Reserves 2 35 Market Risk Measure 1 ......................................................... ........................ ........................ ........................ 35* Trading Asset Ratio.
Trading Revenue Volatility/Tier 1 Capital ..................... 0 2 60 Market Risk Capital/Tier 1 Capital ................................ 0 10 20 Level 3 Trading Assets/Tier 1 Capital .......................... 0 35 20
1 Combined, the credit quality measure and the market risk measure are assigned a 35 percent weight. The relative weight of each of the two scores depends on the ratio of average trading assets to the sum of average securities, loans and trading assets (trading asset ratio).
(viii) [Reserved] (ix) The score of each measure is
multiplied by its respective weight and the resulting weighted score is summed to compute the ability to withstand asset-related stress score, which can range from 0 to 100, where a score of 0 reflects the lowest risk and a score of 100 reflects the highest risk.
(3) Ability to withstand funding related stress score. Three measures are used to calculate the score for the ability to withstand funding-related stress: A core deposits to total liabilities ratio, a balance sheet liquidity ratio, and average short-term funding to average total assets ratio. Appendix A of this subpart describes these ratios. Appendix
B of this subpart describes how each measure is converted to a score. The ability to withstand funding-related stress score is the weighted average of the scores for the three measures. In the following table, cutoff values and weights are used to derive an institution’s ability to withstand funding-related stress score:
CUTOFF VALUES AND WEIGHTS TO CALCULATE ABILITY TO WITHSTAND FUNDING-RELATED STRESS MEASURES
Measures of the ability to withstand funding-related stress
Cutoff values Weights (percent) Minimum
(percent) Maximum (percent)
Core Deposits/Total Liabilities ..................................................................................................... 5 87 50 Balance Sheet Liquidity Ratio ..................................................................................................... 7 243 30 Average Short-term Funding/Average Total Assets .................................................................... 2 19 20
(4) Calculation of performance score. The weighted average CAMELS score, the ability to withstand asset-related stress score, and the ability to withstand funding-related stress score are multiplied by their respective weights
(30 percent, 50 percent and 20 percent, respectively) and the results are summed to arrive at the performance score, which cannot be less than 0 or more than 100.
(B) Loss severity score. The loss severity score is based on a loss severity
measure described in appendix D of this subpart. Appendix B of this subpart also describes how the loss severity measure is converted to a score between 0 and 100. Cutoff values for the loss severity measure are:
CUTOFF VALUES FOR LOSS SEVERITY MEASURE
Measure of loss severity
Cutoff values
Minimum (percent)
Maximum (percent)
Loss Severity ........................................................................................................................................................... 0 28
(C) Total score. The performance and loss severity scores are combined to produce a total score. The loss severity score is converted into a loss severity
factor that ranges from 0.8 (score of 5 or lower) to 1.2 (score of 85 or higher). Scores at or below the minimum cutoff of 5 receive a loss severity factor of 0.8,
and scores at or above the maximum cutoff of 85 receive a loss severity factor of 1.2. The following linear interpolation converts loss severity
VerDate Sep<11>2014 19:17 May 19, 2016 Jkt 238001 PO 00000 Frm 00034 Fmt 4701 Sfmt 4700 E:\FR\FM\20MYR3.SGM 20MYR3mst
ocks
till o
n D
SK
3G9T
082P
RO
D w
ith R
ULE
S3
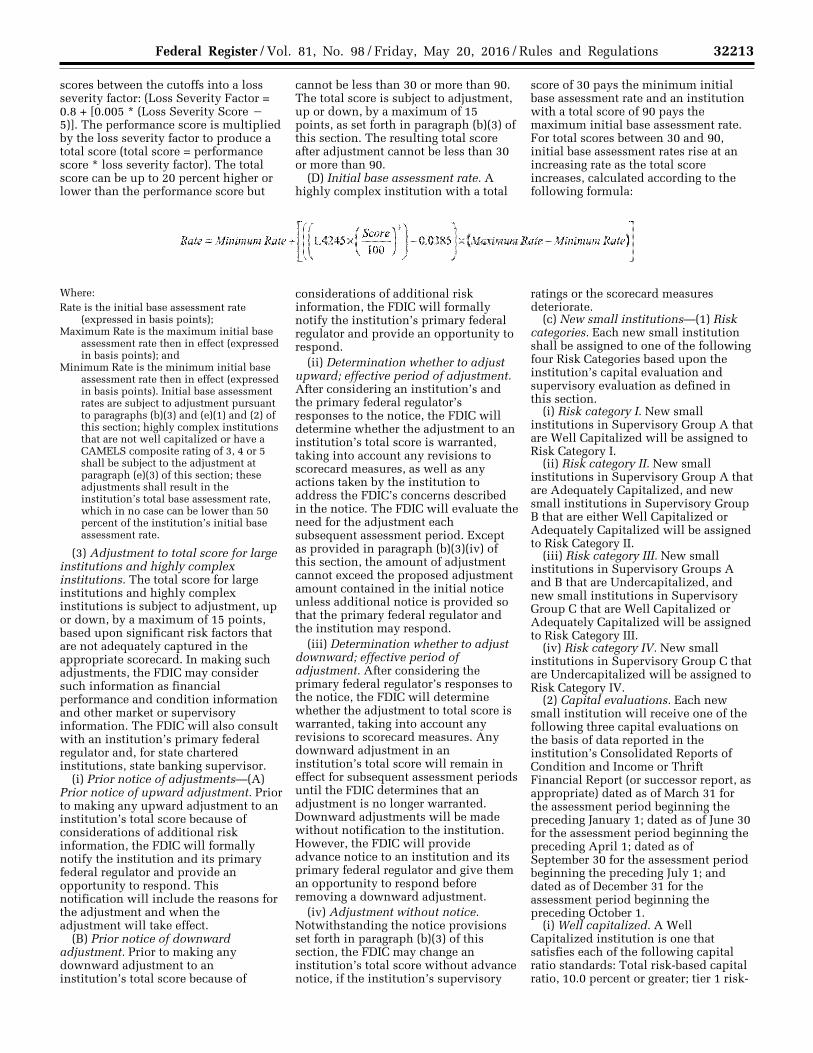
32213 Federal Register / Vol. 81, No. 98 / Friday, May 20, 2016 / Rules and Regulations
scores between the cutoffs into a loss severity factor: (Loss Severity Factor = 0.8 + [0.005 * (Loss Severity Score ¥
5)]. The performance score is multiplied by the loss severity factor to produce a total score (total score = performance score * loss severity factor). The total score can be up to 20 percent higher or lower than the performance score but
cannot be less than 30 or more than 90. The total score is subject to adjustment, up or down, by a maximum of 15 points, as set forth in paragraph (b)(3) of this section. The resulting total score after adjustment cannot be less than 30 or more than 90.
(D) Initial base assessment rate. A highly complex institution with a total
score of 30 pays the minimum initial base assessment rate and an institution with a total score of 90 pays the maximum initial base assessment rate. For total scores between 30 and 90, initial base assessment rates rise at an increasing rate as the total score increases, calculated according to the following formula:
Where: Rate is the initial base assessment rate
(expressed in basis points); Maximum Rate is the maximum initial base
assessment rate then in effect (expressed in basis points); and
Minimum Rate is the minimum initial base assessment rate then in effect (expressed in basis points). Initial base assessment rates are subject to adjustment pursuant to paragraphs (b)(3) and (e)(1) and (2) of this section; highly complex institutions that are not well capitalized or have a CAMELS composite rating of 3, 4 or 5 shall be subject to the adjustment at paragraph (e)(3) of this section; these adjustments shall result in the institution’s total base assessment rate, which in no case can be lower than 50 percent of the institution’s initial base assessment rate.
(3) Adjustment to total score for large institutions and highly complex institutions. The total score for large institutions and highly complex institutions is subject to adjustment, up or down, by a maximum of 15 points, based upon significant risk factors that are not adequately captured in the appropriate scorecard. In making such adjustments, the FDIC may consider such information as financial performance and condition information and other market or supervisory information. The FDIC will also consult with an institution’s primary federal regulator and, for state chartered institutions, state banking supervisor.
(i) Prior notice of adjustments—(A) Prior notice of upward adjustment. Prior to making any upward adjustment to an institution’s total score because of considerations of additional risk information, the FDIC will formally notify the institution and its primary federal regulator and provide an opportunity to respond. This notification will include the reasons for the adjustment and when the adjustment will take effect.
(B) Prior notice of downward adjustment. Prior to making any downward adjustment to an institution’s total score because of
considerations of additional risk information, the FDIC will formally notify the institution’s primary federal regulator and provide an opportunity to respond.
(ii) Determination whether to adjust upward; effective period of adjustment. After considering an institution’s and the primary federal regulator’s responses to the notice, the FDIC will determine whether the adjustment to an institution’s total score is warranted, taking into account any revisions to scorecard measures, as well as any actions taken by the institution to address the FDIC’s concerns described in the notice. The FDIC will evaluate the need for the adjustment each subsequent assessment period. Except as provided in paragraph (b)(3)(iv) of this section, the amount of adjustment cannot exceed the proposed adjustment amount contained in the initial notice unless additional notice is provided so that the primary federal regulator and the institution may respond.
(iii) Determination whether to adjust downward; effective period of adjustment. After considering the primary federal regulator’s responses to the notice, the FDIC will determine whether the adjustment to total score is warranted, taking into account any revisions to scorecard measures. Any downward adjustment in an institution’s total score will remain in effect for subsequent assessment periods until the FDIC determines that an adjustment is no longer warranted. Downward adjustments will be made without notification to the institution. However, the FDIC will provide advance notice to an institution and its primary federal regulator and give them an opportunity to respond before removing a downward adjustment.
(iv) Adjustment without notice. Notwithstanding the notice provisions set forth in paragraph (b)(3) of this section, the FDIC may change an institution’s total score without advance notice, if the institution’s supervisory
ratings or the scorecard measures deteriorate.
(c) New small institutions—(1) Risk categories. Each new small institution shall be assigned to one of the following four Risk Categories based upon the institution’s capital evaluation and supervisory evaluation as defined in this section.
(i) Risk category I. New small institutions in Supervisory Group A that are Well Capitalized will be assigned to Risk Category I.
(ii) Risk category II. New small institutions in Supervisory Group A that are Adequately Capitalized, and new small institutions in Supervisory Group B that are either Well Capitalized or Adequately Capitalized will be assigned to Risk Category II.
(iii) Risk category III. New small institutions in Supervisory Groups A and B that are Undercapitalized, and new small institutions in Supervisory Group C that are Well Capitalized or Adequately Capitalized will be assigned to Risk Category III.
(iv) Risk category IV. New small institutions in Supervisory Group C that are Undercapitalized will be assigned to Risk Category IV.
(2) Capital evaluations. Each new small institution will receive one of the following three capital evaluations on the basis of data reported in the institution’s Consolidated Reports of Condition and Income or Thrift Financial Report (or successor report, as appropriate) dated as of March 31 for the assessment period beginning the preceding January 1; dated as of June 30 for the assessment period beginning the preceding April 1; dated as of September 30 for the assessment period beginning the preceding July 1; and dated as of December 31 for the assessment period beginning the preceding October 1.
(i) Well capitalized. A Well Capitalized institution is one that satisfies each of the following capital ratio standards: Total risk-based capital ratio, 10.0 percent or greater; tier 1 risk-
VerDate Sep<11>2014 19:17 May 19, 2016 Jkt 238001 PO 00000 Frm 00035 Fmt 4701 Sfmt 4700 E:\FR\FM\20MYR3.SGM 20MYR3 ER
20M
Y16
.167
</G
PH
>
mst
ocks
till o
n D
SK
3G9T
082P
RO
D w
ith R
ULE
S3

32214 Federal Register / Vol. 81, No. 98 / Friday, May 20, 2016 / Rules and Regulations
based capital ratio, 8.0 percent or greater; leverage ratio, 5.0 percent or greater; and common equity tier 1 capital ratio, 6.5 percent or greater, and after January 1, 2018, if the institution is an insured depository institution subject to the enhanced supplementary leverage ratio standards under 12 CFR 6.4(c)(1)(iv)(B), 12 CFR 208.43(c)(1)(iv)(B), or 12 CFR 324.403(b)(1)(vi), as each may be amended from time to time, a supplementary leverage ratio of 6.0 percent or greater.
(ii) Adequately capitalized. An Adequately Capitalized institution is one that does not satisfy the standards of Well Capitalized in paragraph (c)(2)(i) of this section but satisfies each of the following capital ratio standards: Total risk-based capital ratio, 8.0 percent or greater; tier 1 risk-based capital ratio, 6.0 percent or greater; leverage ratio, 4.0 percent or greater; and common equity tier 1 capital ratio, 4.5 percent or greater, and after January 1, 2018, if the institution is an insured depository institution subject to the advanced approaches risk-based capital rules under 12 CFR 6.4(c)(2)(iv)(B), 12 CFR 208.43(c)(2)(iv)(B), or 12 CFR 324.403(b)(2)(vi), as each may be amended from time to time, a supplementary leverage ratio of 3.0 percent or greater.
(iii) Undercapitalized. An undercapitalized institution is one that does not qualify as either Well Capitalized or Adequately Capitalized under paragraphs (c)(2)(i) and (ii) of this section.
(3) Supervisory evaluations. Each new small institution will be assigned to one of three Supervisory Groups based on the Corporation’s consideration of supervisory evaluations provided by the institution’s primary federal regulator. The supervisory evaluations include the results of examination findings by the primary federal regulator, as well as other information that the primary federal regulator determines to be relevant. In addition, the Corporation will take into consideration such other information (such as state examination findings, as appropriate) as it determines to be relevant to the institution’s financial condition and the risk posed to the Deposit Insurance Fund. The three Supervisory Groups are:
(i) Supervisory group ‘‘A.’’ This Supervisory Group consists of financially sound institutions with only a few minor weaknesses;
(ii) Supervisory group ‘‘B.’’ This Supervisory Group consists of institutions that demonstrate weaknesses which, if not corrected,
could result in significant deterioration of the institution and increased risk of loss to the Deposit Insurance Fund; and
(iii) Supervisory group ‘‘C.’’ This Supervisory Group consists of institutions that pose a substantial probability of loss to the Deposit Insurance Fund unless effective corrective action is taken.
(4) Assessment method for new small institutions in risk category I—(i) Maximum initial base assessment rate for risk category I new small institutions. A new small institution in Risk Category I shall be assessed the maximum initial base assessment rate for Risk Category I small institutions in the relevant assessment period.
(ii) New small institutions not subject to certain adjustments. No new small institution in any risk category shall be subject to the adjustment in paragraph (e)(1) of this section.
(iii) Implementation of CAMELS rating changes—(A) Changes between risk categories. If, during an assessment period, a CAMELS composite rating change occurs that results in a Risk Category I institution moving from Risk Category I to Risk Category II, III or IV, the institution’s initial base assessment rate for the portion of the assessment period that it was in Risk Category I shall be the maximum initial base assessment rate for the relevant assessment period, subject to adjustment pursuant to paragraph (e)(2) of this section, as appropriate, and adjusted for the actual assessment rates set by the Board under § 327.10(f). For the portion of the assessment period that the institution was not in Risk Category I, the institution’s initial base assessment rate, which shall be subject to adjustment pursuant to paragraphs (e)(2) and (3) of this section, as appropriate, shall be determined under the assessment schedule for the appropriate Risk Category. If, during an assessment period, a CAMELS composite rating change occurs that results in an institution moving from Risk Category II, III or IV to Risk Category I, then the maximum initial base assessment rate for new small institutions in Risk Category I shall apply for the portion of the assessment period that it was in Risk Category I, subject to adjustment pursuant to paragraph (e)(2) of this section, as appropriate, and adjusted for the actual assessment rates set by the Board under § 327.10(f). For the portion of the assessment period that the institution was not in Risk Category I, the institution’s initial base assessment rate, which shall be subject to adjustment pursuant to paragraphs (e)(2) and (3) of this section shall be determined under
the assessment schedule for the appropriate Risk Category.
(B) [Reserved] (d) Insured branches of foreign
banks—(1) Risk categories for insured branches of foreign banks. Insured branches of foreign banks shall be assigned to risk categories as set forth in paragraph (c)(1) of this section.
(2) Capital evaluations for insured branches of foreign banks. Each insured branch of a foreign bank will receive one of the following three capital evaluations on the basis of data reported in the institution’s Report of Assets and Liabilities of U.S. Branches and Agencies of Foreign Banks dated as of March 31 for the assessment period beginning the preceding January 1; dated as of June 30 for the assessment period beginning the preceding April 1; dated as of September 30 for the assessment period beginning the preceding July 1; and dated as of December 31 for the assessment period beginning the preceding October 1.
(i) Well Capitalized. An insured branch of a foreign bank is Well Capitalized if the insured branch:
(A) Maintains the pledge of assets required under § 347.209 of this chapter; and
(B) Maintains the eligible assets prescribed under § 347.210 of this chapter at 108 percent or more of the average book value of the insured branch’s third-party liabilities for the quarter ending on the report date specified in paragraph (d)(2) of this section.
(ii) Adequately Capitalized. An insured branch of a foreign bank is Adequately Capitalized if the insured branch:
(A) Maintains the pledge of assets required under § 347.209 of this chapter; and
(B) Maintains the eligible assets prescribed under § 347.210 of this chapter at 106 percent or more of the average book value of the insured branch’s third-party liabilities for the quarter ending on the report date specified in paragraph (d)(2) of this section; and
(C) Does not meet the definition of a Well Capitalized insured branch of a foreign bank.
(iii) Undercapitalized. An insured branch of a foreign bank is undercapitalized institution if it does not qualify as either Well Capitalized or Adequately Capitalized under paragraphs (d)(2)(i) and (ii) of this section.
(3) Supervisory evaluations for insured branches of foreign banks. Each insured branch of a foreign bank will be assigned to one of three supervisory
VerDate Sep<11>2014 19:17 May 19, 2016 Jkt 238001 PO 00000 Frm 00036 Fmt 4701 Sfmt 4700 E:\FR\FM\20MYR3.SGM 20MYR3mst
ocks
till o
n D
SK
3G9T
082P
RO
D w
ith R
ULE
S3

32215 Federal Register / Vol. 81, No. 98 / Friday, May 20, 2016 / Rules and Regulations
groups as set forth in paragraph (c)(3) of this section.
(4) Assessment method for insured branches of foreign banks in risk category I. Insured branches of foreign banks in Risk Category I shall be assessed using the weighted average ROCA component rating.
(i) Weighted average ROCA component rating. The weighted average ROCA component rating shall equal the sum of the products that result from multiplying ROCA component ratings by the following percentages: Risk Management—35%, Operational Controls—25%, Compliance—25%, and Asset Quality—15%. The weighted average ROCA rating will be multiplied by 5.076 (which shall be the pricing multiplier). To this result will be added a uniform amount. The resulting sum— the initial base assessment rate—will equal an institution’s total base assessment rate; provided, however, that no institution’s total base assessment rate will be less than the minimum total base assessment rate in effect for Risk Category I institutions for that assessment period nor greater than the maximum total base assessment rate in effect for Risk Category I institutions for that assessment period.
(ii) Uniform amount. Except as adjusted for the actual assessment rates set by the Board under § 327.10(f), the uniform amount for all insured branches of foreign banks shall be:
(A) ¥5.127 whenever the assessment rate schedule set forth in § 327.10(b) is in effect;
(B) ¥6.127 whenever the assessment rate schedule set forth in § 327.10(c) is in effect; or
(C) ¥7.127 whenever the assessment rate schedule set forth in § 327.10(d) is in effect.
(iii) Insured branches of foreign banks not subject to certain adjustments. No insured branch of a foreign bank in any risk category shall be subject to the adjustments in paragraph (b)(3) or (e)(1) or (3) of this section.
(iv) Implementation of changes between risk categories for insured branches of foreign banks. If, during an assessment period, a ROCA rating change occurs that results in an insured branch of a foreign bank moving from Risk Category I to Risk Category II, III or IV, the institution’s initial base assessment rate for the portion of the assessment period that it was in Risk Category I shall be determined using the weighted average ROCA component rating. For the portion of the assessment period that the institution was not in Risk Category I, the institution’s initial base assessment rate shall be determined under the assessment
schedule for the appropriate Risk Category. If, during an assessment period, a ROCA rating change occurs that results in an insured branch of a foreign bank moving from Risk Category II, III or IV to Risk Category I, the institution’s assessment rate for the portion of the assessment period that it was in Risk Category I shall equal the rate determined as provided using the weighted average ROCA component rating. For the portion of the assessment period that the institution was not in Risk Category I, the institution’s initial base assessment rate shall be determined under the assessment schedule for the appropriate Risk Category.
(v) Implementation of changes within risk category I for insured branches of foreign banks. If, during an assessment period, an insured branch of a foreign bank remains in Risk Category I, but a ROCA component rating changes that will affect the institution’s initial base assessment rate, separate assessment rates for the portion(s) of the assessment period before and after the change(s) shall be determined under this paragraph (d)(4).
(e) Adjustments—(1) Unsecured debt adjustment to initial base assessment rate for all institutions. All institutions, except new institutions as provided under paragraphs (g)(1) and (2) of this section and insured branches of foreign banks as provided under paragraph (d)(4)(iii) of this section, shall be subject to an adjustment of assessment rates for unsecured debt. Any unsecured debt adjustment shall be made after any adjustment under paragraph (b)(3) of this section.
(i) Application of unsecured debt adjustment. The unsecured debt adjustment shall be determined as the sum of the initial base assessment rate plus 40 basis points; that sum shall be multiplied by the ratio of an insured depository institution’s long-term unsecured debt to its assessment base. The amount of the reduction in the assessment rate due to the adjustment is equal to the dollar amount of the adjustment divided by the amount of the assessment base.
(ii) Limitation. No unsecured debt adjustment for any institution shall exceed the lesser of 5 basis points or 50 percent of the institution’s initial base assessment rate.
(iii) Applicable quarterly reports of condition. Unsecured debt adjustment ratios for any given quarter shall be calculated from quarterly reports of condition (Consolidated Reports of Condition and Income and Thrift Financial Reports, or any successor reports to either, as appropriate) filed by
each institution as of the last day of the quarter.
(2) Depository institution debt adjustment to initial base assessment rate for all institutions. All institutions shall be subject to an adjustment of assessment rates for unsecured debt held that is issued by another depository institution. Any such depository institution debt adjustment shall be made after any adjustment under paragraphs (b)(3) and (e)(1) of this section.
(i) Application of depository institution debt adjustment. An insured depository institution shall pay a 50 basis point adjustment on the amount of unsecured debt it holds that was issued by another insured depository institution to the extent that such debt exceeds 3 percent of the institution’s Tier 1 capital. The amount of long-term unsecured debt issued by another insured depository institution shall be calculated using the same valuation methodology used to calculate the amount of such debt for reporting on the asset side of the balance sheets.
(ii) Applicable quarterly reports of condition. Depository institution debt adjustment ratios for any given quarter shall be calculated from quarterly reports of condition (Consolidated Reports of Condition and Income and Thrift Financial Reports, or any successor reports to either, as appropriate) filed by each institution as of the last day of the quarter.
(3) Brokered deposit adjustment. All new small institutions in Risk Categories II, III, and IV, all large institutions and all highly complex institutions, except large and highly complex institutions (including new large and new highly complex institutions) that are well capitalized and have a CAMELS composite rating of 1 or 2, shall be subject to an assessment rate adjustment for brokered deposits. Any such brokered deposit adjustment shall be made after any adjustment under paragraphs (b)(3) and (e)(1) and (2) of this section. The brokered deposit adjustment includes all brokered deposits as defined in Section 29 of the Federal Deposit Insurance Act (12 U.S.C. 1831f), and 12 CFR 337.6, including reciprocal deposits as defined in § 327.8(p), and brokered deposits that consist of balances swept into an insured institution from another institution. The adjustment under this paragraph is limited to those institutions whose ratio of brokered deposits to domestic deposits is greater than 10 percent; asset growth rates do not affect the adjustment. Insured branches of foreign banks are not subject to the brokered deposit adjustment as
VerDate Sep<11>2014 19:17 May 19, 2016 Jkt 238001 PO 00000 Frm 00037 Fmt 4701 Sfmt 4700 E:\FR\FM\20MYR3.SGM 20MYR3mst
ocks
till o
n D
SK
3G9T
082P
RO
D w
ith R
ULE
S3

32216 Federal Register / Vol. 81, No. 98 / Friday, May 20, 2016 / Rules and Regulations
provided in paragraph (d)(4)(iii) of this section.
(i) Application of brokered deposit adjustment. The brokered deposit adjustment shall be determined by multiplying 25 basis points by the ratio of the difference between an insured depository institution’s brokered deposits and 10 percent of its domestic deposits to its assessment base.
(ii) Limitation. The maximum brokered deposit adjustment will be 10 basis points; the minimum brokered deposit adjustment will be 0.
(iii) Applicable quarterly reports of condition. The brokered deposit adjustment for any given quarter shall be calculated from the quarterly reports of condition (Call Reports and Thrift Financial Reports, or any successor reports to either, as appropriate) filed by each institution as of the last day of the quarter.
(f) Request to be treated as a large institution—(1) Procedure. Any institution with assets of between $5 billion and $10 billion may request that the FDIC determine its assessment rate as a large institution. The FDIC will consider such a request provided that it has sufficient information to do so. Any such request must be made to the FDIC’s Division of Insurance and Research. Any approved change will become effective within one year from the date of the request. If an institution whose request has been granted subsequently reports assets of less than $5 billion in its report of condition for four consecutive quarters, the institution shall be deemed a small institution for assessment purposes.
(2) Time limit on subsequent request for alternate method. An institution whose request to be assessed as a large institution is granted by the FDIC shall not be eligible to request that it be assessed as a small institution for a period of three years from the first quarter in which its approved request to be assessed as a large institution became effective. Any request to be assessed as a small institution must be made to the FDIC’s Division of Insurance and Research.
(3) Request for review. An institution that disagrees with the FDIC’s determination that it is a large, highly
complex, or small institution may request review of that determination pursuant to § 327.4(c).
(g) New and established institutions and exceptions—(1) New small institutions. A new small Risk Category I institution shall be assessed the Risk Category I maximum initial base assessment rate for the relevant assessment period. No new small institution in any risk category shall be subject to the unsecured debt adjustment as determined under paragraph (e)(1) of this section. All new small institutions in any Risk Category shall be subject to the depository institution debt adjustment as determined under paragraph (e)(2) of this section. All new small institutions in Risk Categories II, III, and IV shall be subject to the brokered deposit adjustment as determined under paragraph (e)(3) of this section.
(2) New large institutions and new highly complex institutions. All new large institutions and all new highly complex institutions shall be assessed under the appropriate method provided at paragraph (b)(1) or (2) of this section and subject to the adjustments provided at paragraphs (b)(3) and (e)(2) and (3) of this section. No new highly complex or large institutions are entitled to adjustment under paragraph (e)(1) of this section. If a large or highly complex institution has not yet received CAMELS ratings, it will be given a weighted CAMELS rating of 2 for assessment purposes until actual CAMELS ratings are assigned.
(3) CAMELS ratings for the surviving institution in a merger or consolidation. When an established institution merges with or consolidates into a new institution, if the FDIC determines the resulting institution to be an established institution under § 327.8(k)(1), its CAMELS ratings for assessment purposes will be based upon the established institution’s ratings prior to the merger or consolidation until new ratings become available.
(4) Rate applicable to institutions subject to subsidiary or credit union exception—(i) Established small institutions. A small institution that is established under § 327.8(k)(4) or (5) shall be assessed as follows:
(A) If the institution does not have a CAMELS composite rating, its initial base assessment rate shall be 2 basis points above the minimum initial base assessment rate applicable to established small institutions until it receives a CAMELS composite rating.
(B) If the institution has a CAMELS composite rating but no CAMELS component ratings, its initial assessment rate shall be determined using the financial ratios method, as set forth in paragraph (a)(1) of this section, but its CAMELS composite rating will be substituted for its weighted average CAMELS component rating and, if the institution has not filed four quarterly reports of condition, then the assessment rate will be determined by annualizing, where appropriate, financial ratios from all quarterly reports of condition that have been filed.
(ii) Large or highly complex institutions. If a large or highly complex institution is considered established under § 327.8(k)(4) or (5), but does not have CAMELS component ratings, it will be given a weighted CAMELS rating of 2 for assessment purposes until actual CAMELS ratings are assigned.
(5) Request for review. An institution that disagrees with the FDIC’s determination that it is a new institution may request review of that determination pursuant to § 327.4(c).
(h) Assessment rates for bridge depository institutions and conservatorships. Institutions that are bridge depository institutions under 12 U.S.C. 1821(n) and institutions for which the Corporation has been appointed or serves as conservator shall, in all cases, be assessed at the minimum initial base assessment rate applicable to established small institutions, which shall not be subject to adjustment under paragraph (b)(3) or (e)(1), (2), or (3) of this section.
By order of the Board of Directors. Dated at Washington, DC, this 26th day of
April, 2016. Federal Deposit Insurance Corporation. Robert E. Feldman, Executive Secretary. [FR Doc. 2016–11181 Filed 5–19–16; 8:45 am]
BILLING CODE 6714–01–P
VerDate Sep<11>2014 19:17 May 19, 2016 Jkt 238001 PO 00000 Frm 00038 Fmt 4701 Sfmt 9990 E:\FR\FM\20MYR3.SGM 20MYR3mst
ocks
till o
n D
SK
3G9T
082P
RO
D w
ith R
ULE
S3


![[XXXX-XX-X] FEDERAL DEPOSIT INSURANCE … [XXXX-XX-X] FEDERAL DEPOSIT INSURANCE CORPORATION 12 CFR Part 370 RIN 3064-AD37 Final Rule Regarding Amendment of the …](https://img.pdfslide.net/doc/110x75/5ac108947f8b9a4e7c8c8caf/xxxx-xx-x-federal-deposit-insurance-xxxx-xx-x-federal-deposit-insurance.jpg)