Embed Size (px)
Citation preview

Federal Policies and the Medical DevicesIndustry
November 1984
NTIS order #PB85-199552

Recommended Citation:Federal Policies and the Medical Device Industry (Washington, D. C.: U.S. Congress, Officeof Technology Assessment, OTA-H-230, October 1984).
Library of Congress Catalog Card Number 84-601125
For sale by the Superintendent of DocumentsU.S. Government Printing Office, Washington, D.C. 20402

Foreword
In recent decades, both the range of medical devices and the industry that manufac-tures them have greatly expanded. At the same time, there has been growing Federalinvolvement in the U.S. health care system. The Medicare and Medicaid programsestablished in the 1960s have increased the market for medical technologies and havegreatly influenced patterns of payment and use. The Federal Government instituted apremarketing approval process for medical devices in 1976. Other activities, such asfunding research and development, regulating the providers of medical devices, andproviding medical care for veterans, have involved the Government in the develop-ment and purchase of medical devices.
Since the late 1970s, congressional committees have been interested in the effectsof such Federal policies on the companies that manufacture medical devices. In early1982, this interest resulted in a request from the Senate Labor and Human ResourcesCommittee to the Office of Technology Assessment (OTA) for an assessment of Federalpolicies and their effect on the medical devices industry. The Senate Veterans’ AffairsCommittee endorsed the request and expressed particular interest in the activities ofthe Veterans Administration regarding device development and procurement.
In preparing this report, OTA staff drew upon the expertise of members of the ad-visory panel for the study, members of the OTA Health Program Advisory Commit-tee, and experts in health policy, industry, research and development, economics, healthadministration, and medicine. Drafts of the final report were reviewed by the advisorypanel, chaired by Dr. Richard R. Nelson; OTA’s Health Program Advisory Commit-tee, chaired by Dr. Sidney S. Lee; and other individuals and groups with expertise inthe area. We are grateful for their assistance. Key OTA staff involved in the prepara-tion of the document were Jane E. Sisk, Cynthia P. King, John C. Langenbrunner,Katherine E. Locke, Lawrence H. Miike, and Judith L. Wagner.
U JOHN H. GIBBONSDirector
,..Ill

Advisory Panel for Federal Policies and The Medical Devices Industry
Richard R. Nelson, ChairInstitute for Social and Policy Studies, Yale University
New Haven, CT
William F. BallhausInternational Numatics, Inc.Beverly Hills, CA
Ruth FarriseyMassachusetts General HospitalBoston, MA
Peter Barton HuttCovington & BurlingWashington, DC
Alan R. KahnConsultantCincinnati, OH
Grace KraftKidney Foundation of the Upper MidwestCannon Falls, MN
Joyce LashofSchool of Public HealthUniversity of CaliforniaBerkeley, CA
Penn LupovichGroup Health AssociationWashington, DC
Victor McCoyParalyzed Veterans of AmericaWashington, DC
Robert M. MoliterMedical Systems DivisionGeneral ElectricWashington, DC
Louise B. RussellThe Brookings InstitutionWashington, DC
Earl J. SaltzgiverForemost Contact Lens Service, Inc.Salt Lake City, UT ●
Rosemary StevensDepartment of History and Sociology of ScienceUniversity of PennsylvaniaPhiladelphia, PA
Allan R. ThiemeAmigo Sales, Inc.Albuquerque, NM
Eric von HippelSloan SchoolMassachusetts Institute of TechnologyCambridge, MA
Edwin C. WhiteheadTechnicon Corp.Tarrytown, NY

OTA Project Staff—Federal Policies and the Medical Devices Industry
Jane E. Sisk, Project Director
Cynthia P. King, Analyst
John C. Langenbrunner, Analyst1
Katherine E. Locke, Research Assistant
Lawrence H. Miike, Senior Associate
Elaine J. Power, Intern2
Judith L. Wagner, Senior Analyst
Kerry Britten Kemp, Health and Life Sciences Division Editor
Virginia Cwalina, Administrative Assistant
Rebecca I. Erickson, Secretary/Word Processing Specialist
Brenda B. Miller, Word Processor/P. C. Specialist
Clyde J. Behney, Health Program Manager
Roger C. Herdman3 and H. David Banta,4 Assistant Director, OTAHealth and Life Sciences Division
Contractors
James R. Barth and Joseph J. Cordes, George Washington University
Dennis J. Cotter, Georgetown University Health Policy Center
Pony M. Ehrenhaft, Washington, DC
Hope S. Foster, O’Connor & Hannan, Washington, DC
John Hutton, University of York, England
IMS America Ltd., Rockville, MD
Kaye, Scholer, Fierman, Hays & Handler, Washington, DC
Kornmeier, McCarthy, Lepon & Harris, Washington, DC
Anthony A. Romeo, University of Connecticut
1Until November 1983.2Summer 1983.3From December 1983.4Until August 1983.
v

Contents
Chapter Page
1.
2.
3.
4.
5.
6.
7.
Introduction and Summary . . . . . . . . . . . . . . . . . . . . . . . . . . . . . . . . . . . . . . . . . . . . . . 3
Characteristics of the Medical Devices Industry. . . . . . . . . . . . . . . . . . . . . . . . . . . . . 17
Payment Policies for Health Care and Medical Devices . . . . . . . . . . . . . . . . . . . . . . . 41
Research and Development Policies Related to Medical Devices . . . . . . . . . . . . . . . 77
Regulation of Medical Devices by the Food and Drug Administration . . . . . . . . . . 97
Regulation of the Providers of Medical Devices . . . . . . . . . . . . . . . . . . . . . . . . . . . . . . 137
Veterans Administration Policies Regarding Medical Devices . . . . . . . . . . . . . . . . . . 157
Appendixes Page
A.
B.
c.D.
E.
F.
G.
H.
I.
J
Method of the Study . . . . . . . . . . . . . . . . . . . . . . . . . . . . . . . . . . . . . . . . . . . . . . . . . . . . 179
Acknowledgments and Health Program Advisory Committee . . . . . . . . . . . . . . . . . 182
The Innovative Process in the Medical Devices Field . . . . . . . . . . . . . . . . . . . . . . . . . 186
Patent Policy Regarding Medical Devices . . . . . . . . . . . . . . . . . . . . . . . . . . . . . . . . . . . 191
Method Used for OTA’s Analysis of Applications to the National Institutesof Health for Small Business Innovation Research Grants . . . . . . . . . . . . . . . . . . . . 196
The Database of Venture Economics, Inc., on Sourcesof Financial Capital . . . . . . . . . . . . . . . . . . . . . . . . . . . . . . . . . . . . . . . . . . . . . . . . . . . . 197
Tax Policy and Research and Development on Medical Devices . . . . . . . . . . . . . . . 199
Consensus Standards Related to International Trade in Medical Devices . . . . . . . 204
Governmental Regulation of International Trade in Medical Devices:United States, Canada, Japan, United Kingdom, France,Federal Republic of Germany, and Mexico . . . . . . . . . . . . . . . . . . . . . . . . . . . . . . . . 216
Glossary of Acronyms and Terms . . . . . . . . . . . . . . . . . . . . . . . . . . . . . . . . . . . . . . . . . 231
References . . . . . . . . . . . . . . . . . . . . . . . . . . . . . . . . . . . . . . . . . . . . . . . . . . . . . . . . . . . . . . . . . 237
Index . . . . . . . . . . . . . . . . . . . . . . . . . . . . . . . . . . . . . . . . . . . . . . . . . . . . . . . . . . . . . . . . . . . . . 257

1.
Introduction and Summary
No one has yet managed to measure the state of technical knowledge,much less the rate of change of technological knowledge.
—M. Blaug

Contents
Introduction and Summary . . . . . . . . . . . . . . . . . . . . . . . .Scope of the Study . . . . . . . . . . . . . . . . . . . . . . . . . . . . . . ..................Summary . . . . . . . . . . . . . . . . . . . . . . . . . . . . . . . . . . . . . . . . . . . . . . . . . . . . . . . . . . .
Payment Policies for Health Care and Medical Devices . . . . . . . . . . . . . . . . . . . .Regulation ofR&D PoliciesRegulation of
Medical Devices by the Food and Drug Administration . . . . . . .Related to Medical Devices . . . . . . . . . . . . . . . . . . . . . . . . . . . .the Providers of Medical Devices. . . . . . . . . . . . . . . . . . . . . . . .
Veterans Administration Policies Regarding Medical Devices . . . . . . . . . . . . . . .Conclusions . . . . . . . . . . . . . . . . . . . . . . . . . . . . . . . . . . . . . . . . . . . . . . . . . . . .
34568
11111314
1. ■
Introduction and SummaryMedical devices are a striking feature of U.S.
medical care. The past generation has seen the de-velopment of a tremendous range of devices whoseuse has improved or prolonged people’s lives andrevolutionized medical practice.
Some medical devices have enabled people withwhat would otherwise be debilitating conditionsto improve their functioning. Artificial hip joints,for example, have enabled elderly people withcrippling disabilities to walk and live independ-ently. Other devices have extended people’s lives.The Scribner shunt has permitted long-term hemo-dialysis for end-stage renal disease, and the car-diac pacemaker has controlled certain arrhythmiasof the heart.
Still other devices have drastically altered med-ical diagnosis and treatment. Starting with auto-mated blood chemistry analyzers, clinical labora-tories have shifted from manual to mechanizedprocedures, with consequent improvements in thespeed, accuracy, and per-unit cost of tests. Newimaging devices, such as the computed tomogra-phy (CT) scanner, ultrasound, and mammography,often obviate the use of more dangerous, pain-ful, and costly procedures, such as exploratorysurgery. Innovations in needles, sutures, and micro-scopes have greatly improved cataract surgery.
The industry that manufactures medical devicesin the United States has grown in tandem withthese developments. From less than $1 billion in1958, industry sales grew to more than $17 bil-lion in 1983. Even after adjustment for inflation,industry sales increased sixfold during that period.About 3,500 companies now employ more than200,000 people, compared with about 65,000employees in 1958.
These changes in the medical devices industry
have occurred during an era of growing Federalinvolvement in the U.S. health care system. TheMedicare and Medicaid programs, which wereenacted in 1965, have greatly increased health in-surance coverage, expanded the market for med-ical devices, and influenced their development anduse. Between 1960 and 1982, primarily becauseof the growth in Federal programs, the share of
medical expenditures paid by third parties rosefrom 45 to almost 70 percent.
The kind of health insurance coverage that hasevolved in this country has insulated the buyersand users of medical technologies—mainly phy-sicians, hospitals, and patients—from the cost ofmany medical services, especially those providedin hospitals. The purpose of health insurance pro-grams such as Medicare is to permit people to ob-tain needed medical care without risking finan-cial ruin. But there is discretion involved in theuse of medical technology, and for many devices,insurance coverage has reduced the importanceof cost as one of the few factors that motivatediscretion. Some devices, especially those asso-ciated with prevention and rehabilitation, are lesslikely to be covered by insurance than others andmay be relatively underused.
The Medical Device Amendments of 1976 sig-nificantly expanded the Food and Drug Admin-istration’s (FDA) authority to regulate medicaldevices for safety and efficacy. This and otherFederal activities, such as supporting research anddevelopment (R&D), regulating the purchase anduse of devices by medical providers, and deliver-ing medical care to veterans, have substantiallyinvolved the Government in the market for med-ical devices.
Congressional committees have been interestedsince the late 1970s in the effect of Federal pol-icies on the companies that manufacture medicaldevices. There has been particular concern thatthe newly established Federal regulatory processfor devices might be harming technological in-novation and small companies. In early 1982, thisinterest resulted in a request from the Senate La-bor and Human Resources Committee to the Of-fice of Technology Assessment (OTA) for anassessment of Federal policies and their effect onthe medical devices industry. The Senate Com-mittee on Veterans’ Affairs, in endorsing thatrequest, raised issues related to the Veterans Ad-ministration (VA) and its role in technology de-velopment and procurement. This report has beenprepared in response to those requests.
3

4 ● Federal Policies and the Medical Devices Industry— .
SCOPE OF THE STUDYMedical devices span a vast array of supplies
and equipment, from frequently purchased itemswith low unit cost, such as bandages and syringes,to infrequently purchased items with high unitcosts, such as clinical laboratory and imagingequipment. The definition of a medical deviceused for this study is taken from the 1976 Medi-cal Device Amendments (Public Law 94-295) tothe Federal Food, Drug, and Cosmetic Act. Thus,the term medical device refers to any instrument,apparatus, or similar or related article that is in-tended to prevent, diagnose, mitigate, or treat dis-ease or to affect the structure or function of thebody. This definition excludes drugs, which achievetheir effects through chemical action within or onthe body. Medical devices are thus one class ofmedical technology as defined by OTA.l
A wide range of Federal policies helps to framethe social, political, and economic context of themarket for medical devices. This report concen-trates on Federal policies that have the greatestleverage over the kinds of medical devices pro-duced and the price at which they are sold: pol-icies pertaining to payment for health care, sup-port for R&D, regulation of the safety and efficacyof medical devices by FDA, regulation of medi-cal providers, and development and procurementof devices by the VA. Policies that extend to theentire economy, such as those regarding taxation,financial capital, patents, and export control, areexcluded from detailed analysis. Although thesebroader policies may affect medical devices, anyoptions for changing them would require an anal-ysis that reached well beyond the confines of themedical devices industry or this report.
As background to an analysis of Federal pol-icies regarding the medical devices industry, it isimportant to note that medical care differs frommany other products that are bought and sold.Patients often do not have the expertise to evaluatemedical technologies and therefore tend to relyon medical professionals for guidance concer-ning which medical services and devices to use.
IOTA has defined medical technology to include drugs, devices,medical and surgical procedures, and the organizational and sup-portive systems within which medical care is provided.
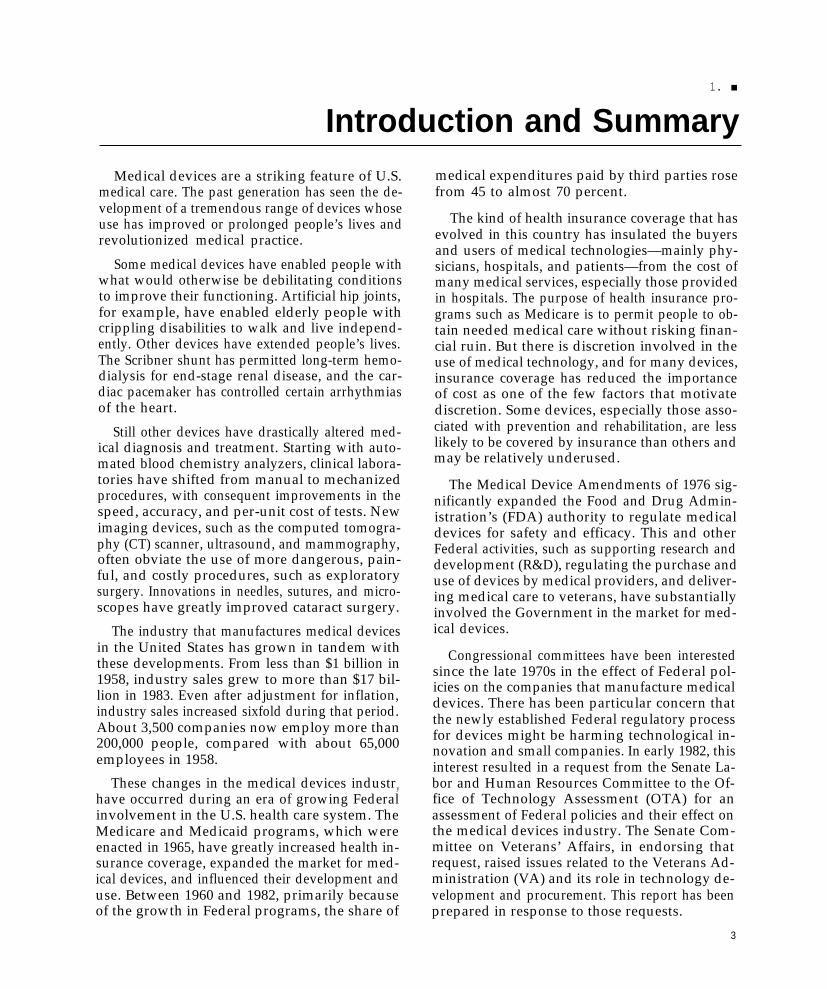
Photo credit: E. /. du Pont de Nemours & Co.
Medical devices encompass abroad range of products,including not only sophisticated, expensive equipmentsuch as computed tomography (CT) scanners, butrelatively simple and inexpensive items, such as
bandages, syringes, and stethoscopes.
Even medical professionals, however, often lackthe expertise to assess sophisticated devices, a factthat underlies the regulatory process establishedby the 1976 Medical Device Amendments.
Governmental programs such as Medicare re-flect the social concern that people be able to ob-tain some minimum level of care, regardless oftheir ability to pay. Benefits from the use of somemedical devices and other technologies, especiallythose to prevent and treat infectious disease, in-clude increases in overall levels of health and pro-ductivity and are thus greater for society than forthe individuals who use the technologies. Gov-ernmental public health programs to immunizeyoung children and to test their vision reflect thesocietal importance attached to the use of suchmedical technologies.
The remainder of this chapter summarizes thechapters in the body of the report: characteris-tics of the medical devices industry, payment pol-

Ch. 1—Introduction and Summary ● 5——-———- — — —
icies for health care and devices, FDA regulationof devices, R&D policies related to devices, reg-ulation of providers, and VA policies regardingdevices. Appendix A describes the method of con-ducting the study, and appendix B acknowledgesthe valuable assistance of several individuals. Ap-pendixes C through I contain material on topicsthat relate to but are broader than medical de-
SUMMARYIn recent years, a number of problems have
been perceived in the cost, efficiency, quality, andinnovation of medical devices, all of which relatein some way to Federal health care policies. Since1978, U.S. expenditures for medical care havebeen rising at an annual rate of 13 to 16 percent,much faster than the rate of growth in the U.S.gross national product. Although studies have notdocumented the precise role of medical technol-ogy in escalating medical care costs,2 the adop-tion of new, sophisticated medical devices, suchas CT scanners, and overuse of existing devices,such as automated clinical laboratory analyzers,have often been implicated as contributing factors.
In addition to concerns about the growth orlevel of health care expenditures, there is concernabout whether the benefits gained in improvedhealth or reduced worry have been worth thecosts. This concern stems from the prevalence ofhealth insurance, which has changed the balancebetween costs and benefits for people who buyand use medical technologies. Health insurance,especially Federal programs, was originally in-tended to make basic medical care accessible topeople who might otherwise not be able to payfor it. But recent concerns about costs have mutedsuch distributional issues. And some cost-effectiveinterventions that are not well covered by insur-ance, especially in preventive and rehabilitativecare, are probably underused.
Issues more directly related to medical devicespertain to the quality of products marketed andused, including their safety and efficacy, and to
‘See OTA’s report Medical Technology and Costs of the Medi-care Program (342) for estimates of technology’s aggregate contri-bution to health, hospital, and Medicare costs.
vices: innovative activity, patent policy, tax pol-icy, consensus standards in international trade,and foreign regulation of international trade. Inaddition to this main report, six case studies ofspecific devices, a technical memorandum on thepolicies of the VA, and a compilation of inven-tors’ vignettes are being published in connectionwith this assessment.
continued innovation in the field. Concerns raisedin the early 1970s about fraudulent and hazard-ous devices culminated in the 1976 Medical De-vice Amendments to the Food, Drug, and Cos-metic Act. The regulatory process for devicesunder this act, in turn, has led to concerns aboutwhether such regulation will impede innovation,which has long been a hallmark of the medicaldevices field, and whether the degree of consumerprotection gained is worth the costs.
The Federal policies most prominent and prob-ably most influential in the medical devices fieldhave been those pertaining to health insuranceprograms, chiefly Medicare and Medicaid, andregulation of marketing. As discussed in this re-port, however, policies pertaining to R&D, reg-ulation of providers, and veterans have had asubstantial role as well.
Federal funding of R&D has been a longstand-ing Federal activity, mainly within the purviewof the National Institutes of Health (NIH). Fed-eral R&D in medical devices, as in other fields,has been intended to stimulate worthwhile in-novations that private developers might not other-wise undertake.
Federal and State regulation of providers whopurchase and use devices was an early responseto rising medical expenditures. Such regulationhas had two goals in addition to cost containment:ensuring that people receive care of acceptablequality and ensuring that the distribution of fa-cilities is equitable.
The Federal Government has sought for manyyears to ensure that veterans have access to med-ical care, including devices. In carrying out its

6 ● Federal Policies and the Medical Devices Industry
mandate, the VA has been involved in the fullrange of activities from R&D through purchaseof devices. Because of the many VA medicalcenters and individual veterans who rely on theagency for devices, the VA has substantial lever-age in the market for many devices.
The Federal policies just mentioned are fre-quently inconsistent, as one would expect of pro-grams that have different, often conflicting, goals:ensuring access to medical care for veterans,elderly and poor people; containing the cost ofthat care; ensuring acceptable quality of care; pro-tecting public health and safety; stimulating worth-while innovations; and minimizing the adverse ef-fects of regulation on manufacturers. This reportand the remainder of this summary chapter de-scribe and analyze these policies with respect totheir effect on the medical devices industry.
A thorough grounding in current and recentFederal policies is particularly important forassessing policy changes that are contemplated orunder way. In the area of payment for medicalcare, tremendous changes are under way that mayaffect devices. Medicare and some private third-party payers are beginning to pay hospitals a fixedamount set in advance for each case.3 The adop-tion of this type of prospective payment methodfor hospitals may substantially change the mar-ket for medical devices and may have implicationsfor the international trade position of U.S. man-ufacturers. In the process of implementing the newpayment system, Medicare is developing policiesthat will affect medical devices, such as how topay for capital expenditures and how to ensureuse of care that conforms to an acceptable levelof quality.
Another important policy area is FDA regula-tion of medical devices and the balance betweenprotecting the public’s health and minimizing theregulatory burden on manufacturers. Major por-tions of the Medical Device Amendments have yetto be implemented, and implementation of somemay not be feasible.
3See OTA’s technical memorandum Diagnosis Related Groups(DRGs) and the Medicare Program: Implications for Medical Tech-nology (341).
Payment Policies for Health Careand Medical Devices
In general, health insurance has stimulated themedical devices field by providing a secure andgrowing market for the products used in medicalcare. The effects of insurance on the market forspecific devices have varied, depending on thecoverage of the devices as benefits, the methodsof payment for covered devices, and the finan-cial relationship between the payer and providerof care.
In recent decades, the sales of devices whoseuse has been well covered by insurance, such asX-ray and electromedical equipment and surgi-cal equipment and supplies, have grown muchmore rapidly than sales of devices such as dentalsupplies and ophthalmic goods, for which patientspay a much greater share of the cost. Medicareand most other health insurance programs coverinpatient hospital care more fully than care pro-vided in other locations, such as physicians’ of-fices and ambulatory laboratories. Some kinds ofmedical care and their associated devices, such aspreventive technologies, eyeglasses, and hearingaids, are excluded from coverage or covered toa very limited extent.
Most methods of third-party payment for med-ical care used in the past have encouraged theadoption and use of medical devices because pro-viders have received more payment with greateruse of technology. Physicians and clinical labora-tories have been paid by Medicare, some Medic-aid, and many Blue Cross/Blue Shield plans forthe charges they have billed, subject to limits setaccording to the fee levels prevailing in the area.Besides stimulating use of technology, these charge-based payment methods have encouraged priceincreases because insurers have used recentlybilled charges to set new levels of payment.
Hospitals have traditionally been paid accord-ing to the charges they have billed or the coststhey have incurred. Traditional hospital paymentmethods have encouraged the adoption and useof medical technologies and have discouragedprice or cost containment.
Recently, however, Medicare and some Stateshave begun to pay hospitals prospectively (i.e.,

Ch. 1—Introduction and Summary ● 7
with rates set in advance of the time when theyapply). In October 1983, Medicare started to payhospitals a fixed amount per admission that variesacross 470 different diagnosis related groups(DRGs). The amount now covers only inpatientoperating costs; capital, outpatient, and teachingexpenses are continuing to be paid on a cost basisfor the time being.
Medicare’s DRG payment system provides in-centives for hospitals to become much more costconscious in their adoption and use of medicaldevices and other resources. Whereas hospitalpayment methods in the past have encouragedproviders and manufacturers to emphasize non-price factors, DRG payment encourages them togive more prominence to price considerations.Especially favored by DRG hospital payment aredevices that lower the cost of a hospital stay byreducing the costs of services provided or byshortening the length of stay. Hospitals are likelyto increase group purchasing, standardize theirpurchases, and require competitive bidding forequipment and supplies.
How DRG rates are changed in future years toreflect changes in prices and technology will af-fect incentives to develop and use new devices.As payment incentives change, many U.S. devicemanufacturers will face an adjustment in theirproduct development and marketing strategies,from stressing quality to placing more emphasison price. However, such a change promises tomake U.S. devices more competitive interna-tionally if U.S. companies can more effectivelychallenge foreign ones on the basis of price as wellas technology.
The exclusion of capital expenses from the DRGhospital payment rate fosters the adoption ofdurable equipment and facilities relative to morelabor-intensive services, with inadequate regardfor the total benefits and costs of each. Congresshas stated its intention of including capital in theprospective rate by 1986. Another problem is thatbecause Medicare’s DRG payment system appliesonly to operating costs for inpatient care, it en-courages the adoption and use of devices andother resources in settings such as home healthcare and hospital outpatient facilities, where DRGpayment is not in effect. In some cases, such as
surgery for cataract removal and placement of anintraocular lens, it is possible that the movementaway from inpatient care may reduce cost andbenefit the patient. But DRG payment as nowestablished fosters changes in that direction withinadequate regard for the effects on total costs ofcare or benefits to patients.
Policy options can address these problems inspecific areas of medical care and device use. Oneapproach would be to develop payment methodswith financial incentives that are more neutralwith respect to physicians’ decisions to use devicesand that encourage physicians to select the leastcostly settings of use. Currently, for example,physicians have financial incentives to order andperform clinical laboratory tests in their offices
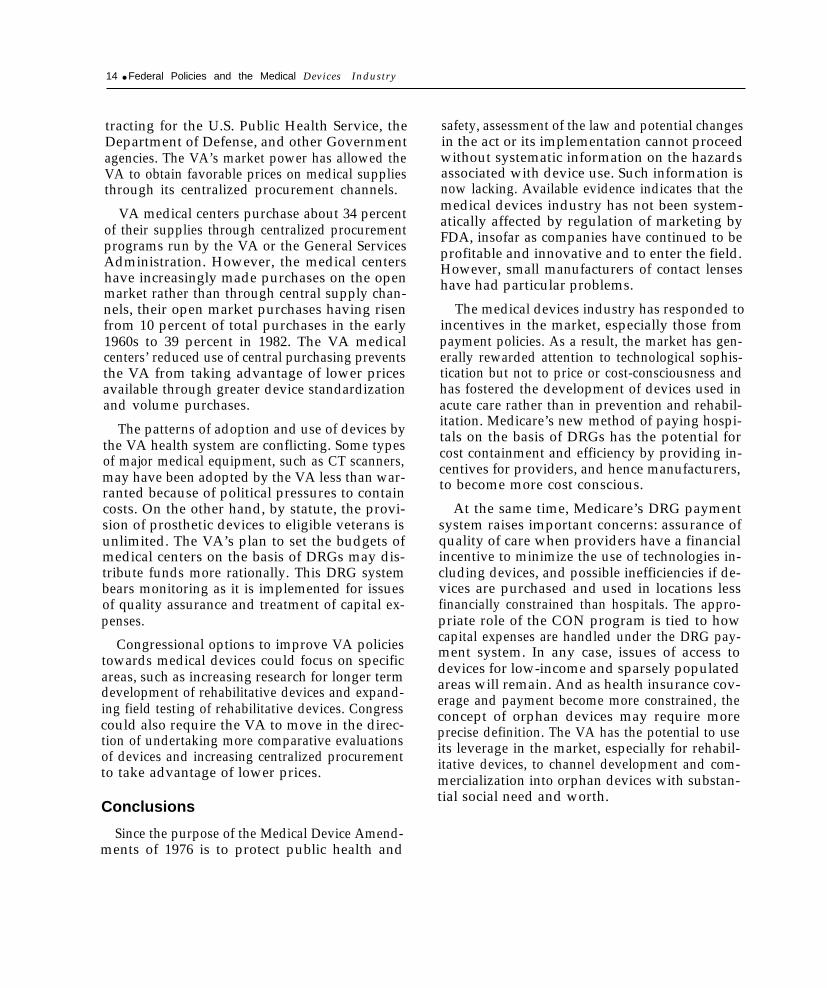
Photo credit: E. I. du Pont de Nemours & Co.
Automated clinical chemistry analyzers, first developedin the 1950s, improve the speed and accuracy andlower the per-unit costs of laboratory tests on bloodsamples. Their use, however, has been implicated as
a source of rising medical expenditures,

8 ● Federal Policies and the Medical Devices Industry
and to use procedures associated with new devicesfor which high fees may be set. Congress couldrequire Medicare to experiment with paymentmethods for laboratory and physician servicesthat are mindful of incentives regarding the useof different technologies and locations of care.
Congress could also encourage Medicare to ex-periment with alternatives to reasonable chargereimbursement of durable medical equipment andto unify payment policies regarding parenteral orenteral nutrition therapy for patients receiving andnot receiving home health services. Congressmight also consider including capital in Medicare’sDRG hospital payment rates, so that hospitalsconsider the cost of equipment and facilities whenmaking decisions about resources to purchase anduse.
The above options that address problems inspecific areas of medical care and device usewould continue payment methods with basicshortcomings. These methods encourage the useof medical technologies, including devices, be-cause providers are paid more for using more serv-ices, and encourage technology use to shift to lessrestricted, more lucrative locations. The resultingpattern of use of devices and other technologiesis unlikely to reflect their relative costs and bene-fits. A different policy approach would be tomove Medicare in the direction begun with DRGpayment. Congress could encourage Medicare toset overall limits on the amount to be paid for careand to permit providers and patients to determinethe use of specific devices and other technologieswithin that limit. Such methods of per-case or per-person payment could be applied to physicianservices, all hospital care, or the full range of med-ical care.
Regulation of Medical Devices by theFood and Drug Administration
FDA regulation of medical devices was intendedto protect consumers’ health and safety by ensur-ing that marketed products are effective and safe.The Medical Device Amendments of 1976 pro-vided more effective methods for dealing withfraudulent devices and attempted to anticipate andminimize the potential risks associated with in-
creasingly sophisticated devices. Congress also in-tended that the regulation impede innovation inthe field as little as possible.
The Medical Device Amendments provided forregulation according to the degree of potential riskposed by a device. Devices that had been mar-keted before 1976 were to be assigned to one ofthree classes: Class I, encompassing devices forwhich general controls such as good manufactur-ing practices were deemed adequate to ensuresafety and efficacy; Class II, an intermediate cat-egory, for devices for which general controls weredeemed insufficient to ensure safety and efficacyand for which performance standards could be de-veloped; and Class III, for devices that supportlife, prevent health impairment, or present anunreasonable risk of illness or injury and requireFDA approval before marketing.
With limited resources, FDA has set prioritiesin implementing the 1976 Medical Device Amend-ments. By early 1984, while the majority of themedical specialty classification panels set up byFDA had completed classification of the devicetypes4 assigned to them, the others had only pro-posed classifications. Twenty-seven percent of thedevice types are in Class I; 64 percent are in ClassII; and 8 percent are in Class III.
To obtain FDA’s market approval, all Class 111devices are required to show evidence of safetyand effectiveness. However, preamendments ClassIII devices were given a 30-month grace periodbefore FDA could require such evidence, and FDAmay extend that period. Furthermore, until evi-dence is required for their preamendments equiv-alents, postamendments devices found “substan-tially equivalent” to Class III preamendmentsdevices may be marketed without additional proofof safety and effectiveness.
FDA could have expedited the classification ofpotentially high-risk Class III device types withineach medical specialty category, thereby startingthe grace period after which evaluation of Class
— — —4A device type may include all products of a particular type (e. g.,
cardiac pacemakers) or grouping of devices that are similar (e.g.,obstetrics-gynecology specialized manual instruments).

Ch. 1—Introduction and Summary ● 9
III preamendments devices of these types couldbegin. Instead, FDA has completed classificationsof device types in the medical specialty catego-ries in which most of the device-associated deathsand injuries have been and continue to be re-ported—e.g., cardiovascular (pacemakers, heartvalves) and obstetrics-gynecology (intrauterinedevices (IUDs)). Furthermore, in September 1983,FDA expressed its intention of reviewing evidenceof safety and effectiveness for 13 preamendmentsClass III device types that it considers of highestpriority. Documentation of safety and effective-ness of products of these types will be needed fortheir continued marketing.
Another of FDA’s priorities has been to imple-ment the premarket approval process for post-amendments Class III devices. Guidelines for theprocedures by which investigational Class IIIdevices may be tested and evidence gathered hadbeen completed by FDA by 1980.
FDA’s premarket approval process has been ap-plied to only a small fraction of the devices mar-keted after 1976. Postamendments devices that arefound substantially equivalent to a device alreadyon the market are automatically classified and reg-ulated like their preamendments equivalent. Bythe end of fiscal year 1981, only about 300 of the17,000 products submitted for clearance to FDAafter 1976 had been found not substantiallyequivalent. Although products that are not sub-stantially equivalent are automatically placed inClass III, the manufacturer can petition FDA forreclassification, and some manufacturers havedone this. *
No performance standards have yet been de-veloped for Class II devices. In practice, there-fore, Class II devices have been regulated likeClass I devices. In mid-1983, FDA identified 11priority Class II device types for which it wasstarting to develop the first performance stand-ards. There is a consensus among industry andconsumers that although an intermediate class ofdevices is advisable, it is impractical for FDAto formulate performance standards for themore than 1,000 device types now designated asClass II.
Other examples of how FDA has set prioritiesin implementing the Medical Device Amendmentscan be cited. In 1980, for example, FDA exempted30 Class I device types in the General Hospitaland Personal Use category from the requirementthat their manufacturers notify FDA before mar-keting them. The manufacturers of these devicetypes, which include medical absorbent fibers andspecimen containers not represented to be ster-ile, continue to be subject to FDA registration andsurveillance for conformity with good manufac-turing practices regarding manufacture, packing,and storage.
Substantial negative effects of the 1976 Medi-cal Device Amendments on the medical devicesindustry have not been documented to date. Per-haps this result is not surprising, because majorsections of the law have not been fully imple-mented. Patents on medical devices, one indicatorof innovative activity, have shown the sametrends as before the law, with a higher rate ofawards continuing for more sophisticated devices.Manufacturers have reported increases in R&D,sales, and new devices introduced since the Med-ical Device Amendments, and national data bearout these reports. One-third of the manufacturersresponding to a national survey in 1981 had enteredthe industry after the amendments, and 80 per-cent were optimistic about business in the fieldduring the next decade. Surprisingly, however,almost half of the survey respondents stated thatFederal regulation had been a major problem forthem.
The regulations have been more burdensometo small manufacturers than to large ones; smallermanufacturers reported higher regulatory costsper employee than larger ones. Small establish-ments are particularly important in the medicaldevices field: about 70 percent of all establish-ments have fewer than 20 employees, and thesesmall establishments have historically accountedfor substantial innovation. The law expressed par-ticular concern about small manufacturers by re-quiring that FDA establish an office to providethem information. Although large manufacturersin the 1981 survey were much more likely to con-sider producing a Class 111 device, it is noteworthy
25-406 0 - 84 - 2

10 ● Federal Policies and the Medical Devices Industry
that this situation existed before the amendmentsas well. Thus, regulation may intensify this pat-tern but did not originate it.
The amendments have posed the greatest prob-lem for small manufacturers of contact lenses. Be-cause some contact lenses were regulated as drugsbefore 1976, the newer types of lenses were auto-matically placed into Class III. Over the years,small manufacturers have found it difficult to en-ter the market because of the expense of gather-ing clinical evidence on safety and effectiveness.The public policy goals at odds in this case arepreserving the confidentiality of information frommanufacturers who have already received ap-proval to market their devices versus increasingthe availability of products, with price competi-tion as one result.
Available information does not permit anassessment of consumer protection under theMedical Device Amendments. Although the pri-mary goal of the amendments is to protect pub-lic health and safety, there exists no systematicinformation on the extent to which problems ofsafety and effectiveness are occurring. Withoutsuch information, one cannot assess the effect ofFDA’s choice of priorities in implementing thelaw. Information from FDA’s present voluntarysystem of reporting device hazards and from prod-uct recalls is inadequate, because it does not in-dicate the magnitude or frequency of device-related problems. Voluntary reports and recallsfor high risks have mostly involved implantabledevices, often with electrical problems, and car-diovascular devices. Since 1980, FDA has pro-posed several approaches to mandatory reportingby manufacturers and expects to issue a revisedproposal in 1984.
Congress has several options to improve FDA’sregulation of medical devices. Insofar as an overallregulatory approach is concerned, Congress couldcontinue the basic framework and intent of the1976 law and adjust specific provisions to reflectjudgments on the appropriate balance betweenmethods of ensuring safety and effectiveness andthe costs of these methods. An alternative strat-egy would be to revise the law to reflect the statusquo with regard to FDA’s implementation of the
law. A third approach would be to revise the lawto exclude certain device types from regulationon the basis of their potential risk.
To address the issue of what evidence of safetyand effectiveness should be required for preamend-ments Class 111 devices, Congress could continueFDA’s emphasis on high-priority device types,limit requirements for evidence of safety and ef-fectiveness to device types identified as problems,or encourage FDA to accept a greater range ofevidence. To address the issue of when the evi-dence should be required, Congress could allowFDA to continue its interpretation that the endof the grace period is the earliest date that FDAcan require evidence, or could establish the endof the grace period as the date when FDA mustcall for evidence. Other congressional options per-tain to possible revisions in the substantial equiv-alence method of market entry for postamend-ments devices.
There is widespread agreement that perform-ance standards cannot be developed in a timelyfashion for all of the devices types that have beenplaced in Class II. Congress could authorize FDAto use other methods, such as voluntary stand-ards or designation of prescription devices, to reg-ulate Class II devices. Other options include leg-islating an additional category of Class II deviceswith different requirements or reclassifying mostexisting Class II device types into other classes.
Information on risks associated with medicaldevices is crucial to assessing the 1976 law andits effectiveness in consumer protection. Congresscould require FDA to develop better systems formonitoring and providing information on devicerisks or encourage FDA to selectively apply post-marketing controls to regulate Class II devices.
To help manufacturers, especially small ones,through the regulatory process, Congress couldencourage FDA to use publicly available infor-mation to down-classify Class 111 devices as soonas possible. FDA might also act as a broker be-tween small firms with promising devices and clin-ical investigations capable of gathering data tosupport premarket approval for Class 111 devices.

Ch. 1—Introduction and Summary ● 1 1. — — — — . —--——- ——-
R&D Policies Related to Medical Devices
The present level of private R&D for medicaldevices appears to be generally adequate. If in-dustrial R&D in medical devices responds to mar-ket opportunities, as it does in other fields, thegreater demand for most medical devices becauseof health insurance would argue that medicaldevices R&D has been adequately stimulated.
From 1974 to 1980, R&D grew at an averageannual rate of about 16 percent in medical devicescompanies, as compared with a rate of about 12percent in industry as a whole. In 1980, com-pany-sponsored R&D as a percentage of sales wasgreater in medical devices than in industry as awhole (2.9 percent compared with 1.6 percent).The percentage of company-sponsored R&Ddevoted to basic research differed only slightly inmedical devices firms and in industry as a whole(3.7 percent compared with 4.1 percent).
Basic research has long been recognized as sub-ject to underfunding by private companies. As re-search becomes more targeted to development ofa commercializable device, however, the case forgovernmental involvement declines. Federal sup-port has been lower for R&D conducted in medi-cal devices companies than for industrial R&D asa whole. In 1980, the Federal Government fundedless than 3 percent of the R&D conducted by med-ical devices firms, compared with 29 percent ofthat conducted by industry as a whole.
Under a new Federal program, the Small Busi-ness Innovation Research (SBIR) program, NIHand other Federal agencies with sizable R&Dbudgets must set aside a small percentage for R&Dawards to small businesses. Although NIH fundsfor the SBIR program may come at least partlyfrom funds that would otherwise have gone tobasic research and nonprofit institutions, theredistributional implications of the program arenot yet clear. The program’s solicitation and selec-tion methods merit attention as the funds devotedto this effort increase.
The Orphan Drug Act of 1983 (Public Law 97-414) charges the Federal Government to identifyand promote orphan products, including bothdrugs and medical devices. Devices that are veryvaluable to potential users, especially in relation
to their cost, and that are so costly that it wouldbe unreasonable or inequitable to expect poten-tial users to pay a price sufficient to cover pro-duction costs, are by definition worthy of sup-port. However, it is difficult to distinguish betweensuch orphan devices and devices that lack a suf-ficient market because they are not worthwhile.
Neither the Orphan Drug Act nor regulationshave provided sound criteria for identifying or-phan devices. By spreading payment across manypeople, third-party payment may render previ-ous orphan devices and services affordable. Medi-care coverage of dialysis for end-stage renal dis-ease is an example. Expensive devices are usuallycovered by health insurance, and many of thosenot covered, including preventive and rehabil-itative devices, may have a large enough marketto permit sale at a sufficiently low price. But theproblem of orphan devices may grow as third par-ties develop increasingly restrictive paymentpolicies.
The Orphan Drug Act makes available to or-phan drugs certain benefits (e.g., grants and con-tracts for clinical testing) that are not availableto devices. It appears premature to extend thebenefits of the Orphan Drug Act to devices untilcriteria are developed to distinguish orphan de-vices from those that are not worth their costs.However, an option would be for Congress tomandate that the Department of Health and HumanServices develop criteria and methods for identi-fying orphan devices.
Regulation of the Providers ofMedical Devices
Federal regulation of the providers of medicaldevices applies mainly to facilities, such as hos-pitals, but affects physicians indirectly. Such reg-ulation has been undertaken to promote goodquality medical care, to control rising costs byevaluating technology adoption and use, and toensure access to care, including medical devices.
As a condition of receiving funds from Medi-care, hospitals have periodically had to review themedical necessity of admissions, extended stays,

72 ● Federal Policies and the Medical Devices Industry— . ———.
and professional services. The reviews performedby Professional Standards Review Organizations(PSROs) focused more on reducing overutiliza-tion of inpatient care and on containing costs thanon reducing underuse or improving overall qualityof care. The emphasis of PSRO review was con-sistent with the incentives of Medicare’s cost-basedreimbursement system, which encouraged admis-sions and days and use of technologies even ifthere were few benefits. The PSRO review pro-gram often led to reductions in admissions andlengths of stay, but when the costs of the programare taken into account, it is not clear that it savedMedicare costs.
Under Medicare’s new DRG hospital paymentsystem, hospitals continue to have financial in-centives to increase admissions, but they also haveincentives to reduce lengths of stay and technol-ogy use for inpatients. In order to be paid byMedicare, participating hospitals are required tocontract by November 15, 1984, with utilizationand quality control peer review organizations(PROS), which will monitor hospital admissions,lengths of stay, and use of technologies. The focusof the PRO review program has changed fromthat of the PSRO program to reflect the incen-tives of the new payment system. Like PSROs,PROS will review hospital admissions for overuse.In addition, however, PROS must specificallymonitor cardiac pacemaker implantations andreimplantations for possible overuse. PROS willalso be more concerned than PSROs were withreviewing short lengths of stay and eventuallywith underuse of ancillary services.
Medical devices have been most directly regu-lated through provider regulation by the Statecertificate-of-need (CON) laws passed in responseto the National Health Planning and ResourcesDevelopment Act of 1974 (Public Law 93-641).These regulations sought to reduce expensiveduplication of technology and to ensure access tofacilities. By 1983, all States except one (Louisiana)had passed CON laws, but only 23 were in com-pliance with Federal requirements in 1984. Becauseof uncertainty about the future of the Federalhealth planning program, the current continuingresolution stipulates that noncomplying States arenot to be penalized.
Photo credit: U.S. Veterans Administration
The VA Prosthetics Center was involved in developingmost of the prosthetic limbs and fitting techniques
used today.
Institutions such as hospitals, nursing homes,kidney disease treatment centers, and ambulatorysurgical centers are required to obtain a CONfrom a State or State planning agency for capitalexpenditures that exceed a minimum threshold,substantially change bed capacity, or substantiallychange services. Medical research institutions andhealth maintenance organizations (HMOs) aregiven special consideration. Although State lawsmay cover investments in other locations, onlynine States cover equipment purchases for phy-sicians’ offices. Few devices have been expensiveenough to meet the threshold for CON review,which is now $600,000 for capital expenditures,$250,000 for annual operating costs from a changein services, and $400,000 for major medical equip-ment. Under the higher limits that have been pro-posed, fewer devices would come under review.

Ch. 1—introduction and Summary ● 1 3—
Evidence on the effect of CON laws on theadoption of medical devices has been inconclu-sive. Early studies indicated that numbers of hos-pital beds fell, but investment and assets per bed,which relate to devices, rose. This result is con-sistent with the CON emphasis on bed supply andthe high thresholds for review. There is no indica-tion that CON has controlled medical costs. Thisfinding is not surprising, because a CON agencyhas no limit on the annual capital expendituresthat it may approve and does not consider oper-ating costs, total costs, or use of devices and othertechnologies. The program was also charged withoften-conflicting goals of controlling cost andassuring access, and relied on consensus amongdecisionmakers with different interests. It is pos-sible, however, that CON procedures may havedeterred applications and purchases.
The different incentives for hospitals underDRG payment have implications for CON laws.Some of the change depends on how capital ex-penses are handled under the DRG system. UnderDRG payment, hospitals themselves may increas-ingly have financial incentives to adopt cost-reducing devices and to examine carefully cost-raising ones. And DRG payment has strengthenedthe incentive for providers to locate and use equip-ment and facilities outside of the more constrainedinpatient setting in such sites as ambulatory diag-nostic centers or physician offices.
Several approaches could be taken to deal withthe shortcomings of the CON process. Congresscould expand the scope of CON regulation tocover purchases of equipment in all locations, orit could place a limit on the annual level of capi-tal expenditures that CON agencies could ap-prove. Alternatively, Congress could eliminate theCON requirement from the National Health Plan-ning Act.
Veterans Administration PoliciesRegarding Medical Devices
With 172 medical centers, an annual budget ofabout $1.3 billion for equipment and supplies, andan R&D budget of almost $160 million, the VAhas the potential to exert substantial influence in
the market for medical devices, especially the mar-ket for rehabilitative devices.
Rehabilitation R&D in the VA is intended toimprove the quality of life and to further the in-dependence of physically disabled veterans. Theprogram has stressed developing practical devicesand increasing the availability of new devices onthe market, especially in prosthetics, sensory aids,and devices related to spinal cord injuries. In thepast, the VA Prosthetics Center was involved indeveloping most of the prosthetic limbs and fit-ting techniques used today and in demonstratinguses of electric wheelchairs, which were thenadopted by manufacturers. In recent years, fund-ing has shifted toward intramural projects, suchas rehabilitation R&D centers, which are affiliatedwith leading engineering schools. Adjusted for in-flation, VA funds committed to R&D in rehabil-itative devices have been stable or declining.
Responsibility for testing and evaluating med-ical devices is divided among several VA organiza-tional units. Despite the opportunity that the VAsystem presents to test devices under actual con-ditions of use, problems of coordination amongunits and of adherence to evaluation protocolshave hampered field testing of rehabilitative de-vices at VA medical centers.
The Testing and Evaluation Staff in Hines, IL,is responsible for testing nonrehabilitative devices,mainly standard stock items and smaller medicalequipment. These evaluations, which are aimedat validating manufacturers’ claims, consist mainlyof consumer research efforts. Although VA reg-ulations prohibit explicit comparison of differentproducts, some evaluations of classes of deviceshave been attempted. These evaluations are usedby purchasers of devices inside and outside of theVA system.
Through the VA Marketing Center in Hines,which manages and negotiates the VA’s nationalpurchasing contracts, the VA has a substantialposition in the markets for medical equipment andsupplies. Procurement by the VA Marketing Cen-ter has accounted for 5 to 10 percent of the na-tional sales of X-ray, nuclear diagnostic, hemo-dialysis, and patient monitoring equipment. Andthe VA has enhanced its market leverage by con-
14 ● Federal Policies and the Medical Devices Industry
tracting for the U.S. Public Health Service, theDepartment of Defense, and other Governmentagencies. The VA’s market power has allowed theVA to obtain favorable prices on medical suppliesthrough its centralized procurement channels.
VA medical centers purchase about 34 percentof their supplies through centralized procurementprograms run by the VA or the General ServicesAdministration. However, the medical centershave increasingly made purchases on the openmarket rather than through central supply chan-nels, their open market purchases having risenfrom 10 percent of total purchases in the early1960s to 39 percent in 1982. The VA medicalcenters’ reduced use of central purchasing preventsthe VA from taking advantage of lower pricesavailable through greater device standardizationand volume purchases.
The patterns of adoption and use of devices bythe VA health system are conflicting. Some typesof major medical equipment, such as CT scanners,may have been adopted by the VA less than war-ranted because of political pressures to containcosts. On the other hand, by statute, the provi-sion of prosthetic devices to eligible veterans isunlimited. The VA’s plan to set the budgets ofmedical centers on the basis of DRGs may dis-tribute funds more rationally. This DRG systembears monitoring as it is implemented for issuesof quality assurance and treatment of capital ex-penses.
Congressional options to improve VA policiestowards medical devices could focus on specificareas, such as increasing research for longer termdevelopment of rehabilitative devices and expand-ing field testing of rehabilitative devices. Congresscould also require the VA to move in the direc-tion of undertaking more comparative evaluationsof devices and increasing centralized procurementto take advantage of lower prices.
Conclusions
Since the purpose of the Medical Device Amend-ments of 1976 is to protect public health and
safety, assessment of the law and potential changesin the act or its implementation cannot proceedwithout systematic information on the hazardsassociated with device use. Such information isnow lacking. Available evidence indicates that themedical devices industry has not been system-atically affected by regulation of marketing byFDA, insofar as companies have continued to beprofitable and innovative and to enter the field.However, small manufacturers of contact lenseshave had particular problems.
The medical devices industry has responded toincentives in the market, especially those frompayment policies. As a result, the market has gen-erally rewarded attention to technological sophis-tication but not to price or cost-consciousness andhas fostered the development of devices used inacute care rather than in prevention and rehabil-itation. Medicare’s new method of paying hospi-tals on the basis of DRGs has the potential forcost containment and efficiency by providing in-centives for providers, and hence manufacturers,to become more cost conscious.
At the same time, Medicare’s DRG paymentsystem raises important concerns: assurance ofquality of care when providers have a financialincentive to minimize the use of technologies in-cluding devices, and possible inefficiencies if de-vices are purchased and used in locations lessfinancially constrained than hospitals. The appro-priate role of the CON program is tied to howcapital expenses are handled under the DRG pay-ment system. In any case, issues of access todevices for low-income and sparsely populatedareas will remain. And as health insurance cov-erage and payment become more constrained, theconcept of orphan devices may require moreprecise definition. The VA has the potential to useits leverage in the market, especially for rehabil-itative devices, to channel development and com-mercialization into orphan devices with substan-tial social need and worth.

2.Characteristics of the
Medical Devices Industry
An initial invention, however dramatic, needs many refinements before itis of widespread use. In the commercialisation of technology, the tortoiseswho carry out these refinements often beat the hares.
—The Economist
Contents
PageIntroduction . . . . . . . . . . . . . . . . . . . . . . . . . . . . . . . . . . . . . . . . . . . . . . . . . . . . . . . . . . 17Growth in the Medical Devices Industry . . . . . . . . . . . . . . . . . . . . . . . . . . . . . . . . . 17Diversity in Products.. . . . . . . . . . . . . . . . . . . . . . . . . . . . . . . . . . . . . . . . . . . . . . 22Characteristics of Medical Devices Manufacturers. . . . . . . . . . . . . . . . . . . . . . . . 25Concentration in the Medical Devices Industry . . . . . . . . . . . . . . . . . . . . . . . . . . . 28Innovation in Medical Devices .............. . . . . . . . . . . . . . . . . . . . . . . . . . . . 31International Competitiveness of U.S. Medical Devices . . . . . . . . . . . . . . . . . . . . 35Conclusions . . . . . . . . . . . . . . . . . . . . . . . . . . . . . . . . . . . . . . . . . . . . . . . . . . . . . . . . . . . 37
LIST OF TABLESTable No. Page
1. Current Dollar Value of Shipments of Medical Devices by SIC Code,Selected Years 1958-83 . . . . . . . . . . . . . . . . . . . . . . . . . . . . . . . . . . . . . . . . . . . . . . . 18
2. Real (1972) Dollar Value of Shipments of Medical Devicesby SIC Code, Selected Years 1958-83 . . . . . . . . . . . . . . . . . . . . . . . . . . . . . . . . 19
3. Growth in Medical Device Companies, Establishments, and Employmentby SIC Code, Selected Years 1963-82 . . . . . . . . . . . . . . . . . . . . . . . . . . . . . . 20
4. Number of Employees in the Medical Devices Industryby SIC Code, Selected Years 1958-83 . . . . . . . . . . . . . . . . . . . . . . . . . . . . . . . . 21
5. Percent Return on Assets for Medical Devices and Selected Industriesby IRS Category, Selected Years 1963-80. . . . . . . . . . . . . . . . . . . . . . . . . . . . . . 22
6. Growth in the Output and Employment of Selected Industries, 1963-82 .,.. 227. Products in the Medical Devices Industry by SIC Code . . . . . . . . . . . . . . . . . . 238. Sales of Selected Medical Devices to Hospitals by SIC Code, 1982 . . . . . . . . 259. Medical Devices in an Internist’s Office . . . . . . . . . . . . . . . . . . . . . . . . . . . . . . 26
10. Size of Employment in Medical Devices Establishmentsby SIC Code, 1977 . . . . . . . . . . . . . . . . . . . . . . . . . . . . . . . . . . . . . . . . . . . . . . . . 27
11. Market Share of Value of Medical Devices Shipmentsby Establishment Size, 1977, 1972, and 1963.. . . . . . . . . . . . . . . . . . . . . . . . . 27
12. Price-Cost Margins of Medical Devices Establishmentsby Employee Size, 1977 . . . . . . . . . . . . . . . . . . . . . . . . . . . . . . . . . . . . . . . . . . . . 28
13. Market Share of Value of Medical Devices Shipmentsby Leading Companies, 1977 and 1963.... . . . . . . . . . . . . . . . . . . . . . . . . . . . . 29
14, Leading Companies’ Market Share of Hospital Salesof Medical Devices, 1982 . . . . . . . . . . . . . . . . . . . . . . . . . . . . . . . . . . . . . . . . . . . . 30
15. Eight Leading Companies in Hospital Sales of Medical Devices in Threeor More Product Categories, 1982 . . . . . . . . . . . . . . . . . . . . . . . . . . . . . . . . . . . . 30
16. U.S. and Foreign Medical Devices Patents Granted by U.S. Patent Officeby Application Date, 1968-79 . . . . . . . . . . . . . . . . . . . . . . . . . . . . . . . . . . . . . . . 34
17. U.S. and Foreign Medical Devices Patents Granted by U.S. Patent Officeby Source and Selected Categories, 1968-79. . . . . . . . . . . . . . . . . . . . . . . . . . . . 35
18. U.S. Exports and Imports of Medical Devices by SIC Code, 1979-83. . . . . . . 36

2.Characteristics of the
Medical Devices Industry
INTRODUCTIONIn recent decades, the industry that manufac-
tures medical devices has experienced continuousgrowth and change. As increased health insurancecoverage has expanded purchasing power formedical care, the market for medical devices hasgrown correspondingly. Growth has occurred notonly in the number of companies and employeesworking in the field, but also in the range of prod-ucts developed and marketed. Throughout all fac-ets of medical care—from diagnostic imaging andsurgery to dentistry and optometry-devices un-known a generation or even a decade ago are nowpart of routine practice.
This chapter presents the most notable featuresof the medical devices industry. Besides the dy -
namic nature of the field, several themes emerge.One is great diversity, both in the medical devicesthat are marketed and in the companies that makethem. Underlying the diversity in products is thehigh level of innovation. Another theme is that,more than in many other U.S. industries, smallfirms are particularly important in developing andproducing medical devices. U.S. medical devicesappear to be quite competitive internationally.Despite the diversity in companies and products,however, the concentration of production in med-ical devices is about the same as it is in a typicalindustry, i.e., a relatively small number of com-panies account for a sizable share of the market.
GROWTH IN THE MEDICAL DEVICES INDUSTRYDuring the past 25 years, sales (value of ship-
ments) of products in the five Standard IndustrialClassification (SIC) codes representing medicaldevices have grown from less than $1 billion tomore than $17 billion, an annual increase of morethan 12 percent (table 1). The growth has beenenormous, even when expressed in real dollars,which are intended to take account of price changesl
(table 2). By 1982, sales in real dollars had reachedsix times the 1958 level, having risen at an aver-age annual rate of 8 percent.
Growth in sales appears to have acceleratedafter 1963, a period which coincided with the earlyyears after implementation of the Medicare and
1Like most price indexes, those of the Department of Commercemeasure annual price changes in a market basket of devices thatwere specified in 1972 (369). A common problem with such indexesis their inability to take into account price changes associated withthe introduction of new products and with changes in productquality. This problem is particularly acute for medical devices, whichhave experienced constant and dramatic change.
Medicaid programs in 1966. From 1966 to 1982,total U.S. expenditures on personal health carein real dollars grew at an average annual rate of5 percent, and those of the Medicare programalone at 18.5 percent.
Although the start of Medicare and Medicaidwas the most notable change, both private andpublic third parties have accounted for an increas-ing share of the growing expenditures on personalhealth care—from 35 percent in 1950 (12 percentprivate, 12 percent State and local, 10 percent Fed-eral) to 51 percent in 1966 (25 percent private, 12percent State and local, 13 percent Federal) and69 percent in 1982 (28 percent private, 11 percentState and local, 29 percent Federal) (128). Al-though the exact relationship has not been doc-umented, growth in health care expenditures ex-panded the market for products such as medicaldevices that are used in the course of deliveringthat care (see ch. 3).
17

Table I.—Current Dollar Value of Shipments of Medical Devices by SIC Code, Selected Years 1958-83a
Current dollar value of shipments (in millions) Annual percentage changeb
X-ray and Surgical Surgical Dentalelectro- and appliances equipment X-ray and Surgical Surgical Dentalmedical medical and and Ophthalmic electro- and appliances equipment
equipment instruments supplies supplies goods medical medical and and OphthalmicYear (Sic 3693) (Sic 3841) (Sic 3842) (Sic 3843) (SIC 3851) Total equipment instruments supplies supplies goods Total
1983 c . . . . $5,500 $4,590 $6,140 $1,180 N Ad
$17,410e 21% 12% 90/0 70/ 0 — 13%e
1982 . . . . . 4,557 4,114 5,642 1,107 $1,358 16,778 42 30 19 -16 8 231981 . . . . . 3,203 3,158 4,734 1,314 1,263 13,672 27 17 23 5 4 181980 . . . . . 2,527 2,697 3,861 1,252 1,212 11,549 10 14 14 17 8 131977 . . . . . 1,885 1,833 2,597 787 972 8,074 34 14 12 14 11 161972 ..., . 444 962 1,454 409 568 3,8371967 . . . . .
14 15 12 13 6 12233 475 838 221 426 2,193 13 14 9 11 12 11
1 9 6 3 . . 144 284 597 148 273 1,446 9 17 5 5 7 81958 . . . . . 95 130 462 116 194 997 – — — — — —
aFor a Iwtlng of products In the Standard industrial Classification (SIC) codes used, see table 7‘For Inconsecutwe years, the compound annual growth rate, the annual rate of growth that makes the present value compound forward to equal a speclfled future value, was calculated.
‘AA = [( FVIPV)l IN – 1] 100, where O/OA = compound annual growth rateFV = future value (the value at the end of N compounding periods)PV = present valueN = total number of compounding periods
cPreliminary estimates.dNA Indicates information not available.‘Total does not include shipments of ophthalmic goods.
SOURCES: U.S. Department of Commerce, Bureau of Industrial Economics, Capital, Energy, and Productivity Studies Division, Washington, DC, unpublished data, January 1984; P. Marcus, U.S. Department of Commerce,Washin ton, DC, personal communication, Janua
8~ 1984; U.S. De partment of Commerce, Bureau of the Census, 7982 Census of kfamfacwres, Preliminary Report Industry Series, MC82-I-38F-3(P),
MC82-I- 8B-l(P), MC82-I-38B-2(P), MC82-I-38B-3(P), M 82-I-38 B-4(P), 1984; and E. Arakaki, U.S. Department of Commerce, Washington, DC, personal communication, August 1984.

Table 2.–Real (1972) Dollar Value of Shipments of Medical Devices by SIC Codea, Selected Years 1958=83
Real (1972) dollar value of shipments (in millions) Annual percentage changeb
X-ray and Surgical Surgical Dentalelectro- and appliances equipment X-ray and Surgical Surgical Dentalmedical medical and and Ophthalmic electro- and appliances equipment
equipment instruments supplies supplies goods medical medical and and OphthalmicYear (SIC 3693) (sic 3841) (Sic 3842) (Sic 3843) (SIC 3851) Total equipment instruments supplies supplies goods Total
1983C . . . . $2,145 $2,050 $2,975 $540 N Ad
$7,710’ 150% 70% 70% 20% 9%e
1982 . . . . . 1,858 1,915 2,790 528 $757 7,848 35 21 19 -20 8 181981 . . . . . 1,374 1,587 2,337 659 704 6,661 14 6 16 -4 -4 91980 . . . . . 1,210 1,494 2,007 685 735 6,131 -1.7 5 7 7 1 41977 . . . . . 1,274 1,273 1,649 564 707 5,467 23 6 3 7 4 71972 . . . . . 444 962 1,454 409 568 3,837 11 10 12 3 91967 . . . . . 311 568 920 234 479 2,512 9 11 7 10 11 91963. 217 377 705 160 312 1,771 8 15 5 4 6 71958 . . . . . 150 184 549 130 231 1,244 — — — — — —aFor a listing of products in the SIC categories used, see table 7“For inconsecutive years the compound annual growth rate, the annua! rate of growth that makes the present value compound forward to equal a specified future value. was calculated
0/0 J = [( FVIPV)l ‘N – 1 ] 100 where O/OA = compound annual growth rateFV = future value (the value at the end of N compounding periods)PV = present value
N = total number of compounding periods
cPreiiminary estimates.dNA indicates information not available.‘Total does not include shipments of ophthalmic goods.
SOURCES: U.S Department of Commerce, Bureau of Industrial Economics, Capital, Energy, and Productivity Studies Division, Washin ton, DC, unpublished data, January 1984; P. Marcus, U.S. Department of Commerce,Washington, DC, personal communication, January 1%34; M. Pavliscak, U.S. Department of Commerce, Washington, DC, persona communication, June 19S4; and E. Arakakl, U.S. Department of Commerce, Washington,fDC, personal communication, August 19S4.

20 ● Federal Policies and the Medical Devices Industry
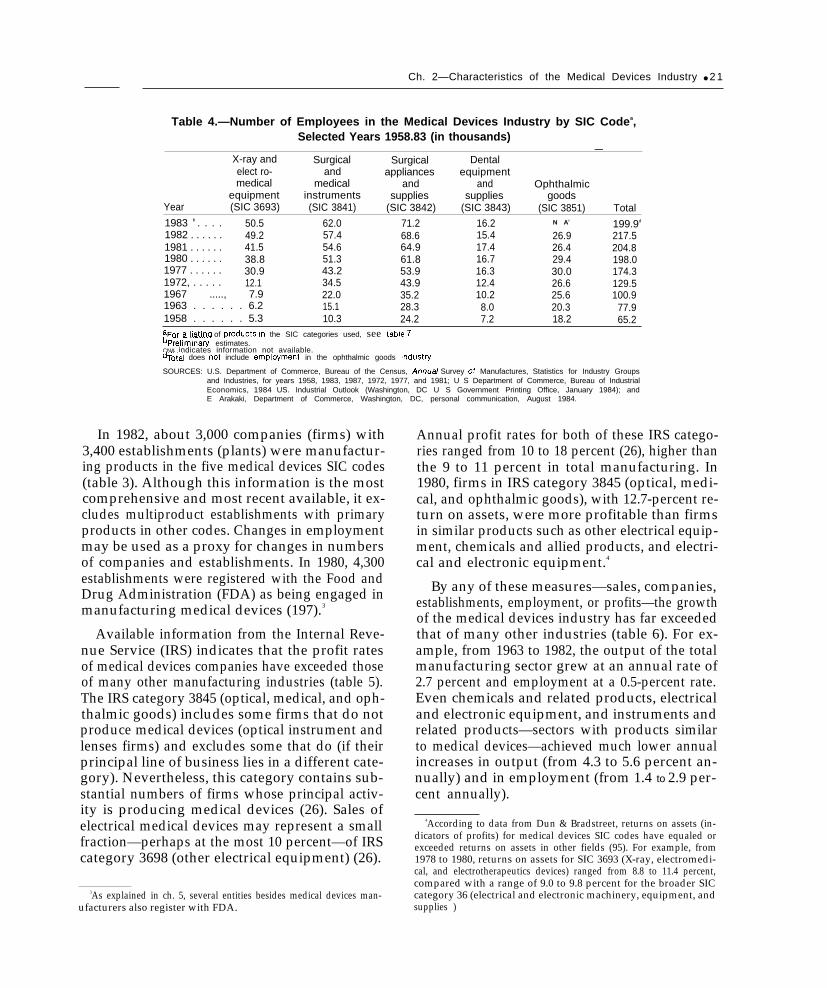
All segments of the medical devices industryhave benefited from this growth, some more thanothers (tables 1 and 2). Most medical devices fallinto one of five SIC codes of the Department ofCommerce: 3693, X-ray, electromedical, andelectrotherapeutics equipment; 3841, surgical andmedical instruments; 3842, orthopedic, prosthetic,and surgical appliances and supplies; 3843, den-tal equipment and supplies; and 3851, ophthal-mic goods.2
2The most comprehensive statistics on the medical devices industrycome from the Census of Manufactures, which is conducted by theBureau of the Census in the Department of Commerce. The datarelate to domestic production by U.S. and foreign companies oper-ating in the United States. A complete census is conducted every
5 years and an Annual Survey of a sample in intervening years. Prod-ucts are categorized by Standard Industrial Classification (SIC) codes.Establishments are assigned to SIC “industries” on the basis of theirprimary line of business. A 1980 sample of 1,891 manufacturingestablishments registered with the Bureau of Medical Devices in theFood and Drug Administration (FDA) fell into 162 SIC codes: 47percent into the 5 major medical devices codes, which included anaverage of 177 establishments per code; 37 percent into 25 otherSIC codes, each with 10 or more establishments; and 16 percent into132 other SIC codes, each with fewer than 10 establishments (393).It can therefore be inferred that the establishments in the five medi-cal devices codes account for a greater volume of medical devicesproduction than those in other codes. Nevertheless, data by estab-lishment from the five medical devices SIC codes exclude someestablishments and perhaps some devices of multiproduct establish-ments whose primary products fall into other categories.
In addition, the FDA sample lists 47 establishments in SIC 2831,biological (393). Diagnostic substances and other biological rep-resent about 45 percent of all shipments in SIC 2831 (363), but thedata are not sufficiently detailed to permit separation of these med-ical devices products from other biologics, such as blood andvaccines.
SIC data on product shipments, however, include shipments ofall medical devices, both those produced by establishments classifiedin the five medical devices codes and those classified in other codes(393).
In both current and real dollars, sales of prod-ucts in SIC codes 3693, 3841, and 3842 are muchgreater than sales of dental equipment and sup-plies and ophthalmic goods. Not only are salesin these three codes the largest in absolute terms,but they have also experienced the highest ratesof increase, especially since 1980. SIC 3842 (sur-gical appliances and supplies), the category withthe greatest sales, has had the highest growthrates, followed closely by SIC 3693 (X-ray, elec-tromedical, and electrotherapeutics equipment).The tremendous growth in SIC 3693 from 1972to 1977 may be somewhat overstated; in 1977,products misclassified in other SIC codes, mainly3841, were assigned to 3693 (393).
Increases in the number of companies (firms)and establishments (plants) have paralleled the in-creases in sales (see table 3). From 1963 to 1982,SIC 3693 (X-ray and electromedical equipment),with annual rates of about 7 and 8 percent respec-tively, experienced the greatest rate of increase incompanies and establishments. During this period,the other four SIC codes had annual increasesranging from about 2 to 6 percent. In all five med-ical devices codes, firms entering a field have thusexceeded those exiting.
By 1982, employment in the establishments inthe SIC medical devices codes had exceeded200,000, a 68-percent increase over the 129,500employed in 1972 (see table 4). SIC 3693 (X-rayand electromedical equipment) again had thegreatest rates of increase, reflecting the hugegrowth in production and facilities during thedecade.
Table 3.–Growth in Medical Device Companies, Establishments, and Employment by SIC Codea, 1963-82
1982 levels (number) 1963-1982 compound annual growth rate
EmploymentSIC industry segment Companies Establishments (thousands) Companies Establishments Employment
Total . . . . . . . . . . . . . . . . . . . . . . 2,986 3,361 217.5 4.4% 4.0% 5.6%SIC 3693: X-ray and
electromedicalequipment . . . . . . . . . . . . . . . 205 260 49.2 7.1 8.2 11.5
SIC 3841: Surgical andmedical instruments . . . . . . 767 858 57.4 5.9 5.8 7.3
SIC 3842: Surgical appliancesand supplies . . . . . . . . . . . . . 1,212 1,365 68.6 4.5 3.5 4.8
SIC 3843: Dental equipmentand supplies . . . . . . . . . . . . . 435 474 15.4 2.6 2.2 3.5
SIC 3851: Ophthalmicgoods . . . . . . . . . . . . . . . . . . . 367 404 26.9 3.0 3.0 1.5
at=or a listing of products in the SIC categories used, see table 7.
SOURCES: U.S. Department of Commerce, Bureau of the Census, 1$%3 Census of Manufactures, Industry Series, MC63-I-36E and MC634-38A, 7982 Census of Marrufac-tures, Preliminary Report Industry Series (Washington, DC: U.S. Government Printing Office, 1966 and 1984).
Ch. 2—Characteristics of the Medical Devices Industry ● 2 1
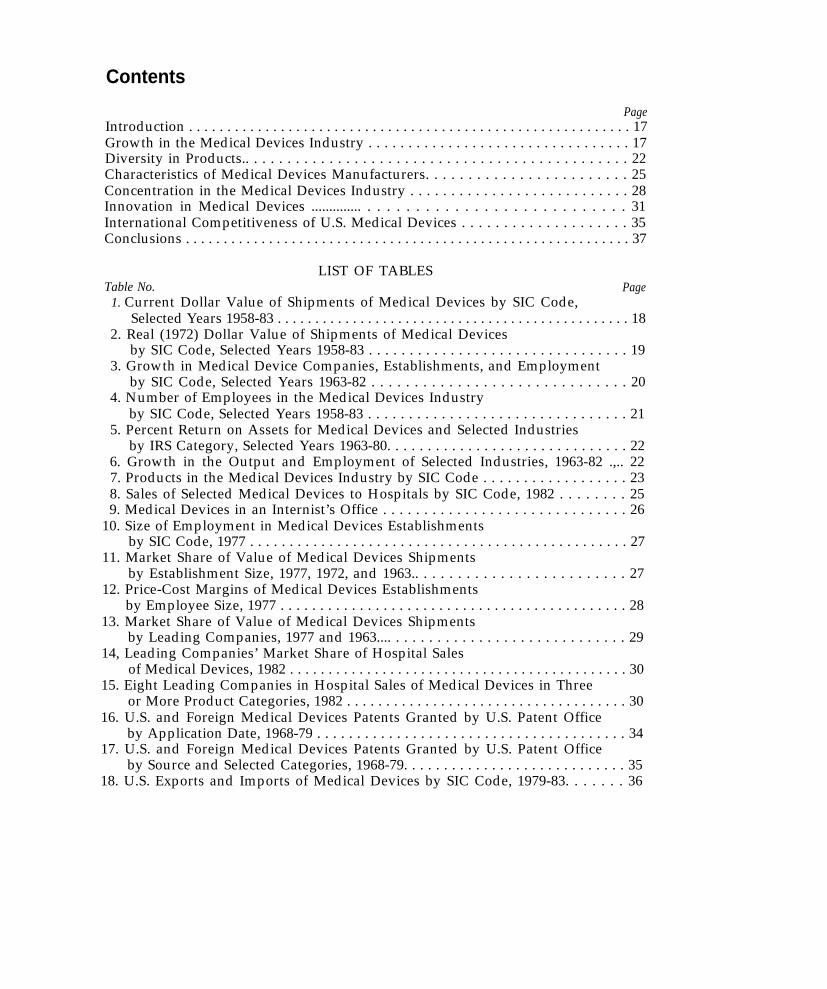
Table 4.—Number of Employees in the Medical Devices Industry by SIC Codea,Selected Years 1958.83 (in thousands)
X-ray and Surgical—
Surgical Dentalelect ro- and appliances equipmentmedical medical and and Ophthalmic
equipment instruments supplies supplies goodsYear (SIC 3693) (SIC 3841) (SIC 3842) (SIC 3843) (SIC 3851) Total1983 b . . . . 50.5 62.0 71.2 16.2 N Ac 199.9d
1982 . . . . . . 49.2 57.4 68.6 15.4 26.9 217.51981 . . . . . . 41.5 54.6 64.9 17.4 26.4 204.81980 . . . . . . 38.8 51.3 61.8 16.7 29.4 198.01977 . . . . . . 30.9 43.2 53.9 16.3 30.0 174.31972, . . . . . 12.1 34.5 43.9 12.4 26.6 129.51967 ....., 7.9 22.0 35.2 10.2 25.6 100.91963 . . . . . . 6.2 15.1 28.3 8.0 20.3 77.91958 . . . . . . 5.3 10.3 24.2 7.2 18.2 65.2aFor a listing of proctucts In the SIC categories used, see table 7bPreliminary estimates.CNA indicates information not available.dTotal does not include employment in the ophthalmic goods Industry.
SOURCES: U.S. Department of Commerce, Bureau of the Census, Annual Survey of Manufactures, Statistics for Industry Groupsand Industries, for years 1958, 1983, 1987, 1972, 1977, and 1981; U S Department of Commerce, Bureau of IndustrialEconomics, 1984 US. Industrial Outlook (Washington, DC U S Government Printing Office, January 1984); andE Arakaki, Department of Commerce, Washington, DC, personal communication, August 1984.
In 1982, about 3,000 companies (firms) with3,400 establishments (plants) were manufactur-ing products in the five medical devices SIC codes(table 3). Although this information is the mostcomprehensive and most recent available, it ex-cludes multiproduct establishments with primaryproducts in other codes. Changes in employmentmay be used as a proxy for changes in numbersof companies and establishments. In 1980, 4,300establishments were registered with the Food andDrug Administration (FDA) as being engaged inmanufacturing medical devices (197).3
Available information from the Internal Reve-nue Service (IRS) indicates that the profit ratesof medical devices companies have exceeded thoseof many other manufacturing industries (table 5).The IRS category 3845 (optical, medical, and oph-thalmic goods) includes some firms that do notproduce medical devices (optical instrument andlenses firms) and excludes some that do (if theirprincipal line of business lies in a different cate-gory). Nevertheless, this category contains sub-stantial numbers of firms whose principal activ-ity is producing medical devices (26). Sales ofelectrical medical devices may represent a smallfraction—perhaps at the most 10 percent—of IRScategory 3698 (other electrical equipment) (26).
3As explained in ch. 5, several entities besides medical devices man-ufacturers also register with FDA.
Annual profit rates for both of these IRS catego-ries ranged from 10 to 18 percent (26), higher thanthe 9 to 11 percent in total manufacturing. In1980, firms in IRS category 3845 (optical, medi-cal, and ophthalmic goods), with 12.7-percent re-turn on assets, were more profitable than firmsin similar products such as other electrical equip-ment, chemicals and allied products, and electri-cal and electronic equipment.4
By any of these measures—sales, companies,establishments, employment, or profits—the growthof the medical devices industry has far exceededthat of many other industries (table 6). For ex-ample, from 1963 to 1982, the output of the totalmanufacturing sector grew at an annual rate of2.7 percent and employment at a 0.5-percent rate.Even chemicals and related products, electricaland electronic equipment, and instruments andrelated products—sectors with products similarto medical devices—achieved much lower annualincreases in output (from 4.3 to 5.6 percent an-nually) and in employment (from 1.4 to 2.9 per-cent annually).
4According to data from Dun & Bradstreet, returns on assets (in-dicators of profits) for medical devices SIC codes have equaled orexceeded returns on assets in other fields (95). For example, from1978 to 1980, returns on assets for SIC 3693 (X-ray, electromedi-cal, and electrotherapeutics devices) ranged from 8.8 to 11.4 percent,compared with a range of 9.0 to 9.8 percent for the broader SICcategory 36 (electrical and electronic machinery, equipment, andsupplies )

22 . Federal Policies and the Medical Devices Industry— — . — . .
Table 5.—Percent Return on Assetsa for Medical Devicesand Selected Industries by IRS Category, Selected Years 1963-80
Optical, medical Other Chemicals Electricaland ophthalmic electrical Total and allied and electronic
goods b equipment manufacturing products equipmentYear (IRS 3845) (IRS 3698) (IRS 40) (IRS 17) (IRS 25)
1980 . . . . . . 12.70/o 11 .0%0 10.50/0 11.29’0 9.6%1977 . . . . . . 14.5 11.2 10.6 12.5 10.51972 . . . . . . 13.1 9.6 8.8 11.3 7.71967 . . . . . . 17.9 13.6 10.2 12.8 11.41963 . . . . . . 12.1 12.9 10.2 14,0 9.5
aPercent return on assets =Net income (less deficit) + interest paid
Total assetsNet income (less deficit) equals “total receipts less total deductions” less “Interest on State and local Government obligations”
Ius “constructive taxable income from related forei n corporations:’~he IRS minor industry 3845 (optical, medical and op%halmic goods) includes firms that would declassified in SICcategories383 0 tical instruments and lenses), 364 (surgical, medical, and dental instruments and supplies), and 365 (ophthalmic goods).
cThe\F&minorindustry 3698 (other electrical equipment) includes firms that would declassified in SICcategories 361 (electrictransmission and distribution equipment), 362 (electrical industrial apparatus), 364 (electric lighting and wiring equipment), and369 (miscellaneous electrical machinery, equipment, and supplies).
SOURCES: U.S. Department of the Treasury, Internal Revenue Service, Sourcebook of Statistics of hmorne, for years 1963, 1967,1972, 1977, and 19~; Corporation Income T= Returns, statistics of income, for years 1963, 1967, 1972, 1977, and 1960;A General Description of the Corporation Source Book, publication 647, revised June 1983.
Table 6.—Growth in the Output and Employment ofSelected Industries, 1963=82
1963-82 compoundannual growth rate
Industrial sector Output Employment
Total manufacturing . . . . . . 2.7% 0.5%Chemicals and
allied products . . . . . . . . 4.3 1.4Electrical and
electronic equipment . . . 5.6 1.5Instruments and
related products . . . . . . . 5.6 2.9
SOURCES: U.S. Department of Commerce, Bureau of Industrial Economics, 1984U.S. /ndustria/ Outlook (Washington, DC: U.S. Government PrintingOffice, January 1984); and V. Kettering, U.S. Department of Com-merce, Bureau of Industrial Economics, Washington, DC, personalcommunication, February 1984.
DIVERSITY IN PRODUCTSThe devices included in the five major SIC
codes illustrate the wide range of products, notonly across codes but within each code as well(table 7). SIC 3842 encompasses disposable sup-plies such as surgical drapes and adult diapers aswell as wheelchairs and prostheses. And togetherthe different codes include pacemakers, hospitalfurniture, and materials for dentures.
Table 8 presents 1982 sales of selected medicaldevices to U.S. hospitals. These data are nationalestimates that IMS America, Ltd., has compiled
The Department of Commerce has ranked sev-eral of the medical devices SIC codes in the top50 codes whose growth in 1984 is predicted to ex-ceed their 1972-81 peak: 3842, orthopedic, pros-thetic, and surgical appliances and supplies, as9th; 3693, X-ray, electromedical, and electrothera-peutic equipment, as 11th; 3841, surgical andmedical instruments, as 13th; 2831, biologicalproducts, as 24th; and 3843, dental equipment andsupplies, as 47th (369).
for OTA from the purchases of a sample of hos-pitals. Because the IMS data include only devicesthat are purchased frequently enough to permitstatistical estimation, many expensive devices thatare rarely purchased by individual hospitals, suchas computed tomography (CT) scanners, do notappear.
Almost half of personal health care expendi-tures in the United States relate to hospital care(128), and hospitals-use devices more intensivelythan other health care settings. Thus, the data intable 8 give some indication of the size of the mar-
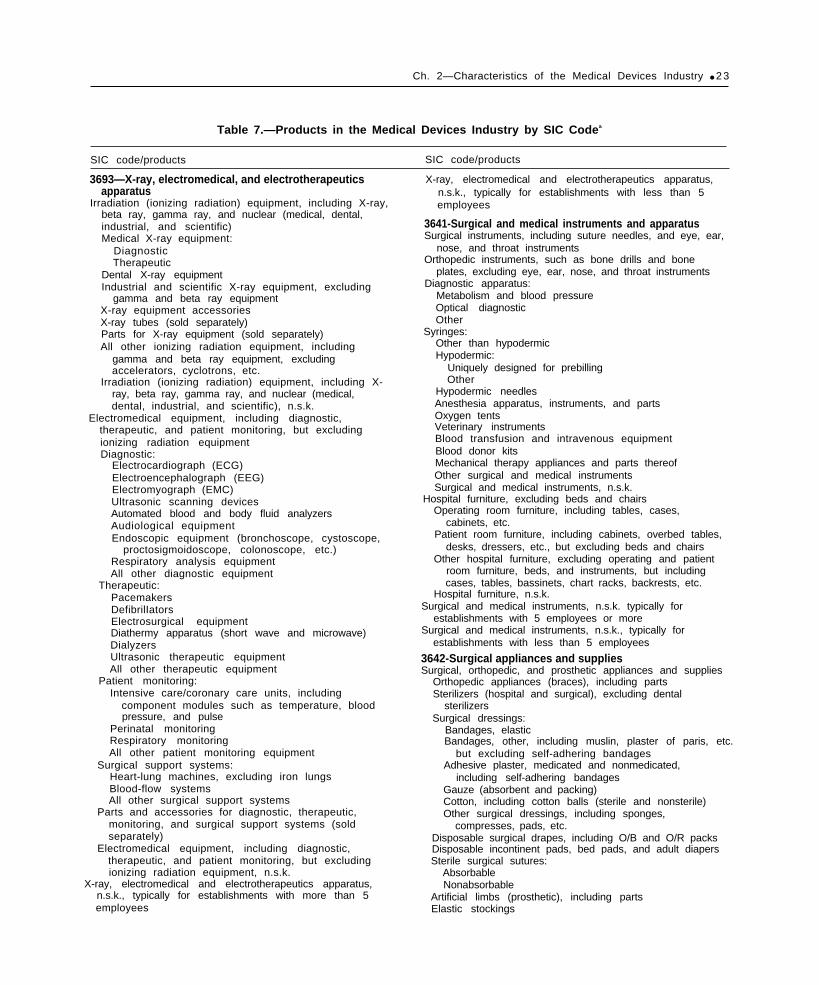
Ch. 2—Characteristics of the Medical Devices Industry ● 2 3
Table 7.—Products in the Medical Devices Industry by SIC Codea
SIC code/products SIC code/products
3693—X-ray, electromedical, and electrotherapeuticsapparatus
Irradiation (ionizing radiation) equipment, including X-ray,beta ray, gamma ray, and nuclear (medical, dental,industrial, and scientific)Medical X-ray equipment:
DiagnosticTherapeutic
Dental X-ray equipmentIndustrial and scientific X-ray equipment, excluding
gamma and beta ray equipmentX-ray equipment accessoriesX-ray tubes (sold separately)Parts for X-ray equipment (sold separately)All other ionizing radiation equipment, including
gamma and beta ray equipment, excludingaccelerators, cyclotrons, etc.
Irradiation (ionizing radiation) equipment, including X-ray, beta ray, gamma ray, and nuclear (medical,dental, industrial, and scientific), n.s.k.
Electromedical equipment, including diagnostic,therapeutic, and patient monitoring, but excludingionizing radiation equipmentDiagnostic:
Electrocardiograph (ECG)Electroencephalograph (EEG)Electromyograph (EMC)Ultrasonic scanning devicesAutomated blood and body fluid analyzersAudiological equipmentEndoscopic equipment (bronchoscope, cystoscope,
proctosigmoidoscope, colonoscope, etc.)Respiratory analysis equipmentAll other diagnostic equipment
Therapeutic:PacemakersDefibrilIatorsElectrosurgical equipmentDiathermy apparatus (short wave and microwave)DialyzersUltrasonic therapeutic equipmentAll other therapeutic equipment
Patient monitoring:Intensive care/coronary care units, including
component modules such as temperature, bloodpressure, and pulse
Perinatal monitoringRespiratory monitoringAll other patient monitoring equipment
Surgical support systems:Heart-lung machines, excluding iron lungsBlood-flow systemsAll other surgical support systems
Parts and accessories for diagnostic, therapeutic,monitoring, and surgical support systems (soldseparately)
Electromedical equipment, including diagnostic,therapeutic, and patient monitoring, but excludingionizing radiation equipment, n.s.k.
X-ray, electromedical and electrotherapeutics apparatus,n.s.k., typically for establishments with more than 5employees
X-ray, electromedical and electrotherapeutics apparatus,n.s.k., typically for establishments with less than 5employees
3641-Surgical and medical instruments and apparatusSurgical instruments, including suture needles, and eye, ear,
nose, and throat instrumentsOrthopedic instruments, such as bone drills and bone
plates, excluding eye, ear, nose, and throat instrumentsDiagnostic apparatus:
Metabolism and blood pressureOptical diagnosticOther
Syringes:Other than hypodermicHypodermic:
Uniquely designed for prebillingOther
Hypodermic needlesAnesthesia apparatus, instruments, and partsOxygen tentsVeterinary instrumentsBlood transfusion and intravenous equipmentBlood donor kitsMechanical therapy appliances and parts thereofOther surgical and medical instrumentsSurgical and medical instruments, n.s.k.
Hospital furniture, excluding beds and chairsOperating room furniture, including tables, cases,
cabinets, etc.Patient room furniture, including cabinets, overbed tables,
desks, dressers, etc., but excluding beds and chairsOther hospital furniture, excluding operating and patient
room furniture, beds, and instruments, but includingcases, tables, bassinets, chart racks, backrests, etc.
Hospital furniture, n.s.k.Surgical and medical instruments, n.s.k. typically for
establishments with 5 employees or moreSurgical and medical instruments, n.s.k., typically for
establishments with less than 5 employees
3642-Surgical appliances and suppliesSurgical, orthopedic, and prosthetic appliances and supplies
Orthopedic appliances (braces), including partsSterilizers (hospital and surgical), excluding dental
sterilizersSurgical dressings:
Bandages, elasticBandages, other, including muslin, plaster of paris, etc.
but excluding self-adhering bandagesAdhesive plaster, medicated and nonmedicated,
including self-adhering bandagesGauze (absorbent and packing)Cotton, including cotton balls (sterile and nonsterile)Other surgical dressings, including sponges,
compresses, pads, etc.Disposable surgical drapes, including O/B and O/R packsDisposable incontinent pads, bed pads, and adult diapersSterile surgical sutures:
AbsorbableNonabsorbable
Artificial limbs (prosthetic), including partsElastic stockings

24 • Federal Policies and the Medical Devices Industry
Table 7.—Products in the Medical Devices Industry by SIC Code—continued
SIC code/products SIC code/products
Elastic braces, suspensories, and other elastic supportsArch supports and other foot appliancesCorn remover pads, bunion pads, etc.Breathing devices, excluding anesthetic apparatus but
including incubators, respirators, resuscitators,inhalators, etc.
Surgical corsetsCrutches, canes, and other walking assistance devicesSplints and trussesWheel chairsOther surgical orthopedic, and prosthetic appliances and
suppliesSurgical, orthopedic, and prosthetic appliances and
supplies, n.s.k.Personal industrial safety devices
Respiratory protection equipment, including gas masks,abrasive masks, canister masks, etc.
Eye and face protection devices, including face shields,hoods, and welding helmets and masks, but excludingindustrial goggles and eye protectors
Protective clothing, except shoesFirst aid snake bite and burn kits, both household and
industrial typesOther personal safety devicesPersonal industrial safety devices, n.s.k.
Hearing aids, electronic:Hearing aids, electronic
Surgical appliances and supplies, n.s.k., typically forestablishments with 5 employees or more
Surgical appliances and supplies, n.s.k., typically forestablishments with less than 5 employees
3843-Dental equipment and suppliesDental metals:
PreciousNonprecious
Dental alloys for amalgamsTeeth, excluding dentures:
PorcelainOther, including resinous and plastic
Denture-base materialsDental chairsInstrument delivery systems (dental units)Dental hand piecesOther dental professional equipment, except X-rayDental laboratory equipment, including furnaces, casting
machines, lathes, benches, polishing units, flasks,blowpipes, presses, etc.
Dental hand instruments (forceps and pliers, brosches,cutting instruments, etc.)
Burs, diamond points, abrasive points, wheels, disks, andsimilar tools for use with hand pieces
Dental cements and other non-metallic filling materialsWaxes, dental gypsums, and other consumable suppliesOther dental products including sterilizers, but excluding X-
ray equipmentDental equipment and supplies, n.s.k., typically for
establishments with 5 employees or moreDental equipment and supplies, n.s.k., typically for
establishments with less than 5 employees
3851-Ophthalmic goodsOphthalmic fronts and temples
Fronts, finished (with or without decoration), and temples:Gold filled fronts (full rimmed, semirimless, or rimless)Aluminum and other base metal frontsPlastic frontsCombination fronts
Temples, all typesOphthalmic fronts and temples, n.s.k.
Glass ophthalmic focus lensesSingle vision lenses (ground and polished and moulded
blanks)Multifocal lenses:
BifocalsTrifocals and double segments
Glass ophthalmic focus lenses, n.s.k.Plastic ophthalmic focus lenses
Single vision lensesMultifocal lensesPlastic ophthalmic focus lenses, n.s.k.
Contact lensesConventional (hard)softContact lenses, n.s.k.
Other ophthalmic goods, n.e.c.Centers, oxfords, parts, trims, etc.Ophthalmic spectacles and eyeglasses (frames and
mountings of all types when sold with correctivelenses inserted, with or without decoration)
Industrial goggles, eye protectors, welding circles andplates, mountings, and parts
Sun or glare glasses and sungoggles, ready-madeNonfocus fashion tinted lenses, plastic and glassOther ophthalmic goods and accessories (sunglass
frames, single readers and magnifiers, holders,gas mask inserts, etc.)
All other ophthalmic goods, n.s.k.Ophthalmic goods, n.s.k., typically for establishments with 5
employees or moreOphthalmic goods, n.s.k., typically for establishments with
less than 5 employees
an,e,c,—Not elsewhere classified.n,s.k.—Not specified In kind.
SOURCE: U.S. Department of Commerce, Bureau of the Census, Annual Survey of Manufactures, Statistics for Industry Groups and Industries, 1977,

Ch. 2—Characteristics of the Medical Devices Industry • 25
Table 8.–Sales of Selected Medical Devices to Hospitals by SIC Code, 1982
Sales to Sales tohospitals hospitals(thousands (thousands
SIC code/product of dollars) SIC code/product of dollars)
X-ray and electromedical equipment(SIC 3693)X-ray supplies . . . . . . . . . . . . . . . . . . . . . . . .Radiological catheters and
guide wire. . . . . . . . . . . . . . . . . . . . . . . . . .Pacemakers and other
cardiovascular products. . . . . . . . . . . . . .Electrosurgical supplies . . . . . . . . . . . . . . .
Surgical and medical instruments (SIC 3841)Surgeons’ needles . . . . . . . . . . . . . . . . . . . .Blood collection supplies . . . . . . . . . . . . . .Thermometers . . . . . . . . . . . . . . . . . . . . . . . .Surgical instruments . . . . . . . . . . . . . . . . . .Syringes and needles . . . . . . . . . . . . . . . . .Catheters, tubes, and allied products . . . .Diagnostic instruments . . . . . . . . . . . . . . . .
Surgical appliances and supplies (SIC 3842)
Ostomy products ..........................................Surgical packs and parts . . . . . . . . . . . . . . .Maternity products . . . . . . . . . . . . . . . . . . . .Dialysis supplies . . . . . . . . . . . . . . . . . . . . . .Cardiopulmonary supplies. . . . . . . . . . . . . .Sponges . . . . . . . . . . . . . . . . . . . . . . . . . . . . .
$ 777,366
135,878
499,99948,552
4,31057,84531,426
294,284331,054235,44569,549
286,63513,842
174,12326,86997,67771,176
174,768
Bandages, dressings and elastic . . . . . . . .Orthopedic supplies . . . . . . . . . . . . . . . . . . .Parenteral supplies . . . . . . . . . . . . . . . . . . . .Urological products . . . . . . . . . . . . . . . . . . .Sterilizer supplies . . . . . . . . . . . . . . . . . . . . .Cast room supplies . . . . . . . . . . . . . . . . . . .Disposable kits and trays ... , . . . . . . . . . .Respiratory therapy. . . . . . . . . . . . . . . . . . . .Garments, textiles, and gloves . . . . . . . . . .
172,303302,283701,106198,97088,84639,836
258,317245,890592,254
Ophthalmic goods (SIC 3851)Ophthalmic-related products. . . . . . . . . . . . 83,649
OtherSolutions . . . . . . . . . . . . . . . . . . . . . . . . . . . .Medical supplies . . . . . . . . . . . . . . . . . . . . . .Chemicals and soaps . . . . . . . . . . . . . . . . . .Paper products . . . . . . . . . . . . . . . . . . . . . . .Gases . . . . . . . . . . . . . . . . . . . . . . . . . . . . . . .Underpads . . . . . . . . . . . . . . . . . . . . . . . . . . .Identification supplies . . . . . . . . . . . . . . . . .Elastic goods . . . . . . . . . . . . . . . . . . . . . . . . .Rubber goods . . . . . . . . . . . . . . . . . . . . . . . .
Total. . . . . . . . . . . . . . . . . . . . . . . . . . . . . . . .
872,985420,702153,946113,738109,93355,25931,51724,932
7,281$7,804,545
SOURCE: IMS America, Ltd. Rockville, MD, unpublished data, 1983.
ket for different devices. The highest sales to hos- Nondurable products are even more prominentpitals are of disposable or nondurable items, such among the medical devices in a physician’s office.as X-ray supplies and garments, textiles, and Table 9 lists the medical devices in an office ofgloves. For many of the devices with high sales two internists practicing in an urban setting. Al-volumes, hospitals account for only a portion of though the office contains basic medical furniturethe overall market. For example, parenteral sup- and equipment, most of the products predisposedplies (for feeding through the bloodstream rather of after one use.than the alimentary canal) are increasingly usedin home health care (see ch. 3) and X-ray suppliesare also purchased by independent diagnosticcenters and private offices.
CHARACTERISTICS OF MEDICAL DEVICES MANUFACTURERSAs indicated by table 3, the number of device are likely to have multiple plants. This pattern
companies is almost as large as the number of appears to be similiar to that in other industries.establishments, with an average of 1.13 establish- For industries in which the four leading firms ac-ments per company. This relationship implies that counted for between 40 and 64 percent of mar-the mode in the medical devices industry is a com- ket sales, a situation similar to that in the medi-pany with one plant, although larger companies cal devices industry, the four leaders in 1963
25-406 0 - 84 - 3

26 • Federal Policies and the Medical Devices Industry
Table 9.—Medical Devices in an Internist’s Office
Medical fixtures:(examining tables and other fixtures used for medical
purposes)Examination rooms (2)
2 exam tables with stirrups and storage drawers2 scales1 treatment cabinet (large)1 instrument cabinet (small)1 eyechart
Laboratory1 X-ray view box1 test tube rack1 sedimentation tube rack
Medical office supplies:1 hanging medical record cabinet (7 tiers)Manila chart foldersPrinted forms for chartsPrescription blanksColor-coded medical record stickers
Diagnostic supplies:Cover slidesUrinalysis plastic cupsWipes for urinalysis clean catchTable paperDrapesPaper tapeBili lab stix (dip-urinalysis)K-Y jellyPregnancy test kit (urinary chorionic gonadotrophins
(UCG)-Beta slide)Sedimentation tubes, cotton plugStains (Gran’s iodine-safranin, etc.)Throat culture plates (oxblood 5%0)Discs for throat cultures (Taxo A)UricultsHemoccult slides (single and triple)Electrocardiograph (EKG) -mounting paper, electro pads &
electrode creamSani vaginal specs size (S)Sani vaginal specs size (M)AnoscopesCards for tuberculosis test
SOURCE: R. Berenson, Washington, DC, personal communication, January 1984.
averaged 4.7 establishments per company and thenext four, 2.4 establishments per company; butthe remaining firms averaged only 1.08establishments per company (274).
In 1977, medical devices establishments aver-aged 54 employees, about the same as the 53employees per establishment for all manufactur-ing (362). Within the medical devices field, SIC3693 (X-ray and electromedical equipment) hadthe largest average size establishment with 127employees, and SIC 3843 (dental equipment) hadthe smallest with 30 employees (table 10).
Sclavotest purified protein derivative (PPD) tuberculosis testPatient gowns (cloth)Cloth tape measuresThermometersGonococcus culture platesBlood drawing tubesAlcohol wipesSterile swabsSwabsBaggiesCervi scrapesFixative spray for Pap slidesSlides (wet mount for Pap)Cardboard containers for Pap slidesCulturettesGloves (reed Tru-touch)Request slips for tests
Therapeutic supplies:GauzesSyringesPeroxideAlcoholBetadine scrubCidex 7 (long life)Drug samplesBandaids
Diagnostic equipment:Examination rooms (2)
2 wall model Baumanometer blood pressureinstruments (3 cuffs)
1 EKG machine2 Burton exam lamps2 otoscope/ophthalmoscope desk units
Laboratory1 centrifuge (provided on load by lab)1 microscope1 incubator
Therapeutic equipment:Instruments (minor surgical--i.e., scissors, scalpels,
tweezers, etc.)
Despite the growth that has occurred in medi-cal devices in recent years, there have not beenmajor increases in the average size of an estab-lishment. In fact, for all of the major medicaldevices SIC codes except X-ray and electromedi-cal equipment and dental equipment, averageemployee size fell from 1972 to 1977; for SIC 3693(X-ray and electromedical equipment), it rosefrom 116 to 127 employees per establishment, andfor SIC 3843 (dental equipment), it rose from 29to 30 employees per establishment (362). Fromthese statistics, one may infer that, with the pos-sible exception of X-ray and electromedical equip-
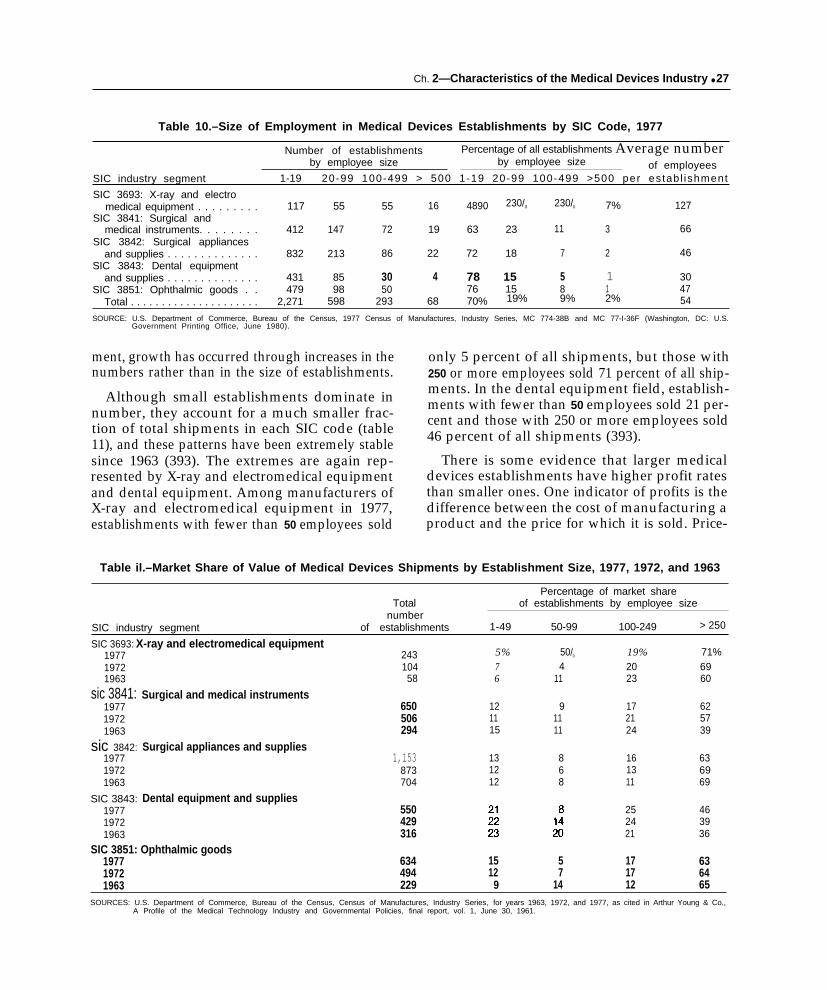
Ch. 2—Characteristics of the Medical Devices Industry ● 27
Table 10.–Size of Employment in Medical Devices Establishments by SIC Code, 1977
Number of establishments Percentage of all establishments Average numberby employee size by employee size of employees
SIC industry segment 1-19 20-99 100-499 > 500 1-19 20-99 100-499 >500 per estab l ishment
SIC 3693: X-ray and electromedical equipment . . . . . . . . . 117 55 55 16 4890 230/0 230/0 7% 127
SIC 3841: Surgical andmedical instruments. . . . . . . . 412 147 72 19 63 23 11 3 66
SIC 3842: Surgical appliancesand supplies . . . . . . . . . . . . . . 832 213 86 22 72 18 7 2 46
SIC 3843: Dental equipmentand supplies . . . . . . . . . . . . . . 431 85 30 4 78 15 5 1 30
SIC 3851: Ophthalmic goods . . 479 98 50 76 15 8 1 47Total . . . . . . . . . . . . . . . . . . . . . 2,271 598 293 68 70% 19% 9% 2% 54
SOURCE: U.S. Department of Commerce, Bureau of the Census, 1977 Census of Manufactures, Industry Series, MC 774-38B and MC 77-I-36F (Washington, DC: U.S.Government Printing Office, June 1980).
ment, growth has occurred through increases in thenumbers rather than in the size of establishments.
Although small establishments dominate innumber, they account for a much smaller frac-tion of total shipments in each SIC code (table11), and these patterns have been extremely stablesince 1963 (393). The extremes are again rep-resented by X-ray and electromedical equipmentand dental equipment. Among manufacturers ofX-ray and electromedical equipment in 1977,establishments with fewer than 50 employees sold
only 5 percent of all shipments, but those with250 or more employees sold 71 percent of all ship-ments. In the dental equipment field, establish-ments with fewer than 50 employees sold 21 per-cent and those with 250 or more employees sold46 percent of all shipments (393).
There is some evidence that larger medicaldevices establishments have higher profit ratesthan smaller ones. One indicator of profits is thedifference between the cost of manufacturing aproduct and the price for which it is sold. Price-
Table il.–Market Share of Value of Medical Devices Shipments by Establishment Size, 1977, 1972, and 1963
Percentage of market shareTotal of establishments by employee size
numberSIC industry segment of establishments 1-49 50-99 100-249 > 250
SIC 3693: X-ray and electromedical equipment197719721963
sic 3841:197719721963
sic 3842:197719721963
SIC 3843:197719721963
24310458
Surgical and medical instruments650506294
Surgical appliances and supplies1,153
873704
Dental equipment and supplies550429316
5%76
121115
131212
50/0
411
91111
868
19%2023
172124
161311
252421
71%6960
625739
636969
463936
SIC 3851: Ophthalmic goods1977 634 15 5 17 631972 494 12 7 17 641963 229 9 14 12 65
SOURCES: U.S. Department of Commerce, Bureau of the Census, Census of Manufactures, Industry Series, for years 1963, 1972, and 1977, as cited in Arthur Young & Co.,A Profile of the Medical Technology Industry and Governmental Policies, final report, vol. 1, June 30, 1961.

28 ● Federal Policies and the Medical Devices lndustry
cost margins have been calculated for medicaldevices establishments with data from the Censusof Manufactures (table 12). According to these1977 data, price-cost margins were highest for thelargest establishments. In only two of the fivecodes, however, did the smallest sized establish-ments have the lowest margins. A serious problemwith these figures is that they overstate profits be-cause they exclude costs such as research and de-velopment, advertising, and depreciation (18).
Small companies in the medical devices fieldhave a greater share of industry output than inmanufacturing generally (26). Companies withone establishment account for 21 percent of allsales of medical instruments and supplies and 31percent of optical and ophthalmic goods, but only16 percent of all manufacturing.5 Companies with
fewer than 250 employees account for 25 percentof all sales of medical instruments and suppliesand 32 percent of optical and ophthalmic goodsas compared with 18 percent of all manufacturing.
The role of small firms in medical instrumentsand supplies is comparable to that of those in elec-tronic components in terms of number of estab-lishments or total receipts. If firm size is definedby number of employees, small medical instru-ment and supply firms with fewer than 250 em-ployees account for a larger share of sales thanfirms of a similar size in the electronic componentsindustry.
‘These data are compiled on the basis of companies rather thanestablishments. The category optical and ophthalmic goods includesproducts such as telescopes and other optical equipment and henceis broader than medical devices (26).
Table 12.—Price-Cost Marginsa of Medical Devices Establishments by Employee Size, 1977
Margins of establishments by employee size
SIC industry segment Total 1-49 50-99 100-249 > 250
SIC 3693: X-ray and electromedicalequipment , . . . . . . . . . . . . . . . . . . . . . . . . . . . . . . . . . 0.406 0.374 0.275 0.398 0.422
SIC 3641: Surgical and medical instruments . . . . . . . . 0.394 0.326 0.360 0.368 0.420SIC 3842: Surgical appliances and supplies . . . . . . . . . 0.374 0.307 0.322 0.355 0.400SIC 3843: Dental equipment and supplies . . . . . . . . . . 0.325 0.283 0.360 0.274 0.366SIC 3851: Ophthalmic goods , . . . . . . . . . . . . . . . . . . . . 0.352 0.350 0.297 0.351 0.357aPrice-cost margins are calculated from Bureau of the Census data as follows:
P r i c e - c o s t m a r g i n = ‘atue a d d e d – ‘ayro’tValue of shipments
“Value added” is the value of shi ments minus materials, supplies, energy and certain other Input costs. It is defined by the Census on an establishment basis. Price-cost! ~~margins are just one measure o profltablllty; each different measure has advantages as well as disadvantages. Limitations of the price-cost margins are: 1) the mar ins
are overstated proxies of profitability since the Census does not provide directly comparable estimates of non-plant costs such as advertising, central office costs, F?&D,and plant depreciation, and 2) the margins are conceptually inadequate because they fail to account for the industry’s capital intensity.
SOURCE: U.S. Department of Commerce, Bureau of the Census, 1977 Census of Manufactures, /ndustry Series, as cited in Arthur Young & Co., A Profile of the MedicalTechnology /ndustry and Governrnenta/ Po/icies, final report, vol. 1, Washington, DC, June 30, 1981.
CONCENTRATION IN THE MEDICAL DEVICES INDUSTRY
The extent to which sales are concentrated to 45 percent of the sales in the medical devicesamong a few companies is a measure of the com- SIC codes (table 13). By comparison, in 43 per-petitiveness of an industry. Despite the large num- cent of all U.S. manufacturing industries duringber of companies, especially small ones, concen- 1972, the four leading firms had 40 percent ortration in the five medical devices SIC codes is more of the total market (274). In the five medi-similar to that in other manufacturing industries. cal devices codes, the share of the four or eightIn 1977, the four leading firms accounted for 32 leading firms has been continually declining since

Ch. 2—Characteristics of the Medical Devices Industry • 29
Table 13.–Market Share of Value of Medical Devices Shipments by Leading Companies, 1977 and 1963
Percentage of market share
Total number of 4 leading 8 leadingSIC industry segment companies companies companies
X-ray and electromedical equipment (SIC 3693)1977 . . . . . . . . . . . . . . . . . . . . . . . . . . . . . . . . . . . . . . . . . . . . . . . . . . . . . . . . . . 212 32% 51%1963 . . . . . . . . . . . . . . . . . . . . . . . . . . . . . . . . . . . . . . . . . . . . . . . . . . . . . . . . . . 56 67 79
Surgical and medical instruments (SlC 3841)1977 . . . . . . . . . . . . . . . . . . . . . . . . . . . . . . . . . . . . . . . . . . . . . . . . . . . . . . . . . . 575 32 481963 . . . . . . . . . . . . . . . . . . . . . . . . . . . . . . . . . . . . . . . . . . . . . . . . . . . . . . . . . 256 47 58
Surgical appliances and supplies (SIC 3842)1977 . . . . . . . . . . . . . . . . . . . . . . . . . . . . . . . . . . . . . . . . . . . . . . . . . . . . . . . . . . 1,017 38 491963 . . . . . . . . . . . . . . . . . . . . . . . . . . . . . . . . . . . . . . . . . . . . . . . . . . . . . . . . . . 525 49 58
Dental equipment and supplies (SIC 3843)1977 . . . . . . . . . . . . . . . . . . . . . . . . . . . . . . . . . . . . . . . . . . . . . . . . . . . . . . . . . . 507 33 461963 . . . . . . . . . . . . . . . . . . . . . . . . . . . . . . . . . . . . . . . . . . . . . . . . . . . . . . . . . . 267 37 50
Ophthalmic goods (SlC 3851)1977 . . . . . . . . . . . . . . . . . . . . . . . . . . . . . . . . . . . . . . . . . . . . . . . . . . . . . . . . . . 593 45 561963 . . . . . . . . . . . . . . . . . . . . . . . . . . . . . . . . . . . . . . . . . . . . . . . . . . . . . . . . . . . 211 53 62
SOURCES: U.S. Department of Commerce, Bureau of the Census, Certsus of Manufactures, /ndustry Series, foryears 1963 and 1977, ascitedin U.S. DepartmentofHealth and Human Services, Food andDru Administration, Office of Planning and Evaluation, Base/ine Data on the Avaflabflity ofMedica/ Devices and
f/n-Vitro Diagnostic Products, OPE Study 5 , Washington, DC, 1980.
1963, with the possible exception of SIC 3841(sur-gical and medical instruments), whose ratio in-creased slightly from 1972 to 1977.
As one would expect, the field appears to bemuch more concentrated at the level of more spe-cific products. The 1977 Census of Manufacturesreported the number of companies with shipmentsof $100,000 or more for each product line. SIC3693 (electromedical equipment) had four prod-uct types with only one manufacturer, and SIC3842 (surgical appliances and supplies) had oneproduct with a single manufacturer (393). Theproducts in the other SIC codes, which varied intheir level of detail, all had more than one man-ufacturer, although the numbers were sometimessmall.
Data from IMS America on sales to hospitalsindicate that a small number of companies havea large share of the market for specific devices(table 14). For sutures, the four leading companiesaccounted for 99.9 percent of all sales. Marketshares over 96 percent were also held by the fourleading firms in surgeons’ needles, blood collec-tion supplies, and ostomy products (for dischargeof intestinal contents or urine through an artifi-cial opening). The lowest market shares of thefour leaders, which were still substantial were 43percent for garments, textiles, and gloves and 45percent for respiratory therapy devices. Severalcompanies have large market shares across a rangeof products. As shown in table 15, American Hos-
pital Supply Corp. is one of eight leading firmsin 21 of the 28 product categories listed in table14, and Johnson &Johnson is one in 14.
Prices for products in SIC medical devices codeshave increased at rates comparable to those inother manufacturing industries. Available indexesmeasure price changes in a given market basketof products and do not incorporate new productsor changes in old ones, a serious deficiency forthe innovative medical devices field. From 1972to 1982, product prices rose at an annual rate of9.5 percent for SIC 3693 (X-ray and electromedi-cal equipment), 8 percent for SIC 3841 (surgicaland medical instruments), 7.3 percent for SIC3842 (surgical appliances and supplies), 7.7 per-cent for SIC 3843 (dental equipment and supplies),and 5.9 for SIC 3851 (ophthalmic goods) (369,375). During that time, product prices increasedat an annual rate of 9.2 percent for all manufac-turing industries and 6.7 percent for the electri-cal and electronic equipment industry.
The lower rate of price increase in ophthalmicgoods is consistent with the case of contact lenses.From 1971 to 1982, the list price of soft contactlenses fell 50 percent, a result of competitionamong fitters as well as among producers of thelenses (275). The mature hard lens sector, whichexhibits little evidence of economies of scale inproduction, has few dominant firms and has beenhighly price-competitive for several years. In the

30 ● Federal Policies and the Medical Devices Industry
Table 14.—Leading Companies’ Market Share of Hospital Sales of Medical Devices, 1982a
Percent market share
Sales to hospitals 4 leading 8 leadingSIC code/product (thousands of dollars) companies companies
X-ray and electromedical equipment (SIC 3693)X-ray supplies . . . . . . . . . . . . . . . . . . . . . . . . . . . . . . . . . . . . . . . . . . . . . . . $77,366 89.3% 98.2%Radiological catheters and guide wire . . . . . . . . . . . . . . . . . . . . . . . . . 135,878 85.3 92.8Pacemakers and other cardiovascular products . . . . . . . . . . . . . . . . . 499,999 73.7 88.9Electrosurgical supplies . . . . . . . . . . . . . . . . . . . . ., . . . . . . . . . . . . . . . . 48,552 58.9 82.6
Surgical and medical instruments (SIC 3841)Surgeons’ needles . . . . . . . . . . . . . . . . . . . . . . . . . . . . . . . . . . . . . . . . . . . 4,310 96.5 99.6Blood collection supplies . . . . . . . . . . . . . . . . . . . . . . . . . . . . . . . . . . . . 57,845 96.4 99.1Thermometers . . . . . . . . . . . . . . . . . . . . . . . . . . . . . . . . . . . . . . . . . . . . . . 31,426 78.8 92.3Surgical instruments . . . . . . . . . . . . . . . . . . . . . . . . . . . . . . . . . . . . . . . . . 294,284 68.1 81.2Syringes and needles . . . . . . . . . . . . . . . . . . . . . . . . . . . . . . . . . . . . . . . . 331,054 65.7 80.9Catheters, tubes and allied products . . . . . . . . . . . . . . . . . . . . . . . . . . . 235,445 60.8 81.6Diagnostic instruments . . . . . . . . . . . . . . . . . . . . . . . . . . . . . . . . . . . . . . 69,549 59.5 77.8
Surgical appliances and supplies (SIC 3842)Sutures . . . . . . . . . . . . . . . . . . . . . . . . . . . . . . . . . . . . . . . . . . . . . . . . . . . . 286,635 99.9 100.0Ostomy products . . . . . . . . . . . . . . . . . . . . . . . . . . . . . . . . . . . . . . . . . . . . 13,842 97.9 99.6Surgical packs and parts . . . . . . . . . . . . . . . . . . . . . . . . . . . . . . . . . . . . . 174,123 84.1 95.1Maternity products . . . . . . . . . . . . . . . . . . . . . . . . . . . . . . . . . . . . . . . . . . 26,869 82.3 91.8Dialysis supplies . . . . . . . . . . . . . . . . . . . . . . . . . . . . . . . . . . . . . . . . . . . . 97,677 81.5 93.3Cardiopulmonary supplies . . . . . . . . . . . . . . . . . . . . . . . . . . . . . . . . . . . . 71,176 79.4 98.0Sponges . . . . . . . . . . . . . . . . . . . . . . . . . . . . . . . . . . . . . . . . . . . . . . . . . . . 174,768 78.9 88.4Bandages, dressings and elastic 172,303 77.3 87.5Orthopedic supplies . . . . . . . . . . . . . . . . . . . . . . . . . . . . . . . . . . . . . . . . 302,283 74.5 83.8Parenteral supplies . . . . . . . . . . . . . . . . . . . . . . . . . . . . . . . . . . . . . . . . . . 701,106 72.6 91.9Urological products . . . . . . . . . . . . . . . . . . . . . . . . . . . . . . . . . . . . . . . . . 198,970 71.7 86,8Sterilizer supplies . . . . . . . . . . . . . . . . . . . . . . . . . . . . . . . . . . . . . . . . . . 88,846 71.4 83,5Cast room supplies . . . . . . . . . . . . . . . . . . . . . . . . . . . . . . . . . . . . . . . . . . 39,836 62,2 78.6Disposable kits and trays . . . . . . . . . . . . . . . . . . . . . . . . . . . . . . . . . . . . . 258,317 46.7 63.1Respiratory therapy . . . . . . . . . . . . . . . . . . . . . . . . . . . . . . . . . . . . . . . . . . 245,890 45.1 67.4Garments, textiles, and gloves . . . . . . . . . . . . . . . . . . . . . . . . . . . . . . . . 592,254 43.7 61.1
Ophthalmic goods (SIC 3851)Ophthalmic-related products . . . . . . . . . . . . . . . . . . . . . . . . . . . . . . . . . . 83,649 67.9 93.3
alMs AmeriCa’S l+ospital SIJ@Y index also has nifleothercategories that are not included here: elastic goods, identification SUpplif3S, SOIUtiOnS, chemicals andsoaps, gases, medical supplies, paper products, rubber goods, and underpads.
SOURCE: IMS America, Ltdv Rockville, MD, unpublished data, 1983.
Table 15.—Eight Leading Companies in Hospital Sales of Medical Devices in Threeor More Product Categories, 1982a
. Number of product categories Number of product categories
in which company is one ofCompany
in which company is one ofeight leading companies Company eight leading companies
American Hospital Brunswick Corp.. . . . . . . . . 4Supply Corp. . . . . . . . . . . 21 Lilly . . . . . . . . . . . . . . . . . . . . 4
Johnson & Johnson . . . . . 14 Cordis/Cordis Dow.. . . . . . 3Colgate-Palmolive . . . . . . . 8 Dart Industries . . . . . . . . . . 3Baxter-Travenol . . . . . . . . . 7 Independent Lab . . . . . . . . 3Bard, C.R. . . . . . . . . . . . . . . 6 Kimberly-Clark . . . . . . . . . . 3Pfizer . . . . . . . . . . . . . . . . . . 6 Professional Med. P...... 3Abbott . . . . . . . . . . . . . . . . . 5 Squibb . . . . . . . . . . . . . . . . . 3Bristol-Myers . . . . . . . . . . . . 5 Terumo-America Inc. . . . . . 3Minnesota 3M Labs . . . . . . 5 Warner-Lambert . . . . . . . . . 3Becton Dickinson . . . . . . . 4
— — . . . . —aoutofthe zBprOduct categories listed in table 14.
SOURCE: IMS America, Ltd. Rockville, MD, unpublished data, 1983.
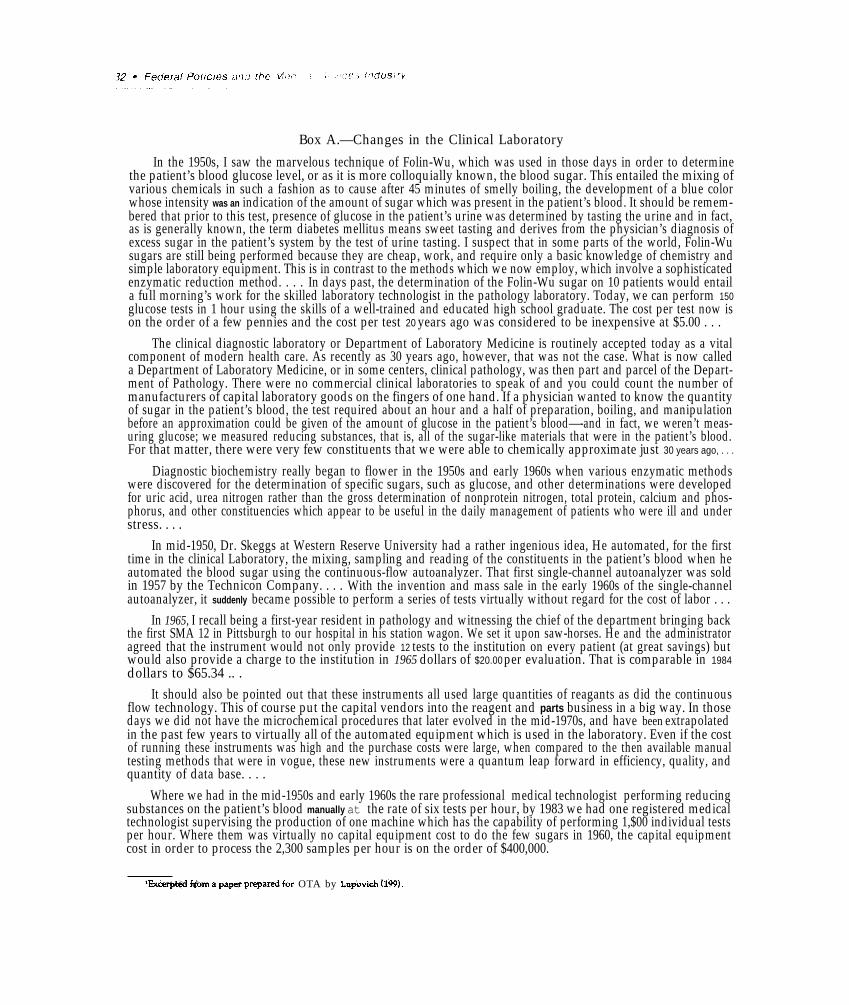
Box A.—Changes in the Clinical Laboratory
In the 1950s, I saw the marvelous technique of Folin-Wu, which was used in those days in order to determinethe patient’s blood glucose level, or as it is more colloquially known, the blood sugar. This entailed the mixing ofvarious chemicals in such a fashion as to cause after 45 minutes of smelly boiling, the development of a blue colorwhose intensity was an indication of the amount of sugar which was present in the patient’s blood. It should be remem-bered that prior to this test, presence of glucose in the patient’s urine was determined by tasting the urine and in fact,as is generally known, the term diabetes mellitus means sweet tasting and derives from the physician’s diagnosis ofexcess sugar in the patient’s system by the test of urine tasting. I suspect that in some parts of the world, Folin-Wusugars are still being performed because they are cheap, work, and require only a basic knowledge of chemistry andsimple laboratory equipment. This is in contrast to the methods which we now employ, which involve a sophisticatedenzymatic reduction method. . . . In days past, the determination of the Folin-Wu sugar on 10 patients would entaila full morning’s work for the skilled laboratory technologist in the pathology laboratory. Today, we can perform 150glucose tests in 1 hour using the skills of a well-trained and educated high school graduate. The cost per test now ison the order of a few pennies and the cost per test 20 years ago was considered to be inexpensive at $5.00 . . .
The clinical diagnostic laboratory or Department of Laboratory Medicine is routinely accepted today as a vitalcomponent of modern health care. As recently as 30 years ago, however, that was not the case. What is now calleda Department of Laboratory Medicine, or in some centers, clinical pathology, was then part and parcel of the Depart-ment of Pathology. There were no commercial clinical laboratories to speak of and you could count the number ofmanufacturers of capital laboratory goods on the fingers of one hand. If a physician wanted to know the quantityof sugar in the patient’s blood, the test required about an hour and a half of preparation, boiling, and manipulationbefore an approximation could be given of the amount of glucose in the patient’s blood—-and in fact, we weren’t meas-uring glucose; we measured reducing substances, that is, all of the sugar-like materials that were in the patient’s blood.For that matter, there were very few constituents that we were able to chemically approximate just 30 years ago, . . .
Diagnostic biochemistry really began to flower in the 1950s and early 1960s when various enzymatic methodswere discovered for the determination of specific sugars, such as glucose, and other determinations were developedfor uric acid, urea nitrogen rather than the gross determination of nonprotein nitrogen, total protein, calcium and phos-phorus, and other constituencies which appear to be useful in the daily management of patients who were ill and understress. . . .
In mid-1950, Dr. Skeggs at Western Reserve University had a rather ingenious idea, He automated, for the firsttime in the clinical Laboratory, the mixing, sampling and reading of the constituents in the patient’s blood when heautomated the blood sugar using the continuous-flow autoanalyzer. That first single-channel autoanalyzer was soldin 1957 by the Technicon Company. . . . With the invention and mass sale in the early 1960s of the single-channelautoanalyzer, it suddenly became possible to perform a series of tests virtually without regard for the cost of labor . . .
In 1965, I recall being a first-year resident in pathology and witnessing the chief of the department bringing backthe first SMA 12 in Pittsburgh to our hospital in his station wagon. We set it upon saw-horses. He and the administratoragreed that the instrument would not only provide 12 tests to the institution on every patient (at great savings) butwould also provide a charge to the institution in 1965 dollars of $20.00 per evaluation. That is comparable in 1984dollars to $65.34 .. .
It should also be pointed out that these instruments all used large quantities of reagants as did the continuousflow technology. This of course put the capital vendors into the reagent and parts business in a big way. In thosedays we did not have the microchemical procedures that later evolved in the mid-1970s, and have been extrapolatedin the past few years to virtually all of the automated equipment which is used in the laboratory. Even if the costof running these instruments was high and the purchase costs were large, when compared to the then available manualtesting methods that were in vogue, these new instruments were a quantum leap forward in efficiency, quality, andquantity of data base. . . .
Where we had in the mid-1950s and early 1960s the rare professional medical technologist performing reducingsubstances on the patient’s blood manually at the rate of six tests per hour, by 1983 we had one registered medicaltechnologist supervising the production of one machine which has the capability of performing 1,$00 individual testsper hour. Where them was virtually no capital equipment cost to do the few sugars in 1960, the capital equipmentcost in order to process the 2,300 samples per hour is on the order of $400,000.
%xcerpted from a paper prepawd for OTA by Lnpovieh (199).

Ch. 2—Characteristics of the Medical Devices Industry ● 3 1——. — . . .
younger soft lens sector, the four leading firmscontrol almost 70 percent of the market, but newfirms have entered and the concentration level hasdeclined steadily during the past 5 years.
There is some evidence that merger activity inthe medical devices field accelerated during thelatter part of the 1970s. Respondents to a surveyin 1981 said that only 4 percent of their companies
had been acquired by another firm, merged withanother firm, or acquired another firm from 1972to 1975, but 23 percent answered affirmatively for1976 to 1980 (197). By 1982, 100 of the 140 firmsbelonging to the Pharmaceutical ManufacturersAssociation produced diagnostic products andother medical devices, accounting for an estimated60 percent of all such sales (244).
INNOVATION IN MEDICAL DEVICES
A hallmark of the medical devices field has beenthe introduction of new products and the refine-ment of old ones. Some innovations affect or-dinary devices that are used frequently, such asassembled surgical trays for operating rooms (2).Others represent the application of sophisticatedtechnology to medical uses, such as nuclear mag-netic resonance imaging. 6 This rapid innovationin medical devices has certainly underlain muchof the growth in firms and sales in recent decades.
Although innovation in medical devices has notbeen precisely documented, striking evidence isprovided by the changes in medical practice thathave resulted from new medical devices. In boxesA and B, respectively, a pathologist and an oph-thalmologist relate certain changes in clinical lab-oratories and ophthalmology that have been linkedto innovations in devices. Innovative devices havebeen the basis for tremendous changes in clinicallaboratory procedures. Compared to a generationago, clinical laboratory tests can now be per-formed more accurately and quickly as well aswith fewer, less skilled personnel and at lowercost .
The pace of innovation in ophthalmology de-scribed in box B is greater than one might expectfrom the relative growth of the SIC code 3851(ophthalmic goods). However, many of the newor refined medical devices used in ophthalmologyare surgical instruments or electromedical equip-ment, which appear in other SIC codes. Similarinnovations have taken place in other areas ofmedicine, such as digital subtraction angiography
6See the separately published OTA case study on nuclear magneticresonance imaging by Steinberg and Cohen (291).
and CT scanning in diagnostic imaging and pace-makers and materials for hip joints in surgery.
Patents are frequently used as a measure of in-novative activity in an industry. Such data havelimitations since not all inventions are patented,several patents may pertain to a single invention,and the propensity to patent is greater in somefields than in others.
The number of patents granted by the U.S. Pat-ent Office grew modestly through the 1970s. From1968 to 1979, almost 22,000 applications werefiled for medical devices patents that were subse-quently issued (table 16), representing 2 percentof all patents (381). Compared with all U.S.patents over the same period of time (see app. D,table D-2): 1) while all patents have remainedessentially constant, medical devices patents in-creased moderately; and 2) while foreign-originmedical devices patents as a percent of total med-ical devices patents increased from 20 to 30 per-cent over the 1970s, foreign-origin patents for allU.S.-issued patents increased from about 30 to 40percent. Individuals owned 37 percent of the med-ical devices patents, compared with 22 percent ofall patents, an observation suggesting the impor-tant role of individuals in the medical devicesfield. Table 17 provides information on patentingactivity in specific medical device fields (see app.D for further information on patents). Electricalsystems and diagnostic equipment using radiation,for example, accounted for about 6 percent of allmedical devices patents. Strength in this area isconsistent with the rapid growth in sales, firms,and employment that has characterized the relatedsegment of the medical devices industry (X-ray,
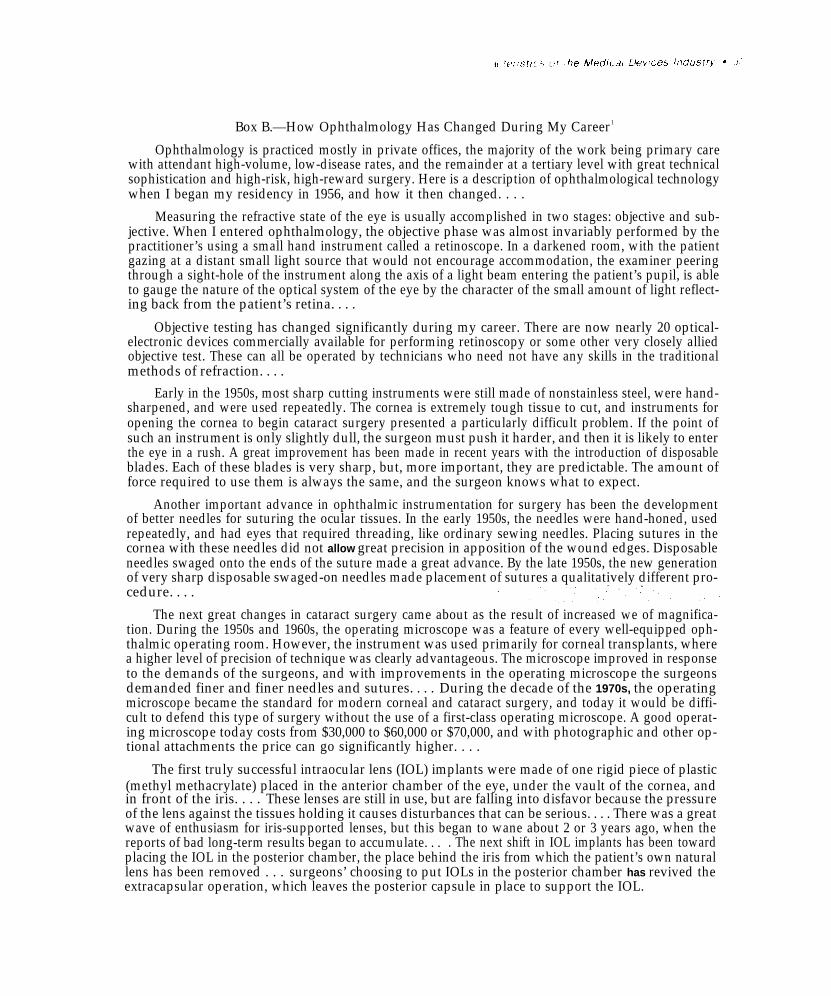
Box B.—How Ophthalmology Has Changed During My Career1
Ophthalmology is practiced mostly in private offices, the majority of the work being primary carewith attendant high-volume, low-disease rates, and the remainder at a tertiary level with great technicalsophistication and high-risk, high-reward surgery. Here is a description of ophthalmological technologywhen I began my residency in 1956, and how it then changed. . . .
Measuring the refractive state of the eye is usually accomplished in two stages: objective and sub-jective. When I entered ophthalmology, the objective phase was almost invariably performed by thepractitioner’s using a small hand instrument called a retinoscope. In a darkened room, with the patientgazing at a distant small light source that would not encourage accommodation, the examiner peeringthrough a sight-hole of the instrument along the axis of a light beam entering the patient’s pupil, is ableto gauge the nature of the optical system of the eye by the character of the small amount of light reflect-ing back from the patient’s retina. . . .
Objective testing has changed significantly during my career. There are now nearly 20 optical-electronic devices commercially available for performing retinoscopy or some other very closely alliedobjective test. These can all be operated by technicians who need not have any skills in the traditionalmethods of refraction. . . .
Early in the 1950s, most sharp cutting instruments were still made of nonstainless steel, were hand-sharpened, and were used repeatedly. The cornea is extremely tough tissue to cut, and instruments foropening the cornea to begin cataract surgery presented a particularly difficult problem. If the point ofsuch an instrument is only slightly dull, the surgeon must push it harder, and then it is likely to enterthe eye in a rush. A great improvement has been made in recent years with the introduction of disposableblades. Each of these blades is very sharp, but, more important, they are predictable. The amount offorce required to use them is always the same, and the surgeon knows what to expect.
Another important advance in ophthalmic instrumentation for surgery has been the developmentof better needles for suturing the ocular tissues. In the early 1950s, the needles were hand-honed, usedrepeatedly, and had eyes that required threading, like ordinary sewing needles. Placing sutures in thecornea with these needles did not allow great precision in apposition of the wound edges. Disposableneedles swaged onto the ends of the suture made a great advance. By the late 1950s, the new generationof very sharp disposable swaged-on needles made placement of sutures a qualitatively different pro-cedure. . . .
The next great changes in cataract surgery came about as the result of increased we of magnifica-tion. During the 1950s and 1960s, the operating microscope was a feature of every well-equipped oph-thalmic operating room. However, the instrument was used primarily for corneal transplants, wherea higher level of precision of technique was clearly advantageous. The microscope improved in responseto the demands of the surgeons, and with improvements in the operating microscope the surgeonsdemanded finer and finer needles and sutures. . . . During the decade of the 1970s, the operatingmicroscope became the standard for modern corneal and cataract surgery, and today it would be diffi-cult to defend this type of surgery without the use of a first-class operating microscope. A good operat-ing microscope today costs from $30,000 to $60,000 or $70,000, and with photographic and other op-tional attachments the price can go significantly higher. . . .
The first truly successful intraocular lens (IOL) implants were made of one rigid piece of plastic(methyl methacrylate) placed in the anterior chamber of the eye, under the vault of the cornea, andin front of the iris. . . . These lenses are still in use, but are falling into disfavor because the pressureof the lens against the tissues holding it causes disturbances that can be serious. . . . There was a greatwave of enthusiasm for iris-supported lenses, but this began to wane about 2 or 3 years ago, when thereports of bad long-term results began to accumulate. . . . The next shift in IOL implants has been towardplacing the IOL in the posterior chamber, the place behind the iris from which the patient’s own naturallens has been removed . . . surgeons’ choosing to put IOLs in the posterior chamber has revived theextracapsular operation, which leaves the posterior capsule in place to support the IOL.

34 . Federal Policies and the Medical Devices Industry.——-——. — —. . . — —.- — —. . . . . . —.—.——.—-.
Table 16.—U.S. and Foreign Medical Devices Patents Granted byU.S. Patent Office by Application Date, 1968-79
— ---- —..Number Annual percentage change— — ——— —. — . —
United UnitedYear Total States Foreign Total States Foreign— — — . — ——— — ..- ———.1979a 2,142 1,488 . -,. 654 5.3% 2.0% 13.5%1978a : 2,035 1,459 676 -4.8 - 7 0 141 9 7 7 2,137 1,569 568 3.8 1.6 1071976 2,058 1,545 ‘: 1 3.2 0.1 13,71975 1,994 1,543 451 --0.5 1.8 -5.81 9 7 4 1,995 1,516 479, 6.6 4.0 15,71 9 7 3 1,871 1,457 414 9 4 8.1 14,01 9 7 2 1,711 1,348 363 4.0 -1.0 28,31 9 7 1 1,645 1,362 283 6.1 8.2 -2.71 9 7 0 1,550 1,259 291 9.1 9.2 8.61 9 6 9 1,421 1,153 268 12,7 9.9 26.41968 1,261 1,049 212 --- -- -.
—.——-Total . . . . . 21,820 16,748 5072— ..- ————-. . — - --. .—.—.— -—————.—.——
aThe average pendenc Y (1 P the delay between the flllng of a pat, t il I(II c il I(>I and I IS subsequent Issuance as a patent)IS currently longer than 2 y ~ars I t Is estimated that 2 to 5 percent I I , I ‘I 7 ) ~pl I lcat Ions and 1 pel’cent of the 1978 appl lcatlons were still pend~ng I . Ijnc 1983
SOURCE U S Department 1 ‘~eall~ and Human Services Food an,~ I J. ~, “Irr II lustr!itlor Of f!ce of Economic Analysts, Roc~vllleMD comt Itat I II b I ibi I shed data frnm the I.J S P ?t{ I ie~. lark 3ffice C)ecernher 1983
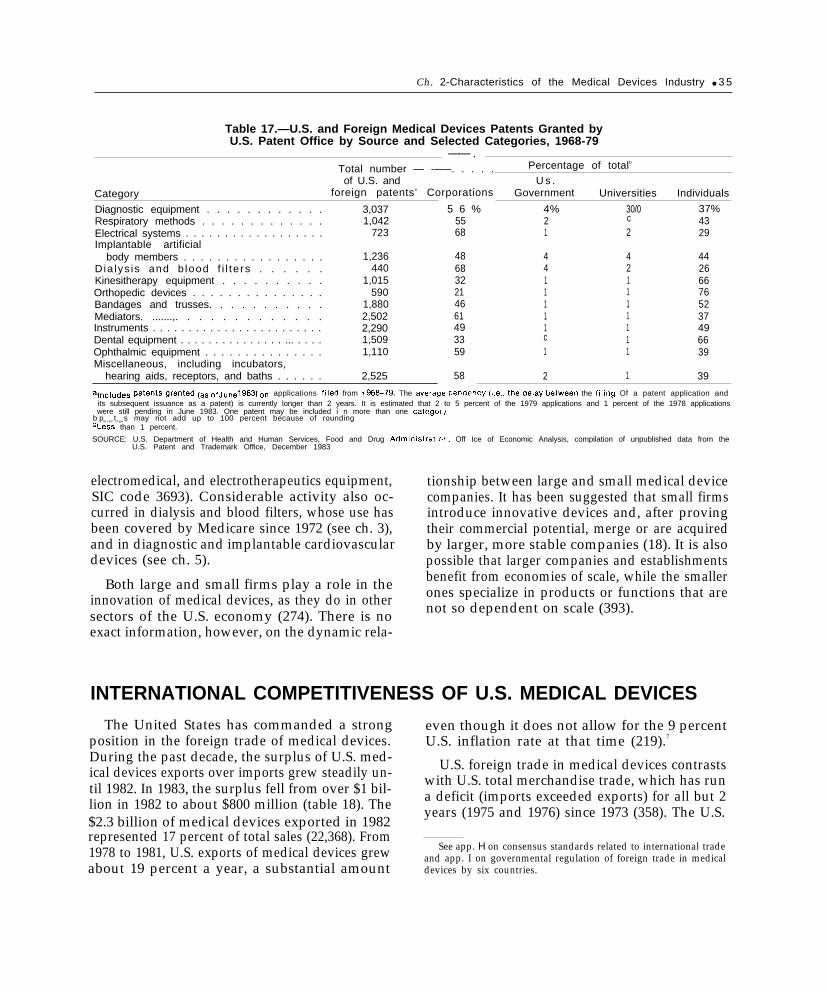
Ch. 2-Characteristics of the Medical Devices Industry ● 3 5
Table 17.—U.S. and Foreign Medical Devices Patents Granted byU.S. Patent Office by Source and Selected Categories, 1968-79
—-— .Total number — -—–. . . . . Percentage of totalb
of U.S. and U s .Category foreign patents’ Corporations Government Universities Individuals
Diagnostic equipment . . . . . . . . . . . . 3,037 5 6 % 4% 30/0 37%Respiratory methods . . . . . . . . . . . . . 1,042 55 2 c 43Electrical systems . . . . . . . . . . . . . . . . . . 723 68 1 2 29Implantable artificial
body members . . . . . . . . . . . . . . . . . 1,236 48 4 4 44Dia lys is and b lood f i l te rs . . . . . . 440 68 4 2 26Kinesitherapy equipment . . . . . . . . . . 1,015 32 1 1 66Orthopedic devices . . . . . . . . . . . . . . . 590 21 1 1 76Bandages and trusses. . . . . . . . . . . 1,880 46 1 1 52Mediators. .......,. . . . . . . . . . . . . 2,502 61 1 1 37Instruments . . . . . . . . . . . . . . . . . . . . . . . . 2,290 49 1 1 49Dental equipment . . . . . . . . . . . . . . . ... . . . . 1,509 33 c 1 66Ophthalmic equipment . . . . . . . . . . . . . . . 1,110 59 1 1 39Miscellaneous, including incubators,
hearing aids, receptors, and baths . . . . . . 2,525 58 2 1 39
al”~lud~~ ~at~nt~ ~rant~d (as of J“n~ 1983) on applications filed from 1 g68_79, The average pendency (i.e., the delay between the filing Of a patent application andits subsequent issuance as a patent) is currently longer than 2 years. It is estimated that 2 to 5 percent of the 1979 applications and 1 percent of the 1978 applicationswere still pending in June 1983. One patent may be included i n more than one categol y
b percen ta g e s may not add up to 100 percent because of roundingcLess than 1 percent.
SOURCE: U.S. Department of Health and Human Services, Food and Drug Adminlstratior, Off Ice of Economic Analysis, compilation of unpublished data from theU.S. Patent and Trademark Office, December 1983
electromedical, and electrotherapeutics equipment,SIC code 3693). Considerable activity also oc-curred in dialysis and blood filters, whose use hasbeen covered by Medicare since 1972 (see ch. 3),and in diagnostic and implantable cardiovasculardevices (see ch. 5).
Both large and small firms play a role in theinnovation of medical devices, as they do in othersectors of the U.S. economy (274). There is noexact information, however, on the dynamic rela-
tionship between large and small medical devicecompanies. It has been suggested that small firmsintroduce innovative devices and, after provingtheir commercial potential, merge or are acquiredby larger, more stable companies (18). It is alsopossible that larger companies and establishmentsbenefit from economies of scale, while the smallerones specialize in products or functions that arenot so dependent on scale (393).
INTERNATIONAL COMPETITIVENESS OF U.S. MEDICAL DEVICES
The United States has commanded a strongposition in the foreign trade of medical devices.During the past decade, the surplus of U.S. med-ical devices exports over imports grew steadily un-til 1982. In 1983, the surplus fell from over $1 bil-lion in 1982 to about $800 million (table 18). The$2.3 billion of medical devices exported in 1982represented 17 percent of total sales (22,368). From1978 to 1981, U.S. exports of medical devices grewabout 19 percent a year, a substantial amount
even though it does not allow for the 9 percentU.S. inflation rate at that time (219).7
U.S. foreign trade in medical devices contrastswith U.S. total merchandise trade, which has runa deficit (imports exceeded exports) for all but 2years (1975 and 1976) since 1973 (358). The U.S.
See app. H on consensus standards related to international tradeand app. I on governmental regulation of foreign trade in medicaldevices by six countries.

36 • Federal Policies and the Medical Devices lndustry— . — — — — . . —
Table 18.–U.S. Exports and Imports of Medical Devices by SIC Code, 1979-83
Millions of dollars Percent change
SIC code 1979 1980 1981 1982 1983a 1982-83
X-ray and electromedical equipment (SIC 3693)Exports . . . . . . . . . . . . . . . . . . . . . . . . . . . . . . .Imports . . . . . . . . . . . . . . . . . . . . . . . . . . . . . . .Surplus (deficit) . . . . . . . . . . . . . . . . . . . . . . . . .
Surgical and medical instruments (SIC 3841)Exports . . . . . . . . . . . . . . . . . . . . . . . . . . . . . . .Imports . . . . . . . . . . . . . . . . . . . . . . . . . . . . . . . .Surplus (deficit) . . . . . . . . . . . . . . . . . . . . . . . . .
Surgical appliances and supplies (SIC 3842)Exports . . . . . . . . . . . . . . . . . . . . . . . . . . . . . . . .Imports . . . . . . . . . . . . . . . . . . . . . . . . . . . . . . . .Surplus (deficit) . . . . . . . . . . . . . . . . . . . . . . . . .
Dental equipment and supplies (SIC 3843)Exports . . . . . . . . . . . . . . . . . . . . . . . . . . . . . . .Imports . . . . . . . . . . . . . . . . . . . . . . . . . . . . . . . .Surplus (deficit) . . . . . . . . . . . . . . . . . . . . . . . .
Ophthalmic goods (SIC 3851)Exports . . . . . . . . . . . . . . . . . . . . . . . . . . . . . . . .Imports . . . . . . . . . . . . . . . . . . . . . . . . . . . . . . . .Surplus (deficit) . . . . . . . . . . . . . . . . . . . . . . . . .
Total five SIC sectorsExports . . . . . . . . . . . . . . . . . . . . . . . . . . . . . . . .Imports . . . . . . . . . . . . . . . . . . . . . . . . . . . . . . . .Surplus (deficit) . . . . . . . . . . . . . . . . . . . . . . . . .
$ 717275442
$ 839312527
$1,006388618
$1,026487539
$1,065670395
3.8%37.6—
410146264
485174311
566195371
605222383
585255330
-3.314.9—
258105153
30994
215
1274186
35695
261
375108267
395110285
5.31.9—
1014259
1405090
1435093
15555
100
8.410.0—
99245
(146)
114278
(164)
123300
(177)
113342
(299)
110452
(342)
-2.732.2
—
$1,585$ 813$ 772
$1,874$ 899$ 975—.——
$2,191$1,028$1,163
$2,262$1,209$1,053
$2,310$1,542$ 768
2.1%27.5%—
aEstimated
SOURCES: W.C. Bandy, U.S. Departmentof Commerce, Bureau oflndustrial Economics, Washington, DC, personal communication, January 1983; E. Arakak~ U.S.Department of Commerce, Washington, DC, personal communication, February 1984; U.S. Department of Commerce, Bureau of Industrial Economics,1984 U.S. /rrdustria/ Out/ook, Washington, DC, January 1984.
position in medical devices is especially note-worthy because the growing strength of the dollarduring the last decade increased the relative priceof U.S. exports as it decreased the price of U.S.imports. That phenomenon did erode the U.S.surplus in 1983. The surplus in medical devicestrade has also persisted during the recent recession,despite the reduced buying power of our majortrading partners.
this category is heavily tied to export: 30 percentof electromedical equipment and 24 percent of X-ray equipment in 1983 were sold overseas (369).As a result, sales of these devices are more de-pendent on fluctuations in exchange rates.
Electromedical equipment, with exports thatgrew almost 25 percent annually from 1978 to1981, accounts for most of the trade surplus inSIC 3693 (219). Although it is common that theU.S. share of the world market for a product de-clines overtime as other countries enter the fieldand U.S. growth falls behind a faster growingworld market, this situation has not occurred withelectromedical equipment. The U.S. share of theworld market increased from 35 percent in 1975to 47 percent in 1979 (219). Patient monitoringsystems and other diagnostic electromedical appa-ratus have accounted for the majority of these ex-ports (371,372). In 1981, Japan, Canada, theNetherlands, West Germany, and France purchasedalmost half of U.S. exports in this subcategory.
Trade in X-ray products has been less favorable.In1982, exports only slightly exceeded imports.A deficit of $175 million was expected for 1983,
In 1983, the European Economic Communitywas the outlet for 37 percent of U.S. exports ofmedical devices, but Canada (14 percent) and Ja-pan (10 percent) were the major individual pur-chasers. 8 The European Economic Communityalso provided more than half of U.S. imports,with West Germany (32 percent) and Japan (18percent) the largest single sources (369).
Although U.S. production is greater in othercategories of medical devices, SIC 3693 (X-ray andelectromedical equipment) leads exports, with $1billion or almost 50 percent of all U.S. foreignsales of medical devices. Domestic production in
8These figures relate to SIC codes 3841, 3842, 3843, and 3693 butexclude SIC code 3851 (ophthalmic goods),

Ch. 2—Characteristics of the Medical Devices Industry ● 3 7.
with imports accounting for 33 percent of U.S.consumption of all X-ray products (369). About40 percent of all X-ray products imported during1981 and 1982 were X-ray apparatus and partsfrom West Germany (373,374).
Although SIC 3841 (surgical and medical instru-ments) showed a trade surplus in 1983, its posi-tion deteriorated from 1982: exports fell 3 percentand imports grew 15 percent. About 15 percentof the surgical and medical instruments producedin the United States during 1983 were exported,but only 7 percent of U.S. consumption camefrom imports. Exports of surgical and medical in-struments indicate the untapped potential of mar-kets other than our traditional trading partners.From 1978 to 1981, exports to Canada (17 per-cent) and the European Economic Communitygrew about 12 percent per annum. Exports to theMiddle East (10 percent) and Latin America (18percent), however, grew nearly 30 percent per an-num (219,371).
SIC 3842 (surgical appliances and supplies), thelargest medical devices category in sales, has theleast relative involvement in foreign trade: only7 percent of production is exported, and 2 per-cent of U.S. consumption is imported (369). From
CONCLUSIONSThe medical devices industry can be charac-
terized as a field that has undergone enormousgrowth in companies, establishments, employ-ment, new products, and foreign trade. By all ofthese measures, the experience of the medicaldevices industry has exceeded that of manufac-turing as a whole and of similar manufacturingsectors. Growth in medical devices has apparentlyoccurred more by the addition of new companiesthan by the expansion of old ones, an indicationthat any barriers to entering the industry are notprohibitive. Both small and large firms have im-portant positions in this industry. Small com-panies are responsible for a greater percentage ofsales in the medical devices industry than in otherindustries. But large companies have accountedfor the majority of sales, and a small number of
1982 to 1983, exports experienced a 5-percent in-crease, and imports rose almost 2 percent. BothWest Germany and Japan had sizable increasesin their exports to the United States.
Exports of devices in SIC 3843 (dental equip-ment and supplies), representing 12 percent ofproduction, increased 8 percent from 1982 to1983. Imports, only about 5 percent of U.S. con-sumption, came mainly from West Germany andJapan (369).
SIC 3851 (ophthalmic goods) is the only medi-cal devices code that has had a persistent tradedeficit. Half of the imports consist of frames andmountings for eyeglasses, which are supplied pri-marily by France, Italy, Japan, and Hong Kong.Sunglasses, 38 percent of ophthalmic imports in1981, came mainly from Japan and Hong Kong(373). Unlike most products in the other medicaldevices codes, ophthalmic goods are usually cho-sen and used by consumers rather than by medi-cal providers. To the extent that use is discre-tionary or postponable, sales would be expectedto be more sensitive to changes in price and gen-eral economic conditions. That reduced exportsin sunglasses accounted for most of the fall in ex-ports from 1981 to 1982 fits this pattern.
firms have a considerable share of the market,especially in specific product lines.
There are, however, disquieting aspects to thesituation. This phenomenal growth has occurredin a market where there is a consensus that tech-nology, including medical devices, has sometimesbeen used excessively (168,266,346). Policy ini-tiatives, both public and private, are now underway to improve the situation, chiefly by chang-ing the way that medical providers are paid. Inaddition, Federal policy regarding premarket ap-proval of devices is under review. It is thereforetimely to analyze the likely effects on the medi-cal devices industry of these and other policies,a task that is undertaken in the remainder of thisreport.

3.Payment Policies for Health Care
and Medical Devices
We prefer to blame technology rather than our cultural institutions for thegreat cost overrun of the American health care system
–Dale R. Olseth

Contents
Page
Introduction . . . . . . . . . . . . . . . . . . . . . . . . . . . . . . . . . . . . . . . . . . . . 41Third-Party Coverage of Medical Devices . . . . . . . . . . . . . . . . . . . . . . . . . 43Methods of Third-Party Payment and the Demand For Medical Devices . . . . . . . 45
Hospital Payment ....., . . . . . . . . . . . . . . . . . . “... . . . . . . . . . . . . . . 47Medicare’s DRGI-Hospital Payment System . . . . . . . . . . . . . . . . . . . . . . 48Payment for Physicians’ Services . . . . . . . . . . . . . . . . . . . . . . . . . . . . . . 51Payment for Ambulatory Clinical Laboratory Services . . . . . . . . . . . . . . . . . 52Payment for Medical Devices Used in the Home . . . . . . . . . . . . . . . . . . 54Payment for Durable Medical Equipment . . . . . . . . . . . . . . . . . . . . . . . 55Payment for Home Health Care Services . . . . . . . . . . . . . . . . . . . . . . . . . 59
The Financial Relationship Between the Third-Party Payer and Providers . . . . . . 63Public Systems . . . . . . . . . . . . . . . . . . . . . . . . . . . . . . . . . . . . . . . . . . . . . . . 63Per Capita Payment Systems . . . . . . . . . . . . . . . . . . . . . . . . . . . . . . . . . . . . 64
Discussion and Policy Options . . . . . . . . . . . . . . . . . . . . . . . . . . . . . . . . . 65Payment for Laboratory Testing . . . . . . . . . . . . . . . . . . . . . . . . . . . . . . . . 66Payment for Devices Used in the Home. . . . . . . . . . . . . . . . . . . . . . . . . 67Payment for Physicians’ Services . . . . . . . . . . . . . . . . . . . . . . . . . . . . . . . 68Hospital Payment.. . . . . . . . . . . . . . . . . . . . . . . . . . . . . . . . . . . . . . . 70Systemwide Reforms . . . . . . . . . . . . . . . . . . . . . . . . . . . . . . . . . . . . 72
LIST OF TABLESTable No. Page19. Impact of Medical Equipment on Per-Case Hospital Costs. . . . . . . . . . . . . . . . 5020. Durable Medical Equipment (DME) Rental and Purchase
Reimbursement Expenditures, by Major Category,All Participating Carriers, 1976 and 1977... . . . . . . . . . . . . . . . . . . . . . 58
21. Estimated Home Health Care Expenditures and Percent Distributionby Source, 1981 . . . . . . . . . . . . . . . . . . . . . . . . . . . . . . . . . . . . . . . . . . . . . . 59
22. Medicare-Certified Home Health Agencies by Type of Agency . . . . . . . . . . . . 60

3 ■
Payment Policies for Health Careand Medical Devices
.
INTRODUCTIONThe market for health care services is more
complicated than most other sectors of the econ-omy. The ultimate consumers of health care typi-cally do not pay for services at the time they arerendered; third-party payers—insurance com-panies, Medicare, Medicaid, and other Govern-ment programs—share in the cost of providingmedical services to their beneficiaries. Only about32 percent of total personal health care expendi-tures are paid directly by patients (128).
The market for health care services is also com-plicated by the central role of the provider—thephysician, other health professional, or hospital—in making decisions about the amount, kind, andquality of services that the patient receives. Mostdiagnostic and therapeutic medical procedures,prostheses, and implants must be ordered by thephysician. Thus, the makers of medical devicesmore frequently see the provider as the buyer thanthey do the patient or consumer.1
Manufacturers of medical devices, like those ofother products, try to produce and price prod-ucts to meet the demands of their market. If lowprice is important to buyers, then, barring the ex-istence of monopoly power,2 the producers willattempt to make products that can sell profitablyat low prices. If price is not so important to cus-tomers, producers will focus on factors that are.Since the system of third-party payment for healthcare services influences the products that will bebought and the prices that will be paid, it is a ma-jor determinant of the market for medical devices.
Payment issues also influence the long-run per-formance of the industry. In general, the success
1An important and growing class of devices are those made ex-pressly for use in the home or by the consumer. These include self-care products such as self-testing diagnostic kits and aids for hand-icapped people that are often marketed directly to the consumer.
‘This assumption is important in gauging the response of the in-dustry to the preferences of consumers.
or failure of a technological innovation restspartly on developers’ perceptions of its market(201,232,264). Although technological oppor-tunities may dictate what directions of advanceare feasible, the perceived existence of a marketfor an innovation is necessary for the commitmentof research and development (R&D) funds or theinvestment in commercialization. There is noevidence to suggest that the medical device indus-try is different from other industries in this regard.
Other factors besides the payment system shapemarkets for medical devices. Both the benefits andcosts of medical devices matter. First, the buyersand users must perceive a device to be worth-while. Devices that are unsafe, ineffective, or lesseffective than their substitutes may not have amarket even in the presence of generous third-party payment. Gastric freezing is an example ofa device-bound procedure that was abandonedsoon after evidence accumulated that it did nothelp ulcer victims, in spite of the willingness ofthird-party payers to finance its use (114). How-ever, many devices have been widely used eventhough well-documented evidence of their effec-tiveness is lacking.
Second, the availability of an important newdevice whose cost, configuration, or setting of usecurrently limits or proscribes third-party payment(an stimulate a change in payment policy. Thecase of long-term hemodialysis therapy for end-stage renal disease is a classic example (256). Withthe development of a subcutaneous arteriovenousshunt (a plastic tube connected to an artery anda vein in the arm or leg) by Quinton and ScribnerIn 1960, hemodialysis rapidly became accepted asa life--extending therapy for victims of chronickidney failure.
In 1972, Congress extended Medicare coveragefor treatment of end-stage renal disease to the gen-
41
25-406 0 - 84 - 4

42 • Federal Policies and the Medical Devices Industry. . —... — . . . — —
Photo credit: National Kidney Foundation, Washington, DC
This man is undergoing hemodialysis for the treatment of end-stage renal disease (ESRD). Medicare began paying forsuch treatment in 1973, and by 1982, expenditures for Medicare’s ESRD program were an estimated $1.8 billion.
era] population (Public Law 92-603), largely outof a recognition that there occurred an estimated7,000 to 10,000 deaths per year because of thelimited availability of dialysis facilities (256). Thisprogram now pays $1.8 billion annually for hemo-dialysis for approximately 80,000 people (98).
Third, many new medical devices are perceivedto have such benefit that they are demandedwhether or not they are covered by insurers. Indentistry, for example, many new materials havebeen developed in the recent past (184,210), de-spite the fact that almost 70 percent of dental ex-penditures are paid directly by patients (128).
With the recognition that other factors affectthe markets for medical devices, this chapter de-scribes how third-party payment, particularlyFederal payment programs, affects the kinds of
medical devices that are produced, the settings inwhich they are used, and the prices at which theysell.
Medicare and Medicaid, the two Governmenthealth insurance programs, are responsible forabout 35 percent of payments for personal healthcare made to hospitals, 23 percent of those to phy-sicians, and 23 percent of all other medical ex-penditures (128). Private health insurance, in-cluding commercial (for-profit) insurance companiesand (not-for-profit) Blue Cross/Blue Shield plans,accounts for another 33 percent of hospital and35 percent of physician expenditures. Other Fed-eral, State, and local government programs alsocontribute 13 percent of personal health expend-itures through the Veterans Administration (VA),the military medical system and its related Civil-

Ch. 3—Payment Policies for Health Care and Medical Devices • 4 3- —
ian Health and Medical Program of the Uniformed Three aspects of third-party payment can in-Services (CHAMPUS) program, and Government fluence the potential market for medical devices:owned and operated health facilities (128).
●
If all sources of third-party payment and Gov-ernment funding are taken together, the individ- ●
ual consumer or patient bears a moderate propor-tion of the burden of personal health care expend- ●
itures in this country (32 percent). But the distri-bution varies widely by settings and types of tech- r .
the coverage of devices as benefits by third-party payers;the methods used to determine the level ofpayment for covered health services; andthe financial relationship between the payerand the provider of health care.
nology. Patients pay only about 12 percent of hos- Each of these elements is discussed in the sec-tions below.pital expenditures directly, but they pay 37 percent
of payments to physicians and almost 77 percentof expenditures for eyeglasses and appliances(128). The burden of payment also varies widelyin the population. Some people have comprehen-sive health insurance, although an estimated 32.7million people under age 65—or about 16 percentof the population under age 65—were without anypublic or private insurance coverage in 1982(295a). 3
3The uncovered population increased dramatically between 1979 –—-—.—
covered. Economic conditions in the period and increases in the costsand 1982. In 1979, 14.4 percent of those under 65 years of age were of health insurance relative to other goods and services are respon-uncovered, and in 1982, 18.9 percent of those under 65 were un- s]ble for these changes (295,296).
THIRD-PARTY COVERAGE OF MEDICAL DEVICES
Economic theory predicts and empirical evi-dence confirms that the existence of insurance cov-erage for a technology increases the number ofsuch services used (29,233,279). It has also beenshown that the use of physician and hospital serv-ices varies inversely with the amount of cost-sharing required of the consumer (233). Not onlyhave people sought care less often under cost-sharing, but their total annual health expenditureshave been lower than for people without cost-sharing requirements. Insurance coverage also af-fects the adoption of new medical technologies.In two studies, a positive relationship was foundbetween the proportion of a State’s populationwith health insurance and the adoption of complexand sophisticated facilities in hospitals (71,266).
Most health insurance plans are selective intheir definition of covered technologies. Insurersavoid certain services whose use may be difficultto predict or control. For example, mental healthservices are frequently excluded from both pub-
lic and private insurance policies, as are somelong-term care and home health services (55). TheMedicare program covers inpatient hospital caremore fully than other services but requires somecost-sharing by beneficiaries and limits the num-ber of hospital days covered.4 Physician servicesand ambulatory laboratory services are covered,but annual deductibles and copayments are re-quired of beneficiaries. Other services, such asoutpatient drugs, eyeglasses, hearing aids, andpreventive services are either uncovered or cov-ered to a very limited extent under Medicare (345).
Coverage decisions are often more complicatedthan the all-or-nothing decision about generalclasses of services. By statute, Medicare may pay
4Medicare consists of two separate but coordinated programs—
Hospital Insurance (Part A), and Supplementary Medical Insurance(Part B). IJnder Part A, beneficiaries receive up to 60 full days ofhosp]ta] care per year after a deductible is satisfied. Part B, whichis voluntary and requires a premium, has both a deductible and abenc+i, [,irv payment of 20-percent coinsurance.

44 ● Federal Policies and the Medical Devices Industry—
only for services that are “reasonable and neces-sary” for diagnosis, treatment, or improved func-tioning of a malformed body member. Medicarehas refrained from establishing a definitive inter-pretation of reasonable and necessary and hasrelied on a loosely structured and decentralizedmechanism to determine whether a specific serv-ice is covered. Under the present Medicare pro-gram, funds are passed from the Federal Govern-ment to many separate contractors (referred toas intermediaries and carriers) who reimburse pro-viders or consumers for the services delivered intheir areas
The contractors are responsible for implement-ing Medicare coverage policy. Decisions involv-ing coverage of services, particularly new serv-ices, are often made on a case-by-case basis andthus may vary from region to region. For exam-ple, prosthetic devices may be covered underMedicare if they replace all or part of an internalbody organ or replace the functioning of a per-manently inoperative or malfunctioning organ.But communications aids, considered by numer-ous health professionals to be prosthetic devices,are not specifically covered under Medicare. Cov-erage is largely at the discretion of the contrac-tor (345).
A rather informal system exists for referral ofcoverage issues that cannot be resolved by thecontractor to Medicare’s regional office and, ifnecessary, to the Federal Health Care FinancingAdministration (HCFA), which often turns to theOffice of Health Technology Assessment’ in thePublic Health Service for guidance. There is ap-parently some chance involved in which issues getflagged for referral (343).
Medicare contractors vary widely in their iden-tification of uncovered technologies, the decisions
5Coverage is important for new devices where payments are madefor each service delivered as in a fee-for-service system. In Medi-care, coverage affects the services of physicians and other healthprofessionals more than hospitals, because they are paid on a fee-for-service basis whereas hospitals are paid by the admission.
6The Office of Health Technology Assessment (OHTA) in the De-partment of Health and Human Services is the office in the PublicHealth Service that is charged with advising HCFA on Medicarecoverage of specific technologies. OHTA is distinct from the Of-fice of Technology Assessment (OTA), a staff agency of Congressthat performs studies requested by congressional committees andhas a Health Program.
they make concerning the coverage of specifictechnologies, and their implementation of cover-age decisions (51,79,343). In short, coverage ofsome services, particularly new procedures, underMedicare is variable and uncertain. Such uncer-tainty may reduce in the eyes of the developer theexpected monetary return from introducing a newmedical device whose coverage is questionable.Increasingly, the manufacturers of new deviceshave themselves approached HCFA for definitiveguidance on coverage (345), perhaps in an attemptto reduce the interregional variation and uncer-tainty associated with the coverage process.
In general, third-party payers will not cover anew device until it is approved for marketing bythe Food and Drug Administration (FDA) (see ch.5). For example, Medicare will cover no drug ordevice that is in the investigational category. Itis interesting to note, however, that the MedicalDevice Amendments of 1976 (Public Law 94-295)do not prohibit the manufacturers of an investiga-tional device from selling their product to users.The producer may charge a price for an investiga-tional device that will recoup research, develop-ment, and production costs but may not make aprofit.
Although the buyers (health care providers)generally cannot charge third-party payers di-rectly for an investigational device, they cansometimes charge for it through other, similar,procedures that are already covered. ’ In the wordsof one legal expert, “investigational devices paytheir own way” (84). This expert also noted thatlarge and small device-makers charge institutions,practitioners, and patients for devices that areavailable only under an FDA investigational de-vice exemption (IDE).
Some investigational devices have become widelydiffused in the absence of either premarket ap-proval or specific coverage by the major third-party payers. As an example of FDA’s policy oflimiting distribution of devices under IDE, theagency recently issued a “guidance” letter to ninemanufacturers of yttrium aluminum garnet (YAG)lasers (used in ophthalmology) limiting investiga-tional uses to 500 patients in a 6-month period— —- —
‘If the device is part of a research program, a research grant maypay for its use.

Ch. 3—Payment Policies for Health Care and Medical Devices ● 4 5.
because it was concerned that the widespread dis-tribution of these devices still in the investigationstage constituted commercialization (88).
Limitations on and exclusions from coverageincrease the difference between the out-of-pocketprice of covered and uncovered services. Whencovered and uncovered services compete as sub-stitutes for one another, the uncovered servicesare at a distinct disadvantage. To have a chanceof being used, the uncovered service would haveto offer patient benefits sufficiently greater tojustify the higher out-of-pocket expense. The ef-fect of differential coverage levels on the marketfor a medical device depends, of course, on whetherthe device is covered by most insurance plans,which patient conditions are covered for payment,whether substitutes for the device exist—and ifsubstitutes exist, whether these alternative serv-ices are covered under insurance policies as well.
The effects of a coverage decision on medicaldevices vary with the specific characteristics andconditions of use of devices. For example, a newcataract removal procedure made possible by anew device may lower the cost to the physicianof performing the procedure. The physician canintroduce the cost-saving method and bill the pa-tient or insurer for the standard cataract removalprocedure (at fees that are not likely to reflect thereduced costs).8 Thus, to the extent that new tech-niques or devices can be subsumed under existingmedical procedure categories, coverage is not ofgreat concern. However, if the cost of the newapproach is higher than the level of payment forexisting procedures, coverage becomes an impor-
‘See the section below on “Payment for Physicians devices” foran explanation of this phenomenon.
tant milestone in the development of a viable mar-ket for the technique. Using old procedure codesfor the new technique will not be attractive tophysicians.
Although the introduction of some new medi-cal devices may be discouraged by the practicalobstacles to third-party coverage, there is noongoing mechanism in Medicare to reverse cov-erage decisions when an existing device has beenfound to be less effective than other approaches.For example, Medicare has continued to cover in-termittent positive pressure breathing (IPPB), amechanical ventilator for respiratory therapy(246,272), despite the fact that several professionalsocieties have seriously questioned its value.
The history of IPPB also illustrates the impor-tant role of professional judgment in influencingthe use of a procedure. Despite the coverage bythird parties, the use of IPPB has decreased dra-matically in the past decade (see box C) (20,43,49,248,272).
Thus, it appears that the process by whichdevices come to be covered (or removed from cov-erage) by third-party payers is idiosyncratic.Under Medicare, some devices are “grandfathered”into coverage by virtue of their age; some are cov-ered by default because they can be paid withinpreexisting medical procedure codes. Others aredenied coverage, or given very limited coveragefor a period of time. The degree of ease with whicha particular device receives the blessing of cover-age from the major third-party payers appears tohave little to do with the device’s relative efficacyor cost effectiveness (24) and more to do with theaccident of timing of its introduction to medicalpractice.
METHODS OF THIRD= PARTY PAYMENT ANDTHE DEMAND FOR MEDICAL DEVICES
Insurers use a variety of mechanisms to pay for ices to the beneficiary (less any deductibles andcovered services provided to their beneficiaries. coinsurance) up to a schedule of maximum al-In the simplest case, the insurer makes fixed in- lowances.demnity payments to the beneficiary, who is re-sponsible for paying the provider whatever is Medicare, Medicaid, and many Blue Cross/charged. Other plans pay for the full costs of serv- Blue Shield plans enter into contracts with “par-

Box C.–Intermittent Positive Pressure Breathing (IPPB)
IPPB devices are mechanical ventilators which, once triggered by the beginning of the patient’s in-spiration, deliver a single “breath” of air. Such devices can be adjusted for sensitivity so that even veryweak patients can trigger the machine with every attempted breath. The patient usually uses only amouthpiece, although a face mask can also be used (467).
The four basic functions of IPPB devices are: 1) to inflate the lungs fully; 2) to deliver any specifiedmixture of gases (including room air) to the lungs; 3) to deliver aerosols (either bland, to moisten thelung, or medicinal); and 4) to stabilize breathing. Common alternative respiratory therapy devices in-clude blow bottles and incentive spirometers, which help inflate the lungs, and nebulizers, which deliveraerosols. IMS data show that sales of IPPB devices have decreased by about one-third in the past 5 years,while sales of nebulizers, for example, have doubled in the same period (166). Professional-journal arti-cles have also reported that use of IPPB devices has decreased since the early 1970s (20,43,248,272).
Reasons for the decrease in IPPB sales and use are not related to payment policies. Rather, the med-ical profession began in the early 1970s to scrutinize criteria for respiratory therapy in general and theadministration of IPPB therapy in particular (266,287).
IPPB emerged out of World War II efforts to provide adequate ventilation for high-altitude pilots.A landmark paper by Motley and his colleagues in 1947 (221) introduced the clinical use of IPPB tothe medical profession. The 1950s and 1960s saw the gradual diffusion of IPPB technology into hospitalsand homes (58,459). Criticisms of indiscriminate use were published, but use increased dramaticallynonetheless (25).
With the adoption of Medicare and Medicaid legislation in 1965, the public endorsed IPPB use.No conscious decision to cover this procedure was e&r made; the technology was in widespread useat the time of passage. Blue Cross/Blue Shield plans also covered treatments without question,
IPPB therapy was common long before any rigorous tests of its efficacy were made. The clinicalstudies reported in the literature during its diffusion tended to use methods that were poorly designedor difficult to duplicate (272). The lack of good clinical data exacerbated the controversy over its properuse.
In the 1970s, several professional groups began to strongly question the use of IPPB devices. A 1974National Heart and Lung Institute conference on the scientific basis of respiratory therapy concludedthat the literature on IPPB warranted closer examination of the technology, especially through controlledclinical trials. By the time of the National Heart, Lung, and Blood Institute (NHLBI) conference in 1979,respiratory therapy textbooks were beginning to emphasize more stringent criteria far IPPB use (467),and the American Association of Respiratory Therapists (AART} had endorsed guidelines for we pre-pared by the American Thoracic Society (4).
Shortly after the 1979 conference, an OTA-contracted case study circulated a critical appraisal ofIPPB to a slightly different audience (272). With this report to give it credibility, the Blue Cross/BlueShieId Association began an assessment of IPPB use and insurance coverage, in cooperation with theAmerican College of Physicians and other professional groups (36).
While public awareness of the potential for IPPB overuse has risen, the controversy in the medicalprofession has slowed considerably. “Consensus papers” such as the AART and Blue /Cross Shieldguidelines stiIl may find strong opposition on some points (278), but there has been little hard argumentcarried in medical journals in the past few years. A 1981 NHLBI Task Force on Pulmonary Technologydid not even mention IPPB (402).

Ch. 3—Payment Policies for Health Care and Medical Devices . 47—- . . . . . . . . . — —
ticipating” providers that specify the methods fordetermining the level of payment that providerswill receive. Because of the importance of Medi-care, Medicaid, and the Blue Cross/Blue Shieldplans as sources of revenue, these methods of pay-ment are critical determinants of the market formedical devices.
Methods of payment vary widely across in-surers and settings of care. This section will focuson current and proposed methods of paying forinpatient hospital care, physicians’ services, lab-oratory tests provided in ambulatory care settings,and services or devices used in the home. Thesefour components constitute over 80 percent ofhealth expenditures and make intensive use ofmedical devices.
Hospital Payment
Public and private third-party payers were re-sponsible in 1980 for over 83 percent of the reve-nues of community hospitals in the United States(108). Private health insurance itself accounts for38 percent, while Medicare and Medicaid com-prise 42 percent. Individual patients are the sourceof about 17 percent of the revenues of commu-nity hospitals.
Third-party payment for hospital care has tradi-tionally taken two forms: payment of billed chargesand payment of incurred costs. Most commercialinsurance plans and about one-third of the 70 BlueCross plans pay hospitals their billed charges.’ In1981, over one-half of the State Medicaid pro-grams and about one-half of the Blue Cross plansreimbursed hospitals for the “reasonable costs”incurred in serving their beneficiaries (6,345).Medicare is in the process of abandoning thismethod of payment and moving to a new system,discussed later in this chapter. Both of these pay-ment methods (by charges and costs) pass the im-mediate burden of payment through the patientto the third-party payer.
Charge- and cost-based third-party paymentsencourage increases in health care expenditures,because hospitals have no incentive to hold costs.——-. .— -
‘A small percentage of commercial policies are indemnity plans,where the insurer pays the patient a fixed amount, such as $100 perday of hospitalization. Only about 10 percent of group policies writ-ten by commercial insurance companies are indemnity plans (456).
down. ’” Only to the extent that patients them-selves react to costs (or charges) by taking theirbusiness elsewhere (if they can) will the hospitalhave an incentive to compete for patients in termsof price, Since patients themselves pay so littleout-of-pocket for inpatient care, they have littleincentive to concern themselves with price. Thepredominance of third-party cost- and charge-based payment has been held responsible for therapid increase in hospital expenditures (110).
The problem of growing hospital expenditureinflation increased during the 1970s and led bothpublic and private third-party payers to modifypayment methods. A number of Blue Cross plans,individual States, and now the Federal Govern-ment have turned to prospective payment .11 Al-though prospective payment methods vary widelyamong States and payers, they have two featuresin common: the amount that a hospital is paidfor services is set prior to the delivery of thoseservices, and the hospital is at least partially atrisk for losses or stands to gain from surplusesthat accrue during the payment period.
Evidence has accumulated that in recent yearssome State-level prospective payment programs,particularly those with relatively stringent sys-tems, have had a moderating influence on hospi-tal costs (33,60). What have these reductions inhospital costs implied for the adoption of medi-cal technology? Three studies of the impact of hos-pital prospective payment programs on the adop-tion of new capital equipment or equipment-embodied services suggest that prospective pay-ment sometimes does affect technology adoptionand that the directions of effect depend on boththe specific attributes of the programs and thecharacteristics of the new technology.
Joskow found that the number of computed to-mography (CT) scanners located in hospitals ina State in 1980 was negatively related to the num-ber of years that ratesetting had been in effectthere (177). Hospital ratesetting also led to a shiftin the location of CT scanners to physicians’ of-
‘“Such incentives apply when costs of production are reimbursed,as under Medicare, but differ when payments are below costs asunder some Medicaid programs (138).
“Prospective payment has also been called prospective reim-bursement

48 ● Federal Policies and the Medical Devices Industry— .—.— — — . —
fices. Cromwell and Kanak analyzed the impactof specific State ratesetting programs on the avail-ability of 13 different services in the hospital be-tween 1969 and 1978 (72). Two States with strin-gent programs, New York and New Jersey, hadthe most consistently negative effects on the avail-ability of services. Other States’ programs showedno consistent impact on service adoption.
Finally, Wagner and colleagues investigated theimpact of prospective payment in three States—New York, Maryland, and Indiana—on the adop-tion of five new pieces of capital equipment: elec-tronic fetal monitoring, gastroendoscopy, volu-metric infusion pumps, automated bacterial sus-ceptibility testing, and computerized energy man-agement systems (448). The first three technol-ogies are likely to raise the cost of care, while thelatter two are investments in equipment that iscost-reducing in large hospitals. Under New YorkState’s ratesetting program, fewer units of thecost-raising technologies were adopted, and theprobability of large hospitals’ adopting the cost-saving equipment increased. However, the pro-spective payment programs in Maryland and Indi-ana showed no such consistent effects on hospi-tals’ adoption behavior.
Medicare’s DRG HospitalPayment System
In March 1983, Congress established a newMedicare hospital prospective payment system(Public Law 98-21). Beginning in October 1983,Medicare began to phase in a system in which itwill pay hospitals a fixed price for treating eachadmission in 470 separate diagnosis related groups(DRGs) of patients. At this time, the price paidfor each admission in a particular DRG covershospital inpatient operating costs—leaving out-patient, teaching, and capital expenses reimbursedon a cost basis for the time being.
The new system is a Medicare-only approach,but the law allows Medicare to join State-run pro-spective plans to cover all kinds of payers. Sup-port from private insurance companies and busi-nesses for these systems is high. Thus, the Federalmove into prospective payment may presage amore general adoption of this kind of paymentby States.
Because Medicare accounts for such a large per-centage of hospital revenues, the new per-casepayment system should put into place strong in-centives for hospitals to change their behaviorregarding the adoption and use of medical devices,as well as all other inputs, because hospitals willbe able to retain any surplus and must bear alldeficits. One can expect the adoption of somedevices, particularly those that reduce the cost perhospital stay, to be encouraged, relative to theirpast experience. Compared to practice in the re-cent past, the adoption of cost-raising devices willbe discouraged, but the strength of that effect willdepend on the device. Some maybe less affectedif hospitals compete for admissions by adoptingnew device-embodied services, while others thatdo not affect the competitive position of hospi-tals are likely to face a more hostile adoption envi-ronment (see box D for more detail).
The new Medicare payment system should alsoalter the settings in which services are deliveredto Medicare patients. In particular, the use ofnursing homes and home health care should in-crease as hospitals seek to reduce the lengths ofstay of Medicare patients. Moreover, payment forcare delivered in these settings is not so con-strained as that in the hospital. Devices that canbe used in the home should find an increasingmarket.
Some observers are predicting, for example,that the already growing market for parenteraland enteral nutrition (techniques of direct feedinginto the bloodstream or gut) in the home will beincreased by DRG payment, and that hospitalswill enter the market as providers of after-hospitalhome care in direct competition with other pro-viders, some of whom are manufacturers of equip-ment and supplies for parenteral and enteral nu-trition (34).
The law may also influence the pricing behaviorof device manufacturers. As hospitals becomemore price-conscious with the advent of per-casepayment, they are likely to increase their use ofgroup purchasing, standardization of purchasing,and competitive bidding for equipment and sup-plies. Group purchasing as a phenomenon hasgrown rapidly among hospitals in the UnitedStates, with an estimated 88 percent of hospitalsbelonging to a purchasing group in 1981 (99), but
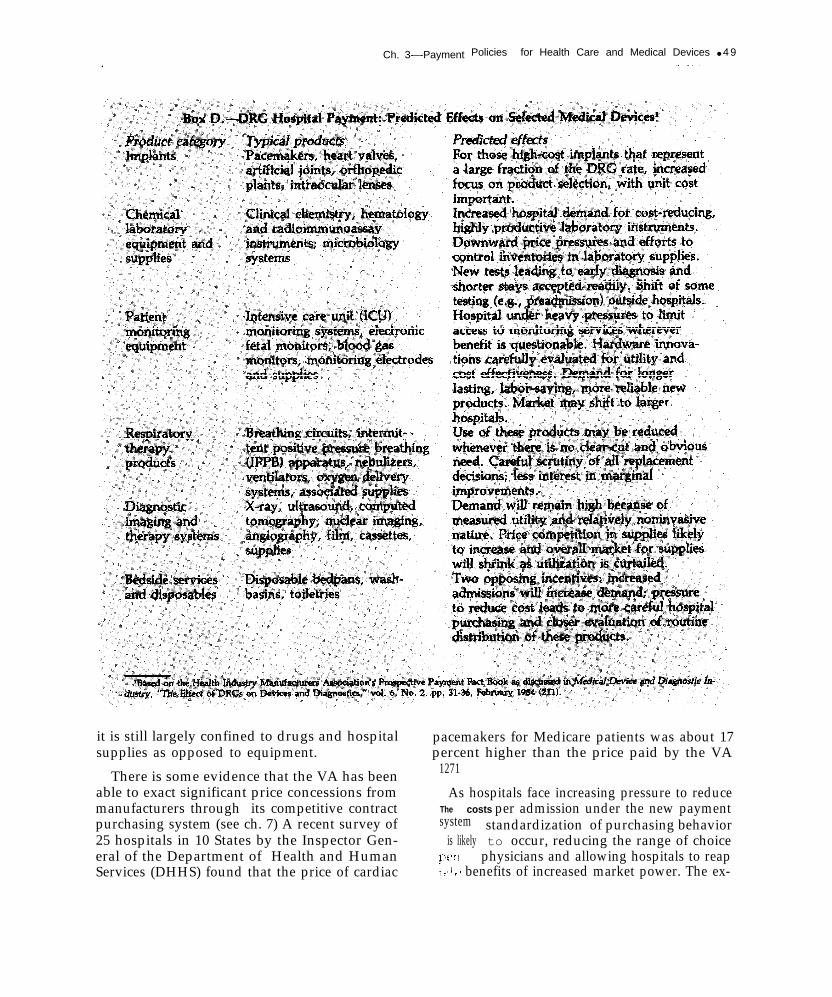
Ch. 3-–-Payment Policies for Health Care and Medical Devices ● 4 9.
it is still largely confined to drugs and hospitalsupplies as opposed to equipment.
There is some evidence that the VA has beenable to exact significant price concessions frommanufacturers through its competitive contractpurchasing system (see ch. 7) A recent survey of25 hospitals in 10 States by the Inspector Gen-eral of the Department of Health and HumanServices (DHHS) found that the price of cardiac
pacemakers for Medicare patients was about 17percent higher than the price paid by the VA
1271
As hospitals face increasing pressure to reduceThe costs per admission under the new paymentsystem standardization of purchasing behavior
is likely to occur, reducing the range of choice[,(!, physicians and allowing hospitals to reap~, I ~ I benefits of increased market power. The ex-

50 ● Federal Policies and the Medical Devices Industry..——— —-.. .— .
pected result in any particular device category isnarrower price ranges and less variation amongproducts.
An unresolved issue with important implica-tions for medical devices is how Medicare will payfor hospitals’ investments in capital plant andequipment in the future. For the present, themethod of payment for capital costs (depreciation,interest, and return-on-equity to for-profit insti-tutions) has not been changed. Capital expendi-tures ‘are reimbursed as they are incurred, on acost basis. Congress has expressed an intentionto include payment for capital by 1986 as part ofthe prospective payment rate, but no specificmethod has been selected.
The present cost-based method of capital pay-ment is inefficient because hospitals have little in-centive to weigh the costs and benefits of pur-chases and hence are likely to adopt and usemedical equipment regardless of the cost effective-ness. Table 19 indicates how hospitals’ incentivesto adopt different kinds of capital equipmentunder DRG payment are influenced by a pass-through of capital (payment of the capital coststhat are incurred).
The capital payment method does not reverseincentives of DRG payment so long as the effecton total hospital costs of a medical equipment pur-chase is in the same direction as its effect on oper-ating costs. For example, DRG payment providesa disincentive to adopt most cost-raising, quality-enhancing (Type I) capital equipment. Regardlessof the way capital costs are handled, such pur-chase would raise operating costs. The capital
passthrough weakens the disincentive to adoptthis kind of technology, but it does not removeit. Since DRG payment sets up incentives for hos-pitals to increase admissions, they have a finan-cial interest to seek cost-raising equipment whoseavailability promises to bring in profitable admis-sions by attracting physicians and patients. A cap-ital cost passthrough essentially subsidizes thiskind of investment, leading potentially to wastefulduplication of these services among hospitals.
With equipment that saves operating costs(Type II) or capital costs (Type III), there can besituations where the policy regarding payment forcapital may actually reverse the incentives of DRGpayment regarding adoption. Of particular con-cern is the incentive under a capital passthroughto adopt expensive capital equipment that reducesoperating costs but raises total cost per case. Forexample, with a capital passthrough, automatedlaboratory equipment might be evaluated in termsof its ability to reduce operating costs, with in-adequate regard for its impact on total costs. Anda more labor-saving capital-intensive systemmight be preferred regardless of its impact on netcosts.
New, inexpensive equipment that replaces older,more costly equipment but only at the expenseof increasing operating costs (Type III) will alsobe discouraged in a DRG system with a capitalcost passthrough even if its adoption would de-crease total costs (Type III-B). Over time, then,hospitals can be expected to become more capital-intensive than efficiency would dictate if the cap-ital passthrough is continued.
Table 19.—lmpact of Medical Equipment on Per-Case Hospital Costs
Direction of effect of equipmentpurchase on: Incentives for adoption
Capital cost Operating cost Total cost With capital Without capitalType of equipment per case per case per case in DRG rate in DRG rate— . .
1. Cost-raising, quality-enhancingequipment . . . . . . . . . . . . . . . . . . . . . . . + + +
Il. Operating cost-saving equipment—
A. Raises total costs . . . . . . . . . . . . + + +B. Saves total costs . . . . . . . . . . . . . + + +
Ill. Capital cost-saving equipmentA. Raises total costs . . . . . . . . . . . . – + + —B. Saves total costs . . . . . . . . . . . . . – + + —
———— —SOURCE: Office of Technology Assessment

Ch. 3—Payment Policies for Health Care and Medical Devices . 51.———— — . . . . — -
Payment for Physicians’ Services
As the primary gatekeeper for the use of medi-cal procedures, the physician is a key actor in deci-sions bearing on the adoption and use of medicaldevices. Most diagnostic and therapeutic servicesmust be ordered by a physician or provided undera physician’s direction. Although the patientalways has the right to refuse services and can re-frain from seeking care in the first place, thiscourse is restricted by consumers’ limited knowl-edge and a medical care system that exhorts thatpatient to “follow doctor’s orders. ” The key roleof the physician is reinforced by extensive insur-ance coverage, which reduces the patient’s eco-nomic incentive to refuse or question services(139).
In 1982, physicians received approximately 37percent of their revenues directly from patients,35 percent from private insurance, 18 percentfrom Medicare, almost 5 percent from Medicaid,and the remainder from private philanthropy andother sources of Government support (128).
Third-party payers generally pay for coveredphysicians’ services on a fee-for-service basis,There are two primary approaches to determin-ing levels of payment: the benefit schedule andthe fee screen (285). Under the benefit scheduleapproach, the insurer pays the patient or physi-cian a predetermined fixed amount for each cov-ered service. In private insurance plans, the pa-tient is responsible for paying the difference betweenthe physician’s fee and the amount of the bene-fit, as well as any deductibles and coinsurance.
The fee-screen approach, used by Blue Shieldplans, Medicare, and some Medicaid programsand commercial major medical plans, pays thephysician’s actual charge (less coinsurance anddeductibles) up to some maximum amount thatis computed from profiles of the physician’s ownfees and those of other physicians in the same spe-cialty and region. This fee-screen approach is gen-erally referred to as the usual, customary, and rea-sonable (UCR) approach to payment. Medicareuses a variant of the UCR system called custom-ary, prevailing, and reasonable (CPR). Here, theCPR will refer to the general system of computing
a payment rate based on historical and compara-tive profiles of physicians’ fees.
Under its CPR system, Medicare pays 80 per-cent of the “reasonable charge”: the lowest of theactual charge, the customary charge, or the pre-vailing charge for a service. The customary chargeis the median charge for that service by the doc-tor, and the prevailing charge is the charge belowwhich lies 75 percent of all charges for that serv-ice by doctors in a particular specialty and geo-graphic area. Unless the physician enters into anagreement with the insurer to accept the CPRamount as payment in full (i.e., accepts assign-ment), which occurs in about 50 percent of allclaims (113), the patient is responsible for pay-ing the difference between the UCR rate and thephysician’s billed charge.
Beginning in 1976, increases in the Medicareprevailing charge have been restricted to a ratereflecting increases in personal income in theUnited States and the costs of medical practice.Over time, as physicians’ actual fees meet or ex-ceed the prevailing charge, Medicare’s CPR sys-tem is becoming a de facto geographic- and spe-cialty-specific benefit schedule. Thus, the differencebetween benefit schedules and CPR methods israpidly becoming a moot point as far as the Medi-care system is concerned.
The CPR system tends to put a premium onperformance of new procedures for which com-parative screens have not been established. A phy-sician can charge a high fee for a new procedureand have it reviewed for its reasonableness by amedical review committee. After these fees areestablished and comparative screens are devel-oped, the new procedure often remains highlyrewarded relative to old procedures, because thereis little financial incentive for physicians to lowerprices as time goes on.
Thus, devices that allow for the performanceof such new procedures should be highly valuedby physicians, other things being equal. (Note,though, that new procedures may require a cov-erage decision, which may slow the adoption ofsuch devices by physicians. ) Gastroendoscopy isan example of a new device-embodied procedurethat was introduced at high fee levels and that is

52 ● Federal Policies and the Medical Devices Industry .
today highly profitable to physicians who performthe procedure in sufficient volume (448).
New procedures are typically device-embodied,whereas the “thinking services” provided by phy-sicians, even though they may embody advancesin knowledge, are generally incorporated in ex-isting procedure categories, such as the office visit.Hence, the bias toward higher rates of return tonew procedures generally represents a bias towarddevice-embodied procedures relative to “cognitiveservices. ”
Schroeder and Showstack analyzed four illus-trative styles of medical practice, ranging frominfrequent to frequent use of laboratory tests thatcan be performed in the office (277). Physicians’net incomes increase as the intensity of labora-tory procedure use increases. To deal with thisproblem, it has been suggested that uniform ben-efit or fee schedules should be constructed on abasis other than UCR, perhaps by experts review-ing data on the relative costs of procedures (137,140). The effect of such a fee schedule on the useof device-specific procedures or the adoption ofnew ones would, of course, depend on the rela-tive fees actually adopted. Should cognitive serv-ices be valued more highly relative to device-specific services, physicians would, other things
Payment for clinical laboratory services deliv-ered to hospital inpatients is part of the hospitalpayment system described above. This sectionfocuses on issues in payment for laboratory serv-ices rendered to ambulatory patients.
Laboratory tests are generally ordered by phy-sicians and are commonly offered by three kindsof laboratories: those located in hospitals, thoselocated in physicians’ offices, and those independ-ent of both hospitals and physicians’ offices. In1977, there were an estimated 7,200 hospital lab-oratories, 50,000 to 80,000 physicians’ office lab-oratories, and an estimated 7,650 independent lab-oratories in the country (226,329,355).
The setting in which testing takes place is deter-mined in part by the economics of laboratorytesting. As new automated chemical laboratorytechnologies came to market in the 1960s, econ-omies of scale in test production favored cen-tralized testing in large independent laboratories,whereas more recently the development of sim-ple new tests such as enzyme immunoassay andmicroprocessor-based equipment has favored de-centralized testing in physicians’ offices. But themethods of third-party payment also affect theprofitability of testing in different settings andtherefore influence the choice of testing location.
being equal, have an incentive to spend relatively Medicare’s methods of paying for ambulatorymore of their patient-care time on them. laboratory tests are particularly influential for
Payment for Ambulatory ClinicalLaboratory Services12
Laboratory equipment, supplies, and reagentsrepresent an important and rapidly advancingarea of medical devices. Laboratory testing vol-umes have increased dramatically in the past dec-ade, partly as a result of the development of newtests and automated equipment and partly as aresult of third-party payment methods. Between1972 and 1977, laboratory tests nearly doubledfor both hospital and ambulatory care (126). Hos-pital laboratory test costs increased from $2.2 bil-lion to over $4 billion, and out-of-hospital testsincreased from 850 to 1,510 tests per 1,000 phy-sician visits (126). During this same period, percapita visits to physicians decreased from 5.0 to4.8 (126).
IZThe material presented in this section is based on a backgroundpaper prepared for OTA by Foster (120).
three reasons: first, Medicare beneficiaries repre-sent a substantial proportion of laboratory testuse; second, in many States, Medicaid uses Medi-care’s payment methods to pay for ambulatorylaboratory services; and third, physicians tend tomake decisions on the location of testing for theirpractice as a whole, not on a specimen-by-speci-men basis, further increasing the leverage of Medi-(are program reimbursement decisions.
Medicare’s payment method for ambulatorylaboratory tests depends both on the setting inwhich a test is ordered (i.e., whether hospital out-patient department or physician’s office) and thesetting in which it is performed (hospital, physi-cian’s office, or independent laboratory).
Before July 1984, Medicare payments for testsordered during physician office visits were madeon a reasonable-charge basis under Part B, theSupplementary Medical Insurance program. Pay-

Ch. 3—Payment Policies for Health Care and Medical Devices ● 5 3——— -_..
ment for these services was 80 percent of the rea-sonable charge, after the beneficiary had met anannual deductible payment (currently $75). Thereasonable charge for a laboratory test was deter-mined by a CPR method of screening claims simi-lar to that applied to physicians’ fees. The rea-sonable charge for a laboratory test, regardlessof where it is performed, is the lowest of the fivefollowing separate limitations:
the actual charge billed for the service by thephysician or laboratory;the customary charge of the laboratory orphysician for the test, calculated as the pro-vider’s median charge in the previous year;the prevailing charge in the locality, com-puted as the 75th percentile of all customarycharges for all participating laboratories orphysicians;the lowest charge at which the test is widelyand consistently available (currently estab-lished for 12 common laboratory tests; orthe comparable charge paid by the privateinsurers that serve as the Medicare carrier.
The customary charges of hospitals, physicians’offices, and independent laboratories, regardlessof whether they use automated equipment, werecommingled to calculate the prevailing charge inthe locality, and all kinds of providers of suchservices were subject to the same prevailing chargeor lowest charge limitation. Note also that thisprocedure generally resulted in Medicare’s pay-ing laboratories at a low rate relative to privateinsurers.
Medicare can pay one of three different entitiesfor ambulatory tests: the beneficiary, the test-ordering physician who has accepted assignment,or the testing laboratory that has accepted assign-ment (42 CFR, sec. 405.251(b)). Until a recentchange in the law, if the beneficiary sought reim-bursement, he or she would receive from Medi-care 80 percent of the laboratory’s reasonablecharge, less any deductible. The party billing thebeneficiary (whether it be a physician’s office, hos-pital, or independent laboratory) was subject tono limitation on the amount that could be chargedthe beneficiary, who had to make up the dif-ference.
Under this method of payment, the physicianwas in a unique position of having the power notonly to choose whether or not to accept assign-ment and bill Medicare directly, but also whetherto perform a test in the office or send the specimento an independent or hospital laboratory. If thephysician accepted assignment, the amount Medi-care would pay depended on the information sup-plied on the physician’s claim for reimbursement.If the claim indicated that the test was performedin the office, Medicare would pay the physician80 percent of the reasonable charge as describedabove. If the claim indicated that the test was per-formed by an outside laboratory, Medicare wouldpay the physician only the laboratory’s reason-able charge plus a $3 handling fee.
Before July 1984, Medicare reimbursement fortests ordered during hospital outpatient visits wasbased on 80 percent of the cost of the service tothe hospital and 80 percent of the reasonablecharge for any physician service provided in con-nection with the test. (The patient was responsi-ble for paying the remaining 20 percent. ) SinceOctober 1983, HCFA treated most clinical labora-tory tests performed in hospital laboratories notas physicians’ services but as hospital outpatientservices. Consequently, the price was typicallybased on the cost, not the charge, method.
In July 1984, Public Law 98-369 established anew method for setting ambulatory laboratoryfees that represents a significant departure fromthe traditional method described above. For a 3-year period beginning in 1984, Medicare paymentfor laboratory services will be established at afixed percent of the prevailing fee level (60 per-cent for physicians’ offices and independent lab-oratories, 62 percent for services to hospital out-patients). After 3 years, a national fee schedule,presumably departing from the prevailing charge,will be developed.
The new law expressly forbids physicians frombilling for laboratory services unless they are ac-tually performed in the physician’s office. Physi-cians who conduct their own tests can still choosewhether to accept assignment, but the law con-tains a provision to encourage assignment. Whena physician accepts assignment, Medicare reim-

54 • Federal Policies and the Medical Devices Industry—— — —- ..— .— ———— —— - — . . — . —
bursement will be at 100 percent of the fee sched-ule amount (rather than 80 percent) and the co-insurance and deductible will be waived.
Independent laboratories must accept assign-ment, but Medicare will pay 100 percent of thefee schedule and will waive coinsurance and de-ductible requirements. The handling fee (currently$3) will be available to the physician or labora-tory that collects the specimen.
Overall, Medicare’s payment method for lab-oratory tests encourages physicians to performtests in their own offices, especially when the ex-pected per-test profit exceeds the $3 handling fee(i.e., when the Medicare payment level plus ad-ditional payment by the patient exceeds per-testcosts in physicians’ offices by at least $3). Whetherthis condition is met depends on the technical costsof performing specific tests and the strength ofeconomies of scale in their production.
Tests requiring a heavy fixed investment in cap-ital equipment may be economical only for thehighest volume group practices. But performingtests in physicians’ offices eliminates transporta-tion costs required of outside laboratories and theextra costs associated with laboratory licensurestandards, to which physicians are not obligatedin most States. The recent emergence of simple,inexpensive laboratory equipment and test kitsthat can be operated at a profit at low volumeshas opened up a wide new physicians’ office mar-ket that clinical laboratory equipment manufac-turers are seeking to fill (35).
The encouragement of testing in physicians’ of-fices, although an important new market for man-ufacturers, may not be the most rational use ofhealth care resources for two reasons. First, thereare situations in which the physician has a finan-cial incentive to select the more costly setting. Forexample, suppose the fee schedule rate for a testis $9 and the cost of the test performed in an in-dependent laboratory is $4.50 (including trans-portation), while a physician can produce thesame test at a cost of $5. Under both the old andnew reimbursement methods, the physician hasan incentive to produce the test in-house, regard-less of the higher cost. When it is recognized thatthe physician can refuse assignment on a claim-by-claim basis and charge the patient more than
$9, the financial incentive to perform the test inthe office appears even stronger. Also, by ex-pressly forbidding physicians from billing for serv-ices provided by independent laboratories, thenew law will further strengthen the incentive fortesting in physicians’ offices.
Second, there is suggestive evidence that testsperformed in physicians’ offices maybe of lowerquality than are tests performed by independentlaboratories (132a,183,212). Data from a nationalproficiency testing program conducted by theAmerican Association of Bioanalysts revealed thatphysicians’ office laboratories in the program pro-duced substantially less precise and accurate testresults than did independent laboratories (132a,‘183). However, the introduction of automatedlaboratory technology may improve physicianlaboratory performance in the future.
Medicare’s payment system also encourageshospitals to expand their laboratory services tooutpatients and nonhospital patients. The newprospective hospital payment system, which per-tains only to inpatients, creates strong pressuresfor hospitals to maximize the proportion of theirlaboratory tests conducted on outpatients in or-der to allocate as many costs as possible to (andreap as high revenues from) this less restrictedpayment area. And to the extent that hospitalscan compete for business with independent lab-oratories, this additional source of revenue willfurther help offset the laboratory-associated costs.
However, Medicare’s new laboratory paymentsystem may encourage some hospitals to refer thebulk of their inpatient testing to highly automatedindependent laboratories with competitive pricesin order to reduce inpatient costs. Thus, the roleof the hospital laboratory in the ambulatory lab-oratory testing market appears to be undergoingfundamental changes—with the precise outcomeunknown at this time.
Payment for Medical DevicesUsed in the Home
Medical devices used in the home include a widerange of products—from disposable supplies suchas bandaids, incontinence aids, and pregnancytests, to long-lasting equipment such as wheel-

Ch. 3—Payment Policies for Health Care and Medical Devices ● 5 5— — — — . —
chairs and hospital beds. Third-party coverage ofa device used in the home depends on specificcharacteristics of the device and the patient. Fromthe standpoint of payment, four different kindsof medical devices are:
Self-administered medical devices—devicessuch as bandages, incontinence aids, ther-mometers, blood pressure monitors, or over-the-counter tests. These products are chosenby consumers, not physicians, and mostthird-party payers do not cover them. Thereare some exceptions if the devices are pre-scribed by a physician.Durable medical equipment (DME)–equipment that can stand repeated use; isgenerally not useful in the absence of illness;and is appropriate for use in the home. Thesedevices are generally covered, provided theyare prescribed by a physician.Home health care devices—devices used inconjunction with health care services ren-dered in the home by health care profes-sionals. Medicare and Medicaid cover thesedevices, but their coverage by private in-surers varies.Home renal dialysis devices—equipment andsupplies used to provide home renal dialysisto patients with end-stage renal disease, Thesedevices are covered by Medicare, with sup-plementary coverage provided by some pri-vate insurers.
Self-administered medical devices, if orderedwithout a prescription, are rarely covered bythird-party payers; consequently, they can be con-sidered traditional consumer goods and will notbe discussed in detail except to note that the lackof insurance coverage for such devices puts themat a disadvantage relative to devices provided byphysicians or other professionals. If these devicesare ordered by prescription, they are sometimescovered under insurance policies, usually to thesame degree that devices provided in a physician’soffice would be covered. Self-administered deviceswill be demanded if their purchase price and theconvenience they represent is competitive with theout-of-pocket costs and convenience of usingalternative devices that are covered by third-partypayers.
Renal dialysis devices used in the home areunique in that they are covered, by a uniformMedicare payment system: Medicare’s End StageRenal Disease (ESRD) program. Since 1972, Medi-care benefits have been available to all patientsregardless of age. The effect of the payment sys-tem on the kinds and prices of available dialysisequipment and supplies, as well as on the settingsin which they are used, has been profound. A sep-arate case study prepared for this report exam-ines hemodialysis devices in detail (see box E)(260).
The two other kinds of devices—durable med-ical equipment and devices provided as part ofhome health care services—raise some interest-ing issues for Federal payment policy and are dis-cussed in detail below.
Payment for Durable Medical Equipment
Hospital beds, wheelchairs, oxygen and itsrelated equipment, canes, and crutches are ex-amples of DME. The Inspector General of DHHShas projected total national (public and private)expenditures for DME to reach $1.26 billion to$1.58 billion in fiscal year 1985 (160). In 1982,Medicare outlays for DME were about $310 mil-lion (158), up almost 150 percent from $125 mil-lion in 1979 (333).
These estimates do not include durable equip-ment provided to Medicare patients as part ofhome health services, estimated at about $19 mil-lion in 1982 (158). Table 20 shows the distribu-tion of spending for various types of DME by asample of Medicare beneficiaries in 1977. Inter-estingly, oxygen and oxygen equipment alone ac-counted for 46 percent of total expenditures forrental and purchase of DME. Medicare expendi-tures for DME may increase even more with theadvent of DRG payment for hospitals. The incen-tive for hospitals to discharge patients early to thehome may lead to greater use of DME in therecovery period.
DME is a distinct benefit category under Medi-care’s Supplementary Medical Insurance program(Part B of Medicare). Medicare generally covers80 percent of the “reasonable” charge or cost of
Box E.—Medicare Payment for Renal Dialysis: Effect on Medical Devicesl
End-stage renal disease (ESRD) afflicts about 83,000 people in the United States (98). In the courseof treatment for this disease, most patients and their providers use an array of products produced bythe hemodialysis equipment and supplies industry. This industry is relatively new. Its whole existenceis a consequence of modern medical advances that have made hemodialysis a viable treatment for ESRD.
For patients with ESRD, the major alternative to kidney transplantation is dialysis, which offersan artificial mechanism for performing kidney functions. In hemodialysis, blood is pumped from thepatient’s body, subjected to a process of dialysis, and then returned to the body in a continuous ex-tracorporeal bIood loop. Patients on hemodialysis are typically dialyzed three times per week, for ses-sions ranging from about 3½ to 5 hours each. These patients can be dialyzed at home or in hospital-based or freestanding dialysis facilities or centers. Hemodialysis was the treatment for about 89 percentof the patients with ESRD in 1982 (98).
Another form of dialysis, peritoneal dialysis, has been increasing in popularity in recent years. Inperitoneal dialysis, the process of dialysis occurs within the patient’s body rather than via an extracor-poreal blood loop. Continuous ambulatory peritoneal dialysis (CAPD) involves a continuous dialysisprocess and frees the patient from dependency on a machine. Used by about 10 percent of the ESRDpopulation in 1982, CAPD is the most popular form of peritoneal dialysis (98).
Since July 1973, the Medicare program has covered about 93 percent of the ESRD patient popula-tion (78). ESRD patients are enrolled under Parts A and B of the Medicare program+ Part A (HospitalInsurance) covers the reasonable and necessary services received in a participating facility, includinginpatient dialysis. ESRD patients generally receive dialysis on an outpatient basis, covered by Part B{Supplementary Medical Insurance). Under Part B, ESRD beneficiaries pay a monthly premium and areentitled to payment of 80 percent of reasonable charges or costs above a deductible. Patients are respon-sible for the remaining 20 percent of charges.
Home dialysis has been covered under this same basic arrangement. Medicare pays 80 percent ofallowed costs for supplies and equipment and physicians’ services above the deductible. Since 1978, ifthe patient obtained home dialysis and equipment from an approved facility that reserved the equip-ment for the exclusive use of patients on home dialysis, the 20-percent coinsurance requirement has beenwaived.
In establishing the actual levels of payment for dialysis, the Medicare program had few precedents.The early decision was to pay 80 percent of the average cost to a hospital-based dialysis facility, and80 percent of the reasonable charges for a freestanding dialysis facility up to a screen (or limit) of $133per treatment. If routine laboratory services were included, the screen was raised by an additional $5;if the supervisory services of a physician were included in the facility’s costs, the screen was increasedby $12, to $150. These rates were in effect from 1974 until August 1983, when they were supplantedby a new reimbursement method.
In 1982, prior to the new rules, nearly all freestanding facilities were being paid at the rate of $138per treatment (78}. Most hospital-based facilities requested and were granted exceptions to the screen,on the grounds that their costs were higher; the average hospital-based payment in 1982 had risen toapproximately $170 per treatment (78,356).
Under the old system, physicians could choose from one of two systems of payment: the initialmethod and the alternative reimbursement method. Under the initial method, reimbursement for super-visory care was paid to a facility as part of its reimbursement rate. Other nonsupervisory services werepaid on a fee-for-service basis. Under the alternative method, physicians were paid a comprehensivemonthly fee per patient. For patients dialyzed in facilities, this fee was based on a calculation of thecustomary or prevailing charges for a followup visit, multiplied by 20. For supervision of home patients,the weighting factor was set at 14 rather than 20, to reflect the. presumed lower requirements of homepatients for physician supervision.

Ch. 3—Payment Policies for Health Care and Medical Devices ● 5 7— —— —.. —
this equipment, subject to the annual deductibleamount. In practice, the reasonable charge isdetermined by the CPR method described in sec-tions above. The allowed rate of payment for aparticular item of DME is the minimum of theDME supplier’s actual charge, the supplier’s cus-tomary charge (the median of supplier’s own pastcharges) or the prevailing charge, defined as the75th percentile of all purchase or rental chargesfor the particular device in the locality during thepreceding year. 13
l~rhe DME reimbursement system IS currently under scrutiny byHCFA and the General Accounting Off Ice for Its effects on users’decisions whether to purchase or rent equlrlmen+ (92, 156,157,237
If the supplier agrees to accept the Medicare rea-sonable charge as payment in full (i. e., acceptsassignment), then the Medicare enrollee is liableonly for his or her 20-percent coinsurance plusany deductible owed. But if the supplier does notaccept this payment, the beneficiary must pay thedifference between the reasonable charge and the
33.+ I incer ~ alnty about the duration of use of DME IS inherent inthe )at urt . It the service, but Medicare’s current system of payment~)ro~ i(le~ ~naciequate incentives for users to purchase equipment, evenwh( n ~ I i> t,lirl v clear that such a decision would cost Medicare lessth~r rtmtal Although the issue has important implications for Medi-( arc ex[wn( i It [ires, it does not influence choices among devices ort,n( \T er,~: I I at(: of use of devices m any fundamental way and is~11)’ i \( L \ ! i n this report
25-406 0 - 84 - 5
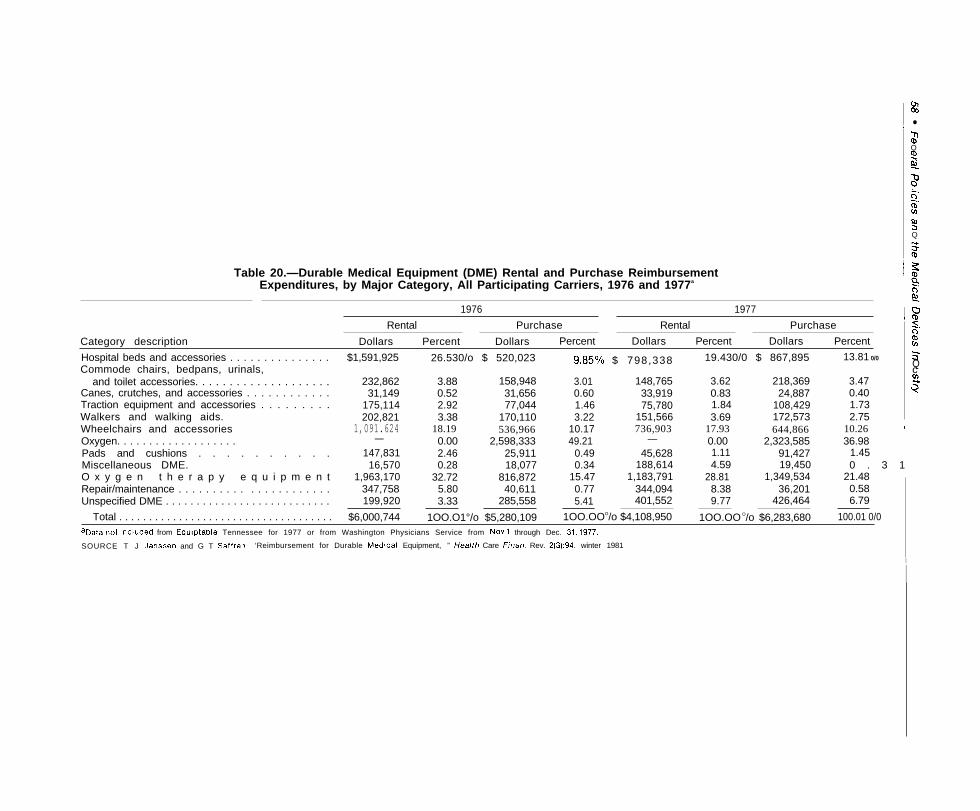
I m03
●IJ1Qmg
$.-.0-.CDv)
m3Q
$
Table 20.—Durable Medical Equipment (DME) Rental and Purchase Reimbursement i $
Expenditures, by Major Category, All Participating Carriers, 1976 and 1977a Is
~ 51976 1977 ~:
Rental Purchase Rental Purchase 7
Category description
-.0
Dollars Percent Dollars Percent Dollars Percent Dollars Percent mCnHospital beds and accessories . . . . . . . . . . . . . . . $1,591,925 26.530/o $ 520,023 9“85°/0 $ 798,338 19.430/0 $ 867,895 13.81 0/0 s
Commode chairs, bedpans, urinals, Qcand toilet accessories. . . . . . . . . . . . . . . . . . . . 232,862 3.88 158,948 3.01 148,765 3.62 218,369 3.47
Canes, crutches, and accessories . . . . . . . . . . . . 31,149 0.52 31,656 0.60 33,919 0.83 24,887 0.40 $Traction equipment and accessories . . . . . . . . . 175,114 2.92 77,044 1.46 75,780 1.84 108,429 1.73Walkers and walking aids. 202,821 3.38 170,110 3.22 151,566 3.69 172,573 2.75Wheelchairs and accessories 1,091.624 18.19 536,966 10.17 736,903 17.93 644,866 10.26 IOxygen. . . . . . . . . . . . . . . . . . . — 0.00 2,598,333 49.21 — 0.00 2,323,585 36.98 ~Pads and cushions . . . . . . . . . . 147,831 2.46 25,911 0.49 45,628 1.11 91,427 1.45 I
Miscellaneous DME. 16,570 0.28 18,077 0.34 188,614 4.59 19,450 0 . 3 1O x y g e n t h e r a p y e q u i p m e n t 1,963,170 32.72 816,872 15.47 1,183,791 28.81 1,349,534 21.48Repair/maintenance . . . . . . . . . . . . . . . . . . . . . . 347,758 5.80 40,611 0.77 344,094 8.38 36,201 0.58Unspecified DME . . . . . . . . . . . . . . . . . . . . . . . . . . . 199,920 3.33 285,558 5.41 401,552 9.77 426,464 6.79
Total . . . . . . . . . . . . . . . . . . . . . . . . . . . . . . . . . . . . $6,000,744 1OO.O1°/o $5,280,109 1OO.OOO/o $4,108,950 1OO.OO O/o $6,283,680 100.01 0/0aData not included from Equlptable Tennessee for 1977 or from Washington Physicians Service from NOV 1 through Dec. 31, 1977.
SOURCE T J Janssen and G T Saffran, ‘Reimbursement for Durable Med!cal Equipment, ” F/ea/th Care Finan. Rev. 2(3):94, winter 1981
I
I

Ch. 3—Payment Policies for Health Care and Medical Devices ● 5 9— — . . -. . ——————-——
actual price of the equipment. The decision whetherto accept assignment rests with the supplier ona case-by-case basis.
In addition to being generally inflationary,Medicare’s CPR pricing system creates particu-lar problems in localities with only one or a fewsuppliers of DME. A high-priced supplier with atleast 25 percent of the locality’s market for a par-ticular kind of DME can unilaterally determinethe prevailing charge and thus manipulate its pay-ment rate (237). The only deterrent to such be-havior is the 20-percent coinsurance rate, whichmay make some consumers sensitive to the pricecharged. But in localities with just one or two sup-pliers, this price sensitivity is bound to be low.
Some observers have noted the potential im-pact of Medicare’s hospital DRG payment systemon the suppliers of DME (154). Under DRG pay-ment, hospitals have an incentive to become sup-pliers of services and products that are subject toless restrictive payment. One potential is for theseinstitutions to become DME suppliers. Having abuilt-in referral base of patients would facilitatethis kind of service integration.
The net effect of competition from hospitals onDME prices is unknown, but it could conceivablycause price cutting by freestanding suppliers in anattempt to maintain their market share. However,the sensitivity of patients to changes in DMEprices may be low because the effective coinsur-ance rate for DME in 1977 was estimated at 26percent (237). Independent suppliers appear to beconcerned about the possible effects of competi-tion from hospitals with a “captive” market (161)and have suggested that Medicare require hospi-tals to provide patients with information on in-dependent suppliers.
Payment for Home Health Care Services
Home health care services are defined as serv-ices that require professionally trained personnel(e.g., nursing, physical therapy) and are deliveredto patients in the home. To some extent, homehealth care substitutes for institutional care pro-vided in hospitals and nursing homes, but in partit is also a service that substitutes for care thatwould otherwise be provided by family, friends,or patients themselves. Since medical devices are
commonly used in the delivery of these services,the recent rapid growth in the use of home healthcare services will affect the kinds of devices thatwill be demanded.
Although there are no precise data on histori-cal trends in the total use of home health care serv-ices throughout the country, data are availablefor use by Medicare and Medicaid beneficiaries.From 1974 to 1982, the number of home healthvisits to Medicare beneficiaries increased by 247percent, from 8.1 million visits in 1974 to 28.1million visits in 1982 (159). In the same period,Medicare reimbursements to home health agen-cies—organizations that provide home health careservices—grew from 1.2 to 2.5 percent of totalMedicare reimbursements, or $1.2 billion in 1982.Approximately 4 percent of those reimbursementswere for equipment, appliances, and nonroutinesupplies offered as part of home health care visits(136), and 28 percent can be attributed to non-labor costs (310). Medicaid expenditures for homehealth services were almost $500 million in 1982(399).
Table 21 estimates national home health careexpenditures by source in 1981. Since the dataunderlying these estimates are imprecise, the tableshould be considered only as a general descrip-tion of the relative importance of various fund-ing sources. Almost 60 percent of home healthcare expenditures are paid for directly by patients.Medicare and Medicaid account for another 19percent of such expenditures, and private inser-
table 21.—Estimated Home Health CareExpenditures and Percent
Distribution by Source, 1981. . ——
Dollar amount Percent(billions)— ——— . of total
Patient direct payments . . . . . . $3.8 58.5%Medicare . . . . . . . . . . . . . . . . . . . 0.9a 13.9
(Federal) . . . . . . . . . . . . . . . . . .(State) . . . . . . . . . . . . . . . . . . . 0 . 3 (3.1)
Other government . . . . . . . . . . . 4.6Private health insurance . . . . . 1.1b
16.9b
Philanthropy . . . . . . . . . . . . . . . . 0.1 1.5Total . . . . . . . . . . . . . . . . . . $6.5 100.00/0——..—..—.
~rhls (S an understatement because it includes approximately one-tenth Oft?xpend It ures provided through hospital-based home health care services.
bA proxy was used for expenditures for “home health Care.” The proxy used,reimbursement for “other payment services;’ generally reflects government andpatient direct payments for home health care, but may not accurately reflectprivate health insurance coverage, which is probably much lower than the 16.9percent Indicated in the table.
SOURCE R M. Gibson and D. R. Waldo, C’National Health Expenditures, 1981:’Health Care Finan, Rev. 4(1):1-35, September 1982

60 • Federal Policies and the Medical Devices Industry— . — ——
ance for less than 17 percent. These data are for1981, before expanded Medicare home healthbenefits as mandated by the Omnibus BudgetReconciliation Act of 1980 (Public Law 96-499)were implemented. Medicare’s share of homehealth care expenditures may have increased sincethen.
The number of home health agencies has growndramatically in the past 3 years alone. Table 22shows the number of Medicare-certified homehealth agencies by type in 1979, 1981, and 1982.Substantial growth occurred in the number of pro-prietary agencies serving Medicare patients. Partof the reported growth between 1981 and 1982does not represent development of new agenciesbut is an artifact of the liberalization of Medicare’spolicy regarding certification of proprietary agen-cies that went into effect in October 1981 pursuantto the Omnibus Budget Reconciliation Act of1980. But even between 1979 and 1981, when pro-prietaries were unable to participate in Medicarein certain States, the number of these agenciesserving Medicare patients grew by almost 75percent.
Medicare will pay for home health services topatients who are homebound, under the care ofa physician, and requiring part-time or intermit-tent skilled nursing care or physical or speech ther-apy. There are no deductibles or coinsurance re-quired of the beneficiary, and since 1980, thereare no limits on the number of visits the benefici-ary can receive during any year. Medicare reim-burses home health agencies on a reasonable costbasis, much the same as the Medicare inpatient
hospital reimbursement method prior to the in-troduction of DRG payment. In the recent past,attempts to control Medicare outlays for homehealth services have centered on two strategies:1) tight control over eligibility for home healthcare services, and 2) imposition of per-visit limitson rates of reimbursement to home health agencies.
To be eligible for home health care benefits, thepatient must require “intermittent” skilled nurs-ing care. The definition of skilled nursing caredepends on the licensing requirements of the in-dividual States; usually it means a person witha Registered Nurse or Licensed Visiting Nurse orequivalent degree, The definition of “intermittent”has been the major avenue for control. HCFA hasrecently interpreted it to mean a requirement forup to two or three visits per week and less than8 hours in any one visit. Daily visits by a skillednurse are reimbursed only if a physician affirmsthat such frequent visits will not be necessary formore than 2 or 3 weeks (74). The idea is that ifa patient needs daily care, he or she should be ina skilled nursing home, even if the person wouldprefer to stay at home, because it is less expen-sive (162).
Medicare does not provide home health carebenefits to patients who receive total parenteralor enteral nutrition therapy at home. But, since1 977, Medicare has covered these services underits prosthetic device benefit (Part B), which cov-ers all nutrients, equipment, and supplies. HCFAhas interpreted the prosthetic device benefit as re-quiring the patient to have severe and permanentimpairment and as not covering the nursing serv-
Table 22.—Medicare-Certified Home Health Agencies by Type of Agency———
D e c e m b e r - September DecemberType of agency 1979 1981 1982
Visiting nurses association . . . . . . . . . . . . .-—.—511 . -
513 517Combination (government/voluntary) ... , 50 55 59Government . . . . . . . . . . . . . . . . . . . . . . . 1,274 1,234 1,211Rehabilitation center based , . . . . . . . . . . . . NAa
11 16Hospital based . . . . . . . . . . . . . . . . . 349 432 507Skilled nursing home based . . . . . . . . . . . . NAa
10 32Proprietary . . . . . . . . . . . . . . . . . . . . . 165 287 628Private nonprofit . . . . . . . . . . . . . . . . . . . . . 44.3 547 632Other . . . . . . . . . . . . . . . . . . . . . . . . . . . . . . . . 66 38 37— —. .aNA indicates information not available; hwne agencies in these ategories were classified as “other” in 1979.
SOURCES 1979 data: U.S Department of Health and Human Se vices, Health Care Financing Administration, Off Ice ofResearch and Demonstration, Medicare: Use of Home 1~ea/th Serv/ces, 1980, prepared by Kathryn D. Barrett, July1983 draft 1981, 1982 data: Home Hea/fh Line,28, Feb 4 1983
“Char) ~lng Face of Medicare Home Health” (table), VOI Vlll, p.

Ch. 3—Payment Policies for Health Care and Medical Devices ● 6 1——— —.- . — —
equipment and supplies, and also discriminateagainst patients requiring home health care as wellas nutrition services (153). (See box F for a de-scription of the parenteral and enteral nutritionmarket. )
Control over rates of reimbursement to homehealth agencies was initiated in 1981 (310) andtightened again in 1981 and 1982. The control wasin the form of limits on per-visit routine costs ofhome health agencies. At present, all home healthagencies are subject to a per-visit limit set at the75th percentile of costs of freestanding agencies,weighted by the mix of visits made (skilled nurs-ing, physical therapy, home health aids) and theurban or rural location of the agency. The costof medical equipment, appliances, and suppliesthat are not routinely furnished in conjunctionwith patient care visits are not subjected to thelimits.
The reimbursement limits have several inherentincentives. The most obvious is for the homehealth agency to “unbundle” its supplies fromroutine categories to nonroutine categories, whichare not subject to payment limits. The second isto substitute nonroutine equipment, appliances orsupplies for routine nursing or other serviceswhenever possible. Third, the agency has no in-centive to consider price in decisions to purchasenonroutine items. The ultimate effect of theselimits is probably to increase the use and cost ofmedical devices in home health care.
that are routinely furnished in conjunc-tion with patient care visits and are directly identifiable services toan Individual patient must meet the following criteria: 1) the com-mon and established practice of home health agencies in the areais charge separately for the item; 2) the agency follows a consist-ent charging practice for both Medicare and non-Medicare patientsreceiving the item; 3) generally, the item is not frequently furnishedto the patient; 4) the costs can be identified and accumulated in aseparate cost center; and 5) the item is furnished at the directionof the patient’s physician and is specifically identified in the planof treatment (310).

62 ● Federal Policies and the Medical Devices Industry

Ch. 3—Payment Policies for Health Care and Medical Devices ● 6 3
THE FINANCIAL RELATIONSHIP BETWEENTHE THIRD-PARTY PAYER AND PROVIDERS
The vast majority of health care services in theUnited States are delivered by private providers—hospitals, physicians, and other professionals andinstitutions—who are organizationally and finan-cially independent of the third-party payer. Asdiscussed above, these providers bill either the pa-tient, the third-party payer, or both and are paidsome proportion of their costs or charges, depend-ing on the payment methods and policies of thethird-party payer. This fee-for-service system paysproviders more when more services are delivered.Except for those services whose level of paymentis below their cost,15 the provider- iS financiallyrewarded by providing more services. Althoughthe third-party payer can attempt to control theuse of services through regulatory means, such
15T’here are SeVera ] reasons w hy the lev~’1 <lt payment might be
below the cost of providing a service t) ,i ~lven patient. First, thecost of providing the service might vary t andomly around somemean level, thus leading to losses on some p~tients which are madeup for by profits on others. Second, the service might be a “loss-Ieader, ” deliberately priced low to enc(~ur,ige utilization of other,more profitable services. Third, the prov]der may be required tooffer some services below cost as a conditl ~n for providing othersto a third-party payer’s beneficiaries>
as I utilization review, the provider has a generalincentive to deliver more individually billableservices.
There are two exceptions to this fiscal independ-ence of payer from provider. First, for health serv-ice: that are provided directly by the governmentin publicly owned and operated facilities, thepayer and provider are integrated in the same en-tity. The VA’s system of hospitals, nursing homes,and outpatient clinics is an example of an in-tegrated health care system that is relatively closedand publicly funded and operated. Second, asmall but growing proportion of the populationis enrolled in per capita insurance plans.
Public Systems
Whether the patterns of use of health care serv-ices and hence, of the devices on which manyof them depend are substantially different in pub-licly operated and budgeted facilities is a matterfor empirical investigation. There is some circum-stantial evidence suggesting that the rate of adop-tion of certain new medical devices has been

64 • Federal Policies and the Medical Devices Industry— — —- —.—— —— —— — —.———— ——
slower in VA hospitals than in the civilian healthcare sector, but differences between public andprivate administration confound the comparison.VA hospitals adopted CT scanners much moreslowly than other hospitals of comparable size.In 1980, almost 85 percent of all community hos-pitals of 500 beds or more had at least one CTscanner, whereas only 25 percent of VA hospi-tals of comparable size had adopted CT scanning(349).” In the remaining hospitals, the VA con-tracted with civilian hospitals for provision of CTprocedures.
The rate of use of therapeutic apheresis also ap-pears to be substantially lower in VA hospitalsthan in the civilian sector, although no compari-sons by type of patients treated are available topursue the reasons for the difference (350). Astudy conducted in the early 1970s of hospitals’adoption of respiratory therapy techniques andelectronic data processing found that Federal hos-pitals adopted these technologies more widelythan non-Federal hospitals, but the study did notcontrol for hospital size, the population served,and other important differences between Federaland non-Federal hospitals (187). (Federal hospi-tals on average are much larger than non-Federalhospitals.)
Per Capita Payment Systems
The second exception to the fiscal independenceof payer and provider covers a small but grow-ing proportion of the population (5.8 percent inJanuary 1984 (170)) enrolled in health mainte-nance organizations (HMOs). For a fixed per cap-ita payment, HMOs provide comprehensive butspecified covered medical services through a definedset of physicians and hospitals (346). An HMOmay either employ or contract with physicians toprovide the covered services. If the relationshipis contractual, it may be on a basis other than sim-ple fee-for-service. Although an HMO may ownits hospital, almost all contract with selected hos-pitals and other facilities to provide services totheir enrolled members. Since the HMO mustcompete with other insurers, it has an incentiveto keep premiums competitive with them. HMOs
lbMost VA medical centers, for example, include chronic care beds,whereas most community hospitals do not.
are also organizationally well suited to limitingcosts by controlling the use of covered services.
There is strong evidence that enrollees of pre-paid group practices, a type of HMO organizedaround a medical group practice, have lower ratesof hospitalization than other plans. In a reviewof HMO experience, Luft concluded that enrolleesin prepaid groups had about 30 percent fewer hos-pital days, mainly because of lower admissionrates rather than shorter lengths of stay (198). Butstudies of HMOs organized around contracts withindependent physicians, frequently referred to asindividual practice associations (IPAs), do notsupport the contention that these have lowerhospitalization rates when differences among pa-tient characteristics are considered (346). In gen-eral, IPAs and other HMOs appear to have lowerrates of surgery than fee-for-service plans (346).
The lower rates of hospitalization in prepaidgroups would, of course, lower the use of medi-cal supplies and equipment in the hospital. Sur-gical supplies and equipment, in particular, wouldneed to be bought less frequently under an HMOpayment system. Of course, to some extent re-ductions in the use of hospital devices may beaccompanied by more intensive use of device-embodied procedures during ambulatory carevisits,
The net effect of these shifts has not been stud-ied, but it is likely that the direct impact of HMOsto date on the medical devices industry or anyof its segments is probably small .17 Although thecompetitive effect of HMOs on the behavior ofother private insurers could reduce the rate of useof health services more generally in the commu-nity, particularly in those metropolitan areaswhere HMOs have a significant share of the in-surance market, there is no convincing evidencethat such an effect has occurred (198). This re-sult is not surprising considering that HMOs, aswell as other plans, have been operating in anenvironment where the buyers of health insurance
---- .—“AS of January 1984, 5.8 percent of the civilian population was
enrolled in HMOS, and in 1981, about 84 percent of HMO enrolleeswere In prepaid group practices (170). If prepaid group practicesaccount for a 30-percent reduction in days of stay per capita, theexistence of prepaid group practices is responsible for at most a re-ducti{~n of 1..s percent in total patient days.

Ch. 3—Payment Policies for Health Care and Medical Devices ● 6 5. .
and medical care are insulated from market pres-sures to be efficient.
The appeal of HMOs and other prepaid plansis that they hold promise for more careful assess-ment of all inputs into the production of healthcare services, including devices. HMOs have in-centives to provide care in the most efficient andcost-effective manner, using the best mix of re-sources to accomplish that purpose. But there are
also pitfalls. HMOs have an incentive to enrollhealthy members of the population whose medi-cal care is less costly to provide. Such practicesalso have a financial incentive to provide as fewservices as possible to their enrollees. As long asHMOs exist in an environment in which they mustcompete for members, however, the tendencytoward underprovision of services maybe limited.
DISCUSSION AND POLICY OPTIONSThis chapter has examined the relationship of
third-party payment, particularly Medicare, to theoverall size of the medical devices market and thekinds of medical devices that are likely to bebought and used. In the traditional fee-for-servicesector of U.S. health care, the decision to covera particular device and the methods used to de-termine the amount of payment appear to influ-ence the demand for devices.
The methods used to determine levels of pay-ment for devices or device-embodied medical serv-ices have influenced their adoption and use inways that will increase society’s cost without ade-quate concern for benefits. In particular, the rea-sonable charge approach used by Medicare for allPart B services creates problems in several areas.With physicians’ services it tends to favor newdevice-embodied procedures over traditional tech-nologies and office visits, with inadequate regardfor their relative cost effectiveness. For laboratorytesting, the CPR mechanism tends to encouragelaboratory testing in physicians’ offices. And fordurable medical equipment, suppliers with a highshare of the market may be able to manipulatepayment rates.
Although cost-based reimbursement of hospi-tals is being largely discarded by Medicare, andmay soon disappear for other payers as well, thecontinuation of cost-based reimbursement of hos-pital capital tends to favor medical equipmentover other kinds of resources used in the deliv-ery of hospital services. In addition, the cost-basedsystem continues to apply to Medicare homehealth services, creating incentives to use medi-
cal devices (as well as other inputs to home healthservices) that may be socially inefficient. AlthoughMedicare has instituted limits on per-visit costs,they do not include nonroutine supplies, equip-ment, and appliances provided as part of a phy-sician’s plan for home health services. Thus, thereare additional incentives for home health care tobecome too device-intensive over time.
It appears that the manufacturers of medicaldevices may be responsive to changes in third-party payment policy, particularly Federal pay-ment policy, in the kinds of devices that are madeand the prices at which they are sold. Even in con-centrated markets, such as that for hemodialyzers,manufacturers appear to have been responsive tomarket pressures by reducing prices or improv-ing products to enhance their productivity (260).The recent introduction of Medicare’s DRG pay-ment system may lead to substantial changes inthe kinds of devices that are marketed to hospi-tals. The ultimate impact of these changes on thetotal market for medical devices is, of course,unknown—as are their ultimate effects on thequality and costs of medical care.
The problems discussed above can be addressedon a piecemeal basis by altering details of third-party payment methods, or they can be addressedby broader reforms of the payment system. Theoptions discussed in this section begin with thoseaddressing specific issues raised in four areas ofpayment: clinical laboratory services, home healthservices, physicians’ services, and hospital serv-ices. Options related to more fundamental changesin the health care payment system are then dis-cussed

66 ● Federal Policies and the Medical Devices Industry— ———. —— . — .
Payment for Laboratory Testing
Physicians have financial incentives to orderand perform clinical laboratory tests in their of-fices. The solution to this situation is the devel-opment of payment methods with neutral finan-cial incentives for physicians to order diagnosticprocedures and to select the least costly settingsof test performance.
Option 1: Mandate that Medicare establish a lab-oratory fee schedule with mandatory assign-ment for all providers.
Medicare’s new fee schedule for laboratory
services lowers Medicare’s payment for tests, butit may strengthen physicians’ financial incentivesto conduct laboratory tests in their own offices,even when office tests are more costly than testssent to independent laboratories.
A fee schedule system that on the one hand re-quires mandatory assignment of laboratory claimsby physicians and on the other allows the physi-cian to bill for services even when they are pro-vided by outside laboratories would give physi-cians a financial incentive to perform their ownlaboratory tests only when the tests are less costlyto perform in the office than in an outside lab-oratory.
The fee schedule could be based on the pricetypically charged by laboratories to physicians.This price is usually competitive, especially inmetropolitan areas.
This option would eliminate incentives to per-form tests in physicians’ offices when they aremore costly than sending them out, but it wouldnot necessarily eliminate the financial incentivethat physicians have to increase test ordering. Ifthe physician must accept assignment, whethera test is profitable will depend on the differencebetween the fee allowed by Medicare and thelowest cost at which the physician can providethe service. Careful and constant attention wouldneed to be given to the relationship between pricesof tests and efficient production of laboratoryservices because some tests will continue to beprofitable and others may become profitable asnew technologies reduce laboratory costs.
Option 2: Mandate that Medicare experiment withother alternatives to the reasonable chargemethod for clinical laboratory services.
A national fee schedule is just one of the alter-natives to the reasonable charge methodology forclinical laboratory services. For example, competi-tive bidding, negotiated rates of payment, andmaster contracts have been discussed or imple-mented by State Medicaid agencies. At present,there is insufficient evidence to assess which ofthese or other approaches is the most effective ap-proach to purchasing laboratory services forMedicare beneficiaries.
The 1981 Omnibus Budget Reconciliation Act(Public Law 97-35) authorized States to enter intocompetitive bidding or other similar arrangementsto procure laboratory testing for Medicaid popu-lations. A State must demonstrate that laboratoryservices will be adequate, that selected labora-tories will be Medicare-certified, and that no morethan 75 percent of the business of the winning lab-oratory is reimbursed by Medicare and Medicaid.To date, only Nevada has implemented competi-tive bidding for laboratory services (120).
California is considering development of a“master contract” with terms spelled out and reim-bursement rates set. The contract would be of-fered to any licensed or certified laboratory wish-ing to provide services to California Medicaidenrollees.
HCFA has had under consideration severaldemonstration projects to test varying methodsof laboratory reimbursement. HCFA plans to testfour different procurement approaches throughdemonstration projects: payment rates establishedby negotiation with laboratories; fee setting byHCFA without negotiation; competitive biddingwith laboratories eligible to provide services aslong as they agree to accept the price of the win-ning bid; and competitive bidding with only win-ning bidders eligible to provide Medicare testing.Currently, HCFA is awaiting the report of a con-tractor for design of a competitive bidding meth-odology (120). It remains to be seen whether thedemonstration will actually be undertaken.
The Administration has proposed legislation toauthorize the Secretary of Health and Human

Ch. 3—Payment Policies for Health Care and Medical Devices ● 6 7— ——— . — — - - — —
Services to purchase Medicare laboratory serv-ices by competitive bidding, negotiated paymentrates, or exclusive contracts with laboratories (S.643, H. 2576). Because little is known about thefeasibility or impact of these approaches, it seemspremature to engage in them on a nonexperimen-tal basis.
Payment for Devices Used in the Home
Medicare reimburses for medical devices usedin the home through the durable medical equip-ment benefit (Part B), the prosthetic devices ben-efit (Part B), and the home health services bene-fit (Parts A and B). ” There are several problemsin existing payment methods that may affect thekinds of devices that are used and the prices atwhich they are offered. Moreover, lack of coordi-nation among these benefit categories createsanomalies in payment for different patients usingthe same devices.
Option 3: Mandate that Medicare include in per-visit payment limits on home health servicesthe cost of nonroutine equipment and supplies.
Cost-based reimbursement of home health careservices creates problems of inflation and inap-propriate use of all inputs, including devices. Forthis reason, Congress has authorized DHHS tolimit per-visit rates of reimbursement for routineservices to the 75th percentile of the costs of free-standing agencies (those not affiliated with insti-tutions) in similar circumstances. At present, how-ever, the cost of medical equipment, appliances,and supplies that are not routinely furnished inconjunction with patient care visits are not sub-ject to the the limits. This exclusion creates in-centives for agencies to “unbundle” their suppliesfrom routine categories to nonroutine categoriesand to substitute nonroutine equipment, appli-
leThe MediCare Program has two parts: Part A, the Hospital In-surance program; and Part B, the Supplementary Medical Insur-ance plan. Part A’s primary purpose is to provide protection againstthe costs of inpatient hospital care. Other Part A benefits includeposthospital extended care services, home health services, and in-patient alcohol detoxification services. Part B services include phy-sician services, outpatient hospital services, outpatient physical ther-apy, and other ambulatory services and supplies, such as prostheticdevices and durable medical equipment. Part B also covers homehealth services for those Medicare beneficiaries who have only PartB coverage (345).
ances, or supplies for routine nursing or otherservices whenever possible. Moreover, a homehealth agency has no incentive to consider pricein decisions to purchase nonroutine items.
Integrating nonroutine items into the per-visitlimits would eliminate these problems, but itwould also increase the already existing incentivesfor home health agencies to select as clients pa-tients whose need for such items is relatively low.Without a reliable measure of case severity, thepotential for such patient selection strategieswould probably be high. Therefore, an importantpriority for research would be development of apatient classification system for home care simi-lar to the DRG system used for hospitals. Eventhen, there is the question of whether home healthagencies are large enough to spread the risk ofenrolling patients with high equipment needsacross a large enough pool of patients.
Option 4: Encourage Medicare to experiment withalternatives to reasonable charge reimbursementof durable medical equipment (DME).
As with other Part B services, the use of rea-sonable charge screens—maximum limits on theamount Medicare will pay based on comparativeprofiles of suppliers’ actual charges—for DMEprobably raises the prices paid for such equip-ment. Medicare’s CPR pricing system for DMEcreates particular problems in localities with onlyone or a few suppliers of DME, where a high-priced supplier with at least 25 percent of thelocality’s market for a particular kind of DME canunilaterally determine the prevailing charge andthus manipulate its payment rate.
Possible alternatives to the CPR pricing systemwould be national or regional price ceilings andcompetitive bidding by suppliers. As yet, thereis no experience with either of these approaches,so it is unknown how they would affect the avail-ability or prices of DME. Price ceilings based inthe beginning on regional or national averageprices and adjusted for general inflation over theyears would tend to raise prices charged by low-priced suppliers while at the same time loweringthose of high-priced suppliers. It might also re-duce the access of Medicare beneficiaries, particu-larly those with low incomes, to DME if assign-

68 ● Federal Policies and the Medical Devices Industry. —
ment rates were to drop as a consequence of theceilings or if suppliers in high-cost localities wereto find it unprofitable to serve Medicare benefi-ciaries.
Unless this approach were adopted in conjunc-tion with a requirement that suppliers of DMEbeneficiaries accept assignment or elimination ofthe 20-percent coinsurance requirement for thoseaccepting assignment, the drop in assignment rateswould cause part of the burden of expenditure toshift from Medicare to the beneficiary.
Competitive bidding by suppliers would bemost useful in areas with a reasonably large num-ber of potential suppliers. The details of a com-petitive bidding strategy are important in deter-mining the effect on availability and prices ofDME. One approach would be a Medicare re-quirement that all DME rentals or purchases ina locality be made through the two or three low-bidding suppliers. This approach would probablybe successful in driving down prices in the nearterm, but it has certain drawbacks. First, the bid-ding would have to be on a product-by-productbasis, and it would be impractical to require a ben-eficiary to use a different supplier for each devicebought. Second, the approach could lead to a re-duction in the number of suppliers, with conse-quent increases in prices by remaining suppliersin subsequent years.
The effect of any of these approaches on theprice and availability of DME to Medicare bene-ficiaries could be studied in the context of dem-onstrations or experiments.
Option 5: Extend Medicare home health bene-fits to individuals on parenteral or enteral nu-trition.
Medicare currently refuses to provide homehealth care benefits to patients who receive athome total parenteral or enteral nutrition ther-apy—methods of direct feeding through the blood-stream or gut. Since 1977, Medicare has coveredthese services as a Part B benefit under prostheticdevices. HCFA has interpreted the prosthetic de-vice benefit as applying only to patients with per-manent impairment and as excluding any nurs-
ing services. However, as part of training andadjustment for home parenteral and enteral nu-trition, nursing services may be required. Patientsmust receive these services at outpatient depart-ments for nursing services to be reimbursed.
The effect of this regulation is to limit parenteraland enteral nutrition benefits to ambulatory pa-tients with permanent need for the technology.It might be possible to shift patients out of hos-pitals into home care settings if these restrictionswere lifted. However, if home health benefits wereextended to patients receiving parenteral andenteral nutrition, the current 20-percent coinsur-ance rate would no longer apply because homehealth services (Part A) do not entail coinsurance,and Medicare would bear the full burden of ex-penditure. To avoid this added cost to Medicare,Congress could authorize DHHS to maintain therelevant equipment and supplies costs as pros-thetic devices under Part B, while offering homehealth benefits under Part A. Patients receivingsuch services would then be required to copay forthe Part B portion but not for the home healthservices.
Payment for Physicians’ Services
Medicare and some other third parties pay forcovered physicians’ services on a reasonable chargebasis. These systems, based as they are on pro-files of physicians’ charges, tend to have an in-flationary effect on physicians’ fees because eachphysician’s future payment is tied through the feescreen to currently billed charges. In addition,these systems put a premium on the performanceof new procedures for which comparative feescreens have not been established. The physiciancan charge a high fee for a new procedure andhave it reviewed for its reasonableness by a med-ical review committee composed primarily ofpracticing physicians. After these fees are estab-lished and comparative fee screens are developed,the new procedures remain highly rewarded rela-tive to old procedures.
The Federal Government could adopt for Medi-care, Medicaid, and CHAMPUS several optionsfor physician payment to address these problems.

Ch. 3—Payment Policies for Health Care and Medical Devices ● 6 9—.——.—. . — — — —
Option 6: Mandate that Federal insurance pro-grams adopt fee schedules that change the rela-tive prices of new v. old procedures and device-bound v. cognitive procedures.
The objective of developing fee schedules thatchange relative prices is not to discourage the in-troduction of new devices, but to remove the pres-ent financial incentives to select one procedureover another (239).
Implementation of this option would requirecollection of data on the costs of performing bothnew and old procedures in order to establish rela-tive prices. It would also require a system formonitoring cost changes in procedures as they dif-fuse into the practice of medicine (140). Moreover,it is not clear that relative costs are the mostappropriate basis for relative prices. Prices shouldreflect the relative values of procedures, but be-cause of present distortions in the pricing system,it would be difficult to identify differences in theserelative values. Hence, setting relative fees wouldrequire making judgments about technologies,specialties, and classes of medical care becauserelative fees affect their use.
How would relative price schedules be affectedby voluntary assignment as now exists underMedicare? Voluntary assignment effectively turnsa fee schedule into a benefit schedule. A fee sched-ule limits the amount actually received by the pro-vider, whereas a benefit schedule limits the amountthat will be paid by the insurer. Under a feeschedule, the insurer pays only the stated pricefor a procedure and requires the provider to ac-cept that price as payment in full or not be paidfor the service at all. Under Medicaid’s mandatoryassignment system, a relative price schedule wouldbe a fee schedule. With voluntary assignment,however, the physician could collect the differencebetween the billed charge and Medicare’s paymentfrom the patient, rendering the payment limit abenefit schedule.
To some extent, then, a benefit schedule thatpaid relatively less for services associated withmedical devices and more for cognitive serviceswould result in Medicare patients’ paying a greatershare of the costs of medical devices. Since peo-ple generally use fewer services the greater thelevel of cost-sharing, the relative use of medical
devices would be expected to fall somewhat, butthe extent of this effect is unknown.
Option 7: Mandate that Federal insurance pro-grams pay physicians by episode of illness orby person served rather than by procedures orservices delivered.
Just as DRG hospital payments provide incen-tives for hospitals to treat each hospital case inthe least costly manner possible with the leastcostly mix of devices and other inputs, paymentfor ambulatory physicians’ services by the episodeor case would offer similar incentives to physi-cians. In particular, the financial incentives to pro-vide more laboratory tests and other device-bound procedures than is cost effective would beeliminated.
However, this approach would not only elim-inate financial incentives to perform specific pro-cedures, since each procedure performed wouldreduce physicians’ net incomes. Whether physi-cians would actually respond to those financialincentives is unknown. Underprovision of labora-tory and other device-bound procedures wouldbe a possibility in some cases and would requiremonitoring.
This option would also require development ofnew systems of classifying patients according tomedical conditions, complaints, or health status.Otherwise, people with serious conditions andhigher use rates might gravitate to certain pro-viders and overburden them financially (“adverseselection”), or some providers might try to attractpeople considered less costly to treat (“cream-skimming”). At present, the technology of patientclassification does not appear to be well devel-oped in the ambulatory care area.
One way to begin implementing this optionwould be to focus on physicians’ services to hos-pital inpatients. Physicians could be paid a spe-cific fee based on the patient’s diagnostic categoryfor the entire hospital stay, rather than for eachinpatient visit. This arrangement would providefinancial incentives to reduce the number of phy-sician visits to the hospital and, as a consequence,the number of procedures ordered. However, eventhis limited use of per-episode physician paymentwould be difficult to implement soon. First, a

70 ● Federal Policies and the Medical Devices Industry
classification system appropriate to physicians’ in-puts has not been developed, and the validity ofDRGs as a classification system for physicians hasnot been tested; second, physicians’ claims dataare not organized in a way that readily allows esti-mation of the relative use of physician service byinpatients in different diagnoses.
The development of adequate patient classifica-tion systems to support payment on a basis otherthan fee-for-services is expensive, and individualpayers have little incentive to support such re-search. As it has in the past, the Federal Govern-ment through HCFA could take the lead in sup-porting research in this area.
Hospital Payment
Medicare’s new DRG payment system estab-lishes a different set of incentives for hospitals.These incentives represent an improvement overthe previous cost-based reimbursement system be-cause, unlike the old system, they encourage hos-pitals to treat each inpatient case in the least costlymanner possible. Of course, the DRG system isnew and hardly complete; further modificationsin its administration can be expected. One suchmodification with particular relevance to medi-cal devices is the treatment of capital costs. Thecurrent system leaves capital costs (depreciationand interest19) reimbursed as they are incurred,with no limit on the amount that a hospital canbe paid. In conjunction with fixed payment formost other components of inpatient costs, this ap-proach encourages investment in medical equip-ment and facilities relative to personnel and sup-plies, which are controlled.
Option 8: Amend the Social Security Act to in-clude payment for capital in DRG paymentrates.
The fundamental issue under the newly createdMedicare DRG payment system is whether a hos-pital’s capital payment should or should not besubject to some kind of externally imposed limit.The current passthrough reimbursement of capi-tal could continue as a permanent feature of DRG
Igcapita] cost also includes a payment for return on equity, butonly to proprietary hospitals.
payment. Alternative methods of capital paymentthat impose limits on reimbursement fall into threecategories: 1) those that establish uniform ratesof payment across all hospitals (or all within aclass); 2) those that establish hospital-specificlimits to capital payment; and 3) those that con-dition payment on approval of capital expendi-ture projects.
The uniform payment approach would treat allhospitals alike, regardless of their capital or oper-ating expenditures. Uniform payment could becalculated either as a fixed percentage of the DRGprice or as a flat rate per bed. Hospital-specificapproaches, on the other hand, would take thehospital’s capital or operating costs into accountin establishing a level of payment, but limit in-creases in the payment level over time. Thus, forexample, capital payments could be limited to apercent of operating costs, so that hospitals withhigh operating costs would receive a higher capi-tal payment than others; alternatively, the capi-tal payment in any year could be tied to the hos-pital’s actual capital costs (as measured by interestand depreciation) in a base year with adjustmentsfor inflation in subsequent years.
If capital payments were controlled through di-rect regulation of capital expenditures, only proj-ects approved by a certificate of need (CON) orother designated agency would be recognized byMedicare for capital payment. Approved projectswould then be paid on a cost basis. Areawide orstatewide annual capital expenditure limits couldbe used to establish an upper bound on the valueof approved projects. The State of New York iscurrently considering adoption of such a capitalexpenditure limit (38).
The alternative capital payment methods de-scribed above can be evaluated on the basis offour general criteria:
●
●
●
Efficiency—the extent to which the approachpromotes the cost-effective use of hospitaldevices.Equity of access to medical technology—theextent to which the method promotes equalaccess among population groups to capital-embodied medical technology.Fairness—the extent to which the methodtreats all kinds of hospitals alike, neither
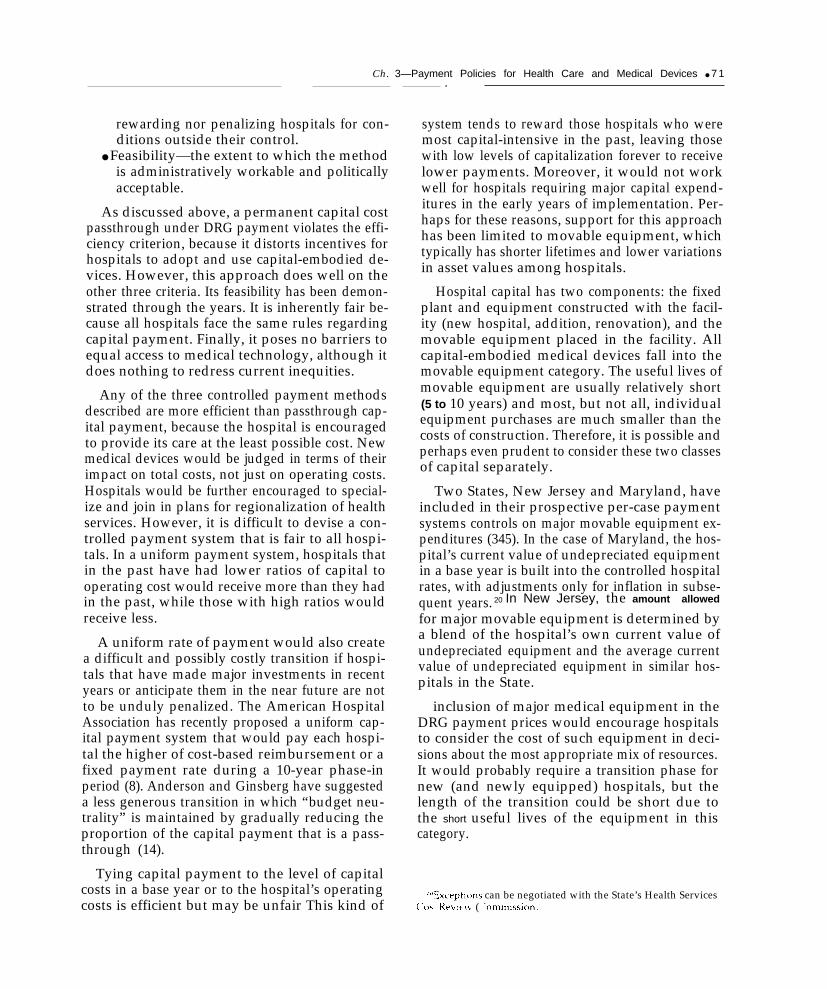
Ch. 3—Payment Policies for Health Care and Medical Devices ● 7 1
rewarding nor penalizing hospitals for con-ditions outside their control.
● Feasibility—the extent to which the methodis administratively workable and politicallyacceptable.
As discussed above, a permanent capital costpassthrough under DRG payment violates the effi-ciency criterion, because it distorts incentives forhospitals to adopt and use capital-embodied de-vices. However, this approach does well on theother three criteria. Its feasibility has been demon-strated through the years. It is inherently fair be-cause all hospitals face the same rules regardingcapital payment. Finally, it poses no barriers toequal access to medical technology, although itdoes nothing to redress current inequities.
Any of the three controlled payment methodsdescribed are more efficient than passthrough cap-ital payment, because the hospital is encouragedto provide its care at the least possible cost. Newmedical devices would be judged in terms of theirimpact on total costs, not just on operating costs.Hospitals would be further encouraged to special-ize and join in plans for regionalization of healthservices. However, it is difficult to devise a con-trolled payment system that is fair to all hospi-tals. In a uniform payment system, hospitals thatin the past have had lower ratios of capital tooperating cost would receive more than they hadin the past, while those with high ratios wouldreceive less.
A uniform rate of payment would also createa difficult and possibly costly transition if hospi-tals that have made major investments in recentyears or anticipate them in the near future are notto be unduly penalized. The American HospitalAssociation has recently proposed a uniform cap-ital payment system that would pay each hospi-tal the higher of cost-based reimbursement or afixed payment rate during a 10-year phase-inperiod (8). Anderson and Ginsberg have suggesteda less generous transition in which “budget neu-trality” is maintained by gradually reducing theproportion of the capital payment that is a pass-through (14).
Tying capital payment to the level of capitalcosts in a base year or to the hospital’s operatingcosts is efficient but may be unfair This kind of
.
system tends to reward those hospitals who weremost capital-intensive in the past, leaving thosewith low levels of capitalization forever to receivelower payments. Moreover, it would not workwell for hospitals requiring major capital expend-itures in the early years of implementation. Per-haps for these reasons, support for this approachhas been limited to movable equipment, whichtypically has shorter lifetimes and lower variationsin asset values among hospitals.
Hospital capital has two components: the fixedplant and equipment constructed with the facil-ity (new hospital, addition, renovation), and themovable equipment placed in the facility. Allcapital-embodied medical devices fall into themovable equipment category. The useful lives ofmovable equipment are usually relatively short(5 to 10 years) and most, but not all, individualequipment purchases are much smaller than thecosts of construction. Therefore, it is possible andperhaps even prudent to consider these two classesof capital separately.
Two States, New Jersey and Maryland, haveincluded in their prospective per-case paymentsystems controls on major movable equipment ex-penditures (345). In the case of Maryland, the hos-pital’s current value of undepreciated equipmentin a base year is built into the controlled hospitalrates, with adjustments only for inflation in subse-quent years. 20 In New Jersey, the amount allowed
for major movable equipment is determined bya blend of the hospital’s own current value ofundepreciated equipment and the average currentvalue of undepreciated equipment in similar hos-pitals in the State.
inclusion of major medical equipment in theDRG payment prices would encourage hospitalsto consider the cost of such equipment in deci-sions about the most appropriate mix of resources.It would probably require a transition phase fornew (and newly equipped) hospitals, but thelength of the transition could be short due tothe short useful lives of the equipment in thiscategory.
‘OExceptlons can be negotiated with the State’s Health Services~’o~’ RevI~t\ ( ‘ommission.
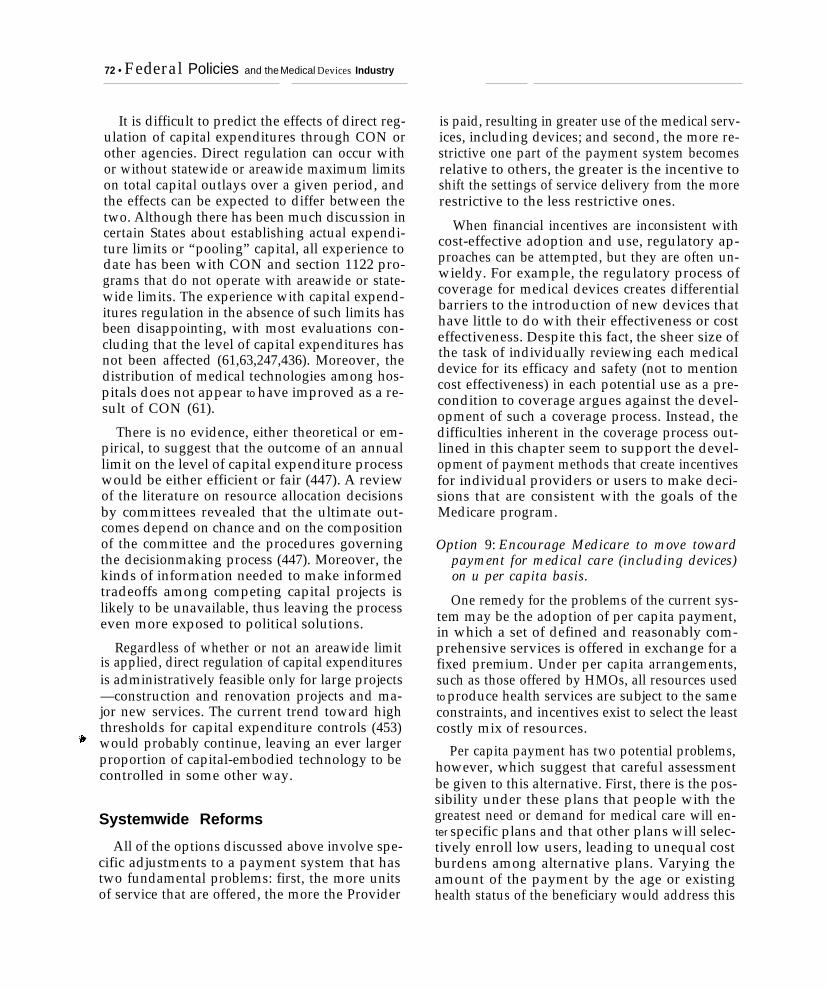
72 • Federal Policies and the Medical Devices Industry
It is difficult to predict the effects of direct reg-ulation of capital expenditures through CON orother agencies. Direct regulation can occur withor without statewide or areawide maximum limitson total capital outlays over a given period, andthe effects can be expected to differ between thetwo. Although there has been much discussion incertain States about establishing actual expendi-ture limits or “pooling” capital, all experience todate has been with CON and section 1122 pro-grams that do not operate with areawide or state-wide limits. The experience with capital expend-itures regulation in the absence of such limits hasbeen disappointing, with most evaluations con-cluding that the level of capital expenditures hasnot been affected (61,63,247,436). Moreover, thedistribution of medical technologies among hos-pitals does not appear to have improved as a re-sult of CON (61).
There is no evidence, either theoretical or em-pirical, to suggest that the outcome of an annuallimit on the level of capital expenditure processwould be either efficient or fair (447). A reviewof the literature on resource allocation decisionsby committees revealed that the ultimate out-comes depend on chance and on the compositionof the committee and the procedures governingthe decisionmaking process (447). Moreover, thekinds of information needed to make informedtradeoffs among competing capital projects islikely to be unavailable, thus leaving the processeven more exposed to political solutions.
Regardless of whether or not an areawide limitis applied, direct regulation of capital expendituresis administratively feasible only for large projects—construction and renovation projects and ma-jor new services. The current trend toward highthresholds for capital expenditure controls (453)would probably continue, leaving an ever largerproportion of capital-embodied technology to becontrolled in some other way.
Systemwide Reforms
All of the options discussed above involve spe-cific adjustments to a payment system that hastwo fundamental problems: first, the more unitsof service that are offered, the more the Provider
is paid, resulting in greater use of the medical serv-ices, including devices; and second, the more re-strictive one part of the payment system becomesrelative to others, the greater is the incentive toshift the settings of service delivery from the morerestrictive to the less restrictive ones.
When financial incentives are inconsistent withcost-effective adoption and use, regulatory ap-proaches can be attempted, but they are often un-wieldy. For example, the regulatory process ofcoverage for medical devices creates differentialbarriers to the introduction of new devices thathave little to do with their effectiveness or costeffectiveness. Despite this fact, the sheer size ofthe task of individually reviewing each medicaldevice for its efficacy and safety (not to mentioncost effectiveness) in each potential use as a pre-condition to coverage argues against the devel-opment of such a coverage process. Instead, thedifficulties inherent in the coverage process out-lined in this chapter seem to support the devel-opment of payment methods that create incentivesfor individual providers or users to make deci-sions that are consistent with the goals of theMedicare program.
Option 9: Encourage Medicare to move towardpayment for medical care (including devices)on u per capita basis.
One remedy for the problems of the current sys-tem may be the adoption of per capita payment,in which a set of defined and reasonably com-prehensive services is offered in exchange for afixed premium. Under per capita arrangements,such as those offered by HMOs, all resources usedto produce health services are subject to the sameconstraints, and incentives exist to select the leastcostly mix of resources.
Per capita payment has two potential problems,however, which suggest that careful assessmentbe given to this alternative. First, there is the pos-sibility under these plans that people with thegreatest need or demand for medical care will en-ter specific plans and that other plans will selec-tively enroll low users, leading to unequal costburdens among alternative plans. Varying theamount of the payment by the age or existinghealth status of the beneficiary would address this

Ch. 3—Payment Policies for Health Care and Medical Devices ● 7 3— —.
problem, but it is difficult to identify factors that have a financial incentive to provide too few.will be associated with greater medical care need. However, competition among plans and the costsSecond, just as fee-for-service medicine gives pro- of malpractice insurance may limit this risk ofviders an incentive to provide too many services, underprovision.providers of services on a per capita basis would
25-406 0 - 84 - 6

4Research and Development;
Policies Related toMedical Devices
Columbus may have been impelled by a desire for spices, but it was the
supply of corn which was increased—Kenneth J. Arrow

Contents
PageIntroduction . . . . . . . . . . . . . . . . . . . . . . . . . . . . . . . . . . . . . . . . . . . . . . . . . . . . 77Trends in Medical Devices R&D . . . . . . . . . . . . . . . . . . . . . . . . . . . . . . . . . . 78Sources of Support for Medical-Device-Related R&D . . . . . . . . . . . . . . . . . . 79
Federal Support for R&D on Medical Devices . . . . . . . . . . . . . . . . . . . 79Private Sources of Funds for R&D on Medical Devices . . . . . . . . . . . . . . . . . . 80
The Small Business Innovation Research Program . . . . . . . . . . . . . . .. 86Federal Support for Orphan Devices. . . . . . . . . . . . . . . . . . . . . . . . . . . . . . . . 88State and Local Initiatives Related to R&D for Medical Devices . . . . . . . . . . . . . . 91Discussion and Policy Options. . . . . . . . . . . . . . . . . . . . . . . . . . . . . . . . . . . 92
LIST OF TABLESTable No. Page23. Industrial R&D in Five SIC Medical Devices Codes, 1974-80 . . . . . . . . . . . . . . 7924. Sources of Support for Industrial R&D in Five SIC
Medical Devices Codes, 1974-80. . . . . . . . . . . . . . . . . . . . . . . . . . . . . . . . 7925. R&D Grants and Contracts Awarded by the National Institutes of
Health, Fiscal Year 1982. . . . . . . . . . . . . . . . . . . . . . . . . . . . . . . . . . . 8026. Sources of Financial Capital to Firms in IRS Category 3845:
Optical Medical, and Ophthalmic Goods, 1976-80 8327. Sources of Financial Capital to Firms in IRS Category 3698:
Other Electrical 1976-80 . . . . . . . . . . . . . . . . . . . . . . . . . . . . . . . . . . . . 8428. Sources of Financial Capital to Firms in IRS Category 40:
All Manufacturing, 1976-80, . . . . . . . . . . . . . . . . . . . . . . . . . . . . . . . . . 8529. Capital Commitments to Independent Private Venture
Capital Funds, 1979-82 . . . . . . . . . . . . . . . . . . . . . . . . . . . . . . . . . . . . . 8530. Percentage of Types of Venture Capital Financing in Medical Devices
and Other Fields, 1982 . . . . . . . . . . . . . . . . . . . . . 8631. Analysis of Applications for Small Business Innovation Research (SBIR)
Grants, National Institutes of Health, 1983.. . . . . . . . . . . . . . . . . . . 88

Research and Development PoliciesRelated to Medical Devices
INTRODUCTIONNew medical devices arise from a process of re-
search and development (R&D)—purposeful ac-tivities requiring the investment of time and othereconomic resources in the investigation of scien-tific or technical problems. R&D is frequentlyclassified into three phases:
●
●
●
✎
Basic research—original investigation whoseobjective is to gain fuller knowledge or un-derstanding of the fundamental aspects ofphenomena and of observable facts withoutspecific applications in mind (421).Applied research—investigation whose ob-jective is to gain knowledge or understand-ing necessary for determining the means bywhich a recognized and specific need may bemet (421).Development— systematic use of the knowl-edge or understanding gained from researchin the design and development of prototypesand processes (413).
Investment in R&D, particularly in develop-ment, is a necessary, but not sufficient, conditionfor technological progress’ in medical devices.Some new devices may result from sudden in-sights, with little developmental work needed;others may require a laborious and slow devel-opment phase with high levels of investment. Allnew devices (or device improvements) need somelevel of development and possibly research. Yetthere are no guarantees that greater investmentin R&D will lead to higher levels of technologi-cal progress in a field. The productivity of R&Ddepends to a 1arge extent on the present state ofscientific knowledge (413) and to some extent onthe existence of a “product champion” (413), but
‘Technological progress is defined here as the continual introduc-tion to practice of new and more useful ways of serving human pur-poses (262).
it may also depend on how the R&D is organized:who performs it, who funds it, how funding deci-sions are made, and the social and economic struc-ture in which it occurs.
The purpose of this chapter is to examine Fed-erd R&D policy as it relates to medical devices.2
As in other areas of Federal policy, questions ofR&D policy transcend the medical devices field.Federal stimulation of industrial R&D through di-rect subsidies or indirect policies (e. g., tax pol-icy) has been a national concern (67,70). Simi-larly, Federal support for basic research andtraining as a long-term national investment intechnological change and R&D capacity has beendiscussed widely in general terms (280) and interms of biomedical research as a whole (413).
This discussion will concern itself neither withthe broad issues of R&D policy nor with publicpolicy instruments that cannot be readily targetedto specific fields such as medical devices (e.g., theuse of income and corporate tax incentives tostimulate R&D). It is important to note, however,that global R&D strategies may have an impacton the level, directions, and settings of R&D onmedical devices that is as great or greater thanthe impact of R&D strategies directed specificallyat medical devices. (App. G contains an analysisof the impact of recent changes in Federal tax pol-icy on medical devices R& D.)
To address the specific issues pertaining to R&Dfor medical devices, the chapter first presents dataon expenditures for and performance of medical-device-related R&D. The chapter also analyzessources of support for medical-device-relatedR&D. The concluding section of the chapter dis-cusses problems that have been identified and pol-icy options to address them..— —— —
R&D in the Veterans Administration is discussed in ch. 7.
77

78 • Federal Policies and the Medical Devices Industry
TRENDS IN MEDICAL DEVICES R&D
For two reasons, it is difficult to identify andquantify R&D activities specifically related tomedical devices. First, most basic and some ap-plied research lays the scientific foundation fora wide range of future products and processes,including medical devices, without being specifi-cally attributable to a device or even to a classof devices. Second, the R&D data that are pub-lished are either aggregated or classified in a man-ner that is inconsistent with the definition of med-ical devices used in this report. The picture ofdevice-related R&D must be sketched from dis-parate and only partially relevant data sources.
Annual estimates of the level of health-relatedR&D expenditures in the United States are avail-able from the National Institutes of Health (NIH),but these estimates are not broken down by phaseof R&D and are not specific to medical devices.In 1980, health R&D totaled an estimated $7.89billion, of which 28 percent was performed, and31 percent was funded, by industry (404).3
Annual estimates of R&D conducted by medi-cal device companies are available from the Na-tional Science Foundation (NSF) survey of R&Din industrial firms, but their validity as estimatesof industrial R&D on medical devices is somewhatlimited. The NSF’s estimates of company-wideR&D for firms whose primary line of business isone of the five medical device Standard IndustrialClassification (SIC) codes4 overestimate industrialR&D on medical devices to the extent that themedical device companies conduct R&D in otherproduct categories and underestimate it to the ex-tent that R&D for medical devices is conductedby firms classified in other SIC codes. Becausemany medical devices firms are owned by largemultiproduct firms, s the balance is likely to be— —
3The NIH estimates of industrial R&D for health are impreciseand probably underestimated due to limitations of the data on whichthe estimates were based (449).
‘The five medical devices SIC codes are: 3693 (X-ray and elec-tromedical equipment), 3841 (surgical and medical instruments), 3842(surgical appliances and supplies), 3843 (dental equipment and sup-plies), and 3851 (ophthalmic goods) See ch. 2 for further informa-tion on the SIC codes.
‘Three obvious examples are the General Electric Co., with ex-tensive R&D in medical imaging; E. I. du Pont, with R&D in health-related products; and Johnson & Johnson, Inc. r a drug companywith several device subsidiaries. (Because Census Bureau data areconfidential, it is impossible to state with certainty the severity ofthe classification problem. )
toward underestimation of industrial R&D onmedical devices.
NSF’s estimates of company-wide expendituresfor applied research and development are brokendown into general product categories such asprofessional and scientific instruments” and “otherelectrical machinery equipment and supplies. ”These categories are too broad to allow the ex-traction of applied research and development ex-penditures that pertain specifically to medicaldevices. Basic research expenditures are collectedfor the company as a whole and are not brokendown by product class.
These caveats must be recognized in interpret-ing table 23, which presents estimates of indus-trial R&D expenditures aggregated over the fivemedical devices SIC codes. In the 1974-80 period,industrial R&D expenditures, which include bothcompany and Federal funding, grew at an aver-age annual rate of 16.1 percent in the five medi-cal devices SIC codes, as compared with an an-nual growth rate of 11.7 percent in industry asa whole (422,424). It is also interesting to notethat although R&D expenditures for medical de-vices are probably underestimated, in 1980, in-dustrial R&D expenditures for firms in the fivemedical devices SIC codes were equal to 3 per-cent of the value of such firms’ shipments (seetable 23); in industry as a whole, R&D expendi-tures were equal to 2.4 percent of the value ofshipments (422,424).
The data suggest that the medical devices in-dustry is relatively R&D-intensive. In 1980, forfirms in the five medical devices SIC codes, com-pany-sponsored R&D was equal to 2.9 percent ofthe value of such firms’ shipments; for industryas a whole, company-sponsored R&D expendi-tures amounted to only 1.6 percent of the valueof shipments (422,424). For the rate of companyInvestment in basic research, there is little dif-ference between medical devices firms and indus-try as a whole. In 1979, firms in the five medicaldevices SIC codes reported that 3.7 percent oftheir company-sponsored R&D was basic re-search, while the figure for industrial firms as awhole was 4.1 percent (422,424).

Ch. 4—Research and Development Policies Related to Medical Devices ● 79.—. —.. .-——
Table 23.—industrial R&D in Five SIC Medical Devices Codesa, 1974-80 (dollars in thousands)
Basic Percentage Applied Percentage Percentage Not Percentage Percentage ofYear research of total research of total Development of total identified of total Total shipments
1975::: NA NA NA NA NA NA NA NA 168,884 2:91974 2 ’0 /0 25 1°/o 70.60/o 1.7% 2 . 8 %
1976 . . . 6,234 3.1 33,046 16.6 90,957 45.8 68,637 34.5 198,874 3.01977 . . . 8,406 3.7 65,994 28.8 154,277 67.5 NA NA 228,677 2.81978 . . . NA NA NA NA NA NA NA 273,794 3.01979. . . 11,272 3.8 67,968 23.3 188,690 6 4 7 23,821 8.2 291,751 2.81980 . . . NA NA NA NA NA NA NA NA 348,707 3.0— —NA indicates information not available because of issues of confidentialityaThe five Standard Industrial Classification (SIC) code medical devices categories are
SIC 3693: X-ray and electromedical equipmentSIC 3841: Surgical and medical instrumentsSIC 3642: Surgical appliances and suppliesSIC 3843: Dental equipment and suppliesSIC 3851: Ophthalmic goods
SOURCES U S Department of Commerce, Bureau of Industrial Economics, 1983 U.S /ndustr/a/ Ou(/ook, Washington, DC, January 1983; US. National Science Founda-tion “Survey of Industrial Research and Development, ” conducted by the U S Bureau of the Census, 1982
SOURCES OF SUPPORT FOR MEDICAL-DEVICE-RELATED R&DR&D for medical devices takes place in numer-
ous settings—private companies, hospitals, anduniversity and government laboratories. Thesources of support for these activities are highlyvaried. It is impossible to isolate the sources offunding of medical-device-related R&D performedin academic or government laboratories fromthose for other health or general R&D, but dataare available on the sources of funding of medi-cal devices R&D conducted in industry. b
Table 24 shows the sources of support for in-dustrial R&D in the five SIC medical devices codes.The level of support from NIH and other Federalagencies is substantially lower for industrial R&Din these SIC codes than it is for industrial R&Das a whole. In 1980, the Federal Governmentfunded less than 3 percent of the R&D conductedby firms in these SIC codes, compared with 29percent of R&D conducted by industry as a whole(422).
Federal Support for R&D onMedical Devices
The Federal Government supports over 52 per-cent of total health R&D, most of it (70 percent)through grants and contracts from NIH (404).Table 25 shows the distribution of R&D grantsand contracts awarded by NIH in fiscal year 1982.
cThe limitations of the NSF industrial R&El survey apply in in-terpreting these data, however.
Table 24.—Sources of Support for Industrial R&Din Five SIC Medical Devices Codesa, 1974-80
——— —Percent
Total change inindustrial company-
R&D Federal Company sponsored
Year (thousands of dollars) R&D— — — .1974. . $142,080 $3,635 $138,445 —1975. . 168,884 164,006 18.5%1976. . 198,874 5,464 193,410 17.91977. . 228,677 5,727 222,950 15.31978. . 273,794 5,623 269,171 20.71979. . 291,751 4,788 286,963 6.61980. . 348,707 7,125 341,582 19.0— — . —aThe five slc codes we the same as those listed in table 23.SOURCES U S Department of Commerce, Bureau of Industrial Economics, 1983
U S /rrdustria/ Out/ook, Washington, DC, January 1983; U.S. NationalScience Foundation, “Survey of Industrial Research and Develop-merit, ” conducted by the U.S. Bureau of the Census, 1982.
Industry received approximately 6 percent of totalNIH grants and contracts for that year. (Of course,these grants and contracts encompass much morethan the development of medical devices, includ-ing some basic research, drug and biotechnologydevelopment, and procurement of items such asresearch laboratory equipment. )
Despite the small proportion of NIH funds thatgoes to industry, NIH and other agencies’ supportfor R&D in specific medical device areas is prob-ably sizable in absolute terms. The National In-stitute for Handicapped Research’s RehabilitationTechnology program, for example, administersa $9 million annual program of grants and con-

80 ● Federal Policies and the Medical Devices Industry—
tracts to 18
Table 25.—R&D Grants and Contracts Awarded bythe National Institutes of Health (NIH), Fiscal Year 1982
‘Total amount Percentage ofPerforming institution (thousands of dollars) total— —-——— —Domestic institutions . . . . . . . . . . . . . . . . . . . . . . $2,709,248 990/0
Nonprofit. . . . . . . . . . . . . . . . . . . . . . . . . . . . . . 2,558,010 94Higher education . . . . . . . . . . . . . . . . . . . . 2,025,822 74
Medical schools . . . . . . . . . . . . . . . . . . . . 1,412,540 52Government . . . . . . . . . . . . . . . . . . . . . . 40,656 1
Federal . . . . . . . . . . . . . . . . . . . . . . . . . . . . 2,083 0Research institutes . . . . . . . . . . . . . . . . 470 0Hospitals. . . . . . . . . . . . . . . . . . . . . . 404 0Other . . . . . . . . . . . . . . . . . . . . . . . . . . . . 1,209 0
State and local . . . . . . . . . . . . . . . . . . . . . . 38,574Research institutes. . . . . . . . . . . . . . . . 1,774 1Hospitals. . . . . . . . . . . . . . . . . . . . . . . . . 26,362 1Other . . . . . . . . . . . . . . . . . . . . . . . . . . . . 10,438 0
Other nonprofit . . . . . . . . . . . . . . . . . . . . 491,531 18Research institutes . . . . . . . . . . . . . . . 275,575 10Hospitals. . . . . . . . . . . . . . . . . . . . . . . . 163,188 6Other . . . . . . . . . . . . . . . . . . . . . . . . . . . . 52,768 2
Profit . . . . . . . . . . . . . . . . . . . . . . . . . . . . . . . . . 151,238 6Foreign institutions . . . . . . . . . . . . . . . . . . . . . . 22,820 1
Total . . . . . . . . . . . . . . . . . . . . . . . . . . . . . . . . . . . $2,732,068 100%a
apercentage may not sum to 100 because Of rounding errorsSOURCEU S.Department of Health and Human Services, National institutes ~f Health, Offlceof Program Plannlng and Evalua-
tlon and the Dlwslon of Research Grants, NIH Data Bock 1983 Washington, DC, June 1983, table 17
centers engaged in applied researchand development of rehabilitative-devices (299).NIH’s critical role in supporting the developmentof renal dialysis technology is described in box G.
A recent analysis of NIH, NSF, and Departmentof Energy grants and contracts active as of May1983 revealed that almost $50 million was relatedto diagnostic imaging (460). This medical imag-ing R&D was scattered throughout the institutesand agencies and covered a wide assortment ofsubjects including not only development or refine-ment of new imaging devices, but the use of imag-ing techniques to enhance understanding of dis-ease processes. A high proportion of these grantswent to academic and other nonprofit institutions,and therefore supplemented the R&D on medi-cal imaging conducted by industry. NIH fundingin the medical imaging area has, in retrospect, hadimportant impacts on the later development ofcommercial imaging devices. Box H presents thehistory of Federal funding for research on nuclearmagnetic resonance (NMR) imaging.
Private Sources of Funds for R&D onMedical Devices
How do medical device firms go about financ-ing the R&D that is not supported by direct grantsand contracts? Firms have two potential sourcesof financing: retained earnings and the financialcapital markets. If funds are sought from exter-nal sources, they may be generated either throughdebt or equity instruments. Tables 26, 27, and 28present data on the sources of financial capital tofirms in three Internal Revenue Service (IRS) in-dustry categories:
• optical, medical, and ophthalmic goods (IRS3845);
● other electrical (including but not limited toX-ray and electromedical devices) (IRS 3698);and
● all manufacturing (IRS 40).These industry classifications include a substan-tial number of firms not engaged in the produc-tion of medical devices, and the data pertain to

Ch. 4—Research and Development Policies Related to Medical Devices ● 81. .- —. —
the financing of all activities in these fields, notjust the financing of R&D and innovation. Con-sequently, the interpretation must proceed withcaution.
Table 26 shows that in 1980, external equitybecame a very important source of financing forsmall firms in the optical, medical, and ophthal-mic goods category. Retained earnings have con-sistently been less important to firms in this cate-gory than they are to manufacturing firms as awhole. The shift by small firms in the optical,medical, and ophthalmic goods category towardexternal equity may be the result of the infusionof large amounts of venture capital into new com-panies in this area in 1979. Notice also that smalloptical, medical, and ophthalmic goods comp-
anies depend to a greater extent on all forms ofexternal financing than do large firms in the sameIndustry.
The role of venture capital in financing innova-tion i n general and new medical devices in par-ticular has increased dramatically since 1978. Ven-ture capitalists are investors who specialize inproviding financial capital to small and, some-times, new firms. From 1969 to 1977, the totalventure capital pool in the United States remainedvirtually unchanged, at the level of about $2.5 bil-lion to $3 billion (190). Since then, however, thetotal venture capital pool has increased sharply,reaching between $3.5 billion and $4 billion in1979 (441), $5.8 billion in 1981 (442), and an esti-
mated $7.5 billion as of December 1982 (440).

82 • Federal Policies and the Medical Devlces Industry—
Ikw H.—Federal Funding o f R e s e a r c h on Nuclear Magnetic Rewwance hnagir@
Guvermmmt policies related to of medical device research and dew%pnwnt (R&0) by univer-s i t i e s a n d rnamda~turers car-i have impacts on the evolution of technokgy a n d the shape ofparticular device industries. The h!story of Governrnent funding of Nh4R imaging research in the UnitedStates reflects these impacts.
NMR imaging is an exciting new diagnostic imaging modaIity that has captured the interest of themedical profession. R has many desirable attributes, including the use of mdiowaves and powerfulmagnetic fiekk rather than ionizing radiation. It also offers excelkmt tissue contrast without the needfor injection of potentially toxic contrast agents and allows visualization of areas such as the posteriorfcwm, brain stern, and spinal cord, which are not well seen with other imaging techniques. Finally, thetechnique offers the possibility & detecting diseases at earlier stages than is currently possible and ofpermitting accurate pathologic diagnoses to be made nonirwasively.
NMR also has disadvantages. NMR irnagers are expensive and logistically difficult to install. Theymay also require more physician time in perkrmance of patient exmninaticm than do-computed tomog-raphy (Cl”) or other imaging techniques. Moreover, at this time, the exact sole of NMR imaging in clini-cal medicine, particularly its efficacy compared to other imaging modalities, has yet to be defined.
Over the past decade, the National Institutes of Health (NIH) has supported research relating toNMR imaging, biomedical appkcations of NMR parameters, and biomedical applications of NMR spec-troscopy. Although NM km provided some funds for development and use of software and ancillaryhardware, it has not provided, and dues not plan to provide, support to clinkal or research hmtitutiortsto lx wed either to develop or purckw N&II? imaging machines for use in human imaging.
NIH has had an active intramural prwgrarn of research involving applications of NMR for manyyears. over the past 6 years, Dr. David Fkx&, a physicist and ektrcmics engineer, has cunchxted researchfocusing on NMR imaging and techniques. Dr. Robert Ek&ban has Txwn studyingphysiological appkatiams of phosphorus, sodium, and nitrogen Ni%@ for the past 3% years.Also, a research group has been formed by Dr. Charles Meyers of the National Cancer Institute (NCI)to expke tk use of NMR in the study of the metabolism of bath mwmal and cancer cells as well asthe effect of various drugs on cellular me&dmlisrn. The group will akm be exploring possible applicationsof NM? to the study of (62).
Using funds contributed by several institutes, NM has purchased a Nh4R imaging systemon which it will perfmm clinical studies including investigations of disease, the effectsof chemotherapy and radiation therapy on Nh4R parameters, and whether NMR can be used to predictpatients’ respcmses to chemotherapy and radiation therapy.
NII-I has also engaged in active extramural support of NMR irna@ng. a few of the NA4R-related extramural grants have been fumkd by the National Heart, Lung, and Blood Institute (NHU31)and other institutes, most of them have been funded by NCI. The first eximmm.rd NCI grant relatedto NMR imaging was awarded to Paul Lauterbur at the State University of New York-Stony Brook in1973 after publicatkm of a landmark article on NMR (191). The award was made to help Lauterburfurther develop his techniques of NR4R imaging and investigate its to cancer research. Hisinitial funding of appmximate~y pm year for 3 years has been renewed at an approximatelyconstant level, without interruption, since 19!73. Lauterbur alsu received ~ ~ant km NHLBI in 1975related to the use of NMR imaging to study blood flow and ari additicm~l per year from thatinstitute since 1978. NIH also supported early work on NhlR of sw@dly excised humantumors (76,77} and tumors in mice and rats (M4,152), as well as on the imaging d tumors in live animals(75).
NIH is cwmdy funding approximately $2 million of research to l%lkll? imaging or in vivos p e c t r o s c o p y in at least 10 diffarent (460). T h e Of Ene~w kas a~~ded an a d d i -tional $%.8 million for NMR-rektted rewarch (46U). In October 1962, the EMagmstk Imaging Research

Ch. 4—Research and Development Policies Related to Medical Devices ● 8 3. . - . —
Table 26.—Sources of Financial Capital to Firms in IRS Category 3845: Optical, Medical,and Ophthalmic Goods, 1976-80— .— .-.——. —.
Asset size class (000s) Asset size class (000s)Ratio $1-$5,000 $5,000+ Ratio $1-$5,000 $5,000+
——.External equity to assets
.—1978 . . . . . . . . . . . . . . . . 0 . 2 0 0.16
1980 . . . . . . . . . . . . . . . . . . . . 0.38 0.18 1977 . . . . . . . . . . . . . . . . 0.20 0.141979 . . . . . . . . . . . . . . . . . . . . 0.16 0.19 1976 . . . . . . . . . . . . . . . . . . . 0.12 0.131978 . . . . . . . . . . . . . . . . . . . . 0.23 0.18 Short-term debt to assets1977 . . . . . . . . . . . . . . . . . . . . 0.24 0.20 1980 . . . . . . . . . . . . . . . . 0,20 0.171976 . . . . . . . . . . . . . . . . . . . . 0.26 0.23 1979 . . . . . . . . . . . . . . . . . . 0.24 0.13
Retained earnings to assets 1978 . . . . . . . . . . . . . . . . . . 0.22 0.161980 . . . . . . . . . . . . . . . . . . . . 0.08 0.35 1977 . . . . . . . . . . . . . . . . . . 0.17 0.171979 . . . . . . . . . . . . . . . . . . . . 0.16 0.37 1976 0.20 0.151978 . . . . . . . . . . . . . . . . . . . .
. , . . , .0.14 0.39 Trade debt to assets
1977 . . . . . . . . . . . . . . . . . . . . 0.21 0.40 1980 . . . . . . . . . . . . . . . . 0.18 0.171976 . . . . . . . . . . . . . . . . . . . . 026 0.40 1979 . . . . . . . . . . . . . . . . . . 0.13 0.15
Long-term debt to assets 1978 . . . . . . . . . . . . . . . . . 0.17 0.121980 . . . . . . . . . . . . . . . . . . . . 0.14 0.13 1977 . . . . . . . . . . . . . . . . . 0.13 0.091979 . . . . . . . . . . . . . . . . . . . . 0.27 0,17 1976 . . . . . . . . . . . . . . . . . 0.18 0.09. — — — — — — . — — — . . — . — —
SOURCE: U.S. Department of the Treasury, internal Revenue Service, Sourcebook of Stdisfrcso f/rrcorne, for years 1976-80, as cited in(26)
Variability in the amount of venture capital in Recent changes have led to a resurgence in thethe United States is influenced by many factors, United States in the supply of venture capital.including sensitivity to general variables in the Especially important to the supply of venture cap-overall economy (e.g., interest rates and infla- ital have been decreases in the rate at which long-tion), changes in capital gains tax laws, and changes term capital gains are taxed. In 1978, the rate ofin pension fund investment rules. taxation was reduced substantially; more recently,

84 ● Federal Policies and the Medical Devices Industry— — — .
Table 27.—Sources of Financial Capital to Firms in IRS Category 3698:Other Electrical, 1976-80
Asset size class (000s)
Ratio $1-$5,000 $5,000-$25,000 $25,000-$100,000 $100,000+External equity to assets
1980 . . . . . . . . . . . . . . . . . . . . . . . .1979 . . . . . . . . . . . . . . . . . . . . . . . .1978 . . . . . . . . . . . . . . . . . . . . . . . .1977 . . . . . . . . . . . . . . . . . . . . . . . .1976 . . . . . . . . . . . . . . . . . . . . . . . .
Retained earnings to assets1980 . . . . . . . . . . . . . . . . . . . . . . . .1979 . . . . . . . . . . . . . . . . . . . . . . . .1978 . . . . . . . . . . . . . . . . . . . . . . . .1977 . . . . . . . . . . . . . . . . . . . . . . . .1976 . . . . . . . . . . . . . . . . . . . . . . . .
Long-term debt to assets1980 . . . . . . . . . . . . . . . . . . . . . . . .1979 . . . . . . . . . . . . . . . . . . . . . . . .1978 . . . . . . . . . . . . . . . . . . . . . . . .1977 . . . . . . . . . . . . . . . . . . . . . . . .1976 . . . . . . . . . . . . . . . . . . . . . . . .
Short-term debt to assets1980 . . . . . . . . . . . . . . . . . . . . . . . .1979 . . . . . . . . . . . . . . . . . . . . . . . .1978 . . . . . . . . . . . . . . . . . . . . . . . .1977 . . . . . . . . . . . . . . . . . . . . . . . .1976 . . . . . . . . . . . . . . . . . . . . . . . .
Trade debt to assets1980 . . . . . . . . . . . . . . . . . . . . . . . .1979 . . . . . . . . . . . . . . . . . . . . . . . .1978 . . . . . . . . . . . . . . . . . . . . . . . .1977 . . . . . . . . . . . . . . . . . . . . . . . .1976 . . . . . . . . . . . . . . . . . . . . . . . .
0.160.120.200.220.16
0.160.270.220.190.29
0.180.130.140.140.11
0.320.250.220.220.22
0.190.190.200.210.20
0.18 0.140.14 0.150.17 0.150.18 0.140.23 0.19
0.33 0.480.39 0.420.37 0.480.40 0.470.35 0.45
0.14 0.130.13 0.170.14 0.130.12 0.130.13 0.15
0.21 0.150.18 0.160.19 0.160.18 0.160.18 0.13
0.16 0.100.14 0.100.13 0.100.12 0.100.11 0.09
0.090.100.120.130.13
0.220.230.250.250.25
0.270.280.270.240.28
0.300.270.250.260.23
0.120.120.130.120.11
SOURCE: U.S. Department of the Treasury, internal Revenue Sewice, Sourcebook of Statistics of/rmorne, for years 1976-80,as citedin (26)
the Economic Recovery Act of 1981 establishedthe long-term capital gains tax rate at 20 percentfor individuals and 28 percent for corporations,making venture investments more attractive thanthey hereunder the pre-1978 rate of 49 percent.Also, in 1979, pension fund regulations of theEmployee Retirement Income Security Act wereinterpreted as allowing some pension fund moneyto flow into venture capital investments.
The results of these changes are evident in datapresented in table 29, which shows capital corn-mitments to private venture capital funds for theyears 1978 to 1982. Not only have the total an-nual outlays of venture capital funds increased asa whole, but also the amount available from pen-sion funds has grown dramatically since 1979: in1982, pension funds represented one-third of thenew capital commitments to private venture cap-ital firms (443).
In 1981, venture capital investments in medi-cal and health-related products and services con-stituted about 6 percent of investments made inorganized venture capital markets (26). Table 30shows the 1982 distribution of venture capital in-vestments by stage of investment in four prod-uct categories: medical imaging, other medicalproducts, industrial products, and electronics.
The two medical devices categories—medicalimaging and other medical products—show a rela-tively high proportion of investments in earlystages, although in medical devices, as in otherfields, the organized venture capital market ap-pears to invest negligible amounts at the earliest(seed money) stage of development. The relativelyimportant role of venture capital firms in financ-ing the startup of new medical device firms sug-gests that investors have been more likely to takegreater risks in this field than they have in other

Ch. 4—Research and Development Policies Related to Medical Devices • 85
Table 28.–Sources of Financial Capital to Firms in IRS Category 40:All Manufacturing, 1976.80
Asset size class (000s)
Ratio $1-$500 $5,000-$25,000 $25,000-$100,000 $100,000+External equity to assets
1980 . . . . . . . . . . . . . . . . . . . . . . . .1979 . . . . . . . . . . . . . . . . . . . . . . . .1978 . . . . . . . . . . . . . . . . . . . . . . . .1977 . . . . . . . . . . . . . . . . . . . . . . . .1976 . . . . . . . . . . . . . . . . . . . . . . . .
Retained earnings to assets1980 . . . . . . . . . . . . . . . . . . . . . . . .1979 . . . . . . . . . . . . . . . . . . . . . . . .1978 . . . . . . . . . . . . . . . . . . . . . . . .1977 . . . . . . . . . . . . . . . . . . . . . . . ,1976 . . . . . . . . . . . . . . . . . . . . . . . .
Long-term debt to assets1980 . . . . . . . . . . . . . . . . . . . . . . . .1979 . . . . . . . . . . . . . . . . . . . . . . . .1978 . . . . . . . . . . . . . . . . . . . . . . . .1977 . . . . . . . . . . . . . . . . . . . . . . . .1976 . . . . . . . . . . . . . . . . . . . . . . . .
Short-term debt to assets1980 . . . . . . . . . . . . . . . . . . . . . . . .1979 . . . . . . . . . . . . . . . . . . . . . . . .1978 . . . . . . . . . . . . . . . . . . . . . . . .1977 . . . . . . . . . . . . . . . . . . . . . . . .1976 . . . . . . . . . . . . . . . . . . . . . . . .
Trade debt to assets1980 . . . . . . . . . . . . . . . . . . . . . . . .1979 . . . . . . . . . . . . . . . . . . . . . . . .1978 . . . . . . . . . . . . . . . . . . . . . . . .1977 . . . . . . . . . . . . . . . . . . . . . . . .1976 . . . . . . . . . . . . . . . . . . . . . . . .
0.130.130.140.180.16
0.290,300.280.280.29
0.180.180.170.170.16
0.210.210.210.210.20
0.180.190.190.180.19
0.130.120.130.150.16
0.330.340.350.360,35
0.180.180.160.170.17
0.210.210.210.190.19
0.150.150.150.140.13
0.160.160.170.180.19
0.330.330.340.340.34
0.280.200.200.210.20
0.190.190.180.170.17
0.120.120.120.110.10
0.160.160.170.170.18
0.280.290.300.300.28
0.250.240.240.250.26
0.190.180.170.160.15
0.120.130.120.120.12
SOURCE: US. Department of the Treasury, internal Revenue Service, Sourcebook of Statistics of/ncorne, for years 1976-80,as cited in (26)
Table 29.—Capital Commitments to lndependentPrivate Venture Capital Funds, 1979-82
1978 1979 1980 1981 1982
Total capital committed (dollars in millions):Corporations . . . . . . . . . . . $22 $28 $127 $142 $ 175Endowments and
foundations . . . . . . . . . . 19 17 92 102 96Foreign investors . . . . . . . 38 26 55 90 188Individuals and families . . 70 39 102 201 290Insurance companies.. . . 35 7 88 132 200Pension funds . . . . . . . . . . 32 53 197 200 474
Total . . . . . . . . . . . . . . . . $216 $170 $661 $867 $1,423
Percentage of total capital committed:Corporations . . . . . . . . . . . 10% 170/0 19% 170/0 120/0Endowments and
foundations . . . . . . . . . . 9 10 14 12 7Foreign investors . . . . . . . 18 15 8 10 13Individuals and families . . 32 23 16 23 21Insurance companies.. . . 16 4 13 15 14Pension funds . . . . . . . . . . 15 31 30 23 33
Total . . . . . . . . . . . . . . . . 100% 100% 100% 100% 100%
SOURCE Venture Economics, Wellesley Hills, MA, ’’Venture Capital Investmentinthe Medical Health Care Field; contract reporl Prepared for the Officeof Technology Assessment, August 1983. See app F for adescriptlonof the Venture Economics database frcrn which these data were derived.

86 ● Federal Policies and the Medical Devices Industry .
Table 30.—Percentage of Types of Venture Capital Financing in Medical Devices and Other Fields, 1982a
Other medicalType of financing Medical imaging products Industrial products Electronics
Seed money . . . . . . . . . . . . . . . . . . . . . . . . . . . . . 0% 1% 1% 1%Startup and first stage . . . . . . . . . . . . . . . . . . . . 57 56 29 35Expansion . . . . . . . . . . . . . . . . . . . . . . . . . . . . . . 43 38 37 58Leveraged buyouts and acquisitions . . . . . . . . . 0 1 27 1Other .. . . . . . . . . . . . . . . . . . . . . . . . . . . . . . . . . . 0 4 6 5
asee ‘PP, F for ~de~~~iption of the venture Economics database from which this table is derived
SOURCE: Venture Economics, Wellesley Hills. MA, “VentureCapital Investment in the Medical Health Care Field; contract report prepared for the Office of TechnologyAssessment, August 1983.
fields, even in a traditionally high-technology ing seed money must frequently look to theirproduct category such as electronics. Yet, these owners’ and friends’ contributions of both timedata also suggest that small and new firms seek- and money. See box I for an example.
THE SMALL BUSINESS INNOVATION RESEARCH
The Small Business Innovation DevelopmentAct (Public Law 97-219), enacted into law in 1982,requires each Federal agency whose extramuralR&D obligations exceed $100 million to set asidea small percentage for R&D grants or contractswith small businesses. NIH’s Small Business In-novation Research (SBIR) budget amounted to$5.6 million in fiscal year 1983 and $8.2 millionin fiscal year 1984.8 The awards are made in threephases: Phase I involves small awards of 6 months’duration for proving the scientific and technicalfeasibility of new ideas; Phase II involves furtherdevelopment of these ideas with the addition ofa plan to acquire non-Federal venture capital inthe subsequent phase; and Phase III involves onlynon-Federal capital committed to pursuit of com-mercial applications (but Federal involvementmay be in the form of agreements to purchaseproducts).
Each agency may determine the categories ofprojects within its SBIR program and has controlover the size of the maximum award in eachphase, the amount of sharing of R&D expensesrequired of awardees, and the methods and pro-cedures used to solicit and select among proposals.Because the SBIR program is specifically targetedto ideas with commercial promise, the grant awards
‘The percentage increases from 0.2 in fiscaI year 1983 to 1.25within 4 years.
8NIH actually expended $7.3 million in fiscal year 1983 (425).
are generally skewed
PROGRAM
toward applied research anddevelopment and away from-basic research.
The NIH SBIR program made its first Phase Iawards in October 1983 in the form of grants of$50,000 in total costs or less. NIH required granteesto commit to sharing in the costs of the researchand will pay no profit or fee in addition to costs.An analysis by OTA of NIH SBIR grant applica-tions and awards revealed that an estimated 42percent of the SBIR applications responding to thefirst solicitation were for medical devices (see table31). No significant differences were found in theratio of awards to proposals between medicaldevices and other types of research.
It is premature to evaluate the effectiveness ofthe SBIR program on small business innovationin medical devices. Although it is clear that therehas been a reallocation of research dollars fromother R&D programs within NIH to the SBIR ini-tiative, it is unknown to what extent the dollarshave been shifted from research funds that wouldhave gone to academic and nonprofit institutionsor from research funds that would have gone toindustry anyway. Furthermore, if the shift oc-curred within industry, it is unknown at this timeto what extent it represents a net transfer of R&Dfunds from large firms to small firms or simplya net redistribution of Federal funds among smallfirms.

Ch 4—Research and Development Policies Related to Medical Devices ● 8 7— — - — . . . -— —. .——— . -- - --

88 • Federal Policies and the Medical Devices Industry— —.. —
Table 31.–Analysis of Applications for Small Business Innovation Research (SBIR)Grants, National Institutes of Health, 1983a
Medical AllBiotechnology
bdevices other
applications applications applications
Percentage of total grant applications . . . . . . . . 60/0 420/0 520/0Percentage of applications receiving awards . . . 21% 230/o 18%
. -aSee app E for estimation methods.bproposal$ for R & D o n medical devices and other technologies using blotectmology.
cProposals for R&D on medical devices not using biotechnology.dpropo$als for R&D on technologies that neither involve the use of biotechnology nor are medical devices
SOURCE” Off Ice of Technology Assessment
Implementation of the SBIR program may alsoaffect the productivity of the SBIR program instimulating development of new medical devices.One issue is whether or not the program stimu-lates those with the best ideas from a commer-cial perspective to submit grants. It is interestingto note that in fiscal year 1983, the Departmentof Health and Human Services (DHHS) (mainlyNIH) had the lowest ratio of proposals to awards—
six to one—of all Federal agencies. The averageratio of proposals to awards for Government asa whole was 11 to 1 (425). Implementation strat-egies, including the choice of topics included inthe Public Health Service solicitation, the meth-ods used to distribute information on the SBIRprogram to small businesses, and policies regard-ing cost-sharing are likely to have influenced theproposal rates.
FEDERAL SUPPORT FOR ORPHAN DEVICESThe Federal Government has recently been
charged with the responsibility of identifying andpromoting “orphan products, ” including bothdrugs and medical devices. The Orphan Drug Act(1983, Public Law 97-414) defines orphan prod-ucts as drugs and devices for rare diseases or con-ditions. A rare disease or condition is furtherdefined in the act as one that occurs so infre-quently that there is no reasonable expectationthat the cost of developing or making the prod-uct for such a condition can be recovered fromsales of the device.
In the case of drugs, the 1983 act authorizes theSecretary of Health and Human Services to pro-vide four kinds of support for those that have beenfound to be orphans:
a 50-percent tax credit on all clinical testingexpenses associated with the drug,award of an exclusive 7-year right to mar-ket a drug that is unpatentable (through thenew drug approval authority of the Food andDrug Administration (FDA)),technical assistance in the development ofclinical testing protocols, and
• award of grants and contracts for clinicaltesting expenses associated with an orphandrug. (FDA budgeted $500,000 for this func-tion in fiscal year 1983 and $1 million in 1984(116).)
These benefits are not available to devices.
The 1983 law also established an Orphan Prod-ucts Board, with responsibility to “promote thedevelopment of drugs and devices for rare diseasesor conditions . . .,” but its specific functions relateto drugs alone. Thus, the support of orphandevices under the new law is largely a conceptionrather than a reality. Recently, however, NIH hasbecome active in supporting R&D on orphandevices. For example, the National Institute ofNeurological and Communicative Disorders andStroke issued a request early in 1984 for proposalsto develop orphan products including drugs,biological, and devices (403).
The definition of an orphan device as stated inthe 1983 law and in most discussions of the issue

Ch. 4—Research and Development Policies Related to Medical Devices . 89
(115,405) is inadequate because it fails to differen-tiate between products that are prohibitivelycostly but not particularly valuable from thosethat are both costly and valuable. Ideally, a de-vice should be considered an orphan when it canbe shown to be:
very valuable to potential users, particularlyin relation to the cost of development, pro-duction, and distribution: andso costly to develop, produce, and distrib-ute that it would be impossible or inequita-ble to expect potential users to pay a pricethat would allow producers to recover thesecosts.
To take an extreme example, a lifesaving de-vice whose cost per patient is $100,000 would belikely to meet the ideal criteria for an orphan de-vice, whereas a $100,000 per-patient device thatimproves the quality of life a bit for only a frac-tion of those who use it probably would not.
Products for rare diseases or conditions fre-quently (but not always) meet the aforementionedcriteria for an orphan device, because a large partof the cost of R&D and marketing is fixed regard-less of the number of units actually sold. Withfewer potential users over which these costs canbe spread, the price at which the device wouldhave to be sold is likely to be prohibitive. How-ever, a product for a rare disease that is not par-ticularly valuable to users in relation to its costswould not meet the two criteria above, thoughit would fall into the definition in the act.
There may also be products for relatively com-mon diseases whose costs are still high relativeto patients’ abilities to pay for them. See box Jfor a discussion of wheelchairs.
Health insurance, developed as a response tothe disparity between the cost of services and pa-tients’ abilities to pay for them, complicates mat-ters even further. Third-party payment, whichspreads the burden of payment across a broadpool of individuals, is a mechanism for render-ing previously orphaned services and products af-fordable. Indeed, because health insurance gen-erally reduces patients’ out-of-pocket costs forhealth care services, a device whose cost wouldnormally be prohibitive may have an effectiveprice well below that level. For example, coronary
artery bypass graft surgery and its related carewere estimated to cost approximately $15, 000 to$20,000 in 1981 (454). Third parties have paid fora very large share of these costs, and in 1982, ap-proximately 170,000 bypass operations were per-formed (401).
Health insurance also forces a redefinition ofthe market, because insurers’ decisions about thecoverage of a device and, if covered, the appro-priate level of payment become major determi-nants of patients’ and providers’ abilities to payfor it. If a service is not covered by health insur-ance, it may be orphaned; covered and paid forgenerously, it is not.
Thus, the definition of an orphan device is in-extricably linked to the policies of third-party pay-ers. Whereas drugs, particularly those prescribedfor use outside of hospitals and other institutions,are poorly covered by health insurance plans (in-surance paid only 26 percent of total U.S. expend-itures for outpatient prescribed medicines in 1977(180)), and may therefore occasionally be pro-hibitively costly to potential users, expensivedevices are, with exceptions, in a more favorableposition. Devices used for diagnosis or therapyin hospitals, physicians offices, and the home aregenerally covered by public and private health in-surers.
Coinsurance requirements usually follow thosefor other services provided in the same setting.For example, diagnostic laboratory tests providedas part of the physician’s office visit typically havethe same coinsurance rate (say, 20 percent) as isapplied to the physician’s own service.
An example of the difference that insurancepayment can make in the definition of an orphanis the recent characterization of an immunoassaytest for testicular cancer as an orphan by FDA(205). The test is considered an orphan device be-cause the prevalence of testicular cancer in theUnited States is less than 200,000 (116). Yet thistest will probably be covered by third-party pay-ers as a diagnostic service; so it is questionablewhether it actually requires special developmentassistance.9
‘FDA has not provided substantial assistance to the developersof the test (116).
25-406 0 - 84 - 7

90 ● Federal Policies and the Medical Devices Industry—
Thus, while insurance coverage for the use of ●
diagnostic and therapeutic devices is not complete,it is generally much higher than for outpatientdrugs. Exceptions to this general rule are: *
● preventive devices (e. g., screening tests,home self-testing kits) which are less fre-quently covered under health insurance plans;
rehabilitative devices, which are often poorlycovered under private and public third-partypayment plans (352); and
devices subject to restrictive third-party pay-ment limits (e. g., some hospital devices under‘Medicare’s per-case pricing for inpatient hos-pital care).

Ch. 4—Research and Development Policies Related to Medical Devices . 91—. —— --- . —
Even in these categories, however, most devices ficiently low price, a large enough market maywill not meet the ideal definition of an orphan. still exist despite poor coverage by third parties.If they can be developed and distributed at a suf -
STATE AND LOCALMEDICAL DEVICES
INITIATIVES RELATED TO R&D FOR
States have increasingly looked to R&D-inten-sive industries such as medical devices for eco-nomic development opportunities. A recent censusof State government initiative for high-technol-ogy development conducted by OTA identified38 programs in 22 States with dedicated” pro-grams of high-technology development (3.53). Inaddition, OTA identified 15 “high-technologyeducation” initiatives, undertaken in conjunctionwith State universities and dedicated to provid-ing to inventors and entrepreneurs skills theyneed to create firms that will develop or commer-cialize emerging technologies. Only a few of theseprograms actually provided product developmentassistance or laboratory or office space for newand growing businesses.
Perhaps the program most directly relevant tomedical devices is the Health-Care Instrument andDevice Institute (HIDI) at the State University ofNew York at Buffalo, which has been designatedby the State of New York as a State-supportedcenter to facilitate direct interface between aca-demic institutions and the needs of industry (seebox K). Although the HIDI program has severalmissions, an important one is to put into prac-tice ideas generated by inventors in the univer-sity community (113).
Another popular initiative is the establishmentof a research or science park on or adjacent toa university campus. These parks are often en-couraged by State or local tax incentives, butmany universities have also seen the advantageof encouraging this type of development. In gen-eral, these and other universitv-based initiativesare seen as a way of providing consulting oppor-tunities for faculty, employment opportunities forstudents, and enhanced research funding for theuniversity. Rensselaer Polytechnic Institute, forexample, has provided incubator space for en-trepreneurs who need assistance to start a busi-

ness (354). Several other universities also provideincubator space for students, including GeorgiaTech, Carnegie-Mellon University, MassachusettsInstitute of Technology, and the University ofMissouri (which also provides commercializationassistance to students. ) While some of these centersalso assist qualifying small businesses, their ma-jor emphasis is on the enterprising student (354).
University-based programs such as these havebeen criticized for drawing faculty away from theconduct of more basic research in favor of appliedresearch and development. There is also the re-lated issue of maintaining free and open commu-
cessful commercialization requires shielding apotential product from a firm’s competitors, aswell as obtaining proprietary rights to the inven-tion. To some extent, these requirements conflictwith the ideal of freedom of expression in aca-demic environments. Nor has it been documentedthat the resources provided by university-basedcenters are addressing the specific barriers to com-mercialization faced by small or new firms. Sincemost of these projects are relatively new, it is notpossible at this time to evaluate their effects eitheron innovation or on the quality and quantity ofbasic research.
nication within the research community. Suc-
DISCUSSION AND POLICY OPTIONSIs the current level of Federal and industry sup-
port for R&D related to medical devices adequate?Federal support for industrial R&D can be viewedas supplementing private firms’ activities in waysthat advance the public good. Federal support isjustified when private firms are not likely toengage in as much R&D as is socially desirable.
Basic research has long been recognized as be-ing particularly subject to underfunding by pri-vate firms (56,228,230). To be efficient, basic re-search should embody as few constraints as possibleon research directions and be subject to wide dis-closure of research results. These conditions con-flict with the ability of private firms to reap thefull benefits of their investment in basic research(230). Hence, private firms are likely to under-invest in basic research, and Federal support maybe necessary.
As R&D projects are more closely targeted toproducts or processes with commercial potential,however, the argument in favor of Federal sup-port becomes weaker. The private medical devicefirm is likely to be able to appropriate more fullythe benefits of its investment in R&D the closerthe project is to a commercializable device. Andas research becomes more targeted and specificto a device, the societal gains from full disclosureof research findings decline.
Two conditions suggest that the present levelof private R&D for medical devices is generallyadequate. First, if industrial R&D responds to thedemands of the market, as has been suggested byseveral observers (273,276), then the high levelof demand for medical devices resulting fromhealth insurance and other third-party paymentfor health care would argue that medical devicesR&D has been adequately, perhaps more thanadequately, stimulated. Second, the $5.4 billionFederal investment in health R&D (404) providesa rich and continuing source of new scientificknowledge that creates opportunities for devel-opment of new medical devices.
Against this positive picture for R&D on med-ical devices is the potentially deleterious effect ofpremarket regulation on the cost and uncertaintyof investment in R&D for new medical devices.A Louis Harris survey reported that because ofFDA regulations, 27 percent of responding firmsstated that they would not consider developinga new Class III device10 and another 11 percentstated that they would be unlikely to consider anydevice development (197).
‘oA new Class 111 device must be approved by FDA as safe andeffective prior to marketing (see ch. .s).

Ch. 4—Research and Development Policies Related to Medical Devices ● 9 3
However, the available evidence seems to sug-gest that, except perhaps for small firms and man-ufacturers of Class III devices, the medical devicesregulations as they have been implemented havenot added substantially to the cost of develop-ment, because the vast majority of devices intro-duced since the passage of medical device regu-lations in 1976 have not been required to undergorigorous premarket testing (see ch. 5 for details).However, firms have been subject to some uncer-tainty about how the regulations would be applied.
The Federal Government has recently embarkedon a new strategy —the SBIR program—that doesnot increase overall R&D budgets but insteadshifts the allocation of health R&D funds fromother uses to the program’s recipients (smallfirms). The NIH SBIR budget is likely to comeat least partially from funds that would otherwisebe used for basic research and would go to non-profit institutions. Therefore, the program prob-ably results in a small net shift of health R&Dfunds toward the development of medical devices.It is impossible to know whether this shift is inthe best interest of society. Given that the SBIRprogram will consume an increasing proportionof NIH grant and contract funds in the future,continuing scrutiny of the program’s grant solic-itation and selection methods is advisable.
There are specific areas where increased tar-geted Federal support of R&D on medical devicesmay be justified. True orphan devices—thosemeeting the dual criteria of high per-unit cost ofdevelopment and distribution relative to poten-tial users’ ability to pay and high value in rela-tion to cost—are by definition worthy of support.However, it is difficult to differentiate betweendevices that lack a sufficient market because thosewho value them highly cannot afford them anddevices that lack a market because their extrabenefits to society do not outweigh the costs ofbringing them to market. Sound criteria for iden-tifying devices meeting the ideal definition of or-phan have not been developed either in the lawor in regulations.
The problem of orphan devices may grow aspressures to contain health care costs lead third-party payers to develop increasingly restrictive
payment policies. Because the definition of a trueorphan device is inextricably linked to the pol-icies of major third-party payers regarding cov-erage and levels of payment, criteria for identi-fying orphan devices will have to take these pay-ment policies into account.
There appear to be sound theoretical reasonsfor supporting development of devices meetingthe ideal definitions of orphan: high value in rela-tion to cost and high per-unit cost of developmentand distribution relative to potential users’ abilityto pay. Whether in practice there are many de-vices that meet this definition, however, has notbeen investigated.
One way to assist the development of orphandevices, apart from providing direct Federal grantsand contracts for R&D, would be to amend theOrphan Drug Act (Public Law 97-414) to makeorphan devices eligible for the tax credits andgrants offered under that act. The act currentlyprovides a 50-percent tax credit for all clinicaltesting expenses associated with an orphan drugand authorizes the Secretary of Health and HumanServices to make grants for clinical testing. It isimportant to recognize, however, that the cur-rently inadequate definition of orphan productsin the law, which depends on the “rare disease”criterion to identify orphan drugs, may encouragedevices that are not worth their costs to societyto be designated as orphans. Thus, it would prob-ably be premature to change the law until criteriaand methods of analysis are developed that willallow for adequate differentiation between devicesthat lack a market because they are truly orphanedand those that are simply not worth their coststo society.
Option I: Mandate that DHHS develop criteriaand methods for identifying true orphandevices.
This option would be particularly useful now,when Medicare is implementing restrictive newpayment policies in hospitals and changes in phy-sician payment are being contemplated. Withoutadequate methods for assessing the extent towhich a given device meets criteria for orphan-hood, decisions about R&D subsidies (either

94 ● Federal Policies and the Medical Devices Industry
through direct grants or tax subsidies) for orphan such criteria and methods would probably requiredevice development are unlikely to be appro- participation of a number of constituent agenciespriate. of DHHS, including FDA, NIH, and the Health
Because the criteria for orphanhood go well Care Financing Administration.
beyond issues of safety, effectiveness, and diseaseincidence to payment issues, the development of

5.Regulation of Medical Devices bythe Food and Drug Administration
Hearts will never be practical until they can be made unbreakable.—The Wizard of Oz

Contents
PageIntroduction . . . . . . . . . . . . . . . . . . . . . . . . . . . . . . . . . . . . . . . . . . . . . . . . . . . . . . . . . . 97Legislative History of Device Regulation . . . . . . . . . . . . . . . . . . . . . . . . . . . . . . . . . . 97The Medical Device Amendment of 1976. . . . . . . . . . . . . . . . . . . . . . . . . . . . . . . .Implementation of the Medical Device Law . . . . . . . . . . . . . . . . . . . . . . . . . . . . . .
Registration of Firms and Listings of Devices . . . . . . . . . . . . . . . . . . . . . . . . . . .Premarket Notification. . . . . . . . . . . . . . . . . . . . . . . . . . . . . . . . . . . . . . . . . . . . . . .Classification of Devices . . . . . . . . . . . . . . . . . . . . . . . . . . . . . . . . . . . . . . . . . . . . .Reclassification of Devices . . . . . . . . . . . . . . . . . . . . . . . . . . . . . . . . . . . . . . . . . . .Good Manufacturing Practices . . . . . . . . . . . . . . . . . . . . . . . . . . . . . . . . . . . . . . . .Performance Standards . . . . . . . . . . . . . . . . . . . . . . . . . . . . . . . . . . . . . . . . . . . . . . .Investigational Device Exemptions . . . . . . . . . . . . . . . . . . . . . . . . . . . . . . . . . . . . .Premarket Approval. . . . . . . . . . . . . . . . . . . . . . . . . . . . . . . . . . . . . . . . . . . . . . . . . .Postmarketing Surveillance . . . . . . . . . . . . . . . . . . . . . . . . . . . . . . . . . . . . . . . . . . . .Other Provisions of the Law . . . . . . . . . . . . . . . . . . . . . . . . . . . . . . . . . . . . . . . . .
Discussion and Conclusions . . . . . . . . . . . . . . . . . . . . . . . . . . . . . . . . . . . . . . . . . . . .Scope of Medical Device Regulation . . . . . . . . . . . . . . . . . . . . . . . . . . . . . . . . . . .Regulation of Preamendments Class III Devices
and Their Postamendments Equivalents . . . . . . . . . . . . . . . . . . . . . . . . . . . . .Regulation of Intermediate Classes of Devices . . . . . . . . . . . . . . . . . . . . . . . . .Postmarketing Controls . . . . . . . . . . . . . . . . . . . . . . . . . . . . . . . . . . . . . . . . . . . . . . .Impact of the Amendments on Medical Devices Firms . . . . . . . . . . . . . . . . . . . .Conclusions . . . . . . . . . . . . . . . . . . . . . . . . . . . . . . . . . . . . . . . . . . . . . . . . . . . . . . .
Policy Options . . . . . . . . . . . . . . . . . . . . . . . . . . . . . . . . . . . . . . . . . . . . . . . . . . . . . . .Scope of Medical Device Regulation, . . . . . . . . . . . . . . . . . . . . . . . . . . . . . . . . . .Regulation of Preamendments Devices
and Their Postamendments Equivalents . . . . . . . . . . . . . . . . . . . . . . . . . . . . . .Regulation of Classic, or intermediate, Devices . . . . . . . . . . . . . . . . . . . . . . .Postmarketing Monitoring and Controls . . . . . . . . . . . . . . . . . . . . . . . . . . . . . .
Assistance to Small Manufacturers . . . . . . . . . . . . . . . . . . . . . . . . . . . . . . . . . . . . . .
LIST OF TABLESTable No.32. Number of ’’510k” Submissions and Number Found Not
Substantially Equivalent 1976-83 . . . . . . . . . . . . . . . . . . . . . . . . . . . . . . . . . . .33. Classification of Preamendments Device Types by
Medical Specialty Category, February 1984.. . . . . . . . . . . . . . . . . . . . . . . . .34. Classification Status of Preamendments Device Types,
February 1984... . . . . . . . . . . . . . . . . . . . . . . . . . . . . . . . . . . . . . . . . . . . . . . . . . .35. Number of Postamendments Class III Devices Found
Substantially Equivalent to Preamendments Devicesby Medical Specialty Category, 1976-83 ..,.. . . . . . . . . . . . . . . . . . . . . . . . . .
36. Investigational Device Exemptions (IDEs) for Significant Risk Devicesby Medical Specialty Category, 1977-82. . . . . . . . . . . . . . . . . . . . . . . . . . . . . . .
37. Approved Premarket Approval Applications (PMAAs)by Medical Specialty Category, 1977-82 . . . . . . . . . . . . . . . . . . . . . . . . . . . . .
FIGURESFigure No.1. How To Get to Market With a Medical Device . . . . . . . . . . . . . . . . . . . . . . . . .2. U.S. Patent Applications for Low-Technology Medical Devices, 1968-79 . . .3. U.S. Patent Applications for High-Technology Medical Devices, 1968-79 . . .
98102102103105107109109111112114116117118
118120120121126126127
128131132132
Page
104
106
106
107
112
113
Page
101123124

5.Regulation of Medical Devices by
the Food and Drug Administration
INTRODUCTIONThe Medical Device Amendments of 1976 (Pub-
lic Law 94-295) consolidated and expanded ex-isting Federal authority over medical devices intoa system of regulating the safety and effectivenessof medical devices in proportion to the degree ofrisk that they pose. In the past 2 years, interestin the law has grown because of problems thathave surfaced in implementing some key provi-sions and because of concerns regarding the costsof some provisions relative to the incrementalgains in safety and effectiveness.
The Subcommittee on Oversight and Investiga-tions of the House Committee on Energy andCommerce held hearings on the Food and DrugAdministration’s (FDA) implementation of thestatute in July 1982 (336) and issued an oversightreport in 1983 (338). The General Accounting Of-
fice also reviewed implementation of the Medi-cal Device Amendments and issued its report inSeptember 1983 (331). Most recently, in February1984, the Subcommittee on Health and the Envi-ronment of the House Committee on Energy andCommerce held oversight hearings on the law andits implementation (337). These hearings and in-vestigations have focused on FDA’s priorities andpace in implementing the amendments and onthose provisions of the law which, in view of theexperiences gained since the law’s enactment, havenot worked as intended.
The 1976 law, its history, its implementationby FDA, and key unresolved issues are addressedin this chapter. The chapter concludes with a pres-entation of a range of options addressed to themajor objectives of the law.
LEGISLATIVE HISTORY OF DEVICE REGULATIONMedical device regulation was first authorized
in the Federal Food, Drug, and Cosmetic Act of1938. (This act is best known for requiring pre-market notification for the safety of new drugs,a requirement that was extended to include pre-market approval of the efficacy as well as thesafety of new drugs in the Drug Amendments of1962.) The 1938 act defined medical devices as (21U.S.C. § 321 (h)):
. . . instruments, apparatus, and contrivances, in-cluding their components, parts and accessories,intended (1) for use in the diagnosis, care, miti-gation, treatment, or prevention of disease in manor other animals; or (2) to affect the structureor any function of the body of man or otheranimals.
The 1938 act authorized FDA to inspect any sitein which devices were manufactured, processed,
packed, or held (21 U.S.C. § 374). It also author-ized FDA to seize adulterated or misbranded med-ical devices; request an injunction against theirproduction, distribution, or use; or seek criminalprosecution of the responsible manufacturer ordistributor. But the agency could not take actionuntil after a device had been marketed.
In the early regulatory actions taken againstadulterated or misbranded devices, FDA was ableto use expert testimony to prove its allegations.Over time, however, FDA increasingly had to testdevices suspected of violating the law in order toremove these devices from the market (340).
As medical devices became more complex afterWorld War II, attention turned to the regulationof legitimate devices as well. But FDA could stillact only after devices were distributed and also
97

98 . Federal Policies and the Medical Devices Industry
had the burden of proving that a particular itemwas misbranded or unsafe, because devices werenot subject to premarket approval (12). In the late1960s, however, the courts ruled that certainproducts (such as nylon sutures and antibiotic-sensitive discs) that fell in the grey area betweendrugs and devices could legally be considereddrugs and subjected to premarket approval re-quirements for new drugs (12,302); subsequently,FDA regulated as “new drugs” such products assome intrauterine devices (IUDs), some contactlenses, and some in vitro diagnostic products.
Furthermore, during the late 1960s, Congressaddressed public health problems associated withradiation emissions from electronic products.Under the Radiation Control for Health and SafetyAct of 1968 (Public Law 90-602), Congress estab-lished a radiation control program to authorize theestablishment of standards for electronic products,including medical and dental radiology equipment.
From the early 1960s to 1975, six Presidentialmessages were given and 28 bills were introducedto enact medical device legislation.
A 1969 Department of Health, Education, andWelfare review of the scientific literature for in-juries associated with medical devices that wasconducted by the Cooper Committee (named afterits chairman, Theodore Cooper, then Director of
the National Heart, Lung, and Blood Institute ofthe National Institutes of Health) estimated thatover a 10-year period, 10,000 injuries were asso-ciated with medical devices, of which 731 resultedin death (339).
The vast majority of these problems were asso-ciated with three device types: artificial heartvalves, 512 deaths and 300 injuries; cardiac pace-makers, 89 deaths and 186 injuries; and intrauterinecontraceptive devices, 10 deaths and 8,000 injuries(339). As observers noted, however, there hadbeen no sensational event or public tragedy tospur more stringent regulation of medical devicessuch as the events leading to the 1962 Drug Amend-ments (165,328).
Additional examples of hazards associated withmedical devices were documented in congressionalhearings in 1973. These included prosthetic andorthopedic implants of improper materials, car-diac defibrillator with faulty electrical circuitry,incubators in which temperatures reached as highas 1450 F, plastic tracheotomy tubes with obstruc-tions, and faulty valves on emergency oxygenrespirators (339).
The developments just described eventuallyculminated in the enactment of the Medical De-vice Amendments of 1976 (Public Law 94-295).
THE MEDICAL DEVICE AMENDMENTS OF 1976The situation prior to enactment of the Medical ●
Device Amendments in 1976 was that FDA couldimpose premarket approval requirements on onlya limited number of devices that could legally be ●
considered new drugs (see above). FDA did havethe power to inspect the premises where deviceswere manufactured and distributed, but had no
●
power to require that owners of these premisesnotify FDA that they were in the device business.
to require that businesses involved with med-ical devices register their establishments andlist their devices annually,to impose regulatory requirements (standardsor premarket approval) in proportion to thedegree of risk of a device, andto impose other general controls on all de-vices to assure safety and effectiveness.
And FDA could attempt to remove mislabeled or FDA continues to have the authority granted byunsafe devices only on a case-by-case basis afterthe devices had been marketed. the 1938 act to inspect any establishment in which
devices are manufactured, processed, or packed,As a result of the 1976 Medical Device Amend- whether or not these establishments are exempt
ments, FDA currently has the authority: from registration.

Ch. 5—Regulation of Medical Devices by the Food and Drug Administration ● 9 9
The definition of medical device was changedin the 1976 amendments to (Public Law 94-295):
. . . an instrument, apparatus, implement, ma-chine, contrivance, implant, in vitro reagent, orother similar or related article, including any com-ponent, part or accessory, which is—(1) recognized in the official National Formulary,
(2)
(3)
This
or the United States Pharmacopoeia, or anysupplement to them,intended for use in the diagnosis of disease orother conditions, or in the cure, mitigation,treatment, or prevention of disease, in man orother animals, orintended to affect the structure or any func-tion of the body of man or other animals, andwhich does not achieve any of its principalintended purposes through chemical actionwithin or on the body of manor other animalsand which is not dependent upon being metab-olized for the achievement of any of its prin-cipal intended purposes.
last clause in the definition (not achievingits principal purposes through “chemical actionwithin or on the body” and “not dependent uponbeing metabolized”) distinguishes devices fromdrugs.
Devices are to be categorized by type, on thebasis of recommendations from FDA classifica-tion panels, into three regulatory classes reflect-ing their potential risk:
● Class I—general controls,● Class II—performance standards, and● Class III—premarket approval.
Class I, general controls, encompasses devicesfor which general controls authorized by the actare sufficient to provide reasonable assurances ofsafety and effectiveness. Tongue depressors arean example. Manufacturers of Class I and all otherdevices must register their establishments and listtheir devices with FDA, notify FDA at least 90days before they intend to market the device, andconform to good manufacturing practices. Goodmanufacturing practices apply to the manufactur-ing, packing, storage, and installation of devices.
Class II, performance standards, contains de-vices for which general controls are consideredinsufficient to ensure safety and effectiveness andinformation exists to establish performance stand-ards. X-ray devices are an example.
Class III, premarket approval, applies to de-vices for which general controls are insufficientto ensure safety and efficacy, information doesnot exist to establish a performance standard, andthe device supports life, prevents health impair-ment, or presents a potentially unreasonable riskof illness or injury. Cardiac pacemakers are anexample.
Preamendments devices were to be so classifiedand placed in Class I, II, or III. Postamendmentsdevices found to be “substantially equivalent” toproducts on the market before 1976 were to beput into the same class as their preamendmentscounterparts and could be marketed immediately,although those in Class III could eventually be re-quired to demonstrate safety and effectiveness.Other postamendments devices were to be auto-matically classified into Class 111, although themanufacturer could petition FDA for reclassifica-tion into Class I or II; thus, these devices couldnot be marketed until they had completed FDApremarket approval for safety and effectiveness,
In implementing the 1976 amendments, pre-amendments Class 111 devices and their postamend-ments substantially equivalent counterparts wereto be treated differently from truly new post-amendments Class III devices. The 1976 amend-ments stipulate that manufacturers of preamend-ments Class III devices cannot be required topresent safety and effectiveness evidence until 30months after the effective date of a final classifica-tion regulation or until 90 days after publicationof a final regulation requiring submission of evi-dence on safety and effectiveness, whicheverperiod is longer (21 U.S. C. § 351(f)(2)(B)). In theinterim, preamendments Class 111 devices and theirpostamendments substantial equivalents can con-tinue to be marketed, subject only to the samegeneral controls as applied to Class I devices.
Manufacturers of any of the following devicesare required by section 510(k) of the law to notifyFDA at least 90 days prior to marketing them:
●
●
●
a device that is to be marketed for the firsttime,a device or product line that may be similarto one already marketed by another manu-facturer, ora version of an existing device in a form sig-

100 ● Federal Policies and the Medical Devices Industry
nificantly changed or sufficiently modified toaffect its safety and effectiveness.
The manufacturer’s 510k premarket notificationmust contain enough information so that FDA candetermine whether or not the device is “substan-tially equivalent” to a device already being mar-keted. To be found substantially equivalent, apostamendments device need not be identical toa preamendments device, but must not differmarkedly in materials, design, or energy source.
The legislative history reflects a congressionalintent that the term “substantially equivalent” beconstrued narrowly where necessary to assuresafety and effectiveness, but less narrowly in in-stances where differences between a postamend-ments device and a preamendments device did notrelate to safety and effectiveness (340). If FDAdetermines that a postamendments device is sub-stantially equivalent to one already in use, themanufacturer may market the device.
If FDA finds that a device is not substantiallyequivalent to one already in use before the 1976amendments, the device must go through a pre-market approval process. In this case, it is auto-matically classified into Class 111, although themanufacturer may petition FDA to reclassify itinto Class I or Class II. (Class I devices can bemarketed, subject only to the general controlssummarized earlier. Since FDA has published noperformance standards for Class II devices (seesection on “Performance Standards” below), thesedevices have been subject only to general con-trols. ) For a Class III device that is not substan-tially equivalent to a pre-1976 device, informa-tion must be provided to FDA to document itssafety and effectiveness before the device can beapproved by FDA for marketing.
In order to develop the safety and efficacy in-formation necessary for market approval of aClass III device, the sponsor of such a device mayapply to FDA for an “investigational device ex-emption” (IDE). An IDE, the parallel to the in-vestigational new drug (IND) process in drug reg-ulation, permits limited use of an unapproveddevice in controlled settings. Upon completion ofclinical investigations under the IDE, the spon-sor may submit to FDA a premarketing approvalapplication (PMAA) presenting the results of the
clinical investigations, an explanation of what thedevice consists of and how it works, manufactur-ing data that show compliance with good manu-facturing practices, and other information thatFDA may require.
If FDA approves this PMAA, the device maybe marketed. (The amendments provide an alter-native to the IDE/PMAA route to marketing ap-proval for Class III devices, called a “product de-velopment protocol, ” but this has never beenused. The major difference between the productdevelopment protocol and the IDE/PMAA proc-ess is that in the former, FDA would participatein deciding how the device is to be tested. Oncethe product development protocol is completed,the testing results would be submitted to FDA forapproval of the device for marketing (388). )
Finally, the situation for certain “transitionaldevices” (i.e., devices that were regulated as “newdrugs” before enactment of the 1976 amendments)is comparable to that for postamendments devicesthat are not substantiality equivalent to preamend-ments devices. Transitional devices are automat-ically classified into Class 111, which requirespremarket approval, but may be reclassified,subsequent to petitioning FDA, into Class I orClass II,
The current process of getting a medical deviceto market is summarized in figure 1.
The Medical Device Amendments contain otherprovisions worth noting that are applicable to allmedical devices. First, sale, distribution, or useof a device may be restricted by FDA if there can-not otherwise be reasonable assurances of itssafety and effectiveness. A device maybe bannedif it presents substantial deception or an unreason-able and substantial risk of illness or injury.
Second, manufacturers, importers, and distrib-utors of devices may be required to establish andmaintain additional records, make reports, andprovide information to FDA to assure that theirdevices are safe and effective.
Third, devices are subject to the color additiveprovisions of the Federal Food, Drug, and Cos-metic Act, but only if the color additive comesin direct contact with the body for a significantperiod of time.

Ch. 5—Regulation of Medical Devices by the Food and Drug Administration ● 101
Figure 1.— How To Get to Market With a Medical Device
MARKET
+
general purpose articlesdevices used in research and teaching
Yes custom devices
MARKETSOURCE: U.S. Department of Health and Human Services, Food and Drug Adrninistratkm, Bureau of Medical Devices, Regulatory ~equirements for ~arketing
a Device (Washington, DC: U.S. Government Printing Office, 19S2).
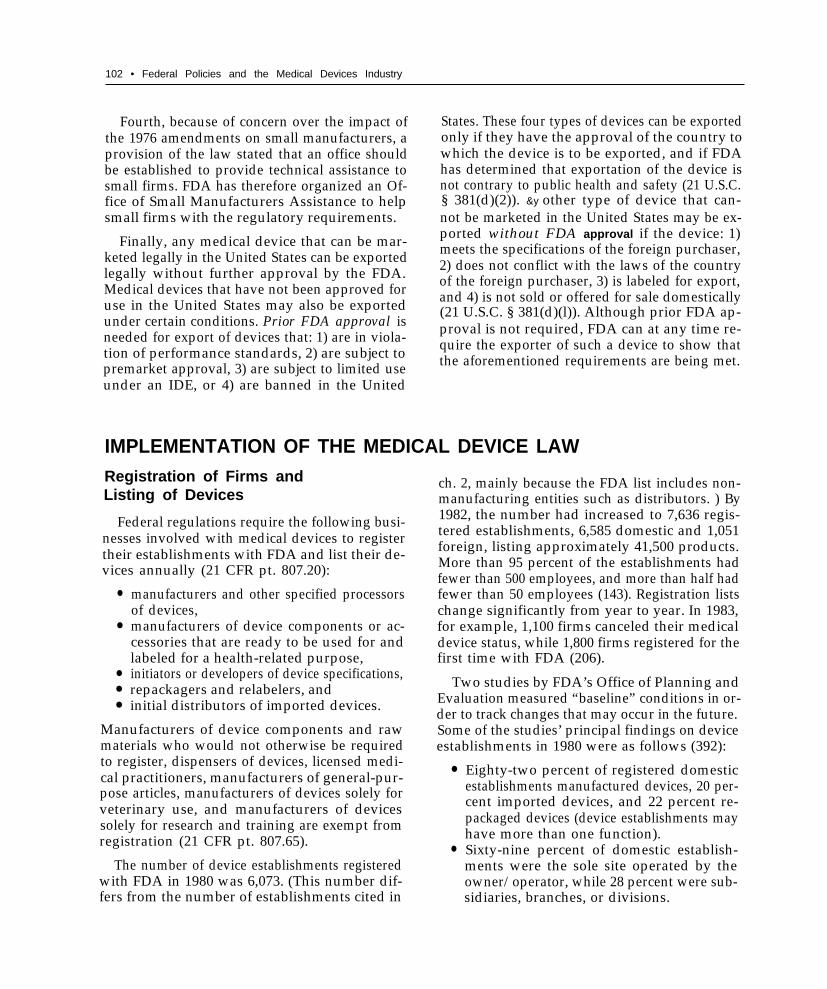
102 • Federal Policies and the Medical Devices Industry
Fourth, because of concern over the impact ofthe 1976 amendments on small manufacturers, aprovision of the law stated that an office shouldbe established to provide technical assistance tosmall firms. FDA has therefore organized an Of-fice of Small Manufacturers Assistance to helpsmall firms with the regulatory requirements.
Finally, any medical device that can be mar-keted legally in the United States can be exportedlegally without further approval by the FDA.Medical devices that have not been approved foruse in the United States may also be exportedunder certain conditions. Prior FDA approval isneeded for export of devices that: 1) are in viola-tion of performance standards, 2) are subject topremarket approval, 3) are subject to limited useunder an IDE, or 4) are banned in the United
States. These four types of devices can be exportedonly if they have the approval of the country towhich the device is to be exported, and if FDAhas determined that exportation of the device isnot contrary to public health and safety (21 U.S.C.§ 381(d)(2)). &y other type of device that can-not be marketed in the United States may be ex-ported without FDA approval if the device: 1)meets the specifications of the foreign purchaser,2) does not conflict with the laws of the countryof the foreign purchaser, 3) is labeled for export,and 4) is not sold or offered for sale domestically(21 U.S.C. § 381(d)(l)). Although prior FDA ap-proval is not required, FDA can at any time re-quire the exporter of such a device to show thatthe aforementioned requirements are being met.
IMPLEMENTATION OF THE MEDICAL DEVICE LAWRegistration of Firms andListing of Devices
Federal regulations require the following busi-nesses involved with medical devices to registertheir establishments with FDA and list their de-vices annually (21 CFR pt. 807.20):
●
●
●
●
●
manufacturers and other specified processorsof devices,manufacturers of device components or ac-cessories that are ready to be used for andlabeled for a health-related purpose,initiators or developers of device specifications,repackagers and relabelers, andinitial distributors of imported devices.
Manufacturers of device components and rawmaterials who would not otherwise be requiredto register, dispensers of devices, licensed medi-cal practitioners, manufacturers of general-pur-pose articles, manufacturers of devices solely forveterinary use, and manufacturers of devicessolely for research and training are exempt fromregistration (21 CFR pt. 807.65).
The number of device establishments registeredwith FDA in 1980 was 6,073. (This number dif-fers from the number of establishments cited in
ch. 2, mainly because the FDA list includes non-manufacturing entities such as distributors. ) By1982, the number had increased to 7,636 regis-tered establishments, 6,585 domestic and 1,051foreign, listing approximately 41,500 products.More than 95 percent of the establishments hadfewer than 500 employees, and more than half hadfewer than 50 employees (143). Registration listschange significantly from year to year. In 1983,for example, 1,100 firms canceled their medicaldevice status, while 1,800 firms registered for thefirst time with FDA (206).
Two studies by FDA’s Office of Planning andEvaluation measured “baseline” conditions in or-der to track changes that may occur in the future.Some of the studies’ principal findings on deviceestablishments in 1980 were as follows (392):
●
●
Eighty-two percent of registered domesticestablishments manufactured devices, 20 per-cent imported devices, and 22 percent re-packaged devices (device establishments mayhave more than one function).Sixty-nine percent of domestic establish-ments were the sole site operated by theowner/operator, while 28 percent were sub-sidiaries, branches, or divisions.

Ch. 5—Regulation of Medical Devices by the Food and Drug Administration • 103
●
●
●
●
●
●
Ninety-three percent of domestic owner/operators (3,948 out of 4,245 in 1980) oper-ated only one medical device establishment.Forty-two percent of the domestic establish-ments had 20 or fewer employees, while 29percent had 100 or more employees.Larger establishments were more likely thansmall establishments to: 1) produce moretypes of devices, 2) make an “exclusive” de-vice (a device made by only one or twoestablishments), 3) make a Class III device,or 4) make a “critical” device (defined belowin the section on “Good ManufacturingPractices”).Sixty-four percent of listed manufacturersmade devices in only one medical specialtyarea (as defined by FDA’s list of classifica-tion panels).Medical device establishments other thanthose making diagnostic devices averaged 4.4products each, while diagnostic device estab-lishments averaged 6.4 products each.There was little overlap between manufac-turers of medical devices and diagnostic de-vices. Establishments making dental, oph-thalmic, and radiological devices were alsohighly specialized. Therefore, there appearsto be a segmentation of the industry betweenmedical and diagnostic devices, and a furthersegmentation of the medical devices portionof the industry between establishments thatare highly specialized and those that makedevices in several areas.
The other study (391) looked at “availability”of devices, or the number of products for eachdevice type. A device type may include all prod-ucts of a particular type (e.g., cardiac pacemakers)or may include groupings of separate types ofdevices that are similar. The more products of atype, the greater the availability of products ofthat type. The analysis in this study was basedon device classifications that were establishedenough to use at the time of the analysis, ordevices from about half of the FDA classificationpanels established (see “Classification” sectionbelow). Its principal findings on availability wereas follows (391):
● On average, there were nine products pertype, i.e., each device type was made by anaverage of nine establishments.
●
●
●
●
●
Product availability was related to class ofdevice. Class I device types averaged 13.1products per type; Class II, 7.9 products; andClass III, 4.5 products.Devices with only one or two manufacturerscomprised 28 percent of all device types.Forty-one percent of Class 111, 28 percent ofClass II, and 24 percent of Class I devicetypes had only one or two manufacturers.Foreign establishments made 17 percent ofthe products examined. Eleven percent of allexclusive types had only foreign manufac-turers; 4 percent were made solely by foreignmanufacturers.Foreign products accounted for 21 percent ofClass III devices, 19 percent of Class II, and15 percent of Class I devices.More than one-third of all obstetrics-gyne-cology products and nearly two-thirds ofClass I neurological products were of foreignorigin.
Premarket Notification
In addition to listing their devices annually, de-vice establishments must notify FDA through the510k notification process (see above) when theyintend to market new devices.
Postamendments devices that are not found byFDA to be “substantially equivalent” to preamend-ments devices or to postamendments devices thathave been reclassified into Class I or II are pre-sumed to be Class III, and hence to need pre-market approval unless the device’s sponsor suc-cessfully petitions FDA to reclassify the deviceinto Class I or II. However, the overwhelming ma-jority of postamendments devices are from man-ufacturers who are marketing existing device typesfor the first time or who have devices that are mi-nor modifications of existing devices. Thus, the510k premarket notification process, together withthe FDA finding that devices are substantiallyequivalent to preamendments devices, has becomethe predominant route by which postamendmentsdevices have reached the market.
An indication of the extent to which postamend-ments devices have been regulated through the510)k notification process is reflected in the factthat, of more than 17,000 notifications receivedfor fiscal year 1977 through fiscal year 1981, only

104 ● Federal Policies and the Medical Devices Industry— .
approximately 300 were found to be not sub-stantially equivalent and therefore automaticallyplaced in Class III. For 65 of these, petitions forreclassification were received; 28 were approved,5 denied, 28 withdrawn or converted to othertypes of submissions, and 4 were still active atthe end of fiscal year 1981, Of the 28 approvals,3 were reclassified from Class III to I, and 25 fromClass III to II (143). The number of 510k submis-sions and the number of submissions found notsubstantially equivalent since 1976 are summa-rized by year in table 32.
The purpose of the 510k notification processwas to keep FDA apprised of what was going onin the industry. The concept of “substantial equiv-alence” was included in the law to address thequestion of how to treat pre- and postamendmentsdevices fairly. Two issues were involved: 1) a dou-ble standard would exist if a postamendments de-vice had to go through the premarketing approvalprocess before it could be marketed, while anidentical preamendments device would continueto be marketed; and 2) a type of monopoly wouldin effect be given to a preamendments device ifidentical pre- and postamendments devices weretreated differently.
The 510k process, together with a determina-tion of substantial equivalence, has been used ex-tensively for postamendments devices to avoid
Table 32.—Number of “510k” Submissions andNumber Found Not Substantially
Equivalent, 1976-83
NumberNumber found not
of “510k” substantiallyYear submissions equivalent
1976 (7 months). . . . . .1977 . . . . . . . . . . . . . . .1978 . . . . . . . . . . . . . . .1979 . . . . . . . . . . . . . . .1980 . . . . . . . . . . . . . . .1981 . . . . . . . . . . . . . . .1982 . . . . . . . . . . . . . . .1983 . . . . . . . . . . . . . . .
Total . . . . . . . . . . . . .
1,3622,4272,1802,7143,3163,6523,780a
N Ab
84743447363553 2d
19,431C 365d
aEstimate.bNA indicates information not available.cExcluding 1983.‘As Of July 1983.
SOURCE: U.S. Department of Health and Human Services, Food and Drug Ad-ministration, unpublished data, Silver Spring, MD, 1983.
Class III designation and its automatic require-ment for premarket approval, or to avoid the in-volved rulemaking process necessary to reclassifysuch devices from Class III to Class I or II.
Use of the substantial equivalence clause to per-mit the marketing of devices without premarketapproval has been encouraged by FDA’s regula-tions and practices. First, FDA’s initial proposedregulations that would have required submissionof a 510k notice if modifications could affectsafety and effectiveness were changed. In the pro-posed regulations, if FDA determined that modi-fications could affect safety and effectiveness,there would be no finding of substantial equiva-lence, and an evaluation of the difference wouldhave been made in a PMAA or in a reclassifica-tion petition from automatic Class III designation(53). In the final regulation, however, FDA changedthe wording to “changes that could significantlyaffect the safety or effectiveness of the device”(emphasis added) (21 CFR pt. 807.81(a)(3)(i)).
Second, FDA allows manufacturers to traceback through a chain of substantially equivalentpostamendments devices to a device on the mar-ket before the amendments were enacted. For ex-ample, a 1982 device may be approved as substan-tially equivalent to a 1981 device, which wasapproved as equivalent to a 1979 device, and soon eventually back to a preamendments device.This practice has been labeled “piggybacking” or,alternatively, “equivalence creep” (53,331).
Third, the amount of data required to showsubstantial equivalence varies widely, dependingon the device. All devices that have been deter-mined not to be substantially equivalent andwhich thus must go through premarket approvalare reviewed centrally, but there is no such cen-tral review for devices that have been found tobe substantially equivalent (47).
Another issue relating to the 510k notificationprocess is whether or not notification require-ments should be applied to Class I devices. In Sep-tember 1982, the Scientific Apparatus MakersAssociation petitioned FDA to drop 510k notifica-tion requirements for Class I device types and tosimplify reporting requirements for Class 11 andIII (82). The petition claimed that Class I deviceswould still be subject to the registration require-
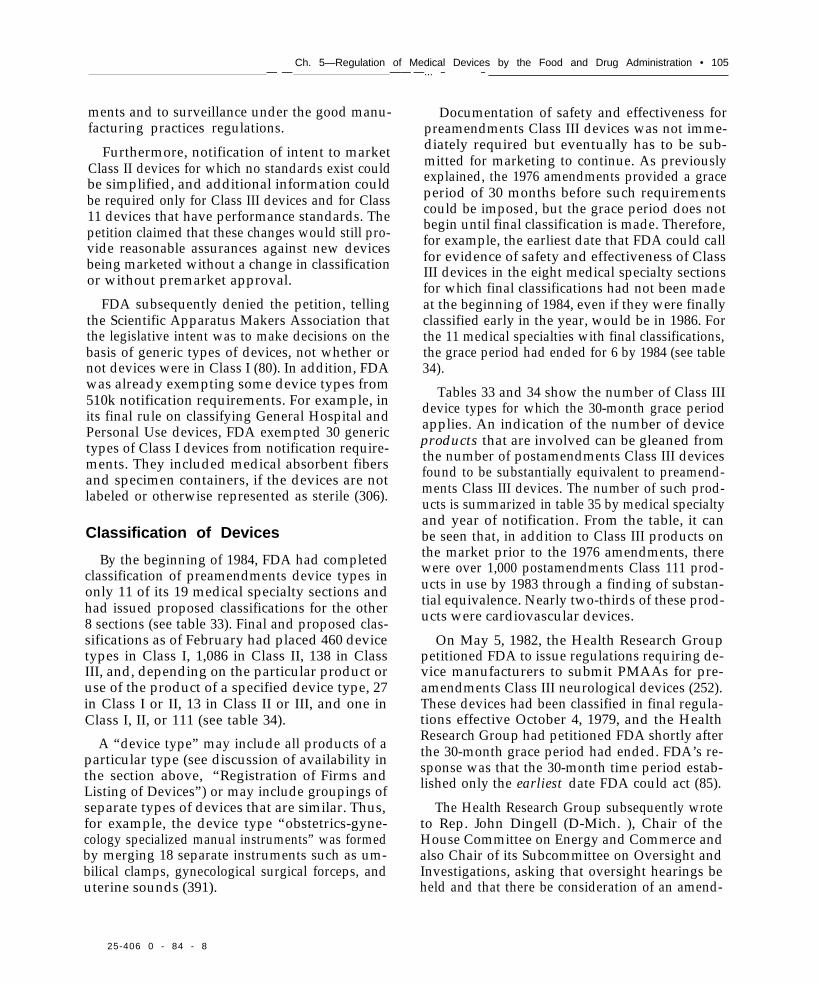
Ch. 5—Regulation of Medical Devices by the Food and Drug Administration • 105— — —— —... — —
ments and to surveillance under the good manu-facturing practices regulations.
Furthermore, notification of intent to marketClass II devices for which no standards exist couldbe simplified, and additional information couldbe required only for Class III devices and for Class11 devices that have performance standards. Thepetition claimed that these changes would still pro-vide reasonable assurances against new devicesbeing marketed without a change in classificationor without premarket approval.
FDA subsequently denied the petition, tellingthe Scientific Apparatus Makers Association thatthe legislative intent was to make decisions on thebasis of generic types of devices, not whether ornot devices were in Class I (80). In addition, FDAwas already exempting some device types from510k notification requirements. For example, inits final rule on classifying General Hospital andPersonal Use devices, FDA exempted 30 generictypes of Class I devices from notification require-ments. They included medical absorbent fibersand specimen containers, if the devices are notlabeled or otherwise represented as sterile (306).
Classification of Devices
By the beginning of 1984, FDA had completedclassification of preamendments device types inonly 11 of its 19 medical specialty sections andhad issued proposed classifications for the other8 sections (see table 33). Final and proposed clas-sifications as of February had placed 460 devicetypes in Class I, 1,086 in Class II, 138 in ClassIII, and, depending on the particular product oruse of the product of a specified device type, 27in Class I or II, 13 in Class II or III, and one inClass I, II, or 111 (see table 34).
A “device type” may include all products of aparticular type (see discussion of availability inthe section above, “Registration of Firms andListing of Devices”) or may include groupings ofseparate types of devices that are similar. Thus,for example, the device type “obstetrics-gyne-cology specialized manual instruments” was formedby merging 18 separate instruments such as um-bilical clamps, gynecological surgical forceps, anduterine sounds (391).
Documentation of safety and effectiveness forpreamendments Class III devices was not imme-diately required but eventually has to be sub-mitted for marketing to continue. As previouslyexplained, the 1976 amendments provided a graceperiod of 30 months before such requirementscould be imposed, but the grace period does notbegin until final classification is made. Therefore,for example, the earliest date that FDA could callfor evidence of safety and effectiveness of ClassIII devices in the eight medical specialty sectionsfor which final classifications had not been madeat the beginning of 1984, even if they were finallyclassified early in the year, would be in 1986. Forthe 11 medical specialties with final classifications,the grace period had ended for 6 by 1984 (see table34).
Tables 33 and 34 show the number of Class IIIdevice types for which the 30-month grace periodapplies. An indication of the number of deviceproducts that are involved can be gleaned fromthe number of postamendments Class III devicesfound to be substantially equivalent to preamend-ments Class III devices. The number of such prod-ucts is summarized in table 35 by medical specialtyand year of notification. From the table, it canbe seen that, in addition to Class III products onthe market prior to the 1976 amendments, therewere over 1,000 postamendments Class 111 prod-ucts in use by 1983 through a finding of substan-tial equivalence. Nearly two-thirds of these prod-ucts were cardiovascular devices.
On May 5, 1982, the Health Research Grouppetitioned FDA to issue regulations requiring de-vice manufacturers to submit PMAAs for pre-amendments Class III neurological devices (252).These devices had been classified in final regula-tions effective October 4, 1979, and the HealthResearch Group had petitioned FDA shortly afterthe 30-month grace period had ended. FDA’s re-sponse was that the 30-month time period estab-lished only the earliest date FDA could act (85).
The Health Research Group subsequently wroteto Rep. John Dingell (D-Mich. ), Chair of theHouse Committee on Energy and Commerce andalso Chair of its Subcommittee on Oversight andInvestigations, asking that oversight hearings beheld and that there be consideration of an amend-
25-406 0 - 84 - 8

106 ● Federal Policies and the Medical Devices Industry
Table 33.-Classification of Preamendments Device Types by Medical Specialty Category, February 1984
ClassI or II or I, II,
Medical specialty category Proposed Final I II Ill II Ill or Ill Total
Neurology. . . . . . . . . . . . . . . . . . . . . . . . . . . .Cardiovascular . . . . . . . . . . . . . . . . . . . . . . . .Obstetrics-gynecology . . . . . . . . . . . . . . . . .Hematology . . . . . . . . . . . . . . . . . . . . . . . . .
}(combined) . . . . . . . . . . . . . .
PathologyGeneral hospital and personal use.............Anesthesiology . . . . . . . . . . . . . . . . . . . . . . .Immunology
)} (combined) .......................
Microbiology . . . . . . . . . . . . . . . . . . . . . . . .Physical medicine . . . . . . . . . . . . . . . . . . . . .Gastroenterology-urology . . . . . . . . . . . . . . .
Subtotal . . . . . . . . . . . . . . . . . . . . . . . . . . .Dental . . . . . . . . . . . . . . . . . . . . . . . . . . . . . . .General and plastic surgery . . . . . . . . . . . . .Ear, nose, and throat . . . . . . . . . . . . . . . . . . .Ophthalmology . . . . . . . . . . . . . . . . . . . . . . .Radiology . . . . . . . . . . . . . . . . . . . . . . . . . . . .Clinical chemistry
}(combined)....................
Clinical toxicology . . . . . . . . . . . . . . . . . . .Orthopedics . . . . . . . . . . . . . . . . . . . . . . . . . .
Subtotal . . . . . . . . . . . . . . . . . . . . . . . . . . .
Total . . . . . . . . . . . . . . . . . . . . . . . . . . . . . .
11128/784/9/794/3/799/11/79
9/11/798/2417911/2/794122/80
4122/808128/791/23/81
12/30/801/191821122/821126/8211291822112/82
2/12/82712182
9/4/792/5/802/261809/12/80
9/12/8010/21/807/16/821119/82
11191821112318311123183
——————
——
2435
42
5121
93
329
6610848
60
39105
64
4232
28049231045
7
31
15
56412225475164
175
38
180 522
460 1,086
11 024 116 0
6 0
2 27 0
5 0
2 09 4
82 713 15 0
10 04 190 0
0 0
24 0
5 6 2 0— —138 27
0 02 00 0
1 0
0 01 0
0 0
5 02 0
1 1 00 01 00 00 01 1
0 0
0 0
2 1—1 3 1
10113869
109
94134
162
8156
9441855467
11973
206
77
781
1,725
SOURCE: Federa/ Register publications of specified dates
Table 34.—Classification Status of PreamendmentsDevice Types, February 1984
Class
I or Il or I II,Status I II Ill II Ill or lll TotalFinal . . . . . . . . 280 5 6 4 8 2 7 1 1 0 9 4 4Proposed . . . . . 180 522 56 20 2 1 781— —
Total . . . . . . . 460 1,086 138 27 13 1 1,725
SOURCE: Seetable33.
ment to the device amendments that would clearlyestablish a definite time for submission of datafor preamendments and substantially equivalentClass III devices (83). The Health Research Grouppetitioned FDA again in March 1983, this timefor preamendments Class III obstetrics-gynecol-ogy devices and their substantial equivalents,pointing out that the 30-month grace period hadended on August 31, 1982 (253).
In September 1983, FDA issued its first ’’Noticeof Intent” to initiate proceedings requiring ap-proval for continued marketing of preamend-
merits Class III devices and their postamendmentssubstantial equivalents in the five medical spe-cialty categories for which the 30-month graceperiod had expired. FDA identified the followingdevices in these five medical specialty categoriesas being the first device types for which safety andeffectiveness evidence would be required (321).
● Hematology and Pathology (combined)1. Automated differential cell counter2. Automated heparin analyzer3. Automated blood cell separator
● Cardiovascular1. Implantable pacemaker pulse2. Pacemaker programmer3. Replacement heart valve
● General hospital and personal use1. Infant radiant warmer
● Neurology1. Implanted cerebella stimulator2. Implanted diaphragmatic/phrenic nerve
stimulator3. Implanted intracerebral/subcortical stim-
ulator for pain relief

Ch. 5—Regulation of Medical Devices by the Food and Drug Administration ● 107
Table 35.—Number of Postamendments Class Ill Devices Found Substantially Equivalent toPreamendments Devices by Medical Specialty Category, 1976-83
1976Medical specialty category (7 mos.) 1977 1978 1979 1980 1981 1982 (as of 7/83) Total
Anesthesiology a. . . . . . . . . . . . . . . . . . . . . . . . . . . 1 3 5 3 9 3 1 2 27Cardiovascular . . . . . . . . . . . . . . . . . . . . . . . . . . . 33 71 89 121 114 143 94 51 716Clinical chemistry . . . . . . . . . . . . . . . . . . . . . . . . . 0 0 0 0 1 2 0 0 3Clinical toxicology. . . . . . . . . . . . . . . . . . . . . . . . . 0 0 0 0 0 1 0 0 1Dental . . . . . . . . . . . . . . . . . . . . . . . . . . . . . . . . . . . 2 6 5 5 4 6 11 3 42Ear, nose, and throat. . . . . . . . . . . . . . . . . . . . . . . o 3 3 6 5 0 3 0 20Gastroenterology-urology a . . . . . . . . . . . . . . . . . . 0 4 2 3 8 5 8 10 40General and plastic surgery . . . . . . . . . . . . . . . . . 6 5 2 6 5 14 2 5 45General hospital and personal usea . . . . . . . . . . 0 1 0 2 2 2 2 1 10Hematology a . . . . . . . . . . . . . . . . . . . . . . . . . . . . . o 9 2 8 4 0 3 1 27lmmunology a . . . . . . . . . . . . . . . . . . . . . . . . . . . . . 1 4 1 3 3 2 1 16Microbiology a . . . . . . . . . . . . . . . . . . . . . . . . . . . o 5 4 8 12 10 3 1 43Neurology a . . . . . . . . . . . . . . . . . . . . . . . . . . . . . . . 5 6 2 3 8 5 2 0 31Pathology a . . . . . . . . . . . . . . . . . . . . . . . . . . . . . . . o 0 0 0 0 0 2 0 2Obstetrics-gynecology a . . . . . . . . . . . . . . . . . . . . 2 2 3 1 3 2 0 2 15Ophthalmology . . . . . . . . . . . . . . . . . . . . . . . . . . . 2 3 7 5 3 3 9 6 38Orthopedics . . . . . . . . . . . . . . . . . . . . . . . . . . . . . . o 1 0 1 2 2 0 2 8Physical medicinea . . . . . . . . . . . . . . . . . . . . . . . . o 1 1 1 0 0 0 0 3Radiology . . . . . . . . . . . . . . . . . . . . . . . . . . . . . . . . o 0 0 1 0 1 3 0 5
Total . . . . . . . . . . . . . . . . . . . . . . . . . . . . . . . . . .— — — —
52 124 126 175 183 202 145 85 1,092
%Iassification completed (as of the endof19S3) (see table 33).
SOURCE: U.S. Department of Health and Human Sewices, Food and Drug Administration, unpublished data, Silver Spring, MD, 19S3.
● Obstetrics-gynecologyl. Transabdominal amnioscope (fetoscope)
and accessories2. Contraceptive uterine device (IUD) and in-
troducer3. Contraceptive tubal occlusion device (TOD)
and introducer
The Federal Register notice also announced thatFDA was proposing a rule to require the filing ofa PMAA for one of these devices, the implantedcerebellar stimulator. Four months after the an-nouncement, no PMAAs had been submitted,probably because of difficulty in providing datathat supported the stimulator’s safety and effec-tiveness (86). If IDEs are obtained, however, theimplanted cerebellar stimulator may continue tobe used for the limited purpose of obtaining safetyand effectiveness data from clinical trials (321).
Reclassification of Devices
As explained earlier, the sponsors of postamend-merits devices that are not substantially equivalentto preamendments devices and are automaticallyput in Class III may petition FDA for reclassifica-tion into Class I or II. The major reclassificationissue has not been with these devices, however,
but with one of the transitional devices—contactlenses,
Under the 1976 Medical Device Amendments,transitional devices (products that had previouslybeen regulated as ’’newdrugs”) were automaticallyclassified in Class III and made subject to pre-market approval requirements, although the man-ufacturers could petition FDA for reclassification.All contact lenses made of polymers other thanpolymethyl-methacrylate (hard lenses) had beenpreviously declared to be “new drugs” and placedin Class 111 when the 1976 amendments wereenacted. Subsequently, some manufacturers didthe testing required to meet the premarket ap-proval requirements.
In March 1981, the Contact Lens ManufacturersAssociation (CLMA), representing predominantlysmall contact lens manufacturers, petitioned FDAto reclassify from Class 111 to 11 contact lenses con-sisting principally of rigid plastic materials. CLMA’scontention was that these lenses were safe and ef-fective enough to be placed in Class II, thus mak-ing further testing unnecessary.
FDA subsequently concluded that CLMA’s peti-tion did not meet all of the requirements of theregulations (21 CFR pt. 860.123). The agency also

108 ● Federal Policies and the Medical Devices Industry
1932 Early 1950s
Mid 1970s
Photo credits: Alan R. Kahn
This picture shows three steps in the evolution of the cardiac pacemaker, from a device carried on the patient’s back,to an external device with internal leads, to a fully implantable pacemaker Implantable cardiac pacemakers are regulated
as Class Ill devices
determined that the objective of CLMA’s petition In December 1983, FDA withdrew the proposedwas meritorious, however, and in November rule on rigid gas-permeable lenses on the basis of1982, proposed to reclassify both daily-wear soft the fact that its review found insufficient publicly
contact lenses and daily-wear rigid gas-permeable available, valid scientific evidence to show thatcontact lenses from Class III to Class I (rather than the device was safe and effective (323). The in-to Class II) (313). formation had to be based on “valid scientific
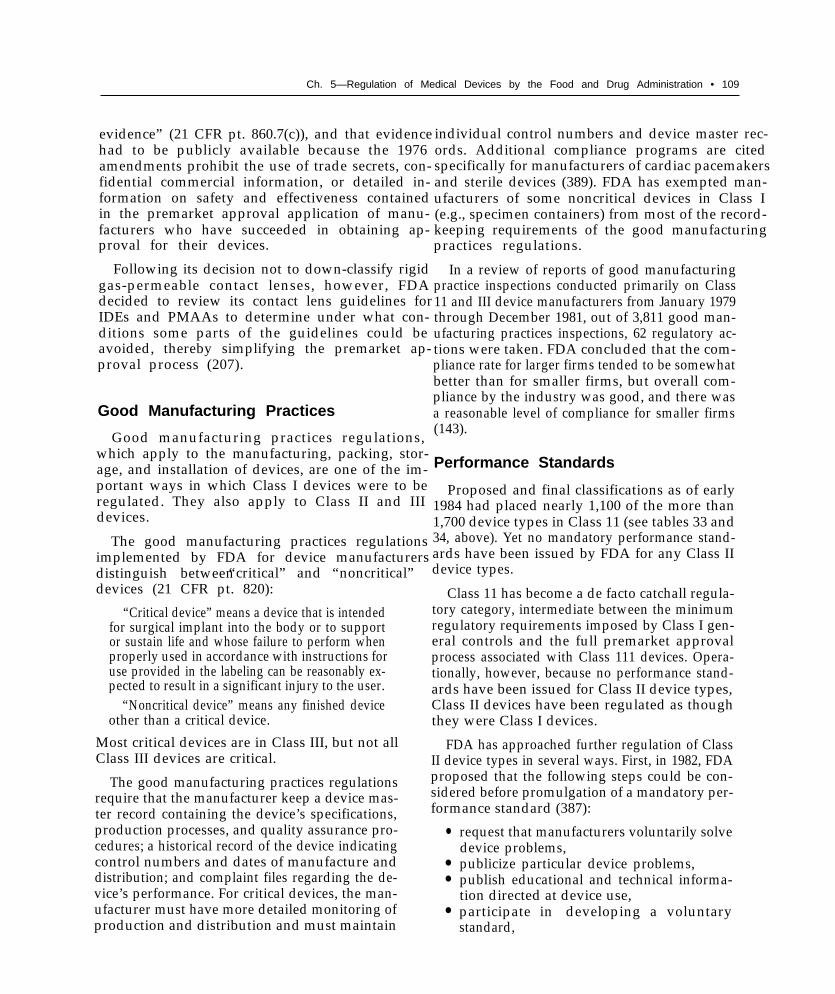
Ch. 5—Regulation of Medical Devices by the Food and Drug Administration • 109
evidence” (21 CFR pt. 860.7(c)), and that evidencehad to be publicly available because the 1976amendments prohibit the use of trade secrets, con-fidential commercial information, or detailed in-formation on safety and effectiveness containedin the premarket approval application of manu-facturers who have succeeded in obtaining ap-proval for their devices.
Following its decision not to down-classify rigidgas-permeable contact lenses, however, FDAdecided to review its contact lens guidelines forIDEs and PMAAs to determine under what con-ditions some parts of the guidelines could beavoided, thereby simplifying the premarket ap-proval process (207).
Good Manufacturing Practices
Good manufacturing practices regulations,which apply to the manufacturing, packing, stor-age, and installation of devices, are one of the im-portant ways in which Class I devices were to beregulated. They also apply to Class II and IIIdevices.
The good manufacturing practices regulationsimplemented by FDA for device manufacturersdistinguish between“critical” and “noncritical”devices (21 CFR pt. 820):
“Critical device” means a device that is intendedfor surgical implant into the body or to supportor sustain life and whose failure to perform whenproperly used in accordance with instructions foruse provided in the labeling can be reasonably ex-pected to result in a significant injury to the user.
“Noncritical device” means any finished deviceother than a critical device.
Most critical devices are in Class III, but not allClass III devices are critical.
The good manufacturing practices regulationsrequire that the manufacturer keep a device mas-ter record containing the device’s specifications,production processes, and quality assurance pro-cedures; a historical record of the device indicatingcontrol numbers and dates of manufacture anddistribution; and complaint files regarding the de-vice’s performance. For critical devices, the man-ufacturer must have more detailed monitoring ofproduction and distribution and must maintain
individual control numbers and device master rec-ords. Additional compliance programs are citedspecifically for manufacturers of cardiac pacemakersand sterile devices (389). FDA has exempted man-ufacturers of some noncritical devices in Class I(e.g., specimen containers) from most of the record-keeping requirements of the good manufacturingpractices regulations.
In a review of reports of good manufacturingpractice inspections conducted primarily on Class11 and III device manufacturers from January 1979through December 1981, out of 3,811 good man-ufacturing practices inspections, 62 regulatory ac-tions were taken. FDA concluded that the com-pliance rate for larger firms tended to be somewhatbetter than for smaller firms, but overall com-pliance by the industry was good, and there wasa reasonable level of compliance for smaller firms(143).
Performance Standards
Proposed and final classifications as of early1984 had placed nearly 1,100 of the more than1,700 device types in Class 11 (see tables 33 and34, above). Yet no mandatory performance stand-ards have been issued by FDA for any Class IIdevice types.
Class 11 has become a de facto catchall regula-tory category, intermediate between the minimumregulatory requirements imposed by Class I gen-eral controls and the full premarket approvalprocess associated with Class 111 devices. Opera-tionally, however, because no performance stand-ards have been issued for Class II device types,Class II devices have been regulated as thoughthey were Class I devices.
FDA has approached further regulation of ClassII device types in several ways. First, in 1982, FDAproposed that the following steps could be con-sidered before promulgation of a mandatory per-formance standard (387):
●
●
●
●
request that manufacturers voluntarily solvedevice problems,publicize particular device problems,publish educational and technical informa-tion directed at device use,participate in developing a voluntarystandard,

110 • Federal Policies and the Medical Devices Industry
● make use of other general controls such asthose for adulteration and misbranding, and
● develop guidelines.
Second, in mid-1982, the Administration sub-mitted to Congress a proposal to repeal the pres-ent statutory procedures for developing and estab-lishing performance standards for medical devicesby substituting a simpler notice-and-commentrulemaking procedure under the AdministrativeProcedures Act. The device amendments requirea five-step process: 1) initiate by Federal Registernotice a proceeding for a performance standard,which provides the opportunity for manufacturersto request a change in classification, denial of re-quests for reclassification, or initiation of reclas-sification by Federal Register notice; 2) invite per-sons by Federal Register notice to submit an ex-isting standard as a proposed performance stand-ard or an offer to develop such a standard; 3) ac-cept or reject such offers or proceed to developsuch standards; 4) publish a notice of proposedrulemaking; and 5) promulgate a performancestandard (21 CFR pt. 861.20).
The proposal the Administration submitted toCongress would have eliminated the second andthird steps. Rep. Henry A. Waxman (D-Calif. ),Chair of the Subcommittee on Health and theEnvironment of the House Committee on Energyand Commerce, agreed to sponsor the bill butadded a section requiring manufacturers to notifyFDA if they learn of device defects that presentunreasonable risks of substantial harm (see subse-quent section on “Postmarketing Surveillance” fora related discussion). H.R. 7052, the Medical De-vice Amendments of 1982, was introduced byRep. Waxman on August 19, 1982, but was notacted on. Similar legislation, including discre-tionary authority to apply performance standards,was reported to be under consideration at the De-partment of Health and Human Services/FDA atthe beginning of 1984 (87).
Third, in mid-1983, FDA finally identified 11priority Class II devices, announced its intent toproceed with development of performance stand-ards, and started the five-step process (see above)by providing the opportunity to submit a requestfor a change in the classification of the first ofthese 11 devices, the continuous ventilator (320).
Do the 1976 Medical Device Amendments infact require the use of performance standards?Two sections of the amendments seem in conflicton this point. Section 514(a)(l) of the act statesthat: “The Secretary may by regulation . . . es-tablish a performance standard for a Class II de-vice” (emphasis added). But the act’s definitionof a Class 11 device is: “A device which cannotbe classified as a Class I device because the [ClassI] controls . . . by themselves are insufficient toprovide reasonable assurance of the safety and ef-fectiveness of the device, for which there is suffi-cient information to establish a performance stand-ard to provide such assurance, and for which itis therefore necessary to establish for the devicea performance standard . . . to provide reason-able assurance of its safety and effectiveness” (em-phasis added) (§ 513(a)(l)(B)).
What if there is insufficient information toestablish a performance standard? That conditionin itself does not require Class III designation. Adevice is a Class III device if it “cannot be classifiedas a Class II device because insufficient informa-tion exists for the establishment of a performancestandard . . . and (it) is purported or representedto be for a use in supporting or sustaining humanlife or for a use which is of substantial importancein preventing impairment of human health, orpresents a potential unreasonable risk of illnessor injury” (emphasis added) (§ 513(a)(l)(0).FDA, in classifying a device into Class II, has hadto conclude that sufficient information to developperformance standards in fact exists (see the def-inition of Class II, above). Yet the fact that nomandatory performance standards have beenissued casts doubt on this conclusion.
Moreover, FDA has chosen Class II instead ofClass III designation even in some cases wherea device was of an implantable type. This is il-lustrated by proposed classifications for Generaland Plastic Surgery devices, where seven im-plantable device types (including artificial chins,ears, and noses) were proposed for Class II in-stead of Class 111 designation (311). The HealthResearch Group, commenting on these proposedclassifications, stated that implantable devicesshould be in Class III (253).

Ch. 5—Regulation of Medical Devices by the Food and Drug Administration • 111
Investigational Device Exemptions
An IDE permits limited use of an unapprovedClass III medical device in controlled settings forthe purpose of collecting data on safety and ef-fectiveness. This information can subsequently beused in support of a PMAA.
The regulations that FDA has implemented onIDEs make a distinction, which is not expresslystated in the law, between “significant risk” and“nonsignificant risk” devices. A “significant riskdevice” is an investigational device that (21 CFRpt. 812.3(m)):
(1)
(2)
(3)
(4)
is intended as an implant and presents a po-tential for serious risk to the health, safety,or welfare of a subject;is purported or represented to be for a use insupporting or sustaining human life and presentsa potential for serious risk to the health,safety, or welfare of a subject;is for a use of substantial importance in diag-nosing, curing, mitigating, or treating disease,or otherwise preventing impairment of humanhealth and presents a potential for serious riskto the health, safety, or welfare of a subject;orotherwise presents a potential for serious riskto the health, safety, or welfare of a subject.
Sponsors of investigations of significant riskdevices must obtain approval by an institutionalreview board, if one exists, and must also applyfor an IDE from FDA. Investigations may notbegin until FDA approval is granted. The deter-mination of whether a device is a significant riskdevice is initially made by the sponsor. The in-stitutional review board reviewing the investiga-tional plan also makes this determination and hasthe authority to approve, require modifications,or disapprove the investigational plan. If the re-view board disagrees with a sponsor’s conclusionthat a device is a nonsignificant risk device, thesponsor has to notify FDA and apply for an IDE.
If no institutional review board exists or if FDAfinds the institutional review board’s review in-adequate, the sponsor may submit an applicationfor an IDE directly to FDA (21 CFR pt. 812.62).FDA will then decide whether an IDE is needed.The sponsor of a nonsignificant risk device neednot apply for an IDE but must obtain approval
to test the device from the institutional reviewboard of the institution where testing will occurand must meet certain reporting, recordkeeping,and monitoring requirements.
The IDE not only allows device sponsors to testthe Class III device before approval is obtainedfor marketing, but also is a method of keepingFDA apprised of the existence of clinical testing.For nonsignificant risk devices, FDA need not ac-tually be informed of the specifics of testing, andthese devices are considered to have approved ap-plications for IDEs as long as the institutional re-view board has approved the testing and certainrecordkeeping and other requirements are met (21CFR pt. 812.2(b)).
(At a December 1983 meeting of the Food andDrug Law Institute, an FDA official unofficiallyraised the idea of a written notification to FDAof the existence of a nonsignificant risk investiga-tion in addition to the normal nonsignificant riskIDE procedures. The principal purpose was to in-form FDA of the existence of clinical testing toensure that a reasonable amount of safety and ef-fectiveness information was gathered in prepara-tion for premarket approval, and to prevent man-ufacturers from profiting on unapproved devices(81).)
In a few instances, FDA guidelines have estab-lished requirements concerning the numbers of pa-tients required in a clinical study and the lengthof time they need to be followed. For example,in December 1983 FDA advised manufacturers ofYAG (yttrium aluminum garnet) lasers, a Class111 device which is used in cataract surgery, thata reasonable study population was 500 patientsstudied for 6 months and that the sponsors shouldnot add to the study without FDA approval (81).
The number of significant risk IDEs that havebeen issued from 1977 to 1982 is summarized intable 36 by medical specialty category. The num-bers in that table reflect the changing status of theIDE regulations. Until 1978, FDA required IDEapplications solely for studies of certain Class IIIdevices that had been previously regulated as newdrugs (i.e., “transitional devices”). In February1978, the IDE regulations for intraocular lensesbecame effective (21 CFR pt. 813), and IDE ap-

112 ● Federal Policies and the Medical Devices Industry
Table 36.—lnvestigational Device Exemptions (IDEs) for Significant Risk Devices byMedical Specialty Category, 1977-82
Medical specialty category 1977 1978a 1979 1980b 1981 1982
Anesthesiology . . . . . . . . . . . . . . . . . . . . . . . . . .Cardiovascular . . . . . . . . . . . . . . . . . . . . . . . . . . . .Clinical chemistry . . . . . . . . . . . . . . . . . . . . . . . . .Clinical toxicology ., . . . . . . . . . . . . . . . . . . . . . . .Dental ............ . . . . . . . . . . . . . . . . . . .Ear, nose, and throat . . . . . . . . . . . . . . . . . . . . . . .Gastroenterology-urology . . . . . . . . . . . . . . . . . . .General and plastic surgery . . . . . . . . . . . . . . . . .General hospital and personal use . . . . . . . . . . .Hematology . . . . . . . . . . . . . . . . . . . . . . . . . . . . . .Immunology . . . . . . . . . . . . . . . . . . . . . . . . . . . . . .Microbiology . . . . . . . . . . . . . . . . . . . . . . . . . . . . .Neurology . . . . . . . . . . . . . . . . . . . . . . . . . . . , . . . .Pathology . . . . . . . . . . . . . . . . . . . . . . . . . . . . . . . .Obstetrics-gynecology. . . . . . . . . . . . . . . . . . . . . .Ophthalmology . . . . . . . . . . . . . . . . . . . . . . . . . . .Orthopedics . . . . . . . . . . . . . . . . . . . . . . . . . . . . . .Physical medicine . . . . . . . . . . . . . . . . . . . . . . . . .Radiology . . . . . . . . . . . . . . . . . . . . . . . . . . . . . . . .
Total . . . . . . . . . . . . . . . . . . . . . . . . . . . . . . . . . .
000000042000000
0o0
7
030000010010000
48000
53
o 02 212 00 01 40 11 102 50 40 00 20 13 20 00 21
21 240 41 00 6
33 105
8 1139 320 10 00 21 4
28 217 124 40 02 00 04 90 0
53 3434 3412 11
2 09 1
203 176
Total
1997
3076
603114
051
180
108C
16227
316
577alntraocular lens regulation final in February 1978blDEregula~onf inal in January 1980.cAlmost exclusively cervical cap studies.
SOURCE: U.S. Department of Health and Human Services, Food and Drug Adminmtration unpubhshed data, Sflver Spring, MD, 1983
placations for intraocular lenses began to be re-ceived. In January 1980, IDE regulations appli-cable to other types of devices were made final(21 CFR pt. 812).
The relationship between requests for approvaland FDA’s finding that IDEs were in fact neededis indicated by the fact that nearly 60 percent ofapproximately 400 requests for approval of IDEsfor significant risk devices that FDA received be-tween July 1981 and July 1982 were approved withor without additional conditions within 30 days.The remainder were disapproved, subject toad-ditional justification, withdrawn by the sponsor,or returned to the sponsor with the finding thatan IDE was not necessary (143).
Premarket Approval
In 1980, FDA developed guidelines for the sub-mission of PMAAs and also published proposedregulations on premarket approval requirements(308). However, the regulations had not beenfinalized by early 1984. Under the guidelines cur-rently inuse, when a PMAA is approved, the ap-proval letter states that information on adversereactions and device defects must be reportedwithin 10 days. And according to an FDA pre-scription device regulation (21 CFR pt. 801.109)
predating the 1976 amendments, certain devicesmay be sold or distributed only by or on the or-der of licensed practitioners. FDA has used theserestrictions as a condition of approval for certaindevices.
As indicated earlier, the only types of devicesthat have had to go through the full premarketapproval process so far are: 1) postamendmentsdevices that are not substantially equivalent topreamendments devices, and 2) ’’transitional de-vices” that have not been reclassified as Class Ior II and postamendments devices substantiallyequivalent to them. Preamendments Class IIIdevices and their postamendments equivalents willeventually have to go through a similar approvalprocess. In September 1983, FDA identified thefirst 13 preamendments Class III device types forwhich evidence of safety and effectiveness willsoon be required if continued marketing is to beallowed (see section on “Classification of De-vices, ” above) (321).
The number of postamendments Class III de-vices that have successfully passed through thefull premarket approval process and the numberof transitional devices that have received pre-market approval from 1977 to 1982 are summar-ized in table 37 by medical specialty category.

Ch. 5—Regulation of Medical Devices by the Food and Drug Administration • 113
Table 37.—Approved Premarket Approval Applications (PMAAs) by MedicalSpecialty Category, 1977-82
Medical specialty category 1977 1978 1979 1980 1981 1982 Total—Approved PMAAs:Anesthesiology . . . . . . . . . . . . . . . . . . . . . . . . . . .Cardiovascular . . . . . . . . . . . . . . . . . . . . . . . . . . . .Clinical chemistry . . . . . . . . . . . . . . . . . . . . . . . . .Clinical toxicology . . . . . . . . . . . . . . . . . . . . . . . . .Dental . . . . . . . . . . . . . . . . . . . . . . . . . . . . . . . . . . .Ear, nose, and throat . . . . . . . . . . . . . . . . . . . . . . .Gastroenterology–urology . . . . . . . . . . . . . . . . . . .General and plastic surgery . . . . . . . . . . . . . . . . .General hospital and personal use . . . . . . . . . . .Hematology . . . . . . . . . . . . . . . . . . . . . . . . . . . . . .Immunology . . . . . . . . . . . . . . . . . . . . . . . . . . . . . .Microbiology . . . . . . . . . . . . . . . . . . . . . . . . . . . . .Neurology. . . . . . . . . . . . . . . . . . . . . . . . . . . . . . . .Pathology . . . . . . . . . . . . . . . . . . . . . . . . . . . . . . . .Obstetrics-gynecology . . . . . . . . . . . . . . . . . . . . .Ophthalmology . . . . . . . . . . . . . . . . . . . . . . . . . . .Orthopedics . . . . . . . . . . . . . . . . . . . . . . . . . . . . . .Physical medicine . . . . . . . . . . . . . . . . . . . . . . . .Radiology . . . . . . . . . . . . . . . . . . . . . . . . . . . . . . . .
Total . . . . . . . . . . . . . . . . . . . . . . . . . . . . . . . . . .
Approved PMAAs for new devices:Anesthesiology . . . . . . . . . . . . . . . . . . . . . . . . . . .Cardiovascular . . . . . . . . . . . . . . . . . . . . . . . . . . . .Clinical chemistry . . . . . . . . . . . . . . . . . . . . . . . . .Clinical toxicology . . . . . . . . . . . . . . . . . . . . . . . . .Dental . . . . . . . . . . . . . . . . . . . . . . . . . . . . . . . . . . .Ear, nose, and throat . . . . . . . . . . . . . . . . . . . . . . .Gastroenterology-urology. . . . . . . . . . . . . . . . . . .General and plastic surgery . . . . . . . . . . . . . . . . .General hospital and personal use . . . . . . . . . . .Hematology . . . . . . . . . . . . . . . . . . . . . . . . . . . . . .Immunology . . . . . . . . . . . . . . . . . . . . . . . . . . . . . .Microbiology . . . . . . . . . . . . . . . . . . . . . . . . . . . . .Neurology . . . . . . . . . . . . . . . . . . . . . . . . . . . . . . . .Pathology . . . . . . . . . . . . . . . . . . . . . . . . . . . . . . . .Obstetrics-gynecology . . . . . . . . . . . . . . . . . . . . .Ophthalmology . . . . . . . . . . . . . . . . . . . . . . . . . . .Orthopedics . . . . . . . . . . . . . . . . . . . . . . . . . . . . . .Physical medicine . . . . . . . . . . . . . . . . . . . . . . . . .Radiology . . . . . . . . . . . . . . . . . . . . . . . . . . . . . . . .
Total . . . . . . . . . . . . . . . . . . . . . . . . . . . . . . . . . .
Approved PMAAs for transitional devices:Anesthesiology . . . . . . . . . . . . . . . . . . . . . . . . . . .Cardiovascular . . . . . . . . . . . . . . . . . . . . . . . . . . . .Clinical chemistry . . . . . . . . . . . . . . . . . . . . . . . . .Clinical toxicology . . . . . . . . . . . . . . . . . . . . . . . . .Dental . . . . . . . . . . . . . . . . . . . . . . . . . . . . . . . . . . .Ear, nose, and throat . . . . . . . . . . . . . . . . . . . . . . .Gastroenterology-urology . . . . . . . . . . . . . . . . . . .General and plastic surgery . . . . . . . . . . . . . . . . .General hospital and personal use . . . . . . . . . . .Hematology . . . . . . . . . . . . . . . . . . . . . . . . . . . . . .Immunology . . . . . . . . . . . . . . . . . . . . . . . . . . . . . .Microbiology . . . . . . . . . . . . . . . . . . . . . . . . . . . . .Neurology ....., . . . . . . . . . . . . . . . . . . . . . . . . . .Pathology . . . . . . . . . . . . . . . . . . . . . . . . . . . . . . . .Obstetrics-gynecology . . . . . . . . . . . . . . . . . . . . .
o1000000000000000007
01000000000000000007
000000000000000
00000000000000000000
00000000000000000000
o00000000000000
0400101000050006200
19
o300101000050000200
12
o10000000000000
120000041034000
12100
28
1200000010040000100
9
o00000040030000
331010042002100
22100
40
3210000220021000000
13
o100
0o20000000
450000222001200
20200
40
4500002120012000100
18
o00000010000000
815
10203
10503
12300
60600
128
813
101033500
123000
4o
53
o20010070030000

114 ● Federal Policies and the Medical Devices Industry
Table 37.—continued
Medical specialty category 1977 1978 1979 1980 1981 1982 Total
Ophthalmology . . . . . . . . . . . . . . . . . . . . . . . . . . . 0 0 6 12 22 20 60Orthopedics . . . . . . . . . . . . . . . . . . . . . . . . . . . . . . 0 0 0 0 2Physical medicine . . . . . . . . . . . . . . . . . . . . . . . . . 0 0 0 0 1 1 2Radiology . . . . . . . . . . . . . . . . . . . . . . . . . . . . . . 0 0 0 0 0 0 0
Total . . . . . . . . . . . . . . . . . . . . . . . . . . . . . . . . . . 0 0 7 19 27 22 75SOURCE: ~.~. ~:epatment of Health and Human Setvices, Food and Drug Administration, unpublished data, Silver Spring,
Approved transitional devices are heavily skewedtoward ophthalmic products, which are almostexclusively contact lenses and contact lens clean-ing solutions and, beginning in December 1981,intraocular lenses. Other examples of transitionaldevices include cardiovascular grafts, bone ce-ment, absorbable sutures, and specific types ofimmunological tests.
“New” postamendments devices are also con-centrated in a few medical specialties, but not tothe extent that ophthalmic devices have domi-nated approved transitional devices. Among thesenew devices are cardiac valves, heart pacemakersand accessories, cardiovascular catheters, life-support monitoring systems, implantable infusionpumps, artificial hips, and antibody tests for in-fectious agents.
From 1977 through the end of 1982, 128 ClassIII products (53 “new” devices and 75 “transi-tional” devices) had gained premarket approval.During the same period, 1,007 Class III productswere approved for marketing through the find-ing that they were substantially equivalent topreamendments Class 111 device types (comparetables 35 and 36). As previously noted, evidenceof safety and effectiveness has not yet been re-quired for these postamendments Class III prod-ucts found substantially equivalent to preamend-ments devices. Many of these applications forpostamendments Class 111 devices are for modifi-cations of devices which were already commer-cially available.
Postmarketing Surveillance
There are a number of existing and potentialmethods to monitor hazards associated with theuse of devices that have been marketed. FDA
maintains a Device Experience Network (DEN)that receives voluntary reports on device hazards;can require repair, refund, or replacement of de-vices for hazards or defects; and requires thatmanufacturers keep records of complaints as partof the good manufacturing practices regulations.Two other methods have been mentioned earlier.A condition of approval for new Class III devicesapproved through the full premarket approvalprocess is that information that manufacturers re-ceive on device defects and adverse reactions hasto be reported to FDA within 10 days. And man-ufacturers, importers, and distributors of devicesmay be required to provide FDA with informa-tion to ensure that their devices are safe and ef-fective.
The major issue in postmarketing surveillanceactivities has involved the authority that the 1976amendments gave to FDA to require that infor-mation be provided to FDA to ensure that devicesalready on the market are safe and effective. Inlate 1980, FDA proposed rules for mandatory de-vice experience reporting, under which manufac-turers and distributors of medical devices wouldbe required to submit reports on devices that: 1)may have caused a death or injury, 2) may havea deficiency that could cause a death or injury orthat could give inaccurate diagnostic informationthat could result in improper treatment, or 3) arethe subject of a remedial action by the manufac-turer (307). Any death that might have beencaused by a device would have had to be reportedwithin 72 hours of the manufacturer’s or distrib-utor’s receipt of that information, with a followupreport submitted within 7 working days. Reportsalso would have had to be submitted within 7working days after receiving information of anyactual or possible device deficiency that could re-sult in a death or injury.

Ch. 5—Regulation of Medical Devices by the Food and Drug Administration ● 115
FDA’s rationale for a mandatory device report-ing regulation was twofold. Practitioners andusers of medical devices usually do not report de-vice experiences to FDA but instead contact themanufacturer for information and advice. Reportswould be required even if the manufacturer deter-mined that the death or injury was not due to thedevice or that there was no deficiency, becauseFDA expected that few devices would be charac-terized by their manufacturers as having deficien-cies, few reports would be submitted, and report-ing of confirmed deficiencies would be delayedif manufacturers first investigated before report-ing (307).
A year later, in late 1981, the proposed rule washeld in abeyance because of comments that therequirements were overly broad and because ofissuance in early 1981 of Executive Order 12291on “Federal Regulation, ” under which regulatoryactions are to be taken only when the potentialbenefits of the action outweigh the potential costs.FDA also announced that it would inspect com-plaint files maintained under the good manufac-turing practices regulations to determine if theycould be used as an adequate or partial substi-tute for the proposed rule (309). A pretest, phaseI of the review of good manufacturing practicescomplaint files was completed on December 31,1981, and phase II started on July 14, 1982, in-volving a review of the complaint files of 418firms.
In May 1983, FDA issued a reproposal on med-ical device reporting, under which reports wouldbe required within 15 days of receiving informa-tion that “reasonably suggests, or a person allegesand the manufacturer or importer is aware of theallegation” that one of its marketed devices “hascaused or contributed to” a death or serious in-jury or “has malfunctioned” and, if the malfunc-tion occurs, “is likely to” cause or contribute toa death or serious injury (318).
Data analysis of the phase 11 review of goodmanufacturing practices complaint files had beencompleted by early 1984, and the report was ex-pected to be available sometime in 1984. FDA hasconcluded that the good manufacturing practicescomplaint files would not be an adequate substi-tute for a mandatory device reporting regulationfor several reasons.
First, inspection of complaint files would notlead to timely reporting. Good manufacturingpractices inspections are conducted every 2 years,and FDA did not expect more frequent inspectionsin the future. Second, with over 6,000 establish-ments to inspect, there would be a problem withdeciding which and how many establishments toinspect. Third, the way in which good manufac-turing practices records are kept would lead topractical difficulties in collecting the informationfor adverse experience information. As a conse-quence, FDA expects to reissue a revised man-datory device reporting proposal in 1984, subjectto clearance by the Office of Management andBudget and other Federal agencies (257).
FDA, in its proposals for a mandatory devicereporting regulation, has stated that its voluntaryreporting system—the Device Experience Net-work, or DEN—is not an adequate substitute.DEN is not a comprehensive reporting program,and FDA does not have the resources to main-tain constant contact with all device users to en-courage reporting. Furthermore, device manufac-turers are the most knowledgeable about theirproducts and their associated risks and are in thebest position to report to FDA. But few manu-facturers report under the DEN system, and manyof the reports that they make are trade complaintsabout a competitor’s product, not reports fromthe manufacturers of the devices in question. Andin some cases, device manufacturers report deviceproblems to FDA only after a product recall orother remedial action is completed (318).
Reviews of DEN data on Class III devices andof recalls prompted by a hazard with a highlikelihood of serious injury or death resulted inthe following observations (based on informationprovided OTA by FDA for the period from 1976to mid-1983). From the DEN system: deaths al-legedly associated with devices were reportedmost frequently for pacemakers and heart valves;actual injury, reported most frequently with pace-makers, heart valves, IUDs, and to a lesser de-gree but still relatively frequently, with intraocularlenses; and potential injury, reported most fre-quently with resuscitation equipment (usuallyassociated with power failure or other electricalmalfunction), intra-aortic balloon pumps or cath-eters, pacemakers, heart valves, and intraocularlenses.

116 • Federal Policies and the Medical Devices Industry
Recalls prompted by risks of serious injury ordeath were most frequent for cardiovascular de-vices, with pacemakers again comprising thelargest subgroup. Thus, the DEN system andrecalls for high risks mostly involve implantabledevices, often involve electrical problems, andoften involve cardiovascular devices.
The DEN system of voluntary reporting andproduct recall information do not provide ade-quate information on the magnitude and frequencyof device-related problems. Voluntary reportingalso includes allegations of death or injury thatmay not be associated with the device in ques-tion or may be user-related and not due to de-vice defects. FDA also cautions against using DENfor trend analysis, because reports are voluntary,use of the system has changed over time, and thenumber of reports therefore may reflect trends inDEN participation and other factors (48). How-ever, voluntary reporting does provide indicationsof the types of devices that have associated risks,and product recall information identifies deviceswith significant actual or potential risks.
Other Provisions of the Law
Restricted Devices
Section 520(e) of the Medical Device Amend-ments added a provision for “restricted devices”authorizing FDA to issue regulations imposingrestrictions on the sale, distribution, or use ofdevices. FDA was also authorized to regulateadvertising of restricted devices and to inspectmanufacturers’ records related to restricted de-vices. Prior to the amendments, the sale and dis-tribution of some devices were authorized onlythrough “prescriptions” by designated persons(e.g., physicians) (21 CFR pt. 801.109). Immedi-ately following the enactment of the law, FDApublished a notice announcing that FDA consid-ered “restricted devices” to include all “prescrip-tion devices” (303).
When FDA attempted to inspect the records forsome prescription devices, however, some man-ufacturers refused to comply, claiming that FDAhad to first issue regulations designating prescrip-tion devices as restricted devices. The U.S. DistrictCourts involved in resolving this issue ruled for
the manufacturers, and both the First Circuit andSecond Circuit of the U.S. Court of Appeals af-firmed the decisions of the lower courts (30,171).
As a consequence, FDA decided to issue a reg-ulation rather than attempt to establish throughfurther litigation its authority to inspect recordsfor restricted devices.
The proposed rule on restricted devices waspublished in October 1980 (305). However, FDAwithdrew the proposed rule in November 1981,stating as its reasons: 1) comments that the cur-rent prescription device regulation was sufficient,and 2) the February 17, 1981, Executive Order12291 on “Federal Regulation” that required Fed-eral agencies to undertake regulatory actions onlywhen the potential benefits of the action to societyoutweigh the potential costs. FDA also stated thatit would use the authority for inspection of recordsrequired by the good manufacturing practices reg-ulations, as well as the dispensing and labelingrequirements of the prescription device regula-tions, in lieu of a restricted device regulation (309).
Banned Devices
The banned device provision of the law hasbeen used once. Prosthetic hair fibers intended forimplantation into the human scalp were bannedin June 1983 (319,324).
Color Additives
FDA has not issued regulations on the color ad-ditive provisions of the amendments, but the issuehas so far been limited primarily to tinted con-tact lenses. All contact lenses that are required tohave premarket approval are also subject to thecolor additive provisions of the law. FDA initiallyapproved tinted contact lenses even though thecolor additives had not been listed for that usebefore the applications were approved (317).When FDA subsequently concluded that it hadto apply the color additive provision to tinted con-tact lenses, it decided that the least unfair methodwas to complete action on the pending PMAAsand to enforce the provision with future PMAAs(323). FDA is also developing proposed changesin the procedural regulations for color additivesto govern their use in all applicable devices (323).
Ch. 5—Regulation of Medical Devices by the Food and Drug Administration ● 117
Export of Devices
FDA regulations have not had a great effect onexport of medical devices, because most exporteddevices are those that are legally marketed in theUnited States and require no special FDA ap-proval.
Most devices requiring FDA approval for ex-port are devices that require but have not yet re-ceived premarket approval. The requirement thatthe importing country approve imports posedsome problems because of the possibility thatthere might not be an official who could give ap-proval. For that reason, FDA has accepted, in lieuof an express approval, a statement from theforeign government that it has no laws prohibitingimportation of the device in question. From Oc-tober 1, 1981 through March 31, 1983, 376 med-ical devices were approved for export, 13 deviceswere disapproved, and 1 previous approval wasrescinded (181).
Assistance to Small Manufacturers
Both the prevalence and absolute magnitude ofregulatory costs increase with establishment size,
DISCUSSION AND CONCLUSIONS
The principal provisions of the statute andFDA’s activities have been cataloged above. The1976 Medical Device Amendments attempted toregulate medical devices in proportion to a de-vice’s degree of risk through a number of pre- andpostmarketing controls. The amendments placedimmediate regulatory priority on significantly newdevices while providing a grace period beforesubstantial evidence of safety and effectivenesshad to be provided for preamendments Class IIIdevices and their postamendments equivalents.
Section-by-section descriptions and analyses ofthe major provisions of the Medical Device Amend-ments and their implementation by FDA wereprovided above to yield an understanding of theexperience so far with the regulation of medicaldevices. The analysis also identified specific reg-ulatory actions that have been proposed as alter-natives to the current situation. However, iden-
but the costs of regulations appear more unfavor-able to the small manufacturer when costs are con-sidered in proportion to establishment size (197).For example, in a limited study of 30 companiesmanufacturing only cardiovascular, anesthesiol-ogy, or diagnostic products, both initial and re-curring costs per employee were higher for smallplants (fewer than 100 employees) than for largerplants (100 or more employees) (17).
Small manufacturers also are more likely toneed assistance in complying with the regulatoryrequirements. FDA’s Office of Small Manufac-turers Assistance has received favorable reviewsby manufacturers. In a survey of medical devicemanufacturers, over three-quarters had heard ofthe office, about half of those who had heard ofit contacted it, and more than three-quarters ofthose contacting the office had found it helpful(197).
tifying specific regulatory areas and analyzing thecurrent approaches (and limitations) and theiralternatives are not the same as developing strat-egies (including maintaining the status quo) formedical device regulation. The relative signifi-cance of actions that could be taken in specificareas of medical device regulation is hard to de-termine and justify without relating these actionsto more specific strategies than the general rubricof meeting safety and effectiveness objectives atminimal regulatory costs.
In the following analysis, the principal issuesthat have arisen in implementing the Medical De-vice Amendments of 1976 are examined. Areasto be discussed include:
● the scope of medical device regulation,● regulation of preamendments Class III de-
vices and their postamendments equivalents,

118 ● Federal Policies and the Medical Devices Industry———.
• regulation of intermediate classes of devices,● postmarketing controls, and● impact of the amendments on medical device
firms.
Scope of Medical Device Regulation
FDA has exempted firms from certain require-ments of the 1976 Medical Device Amendments;under FDA’s IDE regulations, for example, adistinction is made between “significant” and“nonsignificant” risk devices, and sponsors of in-vestigations of nonsignificant risk devices obtainan IDE from an institutional review board ratherthan from FDA (see section on “InvestigationalDevice Exemptions, ” above). The law also ex-pressly permits FDA to exempt firms from noti-fying FDA about their intent to market selecteddevices, and FDA has done so for selected typesof Class I devices, subject to minimal recordkeep-ing requirements.
The Scientific Apparatus Makers Associationhad petitioned FDA to drop notification require-ments for Class I devices, claiming that Class Idevices would still be subject to the registrationrequirements and surveillance under the goodmanufacturing practices regulations. FDA subse-quently denied the petition on the grounds thatthe legislative intent was to make decisions on thebasis of generic types of devices, and not whetheror not devices were in a specific class (see sectionon “Premarket Notification, ” above).
Rather than being considered on the basis ofthe present statute’s legislative intent, the proposalfor dropping notification requirements for ClassI devices could be reconsidered in a reassessmentof the statute. With over 7,000 device establish-ments registered with FDA, listing approximately41,500 products representing over 1,700 devicetypes, one important question that arises is whetherthe scope of present device regulation is too broad.Not only could regulatory costs be excessive wheninformation is gathered that is not going to beused, but other activities undertaken to helpassure safety and effectiveness could be curtailedbecause of competition for funds within a limitedFDA budget.
Regulation of Preamendments Class IllDevices and Their PostamendmentsEquivalents
As of early 1984, classifications had been com-pleted for device types in 11 of the 19 medical spe-cialty categories, and proposed regulations, mostinitially issued in 1982, had been issued for thosein the remaining 8 (see table 34). As preamend-ments Class III devices and their postamendmentsequivalents cannot be required to show substan-tial evidence of their safety and effectiveness un-til at least 30 months after final classification, itwill be 1986 at the earliest before manufacturersof devices in the eight medical specialty catego-ries without final classifications can be requiredto show that their products are safe and effective.
FDA could have expedited classification ofhigh-priority device types within each medicalspecialty category instead of waiting to classifyall devices within each category. For example, theclassification process for device types that hadbeen provisionally designated Class 111 could havebeen completed first, thereby starting the clockon the 30-month grace period.
On the other hand, the medical specialty cate-gories for which FDA first issued final classifica-tions (see table 34) include the categories in whichmost of the deaths and injuries were found in areview of the literature by the Cooper Commit-tee before the amendments were enacted—i.e.,cardiovascular (heart valves, pacemakers) andobstetrics-gynecology (IUDs). Devices in thesecategories continue to be the major causes of deathor serious injury as reported in FDA’s voluntaryDEN reporting system (see section on “Postmar-keting Surveillance, ” above). Thus, the medicalspecialty categories for which FDA has completedclassification include those categories containingdevices with the highest known risks.
Related to classification of preamendments de-vices is the regulation of similar postamendmentsdevices through application of the “substantialequivalence” clause and the practice of “equiva-lence creep” or “piggybacking” whereby a post-amendments device can be found “substantiallyequivalent” to another postamendments devicethat had been previously found to be substantially

Ch. 5—Regulation of Medical Devices by the Food and Drug Administration ● 119— . .
equivalent to an actual preamendments device.One issue is the safety and effectiveness of post-amendments Class III devices that have been per-mitted to be marketed through the “substantialequivalence” route, because the preamendmentsdevices against which they have been comparedhave yet to be required to show evidence of theirsafety and effectiveness.
After the 30-month grace period for preamend-ments devices expires, if FDA requires evidenceof safety and effectiveness for their continued mar-keting, more evidence on safety and effectivenesswill be available on the preamendments deviceswith which postamendments devices are com-pared. Each manufacturer of a Class III device,whether pre- or postamendments, would have tosubmit a PMAA if required, because FDA can-not consider the evidence of safety and effective-ness in one application when reviewing anotherdevice, even one that was previously found sub-stantially equivalent.
As discussed earlier, FDA has initiated pro-ceedings for some preamendments Class III de-vices for which the grace period has ended andwhich FDA has determined have the highest needfor evidence of safety and effectiveness (e.g., theimplanted cerebella stimulator). Criticisms of thepace at which FDA classified preamendmentsdevices, which determines when evidence of safetyand effectiveness of preamendments Class IIIdevices could be required, could have been mutedif the classification process had been speeded upfor preamendments Class III devices in all cate-gories. Final classification of preamendmentsdevices is no longer a major issue, however, be-cause classifications have already been proposedfor those medical specialties without final classif-ication (see table 34), and final classificationshould occur soon.
The remaining issues are: 1) what type of safetyand effectiveness evidence should be required forpreamendments Class 111 devices; and 2) how the“substantial equivalence” clause should be appliedby FDA. FDA, in announcing its intent to requiresafety and effectiveness evidence for those pre-amendments Class III devices it has identified ashaving high priority, indicated that it intended toask for data of the type needed for premarket ap-
proval of new postamendments Class 111 devices(321). However, for less controversial preamend-ments devices, more flexibility in the types ofevidence that have to be provided maybe appro-priate. As for the application of the “substantialequivalence” clause, other interpretations or othermethods of approving postamendments Class IIIdevices are possible (see “Policy Options” sectionbelow).
As noted above, the regulations that FDA hasissued on IDEs distinguish between “significantrisk” devices, for which sponsors have to receiveexpress approval from FDA to conduct studiesunder an IDE, and all other Class III devices, ofwhose testing FDA need not be actually informedand which are considered to have approved IDEssubject to certain conditions (see section on “In-vestigational Device Exemptions, ” above). Thisdistinction reflected express statutory authorityand a decision by FDA that risks from Class IIIdevices varied and monitoring of testing shouldreflect the degree of risk.
FDA has also indicated that IDEs will be madeavailable to manufacturers of preamendmentsClass III devices so that they can continue to mar-ket their devices if they cannot provide reason-able assurance of safety and effectiveness whenFDA requests such information. In its “Notice ofIntent to Initiate Proceedings to Require PremarketApproval of Preamendments Devices,” FDA hasstated that within 90 days of the issuance of a finalregulation, a PMAA must be filed or commercialdistribution has to cease.
But an alternative for the manufacturer is toobtain an IDE and continue distribution for thelimited purpose of obtaining safety and effective-ness data from clinical trials. In addition, undersection 515(6) of the amendments, FDA can ex-tend the grace period if it finds that “the continuedavailability of the device is necessary for the pub-lic health” (321).
The rationale for this use of the IDE is weak.Manufacturers of preamendments devices havehad years to prepare to substantiate the safety andeffectiveness of their devices, because the law waspassed in 1976, the classification process is stillnot over, and there is a 30-month minimum graceperiod from the date of final classification.

120 • Federal Policies and the Medical Devices Industry
Regulation of Intermediate Classesof Devices
For several reasons, Class II designation hasprobably received the most attention. First, ClassII represents the important middle ground of thewhole regulatory approach. Second, the majorityof device types have been placed in Class II (morethan 1,000 out of over 1,700; see table 34). Andthird, no performance standards have yet beenissued.
Regardless of whether or not the 1976 statuterequires, rather than permits, the use of perform-ance standards, the fact remains that, as a prac-tical matter, there is little possibility that stand-ards can be formulated for the large number ofdevice types that have been placed in Class II. Ifperformance standards were meant to be selec-tively used, the designation of so many devicetypes as Class 11 and the resulting perception ofthe futility of such an exercise have been damag-ing to FDA’s efforts, no matter what the rationale.
At the least, the present situation points out theneed for an intermediate regulatory class, the in-appropriateness of mandatory performance stand-ards as the sole or even principal method of reg-ulation, and the need for other methods of regu-lating intermediate devices.
There are, of course, many ways of regulatingan intermediate class of devices. The principalissues here are: 1) whether a change in the stat-ute is needed before FDA can use other than per-formance standards, and 2) what types of regu-latory controls could be used.
Postmarketing Controls
Postmarketing controls on medical devices areof two types: 1) removal from the market orrestrictions on the sale, distribution, or use of des-ignated devices; and 2) postmarketing surveillanceof the clinical experiences with medical devices.
FDA can remove a device from the market byrequiring repair, refund, or replacement; by ban-ning it; or by revoking any approval to marketthe device. There are two types of restrictions onthe sale, distribution, or use of a device. The firstis a restriction to prescription sale or use, applied
when adequate labeling for lay use cannot be writ-ten or when special skills or training are required,such as diagnosing a disease or condition or pre-scribing for treatment. The second is a restrictionbased on other conditions FDA may prescribe inregulations in order to provide reasonable assur-ance of the safety and effectiveness of the device.
The restricted device regulations were with-drawn by FDA with the explanation that theprescription device regulations were adequate. Inaddition, Executive Order 12291 requires that Fed-eral agencies undertake regulatory actions onlywhen the potential benefits outweigh potentialcosts. However, in the original proposed regula-tion, FDA had stated that (305):
. . . the current determination that a device is a“prescription” device is quite subjective. Often,the determination is made by the manufacturer.
FDA therefore proposed the restricted device ruleto make these criteria more objective.
FDA also stated in its withdrawal of the pro-posed restricted device rule that it would use itsinspection authority under the good manufactur-ing practices regulations to inspect manufacturers’records on these types of devices for informationon such matters as deaths and injuries (309). Butthe Subcommittee on Oversight and Investiga-tions of the House Energy and Commerce Com-mittee observed that (338):
. . . most of the general controls . . . are gearedtoward ensuring that finished devices, when readyfor use, will be free from defects, safe and effec-tive. Restriction, on the other hand, can addressproblems with a device once it is in use. It dealswith the risks that practitioners, technicians, orothers who employ the device are doing so im-properly due to inadequate training, experience,facilities, or instructions.
These issues—use of existing sources of infor-mation on deaths and injuries, and problems aris-ing from improper use of medical devices ratherthan from improper manufacture—have also beeninvolved in the debates on the types of postmar-keting monitoring activities that should be con-ducted.
One of the expressed reasons why mandatorydevice reporting regulations have been held inabeyance was to examine whether the complaint

Ch. 5—Regulation of Medical Devices by the Food and Drug Administration • 121— — —. — —
files which are required under the good manufac-turing practices regulations could partially orcompletely substitute for the mandatory devicereporting regulations. As described earlier, the ex-amination had been completed by early 1984, withthe conclusion that the good manufacturing prac-tices complaint files are not adequate substitutesfor mandatory reporting (257).
On the question of improper use, the GeneralAccounting Office has recommended that FDA’svoluntary DEN reporting system be revised sothat information is included on the scope andnature of device problems caused by user errorand inadequate maintenance; that the data beanalyzed to identify special problems, areas whereproblems might be concentrated, and trends; andthat the results be used to aid in developing solu-tions. FDA responded that these recommenda-tions would be taken into consideration and thatpossible actions would include implementingeducational programs or restricted use criteria(331).
Thus, FDA may eventually issue restricted de-vice regulations, subject to the current adminis-tration’s position on deemphasizing regulatory ap-proaches and its preference for voluntary initiatives.Furthermore, efforts may be made to upgradethe voluntary DEN system and disseminate thatinformation to educate users about potentialhazards.
Impact of the Amendments onMedical Devices Firms
The preceding analyses examined individualprovisions of the 1976 Medical Device Amend-ments and their implementation by FDA. A broaderissue is the impact of the amendments on the med-ical devices industry. Information available on theimpact of the law reflects regulatory implemen-tation by FDA and understanding of the law bydevice firms in the first few years following pas-sage of the statute. In evaluating this impact, itis important to keep in mind that some sectionsof the amendments have been implemented fully,some partially, and some have yet to be addressed.
Two studies that FDA conducted to establish“baseline conditions” in order to track changes
that occur in the future were summarized earlier,based primarily on 1977 data (391,392). Thesestudies showed that the “medical devices indus-try” is quite heterogeneous. There is a clear sep-aration of the industry into medical device versusdiagnostic testing firms, with little overlap be-tween manufacturers of either type of product.
The medical device portion of the industry isfurther separable into establishments that arehighly specialized and those that manufacturedevices in several areas. Sixty-four percent ofmanufacturers made devices in only one devicearea. Highly specialized areas include dental, oph-thalmic, and radiological devices.
Each device type is made by an average of ninedifferent manufacturers, but this measure of “prod-uct availability” or “concentration” in the indus-try is related to the class of the device. Class I de-vice types averaged 13.1 manufacturers per type;Class II,. 7.9 manufacturers; and Class III, 4.5manufacturers. Devices made by only one or twomanufacturers (“exclusive” devices) comprised 28percent of all device types and followed a similarpattern. Only one or two establishments weremanufacturing 41 percent of the Class III devicetypes, compared to 28 percent of Class II devicetypes and 24 percent of Class I device types.
Large establishments were more likely to make:1) more device types, 2) an “exclusive” device, 3)a Class III device, or 4) a “critical” device (definedby FDA as requiring more rigorous controls inthe manufacturing process).
These findings lead to the following observa-tions. First, the distinction between firms thatmanufacture diagnostic tests and firms that man-ufacture other medical devices probably reflectsthe “catchall” nature of the 1976 Medical DeviceAmendments, which essentially authorized Fed-eral regulation over all medical products that arenot drugs or biologics. One question is the ap-propriateness of regulating such distinctly differentproducts in a similar manner. For example, ClassIII medical devices are generally those that are im-planted or have life-support or life-sustainingfunctions, and criticisms of FDA’s application ofthe law to devices of this nature have been raisedwhen FDA has chosen not to place some of thesetypes of devices in Class 111 (253).
25-406 0 - 84 - 9

122 ● Federal Policies and the Medical Devices Industry
On the other hand, diagnostic tests pose fewdirect risks, but some have been placed in ClassIII because defective tests could lead to erroneoustreatment (or no treatment), which in turn couldresult in harm to patients. The underlying ques-tions are whether the law’s scope and applicationare appropriate, and if not, whether regulationof diagnostic tests and other medical devices canbe addressed differentially under the present lawor whether new legislative remedies should be ex-plored.
Second, it should be remembered that the find-ings that devices in higher regulatory classes havefewer manufacturers per device type and thatlarger manufacturers are more likely to manufac-ture devices in a higher regulatory class representthe situation that was already present before theamendments were implemented. Classificationunder the 1976 amendments did not cause butmight be expected to reinforce this situation, espe-cially for Class III devices, because of the highercosts associated with approval.
FDA also commissioned a survey conducted inthe fall of 1981 of medical device manufacturingestablishments that had been registered with FDAin September 1980 (197). The surveyors concludedthat there was no evidence that the amendmentsraised barriers to market entry, reduced innova-tion, or adversely affected investment, sales, oremployment. For example, one of the survey’sconclusions, based on information provided bythe surveyed manufacturers, was that there wasno evidence that patent activity had measurablydeclined since the Medical Device Amendmentswere enacted in 1976.
Figures 2 and 3 provide a more comprehensivepicture of medical device patent activities, sum-marizing patent applications with the U.S. Pat-ent Office between 1968 and 1979. Patent applica-tions on “low-technology” devices such as bandages,receptacles, eyeglass frames and lenses began lev-eling off just prior to the 1976 amendments. Butapplications for “high-technology” devices suchas implants, dialysis machines, respiratory de-vices, and cardiovascular devices continued to in-crease throughout the decade (see app. D)
The 1981 survey commissioned by FDA foundthat a third of all manufacturers had entered the
medical device field after the 1976 statute (197).Most manufacturers reported increases in domes-tic and foreign sales, research and development(R&D) activities, and the number of new devicesintroduced since the amendments. Fifty-one per-cent were more profitable and only 27 percent lessprofitable than they had been prior to passage ofthe amendments, and 80 percent were optimisticabout doing business in medical devices duringthe next decade.
The survey also found that significant R&Dactivities were common traits in medical devicefirms—whether they were large, medium, orsmall—and that the introduction of significantlynew medical devices had been just as common forsmall firms as for large firms (197). But when thesurvey was conducted in the fall of 1981, only aquarter of small establishments (1 to 9 employ-ees)—as compared to 63 percent of establishmentswith over 500 employees—reported that theywould consider developing and marketing a ClassIII device. The surveyors concluded that Class IIIdesignation appears to be more likely to discour-age small establishments than large establishmentsfrom developing new devices, but observed thatopinions do not necessarily translate into behav-ioral differences. They pointed out that 8.4 per-cent of establishments were manufacturing ClassIII devices and that a higher percentage of manu-facturers would continue developing Class IIIdevices.
Somewhat in contrast with the overall optimis-tic picture of the industry just presented weremanufacturers’ answers to the survey question ofthe impact of the Medical Device Amendments(197). Nearly half (46 percent) stated that Federalregulation had been a major problem for them,and 21 percent stated that regulation was thesingle most serious problem. However, althoughmost manufacturers wanted changes in the regu-lations, they did not believe (53 percent) that de-vice regulation should be abolished, and the vastmajority (80 percent) believed that at least im-plants and life-support or life-sustaining devicesshould be strictly regulated.
The specific problems associated with regula-tion under the 1976 amendments were varied(197). One problem reported by a substantial

Ch. 5—Regulation of Medical Devices by the Food and Drug Administration ● 123
Figure 2.–U.S. Patent Applications for Low-Technology Medical Devices, 1968-79
69 1970 172 1973 1974
Year of appl icat ion
1976I1977 1979
SOURCE: U.S. Department of Health and Human Services, Food and Drug Office of Economic Analysis, MD, compilation of unpublished data from the U.S. Patent and Trademark Office, December 1983.
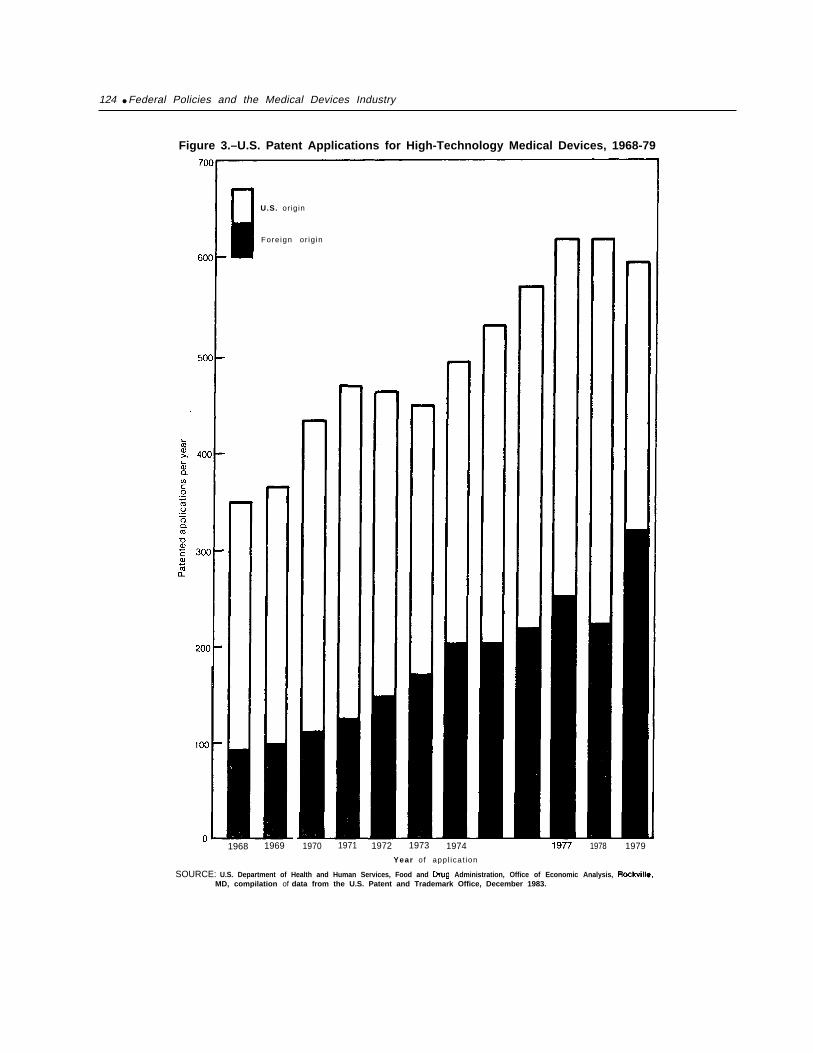
124 ● Federal Policies and the Medical Devices Industry
Figure 3.–U.S. Patent Applications for High-Technology Medical Devices, 1968-79
U.S. origin
Foreign or ig in
1968 1969 1970 1971 1972 1973 1974
Year of appl icat ion
1978 1979
SOURCE: U.S. Department of Health and Human Services, Food and Administration, Office of Economic Analysis, MD, compilation of data from the U.S. Patent and Trademark Office, December 1983.

Ch. 5—Regulation of Medical Devices by the Food and Drug Administration ● 125
number of manufacturers in the 1981 survey wasthe cost of compliance. In order to meet the reg-ulatory requirements, 64 percent either added newemployees, purchased new equipment, or increasedoutside purchases. Absolute costs increased withestablishment size, but when adjusted for estab-lishment size, smaller manufacturers had rela-tively higher costs per employee in meeting theregulatory requirements.
Another problem reported by a significantnumber of manufacturers was in understandingwhat to expect from FDA in meeting the regula-tory requirements. Of particular interest is the cor-relation between manufacturers’ attitudes towardFDA and their understanding of the regulations.Of those manufacturers who said they fully un-derstood the regulations, about half (51 percent)gave FDA a positive rating, and 71 percent statedthat the regulations were effectively protecting thepublic. The Office of Small Manufacturers Assist-ance was one FDA information source that waspositively received by the industry, but difficultyin understanding the regulatory requirements wasstill a major problem and fell disproportionatelyon small manufacturers. Thus, a particular pri-ority for regulatory reform was in special effortsto improve manufacturers’ understanding of thedevice regulations.
Despite the negative opinions by manufacturersregarding regulation, majorities still reported thatregistration, product listing, product classifica-tion, labeling requirements, premarket approval,and IDEs had no effects on their establishments(197). Seventeen percent of manufacturers evenreported that good manufacturing practices havebeen of help to them.
Under the 1976 amendments, difficult and com-plex precedent-setting decisions have been madeon a diversified industry that was not previouslysubject to a great deal of FDA regulation. In gen-eral, the 1976 Medical Device Amendments havenot had a significant negative impact on the man-ufacturers of medical devices. Particular segmentsof the industry may be more affected than others,however, and compliance costs affect small man-ufacturers relatively more than they do large man-ufacturers.
In the contact lens industry, the issues of thecosts of complying with regulations and smallmanufacturers’ entry into the market have con-verged (see discussion under “Reclassification ofDevices” section, above). Class III designation ofnew types of contact lenses (soft lenses, gas-permeable lenses) has made it difficult for manysmall companies to gain early entry because ofthe costs of gathering clinical evidence on safetyand effectiveness. But there has not been a unifiedfront by the contact lens industry against Class111 designation. Rather, large firms that alreadyhave market approval have tended to resist reclas-sification from Class III to Class I or II. At issuein this instance is competition between first en-trants into the market and subsequent manufac-turers. The public policy goals that are at oddsare rewarding companies that first succeed in get-ting innovations on the market versus achievinggreater availability of products of a particulartype, with price competition as one result.
Throughout the medical devices industry, oneof the impacts of medical device regulation hasbeen uncertainty over the regulatory require-ments. This situation, in retrospect, is under-standable, given the fact that the implementation
Photo credit: Bausch & Lomb SOFLENS, Professional Products Division
The new generation of contact lenses, such as the soft con-tact lens show on the left, are subject to the full premarketapproval process of the Food and Drug Administration. Theolder types of hard contact lenses, such as that shown onthe right, no longer have to go through the full premarket ap-
proval process.

126 ● Federal Policies and the Medical Devices Industry—.-—- —
of some provisions of the law has not been initi-ated or completed and the fact that the majorityof devices have been placed in Class II, despiteinability to proceed with the statutory intent ofregulating this class of devices through perform-ance standards.
Conclusions
During the 8 years since the Medical DeviceAmendments of 1976 were enacted, the medicaldevices industry has continued to grow, and whileregulatory costs have been incurred, regulationhas generally not had a significant negative im-pact on the industry. A large part of the indus-try’s development may be due in part to FDA’simplementing the 1976 law in ways that wouldmake market entry easier—as in use of the 510kpremarket notification and a finding of “substan-tial equivalence” as the predominant route fordevices to be released for marketing—and in partto FDA’s not implementing or implementing slowlysome of the law’s provisions. The situation forindustry may change if FDA implements all of theprovisions of the amendments, or as new medi-cal devices are developed that make it harder overtime to use the “substantial equivalence” route tomarket devices.
Several provisions of the amendments that aretargeted at specific risk categories—such as thosepertaining to the safety and effectiveness of pre-amendments devices, regulation of Class II de-vices, and monitoring of devices once they are onthe market—have yet to be fully implemented oraddressed. Yet there is little information that ac-tual risks are systematically occurring or not be-ing addressed by FDA’s choice of priorities in im-plementing the amendments.
This paucity of information on actual risks canbe interpreted in two ways, based on opposing
POLICY OPTIONSMost of the attention that has been focused on
medical device regulation since the enactment ofthe 1976 Medical-Device Amendments has beenoriented toward questions such as whether a par-
assumptions. First, it might be taken as an indica-tion that hazards are in fact low, that the currentapplication of the amendments is satisfactory, andthat it is not necessary to implement all of thelaw’s provisions. An alternative interpretation isthat the paucity of information on risks is a defi-ciency in itself—one that the amendments attemptedto address—and that a lack of information onrisks is a problem that needs to be addressed.
The Medical Device Amendments providedmore effective methods for dealing with fraud-ulent devices, and the increasingly complex natureof “high-technology” medical devices was one ofthe imperatives for developing premarket screen-ing and testing requirements. Public policy inthese two instances was not primarily dependenton quantifying the number of injuries currentlycaused by medical devices. In the case of fraud-ulent devices, the amendments provided more ef-fective tools for removing these devices from themarket. For “high-technology” devices, theamendments attempted to anticipate and minimizepotential risks associated with their use throughpre- and postmarketing controls. Realistically,however, it might be expected that debates overhow and to what extent medical devices shouldcontinue to be regulated will focus on the coststo industry versus (lack of knowledge of) the ex-tent of risks associated with medical devices.
In sum, 8 years after the Medical Device Amend-ments of 1976 were enacted, the medical deviceindustry has incurred regulatory costs but con-tinues to prosper in general; major sections of thelaw remain partially or not implemented, andthere do not seem to be any obvious, major risksthat are not being addressed, a situation that mayreflect either a lack of significant risks or lack ofknowledge of significant risks that do exist.
ticular provision of the 1976 law has been imple-mented, whether its implementation has beencompatible with congressional intent, and whetherthe provision worked in practice as it did in con-

Ch. 5—Regulation of Medical Devices by the Food and Drug Administration ● 127
cept (331,338). A range of options proposed forspecific issues that the current law was designedto address is provided below. Areas of the lawto be specifically addressed include:
• evaluating the safety and effectiveness ofpreamendments devices and their postamend-ments equivalents,
● developing performance standards for ClassII devices,
. reviewing postmarketing activities and con-trols, and
. assisting small manufacturers of devices.
Beyond developing options on specific provi-sions of the law, however, there is the questionof how specific actions fit within an overall reg-ulatory framework. Various overall regulatory
approaches are presented in the first three optionsbelow.
Scope of Medical Device Regulation
Option 1: Continue the basic framework and in-tent of the 1976 Medical Device Amendmentsand make adjustments in implementation orwording of the specific provisions of the law.
A judgment could be made that the basic frame-work and intent of the 1976 amendments remainsappropriate and that the law’s implementation byFDA should proceed, subject to modifications inthe wording or implementation of specific provi-sions of the law that reflect judgments on theappropriate balance between methods of ensur-ing safety and effectiveness and the costs associ-ated with these methods.
FDA, in implementing the 1976 law, has hadto develop a set of priorities so that its limitedresources could be efficiently applied. Congresscould provide more direction to FDA on what itconsiders priority issues and what orientation itconsiders appropriate within a particular regula-tory area. Setting such priorities would entailweighing benefits to consumers from reducingrisks and ensuring efficacy versus costs to the in-dustry from regulatory requirements. Examplesof priority areas might include approval of newdevices, particularly Class III; safety and effec-tiveness of preamendments Class III devices; selec-tive monitoring and controls over marketed de-
vices; and development of better information ondevice-associated risks.
Congress could also provide direction withineach priority area on the extent of its concernabout ensuring safety and effectiveness versusminimizing barriers to market entry. Approachesto balancing safety and effectiveness versus easeof marketing are reflected by the variation in thetypes of safety and effectiveness evidence thatcould be required for preamendments Class IIIdevices and in whether FDA or device manufac-turers should bear the burden of proof (see Op-tions 4, 5, and 6).
A different strategy from focusing on whichprovisions of the law should be emphasized wouldbe for Congress to determine which aspects of thecurrent law do not have high priority. The ex-emption of devices from some of the law’s re-quirements through the use of FDA’s discretionaryauthority has been previously discussed. FDA hasexempted manufacturers of some Class I devicetypes (e. g., specimen containers) from having to
notify FDA when they intend to market theirdevices and from most of the recordkeeping re-quirements of the good manufacturing practicesregulations. In the regulations on IDEs, FDAmakes a distinction between “significant risk” and“nonsignificant risk” Class 111 devices and requiresdifferent procedures for the two. Also mentionedearlier was a petition to FDA from the ScientificApparatus Makers Association, subsequentlydenied by FDA as being against legislative intent,to drop 510k notification requirements for allClass I devices.
Option 2: Revise the 1976 Medical Device Amend-ments to reflect the status quo with regard toFDA’s implementation of the law.
Although the issuance of mandatory perform-ance standards for Class II devices has proved notto be feasible and FDA has yet to complete theimplementation of several other provisions of the1976 law, obvious, systematic deficiencies in thesafety and effectiveness of medical devices havenot been apparent. One approach, therefore,might be to recognize the two-tiered regulatoryapproach that has been applied to medical devicesrather than the three-tiered approach originallybuilt into the law.

128 ● Federal Policies and the Medical Devices Industry
More flexibility could be obtained through thekinds of controls identified previously to augmentor replace Class II performance standards (see Op-tion 13), but the bedrock of the law could belimited to: 1) general controls for all devices, and2) premarket approval requirements for a limitednumber of devices, such as implantable or life-supporting devices. Other current provisionscould also be modified or deleted. For example,review of preamendments devices could be limitedto high-priority device types, the approach thatFDA is currently taking.
Option 3: Revise the 1976 Medical Device Amend-ments to exclude certain device types from reg-ulation.
In the previous option, revisions in the lawwould be guided by FDA’s implementation of thelaw to date. In addition to or in place of that op-tion, Congress might choose to consider statutoryexclusions of some device types.
Statutory modifications could be guided byfocusing on risks, such as the proposal to exemptClass I devices from notification and recordkeep-ing requirements, or by focusing on the varietyof medical products currently under the jurisdic-tion of the amendments, such as the question ofwhether it is appropriate to regulate diagnostictests in the same manner as other types of medi-cal devices.
Regulation of Preamendments Devicesand Their Postamendments Equivalents
The 1976 amendments provided a 30-monthgrace period after final classification before evi-dence of the safety and effectiveness of preamend-ments Class III devices would be required by FDA.For these devices, two issues that remain are whattype of evidence has to be presented and whenthat evidence has to be provided to FDA. In part,these issues are important because of the wide-spread use of the “substantial equivalence” methodof gaining market entry for postamendmentsdevices. As previously discussed, a finding ofsubstantial equivalence will be made if a new de-vice does not differ markedly as to materials,design, or energy source, and if there is no sig-nificant difference with regard to safety and ef-
fectiveness. As yet, however, there is no require-ment to provide safety and effectiveness evidenceon the preamendments devices with which newdevices claimed to be their substantial equivalentsare compared.
In addition, FDA’s Office of General Counseldoes not consider a finding of “substantial equi-valence” an approval. A device is considered ap-proved once a determination is made that it is safeand effective. The 510k method of obtainingFDA’s permission to market a device is basicallya determination that the device is substantiallyequivalent to a preamendments device, and FDAhas no choice but to allow it to be marketed; itIS not a determination that the device is safe andeffective (464).
ISSUE:What evidence of safety and effectivenessshould be required of preamendmentsClass III devices?
Option 4: Continue FDA’s current approach ofemphasizing safety and effectiveness evidencefor high-priority preamendments Class IIIdevices.
Under FDA’s current policy as represented bythis option, preamendments Class III device typeswith questionable safety and effectiveness or withrelatively high risks will be addressed by FDAfirst, using expert opinion and publicly availableliterature. This approach can be viewed as a rea-sonable allocation of FDA’s limited resources, al-though FDA has to gather and review informa-tion to set areas of priority, and developing theinformation can be very resource-intensive forFDA
Option 5: Limit through legislation requirementsfor evidence of safety and effectiveness of pre-amendments Class III devices to device typesthat have specific problems associated withthem.
This option would codify FDA’s current ap-proach so that FDA would have to identify pre-amendments Class III device types with problemsbefore it could require evidence of safety and ef-fectiveness. Other preamendments device types

Ch. 5—Regulation of Medical Devices by the Food and Drug Administration • 129— — . . —
would be presumed to be safe and effective, sub-ject to development of new information. As in theprevious option, this approach could be resource-intensive for FDA because the agency would haveto gather evidence to identify problem devices.Legislating this approach instead of relying onFDA’s discretion would reduce uncertainty andmake it explicit that all preamendments Class IIIdevices will not eventually have to show evidenceof safety and effectiveness.
Option 6: Encourage FDA to accept evidence ofsafety and effectiveness such as reviews of theliterature and expert opinion, in lieu of clini-cal evidence, for preamendments Class III devices.
In the two previous options, the safety and ef-fectiveness of preamendments Class III deviceswould in effect be presumed, and FDA would de-velop information to counter that presumptionbefore initiating actions. In this option, the bur-den of providing FDA with evidence of safety andeffectiveness would continue as now to rest withthe manufacturers, but the range of acceptabletypes of evidence would be greater. This approachwould enable FDA to screen all device types ora greater number than would the two previousoptions, and the screening process might then beused by FDA to target problem devices.
A variation of this option would be for FDAto start with the presumption that clinical dataon devices are required but allow manufacturersto overcome that presumption with evidencegained from general use of these types of devices.
ISSUE:When should safety and effectivenessevidence be required of preamendmentsClass 111 devices?
Option 7: Continue FDA’s interpretation that theend of the 30-month grace period after finalclassification establishes the earliest date thatFDA can require safety and effectiveness evi-dence on preamendments Class III devices.
Because the 30-month grace period establishesthe earliest date on which the agency can act, FDAhas begun the process of requiring safety and ef-fectiveness evidence for only a few “high-priority”preamendments Class 111 devices. FDA’s priority-
based review is dictated by the limited resourcesavailable to FDA and the resulting difficulty incalling for evidence of safety and effectiveness forall preamendments Class 111 devices as their graceperiods expire. Thus, the issue of when suchevidence will be required is related to the ques-tion of what kinds of evidence will be acceptable(see Options 4, 5, and 6).
Option 8: Establish the end of the 3&month graceperiod after final classification as the time whenFDA has to call for safety and effectivenessevidence on preamendments Class III devices.
This option could be legislated, but its desir-ability depends on whether FDA takes other ap-proaches to ensuring safety and effectiveness asdiscussed above and on the resources FDA coulddevote to preamendments devices relative to otherprovisions of the law. For example, if FDA takesthe approach in Option 6 of accepting a greaterrange of evidence to screen for problem devices,this option would be much more reasonable toimplement than under current conditions, inwhich FDA has assumed responsibility for iden-tifying problem areas.
Option 9: Prohibit use of the IDE to extend thegrace period for preamendments Class III de-vices that have been required to show evidenceof safety and effectiveness, except when noacceptable alternatives are available.
The grace period for many preamendmentsdevices had not ended or had not even begun asof early 1984, 8 years after the amendments werepassed. Given this extended period of “notifica-tion, ” there seems little justification for makingIDE routinely available to preamendments devicemanufacturers. Possibly, however, IDEs could bemade available on a case-by-case basis. Routineuse of the IDE to continue limited distribution ofpreamendments devices would be less of an issueif other types of evidence of safety and effective-ness, such as literature reviews and expert opin-ions, were accepted.
Except for those options specifically calling forlegislation, all of the options pertaining to pre-amendments Class 111 devices could be imple-mented under the existing statute. However, Con-gress could mandate a particular approach throughlegislative changes.

130 • Federal Policies and the Medical Devices industry. — —..——
ISSUE:Does the “substantial equivalence”method of entering the market forpostamendments medical devices needto be revised?
The 1976 Medical Device Amendments requirethat any postamendments device not found “sub-stantially equivalent” to a preamendments devicebe automatically classified in Class III, with subse-quent opportunity to petition for reclassificationof the device in Class I or II. The “substantialequivalence” clause of the 1976 law was meantto make a regulatory distinction between thosepostamendments devices that are modificationsof commercially available devices from those thatare truly new devices.
Because of the costs and delays in approvalassociated with the reclassification process, how-ever, manufacturers of postamendments deviceshave had incentives to seek a finding of “substan-tial equivalence” rather than reclassification sothat they can market their devices much sooner.Much less information is needed to successfullyclaim that a postamendments device is substan-tially equivalent to a preamendments device thanto gain approval through the premarket approvalprocess. In fact, the lack of information on thesafety and effectiveness of preamendments devicesraises questions about how determinations ofsubstantial equivalence can be made.
Option 10: Retain existing procedures for deter-mining ‘substantial equivalence. ”
As previously explained, FDA has begun to callfor safety and effectiveness evidence on high-priority preamendments Class III devices, andonce that evidence is presented and evaluated,there should be a substantive basis for compar-ing these devices with postamendments devicesdetermined to be substantially equivalent. Butthe process will take years and may be selectiverather than including all preamendments Class IIIdevices.
On the other hand, the “substantial equiva-lence” clause has been a convenient method fordevice manufacturers to get their products ontothe market quickly But as new generations of
postamendments devices diverge more and morefrom their preamendments antecedents, it will beharder for manufacturers to use the substantialequivalence method of market entry. It will alsobe harder to practice “piggybacking,” in whicha postamendments device is compared to anotherpostamendments device and, through a chain ofother postamendments devices, eventually com-pared to a preamendments device.
More immediately, FDA’s Office of GeneralCounsel has stated that such “piggybacking” is notauthorized by the amendments (464), and if thepractice of piggybacking ceases, more postamend-ments devices will eventually be placed in ClassIII, and their manufacturers will have to go throughthe full premarket approval process or petitionFDA for reclassification.
Option 11: Eliminate automatic classification intoClass III of postamendments devices that arenot found substantially equivalent to preamend-ments devices, and allow FDA to place a de-vice in the appropriate class at the time ofnotification.
Automatic classification into Class 111 of post-amendments devices that are not found substan-tially equivalent to preamendments devices servesas a second screen in the regulation of post-1976devices. The first screen is a determination ofwhether or not a device is “substantially equiva-lent” to a preamendments device. The secondscreen, with automatic classification into Class 111,is a presumption that any device that is not sub-stantially equivalent needs full premarket ap-proval, unless the manufacturer successfully peti-tions FDA for reclassification in Class I or Class11 Under this option, the burden of responsibilityof coming forth with evidence that rebuts initialClass 111 designation could remain with devicemanufacturers, but manufacturers could be al-lowed to present this evidence for classificationat the time of notification. This change should re-duce current incentives to claim “substantialequivalence. ”
Option 12: Develop approaches for reviewing newdevices that are different from those for review-ing modifications of commercially available .devices.

Ch. 5—Regulation of Medical Devices by the Food and Drug Administration ● 131——
Eliminating automatic Class 111 designation ofpostamendments devices that are not found sub-stantially equivalent to preamendments devicesmight serve to bring out the distinction betweenmodified and new devices that the “substantialequivalence” clause was originally meant to pro-vide. GAO has recommended another approach,eliminating the “substantial equivalence” clauseso that all Class 111 (but not Class I or II) post-amendments devices have to go through premar-ket approval. (Automatic Class III designation fornon-substantially equivalent postamendments de-vices could also be eliminated so that new devicesthat would more appropriately be put into ClassI or II would not have to go through the super-fluous step of reclassification. ) In general, then,the difference in approach could be between pre-and postamendments devices as originally in-tended, or between Class III pre- and postamend-ments devices, where the difference in regulatoryrequirements is most pronounced.
Regulation of Class II, or Intermediate,Devices
More than 1,000 of the 1,700 device types havebeen placed in Class II. The unanimous opinion,however, is that except for a small number of de-vice types, performance standards cannot be de-veloped in a timely fashion. Thus, if an inter-mediate class of regulation is still needed, per-formance standards will have to be replaced byother types of regulation between Class I and itsgood manufacturing practices requirements andClass 111 and its premarket approval requirements.
Option 13: Give FDA legislative authority to useavailable methods in addition to performancestandards to regulate Class II devices.
An obstacle to the use of methods for regulat-ing Class II devices other than performance stand-ards has been the question of whether or not thelaw requires the use of performance standards.GAO has in fact suggested that the law be revisedto give FDA the authority to make a device-by-device determination of when performance stand-ards are needed (331). Although the use of per-formance standards may not be mandatory, achange in the statute clearing up the ambiguitymight be useful in setting into motion substan-
tive efforts to use other approaches, instead ofcontinuing to focus attention on the unrealisticexpectation that so many performance standardscan be developed.
FDA has suggested using a combination ofvoluntary standards, user education, and otherexisting controls to regulate Class II devices (387).Previously identified controls include revokingany approval to market a device, banning the de-vice, or requiring repair, refund, or replacement,and the prescription and restricted device provi-sions. If the legality of using available approachesin place of performance standards is upheld or theuse of these remedies legislated, a three-tiered reg-ulatory system for medical devices can be put inplace. Rather than a Class II with mandatory con-trols, however, there would be specific devices(Class I or Class III) for which additional controlscould be stipulated (e.g., prescription or restricteddevices), and device-by-device determinations ofthe applicability of these other controls.
Option 14: Legislate an additional category ofClass II devices to be regulated through meth-ods other than performance standards.
The Subcommittee on Oversight and Investiga-tions of the House Committee on Energy andCommerce has suggested that performance stand-ards be retained for Class II and that a Class 11Abe formed on which greater controls (e.g., restric-tions under the restricted device clause, increasedmandatory device experience reporting, and adop-tion of performance specifications against whichthe device must be tested periodically) are imposed(338).
This option is similar in effect to the previousoption, the principal difference being that this op-tion involves legislating an explicit, additional cat-egory of Class II devices and retaining mandatoryperformance standards for some devices. Also,this option would leave less discretion to FDA indetermining which devices should be regulatedand how they should be regulated.
Option 15: Encourage FDA to reclassify mostClass II device types into Class I or III and tocontinue to develop performance standards forthe remaining Class II devices.
Rather than being regulated through perform-ance standards, medical devices receiving Class
132 . Federal Policies and the Medical Devices Industry
II designation are currently being regulated byFDA as though they were Class I devices. A par-tial approach to the problem might be to screencurrent Class II devices to see whether some ofthem could be placed in Class III. This issue wasraised by the Health Research Group in the caseof General and Plastic Surgery devices, when FDAproposed placing seven implantable device types(including artificial ears, noses, and chins) in ClassII rather than Class III (253).
The burden of regulation under Class III forreclassified Class II devices might not be onerous.FDA already differentiates between “significantrisk” and “nonsignificant risk” Class III devicesin its IDE regulations; and FDA could develop dif-ferent levels of evidence for safety and effective-ness of the types previously discussed under op-tions for preamendments Class III devices (Option6).
Postmarketing Monitoring and Controls
The lack of information on risks associated withthe use of medical devices can be viewed eitheras evidence that such risks are not extensive andthat more vigorous device regulation is not needed,or instead as an indication that monitoring sys-tems should be improved to yield more informa-tion before risks are discounted. Identifying prob-lems is crucial in determining which devices mayneed additional controls and what types of con-trols should be applied. Thus, improved informa-tion on risks would be helpful both for determin-ing the scope of the problems that regulation couldaddress and in applying the appropriate types ofcontrols.
Option 16: Require FDA to develop better sys-tems for monitoring and providing informationon risks associated with devices.
FDA is reportedly ready to make final its reg-ulations on mandatory device experience report-ing by manufacturers, subject to the Office ofManagement and Budget’s approval (257). GAOhas suggested that FDA’s voluntary reporting sys-tem, the Device Experience Network (DEN), berevised so that information is included on thescope and nature of device problems caused byuser error and inadequate maintenance; that thedata be analyzed to identify special problems and
trends; and that the results be used to aid in de-veloping solutions (331). GAO is also initiatinga comprehensive exploration of postmarketingsurveillance activities and their potential applica-tions (300).
Thus, there is a gradual movement toward bet-ter identification of, and faster and more targetedresponses to, device risks. The process might beaccelerated by legislating mandatory device ex-perience reporting instead of continuing with thepermissive language contained in the statute.
Option 17: Encourage FDA to selectively applypostmarketing controls to regulate Class IIdevices.
Postarnendments controls could be applied toa new class of Class II devices or left to be ap-plied by FDA on a device-by-device basis (see Op-tions 13, 14, and 15). A reconstituted three-tieredclassification approach would result. Minimal reg-ulation would apply to the lowest class of devicesthrough the good manufacturing practices regu-lations. An intermediate class of devices (ClassII) would be represented by those devices thathave additional controls (prescriptions, restricteddevices, postmarked controls) applied to them ofthe types identified in addition to the good man-ufacturing practices requirements. The highestregulated class of devices would have to meetpremarket approval requirements and might haveadditional controls imposed on their marketing.
Assistance to Small Manufacturers
The 1976 amendments contained a provisionto help small firms through the regulatory proc-ess by establishing an Office of Small Manufac-turers Assistance. Two other steps could aid smallfirms in manufacturing Class III devices: 1) whereappropriate, Class III devices could be down-classified as soon as possible; and 2) small firmscould be given assistance in developing the safetyand effectiveness evidence necessary for Class IIIdevice approval.
Option 18: Develop additional mechanisms tohelp small firms through the regulatory process.
Option 18A: Encourage FDA to use publiclyavailable information as soon as possible todown-classify Class III devices.

Ch. 5—Regulation of Medical Devices by the Food and Drug Administration ● 133— ..—. —
FDA could take the initiative in identifyingClass III devices of significant importance to pub-lic health and could monitor their use. Thus, pub-licly available information could be accumulatedat the earliest possible time and down-classifica-tion could be initiated.
Option 18B: Develop a “broker” mechanism be-tween small firms with promising devices andclinical investigators capable of performing thetests necessary to gather safety and effective-ness data in support of the premarket approvalapplication for Class III devices.
Although Option 18A might help small firmsgain approval for medical devices that are alreadyon the market, it would not help small firms thatwant to be among the first to have their devicesapproved for marketing.
There is some precedent for a broker function,although there might be questions of conflict-of-interest if FDA assumed the role. One precedent,for example, is the past and continuing collabora-tion between commercial sponsors and specific in-stitutes at the National Institutes of Health in per-forming clinical trials for potentially significantnew drugs to meet FDA’s requirements of clini-cal testing for premarket approval. Another prece-dent is the Federal promotion of “orphan” medi-cal products, in which Federal funds are used tosupport clinical trials for promising products thathave a limited market, such as drugs for rare dis-eases. Thus, as a broker, FDA could maintain aregistry of potentially marketable devices and pro-vide it to interested parties.

Regulation of the Providersof Medical Device Devices
For the general run of consumer goodsthe buyer is necessarily an amateur
while the seller is a professional —Joan Robinson

Contents
PageIntroduction . . . . . . . . . . . . . . . . . . . . . . . . . . . . . . . . . . . . . . . . . . . . . . . . . . . 137Federal Regulation of Providers . . . . . . . . . . . . . . . . . . . . . . . . . . . . . . . . . . . . . . . 137
Federal Regulation of Providers Under Medicare . . . . . . . . . . . . . . . . . . 137Federal Health Planning Regulations . . . . . . . . . . . . . . . . . . . . . . . . . . . . . . 143
State Regulation of Providers . . . . . . . . . . . . . . . . . . . . . . . . . . . . . . . . . . . . . . . . . 145State Licensure of Facilities and Personnel . . . . . . . . . . . . . . . . . . . . . . . . . 145State Certificate-of-Need Laws . . . . . . . . . . . . . . . . . . . . . . . . . . . . . . . . 147
Discussion and Policy Options . . . . . . . . . . . . . . . . . . . . . . . . . . . . . . . . . . . . . 151

6 ■
Regulation of the Providersof Medical Devices
INTRODUCTIONRegulation in health care has developed because
of certain conditions that set the health care fieldapart from many others. Large segments of theAmerican public do not have sufficient medicalknowledge to make informed decisions about theirhealth care. To a significant extent, therefore,especially in the case of sophisticated proceduresand unusual medical conditions, patients mustrely on the judgment of physicians or other healthcare professionals. Furthermore, as described inchapter 3, the system of third-party financing formedical care that has evolved in this country hasfostered the uncritical adoption and sometimes ex-cessive use of medical technologies, includingmedical devices. Such adoption and use, in turn,have contributed to a rapid rate of increase in Fed-eral expenditures under programs such as Medi-care and Medicaid and in national health care ex-penditures generally.
Chapter 5 discussed the Food and Drug Admin-istration’s regulation of drug and device manu-facturers to protect the public from unsafe andineffective drugs and medical devices. This chapterexamines regulations pertaining to the health careinstitutions and individuals—i.e., hospitals, nursinghomes, home health agencies, ambulatory surgi-
cal centers, clinical laboratories, and others—thatprovide or use major medical equipment, such ascomputed tomography (CT) scanners, or smallerdevices, such as sutures or splints.
Various Federal and State regulatory programsaffect the providers of medical devices. As notedin the discussion that follows, regulation of healthcare providers has been undertaken with severalobjectives in mind:
●
●
●
that people receive care of acceptable quality,that rising expenditures on health care arecontrolled, andthat the distribution of medical facilities isequitable.
This chapter analyzes the impact of Federal andState regulation of providers on adoption and useof medical devices in specific health care deliv-ery sites. It also discusses interactions among theregulations and proposed changes. Although deci-sions to adopt and use medical devices are typi-cally made by physicians, most of the regulationsdiscussed in this chapter affect physicians only in-directly.
FEDERAL REGULATION OF PROVIDERS
At the Federal level, providers of services toMedicare beneficiaries are regulated through con-ditions of participation, section 1122 of the SocialSecurity Act, and professional standards revieworganizations (PSROs) (currently being replacedby the utilization and quality control peer revieworganizations, PROS). Providers are also regu-lated under State laws required by the Federalhealth planning program.
Federal Regulation of ProvidersUnder Medicare
Designers of the Medicare program wanted toensure that the Federal Government paid for goodquality care for elderly and disabled people eligi-ble for benefits under this program (107), andconditions of participation for providers wereadopted at the outset of the program to attain a
137
25-406 0 - 84 - 10

138 ● Federal Policies and the Medical Devices Industry— . .
satisfactory level of quality. As the program wasimplemented and costs rose, cost containment alsobecame an issue. Thus, in the Social SecurityAmendments of 1972 (Public Law 92-603), bothto help ensure beneficiaries’ access to quality med-ical care and to help contain costs, Congress cre-ated the PSRO program and added section 1122to the Social Security Act. Along with conditionsof participation, PSRO review of the utilizationand quality of services provided to Medicare ben-eficiaries and section 1122 review of capital ex-penditures are described further below.
Conditions of Participation
Conditions of participation are requirementsthat must be met by hospitals and other providersin order to receive payment for treating Medicareor Medicaid patients, The purpose of the condi-tions is to assure a basic level of quality of themedical care for which the Federal Governmentpays (107). The conditions of participation forhospitals are similar to the voluntary standardspromulgated by the Joint Commission on Accred-itation of Hospitals (JCAH) (see box L) or theAmerican Osteopathic Association. About 5,200hospitals accredited by JCAH or the AmericanOsteopathic Association are automatically con-sidered in compliance with Medicare qualitystandards. However, an additional 1,495 hospi-tals are not accredited by either of these organi-zations but do participate in Medicare or Medic-aid (315).
Some conditions of participation for providerslist specific medical devices whose availability isrequired. The lists of devices in conditions of par-ticipation are generally not extensive or exhaus-tive, but instead allow providers flexibility indeciding which services to make available. Hos-pital operating suites, for example, must have thefollowing equipment available: call-in system, car-diac monitor, resuscitator, defibrillator, aspirator,thoracotomy set, and tracheotomy set (42 CFR405.1031 (a) (11)). Freestanding ambulatory sur-gical centers must provide laboratory and radio-logic services that include, but are not limited to,such medical devices as surgical dressings, splints,casts, appliances, materials for anesthesia, anddiagnostic or therapeutic services directly related
to the provision of surgical procedures (42 CFR416.46 (C)).
The conditions of participation have not under-gone any substantial revision since Medicarebegan operating in 1966. Revisions proposed bythe Department of Health and Human Services(DHHS) in January 1983 would make the condi-tions of participation for hospitals less prescrip-tive, allowing hospital medical staff and admin-istrations greater flexibility in the provision ofinpatient medical care. Statutory requirements arestill included, but the proposed changes “. . . areintended to simplify and clarify requirements, tofocus on patient care, to emphasize outcomerather than the means used to achieve those ends,to promote cost containment while maintainingquality care, and to achieve more effective com-pliance with Federal requirements” (315). Bene-ficiary and labor groups have protested the newregulations, and the Secretary of Health andHuman Services has delayed publication of thefinal rules by returning them to the Health CareFinancing Administration (HCFA) (452).
Many of the existing conditions of participa-tion for providers specify educational and experi-ence requirements for personnel, similar to JCAHstandards. Stringent personnel requirements canhave several effects on the diffusion of medicaldevices. Requirements for highly trained (andtherefore often expensive) personnel to performcertain tasks give providers such as clinical lab-oratories incentives to purchase capital equipmentthat reduces the number of personnel required toperform the task (provided the available person-nel are already being used efficiently) (120,227).If such capital equipment is expensive, hospitalsand facilities that provide services to inpatientsmust comply with section 1122 of the Social Secu-rity Act and State certificate-of-need (CON) reg-ulatory programs required by the National HealthPlanning and Resources Development Act of 1974(Public Law 93-641). These Federal and State pro-grams, discussed further below, were responsesby policymakers to several problems: the duplica-tion of facilities and services, which contributedto the high cost of health care; access to healthcare, especially as it pertained to the maldistribu-tion of services; and the high cost of medical care

lkx L.–--jaw On of$T3w stamliwds for tbt wwe adopted for the hkdiea~e pragram in the Social fku-
rity of %96$ were based on the 1965 standards for qwdity by JCAH. Con-- had Kqco imd the need for a quality assurance for the medical care to be paid through
Rimd ed%aid, and the a v a i l a b l e and acceptable to medical pmfessimmlsalla the publi~ (107).
}~~ ~a~ WI a~%~~wth Of the ~ospi$a~ a~cr~ditati~~ program initiatd by the American CoIlegeof Ekrgw.ms in 1918 to ensure that hospitals had the necessary equipment and supplies for good qualitypatient cam In 1951, the flmmcial burden of stamktrd setting and faciiity mrveying proved too great$CW the Amwicart Cokge of Surgeons. JCAH was founded that yew by joirdng the American Collegeof !iiurgeuns, American CcWege of Physicians, American Hospital Association, Ammican Medical Asso-ciation, and the Canadian Medical Association for the purpuse of accrediting hospitals. The CanadianMedical Asso&&ion withdrew in 1959, when it formed the Canadian Council cm Hospital Accredita-tion. The American Dental Association joined JCAEI as a corporate member in 1979.
, Hospitals must be in substantial compliance with JCAH standards in order to be accredited for aperiod of 3 years. They must dwmmstrate through a survey process that they m+wt the applicable stzmd-ard~, ~ither through the hospital’s own facilities artd staff or by sharing some outside services. Sharedser+kws may be contmcted for with another am-edited hospital or an ~gemy that rnaintsins the levelof performance required by JCAH stmdwxk Each hospital must agree ta conduct an interim self-surveyat the midpoint between its JCAH survqys.
The 1965 JCAH standards adopted by Medicare for its conditions of participation included the re-quirement d urirdysis and hernogkkin or lwrnatocrit tests for a~l patients upon whnisskm. This re-quirement contributed to the overuse of tests and the medical devices involved in performing them. Inthe e+wly 19?(M, this standard was ekxdnated, and in 1979, JCAH reinforced the principle of “no stand-ing tests” in a to its hospitals (222).
In gerwtd, JCAH standards do not specify medical devices that must be available in hospitals forrather, the medical staffs at the !mspitak are left to decide about particular medical d e v i c e sthat will assist in #he provisicm of qwdity cam+ In certain instances, swch as the aner~ency service/de-partment, patient safety requirements specify medical devices and their maintenance. 1%~ example, the1983 Accreditation Manual fur Hospitals specifies in Standard 11 for Functional Safety and Sanitation:
MAwds anti frequency of testing, and verification of performance —-specifications and me+specifications,for all electrical imd electronic patient care equipment, based upon established safety requirements, performancecriteria, and manufacturers’ claims. Such testi~ and verification shall apply to both fixed and mobile ~uipment,with pmDticAw emphasis OR life-suppur$ such as respirators, defibrilktors, pRysic@ic monitoring systems,iniant incubators and warmers, as well as devices with a high hazard potential such as dectrosurgicalW@prri6?nt . . . *
is an ongoing process in JCAH, and input is sought from specialty organizations,other experts in applicable areas, and reknwmt government agencies (such as the Health Care Financingwhich oversees Medicare). JCAH develops standards in response to identified needs tomeasure quality of a service or a particular aspect of care. New or revised standards may be neededwhen there am “. , . innovations in techniques, advancements in knuwkdge, changes in gmwrmwmtalregulations, or the demand by consumers far accountability. . . .“ (IX$. The use of experimental devices,unlike experimental drugs which am addrewed by JCAH, is not covered by a specific standard (222).
The assumption underlying the vd.mtary JCAH standards is that a rmxsary but mot sufficient con-di~iun for good quality medical cam is the availability of certain facilities, including medical techrwl-agies and staff. JCAH strives for the following characteristics for its stardards: 1) validity, meaning thatthe stwwiards relate to quality of care; Z) encouragement of excellence within available resources; 3)meanirtg that the standards h a v e b e e n met b y a n existing hospital; and 4) rrwasurability{176). The effect of JCAH standards cm the quality of care delivered in hospitals is %uwcdotd. Qualityhas improved, but a direct causal relationship has not been established.

140 • Federal Policies and the Medical Devices Industry
borne by Medicare and Medicaid. The interactionof various Federal and State regulations for in-dependent clinical laboratories is described in boxM.
The effects of Medicare conditions of partici-pation on the adoption and use of medical devicesare unclear. Initially, there was an impetus for theFederal Government to approve as many hospi-tal beds as possible so that the Medicare guaran-tee of access to medical care for elderly peoplewould be operational on the first day of the pro-gram’s implementation (7,107). In some cases,hospitals that had not previously been accreditedbecause of failure to meet “contemporary stand-ards of technology, staffing, and medical prac-tice” were certified by Medicare as “in substan-tial compliance” (107). The incentives for facilitiesto achieve full compliance were weak, becausehospitals with conditional certification were paidon the same basis as those in full compliance.
Since Medicare conditions of participation forhospitals were based on JCAH accreditation stand-ards, any evidence on effects of the voluntaryJCAH standards would apply to these conditionsas well. Unfortunately, there is little evidence thataccreditation has had an impact on the qualityof care in hospitals or on the adoption of newmedical technologies (227). Whether or not theconditions of participation affect the adoption anduse of specific medical devices is impossible toprove because of the general lack of specificityregarding medical devices in most of the condi-tions of participation (and in the JCAH stand-ards). Data sources for comparisons also lackspecificity regarding medical equipment.
Medicare’s diagnosis related group (DRG) basedprospective payment system for hospitals, whichwas mandated by the Social Security Amend-ments of 1983 (Public Law 98-21) and is currentlybeing implemented (see ch. 3), changes the envi-ronment for Medicare-based regulatory programs.Medicare’s DRG hospital payment system mayenhance the importance of conditions of partici-pation for quality of care. The same law that man-dated DRG payment also added a new “condi-tion of payment”: In order to be paid for treatingMedicare patients, hospitals must contract withPROS (see “Utilization and Quality Review Pro-grams” section below).
Utilization and Quality Review Programs
Utilization review programs in hospitals havebeen a condition of participation for hospitals par-ticipating in Medicare since the program’s incep-tion in 1966. In the original Medicare legislation,hospitals were required to have periodic reviewsof the medical necessity of admissions, extendedstays, and professional services rendered (42 CFR405.1035 (a)). The purpose of these reviews wasto help contain costs and to ensure quality of care.Medical device use was to be evaluated in con-nection with the review of professional services.
Congress mandated the PSRO program in theSocial Security Amendments of 1972 (Public Law92-603) to carry out these utilization and qualityreview responsibilities. PSROs, which as notedabove are currently being replaced by PROS, areareawide groupings of practicing physicians des-ignated by DHHS to review services provided toMedicare and Medicaid beneficiaries. Their pur-pose has been to ensure that the services Medi-care and Medicaid pay for are: 1) medically nec-essary, 2) of a quality that meets locally deter-mined professional standards, and 3) provided atthe most economical level consistent with qualityof care. Thus, the two objectives of the PSRO pro-gram have been quality assurance and cost con-tainment (345).
In theory, PSROs were to accomplish thesegoals by conducting three types of evaluations ininpatient hospital settings, long-term care facili-ties,
●
●
●
and ambulatory care settings:
utilization reviews (e.g., reviews of the lengthof stay and medical necessity of admissions);medical care evaluations or quality reviewstudies (e.g., audits of patient records tomonitor the appropriateness of tests, drugs,and procedures administered to patients);andprofile analyses (e.g., reviews of hospitalphysicians’ patterns of care to identify po-tential problems).
in practice, PSROs have tended to emphasizeutilization reviews in inpatient settings, focusingon the identification of high hospital admissionrates and lengths of stay. One of the reasons isthat identifying high usage of hospital care hasproved easier than identifying underuse of hos-


142 • Federal Policies and the Medical Devices Industry
pital care or specific medical technologies. Fur-thermore, from the standpoint of reducing Medi-care costs, reducing overutilization of hospitaladmissions and lengths of stay is clearly impor-tant. Reducing overutilization of hospital care islikely to be more cost saving than reducing under-utilization, although it could be argued that fromthe standpoint of quality assurance, it is also im-portant to consider the latter.
PSRO utilization reviews in hospitals, althoughnot focused on particular drugs, devices, or med-ical procedures, may nevertheless have indirectlyaffected the utilization of specific medical devices.Quite conceivably, changes in hospital admissionrates and lengths of stay may have indirectly af-fected the use of diagnostic tests and other device-based procedures routinely used for hospitalpatients.
Like PSRO utilization reviews, most medicalcare evaluations and profile analyses have beenconducted by PSROs in inpatient hospital settings.Unlike utilization reviews, however, some medi-cal care evaluations have been directly focusedon the appropriate use (including underutilization)of specific medical devices.
Thus far, evidence on the effectiveness of re-view programs has been mixed. Analysts consid-ering benefits of review programs have examinedboth cost savings and contribution to qualityassurance. Evidence is inconclusive that utiliza-tion review programs have achieved net cost sav-ings when reductions in length of stay and admis-sions are considered along with the costs of thereview program (50,57,325,326,334,395,397,409,411). Evidence that review programs have im-proved quality of care is limited but suggestive(57,395).
No specific evidence of the effects of PSRO orhospital review programs on the adoption and useof medical devices has been reported, althougha study of one hospital showed that length of stayand average charges per patient (probably relatedto medical device use) generally decreased follow-ing institution of PSRO review. The decrease,however, did not result in savings to Medicareand Medicaid because of an increase in hospitaladmission rates also attributed to PSRO review(455).
As noted earlier, the Social Security Amend-ments of 1983 added as a new “condition of pay-ment” for hospitals treating Medicare patients therequirement that hospitals contract with PROS.PROS have responsibility for monitoring ancil-lary service use and hospital discharges that re-sult in quick readmissions, because Congress rec-ognized the financial incentives under DRG pro-spective payment to use as few ancillary services(including those involving medical devices) as pos-sible, to discharge Medicare patients as quicklyas possible, and to admit as many cases as possible.
PROs, the replacements for the PSROs, arecontract organizations that must affirm their uti-lization review and quality assurance objectives,as well as define their specific plans on how toattain these objectives, in their contracts withHCFA. Medical devices will be subject to evalua-tion under the PRO function to review the com-pleteness, adequacy, and quality of care to hos-pital inpatients. A specific requirement in thescope of work for PROS is to monitor cardiacpacemaker implantations and reimplantations forunnecessary procedures (407).
Section 1122 Capital Expenditure Review
Section 1122 of the Social Security Act andState CON laws required by the National HealthPlanning and Resources Development Act (see“Federal Health Planning Regulations” and “StateCertificate-of-Need Laws” sections below) poten-tially could have the most direct effect on medi-cal devices of any of the provider regulations dis-cussed in this chapter. Congress mandated section1122 capital expenditure review in the Social Secu-rity Amendments of 1972 (Public Law 92-603).The purpose of section 1122 review is to ensurethat Federal funds for Medicare, Medicaid, andthe Maternal and Child Health and CrippledChildren’s Services programs are not used to sup-port unnecessary capital expenditures by healthcare facilities. Section 1122 of the Social SecurityAct authorized the Secretary of Health, Educa-tion, and Welfare (now Health and Human Serv-ices) to enter into contracts with States that werewilling and able to do so. Under these contracts,a State or State health planning agency would re-view expensive capital expenditures, and the Sec-

Ch. 6—Regulation of the Providers of Medical Devices ● 143 . . —
retary could withhold reimbursement for expend-itures that were disapproved.
Under section 1122, capital expenditures byspecified health facilities that exceed a certainthreshold—initially $100,000, currently $600,000—are subject to review by a State or State planningagencies. Also subject to section 1122 review arechanges in numbers of beds or substantial changesin the services offered in medical care facilities.As of 1983, only 15 States had contracts withDHHS to conduct section 1122 capital expendi-ture reviews.
Section 1122 currently applies to hospitals,psychiatric hospitals, tuberculosis hospitals, skillednursing facilities, kidney disease treatment centers,intermediate care facilities, and ambulatory sur-gery centers. Medicare and Medicaid reimburse-ment to these facilities can be denied only forunapproved capital expenditures (i. e., expensesrelated to depreciation, interest on borrowedfunds, or, in the case of proprietary facilities, re-turn on equity for capital equipment or construc-tion). Reimbursement for operating expenses asso-ciated with unapproved capital equipment orconstruction is not affected.
Because of the high threshold for section 1122review and the State-based decisionmaking proc-ess provided for in the law, the effect of section1122 provider regulation on medical devices isprobably similar to that of the State CON pro-grams required by the National Health Planningand Resources Development Act of 1974 (see sec-tion on “State Certificate-of-Need Laws” below).Only a few devices-e. g., CT scanning and nu-clear magnetic resonance (NMR) equipment—ex-ceed the threshold for section 1122 review. Thus,most purchases of medical devices by the facili-ties to which section 1122 applies can be madewithout section 1122 review.
Federal Health Planning Regulations
Bringing together several strands of previouslegislation, the National Health Planning andResources Development Act of 1974 (Public Law93-641) outlined national health priorities andreplaced the existing network of voluntary agen-cies with a system of about 200 local health sys-
tems agencies and State health planning and de-velopment agencies. The purpose of this act andrelated health planning legislation was to cen-tralize decisionmaking at the State level in orderto rationalize resource allocation and controlescalating rates of cost increases.
The 1974 law called for the provision of greaterauthority to State and local planning agencies overhospital investments. The law required Statehealth planning agencies to review CON and sec-tion 1122 applications from medical facilitiesregarding capital investments. State planningagencies have the responsibility of determining thenumbers and types of facilities and services neededby their populations. State Health Plans to accom-plish the equitable distribution of these health careservices are required by the Federal law. Agen-cies try to alleviate the perceived maldistributionof health services and to contain rising coststhrough CON programs.
Amendments to the 1974 National Health Plan-ning and Resources Development Act establisheda two-level review process for CON programs.A medical facility must submit a detailed applica-tion to the local health planning agency, whichsubsequently reviews it. State health planningagencies have the authority to grant a CON, butthey must carefully consider the recommendationof the local agency.
Minimum criteria and standards for CON re-view by the States are set forth in the Federal plan-ning law. The State agencies must consider therelationship of the proposed services to the Statehealth plan and to the provider’s long-range plan,the targeted population’s need for the proposedservices, alternative means of meeting the need,the availability of resources for the proposed serv-ice and alternative health uses of those resources,the relationship of the proposed service to the ex-isting health care delivery system, and specialneeds of health maintenance organizations (HMOs),among other criteria.
Current Federal law requires hospitals, skilledand intermediate-care nursing facilities, kidneydisease treatment centers, rehabilitation hospitals,and freestanding ambulatory surgical centers tosubmit applications for capital expenditures underState CON programs. States vary in their cover-

144 ● Federal Policies and the Medical Devices Industry— — .
age of other facilities, but few cover physicians’offices (see section on “State Certificate-of-NeedLaws” below). Some facilities are exempt from theFederal requirement for CON applications forcapital equipment, among them Federal hospitalsand clinics (e.g., Veterans Administration medi-cal centers). Medical research institutions andHMOs are given special consideration. These en-tities must notify the State CON agency that theyintend to purchase a piece of major medical equip-ment, for example, and the agency must approvethe purchase if specific applicant criteria are metand if need is demonstrated (Public Law 96-79 andPublic Law 96-538).
Required applications for CON are triggeredunder Federal law by types of expenditures andby amounts of such proposed purchases. Pro-posed expenditures must: 1) exceed the threshold,2) substantially change the bed capacity of the fa-cility, or 3) substantially change the services ofthe facility. The original CON thresholds were:1) $150,000 for capital expenditures, 2) $75,000for annual operating costs resulting from chang-ing services, and 3) $150,000 for major medicalequipment to be used to provide medical andother health services. The CON threshold levelsthat have been in effect since 1981 are: 1) $600,000for capital expenditures, 2) $250,000 for annualoperating costs resulting from changes in healthservices, and 3) $400,000 for major medical equip-ment to be used to provide medical and otherhealth services.l For changes in health services,CON applications are required if there is any cap-ital expenditure or if annual operating costs ex-ceed the specified operating cost threshold (129).Medical device purchases are included in CONapplications in those instances in which the de-vices are very expensive or in which facility serv-ices are changed.
Since 1979, Federal law (Public Law 96-79) hasrequired purchases of major medical equipmentthat will be used for medical treatment of hospi-
. .1States have been given authority to adjust these thresholds to
reflect the change in the previous year in the Department ofCommerce Composite Construction Cost Index. For States that doso, the thresholds would be $695,285 and $289,782. The $400,000threshold for major medical equipment may not be adjusted. (SeePublic Law 97-35 or proposed rule changes in the Jan. 4, 1983, issueof the Federal Register (315). )
tal inpatients to be covered by State CON laws,regardless of who makes the capital expenditure.Gifts and donations of medical devices that wouldcome under CON laws if they had been bought bythe facility are also subject to CON requirements.
Capital equipment initially purchased for re-search purposes usually must be approved forlater clinical use through the CON requirementregarding new institutional services. There are nonational data available regarding how much med-ical equipment has initially been purchased for re-search purposes and then transferred to clinicalservice. Thus, the effect of this aspect of theCON regulation on the medical devices industryis unknown.
What are the sanctions or incentives that en-force the Federal planning law’s requirement thatStates have CON laws? First, States that do nothave such laws risk losing their Federal planningmoney. But Federal planning funds have decreasedover the past few years, and the program hasweakened. Second, and probably more impor-tant, if States do not have conforming CON laws,they are supposed to lose Federal funds from sev-eral Public Health Service programs (particularlythose under the Community Mental Health CentersAct, Comprehensive Alcohol and Alcoholism Pre-vention, Treatment, and Rehabilitation Act of1970, and the Drug Abuse Office and TreatmentAct of 1972–see Public Law 96-79, sec. Ids).
The threat of these sanctions persuaded all butone State (Louisiana) to pass CON laws by March1983 (406), although as of March 1984, only 23States had CON programs in compliance with theminimum Federal requirements (129). Because thesanctions are not being applied under the presentnational law, however, Minnesota, Idaho, andNew Mexico have allowed their CON laws to ex-pire, For several years, the costs and benefits ofthe Federal planning program have been ques-tioned by Congress. This debate has resulted infunding the planning program through continu-ing resolutions that have specified that noncom-plying States not be penalized.
The future of the Federal planning program isuncertain. Budget decreases and the expressed in-tention of the Reagan Administration to disman-tle planning have further weakened the existing

Ch. 6—Regulation of the Providers of Medical Devices ● 145
Photo credit: General Electric
Nuclear magnetic resonance (NMR) imaging equipment,shown here, is one of the few medical devices that is
expensive enough to be regulated under Statecertificate-of-need (CON) laws.
program. The Administration, however, seems tobe reconsidering its position (453). New CONthresholds have been proposed in Congress (seebox N), and the Office of Management and Budgethas indicated a willingness to accept thresholdsof $5 million for capital expenditures, $1 millionfor changes in institutional health services, and
$2 million for major medical equipment (453). Al-though the fiscal year 1985 Federal budget con-tains no funds for health planning, the Adminis-tration has indicated that new, reasonable legislationwould be considered favorably (37).
Health planning has many critics, but an in-depth examination of the pros and cons of healthplanning is beyond the scope of this report. Spe-cific criticisms of the Federal health planning pro-gram focus on the difficulty of determining theneed for various health facilities and services.Methods of calculating need involve the use ofdemographic and epidemiologic data and requiredecisions based on the pros and cons of havingexcess or insufficient facilities on a periodic orsporadic basis. State and local planning agenciesoften rely on hospitals and other facilities for theirdata, which may pose problems of reliability. Inconsidering the need for new medical technol-ogies, data may not be available. State planningagency staffs may not have information on safety,efficacy, and cost effectiveness of new or old med-ical devices. Furthermore, agency personnel havebeen criticized for their lack of ability to use thedata appropriately (61,111).
The effect of the Federal health planning regu-lations on medical devices is most distinct in theCON impacts examined in the section on “StateCertificate-of-Need Laws” below.
STATE REGULATION OF PROVIDERS
At the State level, providers of medical devicesare regulated in part through State licensure lawsfor facilities and personnel. They are also regu-lated through State CON laws, which are requiredby the Health Planning and Resources Develop-ment Act of 1974 (Public Law 93-641) to conformto Federal criteria. Capital expenditure reviewsrequired by section 1122 of the Social Security Actwere discussed in the section on “Federal Regula-tion of Providers” above. Although like CON re-views, section 1122 reviews are State based, thesanctions on facilities for noncompliance with thesection 1122 are the withholding of Federal fundsunder Medicaid, Medicare, and Maternal and
Child Health and Crippled Children’s Servicesprograms. The sanctions on facilities for failureto comply with CON, by contrast, are determinedby individual States.
State Licensure of Facilitiesand Personnel
States have the power and responsibility to de-termine which providers may treat patients. Toensure a minimum level of quality for providers,State laws require hospitals, nursing homes, andother health care facilities to meet specific stand-ards in order to be licensed to operate. Facility

146 ● Federal Policies and the Medical Devices Industry. . — . . .
standards often include staffing requirements forlicensed personnel who have met a set of licen-sure qualifications, such as education and experi-ence. Virtually all States have hospital licensurelaws, but licensure laws with respect to other typesof facilities vary. State licensure laws also varyaccording to types of personnel The specificstandards and qualifications required are decidedby the individual States (227).
Some licensure laws are more detailed thanothers regarding medical devices or, more fre-quently, necessary staffing and staff qualifica-tions licensure laws are similar to the Medicareconditions of participation in their focus on struc-tural aspects of quality assurance, such as com-pliance with construction codes and public healthlaws licensure regulations tend to be weaker,more ambiguous, and not so well enforced in mat-
Ch. 6—Regulation of the Providers of Medical Devices ● 147
ters that are more clearly related to patient care(227).
There has been little research on the influenceof State licensure laws on the adoption and useof new medical technologies (227). It is probable,however, that licensure programs have had mixedeffects on medical devices, depending on the speci-ficity of the individual laws and how a particu-lar device is related to personnel needs. In clini-cal laboratories, for example, the strict personnelrequirements for laboratory licensure make equip-ment that reduces the number and skill level ofpersonnel quite attractive (120).
On the other hand, licensure requirements mayslow the diffusion of equipment that requires li-censed personnel for operation (227). In addition,stringent rules to employ highly trained person-nel in laboratories raise barriers to entry of newfacilities in the market because of the difficultyof finding and expense of employing the requiredpersonnel (120). Both facility and personnel licen-sure, then, can affect medical device diffusion.
Another characteristic of State licensure pro-grams themselves that probably affects the med-ical devices industry is the use of professionalsurveyors to inspect facilities. The subjectivity ofsome of the judgments needed to decide aboutlicensing a facility can sometimes be the basis forchallenging negative outcomes. Also, if reviewteams have a particular professional orientation,they can encourage the adoption of the best avail-able new equipment (227).
State Certificate-of-Need Laws
Several States had CON laws prior to the enact-ment of the National Health Planning and Re-sources Development Act of 1974. In 1964, NewYork became the first State to enact and imple-ment a CON law. Twenty-seven States had CONlaws by the time the National Health Planning Actwas passed. These States were required by 1980to make their laws conform to the same minimumFederal standards as State CON laws enacted after1974 (Public Law 96-79 ).2 However, State CON
‘Costs and benefits of the Federal health planning program havebeen debated in Congress for several years. This debate has led tobudget cuts and to continuing resolutions that do not enforcepenalties on noncomplying States.
laws differ with respect to the types of facilitiescovered, the standards and criteria used for CONreview, and the amounts of the expenditures forwhich CON applications must be submitted (406).
As noted in the “Federal Health Planning Reg-ulations” section above, current Federal law re-quires hospitals and other specified medical fa-cilities to submit applications for capital expend-itures under State CON programs. Some Statesrequire other types of facilities (e.g., freestandingemergency care centers and home health agencies)to submit applications, as well. Nine States re-quire CON applications for equipment purchasesfor physicians’ offices (453).
The focus of review when CON laws were firstimplemented after 1974 was on construction proj-ects (i. e., modernizing old buildings and erectingnew ones) and bed capacity changes (61). One ofthe reasons was that control over the costs of suchprojects implied control over further duplicationof facilities and excess bed capacity that wasblamed for some of the increase in health carecosts. Another reason for the focus on construc-tion and bed capacity changes when CON lawswere implemented was that there were few med-ical technologies at the time that cost more than$150,000 (the original CON threshold). Further-more, hospitals and other purchasers of medicalequipment were able to circumvent the require-ment for CON applications for equipment pur-chases in excess of the threshold by dividing ordersinto smaller expenditures that would not triggerthe review process (42). If new laboratories werebuilt or old ones renovated, construction was usu-ally necessary and put the project over the CONthreshold. If equipment purchases (regardless ofprice) changed the health services offered, or ifthe new services (regardless of capital expendi-tures) resulted in operating costs over $75,000(again, the original threshold), CON applicationswould be required (129).
As CON programs matured and as medicalequipment changed, more medical devices cameunder review. Highly innovative machines thataltered the practice of medicine, such as the CTscanner, were introduced in the 1970s (see box O).Machines such as CT scanners presented CONagencies with difficulties because of their high cost

BOX C?. -The Impact of Certificate of Need (CON) on Computed Tomography (CT) Scanners andNuclear Magnetic Resonance (NMR) Imaging Devices
Many of the issues encountered in today’s debate regarding the costs and benefits of NMR imagingdevices were also problems encountered when CT scanning equipment was introduced in the 1970s, TheCON laws were changed to balance some of the incentives for CT, but their effect on NMR remainsspeculative.
One of the difficulties in the CON process for CT scanners was the lack of data on safety and ef-ficacy for different medical conditions when CON applications were received (348). Physicians wereexperimenting with new uses of the machines, and manufacturers were improving the images and reduc-ing the X-ray dosage for their machines. Some hospitals obtained CT scanners for investigational pur-poses, and when CON applications were later submitted, these institutions already had the machinesand experienced personnel on staff. Furthermore, some CT scanners were purchased for hospitals byphysicians or groups of physicians, since only hospital purchases were covered by most CON laws. MobileCT units were also purchased and were able to serve several hospitals (349).
In 1979, CON laws were amended to include major medical equipment purchases for inpatient hos-pital use regardless of purchaser (Public Law 96-79). This change affected the private purchases of CTscanners for hospitals and the mobile units. Private purchases for nonhospital locations of CT scanningdevices were exempt from most States’ CON programs, The CON laws may thus have contributed tothe maldistribution of CT scanners that was perceived as late as 1980 (23). The maldistribution of scan-ners has implications for access to care and perhaps for quality of care for the poor segments of thepopulation who most often go to the hospitals that were not able to obtain CT scanners.
The price of head scanners declined over time, and hospitals that had waited to purchase them coulddo so without submitting CON applications because prices fell below the threshold. A change in theFederal regulations regarding CON programs in 1979 brought the head scanners back into the planningfold by using the “change in service” requirement (349). Upgrading equipment from CT head scannersto body scanners also came under CON review.
NMR imaging devices have been compared to the CT scanning devices because both have been ex-pensive innovations that could change the practice of medicine. Both became popular while still in ex-perimental stages of development. Just as CT head scans were further advanced in development whenCT began to affect CON processes, NMR head images are further advanced than NMR body images.CON applications were submitted before there were adequate data from which to evaluate CT scanningequipment (349). Although NMR is still in a research stage, 33 CON applications had already been filedfor NMR by October 1983 (451).
The prices of most NMR devices would trigger CON even if the thresholds were raised to the pro-posed $1 million for major medical equipment (100). Prices on CT equipment have fluctuated, but whetheror not prices will decrease for some or all NMR devices is unknown. NMR devices would also triggerCON for changes in service and if construction costs for building or renovating facilities to house NMRequipment exceed the proposed $5 million CON threshold. Physical facilities must be modified morefor NMR than for CT equipment. Both raise operating costs, and NMR devices require special person-nel. When CT scanners first became a CON issue, third-party payment for their use was questionable.That is the case again with NMR. Private investors are purchasing NMR imaging equipment and locat-ing it at nonhospital sites for the use of ambulatory patients. Thus, although NMR device use is stillin a research phase, there seems to be a considerable amount of action in the market (100).

Ch. 6—Regulation of the Providers of Medical Devices ● 149
and the paucity of data on safety and efficacy.Physicians were still experimenting with new usesof CT scanners and manufacturers were still refin-ing their machines when CON agencies receivedapplications from hospitals and other covered fa-cilities. In some cases, physicians and physiciangroups purchased CT scanners for their hospitals,to circumvent the requirement for CON approval(which in 1979 was extended to cover any majormedical equipment to be used for inpatient carewithout regard to the purchaser or to the loca-tion of the equipment) (349).
The interaction of CON thresholds and equip-ment purchase prices is a potential source of in-fluence on the diffusion of new medical devices.Over time, CON thresholds have increased. Theprices of medical equipment also change over timeas refinements are made or as components insteadof a composite machine are sold, for example. Theprices of medical equipment may go either up ordown.
If new major medical equipment is priced abovethe CON threshold, delaying its purchase maysave a facility money (unless the facility’s resultingloss in potential operating revenues is substantial):if the price drops below the CON threshold, thefacility may save not only the amount by whichthe price drops but also the administrative costsof the CON application. In the case of equipmentthat substantially changes the services providedby the facility, however, CON review would benecessary even if the price were to drop. In addi-tion, facilities are prohibited from dividing proj-ects into parts to avoid CON applications—eachproject must be a separate project (141).
Under the Federal requirements, State CONprograms are to “provide for procedures andpenalties to enforce the requirements of the pro-gram” (42 U.S. C. 300 m-2). Hospitals and othercovered facilities must submit their CON appli-cations to the State or local planning agency andabide by the approvals or denials or suffer theconsequences. Sanctions against providers varyamong the States but may include any or all ofthe following: denial or revocation of operatinglicenses, fines, civil or criminal penalties, andcourt injunctions (42 CFR 123.408 (b)).
Studies of the effectiveness of CON programshave shown that some States have used them suc-cessfully and others have not (133,436). Capitalexpenditures and health care costs have continuedto increase despite CON laws, although bothresults may vary by State (436). Several research-ers have studied the effects of CON on capital ex-pansion; some have found evidence supportingcapital limitation by CON and some have foundevidence against it (436).
Studies of the effect of CON on cost controlhave produced no findings to support its abilityto control health costs (436). Access to care forsome patients has been improved, but there stillseem to be excess bed capacity and duplicationof services and facilities in some areas and short-ages in others, all of which were to have beeneliminated through CON (61).
There have been many studies of the impact ofCON programs on capital expenditures (436). Oneof the early studies by Salkever and Bice showedthat in States with CON laws, the number of bedsdecreased, but total hospital investment and assetsper bed (which relate to medical devices) increasedfrom 1968 to 1972 (270).
Hellinger, testing the hypothesis that theamount of hospital investment in States withCON laws would be less than it would have beenwithout the CON programs (148), concluded thatCON legislation had not significantly decreasedcapital expenditures. He then speculated that therewould be a lagged effect because hospitals had an-ticipated the passage of the CON laws and spenthigher than usual sums in the period before theirimplementation.
Warner has pointed out that because they donot specifically consider operating costs associ-ated with capital purchases, CON programs donot evaluate whether equipment will ultimatelysave costs or increase costs (450). Operating costsof capital expenditures continue to be a source ofhealth care cost increases (64).
Yet another study showed that in States withhospital rate-setting programs, increased capitalexpenditures may not lead to higher operatingcosts (96). Specific devices may be affected dif-

150 ● Federal Policies and the Medical Devices Industry
ferently in different States. Russell found that thediffusion of cobalt therapy was not discouragedby the CON law in New York, but CON laws inother States have discouraged the technology’sadoption of cobalt therapy (266).
A July 1982 study by the Wisconsin HospitalAssociation used data from the Wisconsin Hos-pital Association CON Data Base, its 1982 CONSurvey, and State and local CON agencies’ grantapplications for 1978-81 to analyze the cost ef-fectiveness of Wisconsin’s CON program (462).The association found, using particular assump-tions, that CON costs far outweighed the benefits.The investigators concluded that Wisconsin’sCON program was not cost effective, did not sup-press applications for capital expenditures (i.e.,did not have a sentinel effect), had had its deci-sions reversed through administrative appeals,and had been unfocused and inconsistent in thesubstance of its reviews and in its determinations.
Looking at application and approval and denialdata gives the impression that CON programs areaccomplishing some of their goals. From 1979 to1981, States reviewed more than 20,000 CON ap-plications, which totaled more than $31 billion.Almost 10 percent of the applications were denied,saving an estimated 15 percent of the proposedexpenditures (406).
These aggregate figures hide the facts that CONmay have deterred an unknown number of ap-plications and purchases and that the quality ofthe rejected applications is unknown. Some con-sultants specialize in CON applications (148), andmanufacturers may send staff to assist hospitalsin their CON applications (208). Small hospitalswith less sophisticated technology are probablyat a disadvantage in attracting or being able topay for such help, and this may exacerbate themaldistribution of high-technology devices. Alsoamong the unknowns are whether the distribu-tion of services is being made equitably amongthe population and whether approved projectswere needed more than those denied.
The costs of the CON programs themselves aresubstantial. In 1982, total Federal and State costsof administering CON programs were $16.9 mil-lion (406). Additional costs were probably offsetby the CON application fees charged by half the
States. Application fees and the other costs borneby the applicant facilities may discourage someapplications. Whether the applications discouragedare frivolous or important for the health of theaffected population is unknown. It is likely thatexamples could be found at either extreme.
Weighing the costs of the CON programs againsttheir benefits is difficult because of the existenceand interactions of Federal, State, and local reg-ulatory programs and of complex goals. Com-peting goals, such as the elimination of excess bedsand the assurance of access to health care, notonly present CON programs with problems whilethey are evaluating applications, but also exacer-bate the problem of identifying and measuring thebenefits of regulation and planning.
CON programs would lose some of their con-trol over capital expenditures if the thresholdswere raised to the levels proposed by the Officeof Management and Budget (i.e., $5 million forcapital expenditures, $1 million for changes inservices, and $2 million for major medical equip-ment). Clearly, fewer projects would require CONapplications. Even some new facilities would bebelow the threshold unless they were specificallycovered by CON laws. New freestanding emer-gency care centers, for example, have averaged$634,000 in building, land, and capital equipmentcosts (292). Capital expenditures that change in-stitutional services and increase operating costsby $1 million annually would still require a CON,but their numbers would probably be small. Highthresholds and the resultant low number of CONapplications would save administrative costs forFederal and State governments and for the fa-cilities,
If the Federal health planning program expires,the State CON laws will be voluntary (as far asthe States are concerned). In 1984, the Office ofHealth Planning of DHHS has estimated that 37of the States that have CON laws would keepthem without the Federal requirement (129). Adozen States have “sunset” clauses that allow theCON laws to expire on specific dates; some othershave sunset provisions tied to the anticipated de-mise of the Federal health planning program.Again, some States have CON laws that are morestringent and some have more lenient regulationsthan the Federal CON requirements.

Ch. 6—Regulation of the Providers of Medical Devices ● 151
The financial incentives for hospitals underMedicare’s DRG hospital payment system cur-rently being implemented (see ch. 3) change theroles of the CON laws and the planning programin general. Some of the effects will depend on howcapital costs will be handled under the DRG sys-tem.3 With DRG payment for inpatient operat-
3Capital costs are now paid on a cost-reimbursement basis butwill probably be paid on a different basis by 1986, since Congressmandated studies of how to treat capital costs under the DRG hos-pital payment system (Public Law 98-21). Any new capital paymentmethod can be expected to change the hospitals’ incentives regard-ing capital expenditures.
ing costs (capital, outpatient, and direct teachingexpenses remain “passthroughs”), hospitals havefinancial incentives to purchase technologies thatlower their operating costs per case; and if theyare expensive, these technologies may come underCON scrutiny. An anticipated response to theDRG hospital payment system is the movementof technologies from tertiary to primary care sites.This movement may be retarded in States wherefacilities other than hospitals are included underCON. The effect of such movement on costs willdepend on whether the primary sites were replac-ing or supplementing hospital care and on the ex-tent of total use that results.
DISCUSSION AND POLICY OPTIONS
Regulation of the providers of medical deviceshas been undertaken to control medical care costs,increase access to medical care (including devices),and control quality of care. Available evidenceon the success that Federal and State regulationof providers has had in meeting these objectivesis inconclusive. Health care costs continue to riseat a higher rate than the overall Consumer PriceIndex. Access to care is still a problem for somepoor patients or patients in particular locations.Quality of care is difficult to define and measure,and problems remain in assessing quality concerns.
Conditions of participation for providers ofservices to Medicare beneficiaries and the newFederal requirement that hospitals contract withPROS (utilization and quality control peer revieworganizations) in order to be paid by Medicarehave quality as well as cost implications. Changesin conditions of participation proposed by DHHSin January 1983 would give hospitals more flex-ibility in the provision of inpatient care, and med-ical devices may be affected even less under thenew conditions than they were under the originalset of conditions. Efforts have been made in thePRO regulations issued by DHHS to address pre-vious problems with the PSRO program concern-ing quality review by requiring that evaluationsof PROS have both cost and quality components.Evaluations of PSRO programs focused on cost-containment goals without adequately measuring
quality of care. Thus, for example, such evalua-tions emphasized the ability of PSRO utilizationreviews to decrease length of stay and hospitaladmissions.
Section 1122 of the Social Security Act pertainsto review of capital expenditures and the Medi-care, Medicaid, and Maternal and Child Healthprograms. Few medical devices come under sec-tion 1122 review because of the high threshold($600,000). However, those devices that do alsotrigger CON review. The penalty for facilities thatdisregard section 1122 reviews would be strongerif the Social Security Act required the withholdingof Federal program payments for operating costsassociated with unapproved capital investments.
The Federal Health Planning and Resources De-velopment Act requirement that States imposeCON regulations on hospitals and other facilitiesin theory should have formed the strongest regu-latory mechanism concerning the adoption anduse of medical devices. Although CON regula-tions have attempted to contain costs and improveaccess, the evidence of their effect on medicaldevices is inconclusive: it is unclear whether CONlaws have influenced the adoption and use of med-ical devices.
The results obtained by State CON laws mayreflect certain characteristics of these laws. First,the laws have high thresholds for capital expend-

152 ● Federal Policies and the Medical Devices Industry
itures resulting in the coverage of few devicesunder these laws, and the laws ignore future oper-ating costs. Second, the focus on hospitals byalmost all the CON laws—although other sites arecovered by some States (including physician of-fices in nine States)—may have contributed toduplication of technologies within the system.Third, the lack of a limit on the amount a CONagency can approve lessens the potential impactof CON on total costs. Fourth, the CON processis a reactive process in the sense of being depend-ent on the submission of CON applications bymedical facilities. And fifth, political interactionsamong consumer patients, providers, and CONagencies influence the decisionmaking process.
One problem with concluding from the mixedevidence that CON regulations have been inef-fective is that incentives for health care facilitiesto buy whatever they wanted were embedded incost-based reimbursement by third-party payers,and not all purchases were subject to CON re-quirements. Duplication of equipment among hos-pitals and other facilities in the same geographicarea continues at least in part because facilitieswant to attract patients and physicians by pro-viding up-to-date equipment. CON programs donot have the power to decide how much equip-ment is used or the ways in which it is used. Uti-lization and quality review programs can encouragethe appropriate use of technologies, but decisionsabout use are basically left to physicians (and insome cases patients).
CON agencies have been hampered by unavail-ability of data on the health of the population andon the safety and efficacy of some new medicalequipment, undeveloped techniques for determin-ing need, insufficient budgets to hire appropriateplanning agency staffs, and the political sensitivityof rationing health care. Furthermore, the regu-latory agencies responsible for CON were advisedby committees representing not only consumersbut also the health care providers. CON decisionswere thus compromises among parties with con-flicting interests. All these difficulties have beenexacerbated by constantly changing technology.
The following options present a range of pos-sibilities regarding CON programs, from chang-ing current regulations to eliminating them. The
options concentrate on CON because of the rela-tive availability of information on these programsand because of the direct impact on the medicaldevices industry.
Option 1: Expand the National Health Planningand Resources Development Act to requireState CON laws to cover purchases of medi-cal equipment regardless of setting.
This option would attempt to make the incen-tives of the Federal health planning act more neu-tral with respect to the location of certain medi-cal devices by requiring that in addition to thehospitals, dialysis centers, and other facilities nowcovered by the act, physicians’ offices, diagnos-tic centers, and other facilities now excluded bythe legislation be required to submit CON applica-tions before purchasing expensive medical equip-ment. Control over all sites of care would removecurrent incentives to place expensive devices incertain, mainly nonhospital, settings without re-gard to cost effectiveness. Maldistribution of med-ical equipment might still occur, though, becauseof the reactive nature of the CON process and theinfluence of other factors on placement.
Several States already have CON programs thatcover major medical equipment purchases regard-less of setting or ownership. Some States are en-couraging hospitals to share equipment, such asnew NMR devices in Nebraska (291). More shar-ing would be anticipated if all settings were cov-ered, especially if a State had a limit on total CONapproval. If such sharing became commonplace,different arrangements might be necessary to en-sure quality (349). For example, facilities nowcarry liability insurance for their own physiciansto use their medical devices; this type of insur-ance might have to be extended to other physi-cians using the devices.
Greater administrative costs to governmentsand providers from increasing the number of ap-plications would result under this option. Al-though few medical devices are covered by CONthresholds, applications would increase sincemany of the settings that would be added by thisoption already purchase high-cost medical devicesfor which hospitals and other facilities are cur-

Ch. 6—Regulation of the Providers of Medical Devices ● 153
rently regulated. Regulatory staff would have tolearn about health care delivery and needs fordevices in these currently uncovered settings.
Option 2: Amend the National Health Planningand Resources Development Act to limit thelevel of capital expenditures that State CONagencies may approve in a year.
Because the funds for health care facilities andmedical devices are limited, not all projects canor should be funded. Current CON approval ordenial decisions are not necessarily made in lightof information on different types of projects, andtradeoffs are not necessarily considered. A limiton the level of capital expenditures would neces-sitate comparisons among projects.
The Federal requirement that CON applicationsbe batched so that similar projects are evaluatedat the same time does not address the issue oftradeoffs among dissimilar projects, Hospitals thatwant to purchase new CT scanners, for example,may have to wait several months until the batchof applications is evaluated. Those applicationsare reviewed without regard to applications forother types of equipment or for buildings.
The Commission on Capital Policy of the Amer-ican Health Planning Association recently recom-mended that future cost-based reimbursement forcapital be limited by each State, subject to a Fed-eral standard (5). The commission urged the adop-tion of limits that reflect the relative need of eachState for modernization of facilities and for newservices and facilities. It further suggested thatcapital payments within those limits be allocatedby means of a planning and capital expenditurereview process, presumably similar to the existingsystem.
If Medicare’s DRG prospective payment sys-tem for hospital operating costs were extended toother payers, a State limit on total CON approvalwould become less useful. The reason is that hos-pital acquisitions would be constrained by the fi-nancial pressures to limit operating costs. A limiton the level of expenditures a CON agency couldapprove would also be less necessary if capital ex-penditures were included in DRG payments.
A major obstacle to the implementation of thisoption is the limit itself. Congress or the Admin-
istration might be the decisionmaking body forchoosing the limit, but how would the limit bechosen? Techniques for determining a commu-nity’s need for specific medical devices are stillcontroversial. Determination of the need for thetotal capital expenditure in health care is clearlyproblematical. How much is the Nation or eachState willing to pay overall for health care? Howcould that amount be apportioned between capi-tal and operating costs, excluding preventive carefor the moment? Would the limit be applied na-tionally or at the State level or locally? Howshould the budgeted limit be apportioned amongthe geographic regions or among the health caredelivery sites?
The ultimate problem would be the selectionof individual projects for funding in light of thelack of a generally valid decisionmaking methodand the lack of theoretical or empirical predictionsthat the results of such a limit would be efficientor equitable.
Option 3: Amend the National Health Planningand Resources Development Act to eliminatethe Federal CON requirement.
State CON programs have not been uniformlysuccessful in controlling the costs and quality of,or improving access to, health care delivery.Health care costs are rising at a great rate, andsome rural areas and urban public hospitals donot have the minimal requirements for some serv-ices that are outlined in the “National Guidelinesfor Health Planning” under the Federal healthplanning program. This option would eliminatethe Federal requirement that States have CONlaws, but would permit those States that wantedto continue their programs to do so.
Implementation of this option would eliminatethe State and Federal Governments’ administra-tive costs for the Federal program. It would alsorelieve hospitals—and in some States, other fa-cilities—of the costs of application fees, person-nel, and delays involved in the CON process.
The method of treatment of capital expendituresby the Medicare payment system will affect theneed for regulations, especially if the DRG-basedprospective payment system expands to otherpayers. In the past, Medicare has reimbursed hos-
25-406 0 - 84 - 11

154 ● Federal Policies and the Medical Devices Industry
pitals for capital equipment on the basis of costs(see ch. 3). Medicare’s DRG prospective paymentsystem provides incentives for hospitals to reduceoperating costs. If cost reimbursement for capi-tal continues under Medicare’s DRG payment sys-tem, hospitals will face incentives to purchasemedical devices that will reduce operating costs.If payment for capital costs is more restricted, theincentive to purchase such devices will be weakened(but not eliminated).
No matter how capital costs are treated, sociallydesirable medical devices that raise operating costsmay not be financially desirable to hospitals.CON programs could play a role in the properdiffusion of socially desirable but very expensivetechnologies if they could encourage particular fa-cilities to purchase such technologies by offeringspecial treatment on other applications, for ex-ample. At present, this kind of negotiating rolewould require changes in some CON laws.
Medicare’s DRG-based prospective paymentsystem itself may change the need for CON pro-grams or for the national planning effort, espe-cially regarding distribution of services. If the in-centives of DRG payment work as anticipated,hospitals will specialize in treating patients inthose DRGs in which they are efficient. Suchspecialization will follow a hospital’s efforts towork with its medical staff to be cost consciousand to reduce the use of very expensive services.Some hospitals will continue to try to attract phy-sicians and patients through purchases of the latestmedical devices, but others will cut back someservices.
Specialization among hospitals is likely to re-sult from the dropping of services that do not payfor themselves through DRG payments. For ex-ample, a hospital that finds that its costs for staff,facilities, and equipment for coronary care arelower than the relevant DRG payment rates mayspecialize in coronary care. The same hospitalmay drop its pediatrics services if its costs arehigher than the relevant DRG rates. Specializa-tion could decrease duplication of medical devicesand possibly eliminate excess capacity and lowerexcess use. CON programs may become unnec-essary in light of these strong cost-containmentincentives for hospitals, although the problem ofduplication of services among nonhospital settingsnot covered by CON could be worsened.
If specialization decisions were made on a purelycost basis, however, it is clear that not all serv-ices or medical devices would be available to allsegments of the population: areas of low popula-tion density or low income would suffer. The cur-rent planning process has not solved the problemof inequitable distribution of facilities and serv-ices. Some communities and population groupsare still underserved, while certain areas have toomany hospital beds. In addition, health planninghas not thus far ameliorated the problem of pub-lic hospitals, which treat a disproportionate num-ber of poor and elderly patients and which do nothave the funds to renovate or to purchase neces-sary equipment.

7.Veterans Administration Policies
Regarding Medical Devices
War loves to play upon the young.–Sophocles

ContentsPage
Introduction . . . . . . . . . . . . . . . . . . . . . . . . . . . . . . . . . . . . . . . . . . . . . . . . . . . . . 157Overview of the VA Health Care System . . . . . . . . . . . . . . . . . . . . . . . . . . 157
The Veteran Patient Population . . . . . . . . . . . . . . . . . . . . . . . . . . . . . . . . . . 158Veterans’ Service Organizations . . . . . . . . . . . . . . . . . . . . . . . . . . . . . . . . . . . 158
Research and Development . . . . . . . . . . . . . . . . . . . . . . . . . . . . . . . . . . . . . . . . . 160Rehabilitation Research and Development Service . . . . . . . . . . . . . . . . . . . . . 161VA Prosthetics Center. . . . . . . . . . . . . . . . . . . . . . . . . . . . . . . . . . . . . . . . . . . 161
Testing and Evaluation . . . . . . . . . . . . . . . . . . . . . . . . . . . . . . . . . . . . . . . . . . . . 162Prototype Rehabilitative Devices . . . . . . . . . . . . . . . . . . . . . . . . . . . . . . . . . . . . . 162Commercially Available Rehabilitative Devices . . . . . . . . . . . . . . . . . . . . . . . 163Commercially Available Equipment and Supplies . . . . . . . . . . . . . . . . . . . . . 165
Procurement and Supply. . . . . . . . . . . . . . . . . . . . . . . . . . . . . . . . . . . . . . . . . . . . . 166Central Procurement by the VA Marketing Center . . . . . . . . . . . . . . . . . . . . . 166Procurement by VA Medical Centers . . . . . . . . . . . . . . . . . . . . . . . . . . . . . . . . 168
Adoption and Use...... . . . . . . . . . . . . . . . . . . . . . . . . . . . . . . . . . . . . . . . . . 169Rehabilitative Devices . . . . . . . . . . . . . . . . . . . . . . . . . . . . . . . . . . . . . . . . . . . . 169Influence of Social, Political, and Economic Factors . . . . . . . . . . . . . . . . . . 170Strategic Planning . . . . . . . . . . . . . . . . . . . . . . . . . . . . . . . . . . . . . . . . . . . . . 171
Discussion and Policy Options . . . . . . . . . . . . . . . . . . . . . . . . . . . . . . . . . . . . . . . 173Research and Development . . . . . . . . . . . . . . . . . . . . . . . . . . . . . . . . . . . . . . . 173Testing and Evaluation . . . . . . . . . . . . . . . . . . . . . . . . . . . . . . . . . . . . . . . . . . . . 173Procurement . . . . . . . . . . . . . . . . . . . . . . . . . . . . . . . . . . . . . . . . . . . . . . . . . . . 174Adoption and Use..... . . . . . . . . . . . . . . . . . . . . . . . . . . . . . . . . . . . . . . . . . . . . 175
TABLESTable No, Page38. Veterans Administration R&D Budget Overview, Fiscal Years
1977-83 . . . . . . . . . . . . . . . . . . . . . . . . . . . . . . . . . . . . . . . . . . . . . . . . . . . . . 16039. VA Medical Center Purchasing Source Priorities, Fiscal Year 1982.. . . . . . . 169
FIGUREFigure No. Page4. Organization Chart of the Veterans Administration, May 1984. . . . . . . . . . . . 159
7.Veterans Administration Policies
Regarding Medical Devices
INTRODUCTION
The Veterans Administration (VA) has a prom-inent role in the medical devices industry fromboth the producer and purchaser sides of the mar-ket. Since the late 1940s, the VA has been an im-portant source of research and development (R&D)funds, notably for rehabilitative technologies. Infiscal year 1983, the VA’s total R&D budget wasalmost $160 million, of which over $10 millionwas specifically earmarked for rehabilitative R&D.Actively serving about 3 million out of 30 mil-lion veterans eligible for free health care andrehabilitative services with an annual budget ofmore than $8 billion, this agency is a significantpower in the marketplace.
The VA presents a unique example of a healthcare system that includes the continuum of pa-tients, needs, facilities, money, and personnel andthe mandate to develop, deliver, evaluate, andsupport a full range of devices and services. Be-cause of its size, the agency clearly has potentialfor influencing the medical devices industry. Yetalthough the VA health care system is completelyfunded by the Federal Government and centrally
OVERVIEW OF THE VA HEALTH
The VA’s health care system is the largest healthcare delivery organization in the Nation.2 The vastmajority of services are delivered to veterans inVA-owned facilities. Most acute care services areprovided in 172 VA medical centers that are, forthe most part, affiliated with medical schools.
‘Unless otherwise noted, this section is adapted from a discus-sion in U.S. Congress, Congressional Budget Office, VeteransAdministration Health Care: Planning for 1990, Washington, DC,February 1983 (327).
‘The Hospital Corp. of America, a private, “for-profit” hospitalchain, includes more facilities, but has revenues only about half thesize of the VA’s health care delivery budget (130).
administered, decisions regarding the purchaseand use of medical devices are primarily made atthe clinical and VA medical center levels. Over-all, the impact of the VA on the medical devicesindustry reflects this combination of targeted pro-grams and policies and decentralized activities.The relationships among the parts of the VA dis-cussed in this chapter are depicted in figure 4.
Throughout this chapter, medical devices aregrouped and referred to in three classes:
● rehabilitative devices, such as prosthetics andsensory aids for disabled people;
● equipment, such as radiological and labora-tory equipment; and
● supplies, such as bandages and other dis-posable.
The discussion begins with an overview of the VAhealth care system and then describes the VA’sprograms, activities, and policies with regard tothe R&D, testing and evaluation, procurementand supply, and, finally, adoption and use ofmedical devices.
CARE SYSTEM1
Begun after World War II, the affiliation programis generally credited with enhancing the qualityof care at the VA hospitals. These hospitals oper-ated over 82,000 beds in fiscal year 1981 andtreated about 1.25 million patients.
The VA provides both institutional and non-institutional long-term care services. Ninety-eightnursing homes associated with the VA medicalcenters provide highly skilled extended care afterhospitalization. The VA plans to increase thenumber of nursing home beds from the 8,700 bedsthat were operated in 1981 to over 13,000 by 1987to serve the rapidly expanding aged veteran pop-
157

158 ● Federal Policies and the Medical Devices Industry—
ulation. Other institutional long-term care serv- nancial management policies, Twenty-eight re-ices are provided by the VA in community nurs- gional areas, called medical districts, control theing homes, where services are purchased on a per allocations that are prospectively budgeted by thediem basis, and at State veterans’ homes, where Central Office. Each medical district is typicallythe VA subsidizes care through grant programs. composed of 4 to 10 VA medical centers.
The VA also operates 15 domiciliaries, usuallyon the VA medical centers’ campuses, where serv-ice-disabled or permanently disabled veterans canlive and receive necessary minimal health care.Noninstitutional care provided includes day-careprograms for the elderly and various home-careprograms.
The outpatient programs operated by the VArepresent an alternative to hospitalization formany veterans. In 1981, more than 15.8 millionoutpatient medical visits were made to VA staff,and 2.1 million visits were made to private phy-sicians and funded on a fee-for-service basis bythe VA. Clinic services are varied. In addition todiagnostic, treatment, and rehabilitative clinics,the VA operates mental hygiene clinics and daytreatment centers for psychiatric patients and pro-vides dental care services for long-term care pa-tients.
In all, the VA employs the full-time equivalentof approximately 194,000 physicians, dentists,nurses, and administrative and support person-nel. The VA’s Department of Medicine and Sur-gery, headed by the Chief Medical Director, ad-ministers the entire health care system with anannual budget in 1983 of just over $8 billion. TheDepartment of Medicine and Surgery is admin-istered from the VA’s Central Office in Washing-ton, DC. Specific areas of patient care and pro-gram function (e.g., rehabilitation medicine,surgery, radiology, and medical research) are theresponsibility of VA organizational units calledservices. As shown in figure 4, these units areunder the guidance of service directors in the VA’sCentral Office.
The VA’s health care system operates under alimited and controlled budget with plans projectedfor 1 and 5 years ahead. Funding is 100 percentFederal. Once Congress determines the overall ap-propriation, the budget is fixed for the followingfiscal year. However, after the appropriation levelis decided, the VA health care system is charac-terized by highly decentralized planning and fi-
The Veteran Patient Population
Currently, there are an estimated 30 millionveterans eligible for health care services. About40 percent of the eligible population are WorldWar II veterans now in their 50s or 60s. By 1990,practically all of these 12 million World War IIveterans will be over 65 years old, and the VAis concerned about the impact of this aging pop-ulation on the health care delivery system.
Only a small proportion of the eligible popula-tion actually uses the VA health care system, how-ever. In 1981, about 3 million veterans, or 10 per-cent of those eligible, used VA services. Mostveterans use community services for their healthcare, presumably because they have -adequatepublic or private health insurance or they preferthe proximity of non-VA facilities. It is estimatedthat only about 2 million of the World War IIveterans will apply for VA health care benefitswhen they are over 65 years of age.
Any veteran with a service-connected disabilityis eligible for health care services. Veterans withservice-connected disabilities represented about 34percent of the applicants who sought medical carefrom the VA in fiscal year 1982. The remainderof the VA patients were veterans aged 65 or older(about one-fourth of patients discharged from VAhospitals in 1981), veterans who were unable topay for their medical care, former prisoners ofwar, and veterans who were exposed to AgentOrange in Vietnam. Other veterans are eligibleon a space-available basis.
Veterans’ Service Organizations
A number of veterans’ service organizationsplay a significant role in the overall delivery ofhealth care by the VA (106). In terms of size ofmembership, the major organizations are TheAmerican Legion, the Veterans of Foreign Wars,and the Disabled American Veterans. At the na-tional level, these groups lobby for services and

Administration (VA),a May 1984Figure 4.–Organization Chart of the Veterans
r— -—– -7 — L..— –—..– —— -—-- — —
I 1
1 1 1
chart shows the wlat!o~ships among the parts of the V’AbACf~D _ Assls[~t Chief Meal, cal ~lrectorCI/A ~u POIY services are located I n I ndli,ldual VA medical u?nterS
d~he p r o s t h e t i c ~Whnology Evalua:,on commt!t~e advises the ?rostt]ellcs afld Sensor, Aids SerVICe
SOURCE Off Ice of Technology Assessment

160 ● Federal Policies and the Medical Devices Industry-- —
attempt to influence legislative decisionmaking.At the local level, they are involved in a varietyof activities including substantial support for com-munity programs. Because of their high visibil-ity in the community, local chapters of these orga-
RESEARCH AND DEVELOPMENT
The goals and priorities of the VA’s R&D pro-gram are diverse, with broad mandates to addressthe very complex and difficult problems of vet-erans. The official role of the Federal Governmentin the R&D of medical devices, especially pros-thetic and disability-related research, dates backto the 1930s and 1940s. Since 1947, the VA hasspent over $25 million on prosthetic device re-search alone (225).
Research indicates that the Federal Governmentcan be particularly effective in sponsoring R&Dif the Government is itself the buyer of the re-sulting technologies (228). The VA spent well over$1 billion on all supplies and equipment for itsvarious medical facilities in 1983. Especially in thearea of rehabilitative devices, not only is the VAthe major buyer in the country, but its R&D ef-forts are very important because of the small andfragmented nature of the market for many reha-bilitative technologies.
Table 38 shows the VA budget for R&D activ-ities, as divided among the VA’s three major R&Dservices: the Medical Research, the RehabilitationResearch and Development, and the Health Serv-ices Research and Development Services. Althoughfunds committed to these R&D services by the VAin current dollars have increased over the past fewyears, the budgets of these services have been
nizations can have an important influence on VAhospital activities. Hospital administrators aresensitive to their inquiries and complaints and usu-ally try to consult these organizations when ma-jor planning decisions are under consideration.
stable or declining if inflation is taken into ac-count. Furthermore, total R&D as a proportionof medical care expenditures by the VA has beensteadily declining for a decade. In fiscal year 1970,R&D budgets accounted for 3.4 percent of theoutlay for the medical care program, comparedwith only 2 percent in fiscal year 1982 (433).
Veterans’ service organizations have expressedconcern about effective cutbacks in R&D budgets,especially in the areas of prosthetics research andresearch on sensory aids for blind and hearing-impaired veterans. The organizations argue thatthese research areas have received decidedly lessfunding than they merit (344).
The bulk of R&D funds goes to the Medical Re-search Service, which provides opportunities forclinician and nonclinician scientists to study healthproblems in the veteran population. The empha-sis of the medical research is on clinical research,most of which is initiated by physician investi-gators who carry out their research part-time andspend the majority of their time treating veteranpatients. Current studies involve cardiovascular,respiratory, and renal devices. A number of re-search projects are also conducted cooperatively,with clinical trials at multiple sites within the VAmedical care system. The largest number of co-operative studies have tested drug therapies, fol-
Table 38.—Veterans Administration (VA) R&D Budget Overview, Fiscal Years 1977-83 (thousands of dollars)
Fiscal year
1977 1978 1979 1980 1981 1982 1983
Medical Research Service . . . . . . . . . . . $101,567 $108,153 $118,016 $122,745 $129,943 $130,842 $141,052Staffing . . . . . . . . . . . . . . . . . . . . . . . . . . 4,220 4,367 4,217 4,171 4,171 3,845 4,015
Rehabilitation R&D Service . . . . . . . . . . . 4,419 5,502 7,191 8,085 8,784 7,185 10,001Staffing . . . . . . . . . . . . . . . . . . . . . . . . . . 69 90 112 143 -143 128 250
Health Services R&D Service . . . . . . . . . 3,604 2,996 3,004 3,153 3,083 2,828 3,786Staffing . . . . . . . . . . . . . . . . . . . . . . . . . . 45 90 105 104 104 93 120
Total . . . . . . . . . . . . . . . . . . . . . . . . . . . . $113,924 $121,198 $132,645 $138,401 $145,942 $144,921 $159,224
SOURCE: U.S. Veterans Administration, 1983.

Ch. 7—Veterans Administration Policies Regarding Medical Devices . 161—. — .-—
lowed by surgical procedures, such as coronaryartery bypass surgery (342).
The Health Services Research and DevelopmentService, which was organized in 1976, developsand supports programs designed to improve clin-ical and administrative decisionmaking in the VAmedical care system. Its only research priorityarea that concerns medical devices is the assess-ment of the cost effectiveness of patient care tech-nologies. The third VA service, the RehabilitationR&D Service, is substantially involved with re-search and medical devices, as described in thefollowing section.
Rehabilitation Research andDevelopment Service
The Rehabilitation R&D Service is the result ofan increased focus, both at the VA and at the na-tional level, on rehabilitation research and engi-neering needs. In 1973, this program was sepa-rated from other R&D efforts at the VA and givena mandate to improve the quality of life and tofacilitate greater independence for physicallydisabled veterans.
The Rehabilitation R&D Service undertakes re-search, development, and evaluation of new re-habilitative devices and techniques. The main goalof the program, which is primarily oriented to so-phisticated equipment, is to develop “usable”devices that assist individuals. All activities arecoordinated with the National Institute of Handi-capped Research at the Department of Education.The Rehabilitation R&D Service is also concernedwith technology transfer, including increasing theavailability of new devices on the market (352).
The activities of the Rehabilitation R&D Serv-ice are concentrated in three areas—prosthetics,spinal cord injuries, and sensory aids, represent-ing the most prevalent service-connected disabil-ities of veterans. Prosthetics research makes upabout 40 percent of the Rehabilitation R&D Serv-ice budget; research relating to spinal cord in-juries, with an emphasis on improving wheel-chairs, makes up about 30 percent of the budget;and research on sensory aids, which include aidsfor visually and hearing-impaired people and forcommunication disorders, makes up the remain-
ing 30 percent (426). Research priorities withinthese areas are identified through a combinationof internal review and workshops and seminars,which include representatives from provider andresearch groups, manufacturers, and disabledveterans’ organizations.
The Rehabilitation R&D Service supports bothintramural and extramural R&D programs, al-though over the past few years, funding has shiftedaway from extramural projects and toward in-tramural projects such as VA-established centersand their university-affiliated programs. Tworehabilitation R&D centers, tied directly to the VARehabilitation R&D Service, have recently beenestablished: one in the Palo Alto VA Medical Cen-ter in California and the other in the Hines VAMedical Center in Illinois outside of Chicago. Sixmore such centers are planned by 1986.
The rehabilitation R&D centers are affiliatedwith leading engineering schools in the same waythat the VA medical centers are affiliated withmedical schools. These affiliations bring facultyand students into clinical research settings to studythe problems of disabled people and to investigatenew procedures and devices to alleviate theirproblems. The rehabilitation R&D centers’ pri-mary goal is to apply advanced technology, suchas microprocessors, to assist physically handi-capped veterans.
In an approach similar to the rehabilitationR&D center concept, the Rehabilitation R&DService is establishing university-affiliated researchengineering programs to help support qualifiedengineering graduate students and faculty whoundertake rehabilitation engineering projects. Thethrust of the program is to interest engineeringstudents in rehabilitation engineering and to createa flow of ideas and information between academiaand the VA (69,125).
VA Prosthetics Center3
The VA Prosthetics Center is a VA R&D cen-ter in New York City that is within the Prosthetic
3Since its inception in 1956, the VA Prosthetics Center has alsobeen known as the VA Rehabilitation Engineering Center (VAREC)and as the Prosthetic Evaluation Testing and Information Center(l’ ETIC)

162 • Federal Policies and the Medical Devices Industry
and Sensory Aids Service (see fig. 4). The VAProsthetics Center was established in 1956 to con-duct R&D in rehabilitation engineering, to evalu-ate and test commercially available rehabilitativedevices, to provide direct patient care for diffi-cult prosthetic and orthotic cases, and to manu-facture orthopedic footwear and prosthetic/or-thotic devices.
In its earlier years, the VA Prosthetics Centerwas the “flagship” of a successful VA intramuralresearch program in prosthetics and orthotics. Themajority of the prosthetic limbs and the fittingtechniques used today, for example, were devel-oped by the VA Prosthetics Center in the 1950s(431). However, a 1983 audit report by the VA’sOffice of Inspector General found managementand operating problems at the VA ProstheticsCenter, then known as the VA RehabilitationEngineering Center (VAREC) (426). The reportrecommended changes in VAREC’s organization,including discontinuation of the R&D program.
TESTING AND EVALUATION
Literally thousands of disability-related devicesare being produced by the public, private, andnonprofit sectors. Although many are relativelysimple and low-cost items, others are expensiveand complex. Regardless of the devices’ cost, use,or complexity, certain criteria need to be metbefore these products enter widespread use. Safetyand effectiveness, including durability and recom-mended applications, are the essential criteria thatneed to be evaluated (412).
Currently, the responsibility for testing andevaluating medical devices is divided among sev-eral VA organizational units. Prototype rehabil-itative devices that are still in the developmentalstage are evaluated by the Rehabilitation R&DService. Once medical devices are commerciallyavailable, the responsibility for evaluation is splitbetween: 1) the Prosthetic and Sensory Aids Serv-ice, which evaluates rehabilitative devices; and2) the Office of Procurement and Supply, whichevaluates all nonrehabilitative devices, equipment,and systems purchased by the VA.
The VA’s Department of Medicine and Surgeryaccepted the Inspector General’s recommendation,disbanded the VAREC Research and DevelopmentService in fiscal year 1984, and changed the orga-nization’s name to the Prosthetic Evaluation Test-ing and Information Center (PETIC) (430).
The VA Prosthetics Center encouraged innova-tion in the past by demonstrating that new typesof wheelchairs were technologically possible andsafe, and, most importantly, that there was asubstantial market for them—the VA (282). TheProsthetics Center’s work with power wheelchairsin the early 1970s demonstrated that electricwheelchairs could be used safely at speeds greaterthan a slow walk and that they could be designedto be used on rough terrain. This situation en-couraged wheelchair manufacturers to begin mak-ing chairs with those capabilities. Efforts centeredaround lightweight sports wheelchairs had a simi-lar effect on manufacturers.
Prototype Rehabilitative Devices
Rehabilitative devices developed by the VAoften do not complete the transition from researchprototypes to commercially viable products. TheVA’s research funds have supported a number ofexpensive prototypes that have been neither putinto general use for the veteran population nordiscarded outright. Examples include a wheelchairwith special electronic controls adapted for usein a vehicle, a four-bar linkage knee for use inabove-knee prostheses, and a standing device forparaplegics (433).
Although there are several reasons for the fail-ure of such prototypes to become viable products,one obstacle is the lack of unbiased evaluationsof the prototypes that provide data on perform-ance and clinical applications. The inadequacy ofinternal testing and evaluation for prototyperehabilitative devices has been generally recog-nized by the VA. Although some VA facilities,including the rehabilitation R&D centers, the VAProsthetics Center, and individual VA medical

Ch. 7—Veterans Administration Policies Regarding Medical Devices ● 163
centers, have been involved in testing new andemerging devices through various VA services,the Rehabilitation R&D budget has not providedadequate funds to purchase expensive prototypesfor clinical evaluation (433). Moreover, the VAhas had a general procurement policy of not pur-chasing equipment unless it is commercially avail-able and in clinical use (344).
There have also been concerns about unneces-sary duplication in rehabilitative device evalua-tion when the Rehabilitation R&D Service hasconducted testing. For example, special recrea-tional ski equipment for disabled people, whichwas developed and tested at the Palo Alto Reha-bilitation R&D Center and then further tested atfour independent centers, could not be purchasedfor veterans until the equipment had gone throughan essentially duplicative testing process at the VAProsthetics Center (19,196).
In response to these criticisms, the Rehabilita-tion R&D Service has recently established theRehabilitation Research and Development Evalua-tion Unit, a coordinating group to conduct clini-cal evaluations of new devices, techniques, andconcepts in rehabilitation and to promote com-mercialization of the prototype devices that areevaluated by the program. The new unit will beresponsible for developing evaluation protocolsand will generally oversee and coordinate theevaluation process. However, all the organiza-tional units within the VA that have a stake inthe devices’ development and ultimate commer-cial success will share in funding the major evalua-tions (435).
Although it is premature to assess the Rehabil-itation R&D Evaluation Unit at this time, the unitappears to have the potential of coordinatingwork so that evaluations are perceived as validby organizational units of the VA that use the re-sults and duplication of effort is avoided.
In an attempt to further structure its technol-ogy transfer efforts, the Rehabilitation R&D Serv-ice has recently entered into an interagency agree-ment with the U.S. Department of Commerce toidentify and develop potential markets and financ-ing for prototype devices that were funded anddeveloped by projects of the Rehabilitation R&D
Service. The goal of the interagency program isto develop a process that leads to the commer-cialization of VA devices and technology.
Commercially Available RehabilitativeDevices
Once rehabilitative devices are commerciallyavailable, the responsibility for their evaluationshifts from the Rehabilitation R&D Service to theVA’s primary user service, the Prosthetic and Sen-sory Aids Service. Throughout the 1970s, theProsthetic and Sensory Aids Service increasinglyemployed performance standards in its prostheticand sensory aids program. These standards aredeveloped with the participation of individualsand organizations both within and outside theVA. Manufacturers, professionals, VA supplyspecialists, and others review the standards, whichprovide product specifications to control devices’quality, safety, and performance.
After a performance standard for a rehabil-itative device has been established, the VA Pros-thetics Center tests the device for compliance withthe standard and determines whether or not prod-ucts meet the VA’s requirements. As noted earlier,the VA Prosthetics Center has recently becomethe VA’s organizational focus for evaluation ofcommercially available rehabilitative devices.
The testing protocols used by the VA Pros-thetics Center range from simple validation assess-ments to complex clinical evaluations involvingdozens of VA medical centers or clinics. At theleast, rehabilitative devices are tested for safety,reliability, and the validity of manufacturers’claims.
Devices can undergo either special laboratorytesting or “field testing” at VA medical centers.Field testing, although advantageous in that itassesses devices’ “usefulness,” has never been uti-lized extensively by the VA Prosthetics Center be-cause of organizational difficulties. Until fiscalyear 1984, no line authority existed from the VAProsthetics Center staff or from the Prosthetic andSensory Aids Service to the medical centers. Theabsence of line authority has typically resulted inloss of control over adherence to protocols andlack of reliable reporting of evaluation data (465).

164 . Federal Policies and the Medical Devices Industry
The VA evaluation process for commerciallyavailable rehabilitative devices has increasinglybeen the target of complaints, particularly fromveterans’ groups. The Disabled American Vet-erans has characterized the evaluation system asbeing “fraught with inefficiencies and communi-cation breakdowns” (439). There has also beencriticism on several other fronts: that testingpriorities are not adequately established; that longlags exist in the evaluation process; that the needsof veterans for devices should be better antici-pated; that the devices should be evaluated forsafety by the Food and Drug Administration in-stead of by the VA; and that the VA should testfor efficacy and cost effectiveness.
The standard-setting process has also been acause of concern for veterans’ organizations andothers. Critics claim that the VA specificationshave often been written to the specifications ofa particular manufacturer’s product, putting othermanufacturers at a distinct disadvantage in theVA market. If such specifications define the di-mensions and materials to be used in devices, itis more difficult for emerging devices that are dif-ferent in design or performance levels to enter thegeneral marketplace (352).
Shepard and Karen, who studied the VA’s ef-fects on the wheelchair industry, concluded thatthe large population of users in the VA could af-ford an opportunity for the VA to expand its rolein postmarketing surveillance of wheelchairs (252).Such surveillance could yield better data on thefrequency of repairs and the advantages and dis-advantages of particular models during actual use.VA standards in the past had apparently been tiedto the design of a particular wheelchair (manu-factured by Everest and Jennings) rather thanbased on performance. The need for performance-based standards in the future has been recognized,and the VA has taken steps to produce such stand-ards. VA standards are important to the indus-try, as evidenced by responses to Shepard andKaren’s telephone survey. One manufacturerstated that it hesitates to make anything that itcannot sell to the VA; other manufacturers statedthat VA standards are considered when they makeR&D decisions (282).
The VA exercises its greatest market power inthe “depot” wheelchair, an inexpensive general-
purpose manual wheelchair. On the one hand, theVA’s large purchases of this model reduce its priceto the VA. On the other hand, the VA tends todiscourage ordering of chairs with more userfeatures or better technology. If alternative modelswere also stocked, price advantages could still beobtained (although possibly not so good as thepresent ones) and more desirable features, suchas lighter weight, could be offered to disabledveterans (281).
Over the past 2 to 3 years, the VA procurementprocess has replaced most standards and devicespecifications with more general purchase de-scriptions—commercial item descriptions (CIDs)—that are designed to accommodate the variety ofprivately developed and marketed devices (32).CIDs are simplified product descriptions that iden-tify by functional or performance characteristicsthe available, acceptable commercial products forGovernment use.
Currently, the VA has standards for only fouror five rehabilitative devices, though these stand-ards are applied to a wide range of devices. Forexample, the standard for wheelchair lift systemscovers 21 different models and 13 different man-ufacturers. The increased use of CIDs, however,has also been criticized. A 1982 study by the U.S.General Accounting Office concluded that theCIDs contained too little specific information,with the result that the VA was purchasing manymedical items that were either unnecessary or oflower quality (332).
To address these concerns, the Prosthetic andSensory Aids Service initiated the Prosthetic Tech-nology Evaluation Committee in 1982. This com-mittee has developed an evaluation and coordi-nation process for rehabilitative devices that willsoon be operational in the VA system.
The Prosthetic Technology Evaluation Com-mittee’s strengths lie in two areas. First, the com-mittee will coordinate evaluation activities withall the concerned participants inside the VA sys-tem, as well as with other Federal agencies, inde-pendent testing labs, and veterans’ organizations.Representatives from the VA’s Prosthetic and Sen-sory Aids Service, Office of Procurement andSupply, Inspector General’s Office, RehabilitationR&D Service, Rehabilitation Medicine Service,

Ch. 7—Veterans Administration Policies Regarding Medical Devices ● 165
and from the Paralyzed Veterans of America andthe Disabled American Veterans are permanentmembers of the Prosthetic Technology EvaluationCommittee. Second, the committee will classifydevices into three product levels according to po-tential level of risk, innovation, and cost, and theclassification will determine the types of evalua-tions that the devices will undergo.
The Prosthetic Technology Evaluation Com-mittee has enlisted the support of important con-sumer groups such as the Paralyzed Veterans ofAmerica and The American Legion, and it appearsto be taking the necessary steps toward a morecoherent and well-focused program of evaluation(245,288). But the committee still has some prob-lems to resolve—such as expanding the VA Pros-thetics Center’s field-testing activities, makingevaluations more national in scope, and establish-ing the committee’s authority over the evaluationactivities of the VA medical centers.
Commercially Available Equipmentand Supplies
At any given time, at least 250 nonrehabilitativedevices, ranging from hospital-based equipmentto supplies and disposable, are being reviewedby the VA’s Office of Procurement and Supplyas a prerequisite to procurement contracts. ItsTesting and Evaluation Staff, which was estab-lished in 1976 and is part of a larger marketingcenter and supply depot in Hines, Illinois, has pri-mary responsibility for this aspect of the VA’s de-vice-testing activities.
The Testing and Evaluation Staff, with fewerthan a half-dozen professionals, also has respon-sibility for a market research and analysis pro-gram. The staff identifies specific medical devicesfor evaluations through requests by VA medicalcenters, manufacturers, and the VA Central Of-fice, as well as through in-house initiatives. Fac-tors such as volume and interest expressed by VAhealth care facilities are usually more importantthan the cost of the products (238).
Thus, evaluations of nonrehabilitative equip-ment and supplies are primarily carried out onstandard stock items and smaller medical equip-ment. Very expensive equipment, such as com-
puted tomography (CT) scanners, is not evaluatedby the Testing and Evaluation Staff; the servicedirectors in the VA’s Central Office are responsi-ble for approving or disapproving the acquisitionof such “controlled items. ” These central purchasedecisions are based on either test data generatedby manufacturers, local medical equipment com-mittees in individual medical centers, or, in a fewinstances, interdisciplinary advisory committeesconvened by the Central Office.
The Testing and Evaluation Staff’s evaluationsare usually internal “consumer research” effortsaimed at validating manufacturers’ claims abouttheir products. VA regulations prohibit explicitcomparison of one product with another. Al-though some evaluations of classes of devices havebeen attempted—evaluations that begin to movetoward analyses of relative efficacy or cost-ef-fectiveness—staffing and budget constraints haverestricted the number of these efforts (238).
Typically, tests on individual devices are car-ried out at VA medical centers around the coun-try and take the form of user surveys. The resultsare synthesized into very short summaries andpublished quarterly by the VA Office of Procure-ment and Supply. The Testing and EvaluationStaff also manages a computerized informationsystem with price and marketing data on medi-cal devices.
The results of evaluations of nonrehabilitativeequipment and supplies by the Testing and Evalua-tion Staff are well disseminated to users withinthe VA health care system. Although the Officeof Procurement and Supply is sometimes reluc-tant to publish the test results because the par-ticular needs of veterans may be different fromthe needs of the general population, such infor-mation is routinely requested by non-VA hospi-tals, nursing homes, and State and local govern-ments. Manufacturers are not permitted to use theVA’s evaluations in their own literature, but pri-vate publications such as Consumer Reports, Hos-pital Purchasing Management, and Health DevicesAlert often reprint survey results (68,238,434),
The Testing and Evaluation Staff’s evaluationsare advisory in nature. Although not scientificallyrigorous, these evaluations do provide an infor-mation base for purchasing by individual VA fa-
166 • Federal Policies and the Medical Devices Industry—
cilities. The Testing and Evaluation Staff’s evalua-tions are, by all accounts, most often used bysmaller, more rural VA facilities. The VA esti-
PROCUREMENT AND SUPPLY
The VA Office of Procurement and Supply isresponsible for supplying the most extensive med-ical program in the Federal Government. In fiscalyear 1982, the VA spent nearly $1.3 billion onsupplies and equipment for its various medical fa-cilities. Totaling nearly 6,800 employees, the pro-curement and supply effort includes staff at theVA Marketing Center (VAMKC), the VA’s Cen-tral Office, three supply depots, the ProstheticDistribution Center, and 172 individual medicalcenters. Procurement staff have the twin goals ofpurchasing devices at the lowest possible cost andassuring the delivery of quality supplies andequipment for veterans. Efforts are divided be-tween central procurement activities and the localsupply activities of the VA medical centers.
Central Procurement by theVA Marketing Center
VAMKC in Hines, Illinois, is the focus of theVA’s national purchasing activity. That VAMKChas acted as the contract negotiator and admin-istrator for the U.S. Public Health Service, thearmed services, and other Government agenciesas well as for the VA has greatly enhanced its mar-ket leverage. In July 1983, VAMKC’s shared pro-curement program with the Department of De-fense, for example, was awarding annualcontracts of $295 million (428). Overall, VAMKCprocurement accounts for a substantial, but notdominant, proportion of national demand formedical equipment and supplies. Bradburd foundthat VAMKC procurement accounted for 5 to 10percent of the national sales volume in the mar-kets for X-ray, nuclear diagnostic, hemodialysis,and patient monitoring equipment (344).
The market power of the VA allows it to ob-tain favorable prices on medical supplies throughits centralized procurement channels (167). Vol-ume purchases of medical supplies and equipmentare managed and distributed through three VA
mates that only about 20 percent of its medicalcenters strictly adhere to purchasing decisionsbased on the evaluations.
supply depots located in Somerville, New Jersey;Hines, Illinois; and Bell, California. The ProstheticDistribution Center in Denver, Colorado, servesthe approximately 200,000 veterans with serv-ice-connected disabilities. In fiscal year 1982, VAmedical centers obtained about $198 million insupplies (about 15 percent of their total procure-ment needs) from the central supply depots (428).
Several other centralized procurement programsprovide individual medical centers with oppor-tunities to obtain economically priced supplies andequipment without having to solicit and awardcontracts. Under the Federal Supply Schedulesprogram, the Government contracts with com-mercial vendors for a wide range of supplies andservices at preestablished prices. VAMKC man-ages Federal Supply Schedules’ contracts for med-ical drugs, chemicals, supplies, and equipment,while the General Services Administration man-ages the contracts for most other items, such asfurniture and office supplies (335). About 34 per-cent of total purchases by VA medical centers,or $434 million, were made through the FederalSupply Schedules program in fiscal year 1982(428).
Decentralized contracts are similar to the Fed-eral Supply Schedules program, in that medicalcenters order from VAMKC-administered con-tracts. Usually these contracts, which account foronly about 3 percent of total purchases by medi-cal centers, are for specialized medical equipmentthat is unavailable through either the supply de-pot or Federal Supply Schedules programs.
The impact of VAMKC’s centralized procure-ment policies and procedures on product priceswas studied by Bradburd specifically for this OTAreport (42). The study examined VA procurementof nine categories of major medical equipment.Although the market was found to be highly con-centrated, the volatility of market shares and the

Ch. 7—Veterans Administration Policies Regarding Medical Devices • 167
very rapid pace of technological change suggestedthat the market was also extremely competitive.
Bradburd’s findings with regard to six VAMKCprocedures or policies are presented below (42).
Brand Name Justification
When a VA hospital receives authorization topurchase a particular item of equipment, VAMKCforwards to the hospital a list of the suppliers oncontract whose equipment meets the requirementsof the purchase order, ranked by order of cost.The hospital is required to purchase from the least-cost supplier unless it can justify purchasing froma different source based on service availability oranother acceptable consideration. This exceptionprocess is called a brand name justification. Be-cause suppliers are anxious to maintain their shareof the VAMKC market, the brand name justifica-tion requirement puts them under pressure not toprice themselves out of the VAMKC market, andthis concern almost certainly results in lowerprices than would be obtained in the absence ofthis requirement.
Firm Fixed-Price Clause
Under the terms of a VAMKC contract, sup-pliers are not allowed to increase prices duringthe contract year. Furthermore, if they lower theprice at any time during the year, the lower priceholds for the balance of the contract year. Thefirm fixed-price clause may or may not result inlower procurement costs. During the course of thebusiness year, there are times when suppliers of-fer temporary price discounts in the private mar-ket to promote their products. Normally, it wouldbe expected that these promotions would be ex-tended to VAMKC as well. However, because atemporary price cut must be extended for the en-tire contract year, suppliers are reluctant to offersuch discount prices to VAMKC.
Even the requirement that prices cannot be in-creased during the course of a contract year hasindeterminate effects on procurement costs. Onthe one hand, such a requirement protects thosewho buy through VAMKC from price increasesfor the contract year. On the other hand, it is pos-sible that suppliers charge a higher price to beginwith as a form of insurance against their margins’
being eroded by cost increases. It is not possibleto determine the direction of the total impact ofthe firm fixed-price clause.
Public Disclosure Requirements
By law, the public has access to the prices atwhich VAMKC procures medical equipment.There is both theoretical and empirical supportfor the view that this results in higher procure-ment costs for VAMKC. The reasoning is that thebenefits that a firm receives from cutting its pricebelow that of its rivals are in part a function ofthe “retaliation lag, ”the length of time beforerivals learn of the price cut and cut their ownprices in response. The price disclosure require-ments have the effect of reducing the retaliationlag, and therefore act to discourage such price cut-ting in the VAMKC market.
In addition, because private buyers of medicalequipment also have access to the price data, thefact that the VAMKC price may serve as thebuyer’s target in pricing negotiations can also in-hibit price cutting in the VAMKC market. Sup-pliers in the market for X-ray equipment, nuclearmedical equipment, patient monitoring, and hemo-dialysis equipment indicate that prices offered toVAMKC are higher than they would be in theabsence of the contract disclosure requirement.In markets where the disclosure requirement hasnot affected pricing, the perceived reason is thatpricing information is widely available from othersources.
No Volume Commitment
VAMKC does not make specific volume com-mitments to its suppliers, who contract to pro-vide equipment at preestablished prices. In mostequipment categories (other than X-ray and nu-clear diagnostic equipment), the absence of a vol-ume commitment is a major factor in supplierpricing behavior.
There are several reasons why a volume com-mitment appears to be very important in someindustries and unimportant in others. First, theimportance of a volume commitment seems to de-pend on whether the equipment is typically “cus-tom made” or purchased from supplier stock. Ifequipment is purchased from stock and is fairly

168 ● Federal Policies and the Medical Devices Industry—
homogeneous, a volume commitment can providereductions in manufacturing cost that can bepassed on to the buyer in lower prices.
Second, the importance of a volume commit-ment seems to depend on whether the equipmentis expensive or inexpensive. If the equipment isinexpensive, the costs of preparing contracts andmarketing the product to buyers are higher rela-tive to the purchase price of the equipment. Inthis situation, the cost savings that come with avolume commitment are more significant, and thecommitment allows some of these savings to bepassed onto the buyer. Some suppliers indicateda willingness to lower prices by 5 to 10 percentin exchange for a volume commitment. Even forrelatively expensive devices, such as ultrasoundequipment, one supplier stated that a group pur-chase of 15 to 20 units would suffice for a largerprice discount than now offered.
Most Favored Customer Clause
Under the terms of a VAMKC contract, sup-pliers are not allowed to sell their equipment undera similar contract to any private buyer at a pricelower than that offered to VAMKC. If a lowerprice is offered to a private buyer, the vendormust lower the VAMKC contract price to thesame level for the balance of the contract. BecauseVAMKC must be offered a price as low as thatoffered to any private buyer, the most favoredcustomer clause helps ensure that the VAMKC’sclients benefit from competition among suppliersin the private hospital market.4
Although the strictness with which the mostfavored customer clause is interpreted varies fromone equipment category to another, it almost cer-tainly has the effect of reducing VAMKC equip-ment procurement costs. The policy can also havea powerful impact on private buyers. In a fewmarkets, private buyers are offered lower pricesthan VAMKC when they make contractual vol-ume commitments, on the grounds that the con-tracts are not like the VAMKC contract. In thesemarkets, the impact of the most favored customerpolicy is obviously less than it is in other markets.
4As noted above, VA suppliers may offer lower prices to privatebuyers if contract terms, such as volume commitments, differ.
However, in many cases the most favored cus-tomer clause may have the effect of increasingprices that private buyers must pay for medicalequipment. Specifically, both buyers in the VAand suppliers indicated that prices were affectedin the markets for X-ray, nuclear diagnostic,ultrasonic, and patient monitoring equipment, aswell as for CT scanning devices.
Reluctance To Procure Mixed Systems
Despite the absence of a formal restriction,VAMKC has exhibited a reluctance to purchasemedical equipment systems in which items ofequipment produced by several different com-panies are interconnected. There are several rea-sons for this, the most important of which are thedifficulties of assigning financial responsibility forrepair-s under warranty and of determining re-sponsibility for the actual interconnection of theequipment. Unfortunately, VAMKC’s policy canhave the effect of practically eliminating manysmaller companies from the procurement proc-ess, and may, as a result, cause higher initial pro-curement costs for the VA. The reluctance topurchase mixed systems is based on actual pro-curement experience, but the practice merits peri-odic review to determine if it saves costs overtime.
Procurement by VA Medical Centers
Actual purchase of medical equipment and sup-plies is carried out by local supply officers locatedin each of the VA medical centers. AlthoughVAMKC is responsible for centrally managingand negotiating contracts for items commonlyused by the medical facilities, individual VA med-ical centers make their own purchase decisions.To the extent that the medical centers use the cen-trally managed supply channels, lower productcosts are available to them through the combinedVA-wide quantity purchases. However, the VAhospital system is actually a loose confederationof semiautonomous institutions in terms of deviceprocurement, thereby reducing many of the ad-vantages available to it as a large market power.
Increasingly, the VA medical centers have pur-chased their supplies and equipment on the openmarket rather than using central supply channels.
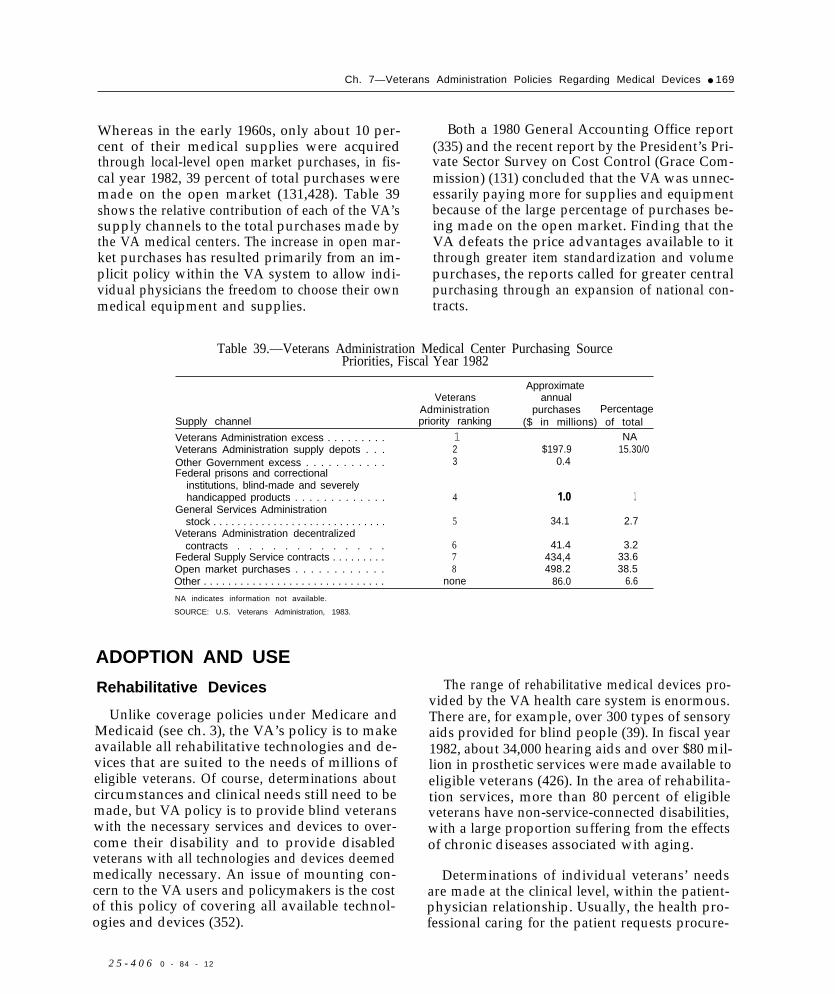
Ch. 7—Veterans Administration Policies Regarding Medical Devices ● 169
Whereas in the early 1960s, only about 10 per-cent of their medical supplies were acquiredthrough local-level open market purchases, in fis-cal year 1982, 39 percent of total purchases weremade on the open market (131,428). Table 39shows the relative contribution of each of the VA’ssupply channels to the total purchases made bythe VA medical centers. The increase in open mar-ket purchases has resulted primarily from an im-plicit policy within the VA system to allow indi-vidual physicians the freedom to choose their ownmedical equipment and supplies.
Both a 1980 General Accounting Office report(335) and the recent report by the President’s Pri-vate Sector Survey on Cost Control (Grace Com-mission) (131) concluded that the VA was unnec-essarily paying more for supplies and equipmentbecause of the large percentage of purchases be-ing made on the open market. Finding that theVA defeats the price advantages available to itthrough greater item standardization and volumepurchases, the reports called for greater centralpurchasing through an expansion of national con-tracts.
Table 39.—Veterans Administration Medical Center Purchasing SourcePriorities, Fiscal Year 1982
ApproximateVeterans annual
Administration purchases PercentageSupply channel priority ranking ($ in millions) of total
Veterans Administration excess . . . . . . . . .Veterans Administration supply depots . . .Other Government excess . . . . . . . . . . .Federal prisons and correctional
institutions, blind-made and severelyhandicapped products . . . . . . . . . . . . .
General Services Administrationstock . . . . . . . . . . . . . . . . . . . . . . . . . . . . .
Veterans Administration decentralizedcontracts . . . . . . . . . . . . .
Federal Supply Service contracts . . . . . . . . .Open market purchases . . . . . . . . . . . .Other . . . . . . . . . . . . . . . . . . . . . . . . . . . . . .
123
4
5
678
none
$197.90.4
1.0
34.1
41.4434,4498.2
86.0
NA15.30/0
1
2.7
3.233.638.5
6.6
NA indicates information not available.
SOURCE: U.S. Veterans Administration, 1983.
ADOPTION AND USE
Rehabilitative Devices
Unlike coverage policies under Medicare andMedicaid (see ch. 3), the VA’s policy is to makeavailable all rehabilitative technologies and de-vices that are suited to the needs of millions ofeligible veterans. Of course, determinations aboutcircumstances and clinical needs still need to bemade, but VA policy is to provide blind veteranswith the necessary services and devices to over-come their disability and to provide disabledveterans with all technologies and devices deemedmedically necessary. An issue of mounting con-cern to the VA users and policymakers is the costof this policy of covering all available technol-ogies and devices (352).
2 5 - 4 0 6 0 - 84 - 12
The range of rehabilitative medical devices pro-vided by the VA health care system is enormous.There are, for example, over 300 types of sensoryaids provided for blind people (39). In fiscal year1982, about 34,000 hearing aids and over $80 mil-lion in prosthetic services were made available toeligible veterans (426). In the area of rehabilita-tion services, more than 80 percent of eligibleveterans have non-service-connected disabilities,with a large proportion suffering from the effectsof chronic diseases associated with aging.
Determinations of individual veterans’ needsare made at the clinical level, within the patient-physician relationship. Usually, the health pro-fessional caring for the patient requests procure-
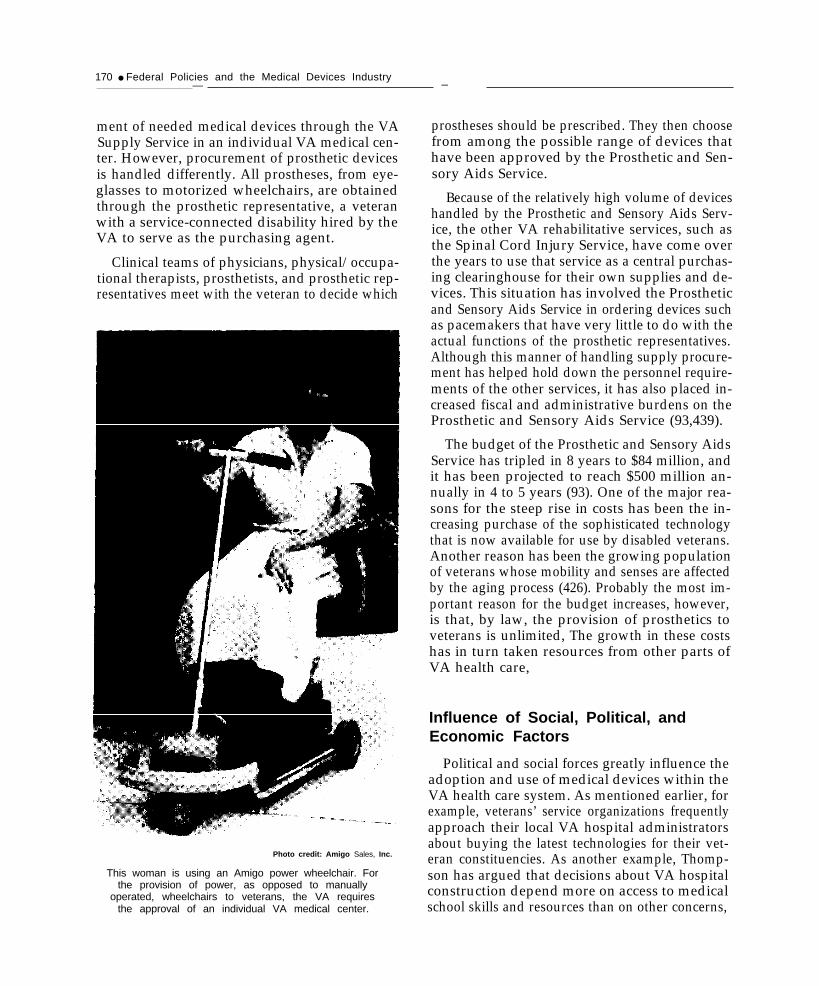
170 ● Federal Policies and the Medical Devices Industry— —
ment of needed medical devices through the VASupply Service in an individual VA medical cen-ter. However, procurement of prosthetic devicesis handled differently. All prostheses, from eye-glasses to motorized wheelchairs, are obtainedthrough the prosthetic representative, a veteranwith a service-connected disability hired by theVA to serve as the purchasing agent.
Clinical teams of physicians, physical/occupa-tional therapists, prosthetists, and prosthetic rep-resentatives meet with the veteran to decide which
Photo credit: Amigo Sales, Inc.
This woman is using an Amigo power wheelchair. Forthe provision of power, as opposed to manually
operated, wheelchairs to veterans, the VA requiresthe approval of an individual VA medical center.
prostheses should be prescribed. They then choosefrom among the possible range of devices thathave been approved by the Prosthetic and Sen-sory Aids Service.
Because of the relatively high volume of deviceshandled by the Prosthetic and Sensory Aids Serv-ice, the other VA rehabilitative services, such asthe Spinal Cord Injury Service, have come overthe years to use that service as a central purchas-ing clearinghouse for their own supplies and de-vices. This situation has involved the Prostheticand Sensory Aids Service in ordering devices suchas pacemakers that have very little to do with theactual functions of the prosthetic representatives.Although this manner of handling supply procure-ment has helped hold down the personnel require-ments of the other services, it has also placed in-creased fiscal and administrative burdens on theProsthetic and Sensory Aids Service (93,439).
The budget of the Prosthetic and Sensory AidsService has tripled in 8 years to $84 million, andit has been projected to reach $500 million an-nually in 4 to 5 years (93). One of the major rea-sons for the steep rise in costs has been the in-creasing purchase of the sophisticated technologythat is now available for use by disabled veterans.Another reason has been the growing populationof veterans whose mobility and senses are affectedby the aging process (426). Probably the most im-portant reason for the budget increases, however,is that, by law, the provision of prosthetics toveterans is unlimited, The growth in these costshas in turn taken resources from other parts ofVA health care,
Influence of Social, Political, andEconomic Factors
Political and social forces greatly influence theadoption and use of medical devices within theVA health care system. As mentioned earlier, forexample, veterans’ service organizations frequentlyapproach their local VA hospital administratorsabout buying the latest technologies for their vet-eran constituencies. As another example, Thomp-son has argued that decisions about VA hospitalconstruction depend more on access to medicalschool skills and resources than on other concerns,

Ch. 7—Veterans Administration Policies Regarding Medical Devices ● 171
such as promoting access of veterans to medicalcare (298).
The VA medical centers have tried to maketheir institutions hospitable places for teachingand research. In this regard, medical schools haveoften successfully encouraged VA hospitals to seekthe latest in equipment and specialized facilities.A study by the National Academy of Sciencesnoted marked proliferation of special care unitsin VA hospitals by the end of the 1970s (224).
Health planning and utilization review agen-cies (see ch. 6) have no authority over VA medi-cal centers. The National Health Planning andResources Development Act of 1974 (Public Law93-641) gave the VA voting membership on Statehealth coordinating councils and on local healthsystems agencies, but VA medical centers submitapplications for new construction or equipmentto the local health planning agencies on a strictlyvoluntary basis. Likewise, the VA has successfullyresisted efforts to place its hospitals under theauthority of utilization and quality control peerreview organizations, which perform utilizationreviews for the Medicare and Medicaid programs.Instead, the VA moved to establish its own HealthServices Review Organization to foster qualityassessment and utilization review.
Political and economic forces have acted to con-strain the adoption and use of medical devices.The VA’s overall health care budget has beenstable during the past few years, and the tightbudget has undoubtedly served as the most pow-erful rein on overadoption. In addition, the con-gressional appropriations committees and otheroversight groups have frequently opposed theVA’s autonomy in decisionmaking with regard toresource allocation. In 1978, for example, effortsby the VA to supplement 24 existing CT scannerswith 13 additional scanners were criticized by theGeneral Accounting Office, and congressional re-sistance eventually prompted the VA to withdrawthe request (330). As another example, the Of-fice of Management and Budget successfully pres-sured the VA to reduce its supply of hospital bedsfrom roughly 121,000 in 1964 to fewer than 90,000by 1980 (298).
Overall, the concurrent social and politicalpressures that develop incentives to overadopt
devices in some areas, while constraining expend-itures in others, have had important implicationsover time. The often sporadic patterns of adop-tion and use of devices and other technologies andpatterns of care by the VA have led to a distribu-tion of resources that may not be equitable or ef-ficient across geographic areas or types of facil-ities. Thus, for example, although the VA is aninternational leader in such areas as cardiac careand radioisotopes, fewer than one-third of the VAmedical centers had CT scanners in 1983 (150).In fact, an extensive study by the National Acad-emy of Sciences in 1977 found ample evidence ofmaldistribution in terms of equipment, basic andspecialized services, staffing, and number of beds(224).
Strategic Planning
There is every indication that with regard tomedical device and technology acquisition, theVA is in transition. Perhaps the most significantinitiative undertaken by the agency in relation tomedical equipment adoption and use has been theimplementation since fiscal year 1981 of MedicalDistrict Initiated Program Planning (MEDIPP).The MEDIPP process is an attempt to create a de-centralized long-range “strategic planning system”in which major plan development responsibilitiesare assigned to the VA’s 28 medical districts.
The VA has recognized that past resource-basedplanning and management approaches are nolonger feasible in an era of stable or declininghealth care budgets and changing demands by itsaging veteran population. Although there will beincreased demand for services in the short termas the size of the elderly veteran population grows,in the long-term, demand for services will declineas this largest group of beneficiaries now enter-ing old age dies.
Because the future certainly holds cutbacks ortermination of specific services or facilities, un-derstanding and acceptance within the VA andits constituencies are important factors in the even-tual success and implementation of the MEDIPPprocess. A key element of the new planning proc-ess is its emphasis on involving administrative andclinical personnel at several levels within the VADepartment of Medicine and Surgery (429).

172 ● Federal Policies and the Medical Devices Industry
The MEDIPP process consists of a cycle ofevents throughout the fiscal year. It begins withdirection by the VA’s Chief Medical Director onbroad-based issues, objectives, and goals for thefuture. Each VA medical district then appoints aDistrict Planning Board and staff to develop adistrict plan within the overall framework ofsystemwide goals. The district plans include ademographic analysis, a workload forecast, anda review of the local resources that are submittedby the VA health care facilities within its juris-diction. Finally, the district administrators andcouncils review and approve the district plans andsubmit them to the VA Central Office (218,426,432).
The first MEDIPP cycle ended in November1982 and covers fiscal years 1985 to 1990. An in-ternal VA study examined the relationship be-tween technology needs and the MEDIPP plansthat were submitted (45). It found that most ofthe medical districts were using the MEDIPP proc-ess to request the purchase of specific major med-ical devices and equipment, in addition to pro-posals for the creation, expansion, or dismantlingof services. In effect, the MEDIPP process couldserve as a vehicle for identifying and monitoringthe need and demand for various types of majormedical equipment. The study also found that VAadministrators and planners ranked the issue ofdevice acquisition (and the larger issue of medi-cal technology) fourth in importance among 50VA-wide issue areas.
These findings confirm and reinforce the po-tential utility of the MEDIPP process, not onlyas a planning tool, but also as an early warningand tracking system for major equipment adop-tion and use. As new device and equipment re-quests begin to surface through medical districtplans, a coherent and well-focused program ofevaluation could be initiated (45). Such evalua-tions could include broader technology assessmentissues such as devices’ cost effectiveness in theoverall delivery of care.
Another new process that may affect medicaldevice adoption and use is setting the budgets ofVA medical centers on the basis of diagnosisrelated groups (DRGs) (103). Although the VAhas budgeted prospectively because of the con-gressional appropriations process, the use of acase-mix measure such as DRGs is intended to dis-tribute the available funds more rationally amongthe medical centers.
DRGs classify patients according to principaldiagnosis, presence of a surgical procedure, age,presence or absence of significant comorbiditiesor complications, and other relevant criteria. Thenew Medicare prospective payment system forhospitals is also based on DRGs (see ch. 3). Boththe VA budgeting system and the Medicare pay-ment system use similar mathematical models toassign patients to DRGs and to allocate resourcesamong DRGs.
Data sources included all VA discharge ab-stracts, costs across different service categories(medical, surgical, psychiatric), the current 470DRG model,5 and the New Jersey ReimbursementSchedule. Since the VA has no patient-basedmethod of assigning costs, the VA used NewJersey cost data to assign relative DRG weightsto the VA discharges, and these weights were usedfor allocation decisions (104).
The VA expects the new budget method to en-courage more efficient use of resources within hos-pitals and to distribute the funds more rationallybecause hospitals will receive funds on the basisof case mix instead of historical budgets. DRGsare also to be used in VA utilization review andquality assurance programs (104). Adoption ofmedical devices will be more affected by MEDIPP,although DRG budgeting will probably affect useof the devices.—
5There are 467 DRGs, plus 3 that require special treatment of thedata: DRG 468 flags an operating room procedure that is unrelatedto the principal diagnosis; DRG 469 represents a patient with a diag-nosis that is valid as a principal diagnosis, but not acceptable asa principal diagnosis; and DRG 470 indicates invalid data.

Ch. 7—Veterans Administration Policies Regarding Medical Devices • 173
DISCUSSION AND POLICY OPTIONS
The VA has the potential to use its extensiveprocurement to influence the type and price ofmedical devices that are developed and marketed.Although the VA appears to have obtained lowerprices because of purchases from least-cost sup-pliers, other procedures such as more standard-ized purchases and volume commitments to de-vice suppliers might result in greater price reduc-tions. In addition, R&D evaluation, and procure-ment have been separate, unintegrated activitieswithin the VA. The potential of the VA’s leveragehas not been realized in stimulating the develop-ment of certain types of devices. Nor have theresults of the VA’s own R&D and evaluationactivities been systematically incorporated into theVA’s procurement and adoption decisions.
In an attempt to coordinate these activities, theVA is discussing an administrative reorganizationthat would put the Rehabilitation R&D Service,the Prosthetic and Sensory Aids Service, and theVA Prosthetics Center in one line (39). The fol-lowing sections offer options for specific improve-ments within the areas of R&D, testing and eval-uation, procurement, and adoption and use ofmedical devices by the VA health care system.
Research and Development
To give increased focus to its rehabilitation re-search efforts, the VA in 1973 organized the Re-habilitation R&D Service. More recently, the VAhas established rehabilitation R&D centers thatare affiliated with engineering schools (two atpresent, six more planned by 1986) for broaderoutreach. However, when inflation is taken intoaccount, the VA’s funding commitment to R&Dhas been stable or declining. Veterans’ serviceorganizations have expressed concern about ef-fective cutbacks in R&D budgets, especially in theareas of prosthetics research and research on sen-sory aids for the blind and hearing-impaired.
Option 1: Increase the VA’s funding for reha-bilitative research that is focused on longer termdevelopment of devices.
The appropriate placement of rehabilitationR&D of this type could be at the rehabilitationR&D centers, at the VA Prosthetics Center, or at
both, depending on the goals of the Rehabilita-tion R&D Service. The rehabilitation R&D centersat Hines and Palo Alto are connected with theirlocal engineering communities. The primary mis-sion of these centers is to apply advanced tech-nology to assist physically handicapped veteranswith the goal of commercialization of the devices.
The VA Prosthetics Center combines the devel-opment of commercially available prosthetics andsensory aids with clinical activities through an in-tegrated management. Its engineers and profes-sional personnel work closely with patients in sev-eral VA medical centers, customizing prostheticsand generally applying the expertise of the re-search engineers to present problems. In addition,within a fixed budget, any decision to channelmore funds to long-term rehabilitative researchwould require a determination that such researchwas more worthwhile than other uses of thesefunds.
Testing and Evaluation
The responsibility for testing and evaluatingmedical devices is divided among several VAorganizational units.The Rehabilitation R&DService evaluates rehabilitative prototype devicesthat are still in the developmental stage. Once themedical devices are commercially available, theresponsibility for evaluation is split between theProsthetic and Sensory Aids Service for reha-bilitative devices and the Office of Procurementand Supply for all nonrehabilitative devices, equip-ment, and systems purchased by the VA. TheDisabled American Veterans organization hascalled the evaluation system fraught with ineffi-ciencies and communication breakdowns. Effortsof the various organizational units have some-times overlapped and unnecessarily duplicatedeach other.
The absence of internal planning and coordi-nation for its evaluation activities has generallybeen recognized by the VA. Recently, the Reha-bilitation R&D Service created the RehabilitationR&D Evaluation Unit to coordinate and improvetesting of prototype rehabilitative devices, and theProsthetic and Sensory Aids Service formed the

174 ● Federal Policies and the Medical Devices Industry
Prosthetic Technology Evaluation Committee todevelop a formal evaluation and coordinationprocess for commercially available rehabilitativeproducts. The Office of Procurement and Supplyestablished the Testing and Evaluation Staff in1976 to provide evaluations of nonrehabilitativemedical devices, equipment, and supplies. Theevaluations are incorporated into national pro-curement contract requirements, but are advisoryonly. Purchasing decisions still rest with individ-ual hospitals.
These improvements in evaluation processesmay result in more appropriate adoption and useof medical technologies by the VA. They may alsoresult in better adoption and use of medical tech-nologies by other Government agencies and bythe private sector through the dissemination ofevaluation findings. Although it is premature toassess these newly created committees and pro-grams, options for specific improvements are pre-sented below.
Option 2: Encourage the expansion of field testingof rehabilitative devices by the VA ProstheticsCenter.
The VA Prosthetics Center is charged with per-forming “compliance testing” on all commerciallyavailable rehabilitative devices for the Prostheticand Sensory Aids Service. Devices can undergoeither special laboratory testing or field testing atVA medical centers, or both.
Field testing is advantageous in that it allowsan evaluation to more accurately assess a device’susefulness to the veteran population. Because oforganizational difficulties, however, the VA Pros-thetics Center has never used field testing to itsfullest possible extent.
Until fiscal year 1984, there was no line author-ity from the VA Prosthetics Center or from theProsthetic and Sensory Aids Service to the VAmedical centers, where the field evaluations areperformed. Absence of line authority had resultedin a loss of control by the testing units over adher-ence to protocols and reporting of evaluation dataand often created initial resistance to cooperationin device studies.
The new Prosthetic Technology EvaluationCommittee, which includes representatives from
all the concerned organizational units within theVA, is mandated to classify devices into groupswhich will determine the types of evaluations thatthe devices will undergo. This committee will needto establish some internal control over the VAmedical facilities to assure adherence to evalua-tion protocols and the collection of accurate dataduring expanded field studies.
Option 3: Require the VA to conduct more com-parative evaluations before purchasing com-mercially available devices.
Evaluations of devices by the Testing and Evalua-tion Staff of the VA’s Office of Procurement andSupply are usually internal “consumer research”efforts that take the form of user surveys. Al-though not scientifically rigorous, they do pro-vide an information base for purchasing by indi-vidual VA medical centers. The VA estimates thatonly about 20 percent of its medical centers strictlyadhere to purchasing decisions based on theseevaluations. However, results of the evaluationsare also routinely requested by private hospitals,nursing homes, and State and local governments.
Evaluative information would be improved ifmore comparative evaluations that identified thepositive and negative consequences of purchaseand use of particular products were undertaken.Product quality features—such as safety, dura-bility, and performance—could be more closelymatched with cost considerations. More validresults would also result from evaluating largersamples.
Although the VA currently prohibits explicitcomparison of one product with another, theTesting and Evaluation Staff has attempted somegroup evaluations of classes of devices. The pri-mary obstacle to expanding these efforts has beenstaffing and budgetary constraints. These con-straints might have to be eased in order to pro-vide better evaluative information for VA pur-chasing decisions.
Procurement
Available evidence indicates that the VA’s cen-tralized procurement programs, through variouscontract and distribution mechanisms, have forthe most part created favorable prices for medi-

Ch. 7—Veterans Administration Policies Regarding Medical Devices ● 175
cal equipment and supplies for the VA medicalcenters, Some policies, like the most favored cus-tomer clause, almost certainly reduce the VA’sequipment procurement costs, but at the sametime have the effect of increasing the prices thatprivate buyers must pay for medical equipment.At least one policy, the VA’s refusal to providevolume commitments to contractors, probablyresults in the VA’s not getting the lowest pricespossible for some medical devices. Other policiesare more ambiguous with respect to their impacton procurement costs.
A greater problem for the VA is the extent towhich the VA medical centers fail to use cen-tralized procurement channels. VA medical facil-ities now purchase about 39 percent of their sup-plies and equipment on the open market, up from10 percent in the early 1960s. This individual pur-chasing reduces the advantages available to theVA as a large institutional buyer.
Option 4: Encourage the VA to increase the pro-portion of its procurement of equipment andsupplies by centralized contracts to realizelower costs from the VA’s leverage in the mar-ketplace.
Combining quantity purchases of equipmentand supplies on a national basis through cen-tralized procurement could result in lower prod-uct costs through price discounts, Centralizingmore device purchases could increase the VA’sbuying power and could lead to even greater pricediscounts.
There are problems, however, in getting phy-sicians to support more centralized procurement.As part of the effort to retain physicians on staff,it has been the practice of the VA since the 1960sto allow physicians to choose their own brandsof medical equipment and supplies. The difficultyof achieving physician/user acceptance of one spe-cific type of medical equipment is a substantialobstacle to increasing centralized procurement.
Use of consensus groups might be one mecha-nism to help physicians reach agreement, or per-haps hospital administrators could be given greaterauthority. The extent of disagreement among phy-sicians regarding the desirability of particularbrands or models of medical equipment varies
depending on the type of equipment, the num-ber of manufacturers, and other less tangiblefactors.
Adoption and Use
Because of incentives to overadopt in someareas and concurrent financial constraints in others,the VA has experienced sporadic patterns of adop-tion and use of devices and other technologies thathave led to a distribution of resources that maynot be equitable or efficient across geographicareas or types of facilities. For example, sometypes of major medical equipment, such as CTscanners, may have been underadopted by the VAbecause of political pressures to contain costs. Onthe other hand, by statute, the provision of re-habilitative devices to veterans is unlimited. Asa result, resources have been drained away fromother parts of the VA’s health care budget as costsfor rehabilitative devices have expanded.
Option 5: Encourage development of comprehen-sive evaluations of major medical equipmentas part of the VA> strategic planning process.
The VA lacks systematic methods for distrib-uting major new medical equipment among itsmedical centers and within its districts. The newMEDIPP (Medical District Initiated ProgramPlanning) process is an attempt to create a decen-tralized long-range strategic planning process inwhich plan development responsibilities are as-signed to the VA’s 28 medical districts. The MEDIPPprocess could serve as a vehicle for identifying andmonitoring the need and demand for various typesof major medical equipment. A coherent, focusedevaluation program could then be initiated toguide the adoption and use of new medical equip-ment within the VA.
In June 1983, the VA’s Chief Medical Directorformed a High-Technology Assessment Group todetermine future VA policy on the acquisition ofmajor new technologies. Comprehensive technol-ogy assessments have not as yet been used exten-sively in the VA health care system. The VA con-tinues to face the constraints of stable or declininghealth care budgets, and the use of analyticalmethods to evaluate the health and economic ef-fects of technologies could assist in developing in-

176 . Federal Policies and the Medical Devices Industry
formation for allocating health care resources useful information. But decisions about devicemore effectively and equitably than in the past. adoption and use would still require judgmentsThe process of conducting such evaluations would about factors such as equity and ethics that areraise relevant issues and the results might provide difficult to incorporate into an analysis.

Appendixes

Appendix A.— Method of the Study
On June 17, 1982, OTA’s Technology AssessmentBoard approved the assessment entitled “Federal Pol-icies and the Medical Devices Industry, ” to begin Sep-tember 1, 1982. The proposal stated that the studywould address gaps in basic information about themedical devices industry and would examine presentand proposed Federal policies that influence the sector.
During the planning period that preceded the study,OTA staff consulted with industry trade associations,consumer groups, and Federal agencies for two pur-poses: to seek suggestions for members of the study’sadvisory panel and to identify issues in the field. Anadvisory panel guides OTA staff in selecting materialand issues to consider and reviews written work, butthe panel is not responsible for the content of the finalreport.
The advisory panel selected for this assessment con-sisted of members from different segments of theindustry—large and small companies, medicine, nurs-ing, hospital administration, economics, policy anal-ysis, law, and consumer advocacy. Richard R. Nelsonof Yale University chaired the panel, and two othermembers, Joyce Lashof and Rosemary Stevens, servedconcurrently on the standing Health Program Advi-sory Committee. At the beginning of the study, thestaff compiled a bibliography and gained familiaritywith major issues and with sources of data on com-panies that make up the industry. This effort was aidedby a background paper prepared by Anthony A.Romeo and by a September meeting with company ex-ecutives arranged by the Health Industry Manufac-turers Association. The study was also considered atthe September meeting of the Health Program Advi-sory Committee, which advised that the perspectivesof consumers and of different segments of the indus-try be sought.
At the first panel meeting, on October 7, 1982, dis-cussion centered on the overall study plan and on ma-jor policy areas, especially payment for the use of med-ical devices and premarket regulation by the Food andDrug Administration (FDA). In order to illuminate cer-tain policies and to gain greater insight into certainsegments of the industry, it was decided to select spe-cific medical devices for more detailed case study. Thepanel discussed criteria for selecting the case studies,including the importance of certain policies. Alsoraised was interest in the process by which devices aredeveloped and brought to market.
Following the panel meeting, OTA staff selected sixcase studies: the Boston elbow, contact lenses, hemo-dialysis equipment, nuclear magnetic resonance imag-ing, technologies for urinary incontinence, and wheel-chairs. It was also decided to produce a separate
technical memorandum on the policies of the VeteransAdministration (VA) concerning medical devices, sincethe relevant policies of this health care delivery sys-tem are both extensive and separate from others. Thetechnical memorandum was to be prepared by OTAstaff, and the case studies and other background papersby contractors outside of OTA.
On the basis of advice from the Health ProgramAdvisory Committee and the advisory panel for thisassessment, two workshops were held at OTA in De-cember 1982: one on December 7 on the purchase anduse of medical devices and the other on December 1.5on research, development, and marketing of medicaldevices. Suggestions for organizations and individualsto participate were solicited from a wide range of in-terested parties.
The first workshop, which was chaired by LouiseRussell from the advisory panel, consisted of peopleinvolved in different facets of the purchase and use ofdevices, including multihospital organizations, muni-cipal hospital administration, hospital administrationin the VA, hospital bioengineering, handicapped peo-ple, and physicians of different specialties (see app. B).Although their interests varied, the participants sharedthe need for better evaluative information on devices,concern about postmarketing surveillance of deviceproblems and standard setting for devices by FDA, andinterest in devices that meet a clinical need instead ofoverly sophisticated ones.
The participants at the second workshop, chairedby Richard Nelson of the advisory panel, were in-volved in the invention, development, and marketingof devices as individual inventors, managers in largecompanies, university researchers, or marketing rep-resentatives (see app. B). Discussion in this workshopcentered on problems in commercializing devices, espe-cially in securing funding to develop prototype devices;the role of Federal regulation, including FDA, VA, andthe Patent Office; the role in the development processof different actors, such as individual inventors, smallfirms, and large firms. On the basis of this discussion,the OTA staff decided to compile vignettes on the de-velopment process from inventors of different devicesand from different organizations.
The staff next prepared a draft status report, whichpresented information gained up to that point in thestudy on the industry and on Federal policies regard-ing payment, FDA regulation, the VA, research anddevelopment, patents, and international trade. Thestatus report was the major topic of the second panelmeeting held at OTA on March 3, 1983. The discus-sion pointed out the advisability of focusing the finalreport of the assessment on policies specific to medi-
179

180 . Federal Policies and the Medical Devices Industry
cal care and, within those policies, on matters relatedto medical devices.
Considerable discussion at the panel meeting alsosurrounded FDA regulation of medical devices. Be-cause of the importance of this policy area, a work-shop on regulation under the 1976 Medical DeviceAmendments was held at OTA on May 19, 1983. Par-ticipants included attorneys and other policymakersfrom Federal agencies, consumer groups, and privatefirms who had been involved in drafting and imple-menting the legislation (see app. B). The workshop dis-cussed the intentions of the framers of the law, theevolution of the bill as it went through the legislativeprocess, and its implementation as practical problemswere faced by FDA.
At its third meeting, on August 4, 1983, the advi-sory panel discussed the revised draft of the status re-port as well as drafts of a case study and backgroundpaper that had been received. The panel noted thatthe report would have to take into account the changesin payment occasioned by Medicare’s forthcoming useof diagnosis related groups. The final draft of the statusreport was sent to the requesting congressional com-mittees in order to inform them of the progress andcomponents of the study.
During the fall and early winter, drafts of the re-maining case studies and background papers were re-ceived, sent to the advisory panel and other expertsfor review, and revised by contractors. The materialwas therefore available to OTA staff as they were pre-paring the first draft of the final report. In March 1984,that draft was sent to the advisory panel, the HealthProgram Advisory Committee, and 75 other reviewerswho are experts in fields related to different aspectsof the study.
The draft report was discussed at the March 31meeting of the Health Program Advisory Committeeand at the fourth and final meeting of the advisorypanel on April 3. The committee advised that morenote be taken of devices for which adoption and usehave been insufficient. The advisory panel concen-trated on the summary chapter, FDA regulation, andpolicy options. After the meeting, OTA staff revisedthe final report based on comments received from thepanel and other reviewers and in early May sent therevised summary chapter to the advisory panel andthe Health Program Advisory Committee. The revisedreport was reviewed within OTA and in mid-May wassubmitted for approval to the Technology AssessmentBoard.
Several documents are being published in connec-tion with the assessment: the main report (of whichthis appendix is a part), a booklet summarizing themain report, a technical memorandum on policies of
the VA, a background paper of inventors’ vignettes,and six case studies. In addition to this report and thesummary, the following publications will be availablethrough the U.S. Government Printing Office:
●
●
●
●
●
●
●
●
Inventors’ Vignettes of the Development of Med-ical Devices, edited by OTA staff.Medical Devices and the Veterans Administra-tion, by OTA staff.Technologies for Managing Urinary Incontinence,by Joseph Ouslander and Robert L. Kane, Univer-sity of California, Los Angeles.The Boston Elbow, by Sandra J. Tanenbaum,Massachusetts Institute of Technology.The Contact Lens Industry: Structure, Competi-tion and Public Policy, by Leonard G. Schifrin,College of William and Mary.Nuclear Magnetic Resonance Imaging Technol-ogy: A Clinical, Industrial, and Policy Analysis,by Earl P. Steinberg and Alan B. Cohen, JohnsHopkins Medical Institutions.The Hemodialysis Equipment and Disposable In-dustry, by Anthony A. Romeo, University ofConnecticut.The Market for Wheelchairs: Innovations andFederal Policy, by Donald S. Shepard and SaritaL. Karen, Harvard School of Public Health.
In addition, papers were prepared on contract toOTA to provide background information for the mainreport and are available through OTA in limited quan-tities:
●
●
●
●
●
●
“Capital Markets, Government Regulation, TaxPolicy, and the Financing of Medical Device In-novations,” by James R. Barth and Joseph J.Cordes, with Michael Bradley, George Washing-ton University.“Governmental Barriers to International Trade inMedical Devices in the United States, UnitedKingdom, France, the Federal Republic of Ger-many, Canada, Japan, and Mexico, ” by Kaye,Scholer, Fierman, Hays & Handler, Washington,DC.“Innovative Activity in the Medical Devices In-dustry,” by Anthony A. Romeo, University ofConnecticut.“Medical Device Standards and InternationalTrade, ” by Kornmeier, McCarthy, Lepon &Harris, Washington, DC.“The Impact of Federal and State Regulatory Pro-grams on the Ambulatory Laboratory Testing In-dustry and the Demand for Instrumentation,” byHope S. Foster, O’Connor & Hannan, Washing-ton, DC.“The Relationship of FDA, PHS, and HCFARegarding Medical Device and Organ Transplant

App. A—Method of the Study • 181— . . - — - —
Technologies,” by Dennis J. Cotter, Georgetown netic Resonance (NMR) in the United Kingdom, ”University. by John Hutton, University of York, England.
• “The Role of the Government in the Research, De- ● “Veterans Administration Procurement and thevelopment, and Commercialization of Computed Market for Medical Equipment, ” by Ralph M.Tomography (CT) Scanning and Nuclear Mag- Bradburd, Williams College.

A p p e n d i x —Acknowlegements andHealth Program Advisory Committee—.——.——.-—..--—— _ ——.— — ..— —— . . — —— .-— - - .- - — - —————.—-—— .
This report has benefited from the advice and review of several other people in addition to the advisorypanel. The staff would like to expresss its appreciation to the following people for their valuable guidance.
Emily Arakaki Warren HyerU.S. Department of Commerce Biomedical Network,Inc.Washington, DC Lawrenceville, NJ
Claude Bandy Michael KerneyU.S. Department of Commerce Berkeley, CAWashington, DCCarl BlozanU.S. Food and DrugRockville, MDRobert BritainU.S. Food and DrugSilver Spring, MDGil DeveyWashington, DCFred Downs
Philip MarcusU.S. Department of Commerce
Administration Washington, DCRobert C. McCuneNational Electrical Maufacturers Association
Administration Washington, DCRobert S. MusitanoDun & BradstreetWashington DCWayne Roe
U.S. Veterans AdministrationWashington, DCLily EngstromNational Institutes of HealthBethesda, MDMarion FinkelU.S. Food and Drug AdministrationRockville, MDRichard FlahertyHealth Industry Manufacturers AssociationWashington, DCSusan FooteUniversity of California, BerkeleyBerkeley, CAGhislaine FrancisU.S. Department of CommerceWashington, DCMargaret GianinniU.S. Veterans AdministrationWashington, DCJonathan GoldOffice of Health PlanningU.S. Public Health ServiceRockville, MD
Health Industry Manufacturers AssociationWashington DCPaul RyserIMS America, Ltd.Rockville, MDWilliam K. ScheirerU.S. Small Business AdministrationWashington, DCF. M. SchererSwarthmore CollegeSwarthmore, PAAl SchnuppU.S. General Accounting OfficeRockville, MDWilliam StarrU.S. Department of CommerceWashington, DCGeorge WillingmyreHealth Industry Manufacturers AssociationWashington, DCDennis WyantU.S. Veterans AdministrationWashington, DC
182

App. B—Acknowledgments and Health Program Advisory Committee • 183_ —
Workshop on the Purchase and Use of Medical Devices, Dec. 7, 1982
Robert Berenson John MatooleWashington, DC Veterans Administration Medical Center
Frank Bowe Omaha, NE
Cedarhurst, NYDennis CotterGeorgetown University Health Policy CenterWashington, DCDanny FoutchHospital Corp. of AmericaNashville, TNPradeep Gupte
James MonganTruman Medical CenterKansas City, MOLouise RussellThe Brookings InstitutionWashington, DCKent SamuelsonSalt Lake City, UT
Westchester -County Medical Center William SchneiderValhalla, NY Kaiser-Permanente Medical Care Program
Ralf Hotchkiss Oakland, CA
Oakland, CAPhyllis LeppertColumbia-Presbyterian Medical CenterNew York, NY
Workshop on Research, Development, and Marketing of Medical Devices, Dec.
William AdamsSurgilite International, Inc.Long Beach, CAPerry Blackshear, Jr.Massachusetts General HospitalBoston, MAThomas CarneyMetatech & BiofermNorthbrooke, ILWilson GreatbatchGreatbatch Enterprises, Inc.Clarence, NYRichard NelsonInstitute for Social and Policy StudiesYale UniversityNew Haven, CT
William PartridgeUniversity of Utah Research InstituteSalt Lake City, UTRichard RettigIllinois Institute of TechnologyChicago, ILWalter RobbMedical Systems OperationsGeneral Electric Co.Milwaukee, WIAron SafirUniversity of Connecticut Health CenterFarmington, CT
15,1982
184 ● Federal Policies and the Medical Devices Industry .—. . — ---- ---- — . . . — - —
Workshop on Standards, Aug. 17, 1983
Russell J. ArnsbergerBecton Dickinson & Co.Washington, DCE. Ronald AtkinsonAmerican Hospital Supply Corp.Evanston, ILRobert AvrutikPhilips Medical Systems, Inc.Shelton, CTRichard G. FlahertyHealth Industry Manufacturers AssociationWashington, DCRobert C. FlinkMedtronic, Inc.Minneapolis, MN
Thomas E. KimbleDuPont Clinical & Instrument System DivisionWilmington, DEHarold MayOhio Medical ProductsMadison, WIThomas D. NickelTravenol Laboratories, Inc.Deerfield, ILGeorge T. WillingmyreHealth Industry Manufacturers AssociationWashington, DCHenry WishinskyMiles Laboratories, Inc.Elkhart, IN
HEALTH PROGRAM ADVISORY COMMITTEE
Stuart H. Altman*DeanFlorence Heller SchoolBrandeis UniversityWaltham, MAH. David BantaDeputy DirectorPan American Health OrganizationWashington, DCCarroll L. Estes**Chair
Sidney S. Lee, Committee ChairPresident, Milbank Memorial Fund
New York, NY
Harvey V. FinebergDeanSchool of Public HealthHarvard UniversityBoston, MAMelvin A. Glasser***DirectorHealth Security Action Council-Committee for National Health InsuranceWashington, DCPatricia King
Department of Social and Behavioral SciencesSchool of NursingUniversity of California, San FranciscoSan Francisco, CARobert EvansProfessorDepartment of EconomicsUniversity of British ColumbiaVancouver, BCRashi FeinProfessorDepartment of Social Medicine and Health PolicyHarvard Medical SchoolBoston, MA
ProfessorGeorgetown Law CenterWashington, DCJoyce C. LashofDeanSchool of Public HealthUniversity of California, BerkeleyBerkeley, CAAlexander LeafProfessor of MedicineHarvard Medical SchoolMassachusetts General HospitalBoston, MA

App. B—Acknowledgments and Health Program Advisory Committee ● 185—
Margaret Mahoney**** Dorothy P. RicePresident Regents LecturerThe Commonwealth Fund Department of Social and Behavior SciencesNew York, NY School of Nursing
Frederick Mosteller University of California, San Francisco
Professor and Chair San Francisco, CA
Department of Health Policy and Management Richard K. RiegelmanSchool of Public Health -
Harvard UniversityBoston, MANorton NelsonProfessor
Associate ProfessorGeorge WashingtonSchool of MedicineWashington, DCWalter L. Robb
University
Department of Environmental Medicine Vice President and General ManagerNew York University Medical School Medical Systems OperationsNew York, NY General Electric
Robert OseasohnAssociate DeanUniversity of Texas, San AntonioSan Antonio, TXNora PioreSenior AdvisorThe Commonwealth FundNew York, NYMitchell Rabkin*PresidentBeth Israel HospitalBoston, MA
Milwaukee, WIFrederick C. RobbinsPresidentInstitute of MedicineWashington, DCRosemary StevensProfessorDepartment of History and Sociology of ScienceUniversity of PennsylvaniaPhiladelphia, PA
*Until April 1983.**Until March 1984.***Until October 1983.****Until August 1983.
2 5 - 4 0 6 0 - 84 - 1 3

Appendix Cm —The Innovative Process in theMedical Devices Field
Introduction
As a society, we value technological progress—thecontinual “introduction to practice of new and moreuseful ways of serving human purposes” (262). In thehealth field, technological progress is often embodiedin the introduction of new medical devices. Despiteits importance, there has been little systematic inves-tigation of the process of technological change for med-ical devices. How and by whom do medical devicesget developed? And what factors influence their de-velopment?
There are, of course, many stories about the intro-duction of specific new devices, such as electronic fetalmonitors (410), gastric freezing (114), gastroendo-scopes (448), and computed tomography (CT) scan-ners (348). These individual cases demonstrate thediversity of developmental pathways taken. They sug-gest that simple generalizations of the process are im-possible. Yet, some elements of the process may becommon to all medical devices and, indeed, to all newtechnologies.
The basic unit of technological change is innova-tion—a new device, product, or process introduced topractice for the first time (223,182). Innovation is alsowidely used to refer to the process by which techno-logical change occurs (232). In this OTA assessment,“innovation” refers to the newly introduced technol-ogy and “innovative process” to the process by whichinnovations find their way into practice. This appen-dix explores the process of technological change in gen-eral, with emphasis on the questions of who developsinnovations and under what conditions the innovativeprocess occurs.
Innovations are valued for their capacity to increaseproductivity or the quality of consumption (274).Those innovations largely affecting production proc-esses have been called process innovations, while thoseintended for sale are product innovations (438). Newmedical devices are product innovations, althoughthey may change the process of medical care.
One important view of the innovative process is thatit consists of four essential functions (274):1
‘There are several other models of the “innovative process” that focus onthe chronological stages rather than on critical functions. Schumpeter definedtechnical change as having three steps: invention, innovation, and imitation(or diffusion) (274). A recent study of the Organization for Economic Coop-eration and Development has identified four stages of innovation: concep-tion, reduction to practice (i.e., prototype), startup, and expansion (diffu-sion) (236). These alternative characterizations of the innovative process donot contradict one another; they highlight the points in the process of inter-est to each author.
●
●
●
●
Invention—the act of insight by which a new andpromising technical possibility is recognized andworked out (at least mentally and perhaps alsophysically).Development—the sequence of detail-orientedtechnical activities, including testing by trial anderror, through which the original concept is mod-ified and perfected until it is commercially viable.Entrepreneurship—the decision to go forwardwith the effort, the organization of it, and the se-curing of funding for it.Investment—the act of risking funds for theventure.
For the innovative process to succeed in producingan innovation, each of these four components is nec-essary, but the mix may differ widely among applica-tions. Some innovations are the result of sudden in-sights, with little developmental work needed; othersmay require a laborious and slow development phasewith high levels of investment. Nevertheless, all in-novative processes contain each of these componentsto a greater or lesser extent.
When and Where the InnovativeProcess Occurs
Theories of innovation rest largely on underlyingviews of the innovative process as either deterministic,individualistic, or serendipitous (182). The deter-ministic view holds that innovations come forth whenthe conditions are right; the individualistic theorystresses the importance of the innovator (an individ-ual or organization) in bringing forth and carryingthrough an idea; and the serendipity approach stressesthe stochastic nature of the process of technologicalchange (182).
There is, of course, some truth in each of these ap-proaches. Variability, complexity, and uncertainty arethe hallmarks of innovative processes (231). Thesethree factors have substantial influence on the effec-tiveness of policies intended to affect the rate and direc-tion of technological change (232). Innovative proc-esses vary widely among industries and institutionsand are not well characterized by simple methods.However, a brief description of how medical and sur-gical procedures that use medical devices come intobeing may highlight the characteristics of the innova-tive process in medicine.2
‘The description presented here is adapted from appendix D of an OTAreport entitled Strategies for Medical Technology Assessment (351).
186

App. C—The Innovative Process in the Medical Devices Field ● 187
Medical and surgical procedures, which often in-volve the use of medical devices, usually begin as user-generated (e.g., physician-generated) innovations. Aninnovative procedure may involve the modification ofan existing procedure (usually in accompaniment withmodifications of the devices being used) for applica-tion to a new use.
Innovations in procedures frequently arise in aca-demic or academic-associated centers, where physicaland professional resources are readily available; a re-search, innovation-seeking atmosphere is encouraged;and contacts with others in the field extend not onlynationally, but also globally. Innovators in such set-tings know how to present the innovations in a man-ner that will be technically acceptable and have theprestige that gives them access to professional meetingsand journals to publicize their results. Their presenta-tions and publications not only diffuse the innovationto a wider audience, but more importantly, begin tolegitimize it. Depending on the claimed innovation’snature, usually defined in terms of how the innova-tion will revolutionize or at least substantially influ-ence the related area of medical or surgical practice,other academic centers will begin to pursue it.
At some point in the innovative process, a prototypedevice must be developed. This activity may occur ina variety of settings including the academic center, ahospital, a medical device firm, or even a home lab-oratory. The development and refinement of a pro-totype can be a costly and time-consuming part of theinnovative process.
At this point, several U.S. Government agenciesmay enter the picture. The National Institutes ofHealth (NIH) may provide support for the innovatorand researchers in other health centers through ran-domized clinical trials, most likely conducted in someof the clinical research centers funded by NIH. A newdevice or modification of an existing device requiresthe Food and Drug Administration’s (FDA) approval.Increasingly, FDA approves the use of investigationaldevices for limited testing at the same centers that NIHsupports as clinical research centers (or at least to thehealth institutions in which these designated centersare located).
FDA must make a determination of safety and ef-ficacy for market clearance of the device under review.FDA will often make its decision long before NIHreaches a decision and terminates funding for the clin-ical trials. FDA’s decision may rest on the narrow ques-tion of the technical functioning and safety of thedevice. Release of the device to the general market,once premarket approval is given, also tends to speedup the diffusion of the procedure that NIH may bestudying.
This result, in turn, places more pressure on theHealth Care Financing Administration (HCFA) to re-imburse for the procedure. Sooner or later, HCFA mayreceive a request for reimbursement of the new pro-cedure and will consider information from any clini-cal trials for evidence of safety and efficacy, but onlyafter the device has been approved for marketing byFDA.
Conditions Affecting theInnovative Process
Despite the variability and uncertainty of the inno-vative process, there are institutional and other con-textual conditions that may influence the process insystematic ways. These conditions fall into four cate-gories:
● conditions affecting the market for the inno-vation,
• conditions affecting the ability to appropriate thebenefits of the effort to produce the innovation,
. conditions affecting the availability of resourcesto invest in the innovation, and
. conditions affecting the availability and organiza-tion of technical and entrepreneurial know-how.
Conditions Affecting the Market for Innovation
The market for an innovation depends on the will-ingness of each potential user to pay for its benefits.If a new medical device is to survive after a trial, itmust be perceived as worthwhile by the people ororganizations who will decide whether or not it willbe used (232). Thus, the perceived need for and po-tential benefits of a new device determine the size ofthe market. Even the “user/innovator,” the individualsor organizations that go about solving their own prob-lems through technological change (446), are likely toassess the potential benefit of the innovation to them-selves and to others in their decisions to devote timeand resources to solving a problem.
Both the size and organization of the market can beimportant in determining the willingness to pay foruseful innovations (268). For example, potential econ-omies of scale in the production of medical servicesin certain devices may not be realized because of thesmall scale of medical care providers (168). If small-scale providers are not organized to share services,then the full benefits of the device cannot be realizedby potential users, and the device is unlikely to suc-ceed. Yet, if the potential cost savings are high enough,the availability of a new technology may, with somedelay, actually bring about a change in the organiza-tion of the market that allows for its adoption (268).

188 ● Federal Policies and the Medical Devices Industry
Although it is difficult to sort out the many factorscontributing to the emergence of newly integratedhealth care organizations, changing medical technol-ogy may be one cause.
The importance of the market in stimulating innova-tion is indicated by the fact that 60 to 90 percent ofsuccessful innovations across many fields have beendeveloped in response to the perceived needs of themarket or of users (437). Any factors affecting the sizeof the market for an innovation, such as changes inthe prices of close substitutes, changes in the abilityof potential users to pay, and regulatory constraintson use (263), are likely to affect the innovative process.
In medical care, the market is determined in largepart by mechanisms of third-party reimbursement forcare (see ch. 3 for more detail). Russell found that therate of diffusion of some (but not all) of the medicaldevice innovations that she studied increased with theonset of Medicare coverage (265). Recent work indi-cates that prospective payment approaches can havesome retarding effects on the quantity of new medicaldevices adopted by hospitals (448). Thus, the paymentprocedures used by insurance companies and otherthird-party payers may have an important indirect ef-fect on innovative activity in the medical devices in-dustry.
Conditions Affecting the Innovator’s Ability toAppropriate Benefits
The need for investment in research, development,and commercialization implies that a potential in-novator must be able to expect a return that will makethe investment worthwhile. s In addition to an evalua-tion of the potential market, the expected return willdepend on the degree to which the innovators can ex-pect to capture or appropriate these benefits in prof-its or perhaps even directly as users. The ability toappropriate benefits affects not only whether innova-tion results, but also what kind of organization or in-dividual undertakes the innovative activity (445).
One influence on the ability to appropriate benefitsis the market structure of the industry, which influ-ences the rate of imitation and therefore the marketshare that an innovator can expect over time. The ef-fect of market structure is controversial. Schumpeterand Galbraith postulated that industries with a fewdominant firms would be able to appropriate more of
3The innovator’s best guess about the potential market may be wrong, foruncertainty and failures of human judgment are inherent in the process. Unlessthere is some reason to suspect a bias in the direction of error, however, theinvestment decision can be assumed to deal with the probability of errorthrough its tradeoff of expected risk for return. Government policies suchas regulation may increase the level of uncertainty about outcomes of theinnovative effort and therefore increase the level of expected return requiredto justify an R&D investment (97).
the benefits of their inventions because they face lessof a threat from imitation and would therefore be moreinnovative than highly competitive industries (274).
Other researchers have concluded that high barriersto entry in an industry, particularly in relation to thecapital investment required to compete, encourage re-search and development (R&D) by the firms in the in-dustry (66). Fellner has suggested that the effect ofmonopoly power on the innovative process may dif-fer between product and process innovations (112).Firms in industries in which a few firms hold a substan-tial share of the total market would have less to gainfrom introducing cost-reducing process innovationsthan would firms in highly competitive industries, andfirms in more competitive fields may have to innovateto keep pace with rivals. Kamien and Schwartz ob-served that the greatest degree of innovation occursin a market structure where rivalry is greater than inmonopoly but less than in perfect competition (178).
Empirical evidence testing this hypothesis in U.S.industry is conflicting. Greer and Rhoades found thatthe rate of process innovation (as measured by produc-tivity growth) was actually higher in concentrated in-dustries, but Scherer points out that this associationcould be the result of a bias in process innovationstoward large-scale operations, which are most likelyto predominate in concentrated industries (134,274).Romeo, on the other hand, found that firms in con-centrated industries adopted numerically controlledmachine tools (a process innovation) more slowly thanfirms in more competitive industries (261).
The ability to appropriate benefits from investmentmay also depend on the size and level of diversifica-tion of the innovating firm. Larger firms with greaterdiversification may be able to apply a process innova-tion across a variety of applications and may there-fore be able to recoup investment costs more readily(230). Empirical studies relating to this hypothesis areinconclusive (274).
Despite the large number of companies in the med-ical devices field, especially small ones, concentrationin the medical devices categories is similar to that inother manufacturing industries. There is some evi-dence, however, that merger activity in medical de-vices accelerated during the latter part of the 1970s (seech. 2 for details).
Government policies can also affect the extent towhich a developer captures the benefits of an innova-tion, The patent system is, of course, designed for thatpurpose, but its power is limited. It is easy to designaround some areas of technology, such as electroniccircuitry and computer software (142). Also, firmsholding critical patents may refuse to license them, thusblocking further technological innovations (142). Inshort, the ability to appropriate benefits may carry

App. C—The Innovative Process in the Medical Devices Field . 189
with it the ability to resist pressure to apply potentialinnovations.
Conditions Affecting the Availability of Resources
Several scholars have noted the increasing institu-tionalization of R&Din the post-war period (175,182).Although there is variation across industries and fieldsof technologies, organized R&D as opposed to indi-vidual efforts have become the predominant source ofinnovation in this country as well as others. This trendtoward institutionalization stems at least partly fromthe complexity of technology and the increasing needfor financial resources and trained manpower to bringforth innovations.
Two kinds of resources are needed for R&D: per-sonnel and financial capital. The availability of a poolof adequately trained personnel capable of carryingon R&D should become more important to technologi-cal innovation as the technology base gains in com-plexity. This OTA report does not explore issues ofpersonnel or the role of scientific and technical edu-cation as it relates to industrial innovation in generaland to the medical devices industry.
Financial capital can take the form of governmentor philanthropic grants and contracts for R&D, fundsgenerated internally by firms (e.g., undistributed prof-its), and debt or equity instruments (including venturecapital arrangements). The flow of these funds dependson the expected return and risk inherent in specificR&D projects, which in turn depend on the marketand the appropriability of benefits. Government pol-icies also influence the flow of R&D funds and there-fore the location of R&D activities and the ultimateinnovations.
As discussed in this OTA report, Government R&Dpolicies influence not only the kinds of projects thatare initiated, but also the kinds of organizations inwhich R&D takes place. Taxation policy also affectsthe availability of different kinds of capital. Appen-dix G discusses the impact of taxation policy on R&Dfor medical devices.
Conditions Affecting the Availability ofTechnical and Entrepreneurial Know-How
Successful innovation requires the joining of tech-nical and entrepreneurial expertise. Although theseareas of expertise need not reside in a single individ-ual, they must be integrated in an appropriate fash-ion. Are there conditions or environments that fosteror inhibit the existence and productive use of theseskills?
A great deal of research has been devoted to deter-mining whether or not the size of the firm has any rela-tionship to its ability to develop innovations success-fully. The size of the organization can be importantto innovation for several reasons. First, larger firmsmay be more able to marshal the technical resourcesneeded to conduct R&Don complex subjects. Second,large firms may be able to appropriate the benefits ofinnovations more easily than small firms. Third, largefirms may have greater access to capital to financeR&D than small firms.
Against these possible advantages of large firms isone major advantage held by small firms. Small firmsmay be less burdened by cumbersome organizationalstructures that could inhibit coordination and timelydecisionmaking on innovation. The interplay of thesefactors has suggested to some that there may be athreshold size necessary to support the R&D thatresults in innovation (203,179). Moreover, this thresh-old size is likely to vary from industry to industry. Em-pirical studies of the innovative process do not sug-gest any systematic patterns of advantage for largefirms. One recent study, which examined 635 prod-uct innovations marketed during the 1970s, found thatsmall firms accounted for approximately 40 percentof these (124). Other work has found some advantageto size but, again, only up to some threshold (200).
In a recent study, The Futures Group examined over8,000 innovations published in trade journals in 1982 ‘(123). 4 The number of innovations per employee was1.43 times higher in small firms (500 employees or less)than in large firms. Innovations were categorized byStandard Industrial Classification (SIC) code. Rates ofinnovation in five medical device codes are presentedin table C-1. With the exception of SIC 3851 (ophthal-mic goods), small firms were over twice as innovativerelative to levels of employment as large firms in themedical device industries.
There is also evidence from a Louis Harris surveythat “the introduction of new medical devices is justas common in small as it is in large plants” (197).About one-half of the establishments with 500 or moreemployees introduced a significant new medical devicein the last decade, while just under half of the firmswith fewer than 500 employees reported doing so. (In-deed, more than one-half of the very small firms, 1to 9 employees, reported such an introduction. )
4This study, like others that depend on a sample of published innovations,is subject to possible selection bias. The bias is most likely in the directionof overrepresentation of innovations by large firms and more significant in-novations. Hence, findings showing smaller firms to be more innovative areprobably strengthened by this bias.

190 ● Federal Policies and the Medical Devices Industry
Table C-1 .—Rates of Innovation in Five SIC Code Medical Devices Categoriesa
Industry
Standard employment in 1977d
Industrial Innovations in 1982 (thousands)
Classification Small Large Small Large Innovations per employee(SIC) codeb firm c firm firm firm small firm : large firm
3693 . . . . . . . 10 5.9 25.0 2.493841 . . . . . . . 36 30 11.7 31.5 3.233842e 33 30 17.9 36.0 2.213843 . ........... 2 0 7.1 9.2 NA f
3851 . . . . . . . 2 9 11.1 18.9 0.38— —Total . . . . . 83 86 53.7 120.6 2.17
alnnovations were published in 1982 trade journals.%he five SIC codes areas follows: 1) SIC 3693(X-ray and electromedical equipment), 2) SIC 3841 (surgical and medical instruments),3) SIC 3842 (surgical a pliances and supplies), 4) SIC 3843 (dental equipment and supplies), and 5) SIC 3851 (ophthalmic goods).
FSee ch. 2 for more in ormation.csmall firms have fewer than 500 emPloYees.deployment in 1977 is Used because a lag in journal publication of 4.3 years between invention and innovation was found
in a detailed analysis of 375 innovating firms.eThis ~alysis e~~ludes four innovations in SIC 3842, &cause the inno@ing companies could not be found in published directories,f NA indicates information not available.
SOURCE: The Futures Group, “Characterization of Innovations Introduced on the U.S. Market in 1982,” contract report preparedfor the US. Small Business Administration, contract No. SBA43050-OA-82, Glastonbury, CT, March 1984.
On balance, it appears that in the medical device industries and types of technologies in the most appro-field as in industry in general, small firms play an im- priate setting for bringing forth innovations. Schererportant role in spurring innovation, but the evidence concludes that the issue of small or large may be ir-is limited by the lack of consistent or validated meas- relevant when what is needed is a variety of environ-ures of innovation and of any standardized criteria for ments capable of responding to technological oppor-assessing the relative importance of innovations. In ad- tunities wherever they arise (274).dition, there maybe a great deal of variation among

Appendix D.— Patent Policy Regarding Medical Devices
Introduction
The U.S. patent system started with British-basedcolonial patent systems which continued after theAmerican Revolution. It is derived from a specific pro-vision in the Constitution (357):
The Congress shall have the Power . . . to promotethe Progress of Science and useful Arts, by securingfor limited Times to . . . Inventors, the exclusive . . .Right to their . . . Discoveries.The Supreme Court has interpreted this clause in our
Constitution to mean that (132):The Congress in the exercise of the patent power
may not overreach the restraints imposed by the statedconstitutional purpose. Nor may it enlarge the patentmonopoly without regard to the innovation, advance-ment or social benefit gained thereby. Moreover, Con-gress may not authorize the issuance of patents whoseeffects are to remove existent knowledge from the pub-lic domain, or to restrict free access to materialsalready available. Innovation, advancement, andthings which add to the sum of useful knowledge areinherent requisites in a patent system which by con-stitutional command must promote the progressof . . . useful Arts. This is the standard expressed inthe Constitution and it may not be ignored. And itis in this light that patent validity requires referencesto a standard written into the Constitution . . .There are four types of property rights in informa-
tion, or intellectual property—patents, trade secrets,trademarks, and copyrights. Patents give the right toexclude others from using inventive concepts duringthe life of the patent. Trade secrets, traditionally underState not Federal law, give the owner of a technicalor commercial secret the right to prevent someone withaccess to the secret from disclosing it or using it forpersonal gain. But if the secret can be discovered in-dependently or is discovered by legitimate means (e.g.,from analysis of the product), there is no protection.Trademarks give merchants the right to restrict theiruse by others who might benefit from the exploitationof established products (e.g., Coca Cola®, Darvon®,SweetnLow®). Copyrights provide the right to excludeothers from copying the form of a work of art or awriting, but do not prevent others from using the ideasexpressed in the copyrighted work (347).
Lately, a property right called a “tangible researchproperty” has emerged separate and distinct frompatents, copyrights, trademarks, and trade secrets. Forexample, in March 1982, Stanford University devel-oped a separate policy on tangible research propertyto protect Stanford’s ownership of “tangible (or cor-poreal) items produced in the course of research proj-ects.” This policy covers such items as “biologicalmaterials, computer software, computer data bases,
circuit diagrams, engineering drawings, integrated cir-cuit chips, prototype devices and equipment, etc. ”(289).
There are four types of patents, one of which, the“utility” patent, applies to useful processes, machines,manufactured articles, or compositions of matter. “De-sign” patents protect ornamental designs. “Plant”patents apply to asexually reproduced plants otherthan tubers or a plant found in an uncultivated state.“Plant variety protection certificates” provide patent-like protection to sexually reproduced plants. Certifi-cates are administered through the U.S. Departmentof Agriculture. Utility, design, and plant patents areadministered through the Patent and Trademark Of-fice in the U.S. Department of Commerce (347).
The law on utility patents is as follows (347):An invention, to-be patentable, must be usefuland must be a process, machine, manufacturedgood, or composition of matter.A patent can be granted only for an inventionthat, at the time of the claim: 1) was not knownto others, and 2) was not so obvious that a per-son of ordinary skill in the art could have madethe same invention.A patent can be granted only to the inventor(s).A patent gives the owner the right to excludeothers from making, using, or selling the inven-tion in the United States. (There are some impor-tant conflicts between the patent laws of theUnited States and those of other countries.)A patent is granted for 17 years.
About 100,000 patent applications are filed per year,of which about two-thirds are eventually granted. Theaverage time from application to action is about 2years. During this time, a patent examiner determineswhether the invention is novel and not obvious (seeabove), primarily by searching files within the Patentand Trademark Office that contain information onU.S. and foreign patents and on literature such as pro-fessional journals (347).
Tables D-1 and D-2 summarize the number of pat-ents granted by the U.S. Patent Office between 1970and mid-1983. In table D-1, patents are enumeratedby the date of the patent grant, while in table D-2, suc-cessful patent applications are listed by the dates whenpatent applications were first filed. The date when anapplication is filed is a more accurate reflection ofwhen the technology was developed. Fluctuations indata based on application dates are more likely to re-flect changes in technological activity, since such fluc-tuations would be unaffected by changes in the Pat-ent and Trademark Office’s processing of patentapplications. For example, the 1979 patent grant data
191

Table D-l.–Patent Activity by Date of Patent Grant, U.S. and Foreign Origin, 1970-83
1970 1971 1972 1973 1974 1975 1976 1977 1978 1979 1980 1981 1982 1983
Total. . . . . . . . . . 64,429 78,317 74,810 74,143 76,278 72,002 70,226 65,269 66,102 48,854a 61,819 65,771 57,889 24,383 b
U.S. origin . . . . . 47,077 55,984 51,524 51,504 50,650 46,713 44,277 41,484 41,254 30,081 37,356 39,223 33,896 14,144(Percent) . . . . (73) (71) (69) (69) (66) (65) (63) (64) (62) (62) (60) (60) (59) (58)
Foreign origin.. 17,352 22,333 23,286 22,639 25,628 25,289 25,949 23,785 24,848 18,773 24,463 26,548 23,993 10,239(Percent) . . . . (27) (29) (31) (31) (34) (35) (37) (36) (38) (38) (40) (40) (41) (42)
aThi~ number i~ artificially low because the patent and Trademark Office issued fewer patents than normal becauseof alackof fundsto print patelltS.
blncludes data only to June 1963.
SOURCE: U.S. Department of Commerce, Patent and Trademark Office, Office of Technology Assessment and Forecast, “OTAF Custom Report, All Technologies Report, 1/1963-6/1983” (mimeo), 1983.
Table D-2.–Patent Activity by Date of Patent Application, U.S. and Foreign Origin, 1970-83
1970 1971 1972 1973 1974 1975 1976 1977 1978 1979 1980 1981 1982 1983
Total. . . . . . . . . . . . ‘65,942 66,353 63,356 66,278 66,381 65,807 65,695 65,697 64,931 64,081 58,228a 23,816a 1,647a 1a, b
U.S. origin . . . . . . . 45,851 45,580 42,429 42,733 41,830 42,198 41,566 40,652 39,222 37,978 34,403 14,765 1,150 0(Percent) . . . . . . (70) (69) (67) (64) (63) (64) (63) (62) (60) (59) (59) (62) (70) (o)
Foreign origin. . . . 20,091 20,773 20,927 23,545 24,551 23,609 24,129 25,045 25,709 26,103 23,825 9,051 496(Percent) . . . . . . (30) (31) (33) (36) (37) (36) (37) (38) (40) (41) (41) (38) (30) (100)
aData incomplete because of lag time between application and aPPrOval.blncludes data only to June 1983.
SOURCE: U.S. Department of Commerce, Patent and Trademark Office, Office of Technology Assessment and Forecast, “OTAF Custom Report, All Technologies Report, 1/1963-6/1983” (mimeo), 1983.

App. D—Patent Policy Regarding Medical Devices • 193
(see table D-1) are low, not because of a decrease intechnological activity, but because the Patent Officeissued fewer patents than normal because of a lack offunds to print patents.
Table D-2, summarizing successful patent applica-tions by the date of patent application, shows that U.S.patents have remained at approximately 65,000 peryear through the 1970s (data for 1980 and subsequentyears are incomplete because of the delay between ap-plication and final ruling by the Patent and TrademarkOffice). During this period, patents of foreign originincreased from 30 to 40 percent of successful applica-tions. About one-fourth of these patents of foreignorigin were Japanese, closely followed by patents fromWest Germany (217).
Table D-3 summarizes 1981-83 data for selected in-dexes. In addition to the fact that about 40 percent ofpatents were of foreign origin, more than 75 percentwere of corporate origin, about 2 percent were U.S.or foreign-government owned, and about 7 percentwere owned by a foreign-resident inventor but as-signed to a U.S. organization.
A patent can be sold (assigned), or it can be licensedon an exclusive or nonexclusive basis. An exclusivelicensee has the right to enforce the patent. Nonex-clusive licenses, granted to more than one party, aresimply promises that licensees will not be sued for pat-ent infringement. Payment for a license is usually byfee (e.g., $10,000 per year) or by royalty, based onsome measure of income such as frequency of use ofthe invention or percent of sales of the invention (orproducts incorporating it).
Patent owners police their own patents. If theybelieve that their patents are being infringed, they maylet unauthorized uses continue and try to collect li-censing fees from the unauthorized users. But if theusers refuse to cooperate, patent owners must go tocourt to obtain an injunction against the unauthorizeduse and to collect damages.
.
Table D-3.–Data on Patent Approvals, SelectedIndexes, 1981-83a
Percent corporate-owned . . . . . . . . . . . . . . . . . . . . . 76.87%Percent government-owned . . . . . . . . . . . . . . . . . . . 2.37%Percent foreign-origin . . . . . . . . . . . . . . . . . . . . .. ..41.06%Percent U.S.-owned of foreign . . . . . . . . . . . . . . . . . 7.170/0aDeflnitlOnS: Paroont corporate-owned: 1981-83 U.S. patents assigned tO cOrPOr-taiona/l Wl-83 patents x 100. Percent govommont.owned: 1981%3 U.S. patentsassigned to the U.S. or foreign governments/1981-83 patents x 100. Percenttomfgn-ortgln: 1981-83 U.S. patents with foreign resident inventor/1981-83 patentsx 100. P.rc.nt U.S..owned of foreign: 1981-83 U.S. patents with a foreign resi-dent inventor that are assigned to a U.S. organization11981 -83 patents with aforeign resident inventor x 100.SOURCE: U.S. Department of Commerce, Patent and Trademark Office, Office
of Technology Assessment and Forecast, “OTAF Custom Report, AllTechnologies Report, January 1983 to June 1983 (mimeo), 1983.
The U.S. patent system is currently undergoing ma-jor changes. In July 1981, reexamination proceedingswere initiated under which anyone can request thata patent be reexamined (accompanied by a $1,500 fee).The Patent and Trademark Office can refuse to re-examine on the basis that no substantially new ques-tion was raised. In the same law (Public Law 96-517)that authorized reexamination (in which other partiescan challenge a patent), Congress also required the Pat-ent and Trademark Office to submit a plan to Con-gress by December 1982 on modernizing its files.
Patent protection is intended to stimulate inventionby giving potential inventors the exclusive right to anybenefits for a substantial time. A patent is also grantedas a reward for the early disclosure of the inventionto the public and not as a reward for either its discov-ery or for investment in its commercial developmentand exploitation. If the public would benefit eventuallyfrom the invention through its public disclosure orcommercial use, no reward would be necessary andno patent would be given (101). This is the reason forthe patenting requirements of novelty and not beingobvious to someone working in the same field, andfor the requirement that the patent application mustcontain enough information so that someone else cancopy it.
Some International Aspects of Patents
Only some of the international aspects of patentsare discussed here. One example of differences betweenthe United States and other countries in the area ofpatent law is the concept of “prior art.” In the UnitedStates, there is a l-year grace period between publish-ing of the invention (e.g., of a new technique in a pro-fessional journal) and filing for a patent. Most univer-sities routinely require researchers to report promptlyinventions with potential commercialization so that theuniversity can assess their potential and file for a pat-ent. Most other countries do not have such a graceperiod.
Another example is that under current U.S. patentlaw, it is legal to import a product made in anothercountry by a process covered by a U.S. patent with-out permission of the patent holder. A proposal tomake this an infringement of the U.S. patent wasreportedly part of the Patent and Trademark Office’s1983 legislative proposals (220).
Under the Paris Convention of 1883, patent holdersare given a commercial monopoly (subject to certainconditions) for their inventions in 92 signatory coun-tries. Patent holders must publish details of theirdiscoveries in the signatory countries for other scien-tists to study, but the invention may not be copied for

194 ● Federal Policies and the Medical Devices Industry
profit. Member countries may allow rival manufac-turers to produce the invention if patent holders abusetheir monopoly, for example, by neglecting to producethe invention in the affected countries.
The Paris Convention is administered by the UnitedNations’ World Intellectual Property Organization. Inthe third conference on revisions of the Paris Conven-tion for the Protection of Industrial Property, held inGeneva in October 1982, the main issue was a propos-al that would make it easier for developing countriesto confiscate and manufacture patented inventions.
Third-world governments had wanted a provisiongiving them the right to take over and manufactureon an exclusive basis any potential invention if theoriginal patent holder did not produce it in their coun-try within 30 months of receiving a patent. The intentwas to force foreign manufacturers to produce theirinventions in the developing country instead of pro-ducing them elsewhere and importing them. Third-world countries claimed that large companies that holdmost patents can use imports to undercut a local man-ufacturer allowed to use their technology, so an ex-clusive license barring even the original patent holderwas necessary for local production. The proposalwould also have allowed a registered patent to be con-fiscated altogether after 5 years.
The developed countries opposed the proposal asan expropriation of private property and because largecompanies would become more secretive about theirinventions and reluctant to invest in developing coun-tries. Chemical and pharmaceutical companies werethought to be most vulnerable, because their patentedproducts are relatively easy to make once their for-mulas are known.
Prior to the October 1982 conference, Japan and theWest European countries had agreed to the proposal,arguing that developing countries would find a wayto do it anyway, and that defining the conditions underwhich exclusive licenses were granted would givemore, not less, protection. At the conference, theUnited States offered a compromise proposal thatwould grant nonexclusive licenses, but no agreementwas reached (194).
Patents and New Product Development
The value of patents in the decision to undertakeinnovative activities depends on the type of inventionand on the type of decisionmaker. For example, thepharmaceutical industry rarely pursues the develop-ment and regulatory approval processes for a new drugunless it can be patented. Also, recall that drugs and
other chemicals, once identified, are relatively easy tocopy. In the 97th Congress, extension of the patentterm to recover time lost to the regulatory approvalprocess was the Pharmaceutical Manufacturers Asso-ciation’s number one legislative priority, but it lost nar-rowly in the supplemental session of Congress. In con-trast, much of the innovation in the electronics industryhas occurred without patents.
The importance of patents to small businesses is alsovariable. Many small firms depend on trade secretsrather than on patents. Reasons include the expenseof obtaining or having to defend patents, and theuncertain outcome if the patent is challenged (234).
But the smaller of the small firms usually considerpatents to be more critical than do large businesses.There are anecdotes of the importance of patents insecuring financial support. In interviews conducted foranother OTA study (347), eight venture capitalists dis-tinguished between two types of investments: 1) thosethat rely on a firm’s management team and rapid ad-vances in technology to provide protection from com-petition, with the emphasis on short-term payouts onthe investments; and 2) technologies that require a longresearch and development period, for which patentsbecome almost a prerequisite for investment.
In essence, the confidence that is placed in patentsis a key to determining the incentives for innovationprovided by patents. Little is statistically known aboutthese factors, but it appears that the degree of confi-dence varies over a wide range.
For products that require large capital costs, suchas automobile manufacturing, patents may have littlebearing on investment decisions because of the limitedability of a competitor to enter the market. But patentshave another use for both large and small firms—defensive use to prevent others from stopping thepatent holder in proceeding with his or her invention.One example is in the development of the computedtomography (CT) scanner (258):
Before CT, few X-ray companies bothered with pat-ents, since all the X-ray companies recognized that noone company had a monopoly on the patents, eachwould have had to license from the other to stay inbusiness—the result being “why bother with patents?”EMI, who was new to the X-ray business, heavilypatented their CT designs, and by the end of the dec-ade was requiring substantial royalties from all the CTsuppliers. As a defensive measure, the X-ray com-panies substantially had to change their patent prac-tices; for example, we [General Electric] went fromhaving the part-time use of one patent attorney to hav-ing three full-time patent attorneys. This, I believe,was totally the result of EMI’s changing the practiceof an industry.

App. D—Patent Policy Regarding Medical Devices . 195
Patenting of Medical Devices
The U.S. Patent and Trademark Office classifiespatents into 400 to 500 functional categories, and nospecific category encompasses all medical devices. TheFood and Drug Administration’s (FDA) Office of Eco-nomic Analysis decided which categories should beconsidered medical devices, and further categorizedthese devices as either “low” or “high” technology,depending on how “sophisticated” the device was(390).
Table D-4 identifies which types of medical deviceshave been categorized by FDA’s Office of EconomicAnalysis as low or high technology and their patentcategories and subcategories as classified according tothe Patent and Trademark Office. Figures 2 and 3 inchapter 5 summarize U.S. and foreign medical devicepatents for these low- and high-technology medicaldevices by application date for 1968 to 1979. Low tech-nology patents increased in the early 1970s from about800 per year to a peak during 1973 to 1974 of between1,200 to 1,300 per year and remained at that generallevel for the rest of the 1970s. Patents for high-tech-nology medical devices, on the other hand, continuedto increase throughout the 1970s, doubling from morethan 500 per year in 1970 to more than 1,000 per yearby 1979.
In sum, in the 1970s: 1) there was a modest increasein the annual number of successful patents for medi-cal devices, while there was essentially no increase inannual total patents granted; 2) patents for low-tech-nology medical devices increased in the early 1970s butremained essentially constant for the rest of the dec-ade, while patents for high-technology medical devicescontinued to increase throughout the decade; and 3)while the percent of foreign-origin patents increasedfor both medical devices and all inventions by approx-imately 10 percent, the percent of foreign-origin med-ical device patents (30 percent) was still lower than thepercent for all patents (40 percent) by the end of the1970s.
Table D-4.–High- and Low-TechnoiogyMedical Devices as Classified by FDA’s
Office of Economic Analysis
High-technobgy devices:A. Diagnostic equipment
1. Cardiac devices (128) 695-715a2. Vascular devices (128) 669-6943. Respiratory devices (128) 716-7304. Stimulators, neurological, etc. (128) 731-746, 639-6445. Radiation (128) 653-6676. Other (128) 630-782, minus above codes plus 3-23
B. Respiratory methods1. Mixing (128) 203.12-204.142. Supply (128) 204.18-205.26 plus 207.14-207.183. Substance removal (128) 205.27-207.134. Other (128) 200.11-200.23 and 204.15-204.17
C. Electrical systems and energy applicators (128)419 R-804
D. Implantable artificial body members1. Cardiovascular (3) 1.4-1.72. Legs, arms, bones, etc. (3) 1.913-23. Other (3) 1-1.2 and 13-36
E. Dialysis and blood filters (210) 321A-3216 and (422)44-48
F. Miscellaneous (includes incubators, hearing aids,magnetic devices) (128) 1R-1.5 and (181) 126-137
Low-technology devices:A.
::D.
E.
F.
Kinesitherapy (128) 24R-67Orthopedic (128) 68-80J, 81 A-81R, 581-623Bandages and trusses (128) 82-171Mediators (604) 1-7, 11-19, 23-42, 46-72, 77-93,104-170, 173-238, 239-263, 272-279, 285-302, 303-311,403-416, 890-897Instruments (604) 8-10, 43-45, 94-103, 171-172,264-271, 280-284Dental
1. Orthodontics (433) 2-242. Apparatus (433) 25-1663. Prosthodontics (433) 167-214
G Ophthalmic1. Examining equipment (351) 1-402. Frames (351) 41-1583. Lenses (351) 159-177
H Miscellaneous (includes receptors, baths, canes) (604)20-22, 73-76, 312-377, 378-402, (128) 362-403—
aNumbers refer to categories (in parentheses) and subcategories according tothe Manual of Classification, U.S. Department of Commerce, Patent and Trade-mark Office
SC)URCE US. Department of !-lealth and Human Services! Food and Drug Admin-i stration? Office Of Economic Analysis, Rockvllle, MD, personal com-municatlm, I)mernber 1963.

Appendix E.— Method Used for OTA’s Analysis ofApplications to the National Institutes of Healthfor Small Business Innovation Research Grants
The data in table 31 (see ch. 4) are the result of anOTA analysis of the Small Business Innovation Re-search (SBIR) grant applications submitted to the Na-tional Institutes of Health (NIH) for funding in Oc-tober 1983. OTA obtained copies of all applicationssubmitted to NIH. A 50-percent-interval sample of ap-plications (one of every two) was selected for analy-sis. (The total sample of 297 was selected from the 593applications submitted. )
Using the Food and Drug Administration’s defini-tion of a medical device, OTA divided the NIH SBIRgrant applications into three categories:
• biotechnology applications (includes medical de-vice and other applications involving biotech-nology),
• medical device applications (includes medical de-vice applications not using biotechnology), and
• all other applications.An application was categorized as a biotechnology ap-plication if the proposed research and development in-
volved the use of recombinant DNA or other recentlydeveloped genetic, cell fusion, or bioprocessing tech-niques. An application was classified as a medical de-vice application if, first, it did not use biotechnologyand, second, it involved either research leading to theactual development of a medical device or researchinto techniques or products that would subsequentlybe used in the development of a medical device (i.e.,the development of new materials for use in a medi-cal device).
Because judgment was involved in categorizing theapplications, inter-rater reliability was tested by hav-ing an independent rater analyze 36 randomly selectedapplications from the sample (approximately 10 per-cent of the sample). The two independent raters agreedon 26 out of the 36 applications (72 percent). This issignificantly higher than the level that would be ex-pected by chance, but nevertheless allows a substan-tial level of variation.

Appendix F.—The Database of Venture Economics, Inc.,on Sources of Financial Capital
Venture Economics, Inc., the research and con-sulting division of Capital Publishing Corp., maintainsan extensive database of information on the U.S. ven-ture capital industry. The Venture Economics databasecurrently tracks investments by the leading venturecapital firms, both independent private and corporategroups, which account for more than 80 percent of theU.S. venture capital industry’s total investment activ-ity. In addition, the database covers the investmentactivities of Small Business Investment Corporations(SBICs) involved in classic venture capital type in-vestments. The database does include a small degreeof investment by foreign sources in U.S. companiesas well as investment from unidentified sources, someof which may be non-venture-capital institutionalfunding.
Through extensive data collection efforts, VentureEconomics has been able to research and computerizeinformation on more than 4,300 companies that havereceived venture capital financing since the 1960s. Ef-forts to date have focused on the computerization ofthe following information on each portfolio company:
●
●
●
●
●
●
company name and address, -
business description,industry or business codes including the Stand-ard Industrial Classification code and more spe-cific codes developed by Venture Economics,status of the firm (public or private),year founded, andfor each round of financing:— amount of financing,— date of the financing round,— stage of development of the company, and— venture capital investors.
Table 30 in chapter 4, which listed the percentageof U.S. venture capital funds invested in medical im-aging, other medical products, industrial products, andelectronics, was based on the Venture Economicsdatabase’s recorded venture capital investments for1982. Although the investments recorded by the Ven-ture Economics database do not account for all ven-ture capital investments (see table F-l), in aggregate,they do offer a representative picture of venture capi-tal investment activity. The categories of investors cov-ered by the database are presented in table F-2. Medi-cal imaging and the three other industry/productcategories mentioned above, which were used in table30 to classify firms receiving venture capital funds, are
shown in table F-3. Definitions of the stages of financ-ing used to categorize financing rounds in table 30 areshown in table F-4.
Table F.I.—Total Investments by the U.S. VentureCapital Industry, 1978-82 (millions of dollars)
——Investments
Total venture recorded by thecapital Venture Economics
Year investments database
1978 . . . . . . . . . . . . $ 550 $ 2821979 . . . . . . . . . . . . 1,000 5001980 . . . . . . . . . . . . 1,100 8031981 . . . . . . . . . . . 1,400 1,4001982 . . . . . . . . . . . . . 1.800 1,760
SOURCE: Venture Economics, Wellesley Hills, MA, “Venture Capital Investment inthe Medical Health Care Field;’ contract report prepared for the Officeof Technology Assessment, August 1983,
Table F-2.–Categories of Investor Types Covered bythe Venture Economics Databasea
Independent private (225 investors):Independent private fundsSBIC subsidiaries of private fundsCorporate financial (120 investors):SBIC and non-SBIC subsidiaries of financial groupsOther investments by financial groups including insurance
companies
Corporate industrial (125 investors):Venture capital funds wholly or jointly funded by
nonfinancial corporationsDirect corporate venture capital investorsSBIC subsidiaries of these industrial corporations
Nonaffiliated SBICs (140 investors):Public and private SBICs not affiliated with any of the
above investor types
Other (240 investors):b
Government affiliated groupsCommunity development corporationsUniversitiesIndividualsForeign investors—
aThe number of investors in each category includes investment groups that are nolonger actwe or that make only occasional investments.
bThe majority of these are United Kingdom funds that do not iflvest in the United
States on a regular basis.
SOURCE Venture Economics, Wellesley Hills, MA, “Venture Capital Investment Inthe Medical Health Care Field;’ contract report prepared for the Office~’ Technology Assessment, August 1983.
197

Table F-3.—Four Product Categories Used in theVenture Economics Database
Medical imaging:X-raysCT scanningUltrasound imagingNuclear imagingOther imaging
Medical products and services:Diagnostic (not including medical imaging):
Diagnostic servicesDiagnostic test products and equipmentOther diagnostic
Therapeutic:Therapeutic servicesSurgical instruments and equipmentPacemakers and artificial organsDrug delivery and other therapeutic equipmentOther therapeutic including defibrillator
Other medical or health related:Disposable productsHandicap aidsMonitoring equipmentOther medical or health related (not including pharmaceu-
ticals, fine chemicals, or hospital and other institutionalmanagement including management services andleasing)
Industrial products:Advanced materials (including production processes)Industrial automationIndustrial equipment and machineryChemicalsPollution and recycling equipmentOther industrial products
Other electronics industry segments:Electronic components:
SemiconductorsMicroprocessorsControllersCircuit boardsDisplay panelsOther electronic components
BatteriesPower suppliesElectronics-related equipment:
Semiconductor fabrication equipment and wafer productsComponent testing equipmentOther electronics-related equipment
Laser relatedFiber opticsAnalytical and scientific instrumentation:
Chromatography and related laboratory instrumentation(including spectrometers)
Other measuring devices (including infrared gas analyzers,moisture analyzers)
Other analytical and scientific instrumentationOther electronics-related equipment:
Military electronics (excluding communications)CopiersCalculatorsOther electronics related
SOURCE: Venture Economics, Welieeley Hiils, MA, “Venture Capital Investmentin the Medical Health Care Field,” contract report prepared for theOffice of Technology Assessment, August 19S3.
Table F-4.-Definitions of Stages of VentureCapital Financing
Early stage:Seed—A relatively small amount of capital provided to an
inventor or entrepreneur to prove a concept. It may involveproduct development but rarely involves initial marketing.
Startup-Financing provided to companies for use in productdevelopment and initial marketing. Companies may be in theprocess of being organized or have been in business a shorttime (1 year or less), but have not sold their productcommercially. Generally such firms would have assembledthe key management, prepared a business plan, and mademarket studies.
First stage—Financing provided to companies that haveexpended their initial capital (often in developing a prototype)and require funds to initiate commercial manufacturing andsales.
Expansion:Second stage—Working capital for the initial expansion of a
company which is producing and shipping and has growingaccounts receivable and inventories. Although the companyhas clearly made progress it may not yet be showing a profit.
Third stage—Funds provided for the major growth expansionof a company whose sales volume is increasing and whichis breaking even or profitable. These funds are utilized forfurther plant expansion, marketing, and working capital ordevelopment of an improved product.
Fourth stage—The last round of private financing prior to, butnot in anticipation of, a public offering or prior to the pointat which a company can qualify for credit-oriented institutionalterm financing. This round may enable institutional termfinancing or may involve turnaround aspects.
Bridge financing— Financing for a company expecting to gopublic within 6 months to a year. Often bridge financing isso structured that it can be repaid from proceeds of a publicunderwriting. It can also involve restructuring of majorstockholder positions through secondary transactions. Thiswould be done if there were early investors who wanted toreduce or liquidate their positions, or if management hadchanged and the stockholdings of former management, theirrelatives and associates, were to be bought out to relievepotential overhead stock supply when public.
Leveraged buyouts and acquisition:Acquisition for expansion —Funds provided to a firm to finance
its acquisition of another company.Management/leveraged buyout—Funds provided to enable
operating management to acquire a product line or business(which may be at any stage of development) from either apublic company or private company (often such companiesare either closely held or family-owned). This usually involvesrevitalization of the operation, with entrepreneurialmanagement acquiring a significant equity interest.
otherTurnaround—Financing provided to a company at a time of
operational or financial difficulty with the intention of “turningaround” or improving the company’s performance.
Secondary purchase—Purchase of securities from anotherventure capital firm, other stockholders, or on the openmarket.
SOURCE” Venture Economics, Wellesiey Hiils, MA, “Venture Capital Investmentin the Medical Health Care Field, ” contract report prepared for theOffice of Technology Assessment, August 19S3.

Appendix G. —Tax Policy and Research and Developmenton Medical Devices1
Introduction
Much attention has been paid to potential effects oftax policy on incentives for innovation. Renewed in-terest in this question has recently been prompted byenactment of the Economic Recovery Tax Act of 1981(ERTA) and the Tax Equity and Fiscal ResponsibilityAct of 1982 (TEFRA). As a result of both ERTA andTEFRA, basic changes were made in both the personaland the corporate income tax including: 1) changes inmarginal tax rates on personal income, 2) changes inthe tax rules for depreciation of capital goods, and 3)enactment of new provisions applying to research anddevelopment (R&D).
Assessing the impact of these tax changes on the fi-nancial incentives for innovation generally, let aloneinnovation in medical devices, is extremely complex.However, it is possible to identify two distinct waysin which tax policy changes such as ERTA and TEFRAcan affect incentives for innovation. First, tax incen-tives may alter the expected after-tax returns receivedby prospective purchasers of goods that embody in-novations, thereby stimulating, or inducing, the de-mand for such innovations. Second, both personal andcorporate income taxes will cause after-tax prices incapital markets to diverge from pre-tax prices. Boththe size of this divergence and its pattern among dif-ferent types of investments may influence the will-ingness of firms and individuals to invest in R&D andinnovation.
Taxes and Induced Innovation
There is some evidence that the level of innovativeactivity in the development of particular goods isrelated to the overall level of demand for those goods.A particularly important example of such induced in-novation is the case of capital goods innovation, whereseveral empirical studies have shown that the level ofcapital spending by industry affects the level of innova-tion in capital goods (273, 276). Because ERTA/TEFRApermit firms to deduct the costs of depreciable assetsmore rapidly than was previously allowed, these taxpolicy changes are expected to stimulate greater capi-tal spending by industry. According to the induced-innovation hypothesis, such increased capital spendingshould also stimulate innovative activity among thosefirms producing capital goods.
1This appendix was written for OTA by Barth and Cordes (27).
Many medical devices are clearly capital goods.However, the market for medical devices differs fromthe market for other capital goods in one importantrespect. Because many of the purchasers of medicaldevices are not subject to taxation, their demands formedical devices should not be directly affected by taxrules governing depreciation of capital goods. Thus,the tax provisions of ERTA/TEFRA may be expectedto have a smaller impact on the capital spending deci-sions of purchasers of medical devices than of pur-chasers of other capital goods.
This situation implies that any induced innovationattributable to ERTA/TEFRA will also be less in thecase of medical devices than other capital goods. Ofcourse, TEFRA contained a section specific to Medi-care payment of hospitals, which, with its subsequentmodifications under the Social Security Amendmentsof 1983 (Public Law 98-21), dramatically altered theincentives of hospitals to purchase medical technology(see ch. 3 for details).
Another, perhaps more important, way in which thetax code can affect the demand for medical devices isthrough the tax treatment of employer-paid healthbenefits. Because such benefits are typically treated asnontaxable fringe benefits, employees, particularlythose facing high marginal tax rates, have a tax incen-tive to receive part of their labor compensation in theform of such benefits. The growth of health benefitplans has been one of a number of factors contribut-ing to growth in demand for health services during thepostwar period, and this growth in demand may alsohave encouraged innovations in medical devices.
Although the tax-exempt status of fringe benefits hasnot been affected by ERTA/TEFRA, there has beensome support for changes in tax law which would limitthe tax exemption currently enjoyed by all fringebenefits, included employer-paid health benefits. Ifthese changes were enacted, it is likely that both thelevel and composition of demand for health serviceswould be affected, and this change in turn could havesome impact on the level and type of R&D in the med-ical devices industry.
Taxes and Suppliers of Innovation
The ultimate suppliers of innovations are the in-dividuals or firms who choose to allocate resources toR&D rather than to other investment projects. In part,such choices are made outside the boundaries of thefirm in external capital markets by individual investorswho must decide how to allocate their portfolios of
199

200 • Federal Policies and the Medical Devices Industry
wealth among different investments. In part, suchchoices are made within the firms by managers whomust choose among competing uses of a firm’s capitalbudget. In both cases, however, the tax treatment ofdifferent investment options is an important factor inthe ultimate investment decision.
Two alternative investments may be equally pro-ductive before the income from such investments istaxed and yet earn different after-tax returns if one in-vestment is taxed relatively more heavily than theother. In such an event, two investments which areequally attractive insofar as social returns are con-cerned are not equal in the eye of the prospective in-vestor, who will choose the investment with the higherafter-tax return.
In the case of R&D investments, there are two prin-cipal ways in which the tax code affects their after-tax return compared to other investment activities. Thefirst is the tax treatment of capital gains. The secondis the tax treatment of inputs specific to the innova-tion process.
Taxation of Capital Gains
The expected returns on an investment may berealized through annual flows of income, through cap-ital gains or losses resulting from changes in the assetprice of the investment, or through some combinationof annual flows and changes in asset values. In theabsence of taxation, the manner in which the returnwas expected to be received would be irrelevant to theultimate investment decision. All that would matterwould be the total expected return (annual expectedflows plus or minus capital gains and losses) and theexpected risk (the variance of realized returns aroundthe total expected return). However, because capitalgains and capital losses are treated differently fromincome under U.S. income tax, investments whosereturns are realized primarily through capital gains orcapital losses will be evaluated on a different after-taxbasis from investments whose returns are realizedthrough annual flows of ordinary income.
At present, capital gains are not taxed until they areactually realized into cash through sale of the asset.More importantly, if the asset is held for longer than1 year, the capital gain that is realized is taxed at arate which is generally 40 percent of the tax rate ap-plied to ordinary income. Thus, for example, if a per-son’s tax rate on ordinary income were the maximumrate of 50 percent, the tax rate applied to each dollarof long-term capital gain would be 20 percent. If theinvestment should prove unsuccessful, and a capitalloss is realized, the loss maybe offset dollar for dollaragainst capital gains. However, if reported capital
losses are greater than the capital gains, the net capi-tal loss may be only partially applied as a deductionagainst ordinary income.
In effect, the U.S. tax system provides preferentialtreatment to investments which pay off in the formof capital gains, while providing less than completetax offsets to investments which result in capital losses.Assessing the impact of such a system on the propen-sity of investors to take risk—and by implication toinvest in innovative activities—is an extremely com-plex task, and the conclusions that emerge from suchan assessment depend on the standard used for com-parison.
If the alternative is a tax system which taxed capi-tal gains in full but also allowed full and completedeductibility of capital losses, it would be impossibleto ascertain on theoretical grounds which of the twotax regimes—the current one, or the alternative-is themost favorable to risk-taking because the differenceswould work in opposite directions. However, com-pared with an alternative system which taxed capitalgains the same as ordinary income but continued toallow only partial tax offsets for capital losses, pref-erential tax treatment of capital gains encourages morerisk-taking. That is, given that loss offsets are incom-plete, partial rather than full taxation of capital gainsmay be one way of preserving incentives for risk-taking.
Two groups of individuals for whom the tax treat-ment of capital gains would appear to be particularlyimportant are the entrepreneur-founders of new ven-tures and the venture capitalists who provide exter-nal financing to such ventures. Those who choose tobecome entrepreneurs have in effect chosen to forgorelatively certain returns to their human capital (i. e.,labor) which could be earned from salaried employ-ment, as well as returns to any personal financial cap-ital they invest, in order to develop an idea or inven-tion into a new product or service.
Presumably, this decision is motivated by a varietyof considerations and is certainly not limited to taxfactors. However, the fact that the expected returnsto entrepreneurship will typically be realized in theform of increases in the value of the entrepreneur’sownership share in the firm, which in turn will be taxedfavorably as capital gains, would at the margin en-courage rather than discourage entrepreneurship. In-deed, there is some empirical evidence that the pref-erential tax treatment of capital gains has influencedthe decision of individuals ’between salaried employ-ment and entrepreneurship (151).
Similar considerations apply to individual venturecapitalists. Although such persons are not themselvesactively engaged in the development of innovations,

App. G—Tax Policy and Research and Development on Medical Devices ● 201
they typically share in both the risks and rewards ofentrepreneurship through equity participation in theentrepreneurial firm. The fact that any returns to suchparticipation are likely to be realized through apprecia-tion in stock values, and therefore to be taxed fa-vorably as capital gains, would, at the margin, en-courage the commitment of venture capital.
Data provided to OTA on the organized venturecapital market suggest that venture capitalists are morelikely to commit funds to the early stages of firm de-velopment in the case of medically oriented venturesthan they are in the case of other industrial ventures(see table 30 in ch. 4). The data also show that capitalprovided to medical device ventures is more likely tocome from private, independent sources than fromcorporations or small business investment companies(443). These two considerations imply that individualtax incentives which encourage the commitment of riskcapital may be of special importance to innovation inmedical devices.
Finally, the current tax treatment of capital gainsinteracts with the double-taxation of dividends at thecorporate level to encourage earnings retention ratherthan dividend payout. If earnings are paid out individends, such income will be taxed in full at ordinaryincome tax rates. However, if the earnings are retainedand reinvested, stockholders can defer paying personaltaxes until any expected capital gains are realizedthrough sale of stock, and then do so at preferentialcapital gains tax rates. As a result, the effective taxon income from corporate equity is less under earn-ings retention than under dividend payout. At themargin, this encourages firms to retain earnings and,if retained earnings are an important source of fundsfor some innovations, enhances the financial resourcesavailable for innovative activities.
The current tax treatment of capital gains would ap-pear to provide benefits to investments in medical de-vice innovations which are equal to those provided toother risky investments, However, the overall valueof the tax preference on capital gains to the highestincome investors has been somewhat reduced by ERTA,which lowered the maximum tax rate on “unearnedincome” from 70 to 50 percent.
Corporate Tax Policy
In the case of relatively established firms, the deci-sion to engage in R&D requires that resources be usedto develop and produce a new product which couldinstead be used to enhance the firm’s ability to pro-duce its existing products. If the firm’s ultimate objec-tive is to maximize its value, this implies that capitalshould be allocated to R&D up to the point where thelast dollar allocated earns a risk-adjusted expected
after-tax return equal to that earned from a dollar in-vested in a more traditional investment activity.
If the tax code is neutral in its treatment of the pro-ductive inputs used in different investment projects,tax considerations will not influence the firm’s alloca-tion of capital among competing investment activities.However, if the tax code favors the use of certain in-puts, and if these favored inputs are specific to cer-tain types of investment projects, tax considerationswill affect the amount of capital allocated to differentprojects. In effect, investments that use tax-favored in-puts will be encouraged, because they will need to earna lower pre-tax return in order to earn a given after-tax return than will investments that do not use tax-favored inputs.
Tax Treatment Before and After ERTA/TEFRA.–In the case of R&D, the issue is whether the inputs usedfor R&D are treated more or less favorably than in-puts used in other investment activities. The two prin-cipal inputs needed to develop innovations are tangi-ble capital in the form of depreciable assets and intangiblecapital arising from expenditures on R&D.
Prior to the enactment of ERTA/TEFRA, tangiblecapital used in conducting R&D was treated the sameas tangible capital used for other purposes. Firms usingsuch capital were entitled to claim an investment taxcredit on new equipment, but not structures, and couldthen claim a stream of depreciation deductions overa number of years based on guidelines established bythe Department of Treasury. However, neither theamount of the investment credit nor the speed at whichthe asset could be depreciated were related to the typeof investment project in which the asset was used—i.e., to whether the asset was used in R&D or in a moretraditional investment activity.
Other costs of R&D were, however, given specialtreatment. Specifically, section 174 of the Internal Rev-enue Service Code allowed the salaries and expensesincurred to develop R&D to be deducted immediatelyin the year incurred. This “expensing” of R&D wasviewed as preferential treatment because R&D sala-ries and expenses were seen as part of the costs of ac-quiring an intangible asset which was capable of pro-viding services to the firm over a number of years.Under this view, expensing confers favorable tax treat-ment on R&D activities.
Enactment of ERTA/TEFRA has altered the relativeposition of different kinds of investments in threeways. First, though the rules governing R&D expens-ing were not changed by ERTA/TEFRA, the rulesgoverning depreciation of other capital assets havebeen liberalized considerably by adoption of the Ac-celerated Cost Recovery System (ACRS). Second, forthe first time, tax depreciation rules treat equipmentused in R&D as different from equipment used in other
25-406 0 - 84 - 14

202 ● Federal Policies and the Medical Devices Industry
activities. Third, for the first time, R&D outlays whichqualify for expensing may also qualify for a tax credit.In the remainder of this section, we examine how thesemeasures-both singly and in combination-affect therelative attractiveness of innovative investments gen-erally, and innovation in medical devices specifically.
Accelerated cost recovery. ACRS, enacted as partof ERTA with some modifications in TEFRA, speedsup the rate at which the costs of using depreciableassets may be recovered.
Depreciable capital assets (e.g., equipment andbuildings) are important inputs into R&D. However,the capital intensity of R&D differs among projects sothat the impact of changes in cost recovery rules willbe greater for some types of R&D projects than forothers. Liberalized cost recovery favors R&D projectsthat are relatively capital-intensive.
Detailed data on the capital intensity of R&D in dif-ferent industries do not exist. However, NationalScience Foundation (NSF) data can be used to con-struct a crude index of factor intensity in R&D: theratio of R&D expenditures to scientists and engineersemployed in R&D. Other things being equal, this ratioshould be higher in industries in which R&D is morecapital-intensive. Based on this ratio, one may there-fore ascertain whether R&D activities in any given in-dustry benefit relatively more or less from ACRS.
While NSF data do not permit the above ratio tobe calculated specifically for medical device producers,the ratio can be calculated for producers of optical,surgical, and photographic equipment (Standard In-dustrial Classification (SIC) codes 383-387). Between1976 and 1979, the R&D capital-intensity ratio for thisindustry group exceeded the average ratio for all man-ufacturing industries. This suggests that the R&D in-vestments of medical device producers in these SICcodes benefit relatively more from ACRS than do R&Dinvestments of other manufacturers.
The overall effect of the ACRS on R&Din medicaldevices is unclear, however, because ACRS moves thetax treatment of non-R&D capital closer to that ofR&D expensing. This reduces the relative attractive-ness of using business funds for R&D expenditures thatqualify for expensing. While ACRS has a scale effectfavorable to all investment projects using depreciablecapital, it has a substitution effect which tends to fa-vor capital investments that do not involve R&D (27).That is, while ACRS reduces effective tax rates on allinvestments, it reduces them more for investment proj-ects which are relatively less intensive in the type ofR&D which qualifies for expensing. The net effect of
the two effects on R&D in medical devices is unknown.Special treatment of R&D equipment, One provi-
sion of ACRS which applies specifically to depreciable
assets used in R&D is the assignment of all R&D equip-ment to the “3-year recovery class.” Because of thisprovision, all equipment used in R&D must be depre-ciated over 3 years, even though the ACRS guidelineswould normally require that the same equipment bedepreciated over a longer period of time if used forother purposes. Because non-R&D equipment is as-signed to either the 5- or 10-year recovery class, thisprovision would appear to favor R&D by allowing thecapital costs of equipment to be deducted more rapidlyif the equipment is used for R&D rather than in otheractivities. However, while equipment used in R&Dmay be written off more rapidly, all equipment in the3-year recovery class qualifies for a smaller investmenttax credit—6 percent—than equipment in the longerlived asset classes, which is eligible for a 10-percentinvestment credit.
Under ERTA, the disadvantage of receiving a smallerinvestment credit was large enough to offset the advan-tage of more rapid writeoff. However, because ofchanges made in TEFRA which reduced the value ofthe writeoff, this no longer appears to be the case.Given the current set of tax rules, the net effect ofgrouping R&D equipment into a special recovery classis favorable to equipment used in R&D. (For a moreelaborate discussion, see Barth, Cordes, and Tassey,1984 (27); Collins, 1983 (65); Zakupowsky and Sunley,1982 (466).)
Tax credit for incremental R&D. As a result ofERTA, firms can also claim a tax credit for certainR&D spending. The amount of the credit equals 25 per-cent of the amount of which “qualified research ex-penses” during a year exceed the base period level ofsuch expenses. The base period level is the averagequalified expenses of the 3 preceding years, whilequalified expenses are those defined in keeping withsection 174 (the R&D expensing provision). If the firmpays other parties to conduct R&D, 65 percent of suchpurchases are deemed to be qualified research expenses.The R&D credit is scheduled to expire as of January1, 1986.
Predicting the impact of the existing R&D tax creditis difficult for two reasons. First, the R&D credit istemporary rather than permanent. Second, the amountof the credit is based on incremental rather than totalexpenditures. A detailed analysis of the effect of theR&D credit is beyond the scope of this discussion (seeBarth, Cordes, and Tassey, 1984 (27) for a completetreatment), but it is possible to make a rough assess-ment of the benefits which producers of medical de-vices have thus far derived from the R&D credit inrelation to firms in other industries.
In a preliminary sample of 1981 tax returns takenby the Department of Treasury, producers of optical,

App. G—Tax Policy and Research and Development on Medical Devices ● 203
medical, and ophthalmic goods claimed R&D creditsequal to 5.4 percent of total eligible R&D spending,while the corresponding figure for producers of otherelectrical equipment, including manufacturers of elec-tronic medical devices, was approximately 3.5 percent(418). These percentages may be compared with thepercentage for all of the manufacturing firms sampled,which was 4.8 percent.
Results reported by Eisner and colleagues for 1981,based on data in the Compustat tapes, are qualitativelyconsistent with these estimates. Specifically, Eisner andcolleagues calculate that firms in the NSF industrygroup “optical, surgical, and other instruments” claimedR&D tax credits equal to 4.6 percent of eligible R&D,as compared with all manufacturing firms, whichclaimed R&D credits equal to 3.3 percent of eligibleR&D (98a). However, their predictions for 1982 basedon simulations indicate that producers of optical, sur-gical, and other instruments would be eligible to claimR&D credits equal to only 2.6 percent of qualifyingR&D, as compared with all manufacturing firms,which would be able to claim credits equal to 2.8 per-cent of eligible R&D spending.
The differences reflect differences among the sam-pled firms in the rate of growth in eligible R&D. How-ever, because the numbers pertain only to eligibleR&D, they provide but a partial view of the relativeimpact of the R&D credit. The reason is that total R&Dspending consists both of outlays for eligible R&D andoutlays for R&D depreciable capital. Unfortunately,because R&D depreciable capital does not qualify forspecial tax treatment, firms are not required to reportthis component of R&D in their tax returns. Hence,it is difficult to estimate precisely the amount of R&Dclaimed as a percent of all R&D.
A crude estimate of this latter magnitude may beobtained as follows. In the case of all manufacturingfirms, it has been estimated that total company R&Dspending equals roughly 2 percent of sales (423). How-ever, the total amount of eligible company R&D re-ported by manufacturing firms in the Treasury sam-ple equals only about 0.66 percent of the receiptsreported by the firms (418). This figure suggests thateligible R&D spending equals roughly 33 percent ofall R&D spending by firms in the sample. In this case,
the amount of R&D credits claimed as a percentageof all R&D spending would be 1.6 percent (one-thirdof 4.8 percent).
By comparison, NSF estimates that producers of op-tical, medical, and surgical instruments that performR&D spend amounts on R&D which equal roughly 5percent of sales (423). The total amount of eligibleR&D reported by sampled producers of optical, med-ical, and ophthalmic goods equaled 0.8 percent ofreported receipts. Thus, eligible R&D equaled roughly16 percent of all R&D spending by this group of firms,so that the amount of R&D credits claimed as a per-centage of all R&D would be 0.9 percent. With thesame procedure it is estimated that producers of otherelectrical equipment (including medical electronicdevices) claimed credits equal to 0.5 percent of totaleligible R&D.
Thus, as a percentage total of R&D spending, theamount of R&D credit claimed by medical device pro-ducers may be less than that claimed by all manufac-turing firms. Of course, the industry classificationsmake it difficult to generalize about medical devicesper se. The difference arises because eligible R&D maybe a smaller share of total R&D among medical de-vice producers than it is among all manufacturingfirms.
Conclusion
The analysis above suggests that the current tax sys-tem is generally favorable to R&D investments, butthe incentives differ both among different types of in-novation and among different phases of the innova-tion process. With respect to medical devices, thelimited data available suggest that R&D is relativelycapital-intensive. Consequently, medical device R&Dshould benefit somewhat more than other industries’R&D from the recent liberalization of tax depreciationallowances. However, to the extent that the innovativeprocess in medical devices is more capital-intensive,the incentive effects of the incremental tax credit forR&D may be somewhat less for medical device pro-ducers than it is for firms whose R&D is more 1abor-intensive, because the special tax treatment of R&Ddoes not apply to capital expenditures.

Appendix H.— Consensus Standards Related toInternational Trade in Medical Devices1
IntroductionThe ability to market medical devices effectively
outside the United States depends partly on regulatorycontrols imposed by the U.S. and foreign governmentsand on standards or specifications set by local, na-tional, and international bodies. Most nations, in-cluding the United States, use regulations and prod-uct standards to control the sale of medical devices,both foreign and domestic. Although the need to pro-tect public health and safety provides justification forgovernmental regulation, governmentally imposed re-quirements relating to standards, certifications, inspec-tions and testing may create nontariff trade barriers.
Standards based on one nation’s technology may bydefinition exclude foreign products. Testing and ap-proval procedures, developed and required for domes-tic use, may be conducted in such a way as to inor-dinately increase importers’ expenses. The internalorientation of certification systems may serve to limitaccess for imports or deny certification to importedproducts (379). These factors underscore the impor-tance of international cooperation and coordinationin standards-related activities.
The General Agreement on Tariffs and Trade (GATT)is the principal multilateral instrument that sets agreedrules for international trade. Its basic aim is to lib-eralize world trading practices through reduction oftariff and nontariff trade barriers. GATT, concludedin 1948 and currently subscribed to by 87 nations, pro-vides a continuing forum for multilateral discussionsand negotiations on trade matters. In contrast to earlierrounds of negotiations which focused almost exclu-sively on tariff issues, the “Tokyo Round, ” completedin 1979, focused on reducing or removing nontariffbarriers to trade and resulted in six major agreementsdealing with nontariff matters. One such agreement—The Agreement on Technical Barriers to Trade (or“Standards Code’’)—is of particular importance tothe medical devices industry and currently has moresignatories than any other GATT code (see table H-1). The Standards Code establishes international prin-ciples governing the development, adoption, or ap-plication of any standard or certification system bythe signatories and thereby seeks to eliminate the useof standards and certification systems as nontarifftrade barriers (379). Title IV of the Trade AgreementsAct of 1979 (19 U.S.C. § 2501 et seq. ) approved U.S.acceptance of the Standards Code and served to im-plement the code in the United States.
1This appendix was drawn from a paper prepared for OTA by Lepon andGawron (193).
204
This appendix explores how established interna-tional trade agreements (such as GATT) and Federallaws (such as the Trade Agreements Act) have affectedtrade in medical devices, specifically as they relate tothe development and application of standards. Thisappendix also describes organizations and agencies in-volved in medical device standards-setting procedures,their procedures, the effect of implementing theirstandards, and U.S. Government responsibilities instandards-setting.
Standards-Setting Organizations
U.S. Voluntary Consensus Organizations
Standards for medical devices in the United Stateshave traditionally been developed in the private sec-tor by professional organizations, trade associations,and voluntary standards organizations. These volun-tary consensus standards are nonbinding standards de-veloped by consensus among voluntary participantssuch as consumers, manufacturers, professional asso-ciation representatives, physicians, clinical technicians,hospitals, and other users (117). Besides the organiza-tions described below, additional ones represent spe-cific interest groups such as hospitals, hospital sup-
Table H-1 .—Signatories to the Standards Codea
Argent inaAustriaBelgium b
BrazilCanadaChileCzechoslovakiaDenmarkb
EgyptEuropean Economic
Community b
FinlandFranceb
Federal Republic ofGermany b
Greece c
HungaryIndiaIrelandb
Italy b
JapanKoreaLuxembourg b
Netherlands b
New ZealandNorwayPakistanPhilippinesRomaniaRwandaSingaporeSpainSwedenSwitzerlandTunisiaUnited Kingdomb
Hong KongUnited StatesYugoslavia
a–As of N& 1, 1983.b~he Standards Code is adhered to by the European Economic COmmunity, inaddition to being adhered to by the 10 member states of the community,
SOURCE U.S. Executive Office of the President, Office of the U.S. TradeRepresentative, “Status of Tokyo Round MTN Agreement Signaturesand Acceptances, ” Nov. 1, 1983,

App. H—Consensus Standards Related to International Trade in Medical Devices . 205
pliers, health industry manufacturers, mechanicalengineers, dentists, and pathologists (see table H-2).Some of these organizations develop standards for useby their own membership or have representatives onthe boards and committees of other standards-settingorganizations.
American National Standards Institute, Inc. (ANSI).–ANSI is a private, nonprofit federation of standards-developing organizations and standards users. Foundedin 1918, ANSI has been established over the years asthe primary U.S. organization for sanctioning and ap-proving voluntary standards in many fields. ANSI ap-proves the American National Standards, a compila-tion of standards widely accepted by manufacturers,product purchasers, and other professional organiza-tions. ANSI has delegated the planning and coordi-nation of standards in the medical device field to itsMedical Devices Standards Management Board, whichis composed of representatives from professional so-cieties, trade associations, Government agencies, andgeneral interest groups.
Through this board, ANSI has approved nearly 200standards for medical devices, primarily by accreditingthe standards developed by other organizations. Thesestandards include many for devices used for cardio-vascular surgery, neurosurgery, ophthalmology, or-thopedics, dentistry, anesthesiology, thoracic surgery,respiratory assistance, and in vitro diagnostic prod-
Table H-2.-Additional U.S. Organizations Involved inVoluntary Standards Setting for Medical Devices
American Academy of AllergyAmerican Association for Clinical ChemistryAmerican Association of Blood BanksAmerican Association of ImmunologistsAmerican Dental AssociationAmerican Heart AssociationAmerican Hospital AssociationAmerican Institute for Ultrasound in MedicineAmerican Psychiatric AssociationAmerican Society for Artificial Internal Organs, Inc.American Society for MicrobiologyAmerican Society of Mechanical EngineersAmerican Thoracic SocietyCollege of American PathologistsCompressed Gas AssociationHealth Industry Manufacturers AssociationHearing Industries AssociationIlluminating Engineering SocietyInstitute of Electrical and Electronics EngineersNational Council on Radiation Protection and MeasurementsNational Electrical Manufacturers AssociationNational Sanitation FoundationPharmaceutical Manufacturers AssociationScientific Apparatus Makers AssociationSOURCE: J, Lepon and E. Gawron, Kornmeier, McCarthy, Lepon, and Harris,
“Medical Device Standards and International Trade,” contract reportprepared for the Office of Technology Assessment, 1983.
ucts. ANSI also represents the United States in inter-national standards-setting bodies, most notably the In-ternational Electrotechnical Commission (IEC).
ANSI coordinates standards to eliminate duplica-tion among those developed by different organiza-tions. In addition, it serves as a clearinghouse to pro-vide standards developers with information on theprocedures and activities of other standards developers.
Before a standard can receive the American NationalStandards designation, it must be reviewed by ANSI’sappropriate committees. To this end, ANSI solicitscomments from interested parties on the proposedstandard in an effort to ensure that its due process re-quirements are met. If, as is sometimes the case, otherrecognized national standards already exist, ANSI willwork to harmonize the standards so as to eliminateany overlap in content and ensure that a voluntaryconsensus can be achieved among the affected orga-nizations.
Association for the Advancement of Medical In-strumentation (AAMI).—AAMI is a nonprofit, pro-fessional association formed in 1967 and comprised ofindividuals, hospitals, health care facilities, profes-sional and medical societies, Government agencies,manufacturers, and research and educational institu-tions concerned with the development, evaluation, andapplication of medical devices. Approximately 40 med-ical device standards, process guidelines, and recom-mended practices concerning such areas as critical careinstrumentation are currently under development, and11 are available in final form. AAMI carries out itswork through technical committees composed of bothmedical device manufacturers and medical device usersin an attempt to balance representation by the groupswhich will potentially be affected by any approvedstandards.
AAMI participates in the international standards-setting activities of organizations like the InternationalOrganization for Standardization (ISO) and IEC throughits membership in ANSI. At the request of ISO andIEC, AAMI has placed its members on their technicalcommittees. For instance, an AAMI participant sits onISO’s technical subcommittee for cardiovascular im-plants and represents the view of AAMI members.
American Society for Testing and Materials (ASTM).—ASTM, founded in 1898, is a nonprofit, nongovern-mental organization involved in developing voluntaryconsensus standards. In medical devices, its standardsprimarily, but not exclusively, relate to materials usedto manufacture devices. ASTM has over 30,000 indi-vidual members representing Government agencies,private physicians, hospitals, public and private lab-oratories, and medical device manufacturers. ASTMstandards provide guidance in determining the biocom-patibility of materials; define the properties and char-

206 • Federal Policies and the Medical Devices Industry
acteristics of such materials as plastics, metals, andceramics; and establish testing methods and recom-mended handling practices for medical and surgical in-struments. Nearly 30 technical committees are involvedin reviewing and developing standards for medical sur-gical materials and devices.
National Fire Protection Association (NFPA).–NFPA is an independent, voluntary, nonprofit orga-nization established in 1896 to protect people and theirenvironment from destructive fires. NFPA’s member-ship is comprised of interested individuals and repre-sentatives of national trade and professional organi-zations. A primary function is the development ofsafety standards and codes that eventually become partof the National Fire Codes, a multivolume set of final,approved NFPA standards.
In 1975, NFPA established a health care section toassist in the development of standards that may helpto prevent fires in medical facilities. NFPA also en-courages safe use of medical devices, particularly elec-trically powered medical devices, in patient areas. Itparticipates in many other standards-setting organi-zations by placing its members or organizational staffon their technical committees. For instance, NFPA isan active participant on ASTM’s committee on thehazard potential of chemicals and ASTM’s subcom-mittee on flammability and ignition testing, AAMI’ssubcommittees on electrical safety and monitoringdevices, and the U.S. Veterans Administration (VA)Advisory Committee on structural safety of VA facil-ities. Through its membership in ANSI, NFPA alsoassists in the review and development of the Ameri-can National Standards and participates in the inter-national standards development activities of IEC.
NFPA standards for safety have been widely ac-cepted by States and local governments in establish-ing regulations for licensing of medical facilities andfor regular building inspections. Although NFPA stand-ards are voluntary, their adoption by the regulatoryagencies of State and local governments have madesome of them mandatory.
National Committee on Clinical Laboratory Stand-ards (NCCLS).—NCCLS is a private, nonprofit cor-poration devoted to upgrading health care by improv-ing the quality of clinical laboratory methods and byproviding acceptable guidelines and standards for clin-ical laboratories. NCCLS was founded in 1968 by rep-resentatives of the clinical laboratory services profes-sions, the Federal and State Government agencies withresponsibilities for public health, and diagnostic prod-ucts companies that provide the reagents, instruments,and systems used in clinical laboratory identificationand measurement. Its members work to produce volun-tary consensus standards through numerous technicalcommittees.
NCCLS coordinates the process by which nationalconsensus on clinical laboratory standards is achieved,and thus expedites the process by which NCCLS stand-ards become adopted as national and internationalstandards. It works closely with its European counter-part, the European Committee on Clinical LaboratoryStandards, as well as with the International Organiza-tion of Legal Metrology, and ISO in developing andharmonizing international standards.
Underwriters Laboratories, Inc. (UL)—UL is an in-dependent not-for-profit corporation established in1894 to help reduce or prevent bodily injury, loss oflife, and property damage. UL has developed stand-ards and requirements covering medical and dentalequipment intended for professional use by personnelm hospitals, nursing homes, medical care centers, med-ical and dental offices, and other health care facilities.
UL’s standards for safety are based on research andcooperation by engineers, manufacturers, consumers,and recognized specialists in many fields. Many ULstandards for safety are recognized as American Na-tional Standards by ANSI. UL is a member of ANSIand assists in the review and development of Ameri-can National Standards. Its staff members serve ontechnical committees and subcommittees of variousdomestic standards developing organizations such asASTM and NFPA, as well as international organiza-tions such as IEC and ISO.
UL standards and requirements are the basis onwhich UL’s registered certification mark may be affixedto complying products by subscribers to UL’s services.This system of marking is recognized by consumers,regulatory authorities, and others who seek and relyon third-party certification of products with respectto safety. Federal, State, and municipal authorities, ar-chitects, building owners, and consumers may requirelisting or classification by UL as a condition of theiracceptance of a device, system, or material having abearing upon risk of fire, shock, or other injury to per-sons or property. Although UL standards for safetyare voluntary, adoption by regulatory agencies hasmade some of them mandatory (109).
International Organizations
International Organization for Standardization(ISO).–ISO, formed in 1947, is an organization of na-tional standards institutes involving over 84 countries.Its objective is to promote development of worldwidestandards for the purpose of “facilitating internationalexchange of goods and services and to develop mutualcooperation in intellectual, scientific, technological,and economic ability” (169).
ISO recognizes ANSI as the representative memberbody for the United States. Other U.S. standards-

App. H—Consensus Standards Related to International Trade in Medical Devices • 207
setting organizations, including various Federal Gov-ernment agencies and representatives of manufac-turers, participate in many of ISO’s technical commit-tees that are concerned with medical devices. Thesegroups together comprise the U.S. delegation to theinternational organization. Members participate onsuch technical committees as dentistry, implants forsurgery, mechanical contraceptives, prosthetics, andtransfusion equipment.
The development of international standards, ofwhich there are nearly 200 relating to medical devices,is a slow, deliberative process. First, draft proposalsare submitted by interested national standards orga-nizations or individuals to technical committees forstudy. Most of the work of reviewing these proposalsis done through correspondence with its members. Theprocess of approving a standard may take as long as6 or 7 years, but most proposed standards take about3 years to gain approval as an International Standard.
Once a standard has become an International Stand-ard, many national standards institutes and govern-ments often seek to adopt it as their national stand-ard as well. For example, ANSI, working through itsAmerican Dental Association members, has adoptedthe ISO standard for dental zinc silico-phosphate asan ANSI standard (ANSI/ADA 21-1981). The reversecase has also occurred, in which a specific national orregional standard has become an International Stand-ard. This situation is becoming more common as manyaggressive national and regional standards organiza-tions attempt to have their own standards accepted in-ternationally. For example, AAMI has introduced itsdraft standard for implantable ventricular pacemakers(AAMI 1P) to ISO, which in turn accepted it as a draftInternational Standard (ISO 5841.1).
International Electrotechnical Commission (IEC).–IEC was formed in 1906. In accordance with a formalagreement between IEC and ISO, questions related tointernational standardization in the electrical and elec-tronic engineering fields are reserved to IEC and othersubject areas are the responsibility of ISO. If ISOundertakes an international standardization matterunrelated to a particular technology, it consults IECto safeguard any electrotechnical interests that maybeinvolved.
The structure and process of standards developmentby IEC is similar to the methods employed by ISO.The recognized national standards institutes withresponsibility for development of standards for elec-trical products are IEC members. ANSI’s U.S. NationalCommittee is the U.S. member of IEC, and other U.S.voluntary consensus organizations may participate inIEC’s standards development process through its tech-nical committees (169).
Other International Standards-Setting Organiza-tions.—The organizations with specific areas of inter-est contribute their expertise to the development ofthose standards. Many of these international volun-tary organizations maintain close liaison with their na-tional counterparts in the United States. The govern-mental role in these associations is limited to the extentthat an individual member of a national professionalsociety may also be a government employee andas such have contact with her or his internationalcounterparts in the exchange of information.
The International Committee for Standardization inHematology develops reference materials and recom-mends standardized techniques in diagnostic hematol-ogy, blood transfusion practices, and related activities.
The International Union of Immunological Societiesand the International Federation of Clinical Chemistsdevelop specifications for methods of testing andmaterials and also receive and organize internationaltests to submit to the World Health Organization(WHO) for acceptance as recommended procedures.WHO also develops and promotes standards in medi-cal devices. Expert panels and committees of WHOhave worked on such topics as standardization of diag-nostic equipment and quality control in health labora-tories.
The International Organization for Legal Metrology(OIML) is a treaty body established in the early 1950s.It is comprised of 48 countries, including the UnitedStates, which joined in 1972. OIML works to har-monize international standards for legal measuringdevices, such as gasoline pumps and weight scales,and, in the medical field, such devices as blood pres-sure gauges and electrocardiographs. The National Bu-reau of Standards represents the United States inOIML. A U.S. advisory committee for legal metrol-ogy—consisting of representatives of Governmentagencies concerned with legal measurements, manu-facturers of measuring devices, and major standardsorganizations such as ASTM and ANSI—providesguidance to the National Bureau of Standards whenit represents U.S. interests in OIML.
Many international and regional trade associationsparticipate in developing their own standards, andcontribute to organizations such as ISO and IEC. Someof these associations represent manufacturers of radi-ation equipment, surgical instruments, and clinical lab-oratory materials.
European Standards-Setting Organizations
Because of the large number of countries in Europe,with their varied political, social, and economic sys-tems, the environment is a “complex scenario against

208 ● Federal Policies and the Medical Devices Industry
which to review standards and regulations applyingto health care” (73). In addition to the government-affiliated and independent standards institutes withinthe various countries, there are also regional standards-related organizations.
The membership of the European Committee forClinical Laboratory Standards represents health agen-cies, professional societies, and industry. Its objectiveis to improve clinical laboratory practices through avoluntary consensus mechanism (386).
The European Committee for Standardization (CEN)is composed of the national standards organizationsof countries in the European Common Market, plusAustria, Finland, Norway, Portugal, Spain, Sweden,and Switzerland. Its major objective is to harmonizeWestern European implementation of ISO and IECstandards. In addition, it has developed approximately60 “European Standards” in nonelectrotechnical fields.CEN operates certification systems, usually with re-spect to European Standards, and systems for recogni-tion for test results for national certification programswhere no European Standards exist (9).
The European Committee for Electrotechnical Stand-ardization (CENELEC) is comprised of the nationalelectrotechnical committees of its member countries.CENELEC seeks to harmonize the national electro-technical standards of its member countries and usesIEC publications as a basis for its activities. Its majorobjective is to eliminate, through mutual agreement,any technical differences between the national stand-ards and certification programs of its members thatwould result in trade barriers. In addition to its har-monization activities, CENELEC also develops Euro-pean Standards in the electrotechnical field (9).
In general, each country has a national standardsinstitute that produces or sanctions standards, muchas does ANSI. These institutes also have technical com-mittees comprised of government officials, manufac-turers, and end-product users. For the most part,standards established by these institutes are voluntary;however, since each country has its own method ofadministering and monitoring compliance with thesestandards, the line between voluntary standards andmandatory regulations is often blurred (73). Therefore,it is useful to describe briefly key aspects of the stand-ards setting and administering processes for severalmajor European nations, namely the Federal Republicof Germany, the United Kingdom, and France.
In 1981, a group of international medical devicemanufacturers formed the European Regulatory-
2Becton-Dickinson-France, S. A.; Beiersdorf A. G.; Cordis Dow, B. V.;Johnson & Johnson, Ltd.; Medtronic France, S. A.; Miles Laboratories, Ltd.;3M Europe, S. A.; Travenol International Services, Inc.; and WelcomeReagents, Ltd.
Technical Affairs Study Committee, and conducted astudy in the major nations of Europe on the state ofregulatory affairs in the field of medical devices, in-cluding the diagnostic field. The resulting six-volumereport contains a listing of government regulatoryagencies, as well as information on certifying andtesting organizations and on national standards-set-ting. This report indicates that there is an increasingtrend for development of standards in Europe (102).
Federal Republic of Germany .—Two national lawsgovern most of the Federal Republic of Germany’s gov-ernmental involvement in standards-related activity:the Drug Law of August 24, 1976; and the Law onTechnical Equipment and Devices of June 24, 1968,as amended August 13, 1979 (163). Although the DrugLaw is directed primarily to the pharmaceutical indus-try, it defines “drugs” to include certain surgical dress-ings, surgical sutures, and diagnostic products withinthe term “fictitious drugs” (164,174). In addition, im-plantables are brought within the scope of the legisla-tion once they are actually implanted (163).
The Drug Law is comprehensive and contains sec-tions on manufacture, licensing and registration, clin-ical trials, recording of adverse effects, inspections,labeling, and advertising (174). The Ministry of Healthhas statutory responsibility when problems with reg-ulated products are reported and corrective action isnecessary (163).
The Technical Equipment and Devices Law, ad-ministered by the Ministry for Labor and Social Af-fairs, sets forth standards for equipment safety. Specialprovisions require that a manufacturer certify thattechnical medical equipment is in proper condition andthat either the manufacturer or an officially designatedexpert has subjected the equipment to final inspection.Equipment controls and operating instructions mustincorporate use of the German language or utilizestandard symbols (164).
There are two principal standards-setting organiza-tions in West Germany. The Verband DeutscherElektrotechniker (VDE) develops standards and pro-vides certification testing and listing services for elec-trical components and systems. The other, the DeutschesInstitut für Normung (DIN), is a voluntary consen-sus standards organization that has developed stand-ards in a number of areas. Standards involving elec-trical aspects are often published jointly by DIN andVDE. In addition, there is a major testing-certificationorganization called the Technischer UberwachungsVerein (TÜV) which deals primarily with completeproducts, rather than their component parts. TUVissues a “GS” (Geprüfte Sicherheit) mark that, al-though not mandatory, carries with it the same sortof prestige as the UL mark in the United States (293,135).

App. H—Consensus Standards Related to International Trade in Medical Devices • 209
United Kingdom.—In the United Kingdom, with itsnational health system, the Government is the primaryuser of medical devices. The Medicines Act of 1968requires full premarket evaluation for drugs and medi-cines and sets forth requirements for licensing, manu-facturing, inspecting, testing, and labeling. Certainmedical devices, such as surgical sutures, dental fill-ing substances, contact lenses, intrauterine contracep-tive devices, and certain radioactive medicinal prod-ucts, have been brought within the regulatory frameworkof the Medicines Act (174).
The British Standards Institution (BSI) is a volun-tary standards-setting organization that was formedin 1901. In addition to its standards-developing activ-ities, BSI also provides testing and certification serv-ices. Although the standards developed by BSI arevoluntary, the Department of Health and Social Secu-rity (DHSS) has issued a recommendation that gov-ernmental purchases of medical devices comply withexisting BSI standards (149). Therefore, medical de-vices manufacturers regard BSI standards as man-datory in practice, as they must be met in order to mar-ket devices effectively in the United Kingdom.
As BSI standards cover only a relatively small num-ber of medical devices, DHSS general specifications,technical requirements, and voluntary “good manu-facturing practices” have been developed to fill thisvoid. Through its Scientific and Technical ServicesBranch, DHSS has also established a registration schemefor manufacturers. The role of that branch is to de-velop, in conjunction with various trade associations,suitable standards for quality assurance or good man-ufacturing practices, to assess the manufacturers’ com-pliance with those general standards, and to publisha register of manufacturers complying with the goodmanufacturing practices (149). In the event that thisvoluntary scheme proves ineffective, the MedicinesAct provides for residual authority to extend its scopeto cover all medical devices (163).
France.—In France, the authority to control medi-cal devices is derived from the Ministry of Health andFamily and the Ministry of Industry. The two majormechanisms for control are the French Pharmacopoeiaand a “homologation” system (a system of official ap-proval) (174).
The Ministry of Health and Family publishes Phar-macopoeia monographs that contain specifications anddescriptions for many sterile products, a variety ofplastic products, surgical dressings, sutures, varioustubing, and absorbent cotton. Requirements dictatedby the Pharmacopoeia are technically applicable onlyto products sold to public institutions (which accountfor over 90 percent of all medical facilities in France)or to products that claim to conform to the Phar-macopoeia (164,293).
The homologation system is a process of obtainingofficial government approval applicable to a listing ofdevices that is periodically reviewed and updated. Al-though approval is mandatory only for products pur-chased by public institutions, the homologation sys-tem is linked to reimbursement procedures under theFrench social security system. Therefore, approval isnecessary whenever a purchaser wishes to apply forreimbursement (164). Until recently, approval hadbeen granted by an interdepartmental commission, andproduct-specific requirements, specifications, and pro-cedures for testing were stipulated by decree.
In January 1983, France introduced an entirely newscheme of approval. Although it is unclear how thenew scheme will operate in practice, the interdepart-mental commission has been abolished, and a NationalCommittee of Homologation, which has full respon-sibility for the approval process, has been createdwithin the Ministry of Health and Family. The Na-tional Committee has five subcommittees, composedof experts drawn from the ministries, hospitals, anduniversities, and charged with defining the homologa-tion procedures. The subcommittees operate in theareas of: imaging, operating theaters, artificial organsand prostheses, anesthesia and reanimation, and diag-nostic equipment and monitoring (163).
In general, approval requests must be presented tothe Ministry of Health and Family by an authorizedagent established in France, and a testing laboratorywill then be assigned. In practice, only laboratorieswithin the Groupment des Laboratoires des Materielsde Technique Medicale are adequately equipped andstaffed to do the work. For an electrically poweredproduct, the French Electrical Code is applied as theminimum standard. If a particular product standardexists, it is also applied. Clinical testing may be re-quired by physicians assigned by the ministry (293).
The Association Francaise de Normalisation (AFNOR)is France’s primary standards organization. AFNORis a private, public service association that centralizesand coordinates all work and studies concerning stand-ardization, much as does ANSI. Formed in 1926,AFNOR is a voluntary organization of manufacturers,consumers, professional associations, and governmentrepresentatives. Standards developed by AFNOR arevoluntary; however, they may become mandatory ifadopted for use within the homologation system. In1943, AFNOR was given governmental authority todevelop public standards and to administer the mark“NF” as indicating conformity with a standard.
Other Foreign Organizations
Japan.—The Ministry of Health and Welfare regu-lates the importation and sale of medical devices pur-

210 . Federal Policies and the Medical Devices Industry
suant to the Pharmaceutical Affairs Law. In July 1983,an omnibus bill was passed making extensive changesin Japan’s standards and certification system. The om-nibus bill is the culmination of over 4 years of bilateraldiscussions between the United States and Japan (121).
Standards in Japan are normally developed throughadvisory committees to Japanese Government minis-tries (359). The Japanese Industrial Standards Com-mittee (JIS) within the Ministry of International Tradeand Industry is of particular importance to the medi-cal devices industry. Products conforming to JIS stand-ards and testing requirements are entitled to bear the“JIS” mark, which is the most prominent and widelyused certification mark in Japan.
Prior to passage of the recent amendments, only JISstandardized medical devices were exempt from the ap-proval process. The new legislation permits certainnon-JIS standardized devices to bypass the approvalprocess. The devices exempted are those for which theutility, efficiency, and safety is generally acknowl-edged, including such items as surgical knives, tweezers,medical scissors, sterilizers, operating tables, andstethoscopes (121).
Canada.—In Canada, the Department of NationalHealth and Welfare’s Bureau of Medical Devices (BMD)is the central point for mandatory standards. Underthe Food and Drug Act of 1953, the department wasgranted authority to adopt standards and create reg-ulations for medical devices. To date, BMD, whichwas created in 1975, has developed seven medical de-vice regulations: 1) contraceptives, 2) cardiovascularpacemakers, 3) hearing aids (revoked in 1979, but thebureau is working to have them reestablished), 4)mobile oxygen inhalators, 5) blood collection tubes,6) disposable insulin syringes, and 7) electromedicaldevices. In developing these standards, BMD exam-ined existing national voluntary standards and otherinternational and foreign standards which could beadopted or modified, and then based its standardsupon a synthesis of them.
The Canadian Standards Association (CSA) is avoluntary, nonprofit, autonomous organization thatprovides standards-writing and certification services.Its members are drawn from the industrial, govern-mental, private, and educational sectors. In the mid-1970s, CSA initiated a Health Care Technology Pro-gram, whose goal is to develop consensus standardsin the medical engineering field and to implement thosestandards throughout Canada through education, pro-fessional societies, and provincial or federal legislation(90). CSA is also a testing house for certification ofmedical devices. Manufacturers can pay to have theirproducts certified as complying with CSA standardsand certain other relevant standards.
The majority of Canadian medical device standardsare not mandatory. However, since almost all of Can-ada’s hospitals are public, various provincial govern-ments require that certain medical devices meet CSA’sstandards or some other national, international, orforeign standard, such as those of AAMI or ISO.
This requirement has the effect of making manyvoluntary standards mandatory in operation. For ex-ample, all electromedical equipment sold or used inany Canadian province must be “approved,” whichin effect means that the product must be shown to con-form to CSA standard C.22.2 No. 125 (90). Althoughcertain CSA standards are substantially similar to ULstandards in the United States, CSA does not auto-matically certify products certified by UL, but conductsits own testing (463).
Like ANSI (the American National Standards Insti-tute), the Standards Council of Canada, a nonprofitorganization, coordinates other standards-setting orga-nizations and sanctions the standards developed bythese bodies.
Mexico.—The Mexican Government has no uniformsystem of standards development that affects medicaldevices (301). The importation of medical products isgoverned only by the customs law and not by medi-cal device or pharmaceutical legislation as in other de-veloped countries. Entry requires a certificate of originand description of the product. If a product bears acertification of compliance with the standards of theproducing country, such as a UL mark, this certifica-tion is generally accepted by customs officials.
Change in the enforcement of customs laws in Mex-ico can generally be traced to national and interna-tional economic policy issues, such as the effect of im-ports on Mexican employment and other such economicconcerns. These reasons usually are not directed atcontrol of the quality, safety, or effectiveness of theproducts (301).
U.S. Government Agencies Involvedin Standards-Setting Related toInternational Trade
The GATT Standards Code establishes new inter-national ground rules in the area of technical (non-tariff) barriers to trade. It sets forth international rulesamong governments for regulating the procedures bywhich standards and certification systems are pre-pared, adopted, and applied and by which productsare tested for conformity with standards (359,380).The basic premise of the code is that standards-relatedactivities should not be used as mechanisms to restrictunnecessarily international trade (46).

App. H—Consensus Standards Related to International Trade in Medical Devices . 211
Although the code is directly binding only on thecentral governments of its signatories, these govern-ments are obliged to take reasonable measures to en-sure that regional, State, local, and private organiza-tions also comply with the code’s provisions (359).Therefore, the code provisions affect governmentaland nongovernmental standards, whether voluntaryor mandatory, and whether developed by central, re-gional, State, or local governments or private sectorstandards organizations.
Three U.S. Government agencies play a significantrole in the implementation of the Standards Code inthe United States: the Office of the U.S. Trade Repre-sentative, the Department of Commerce, and the De-partment of Agriculture (380). The Department ofAgriculture’s role, while important with respect tooverall implementation of the code, is beyond thescope of this paper. Activities within the Departmentof Health and Human Services are outlined below.
U.S. Department of Health and Human Services
The National Center for Devices and RadiologicalHealth in the Food and Drug Administration (FDA)frequently interacts with domestic and internationalvoluntary standards-setting organizations. Domes-tically, the national center contributes to the reviewand development of standards by organizations suchas ANSI, AAMI and ASTM.3 FDA also participatesin development of international standards through itswork on the technical committees of both ISO andIEC. However, U.S. Government agencies have nei-ther control over nor any official leadership role in thedomestic or international private voluntary standards-setting process.
Recently, U.S. Government agencies—specificallyFDA—have increased their participation in voluntarystandards-setting activities because of two Federal pol-icy initiatives: the GATT Standards Code, as imple-mented in the Trade Agreements Act of 1979 (19U.S.C. § 2531-2573) and Office of Management andBudget (OMB) Circular A-119, Both of these policyinitiatives establish guidelines for and encourage Fed-eral Government agency participation in domestic andinternational voluntary standards-setting activities.
The Trade Agreements Act recommends the use,where appropriate, of international standards as thebasis for developing domestic standards. FDA’s workwith voluntary organizations is important, therefore,to ensure that the U.S. view is expressed and that in-ternationally developed standards are consistent with
3FDA’s activities regarding mandatory performance standards are discussedin ch. S.
U.S. national standards in terms of product safety andeffectiveness.
OMB Circular A-119 sets forth as Federal policy thatthe U.S. Government will rely on voluntary standards,both domestic and international, where appropriate,in lieu of governmentally developed standards. Cir-cular A-119 also specifies that Federal employee par-ticipation should not in any way attempt to dominatethe voluntary process (21).
The Centers for Disease Control (CDC) has alsobeen active in voluntary standards-setting activities inthe medical devices field. CDC provides technicalassistance to organizations such as the National Com-mittee on Clinical Laboratory Studies through CDC’swork with various professional societies and throughinformation received from State health departmentsand other public and private medical laboratories.
Office of the U.S. Trade Representative
In connection with its responsibility for setting andadministering overall trade policy, the U.S. Trade Rep-resentative (USTR) coordinates the development andexecution of the U.S. standards-related trade policy(419). USTR is responsible for resolving standards-related trade disputes between the U.S. and foreigngovernments, overseeing the general implementationof the Standards Code in the United States and coordi-nating the international trade activities of other U.S.Government agencies that engage in standards-relatedactivities that may significantly affect trade, and ne-gotiating bilateral standards arrangements (380).
Under the Standards Code, any signatory may ques-tion another signatory’s compliance with code provi-sions. Bilateral or multilateral consultations are en-couraged to resolve disputes. In the United States, aprivate party may informally raise with USTR a for-eign practice that appears to be inconsistent with thecode or otherwise denies benefits to the United Statesunder the code (380). USTR will then pursue theresolution of problems, keeping the complainant ap-prised of its activities. Problems arising under the codeusually involve: failure by signatories to provide ade-quate information on their standards-setting activities,failure by importing governments to adopt standardsset by international organizations, nonacceptance byimporting countries of test data generated in the UnitedStates, and denial of access to certification systems(359).
U.S. Department of Commerce
National Bureau of Standards (NBS) .—NBS hasbeen delegated the responsibility for establishing and

212 ● Federal Policies and the Medical Devices Industry
maintaining the U.S. inquiry point for Standards Codematters, the central repository for standards and cer-tification information, and a technical office for non-agricultural products. The responsibilities delegated toNBS are carried out through the Office of ProductStandards Policy’s Standards Code and Informationprogram.
As the U.S. inquiry point mandated by the Stand-ards Code, staff of the Standards Code and Informa-tion program notify the GATT Secretariat of proposedU.S. regulations potentially having an effect on trade.They receive notices and information on proposedforeign regulations and disseminate the informationthrough several media and directly to interested U.S.parties. A primary objective of the notification pro-gram is to encourage review and comment on pro-posed foreign regulations. Foreign notifications arerouted through various Government agencies, such asthe Bureau of Industrial Economics in the Departmentof Commerce (DOC); agency members of the Inter-agency Committee on Standards Policy; private stand-ards organizations; and industry groups.
This program also operates the National Center forStandards and Certification Information, which is thenational repository for standards documents. The cen-ter responds to general inquiries about the existenceof specific standards and regulations and maintains areference collection of voluntary and mandatory U.S.standards, as well as major foreign and internationalones. The technical office within the program providesassistance in the areas of exchange of information anddispute settlement.
To market products in foreign countries, U.S. ex-porters must be informed of the testing procedures,approval programs, and certification rules in effect inthose countries. To date, there are no centralized oraccessible reference collections that can provide ex-porters with this essential information (359). Currentfunding and staff resources within the Standards Codeand Information program are insufficient to allow itto expand effectively into this area (1,91). However,the center has begun to collect certification informa-tion on an informal basis through its collection ofmaterials on foreign and international standards activ-ities and through information provided by U.S. tradeand professional organizations.
International Trade Administration (ITA).—TheTrade Agreements Act directs the USTR and the Sec-retaries of Commerce and Agriculture to consult withthe private sector for technical and policy advice onthe implementation of the Trade Agreements Act andthe Standards Code (46,359). In order to meet itsresponsibilities, DOC has established an IndustryFunctional Advisory Committee (IFAC) on Standards
for Trade and Policy Matters. IFAC, administered byITA in DOC, is composed of approximately 20 mem-bers drawn from Industry Sector Advisory Commit-tees within DOC and an approximately equal num-ber drawn from private sector groups involved instandards-related activities (359).
IFAC is responsible for advising USTR on mattersconcerning trade, the operation of existing trade agree-ments, and other matters connected with U.S. tradepolicy. IFAC provides detailed policy and technical ad-vice, information, and recommendations concerningstandards and their effect on trade and the implemen-tation of the Standards Code (359).
Although the mandates of the Standards Code aretechnically applicable only to the Federal Government,the Trade Agreements Act legislation calls on the Presi-dent to promote adherence to the code principles byState and private sector bodies (19 U.S.C. § 2533). Tothis end, ITA has issued voluntary procedural guide-lines for State and local governments and private sec-tor organizations engaged in standards development,product testing, and certification systems (314).
Representation of U.S. Interests in InternationalStandards Organizations.—The Trade AgreementsAct directs the U.S. Secretaries of Commerce and Agri-culture to keep adequately informed of internationalstandards-related activities, to identify those activitiesthat may have a substantial effect on U.S. commerce,and to coordinate those efforts with USTR. Althoughthe act does not designate any specific private orga-nization as the “official” representative of U.S. inter-ests, it confirms the role of U.S. member bodies in pri-vate international standards organizations, such as theANSI/ISO relationship.
The Secretary of Commerce has authority to deter-mine that a member body is not adequately represent-ing U.S. interests and to make arrangements for ade-quate representation (380). For any governmentalinternational standards organizations in which U.S.interests are represented by one or more Federal agen-cies, the Secretary is directed to encourage coopera-tion among the agencies to seek a uniform position.In addition, the Secretary is directed to encourage suchFederal agencies to seek information from and coop-erate with any affected domestic industries (380).
The Standards Code and Information program fulfillsDOC’s obligations with respect to ensuring adequaterepresentation of U.S. interests in international stand-ards-setting through two major activities. First, theprogram’s technical office responds to any informa-tion, complaints, or criticisms concerning participa-tion in international standardization activities. Second,the program maintains statistics and information onU.S. participants in international standards-relatedactivities (359).

App. H—Consensus Standards Related to International Trade in Medical Devices ● 213
Problem Areas for Medical DevicesStandards in International Trade
At an OTA workshop in August 1983, representa-tives of selected members of the Health Industry Man-ufacturers’ Association (HIMA) identified certain prob-lems related to standards and international trade. Allthe participants came from large companies that engagein foreign trade. Although their views may not begeneralizable to the medical devices industry as awhole, they do indicate the experiences and perspec-tives of companies from several areas of medical de-vices (see app. B for a list of workshop participants).It should also be borne in mind that a complete exam-ination of standards-setting would require considera-tion of the benefits to purchasers and users of devices.This section discusses issues raised at the workshopas well as information from Government agencies andother industry representatives.
Development of Standards
Rationale or Need for Standards. —Workshop par-ticipants commented that insufficient attention is givento the rationale for developing standards. Developingmedical device standards may proceed with little orno demonstration of concerns related to clinical safetyand effectiveness (118). For safety standards that areengineering- or technology-based, much time and ef-fort may go into creating standards important froman engineering point of view but of limited concernfrom a medical point of view. One way to demonstratethat a standard is reasonable is to include a rationalethat defines the standard’s purpose and limitations(118).
A related comment was that many standards are de-veloped without any attempt to examine costs andbenefits. Highly restrictive, costly, hardware-orientedstandards are produced where adequate nonhardwarealternatives (such as education, training, and preven-tive maintenance) for resolving the problem may ex-ist. Publication of a rationale would facilitate publicreview and comment and would permit more appro-priate application of standards (89).
The workshop participants advocated greater clin-ical input into standards development. Recently, atrend to involve medical professionals has been devel-oping, particularly in the United States and in Can-ada, but many medical professionals appear reluctantto take the time away from their practices (or otherresponsibilities) or incur the expenses connected withparticipation. Consequently, standards may containrequirements that differ from those necessary to assurethe safety and effectiveness of medical devices (145).
There was speculation that some foreign countrieshave reacted to the 1976 Medical Device Amendmentsby promulgating their own standards, both voluntaryand mandatory. The question was raised of whetheror not standards are needed, considering that manymanufacturers produce devices to specific internal cor-porate standards based on current scientific and tech-nical information, the marketability of the devices,and protection of the company from personal injuryliability.
Access to Information. —When standards—domestic,foreign, and international—are being developed, it isoften difficult for an individual or company to gaintimely access to information so that comments can besubmitted. A major objective of the Standards Codeis to make standards-setting and certification activi-ties open to all interested parties, and code signatoriesmust follow certain procedures for new or amendedmandatory standards and certification system rules(380). However, few foreign countries have detailedspecific requirements regarding public notice, and theStandards Code requirements speak only in terms ofreasonableness. Although none of the code signatoriesmaintain notice procedures that actually violate thecode, U.S. manufacturers have encountered difficultiesin obtaining the timely, adequate information neces-sary for making meaningful comments (359).
FDA’s notices of proposed standards developmentmay not give enough information about the purposeor rationale to determine the scope or need for com-ments (21 CFR pt. 866). At the local level, users ofstandards, manufacturers, or consumers are not allmembers of national organizations and do not allsubscribe to the publications (such as the Federal Reg-ister for domestic notices and the Commerce BusinessDaily for foreign notices) in which notices are pub-lished. Consequently, they may not take part in thecomment process.
In January 1980, HIMA surveyed its membershipto obtain information regarding members’ interna-tional marketing activities, monitoring of regulationsand product standards, and participation in foreign in-dustry organizations. According to the survey results,manufacturers typically rely on foreign agents anddistributors for information on changes in foreign reg-ulations and product standards, and many have des-ignated a specific employee, stationed either in theUnited States or abroad, to monitor standards-relateddevelopments.
Whereas over 70 percent of the manufacturers re-sponding to the survey relied on distributors, agents,and employees as information sources, 35 percent ofthe respondents obtained information directly fromU.S. Government sources and 21 percent obtained the

214 ● Federal Policies and the Medical Devices Industry
information directly from foreign governments orforeign industry organizations (146).
Some European countries with only a few manufac-turers in specialized fields such as medical devices havedeveloped standards swiftly. These standards are oftenbased on locally manufactured products and may, infact, serve to restrain import trade. The standards-setting government may justify its standards by assert-ing that they are based on international standards“with qualifications, ” but the qualifications may besubstantial and belie the original standard. Becausethese standards are often quickly enacted, U.S. stand-ards organizations and interested manufacturers oftenhave difficulty submitting comments in a timely man-ner. Once these standards are finalized, U.S. manu-facturers may have difficulty in having their productsconform to the foreign standards.
Suitable Representation.—The expense of analyz-ing drafts, preparing comments, and attending inter-national meetings often makes it particularly difficultfor small companies to participate, since the cost ofparticipation is the burden of the individual commit-tee members. In the private sector, it is usually themanufacturer who pays the expenses of the employeerepresentative. The review and comment work of com-mittees usually takes place over a period of months,or years in some cases. As a result, the interests ofsmall manufacturers (and others unable to attend in-ternational meetings) in international standards-settingare often not taken into account.
Although 98 percent of the manufacturers respond-ing to the HIMA survey were involved in the exportor foreign manufacture of medical products, only 27percent indicated membership in foreign industry orga-nizations and only 25 percent reported active directinvolvement in international standards organizations.The manufacturers that did participate in internationalstandards development reported employee participa-tion in various technical committees of organizationssuch as IEC, ISO, NCCLS, and OIML—as well as thenational standards organizations of Australia, France,West Germany, and the United Kingdom (146).
Even with improved representation in internationalstandards setting, U.S. interests may be unable to in-fluence decisionmaking at the international level. Euro-pean countries involved in the regional standardssetting activities of organizations such as CEN andCENELEC often vote as a bloc in ISO or IEC to estab-lish European technology as the basis for internationalstandards (249).
Application of Standards
Cost of Conforming to Standards.—In the UnitedStates, UL or NFPA standards are often specified in
public municipal codes, such as building and safetycodes, or in purchasing specifications. Products mustthen bear a UL mark or other form of approval to beused within those jurisdictions. A device may besubject to design and performance standards as wellas installation and use standards. Each time a test isconducted, additional costs are incurred. For exam-ple, some electrical devices require a UL mark as wellas conformity to NFPA fire and safety codes. In addi-tion, a foreign government might require different oradditional tests and markings for the same product.
Although manufacturers consider some medical de-vices standards, such as those developed under the1968 Radiation Control for Health and Safety Act, tohave significantly improved the safety and quality ofthe products, they also maintain that the improve-ments have raised the cost of research, development,and final products.
In foreign countries, the cost to a U.S. manufacturerof complying with foreign standards that differ fromdomestic standards must be built into the price of itsproducts. This can make U.S. products more expen-sive than local foreign ones, and thus less cost com-petitive. To minimize the costs of additional testingor procedures related to meeting foreign and domes-tic standards, as well as for other reasons, U.S. man-ufacturers have set up overseas operations. Establish-ment of foreign manufacturing subsidiaries by U.S.companies diminishes the balance-of-trade advantagefor the United States.
Interpretation and Reliability of Information.—Theexistence of an international or foreign standard, andknowledge of its existence by a U.S. manufacturer, hasonly limited value. It is more important to the manu-facturer to know how that standard will be interpretedby local or national officials, or other certifying bodiessuch as testing laboratories, government reimburse-ment agencies, or insurance providers.
In the Federal Republic of Germany, for example,there are DIN standards for medical device compo-nents, but within the country the officials of the vari-ous states interpret these standards differently. Differ-ing interpretations can result in costly delays in supplyingproducts or in cancellations of orders and contracts.In Germany, U.S. importers also face problems re-lating to insurance coverage. For example, althoughnot legally required, a customer’s insurance carrierasked the importer of an ultrasound imaging deviceto certify that the product met radiofrequency in-terference standards (235). This action caused consid-erable expense to the manufacturer in legal fees anddelayed introduction of the product.
This situation occurs in other countries as well wherethe ultimate legal responsibility for radiofrequency in-terference (or any other responsibility for equipment

App. H—Consensus Standards Related to International Trade in Medical Devices ● 215
safety or performance) rests with the user as opposedto the manufacturer. In order to obtain insurance cov-erage in these situations, the user’s case is much strongerif it can be shown that the product meets, or has beencertified to, the requirements of an applicable stand-ard (293).
Most companies doing business internationally mustrely on their market researchers to identify standardsor other requirements that they must meet or on localdistribution agents for their knowledge of local admin-istrative procedures. Obtaining information throughthese sources is costly and time-consuming. It is all themore difficult for those companies that cannot affordresearchers or local agents.
Once manufacturers have obtained information re-garding foreign standards-related practices, they oftenencounter difficulties in confirming the accuracy ofthat information and determining its practical impli-cations. A major difficulty in foreign standardizationactivities is determining what is required versus whatis customary or desirable in certain markets. Manu-facturers report that certain foreign standards re-quirements that appear to be mandatory may in prac-tice be negotiable with the inspector.
For example, in the United Kingdom, one manufac-turer succeeded in overcoming a seemingly mandatoryDHSS radiation protection standard for X-ray equip-
ment that contained an unworkable limit on fluo-roscopic exposure. Through negotiations with the in-spector involved, the manufacturer was able to obtainapproval of its product (235).
Effect of Standards on Innovation.—The interpreta-tion of standards by foreign governments and thereliability y of information can be linked to the issue ofhow standards keep pace with new technologies. Somecountries, such as Mexico, reportedly use out-of-datestandards and have rejected products not meeting thesestandards. A recent example involved implantablepacemakers (301.).
Although some standards have provisions for assess-ing new or improved products, others are written topreclude newly developed or improved products, suchas the replacement of digital monitors for analogequipment. If standards are not written to accom-modate product changes, introduction of new technol-ogies will be restricted by existing standards and willserve as a barrier to trade.
The process of changing standards, especially inter-national standards, is often as long and cumbersomeas the initial development process. New technologi-cal innovations in medical devices may thus be barredfrom certain countries, either voluntarily or involun-tarily, because the standards for the devices have notevolved so quickly as the products themselves.
Appendix 1. —Governmental Regulation ofInternational Trade in Medical Devices:
United States, Canada, Japan, United Kingdom,France, Federal Republic of Germany, and Mexico1
United States
Regulation of Imports
Two types of government regulations affect the abil-ity of foreign medical devices to compete in the U.S.market. The principal focus of this appendix is the firsttype—those regulations that directly impose require-ments on foreign manufacturers and importers, or onthe imported device itself. The second type of regula-tion indirectly influences the actual sales of importedmedical devices by affecting their competitiveness withdevices manufactured in the United States.
The regulations of the Food and Drug Administra-tion (FDA) are designed to ensure that only safe, ef-fective, and truthfully labeled medical devices are soldin the United States. In theory, this means that foreignmanufacturers and imported devices must meet thesame criteria as U.S. firms and domestically manufac-tured devices. In practice, however, because of budg-etary constraints, foreign manufacturers of medicaldevices are treated somewhat differently, since theyare not inspected so regularly as domestic manufac-turers, and, unlike their domestic counterparts, theyreceive advance notice of an upcoming inspection.
The Customs Service, which is supposed to ensurethat medical device importers comply with the gen-eral rules applicable to all imported products, in 1979delegated certain of its general responsibilities to FDA(304).
Requirements of the Food and Drug Administra-tion.—FDA regulations impose a number of require-ments that must be fulfilled before a device can evenbe considered for import approval, and these require-ments are the same as those imposed on domestic man-ufacturers (see ch. S). Registration of a foreign manu-facturer of medical devices is voluntary, but FDA triesto encourage such establishments to register. Registra-tion is mandatory for the importer (initial distributor)of a foreign medical device (21 CFR 807.20, 1982).Unless the importer is registered, FDA will not allowthe import to be released for sale in the United States.
A foreign manufacturer or distributor must alsosupply FDA with a
IExcerpted from a paperHays & Handler (181).
216
list of every device that it exports
prepared for OTA by Kaye, Scholer, Fierman,
to the United States (21 CFR 807.40, 1982) or author-ize an exclusive distributor to file the medical devicelisting on its behalf. Failure to list a device will resultin its exclusion from the United States.
Foreign manufacturers, unlike domestic producers,usually have at least 30 days notice prior to an FDAinspection. Because of the expense and logistics in-volved, foreign inspections by FDA are infrequent.Furthermore, it is likely that they will become evenmore infrequent in the future because of recent reduc-tions in FDA travel funds.
The third set of FDA preimportation requirementsinvolves premarket notification and approval. Thescope of these requirements varies based on the natureand history of the product. If a product was being im-ported into the United States prior to the Medical De-vice Amendments of 1976, it may continue to be im-ported without notification. But if a device was notbeing imported prior to 1976, the manufacturer or im-porter is required to submit a premarket notificationto FDA. If FDA finds that a product is substantiallyequivalent to a preamendments device, importationand marketing will be permitted. If a device is notsubstantially equivalent to a preamendments device,it may be subject to the further requirement of pre-market approval (see ch. S). In that case, neither im-portation nor marketing of the device is permitted untilapproval is received from FDA.
The fourth form of preimportation requirementrelates to manufacturing. Both foreign and domesticmanufacturing establishments are subject to inspec-tions to ensure compliance with good manufacturingpractices, although the right of such inspection maybe limited by foreign governments or the foreign firminvolved. If a satisfactory arrangement for an inspec-tion cannot be made, FDA has the authority to excludethe product since it would be unable to determinewhether the device met the good manufacturing prac-tices requirements of the Federal Food, Drug, andCosmetic Act. (FDA has encountered few, if any,problems in inspected medical devices firms in thecountries included in this appendix (204). )
Pursuant to a 1979 delegation of some of the Cus-toms Service’s authority, FDA monitors compliancewith customs regulations, collects samples, issuesnotices of sampling, and issues notices of refusal ofadmission at certain ports (384). Figure I-1 outlines thesteps involved in clearing customs.
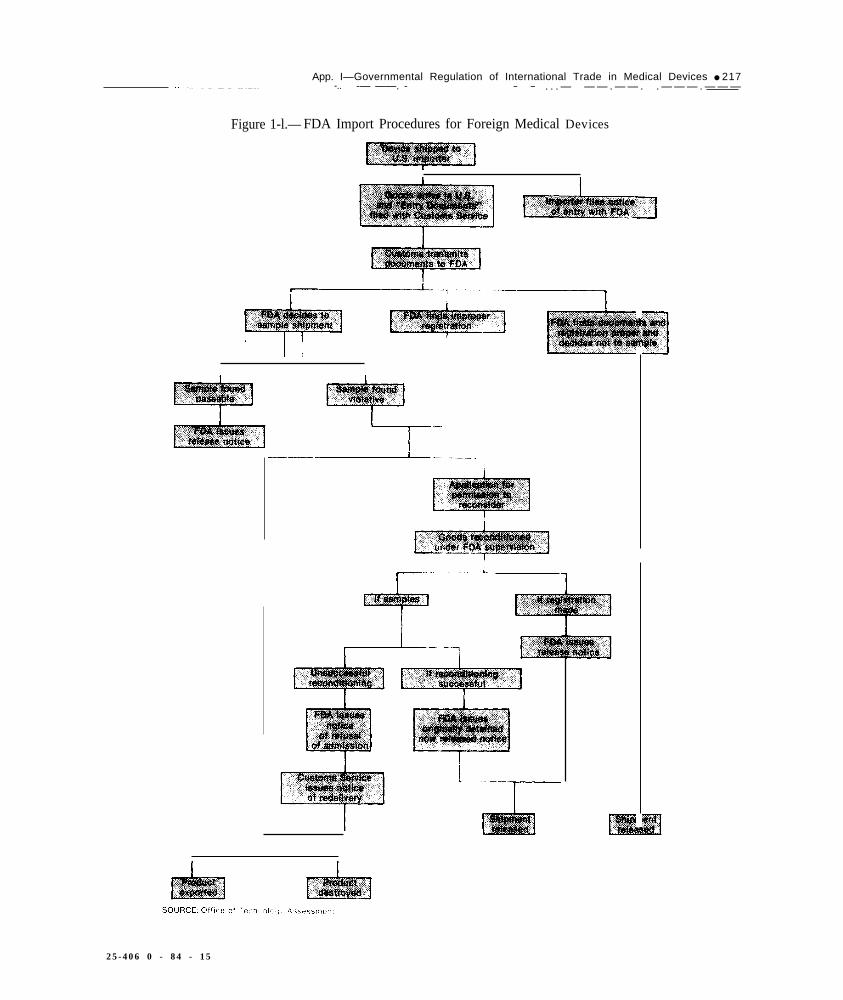
App. I—Governmental Regulation of International Trade in Medical Devices ● 217.———.— -.. -— ——. - — — . . . — — — . — — . . — — — . — — —
Figure 1-l.— FDA Import Procedures for Foreign Medical Devices
i
2 5 - 4 0 6 0 - 8 4 - 1 5

218 . Federal Policies and the Medical Devices Industry
There is no evidence to suggest that FDA regulationswere adopted for the purpose of erecting barriers tointernational trade in medical devices, or that they areadministered with such an intent. As a practical mat-ter, however, certain regulations do have a differentimpact on importers than on domestic manufacturers.For example, domestic producers may have an advan-tage with respect to participation in the notice andcomment process and informal negotiations leading tothe development of regulations. Not all regulations,however, operate to the advantage of domestic pro-ducers. For instance, due to logistical concerns, in-spections under the good manufacturing practices reg-ulations are more frequent, and undoubtedly moreburdensome, for domestic producers than for foreignmanufacturers.
FDA has a variety of administrative sanctions equal-ly applicable to domestic and foreign manufacturersthat can be used to prevent the marketing of adulter-ated or misbranded medical devices. There are, how-ever, important practical distinctions between FDA’sauthority over domestic medical devices and importeddevices. In domestic commerce, FDA has only formalstatutory authority to bring enforcement actions suchas seizures with respect to devices when those devicesare actually misbranded or adulterated. FDA’s discre-tion is therefore limited by the requirement that it beable to prove that a device is in fact adulterated ormisbranded. FDA’s enforcement authority over im-ported devices is broader; it has the authority to actwhen an imported device appears to be misbrandedor adulterated (21 U.S. C. 381(a), 1976; (294)). The“appears” standard significantly modifies the usualburden of proof and offers more discretion to FDA todetain or otherwise halt potentially defective or haz-ardous medical devices before they are distributed toconsumers in the United States. On the basis of thisauthority, FDA actively monitors imports to preventthe introduction of offending devices.
On the other hand, it must be noted that FDA hasa variety of informal administrative remedies, such asregulatory letters or recalls, which it employs whereit does not wish to institute a formal enforcement ac-tion. Some of these actions may be more difficult toapply to foreign manufacturers than to domestic man-ufacturers.
Customs Service Regulations.—The result of thedelegation of customs’ authority to FDA is that theonly customs Service regulations applicable to medi-cal devices are those generally applicable to all im-ported products. These regulations fall into three cat-egories: those pertaining to “entry” of goods into theUnited States, those pertaining to the assessment of
duties on imported products, and those which pertainto the physical appearance of imported goods.
This classification system may change in the nearfuture. The U.S. International Trade Commissionrecently prepared a study in anticipation of the con-version of the U.S. tariff classification into an inter-nationally agreed-upon, harmonized system of tariffclassification. If adopted, the system will result in amore uniform classification of medical devices betweendifferent countries, and thus make the gathering of sta-tistical data easier, but it will have little economic ef-fect on imports into the United States.
Tariffs applicable to medical devices are now gen-erally in the range of 5 to 10 percent, which is com-parable to the rates applied by other countries to theimports manufactured in the United States.
The third set of regulations administered by the Cus-toms Service relate to the physical appearance of, andmarkings on, devices. Although these requirementsmust be met by importers, they have no significantimpact on the pattern of trade in medical devices.
U.S. Trade Laws.—In addition to being subject toFDA and Customs Service regulations, imports ofmedical devices are subject to regulation under the gen-eral U.S. trade laws. These laws, which are briefly de-scribed below, can be used to impose additional duties,quotas, or other restrictions on the importation ofmedical devices that might cause injury to the domes-tic medical devices industry. There are two basic cat-egories of such trade laws: those that impose restric-tions when imports that are traded “unfairly” injurethe domestic industry, and those that permit restric-tions on imports where there is injury to the domesticindustry, without regard to “unfairness. ”
The unfair trade laws have not often been invokedin the medical device area. Nor has any part of themedical device industry yet attempted to bring a coun-tervailing duty or antidumping case against importedmedical devices.
Two actions have been brought against importersof medical devices on the grounds of unfair trade prac-tices. In June 1982, the U.S. International Trade Com-mission instituted an investigation involving certaincomputed tomography (CT) scanner and gamma cam-era medical diagnostic imaging apparatus. The investi-gation involved allegations that equipment importedfrom Israel violated a patent granted to a U.S. com-pany (312). In March 1983, the commission made apreliminary determination that there was no violationand the case was terminated. In September 1983, thecommission initiated a second investigation involvingcardiac pacemakers and components (322). This com-plaint was also based on alleged patent infringementand is currently pending before the commission.
App. I—Governmental Regulation of International Trade in Medical Devices . 219
Regulation of Exports
In the United States, the export of medical devicesis not regulated to anywhere near the same degree asimports. To the extent that export regulations do ex-ist, they are administered principally by two agencies,FDA and the Office of Export Administration (OEA)in the U.S. Department of Commerce.
FDA Export Regulations.—For export purposes,medical devices can be divided into three categories.The first category of devices is by far the largest; anymedical device that can be marketed legally in theUnited States can be exported legally from the UnitedStates without prior approval by FDA.
The second category of devices are those that can-not be marketed in the United States, but that can beexported without FDA approval if the product (sec.801 (d)(l) of the Federal Food, Drug, and CosmeticAct):
● meets the specifications of a foreign purchaser,• does not conflict with the laws of the country of
the foreign purchaser,. is labeled for export, and. is not sold or offered for sale in domestic commerce.
Prior FDA approval is not required for exports undersection 801(d)(l), but FDA may at any time requirean exporter to show that the exports that it is makingunder this section comply with the section’s four re-quirements.
The third category of medical devices, those ex-ported under section 801(d)(2) of the act, includes cer-tain types of adulterated or misbranded devices thatmay be exported only with specific FDA approval andnot under the less strict standards of section 801(d)(l).The third category specifically includes products thatviolate performance standards; that are subject to buthave not received premarket approval; that are sub-ject to limited investigational use, or that are bannedin the United States. As a practical matter, most de-vices requiring FDA approval for export are those thatrequire but have not yet received premarket approvalor that are subject to limitations as investigationaldevices.
To obtain FDA approval for export of a medical de-vice in the third category, an exporter must submit toFDA an “Export Request. ” This request must containa description of the device and its status under U.S.law, and a letter of acceptance from the governmentof the importing state. This letter of acceptance muststate:
• that the device is not in conflict with the laws ofthe importing state,
● that the foreign government has full knowledgeof the status of the device in the United States, and
● that the import is permitted (along with any re-strictions that might be imposed).
On the basis of this information, FDA will approvethe exportation of the device if it would not be con-trary to public health and welfare.
The FDA approval process for exports under section801(d)(2) raises two problems for U.S. exporters. Thefirst arises from the need to obtain explicit authoriza-tion from the foreign government for the importationof a device and is also faced by exporters under sec-tion 801(d)(l). Since many countries have no lawsgoverning the approval of medical devices, it is diffi-cult for these countries to inform FDA that a deviceis approved for import. In such cases, FDA will ac-cept a statement from a foreign government that it hasno laws prohibiting the importation of a particularmedical device. This procedure may only partiallyalleviate the difficulty because in many of these coun-tries no one is authorized by law to make even sucha limited statement to FDA. The second problem isthe vagueness of the “public health and welfare” stand-ard used in section 801(d). Neither the Medical De-vice Amendments of 1976 nor the legislative historyindicate whose health and safety is to be protected byFDA.
In practice, FDA’s reliance on the standard is mini-mal; the decision to allow an export is usually madesimply on the basis of whether the foreign governmentapproves the importation of the device. From October1, 1981 through September 30, 1982, FDA issued 260letters approving export of medical devices under sec-tion 801(d). In the same period, eight requests werenot approved. From October 1, 1982 through March31, 1983, 116 approvals for export were given, fivedevices were not approved, and one previous approvalwas rescinded.
Department of Commerce Export Controls.—Med-ical devices, along with all other U.S. exports, aresubject to the export controls in the Export Adminis-tration Act of 1979. That act authorizes the Presidentto impose controls on exports for reasons of nationalsecurity, foreign policy, and short supply.2 The prin-cipal authority to administer these controls has beengiven to the Commerce Department’s OEA; otheragencies including the Departments of State, Defense,Energy, and Treasury have an advisory role in OEAlicensing decisions.
‘The Export Administration Act originally expired on Sept. 30, 1983. Thecontrols under the act were at first extended on a temporary basis by thePresident pursuant to the authority of the International Economic EmergencyPowers Act. Congress later passed a bill extending the act until the end ofFebruary 1984. Congress is considering reauthorization with a variety ofamendments, but it is not possible to predict what new provisions will beincluded.
220 ● Federal Policies and the Medical Devices Industry
All exports from the United States must be author-ized by either a general or a validated export license.A general license is an authorization to export grantedby regulation rather than by specific application. Gen-eral licenses can be used to export any good to anydestination, as long as neither the good nor the destina-tion is controlled. Validated licenses are requiredwhenever the export of a specific commodity is con-trolled to a specific destination.
Determination of whether a particular commodityrequires a general or validated export license is madewith reference to the Export Administration Regula-tions and the Commodity Control List.
Medical devices fall into several product classifica-tions of the Commodity Control List, depending onthe nature of the product and its technological sophis-tication. For example, most medical, surgical, and den-tal supplies are classifiable within the miscellaneousproduct group item 6999 G, “other commodities notelsewhere specified, ” which can be exported under gen-eral license except to Cuba, Kampuchea, North Ko-rea, and Vietnam. Most X-ray equipment is classifiedin the Electronic and Precision Instruments ProductGroup in item 1533A, which requires a validated li-cense to any destination other than Canada.
In most cases, the requirements applicable to medi-cal devices are less than clear because the Govern-ment’s interests in restricting exports are based not ontheir status as medical devices but on the fact that theyinclude some form of technology that the United Stateswishes to control, such as computer or laser technol-ogy. An example can be seen in item 1522A, “lasersand laser systems including equipment containingthem,” for which a validated license is required for alldestinations except Canada. Although most medicallaser systems would appear to be covered by this clas-sification, the explanation of this item in the Com-modity Control List provides no further specific guid-ance. Treatment of medical equipment incorporatingsemiconductor or computer technology can be evenmore complicated and can depend on the speed of thecomputer, its capacity, the capability of the computer,and the materials from which the semiconductor ismade. Thus, similar medical devices could be classifiedas different items, with one requiring only a generallicense and the other a validated license because thelatter has a computer that operates at a slightly higherrate of speed or because its semiconductors are madeof a different material.
This export control process and the intricate classi-fication system raise the level of uncertainty for med-ical device exporters. Whenever a validated license fora transaction is required, an exporter cannot be surewhether the export will be approved, in what form itwill be approved, or how long approval will take.
The eventual destination of the device raises addi-tional questions. It is probable that export licenses willbe granted for the export to Western Europe or Japanof a medical device incorporating controlled technol-ogy. Export of the same device to a country in East-ern Europe or to the Soviet Union may or may notbe allowed, depending on the discretionary decisionof the Commerce Department as to whether the re-lease of the technology may hurt U.S. national secu-rity. Even if export approval is granted, conditionsmay be imposed, including substantial modificationof a device in order to prevent the release of sensitivetechnology. The question for the exporter is whethera prospective buyer would be willing to accept a de-vice that is significantly different from that which thebuyer originally intended to purchase.
Regardless of whether the export of a medical de-vice is eventually approved, the length of time in-volved in the licensing process is a disincentive to ex-port. In most cases, the Commerce Department issuesan export license in 4 to 6 weeks. This time frame,however, rests on the assumption that the export doesnot involve highly sensitive technology and is notdestined for a sensitive country such as the SovietUnion, and that the exporter has supplied all the cor-rect documentation to the Commerce Department. De-lays occur when the exporter submits insufficient orincomplete information or when other agencies, usu-ally the Departments of State and Defense, exercisetheir right to review an application. In such cases, de-lays of months and, in extreme cases, years may result.
A number of proposals currently being consideredto facilitate export while protecting national security,such as elimination of export licenses to most West-ern European countries, reduction of controls in situ-ations where identical technology is available fromother foreign sources, and reconsideration of whichtechnology is deemed to be militarily sensitive, mayremove many medical devices from controls. Simi-larly, Administration moves to ease restrictions on ex-ports to China will open up that market to increasingnumbers of U.S. medical devices.
U.S. Government Export Promotion Activities
Department of Commerce.—Most Government ex-port promotion activities are centered in the Depart-ment of Commerce. Among the department’s exportpromotion activities are the Export Trading Companyprogram, the dissemination of information aboutstandards, the development of market research data,and the activities of the Foreign Commercial Service.
Under the Export Trading Company Act (PublicLaw 97-290) groups of U.S. exporters are able to com-bine their resources to aggressively seek export mar-

App. l—Governmental Regulation of International Trade in Medical Devices • 221
kets. Groups of medical device exporters or even asingle medical device manufacturer may obtain a cer-tificate from the Department of Commerce enablingthem to engage in certain activities that would other-wise be prohibited under antitrust laws. There has beenlittle experience in the operation of export trading com-panies, and it will be some time before it can be deter-mined whether the program will in fact significantlypromote U.S. exports. At the present time, no medi-cal device manufacturers appear to have attempted toestablish export trading companies.
A second Commerce Department function of poten-tial significance to the medical device industry is thecompilation by the National Bureau of Standards oflists of applicable foreign standards. This project hasnot yet been completed, but when it is, the ready avail-ability of applicable foreign standards will be of helpto U.S. medical device exporters. There is currentlyno compilation of medical device standards. FDA’s Bu-reau of Medical Devices publishes an annual surveyof standards for medical devices, but it simply iden-tifies relevant standards of most major U.S. tradingpartners and does not reproduce them. The actualstandards are available only from sources in the for-eign country, or, in some cases, from private organi-zations in the United States, such as the American Na-tional Standards Institute, Inc.
The Department of Commerce also provides a va-riety of resources for potential exporters, includingmarket research and computerized lists of market op-portunities. The department has, for example, com-missioned detailed market surveys of the medical de-vice markets in a variety of countries. These CountryMarket Surveys include information about marketconditions, the status of foreign competitors, the ma-jor end-users, and forecasts of the markets for particu-lar medical devices. Also included are brief reviewsof foreign government regulations. The departmentalso maintains lists of potential purchasers of U.S.goods.
Although the services provided in the Departmentof Commerce are not a substitute for individual mar-ket analyses by an exporter and do not eliminate theexporter’s need for competent assistance in the foreignmarket, they do provide some help, particularly tofirst-time exporters to certain markets.
Department of the Treasury .—The most significantfinancial export incentive provided by the U.S. Gov-ernment and available to exporters of medical devicesis the “DISC” export tax system. Under the DISC pro-visions of the income tax code, a corporation engagedin export trade may set up a corporation called aDomestic International Sales Corp. (DISC), throughwhich it channels its export sales. It is then permittedto defer tax on portions of the income of the DISC.
Under the complicated accounting rules applicable toDISC taxation, the amount of income thus shelteredvaries, depending on the level of export sales made bythe DISC, but generally up to 20 percent of the incomegenerated by export sales can be sheltered.
The DISC system is currently under congressionalreview. International criticism of the DISC system asan illegal export subsidy persuaded the United Statesto make a commitment to its foreign trading partnersto eliminate it. There are several possible replacementsfor the DISC system pending before Congress.
U.S. Trade Representative.—The U.S. Trade Rep-resentative (USTR) is the principal U.S. negotiator forinternational trade agreements. USTR represented theUnited States at the Tokyo Round of the MultilateralTrade Negotiations, held under the auspices of theGeneral Agreement on Tariffs and Trade (GATT),which led to the development of the Standards andGovernment Procurement Codes. The Standards Codeis an agreement among the signatory countries, in-cluding most major export markets for U.S. medicaldevices, not to use standards as nontariff barriers (seeapp. H). The Government Procurement Code is anagreement to expand the opportunities of foreign sell-ers to compete for Government contracts. By seekingto enforce U.S. rights under these agreements, and bynegotiating for an expansion of their scope, USTR canplay a role in expanding foreign markets for U.S. med-ical devices.
USTR also conducts bilateral negotiations to removespecific trade barriers to U.S. goods. The issues areusually brought to the attention of the USTR by pri-vate industry. For instance, USTR has been negotiat-ing a reduction in Japanese medical devices trade bar-riers for the last year. The U.S. medical device industrybrought to the attention of USTR a number of Japa-nese import procedures that had the effect of signifi-cantly limiting the access of U.S. products to the Jap-anese market. Among these barriers were regulationsrequiring chemical testing for devices, restrictions onchanges in import agents, complex procedures for ap-proving minor device changes that do not affect healthand safety, and the generally slow process leading toapproval of medical devices. Negotiations between theJapanese and USTR have had limited positive results,with some restrictive procedures having been modi-fied to accommodate U.S. concerns (see below).
Canada
The Canadian market for medical equipment, in-cluding medical devices, was approximately $440 mil-lion in 1981 (241). By 1980, imports of medical equip-ment had reached an estimated $391 million annually,constituting 88 percent of the total market. By far the

222 • Federal Policies and the Medical Devices Industry
largest share of the imports, 82 percent in 1980, camefrom the United States, and many of the domesticCanadian medical device manufacturers are owned byU.S. firms. Canada has had universal health insurancesince the early 1970s.
Import Requirements
There is no import license required for medical de-vices. However, under regulations issued by the Min-istry of National Health and Welfare, it is illegal forany person to import for sale any device which doesnot meet the specific requirements relating to safety,efficacy, and truthful labeling of the Canadian Foodand Drug Act or the Medical Device Regulations (255).As in the United States, goods found to be noncon-forming may be relabeled or modified by the importerto meet Canadian requirements.
In addition, within 10 days of the first sale of a de-vice in Canada, importers are required to provide in-formation to the Health Protection Branch of the Min-istry of National Health and Welfare regarding theforeign manufacturer or importer, the Canadian dis-tributor, the model number, any drugs present in thedevice, statements of the uses for which the device isbeing offered, and the method(s) of sterilization, if any,recommended by the manufacturer.
Extra-oral dental X-ray equipment is subject to spe-cial import restrictions (254). Imported radiation-emitting devices must comply with all applicablestandards regarding design, construction, and func-tion. Canada will accept X-ray devices certified underU.S. FDA performance standards.
Tariffs on medical devices now average approx-imately 15 percent and are expected to be reduced to9.5 percent by 1985 under GATT commitments al-ready made by Canada (241).
Product Approval Process
Both imported and domestically manufactured med-ical devices are regulated by the Health ProtectionBranch of the Ministry of National Health and Wel-fare, which carries out laws such as the Radiation Emit-ting Devices Act, the National Health and Welfare Act,the Food and Drugs Act, and the Hazardous ProductsAct, which concern the types of information requiredto be submitted and the timing of the submissions.
Under the Canadian product approval system, themanufacturer or importer of a medical device mustconduct premarket tests and present the results to theHealth Protection Branch. The data must indicate thebenefits and performance results claimed for the de-vice. In addition, at any time the manufacturer mustbe prepared, if requested, to provide to the Assistant
Deputy Minister of the Health Protection Branch in-formation on test methods and test results (255).
Only recently has the Canadian Government begunto develop regulatory standards for medical devices.The Bureau of Medical Devices in the Health and Pro-tection Branch of the Ministry is concerned with thetechnical and scientific aspects of medical device reg-ulation regarding the quality, safety, and efficacy ofmedical devices (241). The bureau conducts researchto allow it to enact specific safety and performancestandards for various types of medical devices and todevelop test methods to evaluate conformity with thesestandards. It also tests devices for compliance withstandards, to assess manufacturer’s claims for safetyand efficacy, and to evaluate newly suspected hazardsin previously approved devices.
In addition to its scientific duties, the bureau accu-mulates information on sales of medical devices inCanada and monitors recall developments in foreigncountries. When appropriate, it also initiates recallsof imported devices.
Only a few types of medical devices are presentlysubject to mandatory standards promulgated by thebureau (241). In addition to the standards for radia-tion-emitting devices, there are now national stand-ards on leakage of current from electromedical devicesand the design and operation of oxygen inhalators.These standards tend to be similar, though not iden-tical, to U.S. standards.
The bureau has also enacted regulations requiringpremarket review of all implantable medical devicesand submission by the manufacturer of safety and ef-fectiveness data. It is expected that the bureau will issueadditional standards for a number of medical devicesin 1984—including labeling and packaging standardsfor radioenzyme testing devices, infant incubators,medical gas cylinders, and ozone emissions from med-ical devices.
Medical devices that are “new” within the definitionof the Canadian Food and Drugs Act are subject toadditional regulatory requirements first imposed in1975 (255). At the present time, the only products thatfit this category of “new” devices are intrauterinedevices, cardiac pacemakers, prolonged-wear contactlenses, and intraocular lenses. Even these devices areconsidered new only if they have not previously beensold by the same manufacturer in Canada, differ froma device previously sold by the same manufacturer inCanada, or are identical to a device previously soldin Canada by the same manufacturer but recalled orwithdrawn from the Canadian market. To be sold inCanada, new devices must receive a Notice of Com-pliance from the Health Protection Branch.
In addition, it is usually necessary for manufacturersof certain medical devices to comply with standards

App. I—Governmental Regulation of International Trade in Medical Devices ● 223
set by the Canadian Standards Association, an inde-pendent, private body. The association has two gen-eral specifications that govern X-ray equipment andelectromedical equipment. Provincial governments en-force compliance with these standards (241).
Other Market Factors
Other than tariffs, which are temporarily somewhathigher than in the other developed countries in thisstudy, the Canadian market remains remarkably freeof direct and indirect import barriers. The health caredelivery system does not discriminate overtly againstpurchase or use of foreign medical devices. However,the Canadian Federal Government has had a practiceof granting a preference to goods of Canadian originwhen making purchasing decisions. This has taken theform of accepting bids by Canadian suppliers that arewithin a specified range (5 to 15 percent) of the lowestbid offered by a firm importing similar goods.
Some provinces, particularly Ontario and Quebec,have adopted similar preferences for products fromwithin the province. Although the Federal and Pro-vincial governments purchase most of the medicaldevices sold in Canada, the effect of their procurementpolicies on imports has not been as great as might havebeen expected, probably because except for disposablethe Canadian medical devices industry is not well de-veloped.
Japan
The Japanese market for all medical equipment, in-cluding medical devices, was estimated to be about$1.24 billion in 1982 (122). The share of the Japanesemedical equipment market held by imports has in re-cent years been only about 23 percent, one of thelowest percentages for any industrialized country ex-cept the United States. The United States is the largestsupplier of medical equipment in Japan, providing ap-proximately 60 percent of all such imports in 1982.
Import Requirements
Special technical import requirements apply tomany products, including medical devices. When a de-vice is subject to one of these technical requirements,a firm must apply to the Ministry of InternationalTrade and Industry (MITI) for an import quota cer-tificate. In addition, U.S. products that require an ex-port license under the U.S. Export Administration Actor are subject to other U.S. export controls must alsohave an import certificate. Most medical devices arealso subject to technical inspection at the point of en-
try to Japan to assure that any applicable standardshave been met.
Under the Pharmaceutical Affairs Law, importationof medical devices into Japan must be approved bythe Ministry of Health and Welfare unless the devicesbear the Japanese Industrial Standards Committee (JIS)mark of approval (243). The term medical device in-cludes instruments for use in the diagnosis, cure, orprevention of disease in man or animals, or intendedto affect the structure or function of the body andwhich are designated by Cabinet Order.
Two types of licenses are necessary to import a med-ical device. The first is a license for professional im-portation, a general license required of all importers,which signifies that a company or person is qualifiedto sell medical equipment in Japan. The purpose of thislicensing procedure is to ensure that each company im-porting medical equipment to Japan has the capabil-ity and knowledge to service the equipment and in-struct purchasers in its proper use. Each office of animporting firm must be separately licensed for profes-sional importation. These licenses are valid for only3 years.
Each type of medical device to be imported mustalso be granted a separate product license, which isto ensure the quality, safety, and efficacy of the de-vice (243). To be granted a license, the device, if it hasnot already received the JIS mark, must go througha time-consuming and rigorous testing and approvalprocess. Virtually any modification in the design ortype of a device being imported, even if it does notchange the product’s performance, requires a repeti-tion of the product approval process discussed below,as though an entirely new product was being licensed.
Until August 1983, only an importer could applyfor a product license. The theory behind this require-ment was that the importer, rather than the foreignmanufacturer, actually stood behind the device in Ja-pan for product liability and all other purposes. Forthis reason, transfer of a product license from one im-porter to another was forbidden. The effect of this re-quirement was to limit drastically the ability of over-seas suppliers to change their Japanese distributionagents, since switching agents required submitting anew product license application, causing delays of 6months to 2 years.
In response to growing pressure from European andU.S. Government agencies (3) and trade groups, theJapanese Ministry of Health and Welfare in April 1983announced planned changes in the importer and prod-uct licensing process (173). The most significant mod-ification was that, effective August 1, 1983, a foreignmanufacturer could apply for a product import license.The foreign manufacturer must submit the same docu-

224 . Federal Policies and the Medical Devices Industry
ments and data relating to a device’s safety and efficacythat are required of an importer applicant and desig-nate an “in-country caretaker, ” who handles the re-sponsibilities ordinarily imposed on a domestic man-ufacturer.
Approval of a foreign manufacturer’s product im-port application also depends on the payment of allcosts for an onsite inspection of the foreign manufac-turer’s overseas facilities. Theoretically, all U.S. man-ufacturers importing new devices to Japan will be sub-ject to inspection. A “grandfather clause” limits theapplicability of this new system to medical devices notcurrently on the Japanese market. A recent change inthe regulations issued under the medical device lawallows product licenses to be transferred from one im-porter to another in certain cases.
Japan applies GATT tariffs to medical devices. Therates now average between 6 and 8 percent and arescheduled to decrease by 0.5 percent on average in1984 (122). Japan has adopted the basic Customs Co-operation Council Nomenclature (CCCN) for purposesof classifying imports, including medical devices.
Product Approval Process
Applications for approval of the product license dis-cussed above are made to the local prefectural gov-ernment and must be accompanied by the results ofclinical tests conducted in Japan (242). If the deviceis identical to an already approved item or has receivedthe JIS mark, approval by the Pharmaceutical AffairsBureau is automatic. Otherwise, a minimum of twoclinical studies conducted in authoritative general oruniversity hospitals is required. Because tests con-ducted only on Japanese nationals are acceptable, U.S.firms have to repeat clinical tests in Japan that havealready been conducted elsewhere (3).
The time elapsed between submission of an applica-tion and the receipt of final approval is a minimumof 3 months and can be as much as a year or more(215). The Government official responsible for the re-view need not inform the manufacturer in advance ofthe data needed and may require additional studies andinformation. As a result, considerable time elapses ifthe Ministry of Health and Welfare returns applica-tions for more data.
Another problem that has been raised during U. S.-Japan discussions of medical device regulation is theneed to apply to local prefectural offices, which thenforward data to the Ministry of Health and Welfare.The U.S. Government has urged Japan to allow localprefectures to approve routine applications, such aschanges in the color and size of a product.
JIS, a part of MITI, has broad powers to establishstandards for industrial products. JIS standards are not
usually identical to the corresponding international orU.S. standards. Although devices are not required bylaw to conform to JIS standards, and some domes-tically manufactured items that do not conform areactually sold in Japan, it is very difficult to import andsell products that do not conform to JIS standards.
Foreign manufacturers can apply for permission toattach the JIS emblem to their products under the In-dustrial Standardization Law (Law No. 185, 1949,revised 1980). Permission to use the mark is given ona plant-by-plant basis after an onsite inspection by offi-cials of the applicable Ministry. Depending on thenature of the medical device, permission to use the JISmark must be approved by MITI. JIS has promulgatedhundreds of standards relevant to medical devices(122). The general standards are usually similar to thestandards promulgated by the International Electro-technical Commission. Specific JIS standards havebeen established for some electromedical devices in-cluding cardiographic, electroencephalographic, andaudiometric. A program is now under way to put intoplace specific standards for 38 additional electromedi-cal devices.
Under the Pharmaceutical Affairs Law, the Minis-try of Health and Welfare has developed its own stand-ards for certain medical devices such as contact lensesand artificial heart valves for which sterilization is par-ticularly important. Products for which Ministrystandards have been developed require for importa-tion certification that they conform with the standards.Obtaining this certification involves testing samplesin Japan.
Other Market Factors
Both established business practices and Governmentregulation hinder the importation of medical devicesinto Japan.
The Japanese Government has set up the GOTODACommittee to study ways of bringing the Japanese cer-tification process and standards more in line with in-ternational practice (195). The committee’s recommen-dations have led to Government modification of someregulations, such as the product import license schemeabove. However, a number of regulatory barriers haveremained, such as the requirements that clinical testingbe performed on Japanese people; that electromedicaldevices remain at the point of entry until they havebeen inspected and approved for release; and that theproduct approval process be repeated for very minormodifications not affecting a device’s performance orsafety.
Many U.S. firms operating in Japan also believe thatthe Japanese Government enforces its product licens-ing requirements unequally, to the disadvantage of im-

App. I—Governmental Regulation of International Trade in Medical Devices ● 225
porters. Because the Ministry of Health and Welfarelacks a domestic enforcement arm similar to the FDA’sfield force, violations of the product licensing require-ment may go undetected.
The existing system of distribution is also a stumblingblock to expansion of the import market in medicaldevices. U.S. firms and their subsidiaries have gener-ally relied on domestic sales agents to sell their prod-ucts, Direct sales by importers to end-users wereunheard of until the recent changes in Japanese regu-lations effective August 1, 1983. Direct sales will prob-ably remain rare for a while, given the importance ofpersonal ties to the market and the requirement thatforeign firms wishing to sell to an end-user must ob-tain a license for professional importation which in-volves inspection of each plant where the product ismanufactured. Such licenses, however, are not re-quired for import sales to distributors or other firmsthat resell the equipment to end-users.
Although most U.S. manufacturers of medical de-vices have not had Japanese subsidiaries, a growingnumber of U.S. firms, including Beckman Instruments,Inc., American Hospital Supply Corp., and BaxterTravenol Laboratories, Inc., have set up subsidiariesto promote Japanese sales. Using subsidiaries assuresbuyers that the seller has the knowledge and abilityto give proper instruction in use of the device and toservice it after sale, both important factors in sellingvery sophisticated electromedical devices.
Sales to an agent remain the most common form ofproduct distribution, not only for medical devices butalso for many other imported products. However, thesystem of selling through agents results in one or moremarkups of the device’s price, which pushes the priceof foreign products above those of comparable Japa-nese products.
United Kingdom
The United Kingdom has traditionally been a ma-jor market for medical devices because of its exten-sive and sophisticated health care system. In 1982, totalsales of medical equipment in the United Kingdomwere in excess of $600 million (52). The size of the U.K.medical device market is linked directly to expendituresfor the nationalized health care system, which hasslowed considerably during the 1980s.
In 1982, the United Kingdom imported $537 millionof medical devices. The United States had the largestshare of the total U.K. import market for medicaldevices with 28 percent, up from 25 percent in 1980(52). It is expected that the U.S. share will continueto increase to nearly 36 percent of total imports by1987. Increases in medical device imports from other
major suppliers will reflect both increased competitionamong foreign suppliers to maintain their sales and de-creased sales by U.K. domestic suppliers. The majornew products in which U.S. suppliers are expected todo well over the next 5 years are high-technologyitems, such as laser technology, fiber optics, andmicro-surgical equipment.
Import Requirements
The general British import regulations applicable toall imported goods do not appear to significantly im-pede the importation of medical devices (105). Nor areforeign manufacturers of medical devices required toobtain Government-issued clearances when their goodsare imported into the United Kingdom. Foreign con-cerns are permitted to negotiate directly with the end-user, and there is no requirement that the transactionbe reported to the Government. Imported medical de-vices are subject only to routine customs procedures.
As a member of the European Community, theUnited Kingdom does not impose tariffs on the prod-ucts of European Community member states. There-fore, members can sell medical devices in the UnitedKingdom at a competitive advantage. The UnitedKingdom along with many other European countriesadheres to the CCCN for the classification of medicaldevices. Having a standardized category of goodssimplifies the import and export of medical devices.
British tariff duties do not impose a substantial bar-rier to the importation of medical devices. The dutyrates on most medical devices range from 5 to 8 per-cent ad valorem and are generally comparable to orslightly below similar tariffs in the United States. Cer-tain medical device imports, such as those intendedfor training and research or for sale to nonprofit in-stitutions may be exempted altogether from the im-position of duties.
In addition to being subject to duties imposed ondevices from non-European Community countries, allimported medical equipment is subject to a 15-percentvalue-added tax (VAT) imposed on the duty-paidvalue of the goods. The VAT is imposed in order toequalize the treatment of imported devices with thosemanufactured in the United Kingdom, which are al-ready subject to a VAT.
Product Approval Process
Although medical devices sold in the United King-dom are not generally subject to the drug laws or toany mandatory scheme comparable to the controls ex-ercised by the FDA, regulations do apply to the medi-cal device market. Many medical devices are regulatedby two divisions of the Department of Health and

226 ● Federal Policies and the Medical Devices Industry
Social Security. The Medicines Division controls themanufacturing, licensing, clinical trial, certification,safety, efficacy, pre-market approval, labeling, qualitycontrol and adverse-reaction reporting of those devicessubject to the provisions of the Medicines Act of 1968,as amended. Although the Medicines Act applies pri-marily to drugs, it also covers such devices as surgi-cal sutures, dental filling substances, contact lenses,intrauterine contraceptive devices, and certain radioac-tive medicinal products (174).
The Supplies, Industries, and Exports Division ad-ministers the Drug Tariff, which lists products thatmay be prescribed and distributed through the Nation-al Health Service (NHS). In addition, this division setsspecific purchasing requirements for such medicaldevices as X-ray equipment, hemodialysis machines,and surgical implants (174). The activities of the divi-sion are focused on devices that the Government pur-chases in large volume and on products that, if foundto be defective, would pose a substantial hazard to thepublic health and welfare. Through the Supplies, In-dustries, and Exports Division, the Government, whichis by far the largest purchaser of medical devices, rou-tinely sets quality and safety standards for the prod-ucts it purchases. These standards, adhered to bydomestic procedures, must be complied with by im-porters in order to sell in the U.K. market.
The Government also influences, unofficially, thetypes and specifications of other medical devicesthrough a voluntary system of manufacturer registra-tion that operates through the National Health Serv-ice (174), Under the control of the Scientific and Tech-nical Branch of the Supplies, Industries, and ExportsDivision, this system allows manufacturers of medi-cal devices to voluntarily register their businessesunder certain “good manufacturing practice” guidesthat have been developed in consultation with Britishtrade associations.
Registration certifies that equipment manufacturedby the concern meets certain safety and effectivenesscriteria. The guides cover the entire manufacturingprocess, from training of personnel to packaging, la-beling, and possible recall. The first guide, applicableto sterile, single-use medical devices, became effectivein 1982. Guides are expected to be issued for numer-ous areas in the future.
Although NHS hospitals are not required by law tomake purchases from registered manufacturers, thesystem contains incentives to encourage registration.The Health Service Supply Council will circulate listsof registered manufacturers along with a recommen-dation that products should be purchased only fromlisted manufacturers. In effect, then, the Scientific andTechnical Branch’s advisory standards will guide the
purchase of medical equipment by NHS hospitals. Be-cause these hospitals do most of the medical equip-ment purchasing, it will generally be good businesspractice for a device manufacturer to register undera “good manufacturing practice” guide, if one applies.
The combination of standards for Government pur-chases and reliance by private purchasers on thosestandards acts as an unofficial regulatory scheme forboth imported and domestic medical devices sold inthe United Kingdom. The result is a degree of regula-tion of medical devices, that, though lacking a statu-tory basis, is as pervasive as that existing in almostany other country. The “voluntary” registration pro-cedure will soon augment the power of these indirectcontrols even further.
Certain medical devices, including electrical andradiological medical equipment, must also complywith standards issued by the British Standards Insti-tution (BSI) (52). These standards may pose signifi-cant obstacles to U.S. manufacturers, since compliancewith U.S. standards does not always satisfy all U.K.requirements. In general, compliance with the stand-ards of BSI is now as important in the sale of electri-cal medical devices as compliance with a standarddeveloped by the Supplies, Industries, and ExportsDivision.
Other Market Factors
Since Government agencies purchase the vast ma-jority of all medical devices sold in the United King-dom, marketing strategy must be aimed at Govern-ment, rather than private, procurement. Purchases byGovernment hospitals and other agencies have in thepast been made primarily at the local level, rather thanthrough a centralized purchasing system. This decen-tralized purchasing system for NHS hospitals hasresulted in hospitals’ buying equipment which may notbe exactly what they need, or paying more for equip-ment because they are not buying in large quantities.In an effort to overcome these problems, NHS hasrecently revised its purchasing procedure to set up 17regional purchasing centers and a new, national SupplyCouncil to act as a central purchasing agency for high-volume equipment purchases (52).
France
The French market for all medical equipment wasan estimated $356 million in 1980, with imports ac-counting for about 70 percent of that market (286).Exports of French medical equipment have averagedabout 80 percent of imports to France. During the lastdecade, the United States replaced West Germany as

App. I—Governmental Regulation of International Trade in Medical Devices ● 227
the leading exporter of medical equipment and in 1980provided about 24 percent of all imported medicalequipment to France.
Import Requirements
In addition to the regular documents for import, nu-merous medical devices require technical visas, whichpermit surveillance of the quantity and price of im-ports (286). Technical visas are required for anestheticequipment, syringes and surgical supplies, special diag-nostic equipment, blood transfusion apparatus, andelectrostatic units containing artificial radioactiveelements.
Tariffs on most imported medical equipment rangebetween 5 and 13 percent (286) and apply only togoods outside the European Community. Under com-mitments made at the Tokyo Round of GATT, thesetariff rates should decrease slightly over the next fewyears. France does impose a VAT of 17.6 percent onmost goods, including medical devices, regardless oftheir source.
Product Approval Process
A combination of technical standards and productapproval requirements necessary for government pur-chases and reimbursement payments constitutes an in-direct but comprehensive system of regulation. The ef-fectiveness of this system is increased by the relianceprivate parties place on official standards in makingtheir own purchasing decisions.
The French Pharmacopeia3 sets forth detailed puritystandards for drugs and “sterile devices, ” such as sur-gical dressings, sutures, certain implants, absorbentcotton, and a variety of plastic products. Pharma-copoeia requirements technically apply only to prod-ucts that are sold to public institutions or to productsthat claim to comply with the Pharmacopoeia. How-ever, their role in practice is far broader, since privatepurchasers also rely on compliance with Pharmacopoeiarequirements as an indication of quality (164).
For certain medical devices that are to be sold topublic institutions, French law requires official gov-ernment approval through “homologation.” The Com-mission d’Homologation periodically lists certain cat-egories of devices that must be approved before theycan be purchased by a public institution. Manufac-turers must formally apply to the commission, whichrequires submission of test reports by the manufac-
3The French Pharmacopoeia has semiofficial status in France, under theauthority of the Ministry of Public Health. Although its definitions, proce-dures, and standards do not have the same force and effect, as for example,FDA regulations in the United States, it is used as a guideline to identify healthand safety violations associated with various drugs and medical devices.
turer. At the end of the process, a proposal is madeto the Ministry of Health, which issues an approvaldecree and a homologation number (164). Many man-ufacturers submit their products to the homologationprocess even when they are not required to do so, be-cause products with official approval have a largermarket.
Certain medical devices sold to public agencies arealso subject to technical standards developed with thecooperation of industry and the Association Francaisedu Normalization (AFNOR), a governmental stand-ards body. These standards are imposed by variousagencies of the national government (286). These prod-ucts may not be imported unless the Ministère de l’ln-dustrie, du Commerce et de l’Artisunat has certifiedthat they conform with the applicable technical stand-ards. If the relevant standards are developed or ad-ministered by a department other than the Ministèrede l’Industrie, initial testing and approval of the de-vice will be done by that department.
The difference between the AFNOR standards andthose under the homologation process is that theAFNOR standards cover very technical matters suchas the electrical workings of a device, while the homo-logation process is a much more general product ap-proval process dealing with both electrical and non-electrical devices. Compliance with AFNOR standardscan be useful in marketing a product. Conformity isshown by an “NF” mark on the label, which can onlybe used with permission of AFNOR after testing of theproduct and inspection of the manufacturing premises.4
Other Market Factors
Government procurement is a very important fac-tor in the French medical device market, with pur-chases by public hospitals accounting for the largestsegment of the market. A central purchasing grouprepresenting public hospitals, the Union de Groupe-ments d’Achats Publiques, accounts for over one-halfof the medical equipment purchases by all public hos-pitals (376). Acceptance by this group can assure aproduct’s success, particularly since private purchas-ing decisions tend to follow government procurementdecisions.
Government purchases are made in one of threeways: through privately negotiated contracts, throughcompetitive bidding, and through bidding where fac-tors other than price are considered. But despiteFrance’s adherence to the Agreement on GovernmentProcurement under GATT, a 1975 “Buy French” pol-icy does apply to purchases of numerous products—including external blood collection systems, hyperbaric
4See Exporters’ &cyc]opec/ia, at 2:481-482 (105).

228 • Federal Policies and the Medical Devices Industry
chambers, body scanners, and artificial kidney ma-chines (286). The requirement for Ministry of PublicHealth “advice” on purchases of “innovative” equip-ment by the public sector (previously limited to “heavyequipment”) often takes the form of approved lists ofsuppliers.
In addition, an effort is being made to strengthenthe capabilities of regional health authorities for pro-viding advice on contemplated purchases. Such “ad-vice” is unlikely to favor U.S. suppliers if viable localalternatives exist, or where a manufacturer is a signif-icant local employer. Indeed, U.S. manufacturers havebeen informed that new products will not be approvedby the French authorities for purchase where there isa competitive French-manufactured device (284).
France also requires companies importing diagnos-tic products to set up a quality control laboratory inFrance to recheck every shipment, regardless of wheth-er it has undergone quality control audits in the coun-try of origin. No shipment of medical devices will belicensed without testing in a Government-approvedlaboratory (444).
Federal Republic of Germany
In 1980, sales of medical equipment and supplies inthe Federal Republic of Germany totaled more than$1.5 billion (188). In 1979, the United States was theleading foreign supplier of medical equipment with 25percent of imports (377).
Import Requirements
Products of European Community, Western Euro-pean, and developing countries are not subject to im-port duties (188). Tariff rates applicable to medicalequipment from other countries average 6 to 9 per-cent, with a maximum of about 11 percent. Most im-ports are subject to a VAT of 13 percent, similar tothe VAT levied on domestically manufactured prod-ucts. Some imported manufactured products are sub-ject to special excise taxes in addition to the “importequalization tax. ” Foreign exporters to West Germanywho must pay both the tariff and the “import equaliza-tion tax” face a significant disadvantage (216).
Product Approval Process
Regulation of medical devices is similar to that ex-isting in the United States prior to the passage of theMedical Device Amendments of 1976, with regulationof some products as an outgrowth of the regulationof pharmaceuticals. The 1976 Law on the Reform ofDrug Legislation pertains to “fictitious drugs, ” whichinclude devices containing a drug, devices to be intro-
duced into the body, dressings and surgical sutures,and diagnostic products (94). Specific regulations havebeen promulgated to govern manufacture, licensing,clinical trials, reporting of adverse effects, and liabilityfor damage caused by drugs.
Although fictitious drugs are not now subject tothese regulations, the regulations could be extendedto them in the future. Under the Drug Reform Law,the government also has a number of enforcementtools that can be used against regulated devices con-sidered misleadingly labeled, unsafe, or ineffective.
Two provisions of the law are of special interest toimporters. First, surgical suture material and certaindiagnostic products may be imported outside the Euro-pean Community countries only if the importer ob-tains certification from a competent authority of themanufacturing country (such as FDA in the UnitedStates) that the World Health Organization’s goodmanufacturing practices have been adhered to or thatthe import is in the interest of the general public. WestGermany is in the process of adopting its own GMPregulations for the pharmaceutical industry, and thesewill apply to manufacturers of fictitious drugs.
Second, the law requires any person who marketsa medical device that comes under the Drug ReformLaw to maintain a place of business within West Ger-many. The European Community recently ruled thatthis requirement is illegal and has asked that it be abol-ished, but its future is uncertain.
Although the Drug Reform Law covers a relativelysmall segment of the medical device industry, a muchlarger segment is indirectly regulated. Regulationsissued under the German General Technical Law re-quire that the manufacturer of technical medical equip-ment is in proper condition and that either the manu-facturer or an expert has subjected the devices to finalinspection (192).
Test protocols may be required from the manufac-turer for certain types of equipment, and testing mustbe carried out at one of 34 designated institutions.Testing for most medical devices is voluntary, but isoften performed because it has some commercial valuefor the manufacturer. However, proposals have beencirculating in West Germany to make testing under thislaw mandatory for all electromedical devices.
Regulation of medical devices also occurs on a piece-meal basis through the work of the Deutsches InstitutFur Normung (DIN), the official standards body inWest Germany. DIN has developed standards in suchareas as the testing, storage, labeling, and packagingof products, and the materials, dimensions, and toler-ances to be used in manufacturing for a large numberof medical devices. Among the medical items for whichstandards exist are surgical dressings, implants, andtransfusion and hematological equipment. Although

App. l—Governmental Regulation of International Trade in Medical Devices ● 229
compliance with an applicable DIN standard is not re-quired by law, in practice it can be a major advan-tage in the marketplace to have a DIN mark of ap-proval on a product. Moreover, much interpretationof DIN standards is done in practice by West Germantest laboratories whose approval is very important formarketing a product in West Germany (458).
West Germany has a pharmacopoeia, but with onlylimited applicability to medical devices. Its main focusis drugs and only a few medical devices, such as sur-gical sutures and dressings, are included.
Other Market Factors
West Germany is a signatory to the GATT Agree-ment on Government Procurement. Although govern-ment spending represents a substantial portion of allhealth care expenditures, purchases of medical devicesare for the most part decentralized without the directinvolvement of Government agencies. In practice, thechief physician in a hospital or in one of its depart-ments makes all purchasing decisions. The major ex-ception involves purchases of $75,000 or more byuniversity clinics. Such purchases must be approvedby the German Research Association. There is no offi-cial “Buy German” policy, but the tendency of pub-licly financed health care institutions is to purchaseWest German products.
Mexico
The market for medical equipment in Mexico issmall but growing. Approximately $44.2 million wasspent during 1980 on medical equipment, includingmedical devices (28). Imports account for nearly 85percent of all purchases of medical equipment. TheUnited States is the largest exporter, with 38 percentof the market in 1980. The Federal Republic of Ger-many (18 percent in 1980) and France (9 percent in1980) are closest U.S. competitors. Devices for whichproduction is labor-intensive are generally supplied do-mestically, while devices that require highly techno-logical processes are often imported.
Import Requirements
The Mexican system of import control involves adual scheme of licensing and tariffs (105). Importersmay obtain a license by applying to the Ministry ofCommerce. The request is considered by one of 13committees that specialize in a particular portion ofthe tariff or by a special committee that considerslicense requests by Government agencies. Requests areusually acted on within 2 weeks. Imports by govern-
ment agencies must be approved in advance by thePublic Sector Imports Committee, and approval willbe withheld if a domestic product is available whichis reasonably competitive in price and quality.
Mexico maintains no special import requirementsfor most medical devices. One exception to this is thatall devices to be physically connected to a patient re-quire import permits from the Ministry of Industry andCommerce and the Ministry of Health and Assistance(378). However, these permits are neither difficult norcostly to obtain.
The majority of medical devices imported into Mex-ico are subject to tariffs which range from 2 to 35 per-cent (28). The median tariff is in the 10- to 15-percentrange, somewhat higher than other countries in thisstudy. The Mexican tariff generally follows CCCN.Mexico is not a signatory to the GATT. However, theonly countries with preferential tariffs are other mem-bers of the Latin America Integration Association(Argentina, Bolivia, Brazil, Colombia, Chile, Ecuador,Paraguay, Peru, Uruguay, and Venezuela) (378).
Product Approval Process
There is no specific system of product approval formedical devices under Mexican law. Certain devices,however, require approvals from Mexican commis-sions that act as counterparts to U.S. utility commis-sions. For example, all electrical devices must be ap-proved by the Federal Electricity Commission, a state-owned corporation, and equipment incorporatingradioactive materials must receive approval from theNuclear Energy Institute (378). There are also no offi-cial standards governing the design or use of medicalequipment in Mexico. Medical products, for the mostpart, can be brought directly into Mexico without anypreimport procedures.
Other Market Factors
The size of the Mexican medical device market andthe import share of that market are limited by a num-ber of factors. First, over 70 percent of all health careexpenditures in Mexico are Government-controlled(28). The emphasis of the two major Governmentagencies involved in the provision of health-relatedservices, the Institute for Social Security and the Sec-retariat of Health and Security, and of Mexican healthcare providers in general, is on the provision of basichealth care services. As a consequence, there is a verylimited market for sophisticated high-technology med-ical equipment, such as CT scanners and cardiac diag-nostic equipment, in which the U.S. medical deviceindustry is particularly strong.
25-406 0 - 84 - 1 6

230 ● Federal Policies and the Medical Devices Industry
Mexican governmental purchasing practices evi-dence a strong preference for domestically produceditems. The Government will procure medical equip-ment from foreign manufacturers only when the equip-ment cannot be domestically supplied. Indeed, theGovernment has a “closed border” policy under whichit will ban imports of products that compete directlywith goods manufactured in Mexico, including thosemanufactured by the Mexican subsidiary of a foreigncorporation. The effect of this policy on U.S. importshas not, so far, been great.
Finally, there is a highly developed system of im-port agents who take responsibility for obtaining
licenses and negotiating with foreign suppliers. Theagents arrange for the import of a good and supplythe ultimate end-user. Direct sales to end-users, al-though not rare, are not significant in volume whencompared either to sales to import agents or thosemade directly to the Government.
The medical devices market has also been affectedby the foreign exchange difficulties that Mexico is cur-rently experiencing. In late 1982, exchange controlswere placed on all foreign remittances from Mexicanbanks. These controls include Government approvalof import contracts requiring payment outside of Mex-ico, even for purchases by Government agencies.

Appendix J. —Glossary of Acronyms and Terms
Glossary of Acronyms
AAMI
AART
ACRSAFNOR
ANSI
AOAASTM
BMD
BSICABGCAPD
CCCN
CDCCEN
CENELEC
CFRCHAMPUS
CIDCLIA
CLMA
CONCPR
CSACTDENDHHS
DHSS
DINDISC
DMEDOCDRGsERTA
— Association for the Advancementof Medical Instrumentation
— American Association of Respira-tory Therapists
— Accelerated Cost Recovery System— Association Francaise de Normali-
sation— American National Standards Insti-
tute, Inc.— American Osteopathic Association— American Society for Testing and
Materials— Bureau of Medical Devices
(Canada)— British Standards Institution— coronary artery bypass graft— continuous ambulatory peritoneal
dialysis— Customs Cooperation Council No-
menclature– Centers for Disease Control (PHS)— European Committee for Standard-
ization— European Committee for Electro-
technical Standardization— Code of Federal Regulations— Civilian Health and Medical Pro-
gram of the Uniformed Services— commercial item description— Clinical Laboratory Improvement
Act— Contact Lens Manufacturers Asso-
ciation— Certificate of need— customary, prevailing, and rea-
sonable— Canadian Standards Association— computed tomography– Device Experience Network (FDA)— Department of Health and
Human Services— Department of Health and Social
Security (United Kingdom)— Deutsches Institut fur Normung— Domestic International Sales
Corp.— durable medical equipment— Department of Commerce— diagnosis related groups— Economic Recovery Tax Act of
1981
ESRDFDA
GAO
GATT
HCFA
HIDI
HIMA
HMOIDEIEC
IFAC
INDIVIPAIPPB
IRSISO
ITA
IUDJCAH
JISMEDIPP
MITI
NBS
NCCLS
NCINFPA
NHLBI
NHS
NIADDK
NIH
— end-stage renal disease— Food and Drug Administration
(PHS, DHHS)– General Accounting Office (U.S.
Congress)— General Agreement on Tariffs and
Trade-- Health Care Financing Administra-
tion (DHHS)— Health-Care Instrument and Device
Institute— Health Industry Manufacturers’
Association— health maintenance organization— investigational device exemption— International Electrotechnical Com-
mission— Industry Functional Advisory
Committee (DOC)— investigational new drug— intravenous— individual practice association— intermittent positive pressure
breathing— Internal Revenue Service— International Organization for
Standardization— International Trade Administration
(DOC)— intrauterine device— Joint Commission on Accreditation
of Hospitals– Japanese Industrial Standards— Medical District Initiated Program
Planning— Ministry of International Trade
and Industry (Japan)— National Bureau of Standards
(DOC)— National Committee on Clinical
Laboratory Standards– National Cancer Institute (NIH)— National Fire Protection Asso-
ciation— National Heart, Lung, and Blood
Institute (NIH)— National Health Service (United
Kingdom)— National Institute of Arthritis,
Diabetes, Digestive, and KidneyDiseases (NIH)
– National Institutes of Health (PHS,DHHS)
231 <
232 • Federal Policies and the Medical Devices Industry
NMR – nuclear magnetic resonanceNSF – National Science FoundationOEA – Office of Export Administration
(DOC)OHTA – Office of Health Technology (PHS,
DHHS)OIML – International Organization for
Legal MetrologyOMB – Office of Management and BudgetOTA — Office of Technology Assessment
(U.S. Congress)PHS – Public Health Service, DHHSPMAA – premarket approval applicationPRO — peer review organizationPSRO – Professional Standards Review Or-
ganizationR&D research and developmentRehab R&D - Rehabilitation Research and Devel-
SBICSBIRSICTEFRA
TÜVUCR
ULU.S.C.USTRVAVAMKC
VAREC
VATVDE
WHOYAG
opment— Small Business Investment Corp.— Small Business Innovation Research— Standard Industrial Classification— Tax Equity and Fiscal Responsibil-
ity Act of 1982— Technischer Uberwachungs Verein— usual, customary, and reasonable
charges— Underwriters Laboratories, Inc.— United States Code— U.S. Trade Representative— Veterans Administration— Veterans Administration Marketing
Center— Veterans Administration Rehabili-
tation Engineering Center— value added tax— Verband Deutscher Elektro-
techniker— World Health Organization— yttrium aluminum garnet
Glossary of Terms
Applied research: Investigation whose objective is togain knowledge or understanding necessary fordetermining the means by which a recognized andspecific need may be met.
Basic research: Original investigation whose objectiveis to gain fuller knowledge or understanding of thefundamental aspects of phenomena and of obser-vable facts without specific applications in mind.
Capital costs: Expenditures for plant and equipmentused in providing a service. Under Medicare’s pro-
spective hospital payment system established by theSocial Security Amendments of 1983 (Public Law98-21), hospitals’ capital costs (depreciation, inter-est, and return on equity to for-profit institutions)are treated as passthroughs (i. e., are not subject tothe new system’s controls).
Certificate of need (CON): A State regulatory plan-ning mechanism encouraged by the National HealthPlanning and Resources Development Act (PublicLaw 93-641) to control expenditures for and distri-bution of expensive medical care facilities andequipment. CON applications are reviewed by localhealth systems agencies, which recommend ap-proval or disapproval to State health planningagencies.
Class 1: One of three regulatory classes set up by the1976 Medical Device Amendments (Public Law 94-295). Class I, general controls, contains devices forwhich general controls authorized by the act are suf-ficient to provide reasonable assurances of safetyand effectiveness. Manufacturers of Class I devicesmust register their establishments and list their de-vices with the Food and Drug Administration (FDA),notify FDA before marketing a device, and conformto good manufacturing practices.
Class II: The regulatory class of devices for which gen-eral controls are considered insufficient to assuresafety and effectiveness and information exists toestablish performance standards.
Class III: The regulatory class of devices for whichClass I general controls are insufficient to ensuresafety and effectiveness, information does not ex-ist to establish performance standards, and thedevice supports life, prevents health impairment,or presents a potentially unreasonable risk of illnessor injury.
Conditions of participation: Requirements that a pro-vider must meet in order to be allowed to receivepayments for Medicare patients. An example isthe requirement that hospitals conduct utilizationreview.
Development: Systematic use of the knowledge or un-derstanding gained from research in the design anddevelopment of prototypes and processes.
Device type: All products of a particular type or agrouping of separate types of devices that aresimilar, as categorized by FDA. FDA has classifieddevice types according to the potential risk posedby their use and the degree of regulation required.
Diagnosis related groups (DRGs): Groupings of diag-nostic categories drawn from the InternationalClassification of Diseases and modified by the pres-ence of a surgical procedure, patient age, presenceor absence of significant comorbidities or complica-

App. J—Glossary of Acronymns and Terms • 233
tions, and other relevant criteria. DRGs are thecase-mix measure mandated for Medicare’s prospec-tive hospital payment system by the Social Secu-rity Amendments of 1983 (Public Law 98-21).
DRG payment: The system of prospective payment forinpatient services by Medicare which was mandatedby the Social Security Amendments of 1983.
Good manufacturing practices: Requirements regard-ing the manufacturing, packing, storage, and instal-lation of devices required under the Medical DeviceAmendments of 1976 and applicable to all three reg-ulatory classes of devices.
Investigational device exemption (IDE): A regulatorycategory and process under which FDA permits lim-ited use of an unapproved medical device in con-trolled settings for the purpose of collecting dataon safety and effectiveness. This information maysubsequently be used in support of a premarketingapproval application.
Medical device: Any instrument, apparatus, or simi-lar or related article that is intended to prevent,diagnose, mitigate, or treat disease or to affect thestructure or function of the body.
Medical technology: The drugs, devices, and medicaland surgical procedures used in medical care, andthe organizational and support systems withinwhich such care is provided.
Nuclear magnetic resonance (NMR) imaging: A diag-nostic imaging modality that uses radiowaves andpowerful magnetic fields rather than ionizing ra-diation.
Orphan product: Defined by the Orphan Drug Act of1983 (Public Law 97-414) as drugs and medicaldevices for rare diseases or conditions.
Peer review organizations (PROS): Physician organi-zations established by the Tax Equity and FiscalResponsibility Act of 1982 (Public Law 97-248) toreplace Professional Standards Review Organiza-tions. Hospitals are mandated to contract withPROS to review quality of care and appropriate-ness of admissions and readmissions. PROS are alsotermed utilization and quality control peer revieworganizations.
Postamendments device: A medical device first mar-keted after May 1, 1976, when the Medical DeviceAmendments took effect.
Preamendments device: A medical device marketedbefore May 1, 1976, when the Medical DeviceAmendments took effect.
Premarket approval application (PMAA): An applica-tion to FDA for approval to market a new device.The sponsor of the device must submit to FDA in-formation to document its safety and effectivenessbefore the drug may be marketed.
Procedure (medical or surgical): A medical technol-ogy involving any combination of drugs, devices,and provider skills and abilities. Appendectomy, forexample, may involve at least drugs (for anesthe-sia), monitoring devices, surgical devices, and theskilled actions of physicians, nurses, and supportstaff.
Professional Standards Review Organizations (PSROs):Community-based, physician-directed, nonprofitagencies established under the Social Security Amend-ments of 1972 (Public Law 92-603) to monitor thequality and appropriateness of institutional healthcare provided to Medicare and Medicaid benefi-ciaries.
Prospective payment: Payment for medical care on thebasis of rates set in advance of the time period inwhich they apply. The unit of payment may varyfrom individual medical services to broader cate-gories, such as hospital case, episode of illness, orperson (cavitation).
Standard Industrial Classification (SIC) codes: A cat-egorization of data on products and companies thatis used by the U.S. Department of Commerce. Es-tablishments (plants) are assigned to SIC “indus-tries” on the basis of their primary line of business.However, SIC data on shipments of a specific prod-uct include all shipments of the relevant product,regardless of the “industry” in which the produc-ing establishment is classified.
Substantially equivalent device: A device first mar-keted after the 1976 Medical Device Amendmentsthat FDA has found to be similar to a device alreadybeing marketed. To be found substantially equiva-lent, a postamendments device need not be iden-tical to a preamendments device, but must not dif-fer markedly in materials, design, or energy source.
Third-party payment: Payment by a private insureror government program to a medical provider forcare given to a patient.
Transitional devices: Devices that were regulated asnew drugs before enactment of the 1976 MedicalDevice Amendments.

References

References
1.
2.
3.
4.
5.
6.
7.
8.
9.
10.
11.
12.
13.
14.
Abelson, D. S., Director, Technical Trade Bar-riers, Office of the U.S. Trade Representative,Washington, DC, personal communication,NOV. 29, 1983.Adams, W., Surgilite International, Inc., com-ments made at OTA workshop, December 1982.Agress, P., “Problems Encountered in Market-ing U.S. Medical Devices in Japan: DiscussionsBetween the Two Governments Aimed at Eas-ing Difficulties, ” Food Drug Cosmetic Law J.38:43, 1983.American Association for Respiratory Ther-apists, “Guidelines for the Use of IntermittentPositive Pressure Breathing,” Dallas, TX, April1979.American Health Planning Association, Reportof the Commission on Capital Policy, Washing-ton, DC, March 1984.American Hospital Association, Division ofHealth Financing Policy, Office of Public Pol-icy Analysis, Hospital-Blue Cross Contract Pro-visions, July 1, 1981, AHA catalog No. 073200,Chicago, IL, February 1982.American Hospital Association, Hospital Regu-lation, Report of the Special Committee on theRegulatory Process, Chicago, IL, 1977.American Hospital Association, Office of Pub-lic Policy Analysis, “Incorporating Capital Costsinto Medicare Prospective Prices, ” unpublisheddraft, Chicago, IL, July 1983.American National Standards Institute, Direc-tory of International and Regional StandardsOrganizations (New York: ANSI, 1982).American Society for Parenteral and Enteral Nu-trition, “Parenteral and Enteral Nutrition, ” un-published briefing paper, Washington, DC,Nov. 18, 1982.American Society for Parenteral and Enteral Nu-trition, Public and Private Insurance Coverageof Parenteral and Enteral Nutrition Services,background paper prepared by Memel, Jacobs,Pierne & Gersh, Washington, DC, March 1983.AMP, Inc. v. Gardner, 389 F. 2d 825 (1968);cert. denied 393 U.S. 825 (1968).Anbar, M., “University-Based R&D: A New De-velopment in National Economy, ” Medical De-vice & Diagnostic Industry 5(12):26-29, Decem-ber 1983.Anderson, G., and Ginsburg, P. B., “Prospec-tive Capital Payments to Hospitals,” Health Af-fairs 2(3):52-63, fall 1983.
15<
16.
17.
?.8.
19.
20.
21.
22.
23.
24.
25.
26.
Arakaki, E., U.S. Department of Commerce,Washington, DC, personal communications,February and August 1984.Arizona Board of Regents, “Patent Policy of theArizona Board of Regents,” adopted Apr. 16,1977,Arthur D. Little, Inc., Cost of Compliance WithGood Manufacturing Practices Regulations bythe Medical Device Industry, prepared for theFood and Drug Administration, Department ofHealth and Human Services, contract No. 223-79-8052 (Springfield, VA: National Technical In-formation Service, Department of Commerce,March 1982).Arthur Young & Co. and The Emergency CareResearch Institute, A Profile of the MedicalTechnolog y Industry and Governmental Pol-icies, final report, vol. 1, contract No. 233-79-3011, report to the National Center for HealthServices Research, U.S. Department of Healthand Human Services, Hyattsville, MD, June 30,1981.Axelson, P., U.S. Veterans Administration Re-habilitation Research and Development Center,Palo Alto, CA, personal communication, July1983.Ayres, S. M., “Magnitude of Use and Costs ofIn-Hospital Respiratory Therapy,” Am. Rev.Resp. Dis. 122(5):11-13 (pt. 2), November 1980.Baker, D. F., speech presented at the Ninth An-nual AAMI/FDA Conference on Medical De-vice Regulation, Arlington, VA, Nov. 10, 1982.Bandy, W. C., U.S. Department of Commerce,Bureau of Industrial Economics, Washington,DC, personal communication, January 1983.Banta, H. D., “Computed Tomography: CostContainment Misdirected” (editorial), Am. J.Public Health 70:215, 1980.Banta, H. D., Ruby, G., and Burns, A. K.,“Using Coverage Policy to Contain MedicareCosts,” in U.S. Congress, House Committee onWays and Means, Subcommittee on Health,Proceedings of the Conference on the Future ofMedicare, Committee Print No. 23 (Washing-ton, DC: U.S. Government Printing Office,1984).Barach, A. L., and Segal, M. S., “The Indiscrim-inate Use of IPPB, ” JAMA 231(11):1141-1142,Mar. 17, 197s.Barth, J. R,, and Cordes, J. J., “Capital Mar-kets, Government Regulation, Tax Policy and
237

238 ● Federal Policies and the Medical Devices Industry
27.
28.
29.
30.
31.
32.
33.
34.
35.
36.
37.
38.
39.
40.
41.
the Financing of Medical Device Innovations, ”contract report prepared for the Office of Tech-nology Assessment, U.S. Congress, Washing-ton, DC, February 1984.Barth, J. R., Cordes, J. J., and Tassey, G., “TheImpact of Recent Changes in Tax Policy on In-novation and R& D,” in Strategic Managementof Industrial R&D: Interdisciplinary Perspec-tives, B. Bozeman, M. Crow, and A. Link (eds.)(Lexington, MA: Lexington Books/D.C. Heath& Co., 1984).Batres, Valdes, Wygard y Associadoes, S. C.,“Market Survey of Medical Equipment (Mexi-co), ” prepared for U.S. Trade Center, April1982.Beck, R. H., “The Effects of Copayment on thePoor,” ]. Hum. Resour. (1):129, 1974.Becton, Dickinson& Co. v. Food and Drug Ad-ministration; United States v. Becton, Dickin -son & Co.; and In the IWatter of the Establish-ment Inspection of Bard-Parker, Division ofBecton-Dickinson Co.; 589 F. 2d 1175 (2d Cir.1978).Berenson, R., Washington, DC, persor.al com-munication, January 1984.Bialys, S., U.S. Veterans Administration, Hines,IL, personal communication, May 1983.Biles, B., Schramm, C. J., and Atkinson, J. G.,“Hospital Cost Inflation Under State Rate-Setting Programs,” Al. Engl. J. Med. 303(12):664, Sept. 18, 1980.Biomedical Business International, “Medical Nu-tritional: Markets, Trends, Outpatient Servicesand Synergies, ” VII(3) :18-19, Feb. 8, 1984.Biomedical Business International, “Trends inClinical Testing,” VI(14):124-126, Aug. 1 0 ,1983.Blue Cross and Blue Shield Association, “Med-ical Necessity Guidelines on Respiratory Care(Inpatient),” Chicago, IL, Oct. 20, 1982.The Blue Sheet, “Health Planning Will GetFunding If Legislation Clears,” 27(5):14-15, Feb.1, 1984.The Blue Sheet, “New York Certificate-of-NeedReview to Focus on New Projects’ OperatingCosts,” 26(25):12-13, June 22, 1983.Booker, H., U.S. Veterans Administration,Washington, DC, personal communications,November 1982 and April 1984.Bovbjerg, R. R., Diamond, L. H., Held, P. J.,et al., “Continuous Ambulatory Peritoneal Dial-ysis: Preliminary Evidence in the Debate OverEfficacy and Cost,” Health Affairs 2(2):96-102,summer 1983.Bozeman, B., Crow, M., and Link, A. (eds.),
42.
43.
44.
45.
46.
47.
48.
49.
50.
51.
52.
53.
Strategic Management of Industrial R&D: Inter-disciplinary Perspectives (Lexington, MA: Lex-ington Books/D.C. Heath & Co., 1984).Bradburd, R. M., “Veterans AdministrationProcurement and the Market for Medical Equip-merit, ” contract report prepared for the Officecf Technology Assessment, U.S. Congress,Washington, DC, Oct. 19, 1983 (draft).Braun, S. R., Smith, F. R., McCarthy, T. M.,et al., “Evaluating the Changing Role of Respi-ratory Therapy Services at Two Hospitals, ”)AMA 245(20):2033-2037, May 22-27, 1981.Brennan, M. F., “Total Parenteral Nutrition inthe Cancer Patient,” IVew Engl. J. Med. 30s(7):375-382, Aug. 13, 1981.Breslar, J., U.S. Veterans Administration, Wash-ington, DC, personal communications, May andJune 1983.Bridgman, E., “The Impact of the GATT Stand-ards Code and United States Trade AgreementAct on Private Sector Standards Development,”presented at the Ninth Annual AAMI/FDAConference on Medical Device Regulation, Arl-ington, VA, Nov. 10, 1982.Britain, R., U.S. Department of Health andHuman Services, Food and Drug Administra-tion, comments made at OTA Workshop on theMedical Device Amendments of 1976, Washing-ton, DC, May 19, 1983.Britain, R., U.S. Department of Health andHuman Services, Food and Drug Administra-tion, Silver Spring, MD, personal communica-tion, August 1983.Britt, M. R., Child, S. R., and Grantham, M.L., Reduction of Intermittent Positive PressureBreathing (IPPB) Usage in Surgical Patients bya PSRO, Utah PSRO, Salt Lake City, UT, n.d.Brook, R. H., Williams, K. N., and Rolph, J.E., “Controlling the Use and Cost of MedicalServices: The New Mexico Experimental Medi-cal Care Review Organization—A Four-YearCase Study,” Medical Care 16(9) (Suppl.), Sep-tember 1978.Bunker, J. P., Fowles, J., and Schaffarzick, R.,“Evaluation of Medical Technology Strategies:Evaluation of Coverage and Reimbursement,”IV. Engl. J. Med. 306(10):620, Mar. 11, 1982.Business Management Consultants, Ltd., “Surveyof the United Kingdom Market for MedicalEquipment, ” report prepared for the U.S. De-partment of Commerce, International TradeAdministration, Office of Trade InformationServices, Aldershot, Hampshire, U. K., June 1s,1983.Campbell, J,, “The 1976 Medical Device Amend-

References • 239
54,
55.
56.
57.
58.
59.
60.
61.
62.
63.
64.
65.
66.
67.
ments and the 510(k) Process, ” presented to theFood and Drug Law Institute, Washington, DC,May 1, 1983.Carney, T. P., President, Metatech Corp., pa-per prepared for the Office of Technology As-sessment, U.S. Congress, Washington, DC,1983.Carroll, M. S., and Arnett, R. H., III, “PrivateHealth Insurance Plans in 1977: Coverage,Enrollment, and Financial Experience,” HealthCare Finazz. Rev. 1(2):3, fall 1979.Carter, C., “Conditions for the Successful Useof Science,” Science 219(4590):1295-1298, Mar.18, 1983.Chassin, M., “Chapter IV, Certificate of Need,”Medica] Care 16(10) (%ppl.):21-26, October1978.Cherniak, et al., “Home Care of Chronic Res-piratory Disease,” JAMA 208:821, 1969.Chrysomilides, S. A., and Kaminski, M. V.,“Home Enteral and Parenteral Nutritional Sup-port: A Comparison,” Am. J. Clin. IVutr. 34(10):2271-2275, October 1981.Coelen, C., and Sullivan D., “An Analysis ofthe Effects of Prospective Reimbursement Pro-grams on Hospital Expenditures,” Health CareFinazz. Rev. 2(3):1, winter 1981.Cohen, A. B., and Cohodes, D. R., “Certificateof Need and Low Capital-Cost Medical Tech-nology,” Milbank Mere. Fund Q. 60(2):307-28,spring 1982.Cohen, J. S., Research Chemist, National Insti-tute of Child Health and Human Development,National Institutes of Health, Bethesda, MD,personal communication, Aug. 1, 1983.Cohodes, D. R., “The State Experience WithCapital Management and Capital ExpenditureReview Programs,” article cited in “Health Cap-ital Issues, ” papers presented at the Health Cap-ital Conference sponsored by the Bureau ofHealth Facilities, Feb. 19-20, 1980.Cohodes, D. R., “Which Will Survive? The $150Billion Capital Question, ” Inquiry 20:5-11,spring 1983.Collins, E., “Tax Incentives for Industrial R&D:Effects of the New Provisions and Proposals forFurther Action,” mimeo, National Science Foun-dation, Washington, DC, 1983.Comanor, W. S., “Market Structure, ProductDifferentiation, and Industrial Research,” Q. J.Econ. 85:639-657, November 1967.Committee for Economic Development, Re-search and Policy Committee, Stimulating 7’ech-
68.
69.
70.
71.
72.
73.
74.
75.
76.
77.
78.
79.
nological Progress (New York: The HeffernanPress, Inc., 1980).Cook, C., U.S. Veterans Administration, Wash-ington, DC, personal communication, Decem-ber 1982.Coombs, F., U.S. Veterans Administration,Washington, DC, personal communication, Jan-uary 1983.Cordes, J. J., “The Impact of Tax and FinancialRegulatory Policies on Industrial Innovation,”report of a workshop sponsored by the NationalResearch Council and the National Academy ofEngineering, July 20, 1978 (Washington, DC:National Academy of Sciences, 1980).Cromwell, J., Ginsburg, P., Hamilton, D., etal., Incentives and Decisions Underlying Hos-pitals’Adoption and Utilization of Major Cap-ital Equipment (Cambridge, MA: Abt Associ-ates, 1975), as cited in (351).Cromwell, J., and Kanak, J., “The Effects ofProspective Reimbursement Programs on Hos-pital Adoption and Service Sharing,” HealthCare Finan. Rev. 4(2):67, December 1982.Cutler, I. R., “The European Scene With Respectto Standards and National Regulatory Require-ments for Medical Devices and Equipment, ” pa-per presented at the Ninth Annual AAMI/FDAConference on Medical Device Regulation, Ar-lington, VA, Nov. 9-10, 1982.Cutler, S., Health Care Financing Administra-tion, Baltimore, MD, personal communication,Aug. 17, 1983.Damadian, R., Minkoff, L., Goldsmith, M., etal., “Tumor Imaging in a Live Animal by FieldFocusing NMR (Fonar),” Physiol. Chem. &Phys. 8:61-65, 1976.Damadian, R., Zaner, K., and Her, D., “HumanTumors by NMR,” Physiol. Chem. & Phys.5:381-402, 1973.Damadian, R., Zaner, K., Her, D., et al., “Hu-man Tumors Detected by Nuclear Magnetic Res-onance,” Proc. IVat. Acad. Sci. USA 71(4):1471-1473, 1974.Davis, C., Health Care Financing Administra-tion, testimony at hearing on Proposed Prospec-tive Reimbursement Rates for the End-Stage Re-nal Disease Program, before the Subcommitteeon Health, Committee on Finance, U.S. Senate,Mar. 15, 1982 (Washington, DC: U.S. Govern-ment Printing Office, 1982).Demlo, L. K., Hammons, G. T., Kuder, J. M.,et al., “Report of a Study on Decisionmakingby Medicare Contractors for Coverage of Med-

240 . Federal Policies and the Medical Devices Industry
80.
81.
82.
83.
84.
85.
86.
87.
88.
89.
90.
91.
92.
93.
94.
ical Technologies, ” College of Medicine andGraduate College of University of Iowa Hospi-tals and Clinics, contract report prepared for theOffice of Technology Assessment, U.S. Con-gress, October 1983 (draft).Devices and Diagnostics Letter, “FDA DeniesPetition To Simplify 510(k) Procedures,” 10(33),Aug. 1911983.Devices and Diagnostics Letter, “FDA LimitsNumber of YAG Laser Investigations, ” 10(50),Dec. 16, 1983.Devices am3Diagnostics Letter, “Firms Line UpBehind Petition To Revamp 510(k) Rule,” 10(1),Jan. 7, 1983.Devices and Diagnostics Letter, “HRG TakesNeuro Device Submission Argument to Dingell,”9(50), Dec. 10, 1982.Devices and Diagnostics Letter, “InvestigationalDevices Need Not Be Loss-Leaders,” 9(51):2,Dec. 17, 1982.Devices and Diagnostics Letter, “NaderitesSpurned On Effort To Force Device Standards,”9(49), Dec. 3, 1982.Devices and Diagnostics Letter, “PMA Require-ments May Stifle Cerebella Stimulator, ” 11(2),Jan. 13, 1984.Devices and Diagnostics Letter, “Progress To-ward Revising Class II Standards Starts, ” 10(48),Dec. 2, 1983.Devices and Diagnostics Letter, “YAG LaserStudies Limited to 500 Patients, 6 Months, ”10(41):1, Oct. 14, 1983.diMonda, R., “How Hospitals Perceive Stand-ards,” Medical Instrumentation 13(4):200-3,July-August 1979.Dolan, A. M., “The Development of Consen-sus Standards for Medical Devices in Canada, ”Medical Progress Through Technology 6(3):137-40, June 1979.Donaldson, J. L., Deputy Director, Office ofProducts Standards Policy, Office of the Direc-tor, National Bureau of Standards, Washington,DC, personal communication, Nov. 29, 1983.Dowdal, T. G., U.S. General Accounting Of-fice, letter to Carolyn K. Davis, Administrator,Health Care Financing Administration, re: Anal-ysis of Medicare Durable Medical EquipmentClaims in Georgia, Idaho, and Southern Califor-nia (GAO/HRD-84-40), Feb. 13, 1984.Downs, F., U.S. Veterans Administration,Washington, DC, personal communications,November 1982 and June 1983.Drug Reform Law (Law on the Reform of DrugLegislation), Federal Republic of Germany, Aug.24, 1976, Bundesgesetzblatt IBGB1].
95.
96.
97.
98.
98a.
99.
100.
101.
102.
103.
104.
105.106.
107.
108.
109.
110.
Dun & Bradstreet, Dun’s Financial Profiles, 1981Jndustry Norms, Three Years, vols. I and II,New York, November 1981.Dunkelberg, J, S., Furst, R. W,, and Roenfeldt,R. L., “State Rate Review and the RelationshipBetween Capital Expenditures and OperatingCosts,” Inquiry 20:240-247, fall 1983.Eads, G. C., “Regulation and Technical Change:Some Largely Unexplored Influences, ” Am.Econ. Rev. 70(2):50, May 1980.Eggers, P. W., Office of Research, Health CareFinancing Administration, Baltimore, MD, per-sonal communication, February 1984, as citedin (260).Eisner, R., Albert, S. H., and Sullivan, M. A.,“Tax Incentives and R&D Expenditures, ” pre-sented at the 16th CIRET Conference, Washing-ton, DC, September 1983.Eli Lilly & Co., “Lilly Hospital Pharmacy Sur-vey, ‘82,” Indianapolis, IN, 1982,Emergency Care Research Institute, “NMR: StillToo Early for Answers to Many Questions,” is-sues in Health Care Technology, November1983.Engelberg, A. B., “Patent Term Extension: AnOverreaching Solution to a Nonexistent Prob-lem,” Health Affairs 2:34-45, spring 1982.EUROTASC (European Regulatory-TechnicalAffairs Study Committee), Six-Volume Report,September 1981.Evans, C. C., U.S. Veterans Administration,Washington, DC, personal communication,Mar. 5, 1984.Evans, C. C., Holden, F., and Speight, J., “ADRG Based Resource Allocation System for theVeterans Administration,” Allocation Develop-ment Service, U.S. Veterans Administration,unpublished paper, 1983.Exporters’ Encyclopedia, 2:481-482, 1405-1428.Farrow, S. C., Kaluzny, A. D., and Ricketts,-r., “Proceedings of a Conference on HealthServices Research Issues in the Veterans Admin-istration, ” J. Med. Systems 5(1/2):1-16, 1981.Feder, J., Medicare: The Politics of Federal Hos-pital Insurance (Lexington, MA: LexingtonBooks, 1977).Feder, J., Hadley, J., and Mullner, R., “PoorPeople and Poor Hospitals: Implications forPublic Policy,” J. Health Polit. Policy Law,forthcoming.Feil, C., Associate Manager of Public Informa-tion, Underwriters Laboratory, Northbrook, IL,personal communication, September 1983.Feldstein, M. S., and Taylor, A. K., The Rapidl?ise of Hospital Costs, a report to the President’s

References • 241
111.
112,
113.
114.
115.
116.
117.
118.
119.
120.
121.
122.
123.
Council on Wage and Price Stability (Washing-ton, DC: U.S. Government Printing Office,1977).Feldstein, P. J., “Relying on Regulation To Im-prove Hospital Performance, ” FIeakh Care Eco-rtornics (New York: John Wiley & Sons, 1979).Fellner, W., “The Influence of Market Structureon Technological Progress, ” Quality J. Econ.65:560, November 1951, as cited in (274).Ferry, T. P., Gornick, M., Newton, M., et al.,“Physicians’ Charges Under Medicare: Assign-ment Rates and Beneficiary Liability, ” ~ealthcare I?inan. I?ev. 2:49-73, winter 1980,Fineberg, H. V., “Gastric Freezing—A Study ofDiffusion of a Medical Innovation,” in Instituteof Medicine and National Research Council,Medical Technology and the Health Care Sys-tem: A Study of Equipment-Embodied Technol-ogy (Washington, DC: National Academy ofSciences, 1979).Finkel, M. J., “The Development of OrphanProducts,” Al. Engl. J. Med. 307(15):963-964,Oct. 7, 1982.Finkel, M. J., Director, Office of Orphan Prod-ucts Development, Food and Drug Administra-tion, Rockville, MD, personal communications,Jan. 25 and Apr. 15, 1984.Flaherty, R,, Director, Diagnostic Standards andScientific Affairs, Health Industry Manufac-turers Association, Washington, DC, personalcommunication, July 29, 1983.Flink, R. C., “Standards: A Benefit or Burdento Industry?” Medical Instrumentation 13(4):197-8, July-August 1979.Foster, H. S., Attorney at Law, O’Conner andHannan, Washington, DC, personal communi-cation, April 1984.Foster, H. S., “The Impact of Federal and StateRegulatory Programs on the Ambulatory Lab-oratory Testing Industry and the Demand forInstrumentation,” contract report prepared forthe Office of Technology Assessment, U.S. Con-gress, Washingtonr DC, January 1984 (reviseddraft).Foster, M. E., “Sweeping Amendments to Stand-ards and Certification System Adopted, ” EastAsian Exec. Rep. 5(7):9,13-14, July 15, 1983.Fuji National City Consulting Ltd., “Survey ofJapanese Markets for Medical and Dental Equip-merit, ” vol. 2, prepared for the U.S. Embassy,May 1983.The Futures Group, “Characterization of In-novations Introduced on the U.S. Market in1982,” contract report prepared for the U.S.Small Business Administration, contract #SBA-6050-OA-82, Glastonbury, CT, March 1984.
124.
125.
126.
127.
128.
129.
130.
131.
132.
132a.
133.
134.
135.
136.
137.
Gellman Research Associates, Inc., The Rela-tionship Between Industn”al Concentration, FirmSize, and Technological Innovation, report pre-pared for the Office of Economic Research, Of-fice of Advocacy, U.S. Small Business Admin-istration, Washington, DC, May 11, 1982.Giannini, M., U.S. Veterans Administration,Washington, DC, personal communication, No-vember 1982.Gibson, R. M., “National Health Expenditures,1978, ” Health Care Finan. Rev. 1:1-36, summer1979.Gibson, R. M., and Waldo, D. R., “NationalHealth Expenditures, 1981,” Health Care Finan.Rev. 4(1):1-35, September 1982.Gibson, R. M., Waldo, D. R., and Levit, K. R.,“National Health Expenditures, 1982,” HealthCare Finan. Rev. 5(1):1-31, fall 1983.Gold, J., Office of Health Planning, U.S. De-partment of Health and Human Services, Pub-lic Health Service, Health Resources and Serv-ices Administration, Washington, DC, personalcommunication, Apr. 12, 1984.Goldschmidt, P. G., U.S. Veterans Administra-tion, Washington, DC, personal communica-tion, January 1983.Grace Commission, President’s Private SectorSurvey on Cost Control: Task Force Report onthe Veterans Administration, draft, Washing-ton, DC, May 1983.Graham, et al. v. John Deere Co. of KansasC’ity, et al., 383 U.S. 1 (1966).Grayson, R. T., “Effects of Regulatory Controlson the Accuracy of Clinical Laboratory Tests, ”J. Medical Technology (forthcoming).Greenfield, W. M., “New Approaches To Usingthe Determination-of-Need Process To ContainHospital Costs,” IV. Engl. J. Med. 309(6):372-375, Aug. 11, 1983.Greer, D. F., and Rhoades, S. A., “Concentra-tion and Productivity Changes in the Long andShort Run, ” South. Econ. J. 43:1031, October1976, as cited in (274).Griessbach, L., German American Chamber ofCommerce, personal communication, Nov. 29,1983.Hadley, D., Health Care Financing Administr-ation, Baltimore, MD, personal communication,Aug. 11, 1983.Hadley, J., “Critique of Peter Fox’s ‘PhysicianReimbursement Under Medicare: An Overviewand a Proposal for Area-Wide Physician Incen-tives, ‘ “ in U.S. Congress, House Committee onWays and Means, Subcommittee on Health,Proceedings of the Conference on the Future ofMedicare, Committee Print No. 23 (Washing-

242 . Federal Policies and the Medical Devices Industry
138.
139.
140.
141.
142.
143.
144.
145.
146.
147.
148.
149.
150.
ton, DC: U.S. Government Printing Office,1984).Hadley, J., and Feder, J., “Hospital Cost Shift-ing,” Urban Institute working paper #3179-07(Washington, DC: The Urban Institute, 1984).Hadley, J., Holahan, J., and Scanlon, W., “CanFee-for-Service Reimbursement Coexist WithDemand Creation?” Inquiry 16(3):247, fall 1979.Hadley, J., Juba, D., Swartz, K., et al., Alter-native Methods of Developing a Relative ValueScale of Physicians’ Services (Washington, DC:The Urban Institute, February 1983).Hamilton, R., “Certificate of Need: Scope ofCoverage,” paper presented at the AmericanHealth Planning Association and the NationalHealth Lawyers Association, Washington, DC,Dec. 7, 1983.Harrnan, A. J., “Industrial Innovation and Gov-ernmental Policy: A Review and Proposal Basedon Observation of the U.S. Electronics Sector, ”Tech. Forecast. Soc. Change 18:15, 1980.Hayes, A. H., Jr., Statement of the Commission-er, Food and Drug Administration at Hearingson FDA Oversight: Medical Devices, U.S.Congress, House Committee on Energy andCommerce, Subcommittee on Oversight and In-vestigations, July 16, 1982, serial No. 97-144(Washington, DC: U.S. Government PrintingOffice, 1982).Hazelwood, C. F., Cleveland, G., Medina, D.,“Relationship Between Hydration and ProtonNuclear Magnetic Resonance Relaxation Timesin Tissue of Tumor-Bearing and Non-tumorBearing Mice: Implications for Cancer Detec-tion,”J. Natl. Cancer Inst. 52:1849-1853, 1974.Health Industry Manufacturers Association,Guidelines for the Development of VoluntazyDevice Law Standards, HIMA Report No. 79-6, Washington, DC, October 1979.Health Industry Manufacturers Association, I.n-ternational Activities Survey, HIMA Document10, vol. 2, Washington, DC, July 1980.Heimburger, H. C., “Home Parenteral Nutri-tion,” Ala. J. Med. Sci. 19(4):377-380, October1982.Hellinger, F. J., “The Effect of Certificate-of-Need Legislation on Hospital Investment, ” In-quiry 13:187-193, June 1976.Higson, G. R., “The UK Department of Healthand Social Security’s Scientific and TechnicalServices Branch,” J. Medical Engineering andTechnology 7(3):130-35, May/June 1983.Holder, J., U.S. Veterans Administration, Wash-ington, DC, personal communication, June1983.
151.
152.
153.
154.
155.
156.
157.
158.
159.
160.
161.
162.
163.
164.
165.
166.
Holland, D., “The Effect of Taxation on Effort:Some Results for Business Executives,” NationaZTax Association—Proceedings of the 62nd An-nual Conference, September 1969.Hollis, D. P., Saryan, L. A., Eggleston, J. C.,et al., “Nuclear Magnetic Resonance Studies ofCancer,” J. Natl. Cancer Inst. 54:1469-1472,1975.Home Health Line, “A Big Chill Settles OverPart A Home Hyperalimentation,” 1X:22-24,Jan. 30, 1984.Home Health Line, “Atlanta Home Care Semi-nar—National Medical Enterprises V. P. Living-ston Says Home Care Low Priority for Hospi-tals; Manufacturers Expand Into Home CareCenters,” VIII:212-214, Nov. 21, 1983.Home Health Line, “Changing Face of MedicareHome Health” (table), VIII:28, Feb. 4, 1983.Home Health Line, “DME Under $120 ShouldBe Purchased, GAO Report Says, ” VIII:126,July 18, 1983.Home Health Line, “GAO Again Finds DME Ex-cess Rental—This Time in ‘High-Cost’ OxygenConcentrators, ” 1X:53, Feb. 27, 1984.Home Health Line, “GAO Finds Only $18 Mil-lion in HHA DME Expenditures, ” 1X:85, Apr.9, 1984.Home Health Line, “Medicare Home HealthOutlays Up 1,000% From 1974 (table),” VIII:136, July 25 and Aug. 1, 1983 (combined issue).Home Health Line, “Medicare Home HealthYearly Outlays to Break $3 Billion by End ofDecade, Total Hospice Outlays Equal $815 Mil-lion Before Sunset, ” 1X:43, Feb. 13, 1984.Home Health Line, “NAMES Presses ‘Freedomof Choice’ in Hospital DME Referrals, ” 1X:49,Feb. 20, 1984.Home Health Line, “Region V Flattens DailyCare After Consulting HCFA; Says PatientShould Be in Skilled Nursing Facility If Cheaper, ”VIII:167-168, Sept. 12, 1983.Howard, A. J., “European Medical Device Reg-ulations: An Update,” Medical Device and Diag-nostic Industry 5(9):46-50, September 1983.Hulse, J. W., “The Impact of Foreign Regula-tion on International Trade: Potential Barriersto U.S. Products, ” paper presented at the NinthAnnual ~1/FDA Conference on MedicalDevice Regulation, Arlington, VA, Nov. 10,1982.Iglehart, J., “Health Report/Federal Regulationof Medical Devices Gets Serious Attention inCongress,” NationaZJournal Reports, pp. 1184-1188, Aug. 11, 1973.IMS America, Ltd., Rockville, MD, unpublished
References . 243
167.
168.
169.
170.
171.
172.
173.
174.
175.
176.
177.
178.
179.
180.
data provided to the Office of TechnologyAssessment, U.S. Congress, under contract, De-cember 1983.IMS America, Ltd., Veterans AdministrationPrice Analysis of Hospital Supply and Pharma-ceutical Products, Order No. TE-QI-83, Rock-ville, MD, May 1983.Institute of Medicine and National ResearchCouncil, Medical Technology and the HealthCare System: A Study of Equipment-EmbodiedTechnology (Washington, DC: National Acad-emy of Sciences, 1979).International Organization for Standardization,MEMENTO 1978 and 1983 (Geneva, Switzer-land: 1S0, 1978 and 1983).InterStudy, “The December 1983 HMO Enroll-ment in the U. S.: A Mid-Year Census” (Ex-celsior, MN: InterStudy, 1984).In the Matter of the Establishment Inspection ofPortex, Inc., Food and Drug Administration,Appellant, 595 F. 2d 84 (lst Cir. 1979).Janssen, T. J., and Saffran, G. T., “Reimburse-ment for Durable Medical Equipment, ” HeaZthCare Finan. Rev. 2(3): 94, winter 1981.Japan Ministry of Health and Welfare, “Meas-ures Taken by the Japanese Ministry of Healthand Welfare (MHW) for Further Opening theJapanese Market Regarding Pharmaceuticals,Food, Etc.,” April 1983.Jarvis, A. E., “A Detailed Review of the Medi-cal Device Regulations of Major Importers ofU.S. Products,” paper presented at the NinthAnnual AAMI/FDA Conference on MedicalDevice Regulation, Arlington, VA, Nov. 10,1982.Jewkes, J., Sawers, D., and Stillerman, R., TheSources of Invention, 2d ed. (New York: Nor-ton, 1969).Joint Commission on Accreditation of Hospitals,Accreditation Manual for Hospitals 1983, Chi-cago, IL, 1982.Joskow, P. L., Controlling Hospital Costs: TheRole of Government Regulation (Cambridge,MA: The Massachusetts Institute of TechnologyPress, 1981).Kamien, M. I., and Schwartz, N. L., “On theDegree of Rivalry for Maximum InnovativeActivity,” Q. J. Econ. 90(2):245-260, May 1976.Kamien, M. I., and Schwartz, N. L., MarketStructure and Innovation (Cambridge, MA:Cambridge University Press, 1982).Kasper, J. A., Prescribed Medicines: Use, Ex-penditures, and Sources of Payment, Data Pre-view 9, DHHS publication No. (PHS) 82-3320,National Health Care Expenditures Study, Na-
181,
182.
183.
184.
185.
186.
187.
188.
189.
190.
191.
192.
193.
194.
tional Center for Health Services Research, U.S.Department of Health and Human Services,Hyattsville, MD, April 1982.Kaye, Scholer, Fierrnan, Hays, & Handler,“Governmental Barriers to International Tradein Medical Devices in the United States, UnitedKingdom, France, The Federal Republic of Ger-many, Canada, Japan, and Mexico, ” contractreport prepared for the Office of TechnologyAssessment, U.S. Congress, Washington, DC,February 1984.Kelly, P., and Kranzberg, M. (eds. ), Techno-logical Innovation: A Critical Review of Cur-rent Knowledge (San Francisco: San FranciscoPress, 1978).Kenney, M., independent consultant, Berkeley,CA, personal communication, Apr. 19, 1984.Kessler, P., “You: Putting Teeth Into Bonding,”The Washington Post, C5 (co1. 2), July 5,1983.Kettering, V., U.S. Department of Commerce,Bureau of Industrial Economics, Washington,DC, personal communication, February 1984.Kidder, Peabody & Co., Baxter Travenol Lab-oratorz”es, Inc.: 1983 Review and Outlook, Com-pany Follow-up, May 13, 1983.Kimberly, J. R., “Hospital Adoption of Innova-tions in Medical and Managerial Technology:Individual, Organizational and Contextual/Environmental Effects,” Executive Summary,National Science Foundation Grant No. PRA76-23080, March 1978.Kindel, K., “Survey of the Market for MedicalEquipment in Germany,” prepared for the U.S.Department of Commerce, Berlin, March 1981.Kleinfield, N. R., “The Home Health CareBoom,” The New York Times, sec. Dl, June 30,1983.L. W. Bergman& Co., “Financial Issues in Bio-technology, ” contract report prepared for theOffice of Technology Assessment, U.S. Con-gress, Washington, DC, March 1983.Lauterbur, P. C., “Image Formation by InducedLocal Interactions: Examples Employing NuclearMagnetic Resonance,” Nature 242:190-191,1973.Law on Technical Equipment and Devices, Fed-eral Republic of Germany, June 24, 1968, asamended Aug. 13, 1979, BundesgesetzblattIBGB1], p. 1432.Lepon, J., and Gawron, E., Kornmeier, McCar-thy, Lepon, and Harris, “Medical Device Stand-ards and International Trade, ” contract reportprepared for the Office of Technology Assess-ment, U.S. Congress, Washington, DC, 1983.Lewis, P., “U.S. and Third World At Odds Over

244 • Federal Policies and the Medical Devices Industry
195.
196.
197.
198.
199.
200.
201.
202.
203.
204.
205.
206.
207.
208.
Patents,” The New York Tines, D1 (co]. 1),Oct. 5, 1982.Liaison and Coordination Headquarters onStandards and Certification Systems, “Improve-ment of Japan’s Standards and Certification Sys-tems, Etc.,” Mar. 26, 1983.Liefer, L., U.S. Veterans Administration Reha-bilitation Research and Development Center,Palo Alto, CA, personal communication, July1983.Louis Harris & Associates, Inc., A Survey ofMedical Device Manufacturers, study No. 802005,report submitted to the Bureau of Medical De-vices, Food and Drug Administration, U.S. De-partment of Health and Human Services, July1982.Luft, H. S., Health Maintenance organizations:Dimensions of Performance (New York: JohnWiley & Sons, Inc., 1981).Lupovich, P., “Changes in the Clinical Labora-tory,” paper prepared for the Office of Technol-ogy Assessment, U.S. Congress, Washington,DC, February 1984.Mansfield, E., Industrial Research and Techno-logical Innovation (New York: W. W. Norton& Co., 1968).Mansfield, E., and Wagner, S., “Organizationaland Strategic Factors Associated With Probabil-ities of Success in Industrial R and D,” J. Busi-ness 48:179-98, April 1975, as cited in (274).Marcus, P., U.S. Department of Commerce,Washington, DC, personal communication, Jan-uary 1984.Markham, J. W., “Market Structure, BusinessConduct, and Innovation, ” Am. Econ. Rev.60:323, 1965, as cited in (182).Martin, D. R., Director, International Investiga-tions Staff, Executive Directorate for RegionalOperations, Food and Drug Administration,Rockville, MD, personal communication, Dec.16, 1983.Medical Devices, Diagnostics and Instrumenta-tion Reports (The Gray Sheet), “Abbott’s Alpha-Fetoprotein Diagnostic Kit for Testicular Can-cer,” 10(8):9-10, Feb. 20, 1984.Medical Devices, Diagnostics and Instrumenta-tion Reports (The Gray Sheet), “Annual Reg-istration of Medical Device Firms TemporarilyDelayed,” 10(3), Jan. 16, 1984.Medical Devices, Diagnostics and Instrumenta-tion Reports (The Gray Sheet), “Contact LensGuidelines: FDA Is Establishing Working Group,”9(48), Nov. 28, 1983.Medical Devices, Diagnostics and Instrumenta-tion Reports (The Gray Sheet), “NMR Purchases
209.
210.
211.
212.
213.
214.
215.
216.
217.
218.
219.
220.
221.
222.
223.
in New York Limited to 13 Sites Under HealthPlanning Commission Proposal; Wisconsin,Oregon, North Carolina Also Move To RestrictPurchases,” pp. 9-10, Feb. 27, 1984.Medical Devices, Diagnostics and Instrumenta-tion Reports (The Gray Sheet), reporting on tes-timony of NIH Director James Wyngaarden totwo subcommittees of the House Science andTechnology Committee, 8(40), Oct. 4, 1982.Medical Devices, Diagnostics and Instrumenta-tion Reports (The Gray Sheet), “Sealants Are‘Highly Effective’ and ‘Safe’,” 9(50):12-13, Dec.12, 1983.Medical Device and Diagnostic Industry, “TheEffect of DRGs on Devices and Diagnostics, ”6(2):31-36, February 1984.Medical World News, “Physician-Office Lab Re-sults Less Accurate Than Those of LicensedLabs, Study Shows,” 25(3):46-47, Apr. 9, 1984.Medsger, B., “The Most Captive Consumers: Atthe Mercy of the Wheelchair Barons, ” The Pro-gressive, pp. 34-39, March 1979.Mixon, A. M., III, President, Invacare Corp.,personal communication, Aug. 16, 1983.Miyamo, H., Japan Ministry of InternationalTrade and Industry, personal communication,NOV. 16, 1983.Moliter, R. M., General Electric Co., Washing-ton, DC, personal communication, Nov. 18,1983.“More Patents Bear the Label ‘Made in Japan’, “National journal 14:1069, June 12, 1982.Morrone, F., U.S. Veterans Administration,Washington, DC, personal communication,June 1983.Mosley, M., “Talking Points on U.S. Exportsof Medical Instruments, ” paper presented at themeeting of the Association for the Advancementof Medical Instrumentation, Arlington, VA,Oct. 10, 1982.Mossinghoff, G. J., Patent and TrademarkCommissioner, commenting on the 1983 leg-islative proposals, Chemical & EngineeringNews 60(33): Aug. 16, 1982.Motley, H, L., Werko, L., Cournard, A., et al.,“Observations on the Clinical Use of Intermit-tent Positive Pressuref”J. Aviation Med. 18:417-435, October 1947.Mullin, P., Joint Commission on Accreditationof Hospitals, Chicago, IL, personal communi-cation, Apr. 17, 1984.Myers, S., and Marquis, R. G., SuccessfulIndustrial Innovations, NSF-No. 69-17 (Wash-ington, DC: U.S. Government Printing Office,1969).
References • 245
224.
225.
226.
227.
228.
229.
230.
231.
232.
233.
234.
235.
236.
National Academy of Sciences, Elealth Care forAmerican Veterans, prepared for the Commit-tee on Veterans Affairs, U.S. House of Repre-sentatives, Committee Print No. 36 (Washing-ton, DC: U.S. Government Printing Office,1977).National Academy of Sciences, Assembly of LifeSciences, Final l?eport of tZze Cozrzznittee onProsthetics Research in the Veterans Adminis-tration, 1976.“National Survey of Hospital and Non-HospitalClinical Laboratories,” Laboratory Mgt. 17(3):33-48, March 1979.Needleman, J., and Lewin, L. S., “The Impactof State Regulation on the Adoption and Diffu-sion of New Medical Technology, ” Appendix Fin Institute of Medicine and National ResearchCouncil, Medical Technology and the HealthCare System: A Study of Equipment-EmbodiedTechnology (Washington, DC: National Acad-emy of Sciences, 1979).Nelson, R. R. (cd.), Government and 7’echni-cal Progress: A Cross-Industry Analysis (NewYork: Pergamon Press, 1982).Nelson, R. R., “Government Stimulus of Tech-nological Progress: Lessons From American His-tory,” in Government and Technical Progress:A Cross-Indust~Analysis, R. R. Nelson (cd.).Nelson, R. R., “The Simple Economics of BasicScientific Research,” J. Political Economy 67:297-306, June 1959.Nelson, R. R., and Langlois, R. N., “IndustrialInnovation Policy: Lessons From American His-tory,” Science 219:814-818, Feb. 18, 1983.Nelson, R. R., and Winter, S. G., “In Searchof a Useful Theory of Innovation, ” ResearchPolicy 6:36-76, 1977.Newhouse, J. P., Manning, W. G., Morris, C.N., et al., “Some Interim Results From a Con-trolled Trial of Cost Sharing in Health Insur-ance,” Al. Engl. ]. Med. 305:1501, 1981.Obermayer, J., The Role of Patents in the Com-mercialization of New Technology for Small In-novative Companies (Cambridge, MA: Research& Planning Inc., 1981).Olsson, J., Manager, Safety and RegulatoryEngineering, General Electric Co., Medical Sys-tems Operation, Milwaukee, WI, personal com-munication, Aug. 15, 1983.Organization for Economic Cooperation andDevelopment, Innovation in Small and A4ediumFirms (Paris: Organization for Economic Coop-eration and Development, 1982).
237.
238.
239.
240.
241.
242.
243.244.
245.
246.
247,
248.
249.
250.
251.
Over, A. M., Jr., Bradburd, R. M., Williams,R. C., Jr., et al., Determinants of Current andFuture Expenditures on Durable Medical Equip-ment by Medicare and Its Program Beneficiaries,contract report submitted to the Health CareFinancing Administration, U.S. Department ofHealth and Human Services, Baltimore, MD,April 1983.Palmer, F,, U.S. Veterans Administration Mar-keting Center, Hines, IL, personal communica-tion, May 1983.Pauly, M., Doctors and Their Workshops: Eco-nomic Models of Physician Behavior (Chicago:University of Chicago Press, 1980).Pavliscak, M., U.S. Department of Commerce,Washington, DC, personal communication,June 1984.Peter Barnard Associates, “International Mar-ket Research Survey of the Canadian Market forMedical Equipment,” prepared for the U.S. De-partment of Commerce, July 1983.Pharmaceutical Affairs Law, Aug. 10, 1950, asamended.Pharmaceutical Affairs Law, No. 145, 1960.Pharmaceutical Manufacturers Association,Medical Dew”ces and Diagnostic Products Indus-try: A Profile, Washington, DC: March 1982.Phillips, L., National Research Director, Para-lyzed Veterans of America, Washington, DC,personal communication, June 1983.Pierce, A. K., “Scientific Basis of In-HospitalRespiratory Therapy,” Am. Rev. Resp. Dis.122(5 ):1-2 (pt. 2), November 1980.Policy Analysis, Inc., “Evaluation of the Effectsof Certificate of Need Programs, ” Volume III:Analytic Reports, contract report prepared forthe Bureau of Health Planning and ResourcesDevelopment, Health Resources Administra-tion, Department of Health and Human Serv-ices, contract No. 231-77-0114 (Brookline, MA:Policy Analysis, Inc., August 1980. )Pontoppidian, H., “Mechanical Aids to LungExpansion in Non-intubated Surgical Patients, ”Am. Rev. Resp. Dis. 122(5): 11-13 (pt. 2), No-vember 1980.Porges, A., Assistant General Counsel, Officeof the U.S. Trade Representative, personalcommunication, Dec. 14, 1983.Powell, R. S., Program Director, Diagnostic Im-aging Research Branch, National Cancer Insti-tute, National Institutes of Health, Bethesda,MD, personal communication, July 29, 1983.Predicasts Forecasts, No. 91, Apr. 22, 1983.
25-406 0 - 84 - 17

246 ● Federal Policies and the Medical Devices Industry
252,
253.
254.
255.
256.
257.
258.
259.
260.
261.
262.
263.
264.
265.
Public Citizen Health Research Group, “Com-ments of Public Citizen Health Research Groupon FDA’s Proposed Classification of Generaland Plastic Surgery Medical Devices, ” Washing-ton, DC, June 21, 1982.Public Citizen Health Research Group, petitionto the National Center For Devices and Radio-logical Health, Food and Drug Administration,to call for safety and effectiveness data on 16devices used in obstetrics and gynecology,Washington, DC, Mar. 2, 1983.Radiation Emitting Devices Act and Regula-tions, as amended, Nov. 8, 1977.“Regulations Respecting Medical Devices,” P.C.1975-2031, Aug. 27, 1975, as amended.Rettig, R. A., “End-Stage Renal Disease and the‘Cost’ of Medical Technology,” in Medical Tech-nology: The Culprit Behind Health Care Costs?S. Altman and R. Blendon (eds. ) (Washington,DC: U.S. Department of Health, Education, andWelfare, 1979).Reynolds, C., U.S. Department of Health andHuman Services, Food and Drug Administra-tion, Silver Spring, MD, personal communica-tion, February 1984.Robb, W. L., Vice-President and General Man-ager, General Electric Co., Medical SystemsOperations, Milwaukee, WI, personal comm-unication, October 1982.Roberts, E. B., et al. (eds. ), Biomedical Innova-tion (Cambridge, MA: The Massachusetts Insti-tute of Technology Press, 1981).Romeo, A. A., “The Hemodialysis Equipmentand Disposable Industry, ” contract report pre-pared for the Office of Technology Assessment,U.S. Congress, February 1984 (revised draft).Romeo, A. A., “Interindustry and Interfirrn Dif-ferences in the Rate of Diffusion of an Innova-tion, ” Rev. Econ. Stat. 57:311, August 1975, ascited in (274).Rosenbloom, R. S., “Technological Innovationin Firms and Industries: An Assessment of theState of the Art,” in Technological Innovation:A Critical Review of Current Knowledger P.Kelly and M. Kranzberg (eds. ) (San Francisco:San Francisco Press, 1978).Rothwell, R., “Marketing a Success Factor in In-dustrial Innovation,” Mgt. Decision 14(1):43,1976.Rothwell, R., “Some Indirect Impacts of Gov-ernment Regulation on Industrial Innovation inthe United States, ” Technological Forecastingand Social Change, Elsevier North Holland,Inc., 19:57-80, 1981.Russell, L. B., “The Diffusion of Hospital Tech-
266.
267.
268.
269.
270,
271.
272.
273.
274.
275.
276.
277.
278.
nologies: Some Econometric Evidence,” J. Hu-man Resources 12:482-502, fall 1977.Russell, L. B., Technology in Hospitals: Medi-cal Advances and Their Diffusion (Washington,DC: The Brookings Institution, 1979).Safir, A., “How Ophthalmology Changed Dur-ing My Career, ” paper prepared for the Officeof Technology Assessment, U.S. Congress,Washington, DC, 1983.Sahal, D., Patterns of Technological .lknovation(Reading, MA: Addison-Wesley, 1981).Salans, L. B., Acting Director, National Insti-tute of Arthritis, Diabetes, and Digestive andKidney Diseases, National Institutes of Health,testimony at hearing, The End Stage Renal Dis-ease Program (Part 2-Treatment Standards andMethods), before the Subcommittee on Govern-ment Operations, House of Representatives,Apr. 28, 1982 (Washington, DC: U.S. Govern-ment Printing Office, 1982).Salkever, D. S., and Bice, T. W., “The Impactof Certificate-of-Need Controls on Hospital In-vestment,” MiZbank Mere. Fund Q. 54(2):185-214, spring 1976.Sanford C. Bernstein & Co., Inc., The KidneyDialysis Industry, New York, February 1981.Scheffler, R. M., and Delaney, M., “AssessingSelected Respiratory Therapy Modalities: Trendsand Relative Costs in the Washington, DCArea,” in The Implications of Cost-EffectivenessAnalysis of Medical Technology/BackgroundPaper #12:Case Studies of Medical Technol-ogies, prepared for the Office of TechnologyAssessment, U.S. Congress (Washington, DC:U.S. Government Printing Office, April 1981).Scherer, F. M., “Demand-Pull and Technologi-cal Invention—Schmookler Revisited, ”J. I.ndus-tria] Econ. 30(3):225-237, March 1982.Scherer, F. M., Industrial Market Structure andEconomic Performance, 2d ed. (Chicago: RandMcNally College Publishing Co., 1980).Schifrin, L. G., and Rich, W. J., “The ContactLens Industry: Structure, Competition, andPublic Policy,” contract report prepared for theOffice of Technology Assessment, U.S. Con-gress, Washington, DC, 1983 (draft).Schmookler, J., Invention and Economic Growth(Cambridge, MA: Harvard University Press,1966).Schroeder, S., and Showstack, J. A., “FinancialIncentives to Perform Medical Procedures andLaboratory Tests: Illustrative Models of OfficePractice,” Medical Care 16(4):289-298, April1978.Schwartz, S., American College of Physicians,

References ● 247
279.
280.
281.
282.
283.
284.
285.
286.
287.
288.
289.
290.
291.
292.
Philadelphia, PA, personal communication, July18, 1983.Scitovsky, A. A., and McCall, N., “Coinsur-ance and the Demand for Physician ServicesFour Years Later,” Soc. Sec. Bull. 40:19, May1977.Shapley, W. H., Teich, A. H., and Weinberg,J. P., AAAS Report VIII: Research and Devel-opment, FY 1984, a report prepared for the Ex-ecutive Officer and the AAAS Committee onScience, Engineering, and Public Policy (Wash-ington, DC: American Association for the Ad-vancement of Science, 1983).Shepard, D. S., Associate Professor, HarvardSchool of Public Health, Center for the Analy-sis of Health Practices, Boston, MA, personalcommunication, Apr. 30, 1984.Shepard, D. S., and Karen, S. L., The Marketfor Wheelchairs: Innovations and Federal Pol-icy, contract report prepared for the Office ofTechnology Assessment, U.S. Congress, Wash-ington, DC, 1984 (forthcoming).Shils, M. E., “Registry of Patients on HPN,” inHome Parenteral Nutrition (symposium pro-ceedings, American Society for Parenteral andEnteral Nutrition), pp. 42-44, Washington, DC,1980.Sholer, J., Abbott Laboratories, Chicago, IL,personal communication, Oct. 6, 1983.Showstack, J. A., Blumberg, B. D., Schwartz,J., et al., “Fee-for-Service Physician Payment:Analysis of Current Methods and Their Devel-opment,” Inquiry 16(3):230, fall 1979.Sira Institute Ltd., “Report on Medical Equip-ment Study —France, ” vol. 2, prepared for theU.S. Embassy, Kent, England, Mar. 31, 1981.Skalnik, B., “IPPB: A Question of Quality, ”Resp. Ther. 6:81-83, November-December 1976.Sommer, J., Deputy Director, The American Le-gion, Washington, DC, personal communica-tion, July 1983.Stanford University, “Policy on Tangible Re-search Property, ” memo from the Vice Provostand Dean of Graduate Studies and Research tomembers of the Academic Council and membersof the Academic Staff-Research, Mar. 16, 1982.Steiger, E., The Cleveland Clinic, Cleveland,OH, personal communication, April 1984.Steinberg, E. P., and Cohen, A. B., “NuclearMagnetic Resonance Imaging Technology: AClinical, Industrial and Policy Analysis,” con-tract report prepared for the Office of Tech-nology Assessment, U.S. Congress, Washing-ton, DC, 1984.Stevenson, G. L., “FEC Acceptancef Growth,
293.
294.
295.
295a
296.
297.
298.
299.
300.
301.
302.
303.304.305.306.307.308.309.
310.
311.312.
313.
Cost Benefits Confirmed,” Emergence, June 1983(special issue).Stewardson, J. D., Regulatory Standards Ad-ministrator, Cobe Laboratories, Inc., Lakewood,CO, personal communications, Dec. 6 and 13,1983.Sugar-man v. Forbragd, 405 F. 2d 1189 (9th Cir.1968).Swartz, K., Senior Analyst, The Urban Institute,Washington, DC, personal communication,April 1984.Swartz, K., The Urban Institute, “The Chang-ing Face of the Uninsured, ” paper prepared forpresentation at the First Annual Meeting of theAssociation for Health Services Researchers,Panel on “Health Care for the Poor in an Eraof Retrenchment, ” Washington, DC, June 11,1984.Swartz, K., “Who Has Been Without Health In-surance? Changes Between 1963 and 1979, ” Ur-ban Institute working paper (Washington, DC:The Urban Institute, April 1984).Swift, C., National Cancer Institute, Bethesda,MD, personal communication, Apr. 12, 1984.Thompson, F., Health Policy and the Bureau-cracy: Politics and Implementation (Cambridge,MA: The Massachusetts Institute of TechnologyPress, 1983).Traub, J., National Institute for HandicappedResearch, Washington, DC, personal commu-nication, February 1984.Travers, P., U.S. Congress, General Account-ing Office, Washington, DC, personal commu-nication, April 1984.Turner, R., Mexico Desk Officer, Office ofTrade Administration, U.S. Department ofCommerce, Washington, DC, personal commu-nication, Aug. 30, 1983.United States v. An Article of Drug . . . Bacto-unidisk, 394 U.S. 784 (1969).U. S., Federal Register 41:22620, June 4, 1976.U. S., Federal Register 44:53577, Sept. 14, 1979.U. S., Federal Register 45:65619, Oct. 3, 1980.U. S., Federal Register 45:69678, oct. 21, 1980.U. S., Federal Register 45:76183, Nov. 18, 1980.U. S., Federal Register 45:81769, Dec. 12, 1980.U. S., Federal Register 46:57568-69, Nov. 24,1981.U. S., Federal Register 47(189):42906, Sept. 29,1982.U. S., Federal Register 47:2810, Jan. 19, 1982.U. S., Federal Register 47:24332, June 3, 1982(Initiation of Investigation pursuant to 19 U.S.C.$337).LJ. S., Federal Register 47:53402, Nov. 26, 1982.

248 ● Federal Policies and the Medical Devices Industry
314.315.
316.
317.318.319.320.321.322.
323.324.325.
326.
327.
328.
329.
330.
331.
332.
U. S., Federal Register 47:54990, Dec. 7, 1982.U. S., Federal Register 48(2):299-315, Jan. 4,1983.U.Sv Federal Register 48(92~ Mar. 11, 1983,Final Rule, Department of Health and HumanServices, Health Care Financing Administration,42CFR, Part 405.U.SWFederalRegister48:13020, Mar. 29,1983.U.SVFederalRegister48:24014, May27,1983.U.S_ Federal Register 48:25126, June3, 1983.U.SVFederalRegister48:27723, June 17,1983.U.SVFederalRegister48:40272, Sept. 6,1983.U.Sv FederalRegister48:40960r Sept. 12,1983(Institution of Investigation pursuant to 19U.s.c. $337).U.Sv FederalRegister48:56778, Dec. 23,1983.U.SV Federal Register 49:1177, Jan. 10, 1984.U.S. Congress, Congressional Budget Office,The Effect ofPSROsonHealth CareCosts: Cur-rent FindingsandFuture Evaluations (Washing-ton, DC: U.S. Government Printing Office, June1979).U.S. Congress, Congressional Budget Office,The Impact of PSROS on Health Care Costs:Update of CBO’S 1979 Evaluation (Washington,DC: U.S. Government Printing Office, January1981).U.S. Congress, Congressional Budget Office,Veterans Administration Health Care: Planningfor 1990, Washington, DC, February 1983.U.S. Congress, Congressional Research Service,Medical Devices: A Brief Review of Legislationand Issues Related to Regulation (Washington,DC: U.S. Government Printing Office, 1974).U.S. Congress, General Accounting Office,“Centers for Disease Control Should Discon-tinue Certain Diagnostic Tests and Charge forOthers,” report No. 83-37, Washington, DC,Apr. 16, 1983.U.S. Congress, General Accounting Office,Computed Tomographic Scanners: Opportunityfor Coordinated Federal Planning Before Sub-stantial Acquisitions, Report No. HRD-78-41,Washington, DC, January 1978.U.S. Congress, General Accounting Office, Fed-eral Regulation of Medical Devices—ProblemsStill To Be Overcome, GAO/1-iRD-83-53 (Gai-thersburg, MD: General Accounting Office,September 1983).U.S. Congress, General Accounting Office, Hu-man Resources Division, “VA Needs To Im-prove Its Quality Assurance Program for Med-ical Supply and Equipment Items” (PLRD-82-44)
333.
334.
335.
336.
338.
338.
339.
340.
341.
342.
unpublished memorandum report, Washington,DC, February 1982.U.S. Congress, General Accounting Office,Medicare Payments for Durable Medical Equip-ment Are Higher Than Necessary, ComptrollerGeneral’s Report to the Congress, GAO/HRD-82-61, Washington, DC, July 1982.U.S. Congress, General Accounting Office,Problems With Evaluating the Cost Effectivenessof Professional Standards Review Organization(Washington, DC: U.S. Government PrintingOffice, July 19, 1979).U.S. Congress, General Accounting Office, VANeeds Better Visibility Over Medical CenterPurchases, report No. PSAD 81-16, Washing-ton, DC, December 1980.U.S. Congress, House Committee on Energyand Commerce, FDA Oversight: Medical De-vices, hearings before the Subcommittee onOversight and Investigations, July 16, 1982,serial No. 97-144 (Washington, DC: U.S. Gov-ernment Printing Office, 1982).U.S. Congress, House Committee on Energyand Commerce, Subcommittee on Health andthe Environment, “Oversight Hearing on theMedical Device Amendments of 1976, ” Wash-ington, DC, Feb. 24, 1984.U.S. Congress, House Committee on Energyand Commerce, Subcommittee on Oversightand Investigations, Medical Device Regulation;The FDA’s Neglected Child, An Oversight Re-port on FDA Implementation of the Medical De-vice Amendments of 1976, Committee Print 98-F(Washington, DC: U.S. U.S. Government Print-ing Office, May 1983).U.S. Congress, House Committee on Interstateand Foreign Commerce, Medical Devices, hear-ings before the Subcommittee on Public Healthand the Environment, Oct. 23-24, 1973, serialNo. 93-61 (Washington, DC: U.S. GovernmentPrinting Office, 1973).U.S. Congress, House of Representatives, TheMedical Device Amendments of 1976, 94thCong., 2d sess., 1976, House Report No. 94-853(Washington, DC: U.S. Government PrintingOffice, 1976).[J. S. Congress, Office of Technology Assess-ment, Diagnosis Related Groups (DRGs) andMedicare Program: Implications for MedicalTechnology—A Technical Memorandum, GPOstock No. 052-003-00919-6 (Washington, DC:U.S. Government Printing Office, July 1983).U.S. Congressr Office of Technology Assess-

References ● 249
343.
344.
345.
346.
347.
348.
349.
350.
351.
352.
353.
ment, The Impact of Randomized Clinical Trialson Health Policy and Medical Practice—Back-ground Paper, GPO stock No. 052-003-00924-2 (Washington, DC: U.S. Government PrintingOffice, 1983).U.S. Congress, Office of Technology Assess-ment, The Implications of Cost-EffectivenessAnalysis of Medical Technology, GPO stockNo. 052-003-00765-7 (Washington, DC: U.S.Government Printing Office, August 1980).U.S. Congress, Office of Technology Assess-ment, Medical Devices and the Veterans Adminis-tration—A Technical Memorandum, Washing-ton, DC, in press, n.d.U.S. Congress, Office of Technology Assess-ment, Medical Technology and Costs of theMedicare Program, GPO stock No. 052-003-00957-9 (Washington, DC: U.S. GovernmentPrinting Office, July 1984).U.S. Congress, Office of Technology Assess-ment, Medical Technology Under Proposals Toincrease Competition in Health Care, GPOstock No. 052-003-00892-1 (Washington, DC:U.S. Government Printing Office, 1982).U.S. Congress, Office of Technology Assess-ment, Patents and the Commercialization ofNew Technology (Washington, DC: U.S. Gov-ernment Printing office, 1984 (in press)).U.S. Congress, Office of Technology Assess-ment, Policy Implications of the Computed To-mography (CT) Scanner, GPO stock No. 052-003-00565-4, (Washington, DC: U.S. Govern-ment Printing Office, August 1978).U.S. Congress, Office of Technology Assess-ment, PoZicy Implications of the Computed To-mography (CT) Scanner: An Update, GPOstock No. 052-003-00793-2 (Washington, DC:U.S. Government Printing Office, January1981).U.S. Congress, Office of Technology Assess-ment, The Safety, Efficacy, and Cost Effective-ness of Therapeutic Apheresis, GPO stock No.003-052-00918-8 (Washington, DC: U.S. Gov-ernment Printing Office, 1983).U.S. Congress, Office of Technology Assess-ment, Strategies for Medical Technology Assess-ment, GPO stock No. 052-003-00887-4 (Wash-ington, DC: U.S. Government Printing Office,1982).U.S. Congress, Office of Technology Assess-ment, Technology and Handicapped People,GPO stock No. 052-003-00874-2 (Washington,DC: U.S. Government Printing Office, 1982).U.S. Congress, Office of Technology Assess-ment, Technology, Innovation, and Regional
354,
355.
356.
357.
358.
359.
360.
361.
362.
363.
Economic Development: Census of State Gov-ernment Initiatives for High-Technology Indus-trial Development— Background Paper, GPOstock No. 052-003-00912-9 (Washington, DC:U.S. Government Printing Office, May 1983).U.S. Congress, Office of Technology Assess-ment, Technology, Innovation, and RegionalEconomic Development: Encouraging High-Technology Development—Background Paper#2, GPO stock No. 052-003-00942-1 (Washing-ton, DC: U.S. Government Printing Office,February 1984).U.S. Congress, Senate, CZinical Laboratory Irn-provement Act of 1977, S. Report No. 95-360,95th Cong., Ist sess. (Washington, DC: U.S.Government Printing Office, 1977).U.S. Congress, Senate Committee on Finance,End-Stage Renal Disease (ESRD) Program UnderMedicare, Committee Print 97-9, September1981 (Washington, DC: U.S. Government Print-ing Office, 1982).U.S. Constitution, Article 1, Section 8, Clause8 (the patent clause of the Constitution).U.S. Council of Economic Advisers, EconomicReport of the President and the Annual Reportof the Council of Economic Advisers (Washing-ton, DC: U.S. Government Printing Office, Feb-ruary 1983).U.S. Department of Agriculture, Department ofCommerce, Department of State, and Office ofthe U.S. Trade Representative, Report to theUnited States Congress on the Agreement onTechnical Barriers to Trade—’’Standards Code”(Washington, DC: U.S. Government PrintingOffice, 1983).U.S. Department of Commerce, Bureau of theCensus, 1963 Census of Manufactures, Indus-try Series, MC63-I-36E and MC63-I-38A (Wash-ington, DC: U.S. Government Printing Office,1966).U.S. Department of Commerce, Bureau of theCensus, 1972 Census of Manufactures, Indus-try Series, NIC72-I-36E and MC72-I-38B (Wash-ington, DC: U.S. Government Printing Office,1976).U.S. Department of Commerce, Bureau of theCensus, 1977 Census of Manufactures, Indus-try Series, MC77-I-38B and MC77-I-36F (Wash-ington, DC: U.S. Government Printing Office,June 1980).U.S. Department of Commerce, Bureau of theCensus, 1977 Census of Manufactures, GeneralSummary, Subject Series, MC77-SR-1 (Wash-ington, DC: U.S. Government Printing Office,April 1981).

250 • Federal Policies and the Medical Devices Industry
364.
365.
366.
367.
368.
369.
370.
371.
372.
373.
374.
U.S. Department of Commerce, Bureau of theCensus, 1982 Census of Manufactures, Prelimi-nary Report Industry Series, MC82-I-36F-3(P),MC82-I-38B-l(P), MC82-I-38B-2(P), MC82-I-38B-3(P), MC82-I-38B-4(P) (Washington, DC:U.S. Government Printing Office, 1984).U.S. Department of Commerce, Bureau of theCensus, 1979 Annual Survey of Manufactures,Value of Product Shipments, M79(AS)-2 (Wash-ington, DC: U.S. Government Printing Office,October 1981).U.S. Department of Commerce, Bureau of theCensus, Annual Survey of Manufactures, Sta-tistics for Industry Groups and Industries, foryears 1958, 1963, 1972, 1977 and 1981.U.S. Department of Commerce, Bureau of theCensus, Statistical Abstract of the United States:1982-83 (103d cd.) Washington, DC, 1982.U.S. Department of Commerce, Bureau of In-dustrial Economics, 1983 U.S. Industrial Out-look (Washington, DC: U.S. Government Print-ing Office, January 1983).U.S. Department of Commerce, Bureau of In-dustrial Economics, 1984 U.S. Industrial Out-look (Washington, DC: U.S. Government Print-ing Office, January 1984).U.S. Department of Commerce, Bureau ofIndustrial Economics, Capital, Energy, andProductivity Studies Division, Washington, DC,unpublished data, January 1984.U.S. Department of Commerce, Bureau ofIndustrial Economics, Office of Producer Goods,Science and Electronics Division, “United StatesExports of Selected Commodities by Country,January-December 1981,” unpublished, Wash-ington, DC, Mar. 5, 1982.U.S. Department of Commerce, Bureau of In-dustrial Economics, Office of Producer Goods,Science and Electronics Division, “United StatesExports of Selected Commodities by Country,January-September 1982,” unpublished, Wash-ington, DC, Nov. 23, 1982.U.S. Department of Commerce, Bureau of In-dustrial Economics, Office of Producer Goods,Science and Electronics Division, “United StatesImports of Selected Commodities by Country,January-December 1981,” unpublished, Wash-ington, DC, Mar. 5, 1982.U.S. Department of Commerce, Bureau of In-dustrial Economics, Office of Producer Goods,Science and Electronics Division, “United StatesImports of Selected Commodities by Country,January-September 1982,” unpublished, Wash-ington, DC, Nov. 26, 1982.
375.
376.
377.
378.
379.
380.
381.
382.
383.
384.
385.
386.
387.
388.
U.S. Department of Commerce, Bureau of In-dustrial Economics, Office of Research, Analy-sis, and Statistics, Washington, DC, unpub-lished data, 1984.U.S. Department of Commerce, InternationalTrade Administration, Countryman..et Survey:Medical Equipment France, CMS 78-010, Wash-ington, DC, June 1978.U.S. Department of Commerce, InternationalTrade Administration, Country Market Survey:Medical Equipment Germany, CMS 82-516,Washington, DC, February 1982.U.S. Department of Commerce, InternationalTrade Administration, Country Market Survey:Medical Equipment Mexico, CMS 79-004, Wash-ington, DC, February 1979.U.S. Department of Commerce, InternationalTrade Administration, Technical Barriers toTrade, vol. 4 (Washington, DC: U.S. Govern-ment Printing Office, 1981).U.S. Department of Commerce, InternationalTrade Administration, The Tokyo Round TradeAgreements Technical Barriers to Trade, vol. 4(Washington, DC: U.S. Government PrintingOffice, September 1981).U.S. Department of Commerce, Patent andTrademark Office, Office of Patent Programand Documentation Control, unpublished data,Washington, DC, February 1984.U.S. Department of Commerce, Patent andTrademark Office, Office of Technology Assess-ment and Forecast, “OTAF Custom Report, AllTechnologies Report, January 1963-June 1983”(mimeo), Washington, DC, 1983.U.S. Department of Commerce, Patent andTrademark Office, Washington, DC, unpub-lished data, 1984.U.S. Department of Health and Human Serv-ices, Food and Drug Administration, FDA Com-pliance Policy Guide No. 715Sg.03, Silver Spring,MD, Oct. 1, 1980.U.S. Department of Health and Human Serv-ices, Food and Drug Administration, unpub-lished data, Silver Spring, MD, 1983.U.S. Department of Health and Human Serv-ices, Bureau of Medical Devices Standards Sur-vey 1982, International Edition (Washington,DC: U.S. Government Printing Office, 1982).U.S. Department of Health and Human Serv-ices, Food and Drug Administration, Bureau ofMedical Devices, “Policy for Class II MedicalDevices,” unpublished internal draft, SilverSpring, MD, August 1982.U.S. Department of Health and Human Serv-

References ● 251
389.
390.
391.
392,
393.
394.
395.
396.
397.
ices, Food and Drug Administration, Bureau ofMedical Devices, Product Development Pro-tocol Guideline, Silver Spring, MD, 1980.U.S. Department of Health and Human Serv-ices, Food and Drug Administration, Bureau ofMedical Devices, Regulatory Requirements forMarketing a Device (Washington, DC: U.S.Government Printing Office, 1982).U.S. Department of Health and Human Serv-ices, Food and Drug Administration, Office ofEconomic Analysis, compilation of unpublisheddata from the U.S. Patent and Trademark Of-fice, Washington, DC, December 1983.U.S. Department of Health and Human Serv-ices, Food and Drug Administration, Office ofPlanning and Evaluation, Baseline Zlata on theAvailability of Medical Devices and In-VitroDiagnostic Products, OPE Study 54 (Rockville,MD: Food and Drug Administration, Office ofPlanning and Evaluation, July 1980).U.S. Department of Health and Human Serv-ices, Food and Drug Administration, Office ofPlanning and Evaluation, Baseline Data OnMedical Device Establishments, OPE Study 59(Rockville, MD: Food and Drug Administra-tion, Office of Planning and Evaluation, Sep-tember 1981).U.S. Department of Health and Human Serv-ices, Food and Drug Administration, Office ofPlanning and Evaluation, Baseline Data on Med-ical Device Industries in the Census of Manu-factures, OPE Study 53 (Rockville, MD: Foodand Drug Administration, Office of Planningand Evaluation, July 1980).U.S. Department of Health and Human Serv-ices, Food and Drug Administration, Office ofPlanning and Evaluation, Rockville, MD, un-published data, 1983.U.S. Department of Health and Human Serv-ices, Health Care Financing Administration,1979 PSRO Program Evaluation (Washington,DC: U.S. Government Printing Office, 1980).U.S. Department of Health and Human Serv-ices, Health Care Financing Administration,1981 End-Stage Renal Disease Annual Report toCongress (Washington, DC: U.S. GovernmentPrinting Office, 1981.)U.S. Department of Health and Human Serv-ices, Health Care Financing Administration,“Annual Report to the Congress from the Sec-retary of Health and Human Services on theProfessional Standards Review OrganizationsProgram Fiscal Year 1980,” mimeo, February1981.
398.
399.
400.
401.
402.
403.
404.
405.
406.
407.
408.
409.
U.S. Department of Health and Human Serv-ices, Health Care Financing Administration,“Draft Report of HCFA Task Force on Inde-pendent Laboratories,” Aug. 17, 1983, as citedin Foster, 1984.U.S. Department of Health and Human Serv-ices, Health Care Financing Administration, Of-fice of Research and Demonstrations, Medicare:Use of Home Health Services, 1980, preparedby Kathryn D. Barrett, Baltimore, MD, July1983 (draft).U.S. Department of Health and Human Serv-ices, Health Care Financing Administration,“PSRO Evaluation,” Health Care Financing: Re-search and Demonstrations in Health Care Fi-nancing 1980-1981, HCFA publication No. 03144,Rockville, MD, 1982.U.S. Department of Health and Human Serv-ices, National Institutes of Health, NationalCancer Institute, unpublished data supplied byG. Wilson, Bethesda, MD, December 1983.U.S. Department of Health and Human Serv-ices, National Institutes of Health, NationalHeart, Lung, and Blood Institute, Task Force Re-port on Pulmonary Technology, NIH publica-tion No. 81-2110, Bethesda, MD, July 1981.U.S. Department of Health and Human Serv-ices, National Institutes of Health, National In-stitute for Neurological and Communicable Dis-ease and Stroke, Request for Proposals, “OrphanProducts Development Studies” (RFP #NIH-NINCDS-8407), Bethesda, MD, Jan. 23, 1984.U.S. Department of Health and Human Serv-ices, National Institutes of Health, Office of Pro-gram Planning and Evaluation and the Divisionof Research Grants, N..H Data Book 1983,Washington, DC, June 1983.U.S. Department of Health and Human Serv-ices, Public Health Service, Annual Report:Activities of the Orphan Products Board, March1982-May 1983, Washington, DC, 1983.U.S. Department of Health and Human Serv-ices, Public Health Service, Bureau of HealthMaintenance Organizations and Resources De-velopment, Office of Health Planning, StatusReport on State Certificate of Need Programs,Rockville, MD, March 1983.U.S. Department of Health and Human Serv-ices, Request for Proposal No. HCFA-84-015,Operation of Utilization and Quality ControlPeer Review Organizations, Feb. 28, 1984.U.S. Department of Health and Human Serv-ices, unpublished statistical data, 1983.U.S. Department of Health, Education, and

252 • Federal Policies and the Medical Devices Industry
410.
411.
412.
413.
414.
415.
416.
417.
418.
419.
420,
421.
Welfare, Health Care Financing Administration,Professional Standards Review Organization1978 Program Evaluation, HEW publication No.HCFA-03000, Washington, DC, January 1979.U.S. Department of Health, Education, andWelfare, National Institutes of Health, AntenataZDiagnosis, NIH publication No. 79-1973, Be-thesda, MD, April 1979.U.S. Department of Health, Education, andWelfare, Public Health Service, PSRO: An Ini-tial Evaluation of the Professional Standards Re-view Organization, “Vol. 1: Executive Sum-mary,” Washington, DC, February 1978.U.S. Department of Health, Education and Wel-fare, et al., Rehabilitation Engineering: A Planfor Continued Progress (Charlottesville, VA:Rehabilitation Engineering Center, University ofVirginia, 1978),U.S. Department of Health, Education, andWelfare, Public Health Service, Report of thePresident’s Biomedical Research Panel, “Appen-dix A: The Place of Biomedical Science in Medi-cine and the State of Science, ” DHEW publica-tion No. (OS) 76-501, Washington, DC, Apr. 30,1976.U.S. Department of the Treasury, Internal Rev-enue Service, A General Descn”ption of the Cor-poration Sourcebook, publication 647 (Wash-ington, DC, U.S. Government Printing Office,revised June 1983).U.S. Department of the Treasury, Internal Rev-enue Service, Corporation Income Tax Returns,Statistics of Income, for years 1963,1967,1972,1977 and 1980, Washington, DC, U.S. Govern-ment Printing Office.U.S. Department of the Treasury, Internal Rev-enue Service, Sourcebook of Statistics of In-come, for years 1963, 1967, 1977, and 1980,Washington, DC, U.S. Government PrintingOffice.U.S. Department of the Treasury, Internal Rev-enue Service, Sourcebook of Statistics of In-come, for years 1976-80, as cited in (26).U.S. Department of the Treasury, Office of TaxAnalysis, unpublished data, Washington, DC,1983.U.S. Executive Office of the President, Officeof the U.S. Trade Representative, A Preface toTrade (Washington, DC: U.S. GovernmentPrinting Office, 1982).U.S. Executive Office of the President, Officeof the U.S. Trade Representative, “Status ofTokyo Round MTN Agreement Signatures andAcceptances, ” Nov. 1, 1983.U.S. National Science Foundation, Federal
422.
423.
424.
425.
426.
427.
428.
429.
430.
431.
432.
433.
434.
435.
Funds for Research and Development: FiscalYears 1980,1981, and 1982, NSF 81-325 (Wash-ington, DC: NSF, 1981).U.S. National Science Foundation, NationalPatterns of Science and Technology Resources,1982, NSF 82-319, Washington, DC, 1982.U.S. National Science Foundation, Research andDevelopment in Industry, 1979, detailed statis-tical tables, NSF 81-324, Washington, DC, 1981.U.S. NTational Science Foundation, “Survey ofIndustrial Research and Development, ” con-ducted by the U.S. Bureau of the Census, Wash-ington, DC, 1982.U.S. Small Business Administration, The Stateof Small Business: A Report to the President(Washington, DC: U.S. Government PrintingOffice, 1984).U.S. Veterans Administration, 1982 Annual Re-port, Washington, DC, 1983.U.S. Veterans Administration, Assistant Inspec-tor General for Auditing, “Report of Audit: Pro-curement and Monitoring of Pacemakers, ” Proj-ect No. 101A-79-42, Washington, DC, Feb. 13,1980.U.S. Veterans Administration, Brief of Officeof Procurement and Supply, unpublished, Wash-ington, DC, December 1982.U.S. Veterans Administration, Department ofMedicine and Surgery, “Chief Medical Director’sPreface to Strategic Outlook,” draft 5, version2, Washington, DC, May 1983.U.S. Veterans Administration, Department ofMedicine and Surgery, letter to Honorable AlanK. Simpson, Chairman, Senate Committee onVeterans Affairs, concerning the VA Rehabilita-tion Engineering Center (VAREC), Washington,DC, May 12, 1983.U.S. Veterans Administration, Department ofMedicine and Surgery, Veterans AdministrationProsthetic and Sensory Aids Program SinceWorld War 11 (Washington, DC: U.S. Govern-ment Printing Office, 1977).U.S. Veterans Administration, Medical DistrictInitiated Program Planning: Guidance for thePreparation of Medical District Plans, vol. 1,Washington, DC, June 1983.U.S. Veterans Administration, Office of Plan-ning and Program Evaluation, RehabilitativeEngineering Research and Development Pro-gram Evaluation, Washington, DC, August1981.U.S. Veterans Administration, Office Of Pro-curement and Supply, “Evaluation of New Prod-ucts,” Washington, DC, January 1983.U.S. Veterans Administration, Rehabilitation

References • 253
436.
437.
438.
439.
440.
441.
442.
443.
444.
445.
446.
447.
448.
Research and Development Service, “Develop-ment and Evaluation Program, ” Washington,DC, 1983.Urban Systems Research and Engineering, andPolicy Analysis, Inc., Certificate of Need Pro-grams: A Rev.z”ew, Analysis, and Annotated Bib-liography of the Research Literature, preparedunder contract No. HRA-231-77-0114 for theDepartment of Health, Education, and Welfare,publication No. (HRA) 79-14006 (Washington,DC: U.S. Government Printing Office, Novem-ber 1978).Utterback, J. M., “Innovation in Industry andthe Diffusion of Technology,” Science 183:620-626, Feb. 15, 1974.Utterback, J. M., and Abernathy, W. J., “A Dy-namic Model of Process and Product Innova-tion,” Omega 3:639-656, 1975, as cited in (259).“VA Prosthetics . . . Some Recommendations,”DAV Magazine 24(8):8-9, August 1982.Venture Capital Journal, “Capital Transfusion1982,” 23(1):6, January 1983.Venture Capital Journal, “Evolution of an In-dustry: Venture Capital Redefined for the 1980’s,”January 1980.Venture Capital Journal, “Venture Capital Dis-bursements 1981: A Statistical Overview, ” 22(6):7, June 1982.Venture Economics, Wellesley Hills, MA, “Ven-ture Capital Investment in the Medical HealthCare Field,” contract report prepared for the Of-fice of Technology Assessment, U.S. Congress,Washington, DC, August 1983.Vlassembrouck, J. M., Surgical Products Divi-sion, 3M, Minneapolis, MN, personal commu-nication, Dec. 21, 1983.Von Hippel, E., “Appropriability of InnovationBenefit as a Predictor of Functional Locus of In-notation, ” unpublished, MIT Sloan School ofManagement, Cambridge, MA, 1979, as citedin (259).Von Hippel, E., “A Review of Data Bearing onthe User’s Role in Industrial Innovation,” unpub-lished, MIT Sloan School of Management, Cam-bridge, MA, 1978, as cited in (259).Wagner, J., “The Economic Evaluation of Medi-cine: A Review of the Literature, ” prepared forthe Pharmaceutical Manufacturers of America,mimeo, Oct. 1, 1982.Wagner, J. L., et al., Final Report: A Study ofthe Impact of Reimbursement Strategies on theDiffusion of Medical Technologies, Vol. II: Ap-pendices, report submitted to the Health CareFinancing Administration, HCFA/HHS grant #
449.
450.
451.
452.
453.
454.
455.
456.
457.
458.
459.
460.
461.
462,
18-p-97113/3-01 (Washington, DC: The UrbanInstitute, 1982).Wagner, L., Program Analyst, Office of the Di-rector, National Institutes of Health, Bethesda,MD, personal communication, Dec. 30, 1983.Warner, K. E., “Effects of Hospital Cost Con-tainment on the Development and Use of Med-ical Technology, ” Milbank Mere. Fund Q.56(2):187-211, 1978.Washington Report on Medicine and Health37(39):4, Oct. 3, 1983.Washington Report on Medicine and Health38(9):1, Feb. 27, 1984.Washington Report on Medicine and Health,“Perspectives: Health Planning Looks to the Fu-ture,” 37(48), Dec. 5, 1983,Weinstein, M. C., and Stason, W. B., “Cost-Ef-fectiveness of Coronary Artery Bypass Sur-gery,” Circulation 66(5) Part II, AHA Mono-graph No. 92, Technology Assessment Forumon Coronary Artery Bypass Surgery: Economic,Ethical and Social Issues, November 1982.Westphal, M., Frazier, E., and Miller, M. C.,“Changes in Average Length of Stay and Aver-age Charges Generated Following Institution ofPSRO Review,” Health Services Research 14(4):253-265, winter 1979.Williams, K., Health Insurance Association ofAmerica, Washington, DC, personal communi-cation, December 1982,Willingmyre, G. T., Reuse of Single-Use Hemo-dialyzers (Washington, DC: Health IndustryManufacturers Association, 1979).Willingmyre, G. T., Vice President for Techni-cal Affairs, Health Industry ManufacturersAssociation, comments made at meeting, Nov.28, 1983.Wilson, et al., “Intermittent Positive PressureBreathing,” Calif. Med. 87:161, 1957.Wilson, G. H., Special Assistant for Diagnos-tic Imaging Research, National Cancer Institute,National Institutes of Health, Bethesda, MD,personal communications, June 24, 1983 andSeptember 1983.Wineman, R., memorandum to file, re summaryof meeting concerning end-stage renal diseaseissue, Jan. 21, 1980, reprinted in The End StageRenal Disease Program (Part 2-Treatment Stand-ards and Methods, Hearing before Subcommit-tee of the Committee on Government Opera-tions, House of Representatives, Apr. 28, 1980(Washington, DC: U.S. Government PrintingOffice, 1982).Wisconsin Hospital Association, Report on

254 ● Federal Policies and the Medical Devices Industry
463.
464.
465.
WHA’S Evaluation of the Wisconsin Certificateof N4Program, July 23, 1982 (working draft).Wishinsky, H., Vice President, Scientific andRegulatory Affairs, Professional Products Group,Miles Laboratories, Inc., Elkhart, IN, personalcommunication, Dec. 14, 1983.Witt, A., U.S. Department of Health and Hu-man Services, Food and Drug Administration,Office of General Counsel, Food and Drug Divi-sion, personal communication, April 1984.Wright, D., U.S. Veterans Administration,Rehabilitation Engineering Center, New York,NY, personal communication, June 1983.
466. Zakupowsky, A., and Sunley, E., “An EarlyAssessment of the Capital Cost Recovery Sys-tem for R&D Equipment Provided by the Eco-nomic Recovery Tax Act of 1981, ” working pa-per prepared for the National Science Foundation,Washington, DC, September 1982.
467. Ziment, I., “Intermittent Positive PressureBreathing,” Respiratory Care, G. Burton, G.Gee, and J. Hodgkin (eds.) (Philadelphia: J. B.Lippincott, 1977).

Index
Index——American Association of Bioanalysts, 55American Hospital Supply Corp., 29American Osteopathic Association, 138
California, 66Canada, 36characteristics of the medical devices industry, 17-37
concentration, 28-31diversity in products, 22growth, 17-22innovation, 31-35
changes in the clinical laboratory, 32how ophthalmology has changed, 33
international competitiveness of U.S. medical devices,35
manufacturers, 25-28Congress:
House Committee on Energy and Commerce, Subcom-mittee on Oversight and Investigations, 97, 105
Senate Committee on Veterans Affairs, 3Senate Labor and Human Resources Committee, 3
consensus standards related to international trade, 204Contact Lens Manufacturers Association (CLMA), 107Cooper, Theodore, 98
database of Venture Economics, Inc., on sources offinancial capital, 197
Department of Commerce, 22, 163Department of Defense, 14Department of Energy, 80Department of Health and Human Services, 11, 49, 88diagnosis related groups (DRGs), 7, 8, 48, 50Dingell, Rep. John, 105
European Economic Community, 36
Food and Drug Administration (FDA), 3, 4, 5, 21, 44classification of medical devices, 8, 103, 104, 105investigational device exemption (IDE), 44regulation of medical devices, 8-10, 97-133
General Accounting Office, 97General Services Administration, 14governmental regulation of international trade, 216
Health Care Financing Administration (HCFA), 44, 53,60, 66, 138
Health Care Instrument and Device Institute (HIDI),New York, 91
health maintenance organizations (HMOs), 64, 65
Idaho, 144IMS America, Ltd., 22, 29Indiana, 48innovative process in the medical devices field, 186-190intermittent positive pressure breathing (IPPB), 45, 46Internal Revenue Service (IRS), 21
Joint Commission on Accreditation of Hospitals, 138,139
Japan, 36Johnson & Johnson, 29
legislation:Drug Amendments of 1962, 97Economic Recovery Act, 84Employee Retirement Income Security Act, 84Federal Food, Drug, and Cosmetic Act, 4, 5, 97Medical Device Amendments of 1976, 3, 4, 5, 8, 9,
14, 44, 97National Health Planning and Resources Development
Act of 1974, 12, 138, 151Omnibus Budget Reconciliation Act of 1980, 60, 66Orphan Drug Act of 1983, 11, 88Radiation Control for Health and Safety Act of 1968,
98Small Business Innovation Development Act, 86Social Security Amendments of 1983, 142
Louisiana, 144
Maryland, 48Metatech Corp., 87Minnesota, 144
National Institutes of Health (NIH), 5, 11, 7 9National Science Foundation (NSF), 78New Jersey, 48New Mexico, 144New York, 48, 91, 150nuclear magnetic resonance (NMR) imaging, 82
patent policy regarding medical devices, 191-195payment policies for health care and medical devices, 6,
41-73financial relationship between the third-party payer
and providers, 63-65per capita payment systems, 64public systems, 63
policy options, 65-73hospital payment, 70payment for devices used in the home, 67payment for laboratory testing, 66payment for physicians’ services, 68systemwide reforms, 72
third-party coverage of medical devices, 43-45third-party payment and the demand for medical
devices, 45-63hospital payment, 47Medicare’s DRG hospital payment system, 48payment for
52payment forpayment for
parenteralpayment for
ambulatory clinical laboratory services,
durable medical equipment, 55home health care services, 59and enteral nutrition therapy, 62medical devices used in the home, 54
257

258 ● Federal Policies and the Medical Devices Industry
payment for physicians’ services, 51Pharmaceutical Manufacturers Association, 31Professional Standards Review Organizations (PSROs),
11, 12, 137, 140, 142
regulation by FDA, 97-133discussion and conclusions, 117
impact of the amendments on medical device firms,121
postmarketing controls, 120regulation of intermediate classes of devices, 120regulation of preamendments Class 111 devices and
their postamendments equivalents, 118scope of medical devices subject to regulation, 118
implementation of the medical device law, 102classification of devices, 105good manufacturing practices, 107investigational device exemptions, 111performance standards, 107postmarketing surveillance, 114premarket approval, 112premarket notification, 103reclassification of devices, 107
policy options, 126assistance to small manufacturers, 132postmarketing monitoring and controls, 132regulation of Class II, or intermediate, devices, 131regulation of preamendments devices and their
postamendments equivalent, 128scope of medical device regulation, 127
regulation of the providers of medical devices, 11,137-154
Federal regulation, 137-145health planning regulations, 143under Medicare, 137
State regulation, 145-151certificate-of-need laws (CON), 147-151legislative activity in health planning, 1983Iicensure of facilities and personnel, 145
research and development policies, 11, 77-94Federal support for orphan devices, 88-90
wheelchairs, 90policy options, 92-94Small Business Innovation Research (SBIR) program,
86-88sources of support, 79
. .
Federal support, 79, 81, 82, 83private sources of funds, 80
State and local initiatives, 91-92trends in medical devices R&D, 78-79
Small Business Innovation Research (SBIR) program, 11,86-88
Standard Industrial Classification (SIC) codes, 17-30, 36,37, 78
State certificate-of-need (CON) laws, 12, 13, 143, 144,145, 147-154
tax policy and R&D, 199
U.S. Public Health Service, 14, 44
Veterans Administration (VA), 3, 4, 5, 6, 42policies regarding medical devices, 13, 157-176
adoption and use, 169-172influence of social, political, and economic fac-
tors, 170rehabilitative devices, 169strategic planning, 171
discussion and policy options, 173-176procurement, 174research and development, 173testing and evaluation, 173
overview of health care system, 157-160veteran patient population, 158
procurement and supply, 166-169central procurement by the VA marketing center,
166procurement by VA medical centers, 168
research and development, 160-162rehabilitation research and development service,
161VA prosthetics center, 161
testing and evaluation, 162-166commercially available equipment and supplies,
165commercially available rehabilitative devices, 163prototype rehabilitative devices, 162
VA Marketing Center, Hines, IL, 83
West Germany, 36
U.S. GOVERNMENT PRINTING OFFICE : 1984 0 - 25-406


![[ MEDICAL DEVICES ] - Global Affairs Canadainternational.gc.ca/.../pdfs/download/medical_devices.pdf · 2015-06-02 · CANADA’S MEDICAL DEVICES SECTOR Canada’s medical devices](https://img.pdfslide.net/doc/110x75/5f9f36e00d70d4306d589c5a/-medical-devices-global-affairs-2015-06-02-canadaas-medical-devices-sector.jpg)