Embed Size (px)
Citation preview

Semi-Annual Shareholder Report
April 30, 2017
Share Class TickerC MXCCX
R FMXKX
Institutional FISPX
Service FMXSX
Federated Max-CapIndex Fund
A Portfolio of Federated Index Trust
Not FDIC Insured • May Lose Value • No Bank Guarantee

CONTENTS
Portfolio of Investments Summary Table . . . . . . . . . . . . . . . . . . . . . . . . . . . . . . . . . . . . . . . . . . . . . . . . . . . . . . 1
Portfolio of Investments. . . . . . . . . . . . . . . . . . . . . . . . . . . . . . . . . . . . . . . . . . . . . . . . . . . . . . . . . . . . . . . . . . . . . . . . . . 2
Financial Highlights . . . . . . . . . . . . . . . . . . . . . . . . . . . . . . . . . . . . . . . . . . . . . . . . . . . . . . . . . . . . . . . . . . . . . . . . . . . . . . 17
Statement of Assets and Liabilities. . . . . . . . . . . . . . . . . . . . . . . . . . . . . . . . . . . . . . . . . . . . . . . . . . . . . . . . . . . . . 21
Statement of Operations. . . . . . . . . . . . . . . . . . . . . . . . . . . . . . . . . . . . . . . . . . . . . . . . . . . . . . . . . . . . . . . . . . . . . . . . . 23
Statement of Changes in Net Assets. . . . . . . . . . . . . . . . . . . . . . . . . . . . . . . . . . . . . . . . . . . . . . . . . . . . . . . . . . . 24
Notes to Financial Statements . . . . . . . . . . . . . . . . . . . . . . . . . . . . . . . . . . . . . . . . . . . . . . . . . . . . . . . . . . . . . . . . . . 25
Shareholder Expense Example . . . . . . . . . . . . . . . . . . . . . . . . . . . . . . . . . . . . . . . . . . . . . . . . . . . . . . . . . . . . . . . . . 36
Evaluation and Approval of Advisory Contract . . . . . . . . . . . . . . . . . . . . . . . . . . . . . . . . . . . . . . . . . . . . . . . . 38
Voting Proxies on Fund Portfolio Securities . . . . . . . . . . . . . . . . . . . . . . . . . . . . . . . . . . . . . . . . . . . . . . . . . . . 44
Quarterly Portfolio Schedule . . . . . . . . . . . . . . . . . . . . . . . . . . . . . . . . . . . . . . . . . . . . . . . . . . . . . . . . . . . . . . . . . . . . 44

Portfolio of Investments Summary Table (unaudited)At April 30, 2017, the Fund’s sector composition1 for its equity securitiesinvestments was as follows:
SectorPercentage of
Total Net Assets
Information Technology 22.0%
Financials 13.8%
Health Care 13.7%
Consumer Discretionary 12.3%
Industrials 9.9%
Consumer Staples 9.1%
Energy 6.2%
Utilities 3.1%
Real Estate 2.9%
Materials 2.8%
Telecommunication Services 2.3%
Derivative Contracts2 0.0%
Securities Lending Collateral3 0.2%
Cash Equivalents4 1.5%
Other Assets and Liabilities—Net5 0.2%
TOTAL6 100.0%
1 Except for Derivative Contracts, Cash Equivalents, Securities Lending Collateral and Other Assets andLiabilities, sector classifications are based upon, and individual portfolio securities are assigned to, theclassifications of the Global Industry Classification Standard (GICS) except that the Manager assigns aclassification to securities not classified by the GICS and to securities for which the Manager does nothave access to the classification made by the GICS.
2 Based upon net unrealized appreciation (depreciation) or value of the derivative contracts, asapplicable. Derivative contracts may consist of futures, forwards, options and swaps. The impact of aderivative contract on the Fund’s performance may be larger than its unrealized appreciation(depreciation) may indicate. In many cases, the notional value or notional principal amount of aderivative contract may provide a better indication of the contract’s significance to the portfolio. Morecomplete information regarding the Fund’s direct investments in derivative contracts, includingunrealized appreciation (depreciation) and notional values or amounts of such contracts, can be foundin the table at the end of the Portfolio of Investments included in this Report.
3 Cash collateral received from lending portfolio securities which is invested in short-term investmentssuch as repurchase agreements or money market mutual funds.
4 Cash Equivalents include any investments in money market mutual funds and/or overnightrepurchase agreements.
5 Assets, other than investments in securities and derivative contracts, less liabilities. See Statement ofAssets and Liabilities.
6 The Fund purchases index futures contracts to efficiently manage cash flows resulting from shareholderpurchases and redemptions, dividend and capital gain payments to shareholders and corporate actionswhile maintaining exposure to the Standard & Poor’s 500 Composite Stock Price (S&P 500) Index andminimizing trading costs. Taking into consideration these open index futures contracts, the Fund’seffective total exposure to the S&P 500 Index is effectively 99.8%.
Semi-Annual Shareholder Report1

Portfolio of InvestmentsApril 30, 2017 (unaudited)
Shares Value
COMMON STOCKS—98.1%1
Consumer Discretionary—12.3%
162 Advance Auto Parts, Inc. $ 23,027
8,888 2Amazon.com, Inc. 8,221,311
2,500 2AutoNation, Inc. 105,000
707 2AutoZone, Inc. 489,378
4,556 Bed Bath & Beyond, Inc. 176,545
11,297 Best Buy Co., Inc. 585,298
14,183 Block (H&R), Inc. 351,597
3,457 BorgWarner, Inc. 146,162
7,711 CBS Corp., Class B 513,244
3,498 2CarMax, Inc. 204,633
5,428 Carnival Corp. 335,288
4,144 2Charter Communications, Inc. 1,430,343
174 2Chipotle Mexican Grill, Inc. 82,558
7,498 Coach, Inc. 295,346
108,072 Comcast Corp., Class A 4,235,342
859 D. R. Horton, Inc. 28,253
8,771 2DISH Network Corp., Class A 565,203
3,415 Darden Restaurants, Inc. 290,924
6,646 Delphi Automotive PLC 534,338
2,627 2Discovery Communications, Inc., Class A 75,605
5,712 2Discovery Communications, Inc., Class C 159,822
2,588 Dollar General Corp. 188,173
5,277 2Dollar Tree, Inc. 436,777
2,555 Expedia, Inc. 341,655
2,380 Foot Locker, Inc. 184,069
91,758 Ford Motor Co. 1,052,464
3,644 Gap (The), Inc. 95,473
7,002 Garmin Ltd. 355,982
32,019 General Motors Co. 1,109,138
903 Genuine Parts Co. 83,094
6,935 Goodyear Tire & Rubber Co. 251,255
9,467 Hanesbrands, Inc. 206,475
3,412 Harley Davidson, Inc. 193,836
2,616 Hasbro, Inc. 259,272
25,951 Home Depot, Inc. 4,050,951
Semi-Annual Shareholder Report2
Shares Value
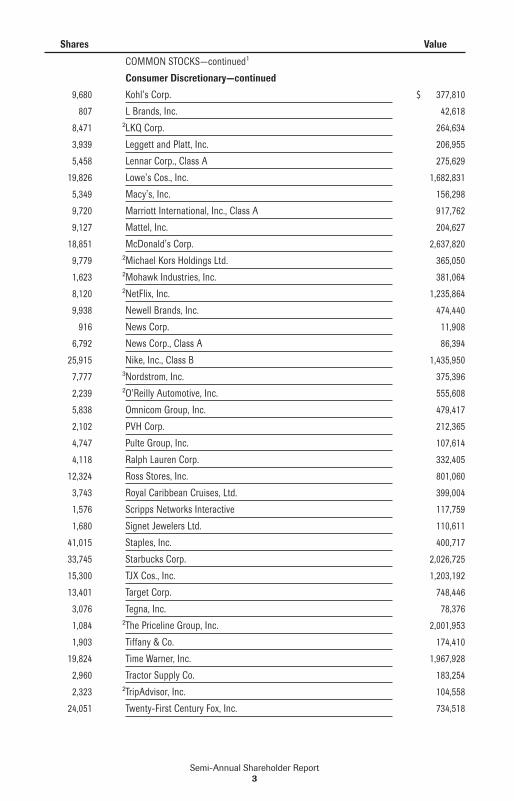
COMMON STOCKS—continued1
Consumer Discretionary—continued
9,680 Kohl’s Corp. $ 377,810
807 L Brands, Inc. 42,618
8,471 2LKQ Corp. 264,634
3,939 Leggett and Platt, Inc. 206,955
5,458 Lennar Corp., Class A 275,629
19,826 Lowe’s Cos., Inc. 1,682,831
5,349 Macy’s, Inc. 156,298
9,720 Marriott International, Inc., Class A 917,762
9,127 Mattel, Inc. 204,627
18,851 McDonald’s Corp. 2,637,820
9,779 2Michael Kors Holdings Ltd. 365,050
1,623 2Mohawk Industries, Inc. 381,064
8,120 2NetFlix, Inc. 1,235,864
9,938 Newell Brands, Inc. 474,440
916 News Corp. 11,908
6,792 News Corp., Class A 86,394
25,915 Nike, Inc., Class B 1,435,950
7,777 3Nordstrom, Inc. 375,396
2,239 2O’Reilly Automotive, Inc. 555,608
5,838 Omnicom Group, Inc. 479,417
2,102 PVH Corp. 212,365
4,747 Pulte Group, Inc. 107,614
4,118 Ralph Lauren Corp. 332,405
12,324 Ross Stores, Inc. 801,060
3,743 Royal Caribbean Cruises, Ltd. 399,004
1,576 Scripps Networks Interactive 117,759
1,680 Signet Jewelers Ltd. 110,611
41,015 Staples, Inc. 400,717
33,745 Starbucks Corp. 2,026,725
15,300 TJX Cos., Inc. 1,203,192
13,401 Target Corp. 748,446
3,076 Tegna, Inc. 78,376
1,084 2The Priceline Group, Inc. 2,001,953
1,903 Tiffany & Co. 174,410
19,824 Time Warner, Inc. 1,967,928
2,960 Tractor Supply Co. 183,254
2,323 2TripAdvisor, Inc. 104,558
24,051 Twenty-First Century Fox, Inc. 734,518
Semi-Annual Shareholder Report3

Shares Value
COMMON STOCKS—continued1
Consumer Discretionary—continued
11,761 Twenty-First Century Fox, Inc., Class B $ 351,183
2,127 2Ulta Beauty, Inc. 598,623
2,984 2,3Under Armour, Inc., Class A 64,126
2,893 2Under Armour, Inc., Class C 56,153
3,220 V.F. Corp. 175,909
7,632 Viacom, Inc., Class B - New 324,818
33,256 Walt Disney Co. 3,844,394
346 Whirlpool Corp. 64,245
2,827 Wyndham Worldwide Corp. 269,441
1,510 Wynn Resorts Ltd. 185,745
8,312 Yum! Brands, Inc. 546,514
TOTAL 58,011,952
Consumer Staples—9.1%
40,722 Altria Group, Inc. 2,923,025
11,864 Archer-Daniels-Midland Co. 542,778
4,981 Brown-Forman Corp., Class B 235,701
23,736 CVS Health Corp. 1,956,796
8,287 Campbell Soup Co. 476,834
6,669 Church and Dwight, Inc. 330,316
2,964 Clorox Co. 396,257
20,556 Colgate-Palmolive Co. 1,480,854
14,895 ConAgra Brands, Inc. 577,628
3,932 Constellation Brands, Inc., Class A 678,427
10,105 Costco Wholesale Corp. 1,793,840
10,417 Coty, Inc., Class A 185,943
4,612 Dr. Pepper Snapple Group, Inc. 422,690
5,557 Estee Lauder Cos., Inc., Class A 484,237
13,854 General Mills, Inc. 796,744
5,260 Hershey Foods Corp. 569,132
5,091 Kellogg Co. 361,461
8,374 Kimberly-Clark Corp. 1,086,526
12,968 Kraft Heinz Co./The 1,172,178
12,995 Kroger Co. 385,302
3,020 McCormick & Co., Inc. 301,698
3,616 Mead Johnson Nutrition Co. 320,812
4,632 Molson Coors Brewing Co., Class B 444,162
35,494 Mondelez International, Inc. 1,598,295
9,775 2Monster Beverage Corp. 443,589
Semi-Annual Shareholder Report4

Shares Value
COMMON STOCKS—continued1
Consumer Staples—continued
32,637 PepsiCo, Inc. $ 3,697,119
32,978 Phillip Morris International, Inc. 3,655,281
55,194 Procter & Gamble Co. 4,820,092
19,424 Reynolds American, Inc. 1,252,848
2,562 Smucker (J.M.) Co. 324,657
10,339 Sysco Corp. 546,623
81,779 The Coca-Cola Co. 3,528,764
10,199 Tyson Foods, Inc., Class A 655,388
34,653 Wal-Mart Stores, Inc. 2,605,213
19,615 Walgreens Boots Alliance, Inc. 1,697,482
7,560 Whole Foods Market, Inc. 274,957
TOTAL 43,023,649
Energy—6.2%
16,258 Anadarko Petroleum Corp. 927,031
7,669 Apache Corp. 373,020
13,562 Baker Hughes, Inc. 805,176
9,614 Cabot Oil & Gas Corp., Class A 223,429
42,311 Chevron Corp. 4,514,584
4,053 Cimarex Energy Co. 472,904
2,990 2Concho Resources, Inc. 378,713
26,894 ConocoPhillips 1,288,492
10,711 Devon Energy Corp. 422,977
15,430 EOG Resources, Inc. 1,427,275
3,131 EQT Corp. 182,036
94,176 Exxon Mobil Corp. 7,689,470
18,666 Halliburton Co. 856,396
1,775 Helmerich & Payne, Inc. 107,636
1,327 Hess Corp. 64,797
44,038 Kinder Morgan, Inc. 908,504
16,161 Marathon Oil Corp. 240,314
7,409 Marathon Petroleum Corp. 377,415
7,372 National Oilwell Varco, Inc. 257,799
3,168 2Newfield Exploration Co. 109,676
8,472 Noble Energy, Inc. 273,900
9,091 ONEOK, Inc. 478,278
17,978 Occidental Petroleum Corp. 1,106,366
10,539 Phillips 66 838,483
3,582 Pioneer Natural Resources, Inc. 619,650
Semi-Annual Shareholder Report5

Shares Value
COMMON STOCKS—continued1
Energy—continued
2,581 Range Resources Corp. $ 68,371
32,053 Schlumberger Ltd. 2,326,727
11,983 2TechnipFMC PLC 361,048
6,007 2Transocean Ltd. 66,257
6,819 Valero Energy Corp. 440,576
26,700 Williams Companies, Inc. 817,821
TOTAL 29,025,121
Financials—13.8%
9,700 Aflac, Inc. 726,336
8,800 Allstate Corp. 715,352
16,997 American Express Co. 1,347,012
20,277 American International Group, Inc. 1,235,072
3,135 Ameriprise Financial, Inc. 400,810
7,862 Aon PLC 942,182
19,226 BB&T Corp. 830,179
224,504 Bank of America Corp. 5,239,923
43,144 2Berkshire Hathaway, Inc., Class B 7,127,820
2,865 Blackrock, Inc. 1,101,793
1,498 CBOE Holdings, Inc. 123,450
5,820 CME Group, Inc. 676,226
13,408 Capital One Financial Corp. 1,077,735
8,841 Chubb Ltd. 1,213,427
4,002 Cincinnati Financial Corp. 288,504
66,325 Citigroup, Inc. 3,921,134
10,250 Citizens Financial Group, Inc. 376,278
3,328 Comerica, Inc. 235,290
8,054 Discover Financial Services 504,100
12,638 2E*Trade Financial Corp. 436,643
18,674 Fifth Third Bancorp 456,206
8,836 Franklin Resources, Inc. 380,920
3,221 Gallagher (Arthur J.) & Co. 179,764
8,178 Goldman Sachs Group, Inc. 1,830,236
9,387 Hartford Financial Services Group, Inc. 453,955
21,663 Huntington Bancshares, Inc. 278,586
14,198 Intercontinental Exchange, Inc. 854,720
2,054 Invesco Ltd. 67,659
78,126 J.P. Morgan Chase & Co. 6,796,962
21,714 KeyCorp 396,063
Semi-Annual Shareholder Report6

Shares Value
COMMON STOCKS—continued1
Financials—continued
15,962 Leucadia National Corp. $ 405,275
4,419 Lincoln National Corp. 291,345
7,206 Loews Corp. 335,944
3,722 M & T Bank Corp. 578,436
12,244 Marsh & McLennan Cos., Inc. 907,648
23,693 MetLife, Inc. 1,227,534
3,591 Moody’s Corp. 424,887
31,446 Morgan Stanley 1,363,813
3,246 NASDAQ, Inc. 223,552
22,324 Navient Corp. 339,325
5,368 Northern Trust Corp. 483,120
11,343 PNC Financial Services Group 1,358,324
9,598 People’s United Financial, Inc. 167,677
5,318 Principal Financial Group 346,361
18,874 Progressive Corp., Ohio 749,675
11,774 Prudential Financial 1,260,171
2,295 Raymond James Financial, Inc. 171,023
42,534 Regions Financial Corp. 584,843
5,483 S&P Global, Inc. 735,764
26,367 Schwab (Charles) Corp. 1,024,358
7,634 State Street Corp. 640,493
7,142 SunTrust Banks, Inc. 405,737
16,102 Synchrony Financial 447,636
2,289 T. Rowe Price Group, Inc. 162,267
24,374 The Bank of New York Mellon Corp. 1,147,040
6,690 The Travelers Cos, Inc. 813,905
5,402 Torchmark Corp. 414,387
36,790 U.S. Bancorp 1,886,591
4,220 Unum Group 195,513
97,775 Wells Fargo & Co. 5,264,206
1,093 Willis Towers Watson PLC 144,954
208 XL Group Ltd. 8,705
3,530 Zions Bancorp 141,306
TOTAL 64,866,152
Health Care—13.7%
38,591 Abbott Laboratories 1,684,111
36,096 AbbVie, Inc. 2,380,170
7,834 Aetna, Inc. 1,058,138
Semi-Annual Shareholder Report7

Shares Value
COMMON STOCKS—continued1
Health Care—continued
7,246 Agilent Technologies, Inc. $ 398,892
4,880 2Alexion Pharmaceuticals, Inc. 623,566
6,605 Allergan PLC 1,610,695
1,107 AmerisourceBergen Corp. 90,829
16,883 Amgen, Inc. 2,757,332
5,695 Anthem, Inc. 1,013,084
865 Bard (C.R.), Inc. 265,970
11,871 Baxter International, Inc. 660,977
4,691 Becton, Dickinson & Co. 877,076
4,878 2Biogen, Inc. 1,322,962
28,884 2Boston Scientific Corp. 761,960
33,740 Bristol-Myers Squibb Co. 1,891,127
7,323 Cigna Corp. 1,145,097
4,337 Cardinal Health, Inc. 314,823
17,306 2Celgene Corp. 2,146,809
7,246 2Centene Corp. 539,102
7,443 2Cerner Corp. 481,934
2,295 Cooper Cos., Inc. 459,757
14,308 Danaher Corp. 1,192,286
3,964 2Davita, Inc. 273,556
1,530 Dentsply Sirona, Inc. 96,757
2,316 2Edwards Lifesciences Corp. 253,996
3,057 2Envision Healthcare Corp. 171,284
14,387 2Express Scripts Holding Co. 882,499
30,182 Gilead Sciences, Inc. 2,068,976
7,066 2HCA Holdings, Inc. 595,028
2,057 2Henry Schein, Inc. 357,507
6,275 2Hologic, Inc. 283,316
2,320 Humana, Inc. 514,994
3,508 2IDEXX Laboratories, Inc. 588,397
1,857 2Illumina, Inc. 343,285
5,530 2Incyte Genomics, Inc. 687,268
807 2Intuitive Surgical, Inc. 674,547
61,617 Johnson & Johnson 7,607,851
2,144 2Laboratory Corp. of America Holdings 300,482
22,094 Lilly (Eli) & Co. 1,813,034
1,702 2Mallinckrodt PLC 79,858
6,337 McKesson Corp. 876,344
Semi-Annual Shareholder Report8

Shares Value
COMMON STOCKS—continued1
Health Care—continued
31,468 Medtronic PLC $ 2,614,676
65,579 Merck & Co., Inc. 4,087,539
489 2Mettler Toledo International, Inc. 251,062
9,436 2Mylan NV 352,435
1,801 Patterson Companies, Inc. 80,126
3,300 PerkinElmer, Inc. 196,053
2,586 Perrigo Co. PLC 191,209
135,199 Pfizer, Inc. 4,585,950
2,637 Quest Diagnostics, Inc. 278,230
2,304 2Regeneron Pharmaceuticals, Inc. 895,081
7,159 Stryker Corp. 976,273
7,354 Thermo Fisher Scientific, Inc. 1,215,837
21,504 UnitedHealth Group, Inc. 3,760,620
2,399 Universal Health Services, Inc., Class B 289,703
1,597 2Varian Medical Systems, Inc. 144,912
7,646 2Vertex Pharmaceuticals, Inc. 904,522
2,039 2Waters Corp. 346,406
6,472 Zimmer Biomet Holdings, Inc. 774,375
10,259 Zoetis, Inc. 575,632
TOTAL 64,666,317
Industrials—9.9%
13,703 3M Co. 2,683,459
6,033 AMETEK, Inc. 345,088
2,407 Alaska Air Group, Inc. 204,812
2,455 Allegion PLC 193,061
10,394 American Airlines Group, Inc. 442,992
8,257 Arconic, Inc. 225,664
14,154 Boeing Co. (The) 2,616,084
243 C.H. Robinson Worldwide, Inc. 17,666
19,947 CSX Corp. 1,014,105
15,725 Caterpillar, Inc. 1,608,039
11 Cintas Corp. 1,347
4,990 Cummins, Inc. 753,191
8,700 Deere & Co. 971,007
17,471 Delta Air Lines, Inc. 793,882
2,930 Dover Corp. 231,118
10,782 Eaton Corp. PLC 815,550
14,758 Emerson Electric Co. 889,612
Semi-Annual Shareholder Report9

Shares Value
COMMON STOCKS—continued1
Industrials—continued
3,049 Equifax, Inc. $ 412,560
2,030 Fastenal Co. 90,700
5,296 FedEx Corp. 1,004,651
2,493 Flowserve Corp. 126,819
7,416 Fluor Corp. 380,589
2,921 Fortive Corp. 184,782
3,641 Fortune Brands Home & Security, Inc. 232,077
6,420 General Dynamics Corp. 1,244,132
189,223 General Electric Co. 5,485,575
17,550 Honeywell International, Inc. 2,301,507
2,448 Hunt (J.B.) Transportation Services, Inc. 219,488
6,699 Illinois Tool Works, Inc. 925,065
6,132 Ingersoll-Rand PLC 544,215
6,861 Jacobs Engineering Group, Inc. 376,806
15,671 Johnson Controls International PLC 651,443
2,945 Kansas City Southern Industries, Inc. 265,256
1,579 L3 Technologies, Inc. 271,225
5,809 Lockheed Martin Corp. 1,565,235
6,710 Masco Corp. 248,404
8,635 Nielsen Holdings PLC 355,158
6,160 Norfolk Southern Corp. 723,738
4,133 Northrop Grumman Corp. 1,016,553
7,252 PACCAR, Inc. 483,926
2,718 Parker-Hannifin Corp. 437,054
4,101 Pentair PLC 264,556
2,183 2Quanta Services, Inc. 77,366
6,912 Raytheon Co. 1,072,812
4,475 Republic Services, Inc. 281,880
3,196 Robert Half International, Inc. 147,176
2,607 Rockwell Automation, Inc. 410,211
1,330 Rockwell Collins 138,440
2,518 Roper Technologies, Inc. 550,687
597 Ryder Systems, Inc. 40,542
18,150 Southwest Airlines Co. 1,020,393
3,562 Stanley Black & Decker, Inc. 484,966
1,762 2Stericycle, Inc. 150,369
5,576 Textron, Inc. 260,176
149 Transdigm Group, Inc. 36,763
Semi-Annual Shareholder Report10

Shares Value
COMMON STOCKS—continued1
Industrials—continued
20,560 Union Pacific Corp. $ 2,301,898
5,953 2United Continental Holdings, Inc. 417,960
15,988 United Parcel Service, Inc. 1,718,070
3,745 2United Rentals, Inc. 410,677
17,330 United Technologies Corp. 2,062,097
622 2Verisk Analytics, Inc. 51,508
2,163 W. W. Grainger, Inc. 416,810
9,764 Waste Management, Inc. 710,624
3,105 Xylem, Inc. 159,628
TOTAL 46,539,244
Information Technology—22.0%
14,429 Accenture PLC 1,750,238
14,677 Activision Blizzard, Inc. 766,873
13,076 2Adobe Systems, Inc. 1,748,784
14,037 2Advanced Micro Devices, Inc. 186,692
7,478 2Akamai Technologies, Inc. 455,709
1,303 Alliance Data Systems Corp. 325,268
6,705 2Alphabet, Inc., Class A 6,198,907
6,699 2Alphabet, Inc., Class C 6,069,026
3,717 Amphenol Corp., Class A 268,776
8,043 Analog Devices, Inc. 612,877
118,372 Apple, Inc. 17,004,138
30,285 Applied Materials, Inc. 1,229,874
3,890 2Autodesk, Inc. 350,372
7,922 Automatic Data Processing, Inc. 827,770
8,847 Broadcom Ltd. 1,953,506
1,695 CSRA, Inc. 49,291
114,408 Cisco Systems, Inc. 3,897,881
6,323 2Citrix Systems, Inc. 511,784
9,859 2Cognizant Technology Solutions Corp. 593,808
22,644 Corning, Inc. 653,279
6,412 DXC Technology Co. 483,080
15,856 2eBay, Inc. 529,749
6,860 2Electronic Arts, Inc. 650,465
5,238 2FIserv, Inc. 624,055
4,339 FLIR Systems, Inc. 159,371
1,151 2F5 Networks, Inc. 148,629
53,277 2Facebook, Inc. 8,004,869
Semi-Annual Shareholder Report11
Shares Value
COMMON STOCKS—continued1
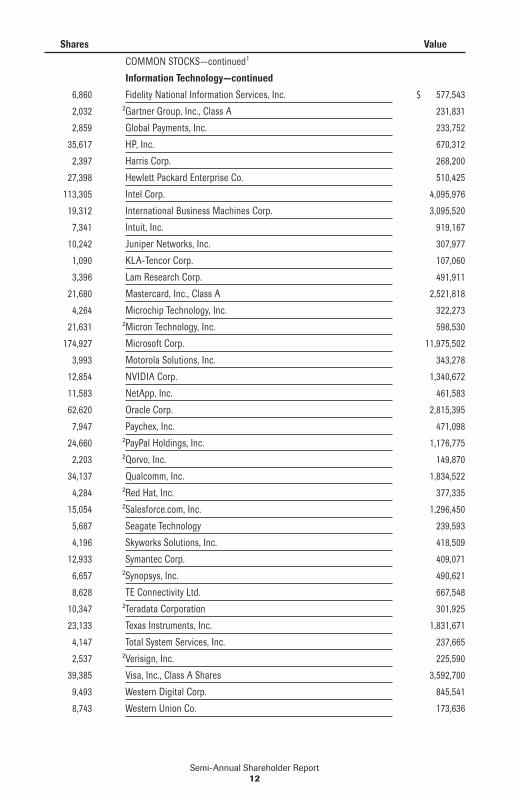
Information Technology—continued
6,860 Fidelity National Information Services, Inc. $ 577,543
2,032 2Gartner Group, Inc., Class A 231,831
2,859 Global Payments, Inc. 233,752
35,617 HP, Inc. 670,312
2,397 Harris Corp. 268,200
27,398 Hewlett Packard Enterprise Co. 510,425
113,305 Intel Corp. 4,095,976
19,312 International Business Machines Corp. 3,095,520
7,341 Intuit, Inc. 919,167
10,242 Juniper Networks, Inc. 307,977
1,090 KLA-Tencor Corp. 107,060
3,396 Lam Research Corp. 491,911
21,680 Mastercard, Inc., Class A 2,521,818
4,264 Microchip Technology, Inc. 322,273
21,631 2Micron Technology, Inc. 598,530
174,927 Microsoft Corp. 11,975,502
3,993 Motorola Solutions, Inc. 343,278
12,854 NVIDIA Corp. 1,340,672
11,583 NetApp, Inc. 461,583
62,620 Oracle Corp. 2,815,395
7,947 Paychex, Inc. 471,098
24,660 2PayPal Holdings, Inc. 1,176,775
2,203 2Qorvo, Inc. 149,870
34,137 Qualcomm, Inc. 1,834,522
4,284 2Red Hat, Inc. 377,335
15,054 2Salesforce.com, Inc. 1,296,450
5,687 Seagate Technology 239,593
4,196 Skyworks Solutions, Inc. 418,509
12,933 Symantec Corp. 409,071
6,657 2Synopsys, Inc. 490,621
8,628 TE Connectivity Ltd. 667,548
10,347 2Teradata Corporation 301,925
23,133 Texas Instruments, Inc. 1,831,671
4,147 Total System Services, Inc. 237,665
2,537 2Verisign, Inc. 225,590
39,385 Visa, Inc., Class A Shares 3,592,700
9,493 Western Digital Corp. 845,541
8,743 Western Union Co. 173,636
Semi-Annual Shareholder Report12

Shares Value
COMMON STOCKS—continued1
Information Technology—continued
20,022 Xerox Corp. $ 143,958
1,780 Xilinx, Inc. 112,336
18,828 2Yahoo, Inc. 907,698
TOTAL 103,847,908
Materials—2.8%
5,247 Air Products & Chemicals, Inc. 737,204
2,097 Albemarle Corp. 228,384
2,597 Avery Dennison Corp. 216,096
866 Ball Corp. 66,587
19,254 Du Pont (E.I.) De Nemours 1,535,507
25,196 Dow Chemical Co. 1,582,309
3,867 Eastman Chemical Co. 308,393
6,296 Ecolab, Inc. 812,751
6,148 FMC Corp. 450,218
48,011 2Freeport-McMoRan, Inc. 612,140
2,002 International Flavors & Fragrances, Inc. 277,457
8,389 International Paper Co. 452,754
7,963 LyondellBasell Industries NV, Class A 674,944
1,205 Martin Marietta Materials 265,329
9,509 Monsanto Co. 1,108,845
6,622 Mosaic Co./The 178,330
19,029 Newmont Mining Corp. 643,370
6,484 Nucor Corp. 397,664
3,579 PPG Industries, Inc. 393,117
6,829 Praxair, Inc. 853,488
4,108 Sealed Air Corp. 180,834
1,092 Sherwin-Williams Co. 365,471
2,732 Vulcan Materials Co. 330,244
10,051 WestRock Co. 538,332
TOTAL 13,209,768
Real Estate—2.9%
1,587 Alexandria Real Estate Equities, Inc. 178,553
9,244 American Tower Corp. 1,164,189
3,806 Apartment Investment & Management Co., Class A 166,475
1,853 Avalonbay Communities, Inc. 351,774
5,214 Boston Properties, Inc. 660,092
5,515 2CBRE Group Inc. 197,492
8,346 Crown Castle International Corp. 789,532
Semi-Annual Shareholder Report13

Shares Value
COMMON STOCKS—continued1
Real Estate—continued
3,150 Digital Realty Trust, Inc. $ 361,746
2,227 Equinix, Inc. 930,218
4,649 Equity Residential Properties Trust 300,233
1,678 Essex Property Trust, Inc. 410,221
1,975 Federal Realty Investment Trust 258,508
15,152 General Growth Properties, Inc. 327,435
18,252 HCP, Inc. 572,200
29,334 Host Hotels & Resorts, Inc. 526,545
4,203 Iron Mountain, Inc. 146,096
11,633 Kimco Realty Corp. 236,034
2,983 Mid-American Apartment Communities, Inc. 295,944
16,500 ProLogis, Inc. 897,765
2,326 Public Storage 487,018
6,349 Realty Income Corp. 370,464
3,991 Regency Centers Corp. 252,151
1,844 SL Green Realty Corp. 193,491
7,493 Simon Property Group, Inc. 1,238,293
7,313 UDR, Inc. 273,067
7,670 Ventas, Inc. 490,957
6,097 Vornado Realty Trust 586,775
8,871 Welltower, Inc. 633,744
10,074 Weyerhaeuser Co. 341,206
TOTAL 13,638,218
Telecommunication Services—2.3%
139,743 AT&T, Inc. 5,538,015
14,314 3CenturyLink, Inc. 367,440
6,955 2Level 3 Communications, Inc. 422,586
92,950 Verizon Communications 4,267,335
TOTAL 10,595,376
Utilities—3.1%
35,292 AES Corp. 399,153
3,962 Alliant Energy Corp. 155,786
5,820 Ameren Corp. 318,296
10,402 American Electric Power Co., Inc. 705,568
3,539 American Water Works Co., Inc. 282,271
5,884 CMS Energy Corp. 267,134
18,083 CenterPoint Energy, Inc. 515,908
7,491 Consolidated Edison Co. 593,886
Semi-Annual Shareholder Report14

Shares Value
COMMON STOCKS—continued1
Utilities—continued
3,591 DTE Energy Co. $ 375,583
14,781 Dominion Resources, Inc. 1,144,493
15,230 Duke Energy Corp. 1,256,475
7,607 Edison International 608,332
973 Entergy Corp. 74,201
6,366 EverSource Energy 378,140
19,637 Exelon Corp. 680,029
8,508 FirstEnergy Corp. 254,730
10,911 NextEra Energy, Inc. 1,457,273
20,025 NRG Energy, Inc. 338,422
11,015 PG & E Corp. 738,556
16,601 PPL Corp. 632,664
2,299 Pinnacle West Capital Corp. 195,622
10,808 Public Service Enterprises Group, Inc. 476,092
3,562 Sempra Energy 402,577
17,779 Southern Co. 885,394
10,987 WEC Energy Group, Inc. 664,933
16,743 Xcel Energy, Inc. 754,272
TOTAL 14,555,790
TOTAL COMMON STOCKS(IDENTIFIED COST $149,278,349) 461,979,495
INVESTMENT COMPANIES—1.7%4
735,397 5Federated Government Obligations Fund, Institutional Shares, 0.65%6 735,397
7,287,920 Federated Institutional Prime Value Obligations Fund,Institutional Shares, 0.99%6 7,290,106
TOTAL INVESTMENT COMPANIES(IDENTIFIED COST $8,023,962) 8,025,503
TOTAL INVESTMENTS—99.8%(IDENTIFIED COST $157,302,311)7 470,004,998
OTHER ASSETS AND LIABILITIES - NET—0.2%8 1,011,878
TOTAL NET ASSETS—100% $471,016,876
At April 30, 2017, the Fund had the following outstanding futures contracts:
DescriptionNumber ofContracts
NotionalValue
ExpirationDate
UnrealizedAppreciation
2S&P 500 E-Mini Index Long Futures 21 $2,499,525 June 2017 $19,3192S&P 500 Index Long Futures 9 $5,356,125 June 2017 $23,346
UNREALIZED APPRECIATION ON FUTURES CONTRACTS $42,665
Unrealized Appreciation on Futures Contracts is included in “Other Assets andLiabilities—Net.”
Semi-Annual Shareholder Report15

1 The Fund purchases index futures contracts to efficiently manage cash flows resulting from shareholderpurchases and redemptions, dividend and capital gain payments to shareholders and corporate actionswhile maintaining exposure to the S&P 500 Index and minimizing trading costs. The underlying faceamount, at value, of open index futures contracts is $7,855,650 at April 30, 2017, which represents 1.7%of total net assets. Taking into consideration these open index futures contracts, the Fund’s effectivetotal exposure to the S&P 500 Index is 99.8%.
2 Non-income-producing security.3 All or a portion of these securities are temporarily on loan to unaffiliated broker/dealers.4 Affiliated holdings.5 All or a portion of this security is held as collateral for securities lending.6 7-day net yield.7 Also represents cost for federal tax purposes.8 Assets, other than investments in securities, less liabilities. See Statement of Assets and Liabilities.
Note: The categories of investments are shown as a percentage of total net assets atApril 30, 2017.
Various inputs are used in determining the value of the Fund’s investments. These inputs aresummarized in the three broad levels listed below:
Level 1—quoted prices in active markets for identical securities.Level 2—other significant observable inputs (including quoted prices for similar securities,interest rates, prepayment speeds, credit risk, etc.). Also includes securities valued atamortized cost.Level 3—significant unobservable inputs (including the Fund’s own assumptions indetermining the fair value of investments).The inputs or methodology used for valuingsecurities are not an indication of the risk associated with investing in those securities.
As of April 30, 2017, all investments of the Fund utilized Level 1 inputs in valuing the Fund’sassets carried at fair value.
See Notes which are an integral part of the Financial Statements
Semi-Annual Shareholder Report16

Financial Highlights – Class C Shares(For a Share Outstanding Throughout Each Period)
Six MonthsEnded
(unaudited)4/30/2017
Year Ended October 31,2016 2015 2014 2013 2012
Net Asset Value, Beginning of Period $14.54 $16.06 $17.27 $16.34 $14.17 $12.83Income From Investment Operations:Net investment income 0.041 0.11 0.11 0.09 0.111 0.09Net realized and unrealized gain oninvestments and futures contracts 1.61 0.32 0.51 2.29 3.29 1.60
TOTAL FROM INVESTMENT OPERATIONS 1.65 0.43 0.62 2.38 3.40 1.69
Less Distributions:Distributions from net investment income (0.06) (0.11) (0.11) (0.09) (0.11) (0.09)Distributions from net realized gain oninvestments and futures contracts (2.20) (1.84) (1.72) (1.36) (1.12) (0.26)
TOTAL DISTRIBUTIONS (2.26) (1.95) (1.83) (1.45) (1.23) (0.35)
Net Asset Value, End of Period $13.93 $14.54 $16.06 $17.27 $16.34 $14.17Total Return2 12.60% 3.19% 3.71% 15.74% 26.19% 13.43%
Ratios to Average Net Assets:Net expenses 1.42%3 1.42% 1.42% 1.42% 1.43% 1.43%Net investment income 0.54%3 0.75% 0.61% 0.56% 0.73% 0.72%Expense waiver/reimbursement4 0.05%3 0.05% 0.04% 0.04% 0.04% 0.07%Supplemental Data:Net assets, end of period (000 omitted) $40,586 $36,956 $40,273 $38,684 $37,078 $30,445Portfolio turnover 16% 31% 31% 28% 26% 38%
1 Per share numbers have been calculated using the average shares method.2 Based on net asset value, which does not reflect the sales charge, redemption fee or contingent
deferred sales charge, if applicable. Total returns for periods of less than one year are not annualized.3 Computed on an annualized basis.4 This expense decrease is reflected in both the net expense and the net investment income ratios
shown above.
See Notes which are an integral part of the Financial Statements
Semi-Annual Shareholder Report17

Financial Highlights – Class R Shares(For a Share Outstanding Throughout Each Period)
Six MonthsEnded
(unaudited)4/30/2017
Year Ended October 31,2016 2015 2014 2013 2012
Net Asset Value, Beginning of Period $14.68 $16.19 $17.39 $16.45 $14.26 $12.90Income From Investment Operations:Net investment income 0.061 0.15 0.16 0.13 0.161 0.15Net realized and unrealized gain oninvestments and futures contracts 1.63 0.34 0.52 2.31 3.31 1.61
TOTAL FROM INVESTMENT OPERATIONS 1.69 0.49 0.68 2.44 3.47 1.76
Less Distributions:Distributions from net investment income (0.08) (0.16) (0.16) (0.14) (0.16) (0.14)Distributions from net realized gain oninvestments and futures contracts (2.20) (1.84) (1.72) (1.36) (1.12) (0.26)
TOTAL DISTRIBUTIONS (2.28) (2.00) (1.88) (1.50) (1.28) (0.40)
Net Asset Value, End of Period $14.09 $14.68 $16.19 $17.39 $16.45 $14.26Total Return2 12.77% 3.56% 4.05% 16.05% 26.59% 13.89%
Ratios to Average Net Assets:Net expenses 1.11%3 1.10% 1.10% 1.10% 1.07% 1.10%Net investment income 0.86%3 1.07% 0.93% 0.87% 1.09% 1.03%Expense waiver/reimbursement4 0.06%3 0.08% 0.06% 0.04% 0.04% 0.07%Supplemental Data:Net assets, end of period (000 omitted) $48,300 $47,998 $45,190 $43,501 $47,403 $40,047Portfolio turnover 16% 31% 31% 28% 26% 38%
1 Per share numbers have been calculated using the average shares method.2 Based on net asset value. Total returns for periods of less than one year are not annualized.3 Computed on an annualized basis.4 This expense decrease is reflected in both the net expense and the net investment income ratios
shown above.
See Notes which are an integral part of the Financial Statements
Semi-Annual Shareholder Report18

Financial Highlights – Institutional Shares(For a Share Outstanding Throughout Each Period)
Six MonthsEnded
(unaudited)4/30/2017
Year Ended October 31,2016 2015 2014 2013 2012
Net Asset Value,Beginning of Period $14.80 $16.31 $17.50 $16.54 $14.33 $12.96Income FromInvestment Operations:Net investment income 0.111 0.28 0.27 0.27 0.271 0.25Net realized and unrealized gain oninvestments and futures contracts 1.65 0.31 0.54 2.31 3.33 1.62
TOTAL FROMINVESTMENT OPERATIONS 1.76 0.59 0.81 2.58 3.60 1.87
Less Distributions:Distributions from netinvestment income (0.13) (0.26) (0.28) (0.26) (0.27) (0.24)Distributions from net realized gain oninvestments and futures contracts (2.20) (1.84) (1.72) (1.36) (1.12) (0.26)
TOTAL DISTRIBUTIONS (2.33) (2.10) (2.00) (1.62) (1.39) (0.50)
Net Asset Value, End of Period $14.23 $14.80 $16.31 $17.50 $16.54 $14.33Total Return2 13.20% 4.30% 4.87% 16.94% 27.51% 14.74%
Ratios to Average Net Assets:Net expenses 0.36%3 0.35% 0.35% 0.35% 0.35% 0.35%Net investment income 1.60%3 1.82% 1.68% 1.62% 1.80% 1.80%Expense waiver/reimbursement4 0.08%3 0.09% 0.07% 0.07% 0.08% 0.08%Supplemental Data:Net assets, end of period (000 omitted) $223,950 $208,577 $257,742 $266,292 $252,517 $198,656Portfolio turnover 16% 31% 31% 28% 26% 38%
1 Per share numbers have been calculated using the average shares method.2 Based on net asset value, which does not reflect the sales charge, redemption fee or contingent
deferred sales charge, if applicable. Total returns for periods of less than one year are not annualized.3 Computed on an annualized basis.4 This expense decrease is reflected in both the net expense and the net investment income ratios
shown above.
See Notes which are an integral part of the Financial Statements
Semi-Annual Shareholder Report19

Financial Highlights – Service Shares(For a Share Outstanding Throughout Each Period)
Six MonthsEnded
(unaudited)4/30/2017
Year Ended October 31,2016 2015 2014 2013 2012
Net Asset Value,Beginning of Period $14.69 $16.20 $17.40 $16.45 $14.26 $12.90Income FromInvestment Operations:Net investment income 0.091 0.21 0.21 0.22 0.231 0.20Net realized and unrealized gain oninvestments and futures contracts 1.64 0.34 0.54 2.30 3.30 1.62
TOTAL FROMINVESTMENT OPERATIONS 1.73 0.55 0.75 2.52 3.53 1.82
Less Distributions:Distributions from netinvestment income (0.11) (0.22) (0.23) (0.21) (0.22) (0.20)Distributions from net realized gain oninvestments and futures contracts (2.20) (1.84) (1.72) (1.36) (1.12) (0.26)
TOTAL DISTRIBUTIONS (2.31) (2.06) (1.95) (1.57) (1.34) (0.46)
Net Asset Value, End of Period $14.11 $14.69 $16.20 $17.40 $16.45 $14.26Total Return2 13.08% 4.01% 4.52% 16.62% 27.11% 14.38%
Ratios to Average Net Assets:Net expenses 0.66%3 0.65% 0.65% 0.65% 0.65% 0.65%Net investment income 1.35%3 1.52% 1.38% 1.32% 1.53% 1.50%Expense waiver/reimbursement4 0.35%3 0.36% 0.35% 0.35% 0.36% 0.39%Supplemental Data:Net assets, end of period (000 omitted) $158,181 $180,503 $218,171 $270,634 $251,893 $259,304Portfolio turnover 16% 31% 31% 28% 26% 38%
1 Per share numbers have been calculated using the average shares method.2 Based on net asset value. Total returns for periods of less than one year are not annualized.3 Computed on an annualized basis.4 This expense decrease is reflected in both the net expense and the net investment income ratios
shown above.
See Notes which are an integral part of the Financial Statements
Semi-Annual Shareholder Report20

Assets:
Total investment in securities, at value including $714,103 of securities loanedand $8,025,503 of investment in affiliated holdings (identified cost $157,302,311) $470,004,998
Restricted cash (Note 2) 330,000
Income receivable 468,337
Receivable for shares sold 1,471,028
TOTAL ASSETS 472,274,363
Liabilities:
Payable for shares redeemed $248,950
Payable for daily variation margin on futures contracts 8,353
Payable for collateral due to broker for securities lending 735,397
Payable to adviser (Note 5) 9,741
Payable for transfer agent fee 75,485
Payable for portfolio accounting fees 55,157
Payable for distribution services fee (Note 5) 51,733
Payable for other service fees (Notes 2 and 5) 52,680
Accrued expenses (Note 5) 19,991
TOTAL LIABILITIES 1,257,487
Net assets for 33,292,474 shares outstanding $471,016,876
Net Assets Consist of:
Paid-in capital $127,748,798
Net unrealized appreciation of investments and futures contracts 312,745,352
Accumulated net realized gain on investments and futures contracts 30,665,093
Distributions in excess of net investment income (142,367)
TOTAL NET ASSETS $471,016,876
Statement of Assets and LiabilitiesApril 30, 2017 (unaudited)
Semi-Annual Shareholder Report21

Net Asset Value, Offering Price and Redemption Proceeds Per Share
Class C Shares:
Net asset value per share ($40,586,162 ÷ 2,912,830 shares outstanding), no parvalue, unlimited shares authorized $13.93
Offering price per share $13.93
Redemption proceeds per share (99.00/100 of $13.93) $13.79
Class R Shares:
Net asset value per share ($48,300,082 ÷ 3,426,986 shares outstanding), no parvalue, unlimited shares authorized $14.09
Offering price per share $14.09
Redemption proceeds per share $14.09
Institutional Shares:
Net asset value per share ($223,949,541 ÷ 15,738,217 shares outstanding), no parvalue, unlimited shares authorized $14.23
Offering price per share $14.23
Redemption proceeds per share $14.23
Service Shares:
Net asset value per share ($158,181,091 ÷ 11,214,441 shares outstanding), no parvalue, unlimited shares authorized $14.11
Offering price per share $14.11
Redemption proceeds per share $14.11
See Notes which are an integral part of the Financial Statements
Statement of Assets and Liabilities – continued
Semi-Annual Shareholder Report22

Investment Income:
Dividends (including $58,688 received from affiliatedholdings (Note 5)) $ 4,650,394
Interest (including income on securities loaned of $3,597) 3,692
TOTAL INCOME 4,654,086
Expenses:
Management fee (Note 5) $ 707,010
Custodian fees 23,983
Transfer agent fee (Note 2) 236,574
Directors’/Trustees’ fees (Note 5) 3,987
Auditing fees 12,794
Legal fees 6,970
Portfolio accounting fees 61,097
Distribution services fee (Note 5) 531,220
Other service fees (Notes 2 and 5) 266,092
Share registration costs 30,750
Printing and postage 17,024
Miscellaneous (Note 5) 17,951
TOTAL EXPENSES 1,915,452
Waivers and Reimbursements:
Waiver/reimbursement of investment adviser fee (Note 5) $(112,684)
Waiver/reimbursement of other operating expenses(Notes 2 and 5) (308,247)
TOTAL WAIVERS AND REIMBURSEMENTS (420,931)
Net expenses 1,494,521
Net investment income 3,159,565
Realized and Unrealized Gain (Loss) on Investments andFutures Contracts:
Net realized gain on investments 34,961,289
Net realized gain on futures contracts 1,584,389
Net change in unrealized appreciation of investments 18,401,932
Net change in unrealized depreciation of futures contracts 358,245
Net realized and unrealized gain on investments andfutures contracts 55,305,855
Change in net assets resulting from operations $58,465,420
See Notes which are an integral part of the Financial Statements
Statement of OperationsSix Months Ended April 30, 2017 (unaudited)
Semi-Annual Shareholder Report23

Six MonthsEnded
(unaudited)4/30/2017
Year Ended10/31/2016
Increase (Decrease) in Net Assets
Operations:
Net investment income $ 3,159,565 $ 7,593,690
Net realized gain on investments and futures contracts 36,545,678 72,117,973
Net change in unrealized appreciation/depreciation of investments andfutures contracts 18,760,177 (62,599,635)
CHANGE IN NET ASSETS RESULTING FROM OPERATIONS 58,465,420 17,112,028
Distributions to Shareholders:
Distributions from net investment income
Class C Shares (174,516) (292,236)
Class R Shares (289,861) (467,459)
Institutional Shares (1,964,753) (3,920,343)
Service Shares (1,383,079) (2,931,970)
Distributions from net realized gain on investments and futures contracts
Class C Shares (5,575,174) (4,570,725)
Class R Shares (7,002,576) (5,000,498)
Institutional Shares (30,324,651) (28,096,248)
Service Shares (25,749,607) (23,643,011)
CHANGE IN NET ASSETS RESULTING FROM DISTRIBUTIONSTO SHAREHOLDERS (72,464,217) (68,922,490)
Share Transactions:
Proceeds from sale of shares 103,294,583 91,076,784
Net asset value of shares issued to shareholders in payment ofdistributions declared 67,695,236 63,289,138
Cost of shares redeemed (160,007,443) (189,898,578)
CHANGE IN NET ASSETS RESULTING FROM SHARE TRANSACTIONS 10,982,376 (35,532,656)
Change in net assets (3,016,421) (87,343,118)
Net Assets:
Beginning of period 474,033,297 561,376,415
End of period (including undistributed (distributions in excess of) netinvestment income of $(142,367) and $510,277, respectively) $ 471,016,876 $ 474,033,297
See Notes which are an integral part of the Financial Statements
Statement of Changes in Net Assets
Semi-Annual Shareholder Report24

Notes to Financial StatementsApril 30, 2017 (unaudited)
1. ORGANIZATIONFederated Index Trust (the “Trust”) is registered under the Investment Company Act of 1940, asamended (the “Act”), as an open-end management investment company. The Trust consists oftwo portfolios. The financial statements included herein are only those of Federated Max-CapIndex Fund (the “Fund”), a diversified portfolio. The financial statements of the other portfoliosare presented separately. The assets of each portfolio are segregated and a shareholder’sinterest is limited to the portfolio in which shares are held. Each portfolio pays its ownexpenses. The Fund offers four classes of shares: Class C Shares, Class R Shares, InstitutionalShares and Service Shares. All shares of the Fund have equal rights with respect to voting,except on class-specific matters. The investment objective of the Fund is to provide investmentresults that generally correspond to the aggregate price and performance of publicly tradedcommon stocks comprising the Standard & Poor’s 500 Index (S&P 500).
2. SIGNIFICANT ACCOUNTING POLICIESThe following is a summary of significant accounting policies consistently followed by theFund in the preparation of its financial statements. These policies are in conformity withU.S. generally accepted accounting principles (GAAP).
Investment ValuationIn calculating its net asset value (NAV), the Fund generally values investments as follows:� Equity securities listed on an exchange or traded through a regulated market system are
valued at their last reported sale price or official closing price in their principal exchangeor market.
� Fixed-income securities are fair valued using price evaluations provided by a pricing serviceapproved by the Board of Trustees (the “Trustees”).
� Shares of other mutual funds or non-exchange-traded investment companies are valuedbased upon their reported NAVs.
� Derivative contracts listed on exchanges are valued at their reported settlement or closingprice, except that options are valued at the mean of closing bid and asked quotations.
� Over-the-counter (OTC) derivative contracts are fair valued using price evaluations providedby a pricing service approved by the Trustees.
� For securities that are fair valued in accordance with procedures established by and underthe general supervision of the Trustees, certain factors may be considered such as: the lasttraded or purchase price of the security, information obtained by contacting the issuer ordealers, analysis of the issuer’s financial statements or other available documents,fundamental analytical data, the nature and duration of restrictions on disposition, themovement of the market in which the security is normally traded, public trading in similarsecurities or derivative contracts of the issuer or comparable issuers, movement of arelevant index, or other factors including but not limited to industry changes and relevantgovernment actions.
If any price, quotation, price evaluation or other pricing source is not readily available whenthe NAV is calculated, if the Fund cannot obtain price evaluations from a pricing service orfrom more than one dealer for an investment within a reasonable period of time as set forth inthe Fund’s valuation policies and procedures, or if information furnished by a pricing service,in the opinion of the valuation committee (“Valuation Committee”), is deemed not
Semi-Annual Shareholder Report25

representative of the fair value of such security, the Fund uses the fair value of the investmentdetermined in accordance with the procedures described below. There can be no assurancethat the Fund could obtain the fair value assigned to an investment if it sold the investment atapproximately the time at which the Fund determines its NAV per share.
Fair Valuation and Significant Events ProceduresThe Trustees have ultimate responsibility for determining the fair value of investments forwhich market quotations are not readily available. The Trustees have appointed a ValuationCommittee comprised of officers of the Fund, Federated Equity Management Company ofPennsylvania (“Manager”) and certain of the Manager’s affiliated companies to assist indetermining fair value and in overseeing the calculation of the NAV. The Trustees have alsoauthorized the use of pricing services recommended by the Valuation Committee to providefair value evaluations of the current value of certain investments for purposes of calculatingthe NAV. The Valuation Committee employs various methods for reviewing third-party pricing-service evaluations including periodic reviews of third-party pricing services’ policies,procedures and valuation methods (including key inputs, methods, models and assumptions),transactional back-testing, comparisons of evaluations of different pricing services, and reviewof price challenges by the Manager based on recent market activity. In the event that marketquotations and price evaluations are not available for an investment, the Valuation Committeedetermines the fair value of the investment in accordance with procedures adopted by theTrustees. The Trustees periodically review and approve the fair valuations made by theValuation Committee and any changes made to the procedures.
Factors considered by pricing services in evaluating an investment include the yields orprices of investments of comparable quality, coupon, maturity, call rights and other potentialprepayments, terms and type, reported transactions, indications as to values from dealers andgeneral market conditions. Some pricing services provide a single price evaluation reflectingthe bid-side of the market for an investment (a “bid” evaluation). Other pricing services offerboth bid evaluations and price evaluations indicative of a price between the prices bid andasked for the investment (a “mid” evaluation). The Fund normally uses bid evaluations for anyU.S. Treasury and Agency securities, mortgage-backed securities and municipal securities. TheFund normally uses mid evaluations for any other types of fixed-income securities and anyOTC derivative contracts. In the event that market quotations and price evaluations are notavailable for an investment, the fair value of the investment is determined in accordance withprocedures adopted by the Trustees.
The Trustees also have adopted procedures requiring an investment to be priced at its fairvalue whenever the Manager determines that a significant event affecting the value of theinvestment has occurred between the time as of which the price of the investment wouldotherwise be determined and the time as of which the NAV is computed. An event isconsidered significant if there is both an affirmative expectation that the investment’s valuewill change in response to the event and a reasonable basis for quantifying the resultingchange in value. Examples of significant events that may occur after the close of the principalmarket on which a security is traded, or after the time of a price evaluation provided by apricing service or a dealer, include:� With respect to securities traded principally in foreign markets, significant trends in
U.S. equity markets or in the trading of foreign securities index futures contracts;� Political or other developments affecting the economy or markets in which an issuer
conducts its operations or its securities are traded;
Semi-Annual Shareholder Report26

� Announcements concerning matters such as acquisitions, recapitalizations, litigationdevelopments, or a natural disaster affecting the issuer’s operations or regulatory changesor market developments affecting the issuer’s industry.
The Trustees have adopted procedures whereby the Valuation Committee uses a pricingservice to determine the fair value of equity securities traded principally in foreign marketswhen the Manager determines that there has been a significant trend in the U.S. equitymarkets or in index futures trading. For other significant events, the Fund may seek to obtainmore current quotations or price evaluations from alternative pricing sources. If a reliablealternative pricing source is not available, the Fund will determine the fair value of theinvestment in accordance with the fair valuation procedures approved by the Trustees. TheTrustees have ultimate responsibility for any fair valuations made in response to asignificant event.
Repurchase AgreementsThe Fund may invest in repurchase agreements for short-term liquidity purposes. It is thepolicy of the Fund to require the other party to a repurchase agreement to transfer to theFund’s custodian or sub-custodian eligible securities or cash with a market value (aftertransaction costs) at least equal to the repurchase price to be paid under the repurchaseagreement. The eligible securities are transferred to accounts with the custodian or sub-custodian in which the Fund holds a “securities entitlement” and exercises “control” as thoseterms are defined in the Uniform Commercial Code. The Fund has established procedures formonitoring the market value of the transferred securities and requiring the transfer ofadditional eligible securities if necessary to equal at least the repurchase price. Theseprocedures also allow the other party to require securities to be transferred from the accountto the extent that their market value exceeds the repurchase price or in exchange for othereligible securities of equivalent market value.
The insolvency of the other party or other failure to repurchase the securities may delay thedisposition of the underlying securities or cause the Fund to receive less than the fullrepurchase price. Under the terms of the repurchase agreement, any amounts received by theFund in excess of the repurchase price and related transaction costs must be remitted to theother party.
The Fund may enter into repurchase agreements in which eligible securities are transferredinto joint trading accounts maintained by the custodian or sub-custodian for investmentcompanies and other clients advised by the Fund’s Manager and its affiliates. The Fund willparticipate on a pro rata basis with the other investment companies and clients in its share ofthe securities transferred under such repurchase agreements and in its share of proceedsfrom any repurchase or other disposition of such securities.
Semi-Annual Shareholder Report27

Investment Income, Gains and Losses, Expenses and DistributionsInvestment transactions are accounted for on a trade-date basis. Realized gains and lossesfrom investment transactions are recorded on an identified-cost basis. Interest income andexpenses are accrued daily. Dividend income and distributions to shareholders are recordedon the ex-dividend date. Foreign dividends are recorded on the ex-dividend date or when theFund is informed of the ex-dividend date. Distributions of net investment income, if any, aredeclared and paid quarterly. Non-cash dividends included in dividend income, if any, arerecorded at fair value. Amortization/accretion of premium and discount is included ininvestment income. Investment income, realized and unrealized gains and losses, and certainfund-level expenses are allocated to each class based on relative average daily net assets,except that Class C Shares, Class R Shares, Institutional Shares and Service Shares may beardistribution services fees, other service fees and transfer agent fees unique to those classes.The detail of the total fund expense waivers and reimbursements of $420,931 is disclosed invarious locations in this Note 2 and Note 5. For the six months ended April 30, 2017, transferagent fees for the Fund were as follows:
Transfer AgentFees Incurred
Transfer AgentFees Reimbursed
Class C Shares $ 17,693 $ —
Class R Shares 71,970 (3,356)
Institutional Shares 69,966 (37,657)
Service Shares 76,945 (49,918)
TOTAL $236,574 $(90,931)
Dividends are declared separately for each class. No class has preferential dividend rights;differences in per share dividend rates are generally due to differences in separateclass expenses.
Other Service FeesThe Fund may pay other service fees up to 0.25% of the average daily net assets of the Fund’sClass C Shares, Institutional Shares and Service Shares to unaffiliated financial intermediariesor to Federated Shareholder Services Company (FSSC) for providing services to shareholdersand maintaining shareholder accounts. Subject to the terms described in the ExpenseLimitation note, FSSC may voluntarily reimburse the Fund for other service fees. For the sixmonths ended April 30, 2017, other service fees for the Fund were as follows:
Other ServiceFees Incurred
Class C Shares $ 48,776
Service Shares 217,316
TOTAL $266,092
For the six months ended April 30, 2017, the Fund’s Institutional Shares did not incur otherservice fees.
Semi-Annual Shareholder Report28

Federal TaxesIt is the Fund’s policy to comply with the Subchapter M provision of the Internal Revenue Codeand to distribute to shareholders each year substantially all of its income. Accordingly, noprovision for federal income tax is necessary. As of and during the six months endedApril 30, 2017, the Fund did not have a liability for any uncertain tax positions. The Fundrecognizes interest and penalties, if any, related to tax liabilities as income tax expense in theStatement of Operations. As of April 30, 2017, tax years 2013 through 2016 remain subject toexamination by the Fund’s major tax jurisdictions, which include the United States of Americaand the Commonwealth of Massachusetts.
The Fund may be subject to taxes imposed by governments of countries in which it invests.Such taxes are generally based on either income or gains earned or repatriated. The Fundaccrues and applies such taxes to net investment income, net realized gains and netunrealized gains as income and/or gains are earned.
When-Issued and Delayed-Delivery TransactionsThe Fund may engage in when-issued or delayed-delivery transactions. The Fund recordswhen-issued securities on the trade date and maintains security positions such that sufficientliquid assets will be available to make payment for the securities purchased. Securitiespurchased on a when-issued or delayed-delivery basis are marked to market daily and beginearning interest on the settlement date. Losses may occur on these transactions due tochanges in market conditions or the failure of counterparties to perform under the contract.
Futures ContractsThe Fund purchases stock index futures contracts to manage cash flows, maintain exposure tothe S&P 500 Index and to potentially reduce transaction costs. Upon entering into a stockindex futures contract with a broker, the Fund is required to deposit in a segregated account,either U.S. government securities or a specified amount of Restricted cash, which is shown inthe Statement of Assets and Liabilities. Futures contracts are valued daily and unrealized gainsor losses are recorded in a “variation margin” account. Daily, the Fund receives from or pays tothe broker a specified amount of cash based upon changes in the variation margin account.When a contract is closed, the Fund recognizes a realized gain or loss. Futures contracts havemarket risks, including the risk that the change in the value of the contract may not correlatewith the changes in the value of the underlying securities. There is minimal counterparty riskto the Fund since futures contracts are exchange traded and the exchange’s clearinghouse, ascounterparty to all exchange traded futures contracts, guarantees the futures contractsagainst default.
Futures contracts outstanding at period end are listed after the Fund’s Portfolioof Investments.
The average notional value of long contracts held by the Fund throughout the period was$15,554,194. This is based on amounts held as of each month-end throughout the six-monthfiscal period.
Semi-Annual Shareholder Report29

Foreign Currency TranslationThe accounting records of the Fund are maintained in U.S. dollars. All assets and liabilitiesdenominated in foreign currencies (FCs) are translated into U.S. dollars based on the rates ofexchange of such currencies against U.S. dollars on the date of valuation. Purchases and salesof securities, income and expenses are translated at the rate of exchange quoted on therespective date that such transactions are recorded. The Fund does not isolate that portion ofthe results of operations resulting from changes in foreign exchange rates on investmentsfrom the fluctuations arising from changes in market prices of securities held. Suchfluctuations are included with the net realized and unrealized gain or loss from investments.
Reported net realized foreign exchange gains or losses arise from sales of FCs, currencygains or losses realized between the trade and settlement dates on securities transactions, thedifference between the amounts of dividends, interest and foreign withholding taxes recordedon the Fund’s books, and the U.S. dollar equivalent of the amounts actually received or paid.Net unrealized foreign exchange gains and losses arise from changes in the value of assetsand liabilities other than investments in securities at fiscal year end, resulting from changes inthe exchange rate.
Securities LendingThe Fund participates in a securities lending program providing for the lending of equitysecurities to qualified brokers. The Fund normally receives cash collateral for securities loanedthat is invested in an affiliated money market fund or in short-term securities includingrepurchase agreements. Collateral is maintained at a minimum level of 100% of the marketvalue of investments loaned, plus interest, if applicable. Earnings on collateral are allocatedbetween the borrower of the security, the securities lending agent, as a fee for its servicesunder the program and the Fund, according to agreed-upon rates.
Securities lending transactions are subject to Master Netting Agreements which areagreements between the Fund and its counterparties that provide for the net settlement of alltransactions and collateral with the Fund, through a single payment, in the event of default ortermination. Amounts presented on the Portfolio of Investments and Statement of Assets andLiabilities are not net settlement amounts but gross. As indicated below, the cash collateralreceived by the Fund exceeds the market value of the securities loaned reducing the netsettlement amount to zero. The chart below identifies the amount of collateral received as wellas the market value of securities on loan. Additionally, the securities lending agreementexecuted by the Fund includes an indemnification clause. This clause stipulates that theborrower will reimburse the Fund for any losses as a result of any failure of the borrower toreturn equivalent securities to the Fund.
As of April 30, 2017, securities subject to this type of arrangement and related collateralwere as follows:
Market Value ofSecurities Loaned
Market Valueof Collateral
$714,103 $735,397
Semi-Annual Shareholder Report30

Additional Disclosure Related to Derivative Instruments
Fair Value of Derivative Instruments
Liability
Statement ofAssets andLiabilitiesLocation
FairValue
Derivatives not accounted for as hedginginstruments under ASC Topic 815
Equity contractsPayable for dailyvariation margin $(42,665)*
* Includes cumulative appreciation of futures contracts as reported in the footnotes to the Portfolio ofInvestments. Only the current day’s variation margin is reported within the Statement of Assetsand Liabilities.
The Effect of Derivative Instruments on the Statement of Operations forthe Six Months Ended April 30, 2017
Amount of Realized Gain or (Loss) on Derivatives Recognized in Income
FuturesContracts
Interest rate contracts 1,584,389
Change in Unrealized Appreciation or (Depreciation) on Derivatives Recognized in Income
FuturesContracts
Interest rate contracts 358,245
OtherThe preparation of financial statements in conformity with GAAP requires management tomake estimates and assumptions that affect the amounts of assets, liabilities, expenses andrevenues reported in the financial statements. Actual results could differ from those estimated.The Fund applies investment company accounting and reporting guidance.
3. SHARES OF BENEFICIAL INTERESTThe following tables summarize share activity:
Six Months Ended4/30/2017
Year Ended10/31/2016
Class C Shares: Shares Amount Shares Amount
Shares sold 448,842 $ 6,150,627 586,302 $ 8,320,460
Shares issued to shareholders in payment ofdistributions declared 416,710 5,389,426 321,952 4,516,524
Shares redeemed (493,845) (6,764,572) (874,884) (12,383,362)
NET CHANGE RESULTING FROMCLASS C SHARE TRANSACTIONS 371,707 $ 4,775,481 33,370 $ 453,622
Semi-Annual Shareholder Report31

Six Months Ended4/30/2017
Year Ended10/31/2016
Class R Shares: Shares Amount Shares Amount
Shares sold 553,669 $ 7,594,303 1,196,352 $ 17,299,556
Shares issued to shareholders in payment ofdistributions declared 527,570 6,904,504 364,798 5,168,336
Shares redeemed (923,069) (12,827,672) (1,082,759) (15,587,958)
NET CHANGE RESULTING FROMCLASS R SHARE TRANSACTIONS 158,170 $ 1,671,135 478,391 $ 6,879,934
Six Months Ended4/30/2017
Year Ended10/31/2016
Institutional Shares: Shares Amount Shares Amount
Shares sold 5,327,411 $ 76,789,566 2,753,720 $ 39,512,781
Shares issued to shareholders in payment ofdistributions declared 2,193,452 29,035,645 1,960,085 27,997,804
Shares redeemed (5,875,022) (83,888,494) (6,427,160) (92,687,296)
NET CHANGE RESULTING FROMINSTITUTIONAL SHARE TRANSACTIONS 1,645,841 $ 21,936,717 (1,713,355) $(25,176,711)
Six Months Ended4/30/2017
Year Ended10/31/2016
Service Shares: Shares Amount Shares Amount
Shares sold 918,158 $ 12,760,087 1,807,628 $ 25,943,987
Shares issued to shareholders in payment ofdistributions declared 2,010,891 26,365,661 1,806,439 25,606,474
Shares redeemed (4,001,116) (56,526,705) (4,794,106) (69,239,962)
NET CHANGE RESULTING FROMSERVICE SHARE TRANSACTIONS (1,072,067) $(17,400,957) (1,180,039) $(17,689,501)
NET CHANGE RESULTING FROMTOTAL FUND SHARE TRANSACTIONS 1,103,651 $ 10,982,376 (2,381,633) $(35,532,656)
4. FEDERAL TAX INFORMATIONAt April 30, 2017, the cost of investments for federal tax purposes was $157,302,311. The netunrealized appreciation of investments for federal tax purposes excluding any unrealizedappreciation/depreciation resulting from futures contracts was $312,702,687. This consists ofnet unrealized appreciation from investments for those securities having an excess of valueover cost of $313,915,740 and net unrealized depreciation from investments for thosesecurities having an excess of cost over value of $1,213,053.
5. INVESTMENT MANAGER FEE AND OTHER TRANSACTIONSWITH AFFILIATES
Management FeeThe management agreement between the Fund and the Manager provides for an annual feeequal to 0.30% of the Fund’s average daily net assets. Subject to the terms described in theExpense Limitation note, the Manager may voluntarily choose to waive any portion of its fee.For the six months ended April 30, 2017, the Manager voluntarily waived $104,725 of its fee.
Semi-Annual Shareholder Report32

Distribution Services FeeThe Fund has adopted a Distribution Plan (the “Plan”) pursuant to Rule 12b-1 under the Act.Under the terms of the Plan, the Fund will compensate Federated Securities Corp. (FSC), theprincipal distributor, from the daily net assets of the Fund’s Class C Shares, Class R Shares andService Shares to finance activities intended to result in the sale of these shares. The Planprovides that the Fund may incur distribution expenses at the following percentages ofaverage daily net assets annually, to compensate FSC:
Share Class NamePercentage of AverageDaily Net Assets of Class
Class C Shares 0.75%
Class R Shares 0.50%
Service Shares 0.30%
Subject to the terms described in the Expense Limitation note, FSC may voluntarily choose towaive any portion of its fee. For the six months ended April 30, 2017, distribution services feesfor the Fund were as follows:
Distribution ServicesFees Incurred
Distribution ServicesFees Waived
Class C Shares $146,672 $ —
Class R Shares 122,618 —
Service Shares 261,930 (217,316)
TOTAL $531,220 $(217,316)
When FSC receives fees, it may pay some or all of them to financial intermediaries whosecustomers purchase shares. For the six months ended April 30, 2017, FSC retained $103,461 offees paid by the Fund.
Sales ChargesFront-end sales charges and contingent deferred sales charges (CDSC) do not representexpenses of the Fund. They are deducted from the proceeds of sales of Fund shares prior toinvestment or from redemption proceeds prior to remittance, as applicable. For the six monthsended April 30, 2017, FSC retained $2,036 of CDSC relating to redemptions of Class C Shares.
Other Service FeesFor the six months ended April 30, 2017, FSSC received $1,753 of the other service feesdisclosed in Note 2.
Expense LimitationThe Manager and certain of its affiliates (which may include FSC and FSSC) on their owninitiative have agreed to waive certain amounts of their respective fees and/or reimburseexpenses. Total annual fund operating expenses (as shown in the financial highlights,excluding interest expense, extraordinary expenses, line of credit expenses and proxy-relatedexpenses paid by the Fund, if any) paid by the Fund’s Class C Shares, Class R Shares,Institutional Shares and Service Shares (after the voluntary waivers and/or reimbursements)will not exceed 1.43%, 1.10%, 0.35% and 0.65% (the “Fee Limit”), respectively, up to but notincluding the later of (the “Termination Date”): (a) January 1, 2018 ; or (b) the date of the
Semi-Annual Shareholder Report33

Fund’s next effective Prospectus. While the Manager and its applicable affiliates currently donot anticipate terminating or increasing these arrangements prior to the Termination Date,these arrangements may only be terminated or the Fee Limit increased prior to the TerminationDate with the agreement of the Trustees.
GeneralCertain Officers and Trustees of the Fund are Officers and Directors or Trustees of certain ofthe above companies. To efficiently facilitate payment, Directors’/Trustees’ fees and certainexpenses related to conducting meetings of the Directors/Trustees and other miscellaneousexpenses are paid by an affiliate of the Manager which in due course are reimbursed by theFund. These expenses related to conducting meetings of the Directors/Trustees and othermiscellaneous expenses may be included in Accrued and Miscellaneous Expenses on theStatement of Assets and Liabilities and Statement of Operations, respectively.
Transactions Involving Affiliated HoldingsAffiliated holdings are investment companies which are managed by the Manager or anaffiliate of the Manager. The Manager has agreed to reimburse the Fund for certaininvestment manager fees as a result of transactions in other affiliated investment companies.For the six months ended April 30, 2017, the Manager reimbursed $7,959. Transactionsinvolving the affiliated holdings during the six months ended April 30, 2017, were as follows:
Affiliates
Balance ofShares Held10/31/2016
Purchases/Additions
Sales/Reductions
Balance ofShares Held4/30/2017 Value
DividendIncome
FederatedGovernmentObligations Fund,Institutional Shares 426,423 6,100,715 (5,791,741) 735,397 $ 735,397 $ 1,416
FederatedInstitutionalPrime ValueObligations Fund,Institutional Shares 20,018,974 53,837,346 (66,568,400) 7,287,920 7,290,106 57,272
Total ofAffiliatedTransactions 20,445,397 59,938,061 (72,360,141) 8,023,317 8,025,503 58,688
6. INVESTMENT TRANSACTIONSPurchases and sales of investments, excluding long-term U.S. government securities andshort-term obligations, for the six months ended April 30, 2017, were as follows:
Purchases $ 73,641,795
Sales $118,612,482
Semi-Annual Shareholder Report34

7. LINE OF CREDITThe Fund participates with certain other Federated Funds, on a several basis, in an up to$500,000,000 unsecured, 364-day, committed, revolving line of credit (LOC) agreement. TheLOC was made available to finance temporarily the repurchase or redemption of shares of theFund, failed trades, payment of dividends, settlement of trades and for other short-term,temporary or emergency general business purposes. The Fund cannot borrow under the LOCif an inter-fund loan is outstanding. The Fund’s ability to borrow under the LOC also is subjectto the limitations of the Act and various conditions precedent that must be satisfied before theFund can borrow. Loans under the LOC are charged interest at a fluctuating rate per annumequal to the highest, on any day, of (a) (i) the federal funds effective rate, (ii) the one monthLondon Interbank Offered Rate (LIBOR), and (iii) 0.0%, plus (b) a margin. The LOC alsorequires the Fund to pay, quarterly in arrears and at maturity, its pro rata share of acommitment fee based on the amount of the lenders’ commitment that has not been utilized.As of April 30, 2017, the Fund had no outstanding loans. During the six months endedApril 30, 2017, the Fund did not utilize the LOC.
8. INTERFUND LENDINGPursuant to an Exemptive Order issued by the Securities and Exchange Commission (SEC), theFund, along with other funds advised by subsidiaries of Federated Investors, Inc., mayparticipate in an interfund lending program. This program provides an alternative credit facilityallowing the Fund to borrow from other participating affiliated funds. As of April 30, 2017,there were no outstanding loans. During the six months ended April 30, 2017, the programwas not utilized.
9. REGULATORY UPDATESOn October 13, 2016, the SEC amended existing rules intended to modernize reporting anddisclosure of information. These amendments relate to Regulation S-X which sets forth theform and content of financial statements. At this time, management is evaluating theimplications of adopting these amendments and their impact on the financial statements andaccompanying notes.
Semi-Annual Shareholder Report35

Shareholder Expense Example (unaudited)As a shareholder of the Fund, you incur two types of costs: (1) transaction costs,including sales charges (loads) on purchase or redemption payments; and(2) ongoing costs, including management fees and to the extent applicable,distribution (12b-1) fees and/or other service fees and other Fund expenses.This Example is intended to help you to understand your ongoing costs (indollars) of investing in the Fund and to compare these costs with the ongoingcosts of investing in other mutual funds. It is based on an investment of $1,000invested at the beginning of the period and held for the entire period fromNovember 1, 2016 to April 30, 2017.
ACTUAL EXPENSES
The first section of the table below provides information about actual accountvalues and actual expenses. You may use the information in this section, togetherwith the amount you invested, to estimate the expenses that you incurred overthe period. Simply divide your account value by $1,000 (for example, an $8,600account value divided by $1,000 = 8.6), then multiply the result by the numberin the first section under the heading entitled “Expenses Paid During Period”to estimate the expenses attributable to your investment during this period.
HYPOTHETICAL EXAMPLE FOR COMPARISON PURPOSES
The second section of the table below provides information about hypotheticalaccount values and hypothetical expenses based on the Fund’s actual expenseratio and an assumed rate of return of 5% per year before expenses, which is notthe Fund’s actual return. Thus, you should not use the hypothetical accountvalues and expenses to estimate the actual ending account balance or yourexpenses for the period. Rather, these figures are required to be provided toenable you to compare the ongoing costs of investing in the Fund with otherfunds. To do so, compare this 5% hypothetical example with the 5%hypothetical examples that appear in the shareholder reports of the other funds.
Semi-Annual Shareholder Report36

Please note that the expenses shown in the table are meant to highlight yourongoing costs only and do not reflect any transaction costs, such as sales charges(loads) on purchase or redemption payments. Therefore, the second section ofthe table is useful in comparing ongoing costs only, and will not help youdetermine the relative total costs of owning different funds. In addition, if thesetransaction costs were included, your costs would have been higher.
BeginningAccount Value
11/1/2016
EndingAccount Value
04/30/2017Expenses PaidDuring Period1
Actual:
Class C Shares $1,000 $1,126.00 $7.49
Class R Shares $1,000 $1,127.70 $5.86
Institutional Shares $1,000 $1,132.00 $1.90
Service Shares $1,000 $1,130.80 $3.49
Hypothetical (assuming a 5% returnbefore expenses):
Class C Shares $1,000 $1,017.80 $7.10
Class R Shares $1,000 $1,019.30 $5.56
Institutional Shares $1,000 $1,023.00 $1.81
Service Shares $1,000 $1,021.50 $3.31
1 Expenses are equal to the Fund’s annualized net expense ratios, multiplied by the average account valueover the period, multiplied by 181/365 (to reflect the one-half-year period). The annualized net expenseratios are as follows:
Class C Shares 1.42%
Class R Shares 1.11%
Institutional Shares 0.36%
Service Shares 0.66%
Semi-Annual Shareholder Report37

Evaluation and Approval of AdvisoryContract – May 2016FEDERATED MAX-CAP INDEX FUND (THE “FUND”)
Following a review and recommendation of approval by the Fund’s independenttrustees, the Fund’s Board of Trustees (the “Board”) reviewed and unanimouslyapproved at its May 2016 meetings the continuation of the Fund’s investmentadvisory contract for an additional one-year term. The Board’s decisionregarding the contract reflects the exercise of its business judgment afterconsideration of all of the information received on whether to continue theexisting arrangements.
The Board had previously appointed a Senior Officer, whose duties includespecified responsibilities relating to the process by which advisory fees are to becharged to a Federated fund. The Senior Officer has the authority to retainconsultants, experts, or staff as may be reasonably necessary to assist in theperformance of his duties, reports directly to the Board, and may be terminatedonly with the approval of a majority of the independent members of the Board.The Senior Officer prepared and furnished to the Board an independent,written evaluation that covered topics discussed below (the “Senior Officer’sEvaluation”). The Board considered the Senior Officer’s Evaluation, along withother information, in deciding to approve the investment advisory contract.
The Board is also familiar with and considered judicial decisions concerningallegedly excessive investment advisory fees, which have indicated that thefollowing factors may be relevant to an adviser’s fiduciary duty with respect toits receipt of compensation from a fund: the nature and quality of the servicesprovided by an adviser to a fund and its shareholders, including the performanceand fees and expenses of the fund and of comparable funds; an adviser’s cost ofproviding the services, including the profitability to an adviser of providingadvisory services to a fund; the extent to which an adviser may realize“economies of scale” as a fund grows larger and, if such economies of scale exist,whether they have been shared with a fund and its shareholders or the family offunds; any “fall-out financial benefits” that accrue to an adviser because of itsrelationship with a fund (including research services received from brokers thatexecute fund trades and any fees paid to affiliates of an adviser for servicesrendered to a fund); comparative fee and expense structures, including acomparison of fees paid to an adviser with those paid by similar funds; and theextent of care, conscientiousness and independence with which board membersperform their duties and their expertise, including whether they are fullyinformed about all facts the board deems relevant to its consideration of anadviser’s services and fees. The Board noted that the Securities and ExchangeCommission (“SEC”) disclosure requirements regarding the basis for theBoard’s approval of the Fund’s investment advisory contract generally track thefactors listed above. Consistent with these judicial decisions and SEC disclosurerequirements, the Board also considered management fees charged to
Semi-Annual Shareholder Report38

institutional and other clients of Federated Equity Management Company ofPennsylvania (the “Adviser”) for what might be viewed as like services. TheBoard was aware of these factors and was guided by them in its review of theFund’s investment advisory contract to the extent it considered them to beappropriate and relevant, as discussed further below.
The Board considered and weighed these circumstances in light of itssubstantial accumulated experience in governing the Fund and working withFederated Investors, Inc. and its affiliates (“Federated”) on matters relating to theFederated funds, and was assisted in its deliberations by independent legalcounsel. Throughout the year, and in connection with its May meetings, theBoard requested and received substantial and detailed information about theFund and the Federated organization that was in addition to the extensivematerials that comprise and accompany the Senior Officer’s Evaluation.Federated provided much of this information at each regular meeting of theBoard, and furnished additional substantial information in connection with theMay meetings at which the Board’s formal review of the investment advisorycontract occurred. At the May meetings in addition to meeting in separatesessions of the independent trustees without management present, seniormanagement of the Adviser also met with the independent trustees and theircounsel to discuss the materials presented and any other matters thoughtrelevant by the Adviser or the trustees. Between regularly scheduled meetings,the Board also received information on particular matters as the need arose.Thus, the Board’s consideration of the investment advisory contract includedreview of the Senior Officer’s Evaluation, accompanying data and additionalinformation covering such matters as: the Adviser’s investment philosophy,revenue, profitability, personnel and processes; investment and operatingstrategies; the Fund’s short- and long-term performance (in absolute terms, bothon a gross basis and net of expenses, as well as in relationship to its particularinvestment program and certain competitor or “peer group” funds and/or otherbenchmarks, as appropriate), and comments on the reasons for performance; theFund’s investment objectives; the Fund’s expenses (including the advisory feeitself and the overall expense structure of the Fund, both in absolute terms andrelative to similar and/or competing funds, with due regard for contractual orvoluntary expense limitations); the use and allocation of brokerage commissionsderived from trading the Fund’s portfolio securities (if any); and the nature,quality and extent of the advisory and other services provided to the Fund bythe Adviser and its affiliates. The Board also considered the preferences andexpectations of Fund shareholders; the entrepreneurial risk assumed by theAdviser in sponsoring the Fund; the continuing state of competition in themutual fund industry and market practices; the range of comparable fees forsimilar funds in the mutual fund industry; the Fund’s relationship to theFederated funds which include a comprehensive array of funds with differentinvestment objectives, policies and strategies which are generally available forexchange without the incurrence of additional sales charges; compliance and
Semi-Annual Shareholder Report39

audit reports concerning the Federated funds and the Federated companies thatservice them (including communications from regulatory agencies), as well asFederated’s responses to any issues raised therein; and relevant developments inthe mutual fund industry and how the Federated funds and/or Federated areresponding to them. The Board’s evaluation process is evolutionary. The criteriaconsidered and the emphasis placed on relevant criteria change in recognition ofchanging circumstances in the mutual fund marketplace.
While mindful that courts have cautioned against giving such comparisonstoo much weight, the Board has found the use of comparisons of the Fund’sfees and expenses to other mutual funds with comparable investment programsto be relevant to its deliberations. In this regard, the Board was presented with,and considered, information regarding the contractual advisory fee rates, netadvisory fee rates, total expense ratios and each element of the Fund’s totalexpense ratio (i.e., gross and net advisory fees, custody fees, portfolio accountingfees and transfer agency fees) relative to the Fund’s peers. The Board focused oncomparisons with other similar mutual funds more heavily than non-mutualfund products or services because it is believed that they are more relevant. Forexample, other mutual funds are the products most like the Fund, they arereadily available to Fund shareholders as alternative investment vehicles, and theyare the type of investment vehicle in fact chosen and maintained by the Fund’sinvestors. The range of their fees and expenses therefore appears to be a relevantindicator of what consumers have found to be reasonable in the precisemarketplace in which the Fund competes.
The Board reviewed the contractual advisory fee rate, net advisory fee ratewhere partially waived and other expenses of the Fund and noted the positionof the Fund’s fee rates relative to its peers. In this regard, the Board noted thatthe contractual advisory fee rate was above the median of the relevant peergroup, but the Board noted the applicable waivers and reimbursements and thatthe overall expense structure of the Fund remained competitive in the contextof the other factors considered relevant by the Board.
By contrast, the Senior Officer has reviewed Federated’s fees for providingadvisory services to products outside the Federated funds (e.g., institutional andseparate accounts and sub-adviser services). He concluded that mutual funds andinstitutional accounts are inherently different products. Those differencesinclude, but are not limited to, different types of targeted investors; being subjectto different laws and regulations; different legal structures; different averageaccount sizes and portfolio management techniques made necessary by differentcash flows and different associated costs; and the time spent by portfoliomanagers and their teams, funds financial services, legal, compliance and riskmanagement in reviewing securities pricing, addressing different administrativeresponsibilities, addressing different degrees of risk associated with managementand a variety of different costs. The Senior Officer did not consider the fees forproviding advisory services to these outside products to be determinative injudging the appropriateness of mutual fund advisory fees.
Semi-Annual Shareholder Report40

Following such evaluation, the Board concluded, within the context of its fulldeliberations, that the expenses of the Fund are reasonable and supportedrenewal of the investment advisory contract with respect to the Fund.
The Board considered the nature, extent and quality of the services providedto the Fund by the Adviser and the resources of the Adviser and its affiliatesdedicated to the Fund. In this regard, the Board evaluated, among other things,the Adviser’s personnel, experience, track record, overall reputation andwillingness to invest in personnel and infrastructure that benefit the Fund. Inaddition, the Board reviewed the qualifications, backgrounds and responsibilitiesof the portfolio management team primarily responsible for the day-to-daymanagement of the Fund. The Board noted the compliance programs of and thecompliance-related resources provided to the Fund by the Adviser. The Fund’sability to deliver competitive performance when compared to its peer group wasalso deemed to be relevant by the Board as a useful indicator of how the Adviseris executing the Fund’s investment program, which in turn was one of theBoard’s considerations in reaching a conclusion that the nature, extent, andquality of the Adviser’s investment management services were such as towarrant continuation of the investment advisory contract.
In evaluating the Fund’s investment performance, the Board consideredperformance results in light of the Fund’s investment objective, strategies andrisks, as disclosed in the Fund’s prospectus. The Board particularly considereddetailed investment reports on the Fund’s performance provided to the Boardthroughout the year and in connection with the May meetings. The SeniorOfficer also reviewed information compiled by Federated, using data supplied byindependent fund ranking organizations, regarding the performance of, and feescharged by, other mutual funds, noting his view that comparisons to fund peergroups may be helpful, though not conclusive, in judging the reasonableness ofthe proposed fees. The Board considered, in evaluating such comparisons, that insome cases individual funds may exhibit significant and unique differences intheir objectives and management techniques when compared to other fundswithin an industry peer group.
For the periods covered by the Senior Officer’s Evaluation, the Fund’sperformance for the three-year and five-year periods was above the median ofthe relevant peer group, and the Fund’s performance fell below the median ofthe relevant peer group for the one-year period. The Board discussed the Fund’sperformance with the Adviser and recognized the efforts being undertaken bythe Adviser in the context of the other factors considered relevant by the Board.
Following such evaluation, the Board concluded, within the context of its fulldeliberations, that the performance of the Fund supported renewal of theinvestment advisory contract with respect to the Fund.
The Board also received financial information about Federated, includinginformation regarding the compensation and ancillary (or “fall-out”) benefitsFederated derived from its relationships with the Federated funds. Thisinformation covered not only the fees under the investment advisory contracts,
Semi-Annual Shareholder Report41

but also fees received by Federated’s subsidiaries for providing other services tothe Federated funds under separate contracts (e.g., for serving as the Federatedfunds’ administrator). The information also detailed any indirect benefitFederated may derive from its receipt of research services from brokers whoexecute Federated fund trades. In addition, the Board considered the fact that, inorder for a fund to be competitive in the marketplace, Federated and its affiliatesfrequently waived fees and/or reimbursed expenses and have disclosed to fundinvestors and/or indicated to the Board their intention to do so in the future,where appropriate. Moreover, the Board receives regular reporting as to theinstitution, adjustment or elimination of these voluntary waivers. The Boardconsidered Federated’s previous reductions in contractual management fees tocertain funds in response to the Senior Officer’s recommendations.
Federated furnished information, requested by the Senior Officer, thatreported revenues on a fund-by-fund basis and made estimates of the allocationof expenses on a fund-by-fund basis, using allocation methodologies specified bythe Senior Officer. The Senior Officer noted that, while these cost allocationreports apply consistent allocation processes, the inherent difficulties inallocating costs continues to cause the Senior Officer to question the precisionof the process and to conclude that such reports may be unreliable, since a singlechange in an allocation estimate may dramatically alter the resulting estimate ofcost and/or profitability of a fund and may produce unintended consequences.The allocation information, including the Senior Officer’s view that fund-by-fund estimations may be unreliable, was considered in the analysis by the Board.
The Board and the Senior Officer also reviewed information compiled byFederated comparing profitability information for Federated to other publiclyheld fund management companies. In this regard, the Senior Officer concludedthat Federated’s profit margins did not appear to be excessive. The SeniorOfficer also noted that Federated appeared financially sound, with the resourcesto fulfill its obligations under its contracts with the Fund.
The Senior Officer’s Evaluation also discussed the notion of possiblerealization of “economies of scale” as a fund grows larger. The Board consideredin this regard that the Adviser has made significant and long-term investments inareas that support all of the Federated funds, such as personnel and processes forthe portfolio management, shareholder services, compliance, internal audit, andrisk management functions, as well as systems technology (including technologyrelating to cybersecurity), and that the benefits of these efforts (as well as anyeconomies of scale, should they exist) were likely to be enjoyed by the fundfamily as a whole. The Board noted that the Adviser’s investments in these areasare extensive. In addition, the Board considered that Federated and its affiliateshave frequently waived fees and/or reimbursed expenses and that this hasallowed fund shareholders to share potential economies of scale from a fund’sinception. Federated, as it does throughout the year, and again in connectionwith the Board’s review, furnished information relative to revenue sharing oradviser paid fees. Federated and the Senior Officer noted that this information
Semi-Annual Shareholder Report42

should be viewed to determine if there was an incentive to either not applybreakpoints or to apply breakpoints at higher levels and should not be viewed todetermine the appropriateness of advisory fees, because it would representmarketing and distribution expenses. Finally, the Board also noted the absence ofany applicable regulatory or industry guidelines on this subject, which (asdiscussed in the Senior Officer’s Evaluation) is compounded by the lack of anycommon industry practice or general pattern with respect to structuring fundadvisory fees with “breakpoints” that serve to reduce the fee as a fund attains acertain size.
The Senior Officer noted that, subject to the comments andrecommendations made within the Senior Officer’s Evaluation, his observationsand the information accompanying the Senior Officer’s Evaluation supported afinding by the Board that the management fee for the fund was reasonable.Under these circumstances, no changes were recommended to, and no objectionwas raised to, the continuation of the Fund’s investment advisory contract.
In its decision to continue an existing investment advisory contract, the Boardwas mindful of the potential disruptions of the Fund’s operations and variousrisks, uncertainties and other effects that could occur as a result of a decision toterminate or not renew an investment advisory contract. In particular, the Boardrecognized that many shareholders have invested in the Fund on the strength ofthe Adviser’s industry standing and reputation and with the expectation that theAdviser will have a continuing role in providing advisory services to the Fund.Thus, the Board’s approval of the investment advisory contract reflected the factthat it is the shareholders who have effectively selected the Adviser by virtue ofhaving invested in the Fund. The Board concluded that, in light of the factorsdiscussed above, including the nature, quality and scope of the services providedto the Fund by the Adviser and its affiliates, continuation of the investmentadvisory contract was appropriate.
The Board based its decision to approve the investment advisory contract onthe totality of the circumstances and relevant factors and with a view to past andfuture long-term considerations. Not all of the factors and considerationsidentified above were necessarily relevant to the Fund, nor did the Boardconsider any one of them to be determinative. With respect to the factors thatwere relevant, the Board’s decision to approve the continuation of the contractreflects its determination that Federated’s performance and actions provided asatisfactory basis to support the decision to continue the existing arrangement.
Semi-Annual Shareholder Report43

Voting Proxies on Fund Portfolio SecuritiesA description of the policies and procedures that the Fund uses to determinehow to vote proxies, if any, relating to securities held in the Fund’s portfolio isavailable, without charge and upon request, by calling 1-800-341-7400. A reporton “Form N-PX” of how the Fund voted any such proxies during the mostrecent 12-month period ended June 30 is available via the Proxy Voting Record(Form N-PX) link associated with the Fund and share class name atwww.FederatedInvestors.com/FundInformation. Form N-PX filings are alsoavailable at the SEC’s website at www.sec.gov.
Quarterly Portfolio ScheduleThe Fund files with the SEC a complete schedule of its portfolio holdings, as ofthe close of the first and third quarters of its fiscal year, on “Form N-Q.” Thesefilings are available on the SEC’s website at www.sec.gov and may be reviewedand copied at the SEC’s Public Reference Room in Washington, DC.(Call 1-800-SEC-0330 for information on the operation of the PublicReference Room.) You may also access this information via the link to theFund and share class name at www.FederatedInvestors.com/FundInformation.
Semi-Annual Shareholder Report44

Mutual funds are not bank deposits or obligations, are not guaranteed by any bank andare not insured or guaranteed by the U.S. government, the Federal Deposit InsuranceCorporation, the Federal Reserve Board or any other government agency. Investment inmutual funds involves investment risk, including the possible loss of principal.
This Report is authorized for distribution to prospective investors only whenpreceded or accompanied by the Fund’s Prospectus, which contains factsconcerning its objective and policies, management fees, expenses andother information.
IMPORTANT NOTICE ABOUT FUND DOCUMENT DELIVERYIn an effort to reduce costs and avoid duplicate mailings, the Fund(s) intendto deliver a single copy of certain documents to each household in whichmore than one shareholder of the Fund(s) resides (so-called“householding”), as permitted by applicable rules. The Fund’s“householding” program covers its/their Prospectus and Statement ofAdditional Information, and supplements to each, as well as Semi-Annualand Annual Shareholder Reports and any Proxies or information statements.Shareholders must give their written consent to participate in the“householding” program. The Fund is also permitted to treat a shareholderas having given consent (“implied consent”) if (i) shareholders with the samelast name, or believed to be members of the same family, reside at the samestreet address or receive mail at the same post office box, (ii) the Fund givesnotice of its intent to “household” at least sixty (60) days before it begins“householding” and (iii) none of the shareholders in the household havenotified the Fund(s) or their agent of the desire to “opt out” of“householding.” Shareholders who have granted written consent, or havebeen deemed to have granted implied consent, can revoke that consent andopt out of “householding” at any time: shareholders who purchased sharesthrough an intermediary should contact their representative; othershareholders may call the Fund at 1-800-341-7400.
Semi-Annual Shareholder Report45

e e eratd dFederated Max-Cap Index FundFederated Investors Funds4000 Ericsson DriveWarrendale, PA 15086-7561
Contact us at FederatedInvestors.comor call 1-800-341-7400.
Federated Securities Corp., Distributor
CUSIP 31420E502CUSIP 31420E809CUSIP 31420E106CUSIP 31420E403
2052905 (6/17)
Federated is a registered trademark of Federated Investors, Inc.2017 ©Federated Investors, Inc.


![TO: - CO Courts€¦ · Web viewDespite the contract’s highly inclusive reference to claims brought “[f]or any reason, including, but not limited to, death,” the court of](https://img.pdfslide.net/doc/110x75/5f8601a04972412b7627ea29/to-co-courts-web-view-despite-the-contractas-highly-inclusive-reference-to.jpg)