Embed Size (px)
Citation preview
UNITED STATESSECURITIES AND EXCHANGE COMMISSION
Washington, D.C. 20549
FORM 8-K
CURRENT REPORTPursuant to Section 13 or 15(d)
of the Securities Exchange Act of 1934
Date of Report (Date of earliest event reported): June 19, 2018
FedEx Corporation(Exact name of registrant as specified in its charter)
Commission File Number 1-15829
Delaware 62-1721435(State or other jurisdiction
of incorporation) (IRS Employer
Identification No.)
942 South Shady Grove Road, Memphis, Tennessee 38120(Address of principal executive offices) (ZIP Code)
Registrant’s telephone number, including area code: (901) 818-7500
Check the appropriate box below if the Form 8-K filing is intended to simultaneously satisfy the filing obligation of the registrant under any of the followingprovisions:
☐ Written communications pursuant to Rule 425 under the Securities Act (17 CFR 230.425)
☐ Soliciting material pursuant to Rule 14a-12 under the Exchange Act (17 CFR 240.14a-12)
☐ Pre-commencement communications pursuant to Rule 14d-2(b) under the Exchange Act (17 CFR 240.14d-2(b))
☐ Pre-commencement communications pursuant to Rule 13e-4(c) under the Exchange Act (17 CFR 240.13e-4(c))
Indicate by check mark whether the registrant is an emerging growth company as defined in Rule 405 of the Securities Act of 1933 (§230.405 of this chapter) orRule 12b-2 of the Securities Exchange Act of 1934 (§240.12b-2 of this chapter).
Emerging growth company ☐
If an emerging growth company, indicate by check mark if the registrant has elected not to use the extended transition period for complying with any new orrevised financial accounting standards provided pursuant to Section 13(a) of the Exchange Act. ☐
EXPLANATORY NOTE
The information in this Report, including the exhibit, is being furnished pursuant to Item 2.02 of Form 8-K and General Instruction B.2 thereunder. Suchinformation shall not be deemed “filed” for purposes of Section 18 of the Securities Exchange Act of 1934, as amended, or otherwise subject to the liabilities ofthat section, nor shall it be deemed incorporated by reference in any filing under the Securities Act of 1933, as amended.
SECTION 2. FINANCIAL INFORMATION.
Item 2.02. Results of Operations and Financial Condition.
Attached as Exhibit 99.1 and incorporated herein by reference is a copy of FedEx Corporation’s press release, dated June 19, 2018, announcing its financialresults for the fiscal quarter and year ended May 31, 2018.
SECTION 9. FINANCIAL STATEMENTS AND EXHIBITS.
Item 9.01. Financial Statements and Exhibits.
(d) Exhibits. The following exhibit is being furnished as part of this Report. Exhibit Number Description
99.1 Press Release of FedEx Corporation dated June 19, 2018.
2

SIGNATURES
Pursuant to the requirements of the Securities Exchange Act of 1934, the registrant has duly caused this report to be signed on its behalf by the undersignedhereunto duly authorized.
FedEx Corporation
Date: June 19, 2018 By: /s/ John L. Merino John L. Merino Corporate Vice President and Principal Accounting Officer
3

EXHIBIT INDEX Exhibit Number Description
99.1 Press Release of FedEx Corporation dated June 19, 2018.
E-1
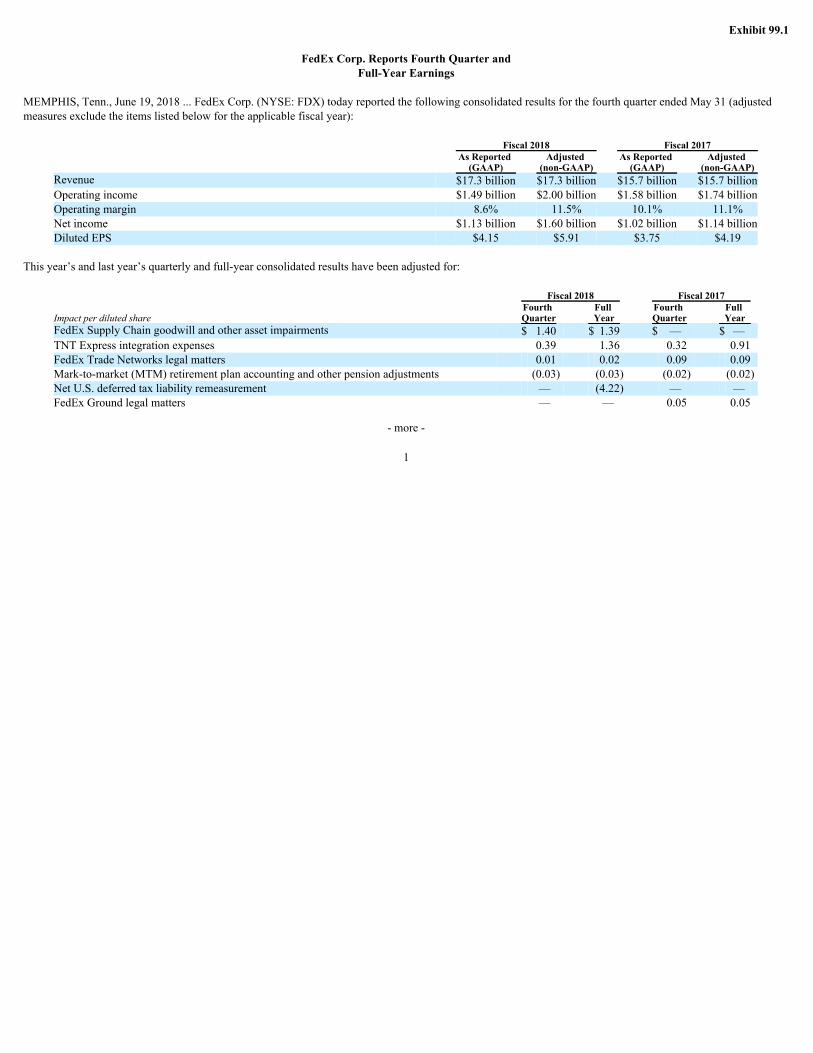
Exhibit 99.1
FedEx Corp. Reports Fourth Quarter andFull-Year Earnings
MEMPHIS, Tenn., June 19, 2018 ... FedEx Corp. (NYSE: FDX) today reported the following consolidated results for the fourth quarter ended May 31 (adjustedmeasures exclude the items listed below for the applicable fiscal year):
Fiscal 2018 Fiscal 2017
As Reported
(GAAP) Adjusted
(non-GAAP) As Reported
(GAAP) Adjusted
(non-GAAP)Revenue $17.3 billion $17.3 billion $15.7 billion $15.7 billionOperating income $1.49 billion $2.00 billion $1.58 billion $1.74 billionOperating margin 8.6% 11.5% 10.1% 11.1%Net income $1.13 billion $1.60 billion $1.02 billion $1.14 billionDiluted EPS $4.15 $5.91 $3.75 $4.19
This year’s and last year’s quarterly and full-year consolidated results have been adjusted for:
Fiscal 2018 Fiscal 2017
Impact per diluted share Fourth Quarter
Full Year
Fourth Quarter
Full Year
FedEx Supply Chain goodwill and other asset impairments $ 1.40 $ 1.39 $ — $ — TNT Express integration expenses 0.39 1.36 0.32 0.91 FedEx Trade Networks legal matters 0.01 0.02 0.09 0.09 Mark-to-market (MTM) retirement plan accounting and other pension adjustments (0.03) (0.03) (0.02) (0.02) Net U.S. deferred tax liability remeasurement — (4.22) — — FedEx Ground legal matters — — 0.05 0.05
- more -
1

“I am proud of the financial and operational results FedEx delivered in fiscal 2018 and extend well-deserved congratulations to our more than 425,000 teammembers worldwide for their continued dedication to the Purple Promise, which simply states, ‘I will make every FedEx experience outstanding,’” said FrederickW. Smith, FedEx Corp. chairman and chief executive officer. “It was a year of opportunities and challenges—anticipated and unexpected—and FedEx emergedmore competitive than ever. In all my years at FedEx, I have never been so optimistic and so sure of our strategy and our ability to deliver an exciting future.”
Fourth quarter operating results benefited from higher base rates, increased volume and the favorable net impact of fuel at each transportation segment. Acceleratedwage increases for certain hourly employees partially offset these benefits.
Fourth quarter net results include a $255 million net tax benefit ($0.94 per diluted share) from corporate structuring transactions as part of the ongoing integrationof FedEx Express and TNT Express and a $133 million tax benefit ($0.49 per diluted share) from foreign tax credits associated with distributions to the U.S. fromthe company’s offshore operations.
Full-Year Results
FedEx Corp. reported the following consolidated results for the full year (adjusted measures exclude the items listed above for the applicable fiscal year):
Fiscal 2018 Fiscal 2017
As Reported
(GAAP) Adjusted
(non-GAAP) As Reported
(GAAP) Adjusted
(non-GAAP)Revenue $65.5 billion $65.5 billion $60.3 billion $60.3 billionOperating income $4.87 billion $5.73 billion $5.04 billion $5.40 billionOperating margin 7.4% 8.7% 8.4% 9.0%Net income $4.57 billion $4.17 billion $3.00 billion $3.27 billionDiluted EPS $16.79 $15.31 $11.07 $12.09
- more -
2
Full-year net results include tax benefits of $2.1 billion ($7.71 per diluted share) attributable to:
• A $1.6 billion benefit from the Tax Cuts and Jobs Act (TCJA), which has three primary components:
• A provisional benefit of $1.15 billion ($4.22 per diluted share) from the remeasurement of the company’s net U.S. deferred tax liability forlower tax rates;
• A benefit of approximately $200 million ($0.75 per diluted share) from an incremental pension contribution made in the third quarter anddeductible against the company’s prior year taxes at 35%; and
• A benefit of approximately $265 million ($0.97 per diluted share) attributable to the phase-in of the reduced tax rate applied to the company’searnings.
• A net benefit of $255 million ($0.94 per diluted share) from corporate structuring transactions as part of the ongoing integration of FedEx Express andTNT Express; and
• A benefit of $225 million ($0.83 per diluted share) from foreign tax credits associated with distributions to the U.S. from the company’s offshoreoperations.
Capital spending for fiscal 2018 was $5.7 billion.
For the year, the company repurchased 4.3 million shares of FedEx common stock for approximately $1 billion.
Outlook
FedEx is unable to forecast the fiscal 2019 year-end MTM retirement plan accounting adjustments. As a result, the company is unable to provide a fiscal 2019earnings per share or effective tax rate (ETR) outlook on a GAAP basis.
New pension accounting rules will be in effect starting in fiscal 2019 that will impact operating margin but not net income or earnings per share. For reference,comparable measures for fiscal 2018 that have been recast to reflect application of the new rules are provided below.
- more -
3
For fiscal 2019, FedEx is targeting:
• Revenue growth of approximately 9%;
• Operating margin of approximately 7.9% (compared to a recast fiscal 2018 operating margin of 6.5%);
• Operating margin of approximately 8.5% excluding TNT Express integration expenses (compared to a recast fiscal 2018 operating margin of 7.8%excluding TNT Express integration expenses and FedEx Supply Chain goodwill and other asset impairment charges);
• Earnings of $15.65 to $16.25 per diluted share before year-end MTM retirement plan accounting adjustments;
• Earnings of $17.00 to $17.60 per diluted share before year-end MTM retirement plan accounting adjustments and excluding TNT Express integrationexpenses;
• ETR of approximately 25% prior to year-end MTM retirement plan accounting adjustments, which is higher than the fiscal 2018 ETR due to taxbenefits from transactions and TCJA impacts that will not reoccur during fiscal 2019; and
• Capital spending of $5.6 billion.
These forecasts assume moderate economic growth. The company’s ETR and earnings per share outlook is based on current TCJA interpretative guidance and issubject to change based on future guidance.
“Our fiscal 2019 results will benefit from our continued focus on revenue quality as well as from synergy realization as we make progress in combining TNTExpress with FedEx Express,” said Alan B. Graf, Jr., FedEx Corp. executive vice president and chief financial officer. “We expect improved earnings, cash flowsand returns this fiscal year and remain committed to improving operating income at the FedEx Express segment by $1.2 to $1.5 billion in fiscal 2020 versus fiscal2017.”
Aircraft Fleet Modernization
FedEx has ordered 12 incremental Boeing 777F aircraft and 12 incremental Boeing 767F aircraft as the next phase of the company’s ongoing fleet modernizationprogram. The 777Fs will be delivered between fiscal 2021 and 2025. The 767Fs will be delivered between fiscal 2020 and 2022. These aircraft will be used tocontinue to improve the efficiency and reliability of the FedEx Express aircraft fleet and allow the company to take advantage of the capital expensing benefits ofthe TCJA.
- more -
4

FedEx Trade Networks Realignment
Effective in the fourth fiscal quarter, the company realigned the specialty services companies FedEx Custom Critical and FedEx Supply Chain under themanagement of FedEx Trade Networks. Prior period results for the transportation segments have been recast to reflect the new alignment. The FedEx TradeNetworks operating segment results are included in “Corporate, other and eliminations.”
FedEx Express Segment
For the fourth quarter, the FedEx Express segment reported (adjusted measures exclude TNT Express integration expenses):
Fiscal 2018 Fiscal 2017
As Reported
(GAAP) Adjusted
(non-GAAP) As Reported
(GAAP) Adjusted
(non-GAAP)Revenue $9.60 billion $9.60 billion $8.82 billion $8.82 billionOperating income $990 million $1.10 billion $888 million $971 millionOperating income YOY change % 11% 13% Operating margin 10.3% 11.5% 10.1% 11.0%
Revenue increased 9% due to higher yields across the global portfolio of package and freight services, as well as higher freight pounds. Operating results improveddue to higher revenue, an $85 million gain on the sale of a non-core business of TNT Express and the favorable net impact of fuel and currency exchange. Resultswere partially offset by increased salaries and employee benefits. As-reported results include $110 million of TNT Express integration expenses.
FedEx Ground Segment
For the fourth quarter, the FedEx Ground segment reported:
Fiscal 2018 Fiscal 2017 ChangeRevenue $4.80 billion $4.30 billion 12%Operating income $832 million $704 million 18%Operating margin 17.3% 16.4% 0.9 pts
Strong revenue growth was driven by average daily package volume growth of 6% and higher base rates. Operating results improved due to the benefits fromrevenue growth and ongoing cost management, partially offset by higher purchased transportation rates and increased staffing and network expansion costs.
- more -
5
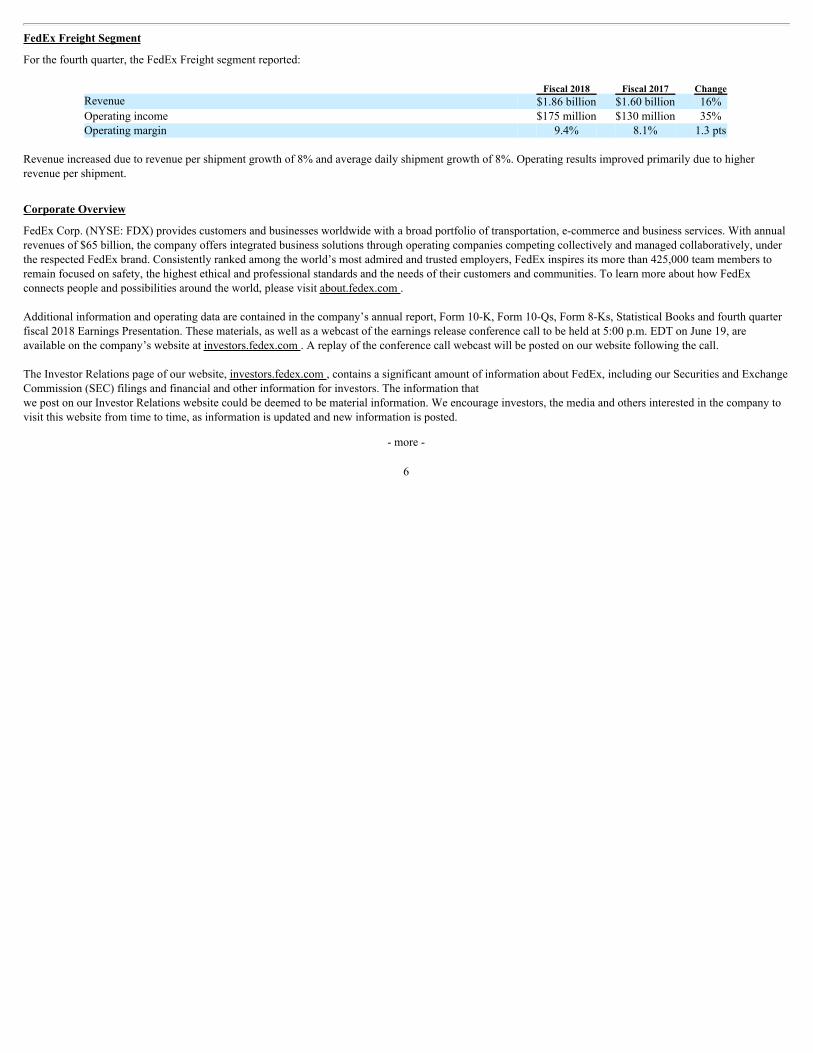
FedEx Freight Segment
For the fourth quarter, the FedEx Freight segment reported:
Fiscal 2018 Fiscal 2017 ChangeRevenue $1.86 billion $1.60 billion 16%Operating income $175 million $130 million 35%Operating margin 9.4% 8.1% 1.3 pts
Revenue increased due to revenue per shipment growth of 8% and average daily shipment growth of 8%. Operating results improved primarily due to higherrevenue per shipment.
Corporate Overview
FedEx Corp. (NYSE: FDX) provides customers and businesses worldwide with a broad portfolio of transportation, e-commerce and business services. With annualrevenues of $65 billion, the company offers integrated business solutions through operating companies competing collectively and managed collaboratively, underthe respected FedEx brand. Consistently ranked among the world’s most admired and trusted employers, FedEx inspires its more than 425,000 team members toremain focused on safety, the highest ethical and professional standards and the needs of their customers and communities. To learn more about how FedExconnects people and possibilities around the world, please visit about.fedex.com .
Additional information and operating data are contained in the company’s annual report, Form 10-K, Form 10-Qs, Form 8-Ks, Statistical Books and fourth quarterfiscal 2018 Earnings Presentation. These materials, as well as a webcast of the earnings release conference call to be held at 5:00 p.m. EDT on June 19, areavailable on the company’s website at investors.fedex.com . A replay of the conference call webcast will be posted on our website following the call.
The Investor Relations page of our website, investors.fedex.com , contains a significant amount of information about FedEx, including our Securities and ExchangeCommission (SEC) filings and financial and other information for investors. The information thatwe post on our Investor Relations website could be deemed to be material information. We encourage investors, the media and others interested in the company tovisit this website from time to time, as information is updated and new information is posted.
- more -
6
Certain statements in this press release may be considered forward-looking statements, such as statements relating to management’s views with respect to futureevents and financial performance. Such forward-looking statements are subject to risks, uncertainties and other factors which could cause actual results to differmaterially from historical experience or from future results expressed or implied by such forward-looking statements. Potential risks and uncertainties include, butare not limited to, economic conditions in the global markets in which we operate, a significant data breach or other disruption to our technology infrastructure, ourability to successfully integrate the businesses and operations of FedEx Express and TNT Express in the expected time frame or at the expected cost, changes infuel prices or currency exchange rates, our ability to match capacity to shifting volume levels, new U.S. domestic or international government regulation, futureguidance and interpretations relating to the TCJA and our ability to realize the benefits of certain provisions of the TCJA, our ability to effectively operate,integrate and leverage acquired businesses, our ability to achieve our FedEx Express segment profit improvement goal, legal challenges or changes related toowner-operators engaged by FedEx Ground and the drivers providing services on their behalf, disruptions or modifications in service by, or changes in the businessor financial soundness of, the U.S. Postal Service, the impact from any terrorist activities or international conflicts and other factors which can be found in FedExCorp.’s and its subsidiaries’ press releases and FedEx Corp.’s filings with the SEC. Any forward-looking statement speaks only as of the date on which it is made.We do not undertake or assume any obligation to update or revise any forward-looking statement, whether as a result of new information, future events orotherwise.
Media Contact: Jess Bunn 901-818-7463Investor Contact: Mickey Foster 901-818-7468Home Page: fedex.com
- more -
7

RECONCILIATIONS OF NON-GAAP FINANCIAL MEASURESTO GAAP FINANCIAL MEASURES
Fourth Quarter and Full-Year Fiscal 2018 and Fiscal 2017 Results
The company reports its financial results in accordance with accounting principles generally accepted in the United States (“GAAP” or “reported”). We havesupplemented the reporting of our financial information determined in accordance with GAAP with certain non-GAAP (or “adjusted”) financial measures,including our adjusted fourth quarter and adjusted full-year fiscal 2018 and 2017 consolidated operating income and margin, net income and diluted earnings pershare, and adjusted fourth quarter fiscal 2018 and 2017 FedEx Express segment operating income and margin. These financial measures have been adjusted toexclude the impact of the following items (as applicable):
• FedEx Supply Chain goodwill and other asset impairment charges incurred in fiscal 2018;
• TNT Express integration expenses incurred in fiscal 2018 and 2017;
• Fiscal 2018 and 2017 charges related to certain pending U.S. Customs and Border Protection matters involving FedEx Trade Networks;
• Fiscal 2018 and 2017 year-end MTM retirement plan accounting and other pension adjustments for our defined benefit pension and otherpostretirement plans;
• Net U.S. deferred tax liability remeasurement during fiscal 2018; and
• Expenses incurred in fiscal 2017 in connection with the settlement of (and certain expected losses relating to) independent contractor litigation mattersinvolving FedEx Ground.
The goodwill and other asset impairment charges at FedEx Supply Chain, litigation- and legal-related matters and MTM retirement plan accounting and otherpension adjustments are excluded from our fourth quarter and full-year fiscal 2018 and 2017 consolidated non-GAAP financial measures, as applicable, becausethey are unrelated to our core operating performance and to assist investors with assessing trends in our underlying businesses.
We have incurred and expect to incur significant expenses over the next few years in connection with our integration of TNT Express. We have adjusted our fourthquarter and full-year fiscal 2018 and 2017 consolidated financial measures and the FedEx Express segment fourth quarter fiscal 2018 and 2017 financial measuresto exclude TNT Express integration expenses because we generally would not incur such expenses as part of our continuing operations. The integration expensesare predominantly incremental costs
- more -
8

directly associated with the integration of TNT Express, including professional and legal fees, salaries and wages, advertising expenses and travel. Internal salariesand wages are included only to the extent the individuals are assigned full-time to integration activities. The integration expenses also include any restructuringcharges at TNT Express.
The provisional benefit from the remeasurement of our net U.S. deferred tax liability as of the date of the enactment of the TCJA is excluded from our full-yearfiscal 2018 consolidated non-GAAP financial measures because it results from the non-recurring impact of a significant change in the U.S. federal statutory tax ratedue to the enactment of the TCJA on our overall deferred tax position, which accumulated over many reporting periods prior to enactment. The adjustment to ourfull-year fiscal 2018 consolidated financial measures related to the TCJA includes only this transitional impact.
We have not included the benefit from our incremental pension contribution made in February 2018 and deductible against our prior year taxes at 35% in theadjustment because the contribution was made in connection with our ongoing pension management strategy. Additionally, we have not included the benefitattributable to the phase-in of the reduced tax rate applied to our fiscal 2018 earnings in the adjustment because the impact of the reduced tax rate on current yearearnings will be ongoing. Finally, we have not included the provisional benefit related to the one-time transition tax on previously deferred foreign earnings in theadjustment because the amount of this provisional benefit at the end of fiscal 2018 was not material to our overall tax position. The provisional benefits related tothe remeasurement of our net U.S. deferred tax liability and the one-time transition tax on previously deferred foreign earnings are estimates subject to adjustmentduring a 12-month measurement period ending December 22, 2018.
We believe these adjusted financial measures facilitate analysis and comparisons of our ongoing business operations because they exclude items that may not beindicative of, or are unrelated to, the company’s and our business segments’ core operating performance, and may assist investors with comparisons to prior periodsand assessing trends in our underlying businesses. These adjustments are consistent with how management views our businesses. Management uses thesenon-GAAP financial measures in making financial, operating and planning decisions and evaluating the company’s and each business segment’s ongoingperformance.
- more -
9

Our non-GAAP measures are intended to supplement and should be read together with, and are not an alternative or substitute for, and should not be consideredsuperior to, our reported financial results. Accordingly, users of our financial statements should not place undue reliance on these non-GAAP financial measures.Because non-GAAP financial measures are not standardized, it may not be possible to compare these financial measures with other companies’ non-GAAPfinancial measures having the same or similar names. As required by SEC rules, the tables below present a reconciliation of our presented non-GAAP financialmeasures to the most directly comparable GAAP measures.
Recast Fiscal 2018 Operating Margin and Fiscal 2019 Operating Margin, Earnings Per Share and ETR Forecasts
Our recast fiscal 2018 operating margin (to reflect application of the new pension accounting rules that will be in effect starting in fiscal 2019) that excludes fiscal2018 TNT Express integration expenses and FedEx Supply Chain goodwill and other asset impairment charges is a non-GAAP financial measure because of theseexclusions. Our fiscal 2019 operating margin forecast is a non-GAAP financial measure because it excludes estimated fiscal 2019 TNT Express integrationexpenses. Our fiscal 2019 earnings per share (EPS) forecast is a non-GAAP financial measure because it excludes the fiscal 2019 year-end MTM retirement planaccounting adjustments and estimated fiscal 2019 TNT Express integration expenses. Our fiscal 2019 ETR forecast is a non-GAAP financial measure because itexcludes the fiscal 2019 year-end MTM retirement plan accounting adjustments.
We have provided these non-GAAP financial measures for the same reasons that were outlined above for historical non-GAAP measures. These items are excludedfrom our recast fiscal 2018 operating margin and our fiscal 2019 operating margin, EPS and ETR forecasts, as applicable, for the same reasons described above forhistorical non-GAAP measures.
We are unable to predict the amount of the year-end MTM retirement plan accounting adjustments, as they are significantly impacted by changes in interest ratesand the financial markets, so such adjustments are not included in our fiscal 2019 EPS and ETR forecasts. For this reason, a full reconciliation of our fiscal 2019EPS and ETR forecasts to the most directly comparable GAAP measures is impracticable. It is reasonably possible, however, that our fiscal 2019 year-end MTMretirement plan accounting adjustments could have a material impact on our fiscal 2019 consolidated financial results and ETR.
- more -
10

As discussed above, the provisional benefit from the remeasurement of our net U.S. deferred tax liability included in our fiscal 2018 earnings is an estimate subjectto adjustment during a 12-month measurement period ending in fiscal 2019. Any adjustment to this provisional benefit will be excluded from our fiscal 2019non-GAAP earning measures, which is consistent with our presentation of the effects of the initial provisional benefit in our fiscal 2018 non-GAAP earningsmeasures.
The table included below titled “Fiscal 2019 Earnings Per Share Outlook” outlines the impacts of the items that are excluded from our fiscal 2019 EPS forecast,other than the year-end MTM retirement plan accounting adjustments. Additionally, the tables below titled “Fiscal 2018 Recast Operating Margin for PensionAccounting Change” and “Fiscal 2019 Operating Margin Forecast” present reconciliations of our presented non-GAAP measures to the most directly comparableGAAP measures.
Fourth Quarter Fiscal 2018
FedEx Corporation Operating
IncomeTaxes1,2
Net
Income2,3
Diluted Earnings Per Share
2 Dollars in millions, except EPS Income Margin GAAP measure $1,490 8.6% $ 231 $1,127 $ 4.15 FedEx Supply Chain goodwill and other asset impairments 4 380 2.2% 1 379 1.40 TNT Express integration expenses 5 136 0.8% 30 106 0.39 FedEx Trade Networks legal matters 1 — (1) 2 0.01 MTM retirement plan accounting and other pension adjustments 6 (10) (0.1%) (1) (9) (0.03)
Non-GAAP measure $1,997 11.5% $ 261 $1,604 $ 5.91
- more -
11

Fourth Quarter Fiscal 2018 (continued)
FedEx Express Segment
Operating
Dollars in millions Income Margin
2 GAAP measure $ 990 10.3% TNT Express integration expenses 110 1.1%
Non-GAAP measure $1,100 11.5%
Full-Year Fiscal 2018
FedEx Corporation Operating Income
Taxes1,2
Net Income
2,3
Diluted Earnings Per Share Dollars in millions, except EPS Income Margin
GAAP measure $4,870 7.4% ($ 219) $ 4,572 $ 16.79 FedEx Supply Chain goodwill and other asset impairments 4 380 0.6% 1 379 1.39 TNT Express integration expenses 5 477 0.7% 105 372 1.36 FedEx Trade Networks legal matters 8 — 2 6 0.02 MTM retirement plan accounting and other pension adjustments 6 (10) — (1) (9) (0.03) Net U.S. deferred tax liability remeasurement — — 1,150 (1,150) (4.22)
Non-GAAP measure $5,725 8.7% $ 1,039 $ 4,169 $ 15.31
- more -
12

Fourth Quarter Fiscal 2017
FedEx Corporation Operating
IncomeTaxes 1
Net Income
3
Diluted Earnings Per Share Dollars in millions, except EPS Income Margin
GAAP measure $1,581 10.1% $ 440 $1,020 $ 3.75 MTM retirement plan accounting adjustments 6 (24) (0.1%) (18) (6) (0.02) TNT Express integration expenses 5 124 0.8% 37 87 0.32 FedEx Trade Networks legal matters 39 0.2% 15 24 0.09 FedEx Ground legal matters 22 0.1% 9 13 0.05
Non-GAAP measure $1,742 11.1% $ 483 $1,138 $ 4.19
FedEx Express Segment
Operating Dollars in millions Income Margin GAAP measure $ 888 10.1% TNT Express integration expenses 83 0.9%
Non-GAAP measure $ 971 11.0%
- more -
13
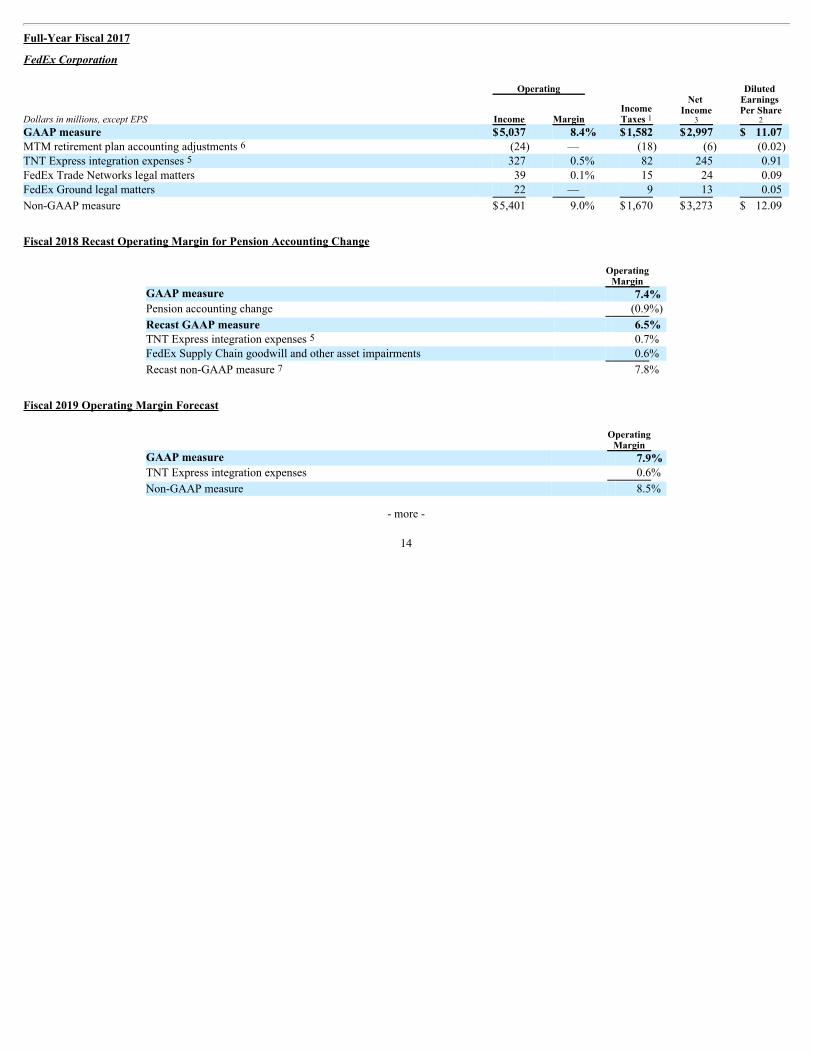
Full-Year Fiscal 2017
FedEx Corporation Operating
IncomeTaxes 1
Net
Income3
Diluted Earnings Per Share
2 Dollars in millions, except EPS Income Margin GAAP measure $5,037 8.4% $1,582 $2,997 $ 11.07 MTM retirement plan accounting adjustments 6 (24) — (18) (6) (0.02) TNT Express integration expenses 5 327 0.5% 82 245 0.91 FedEx Trade Networks legal matters 39 0.1% 15 24 0.09 FedEx Ground legal matters 22 — 9 13 0.05
Non-GAAP measure $5,401 9.0% $1,670 $3,273 $ 12.09
Fiscal 2018 Recast Operating Margin for Pension Accounting Change
Operating
Margin GAAP measure 7.4% Pension accounting change (0.9%)
Recast GAAP measure 6.5% TNT Express integration expenses 5 0.7% FedEx Supply Chain goodwill and other asset impairments 0.6%
Recast non-GAAP measure 7 7.8%
Fiscal 2019 Operating Margin Forecast
Operating
Margin GAAP measure 7.9% TNT Express integration expenses 0.6%
Non-GAAP measure 8.5%
- more -
14
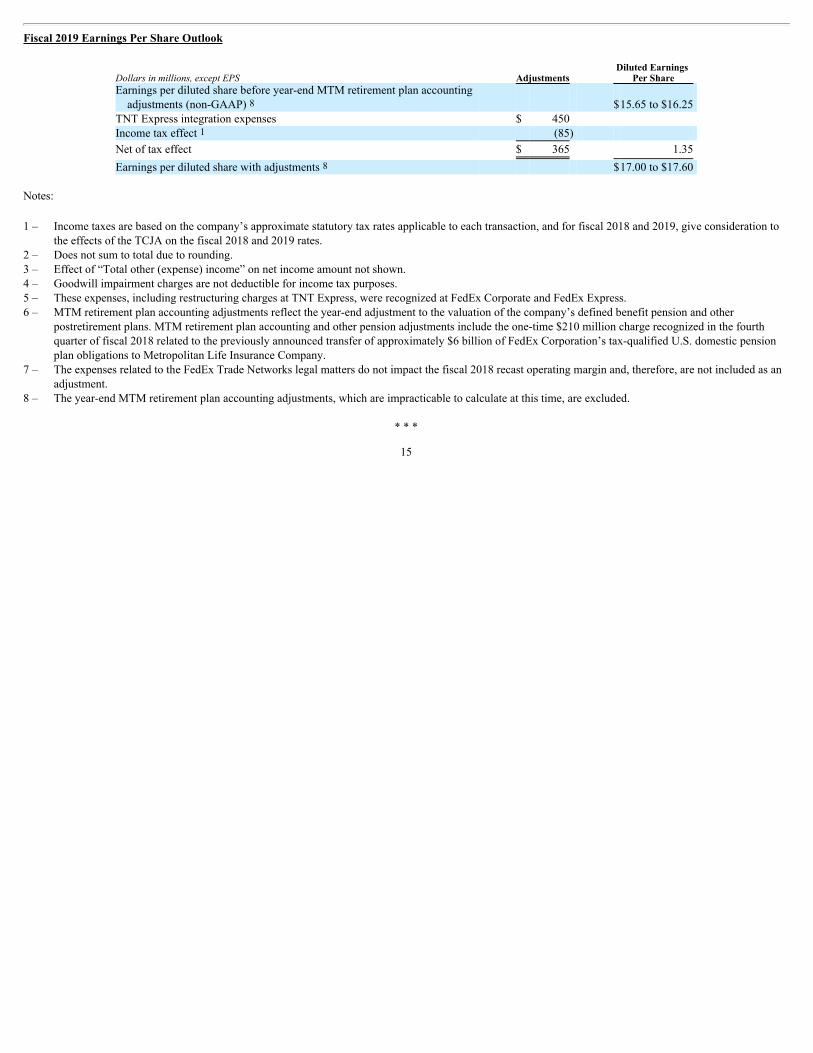
Fiscal 2019 Earnings Per Share Outlook
Dollars in millions, except EPS Adjustments Diluted Earnings
Per Share Earnings per diluted share before year-end MTM retirement plan accountingadjustments (non-GAAP) 8 $15.65 to $16.25
TNT Express integration expenses $ 450 Income tax effect 1 (85)
Net of tax effect $ 365 1.35
Earnings per diluted share with adjustments 8 $17.00 to $17.60
Notes: 1 – Income taxes are based on the company’s approximate statutory tax rates applicable to each transaction, and for fiscal 2018 and 2019, give consideration to
the effects of the TCJA on the fiscal 2018 and 2019 rates.2 – Does not sum to total due to rounding.3 – Effect of “Total other (expense) income” on net income amount not shown.4 – Goodwill impairment charges are not deductible for income tax purposes.5 – These expenses, including restructuring charges at TNT Express, were recognized at FedEx Corporate and FedEx Express.6 – MTM retirement plan accounting adjustments reflect the year-end adjustment to the valuation of the company’s defined benefit pension and other
postretirement plans. MTM retirement plan accounting and other pension adjustments include the one-time $210 million charge recognized in the fourthquarter of fiscal 2018 related to the previously announced transfer of approximately $6 billion of FedEx Corporation’s tax-qualified U.S. domestic pensionplan obligations to Metropolitan Life Insurance Company.
7 – The expenses related to the FedEx Trade Networks legal matters do not impact the fiscal 2018 recast operating margin and, therefore, are not included as anadjustment.
8 – The year-end MTM retirement plan accounting adjustments, which are impracticable to calculate at this time, are excluded.
* * *
15
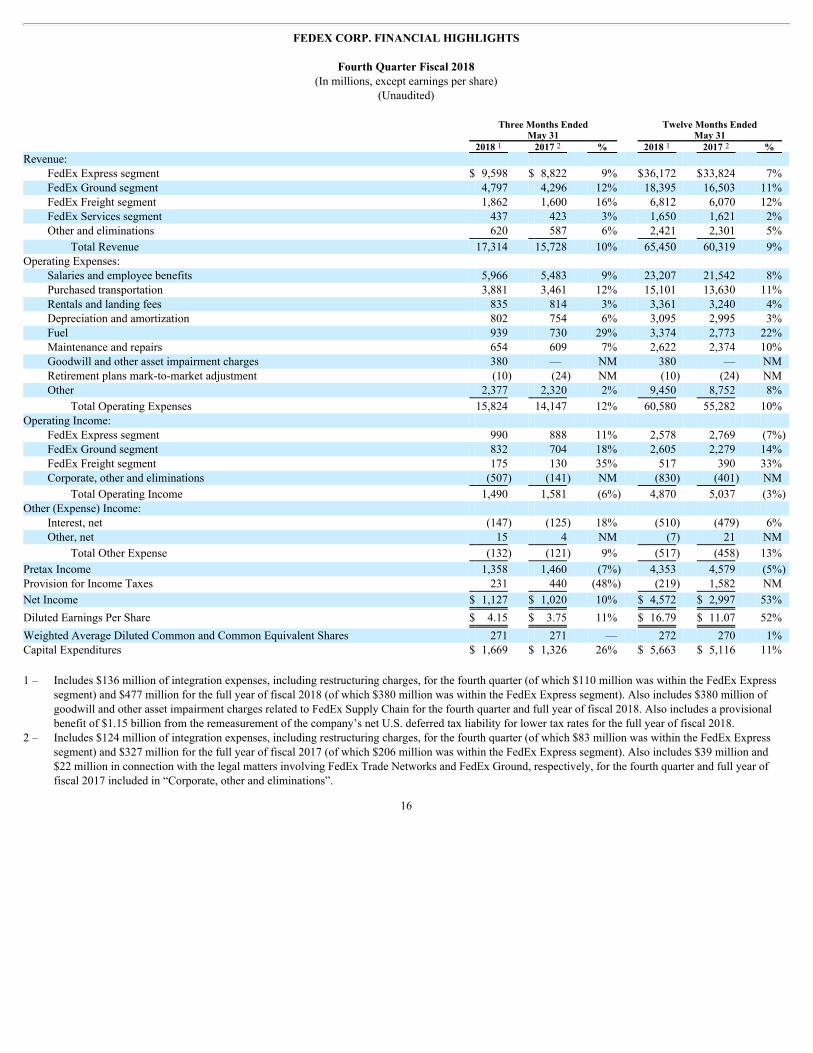
FEDEX CORP. FINANCIAL HIGHLIGHTS
Fourth Quarter Fiscal 2018(In millions, except earnings per share)
(Unaudited) Three Months Ended Twelve Months Ended May 31 May 31 2018 1 2017 2 % 2018 1 2017 2 % Revenue:
FedEx Express segment $ 9,598 $ 8,822 9% $36,172 $33,824 7% FedEx Ground segment 4,797 4,296 12% 18,395 16,503 11% FedEx Freight segment 1,862 1,600 16% 6,812 6,070 12% FedEx Services segment 437 423 3% 1,650 1,621 2% Other and eliminations 620 587 6% 2,421 2,301 5%
Total Revenue 17,314 15,728 10% 65,450 60,319 9% Operating Expenses:
Salaries and employee benefits 5,966 5,483 9% 23,207 21,542 8% Purchased transportation 3,881 3,461 12% 15,101 13,630 11% Rentals and landing fees 835 814 3% 3,361 3,240 4% Depreciation and amortization 802 754 6% 3,095 2,995 3% Fuel 939 730 29% 3,374 2,773 22% Maintenance and repairs 654 609 7% 2,622 2,374 10% Goodwill and other asset impairment charges 380 — NM 380 — NM Retirement plans mark-to-market adjustment (10) (24) NM (10) (24) NM Other 2,377 2,320 2% 9,450 8,752 8%
Total Operating Expenses 15,824 14,147 12% 60,580 55,282 10% Operating Income:
FedEx Express segment 990 888 11% 2,578 2,769 (7%) FedEx Ground segment 832 704 18% 2,605 2,279 14% FedEx Freight segment 175 130 35% 517 390 33% Corporate, other and eliminations (507) (141) NM (830) (401) NM
Total Operating Income 1,490 1,581 (6%) 4,870 5,037 (3%) Other (Expense) Income:
Interest, net (147) (125) 18% (510) (479) 6% Other, net 15 4 NM (7) 21 NM
Total Other Expense (132) (121) 9% (517) (458) 13%
Pretax Income 1,358 1,460 (7%) 4,353 4,579 (5%) Provision for Income Taxes 231 440 (48%) (219) 1,582 NM
Net Income $ 1,127 $ 1,020 10% $ 4,572 $ 2,997 53%
Diluted Earnings Per Share $ 4.15 $ 3.75 11% $ 16.79 $ 11.07 52%
Weighted Average Diluted Common and Common Equivalent Shares 271 271 — 272 270 1% Capital Expenditures $ 1,669 $ 1,326 26% $ 5,663 $ 5,116 11% 1 – Includes $136 million of integration expenses, including restructuring charges, for the fourth quarter (of which $110 million was within the FedEx Express
segment) and $477 million for the full year of fiscal 2018 (of which $380 million was within the FedEx Express segment). Also includes $380 million ofgoodwill and other asset impairment charges related to FedEx Supply Chain for the fourth quarter and full year of fiscal 2018. Also includes a provisionalbenefit of $1.15 billion from the remeasurement of the company’s net U.S. deferred tax liability for lower tax rates for the full year of fiscal 2018.
2 – Includes $124 million of integration expenses, including restructuring charges, for the fourth quarter (of which $83 million was within the FedEx Expresssegment) and $327 million for the full year of fiscal 2017 (of which $206 million was within the FedEx Express segment). Also includes $39 million and$22 million in connection with the legal matters involving FedEx Trade Networks and FedEx Ground, respectively, for the fourth quarter and full year offiscal 2017 included in “Corporate, other and eliminations”.
16
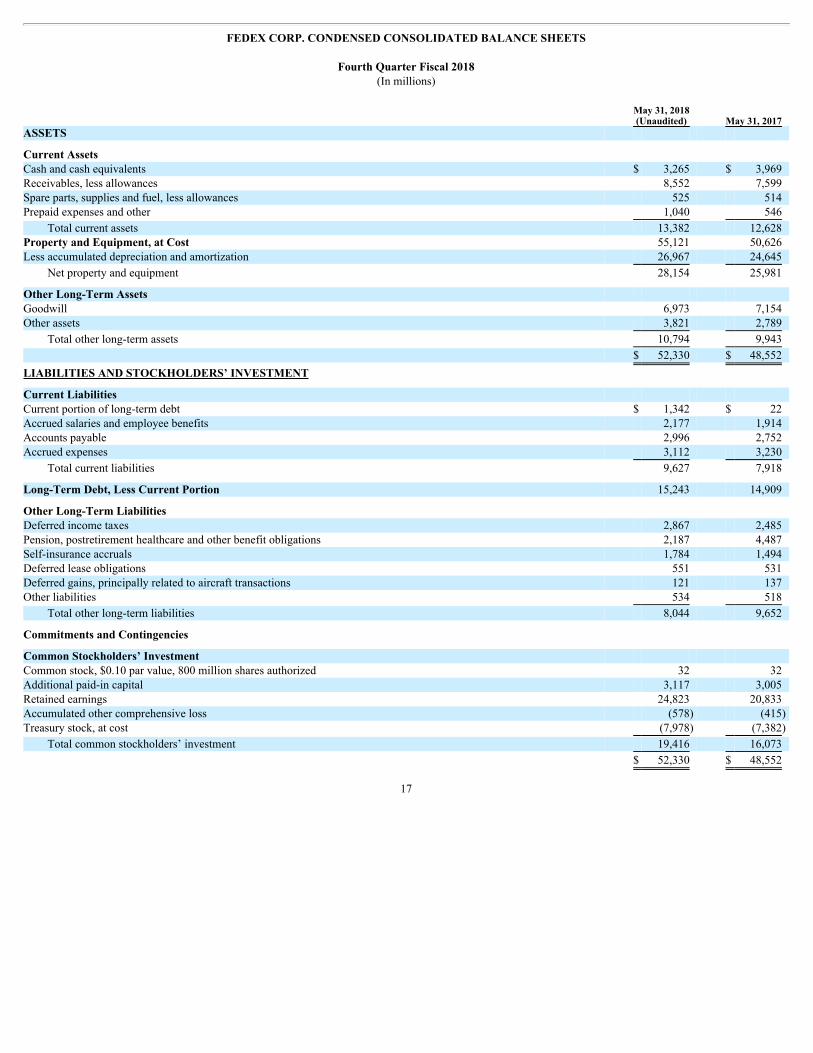
FEDEX CORP. CONDENSED CONSOLIDATED BALANCE SHEETS
Fourth Quarter Fiscal 2018(In millions)
May 31, 2018 (Unaudited) May 31, 2017 ASSETS
Current Assets Cash and cash equivalents $ 3,265 $ 3,969 Receivables, less allowances 8,552 7,599 Spare parts, supplies and fuel, less allowances 525 514 Prepaid expenses and other 1,040 546
Total current assets 13,382 12,628 Property and Equipment, at Cost 55,121 50,626 Less accumulated depreciation and amortization 26,967 24,645
Net property and equipment 28,154 25,981
Other Long-Term Assets Goodwill 6,973 7,154 Other assets 3,821 2,789
Total other long-term assets 10,794 9,943
$ 52,330 $ 48,552
LIABILITIES AND STOCKHOLDERS’ INVESTMENT
Current Liabilities Current portion of long-term debt $ 1,342 $ 22 Accrued salaries and employee benefits 2,177 1,914 Accounts payable 2,996 2,752 Accrued expenses 3,112 3,230
Total current liabilities 9,627 7,918
Long-Term Debt, Less Current Portion 15,243 14,909
Other Long-Term Liabilities Deferred income taxes 2,867 2,485 Pension, postretirement healthcare and other benefit obligations 2,187 4,487 Self-insurance accruals 1,784 1,494 Deferred lease obligations 551 531 Deferred gains, principally related to aircraft transactions 121 137 Other liabilities 534 518
Total other long-term liabilities 8,044 9,652
Commitments and Contingencies
Common Stockholders’ Investment Common stock, $0.10 par value, 800 million shares authorized 32 32 Additional paid-in capital 3,117 3,005 Retained earnings 24,823 20,833 Accumulated other comprehensive loss (578) (415) Treasury stock, at cost (7,978) (7,382)
Total common stockholders’ investment 19,416 16,073
$ 52,330 $ 48,552
17

FEDEX CORP. CONDENSED CONSOLIDATEDSTATEMENTS OF CASH FLOWS
Fiscal 2018(In millions)(Unaudited)
Year Ended May 31 2018 2017 Operating Activities:
Net income $ 4,572 $ 2,997 Noncash charges:
Retirement plans mark-to-market adjustment (10) (24) Goodwill and other asset impairment charges 380 — Depreciation and amortization 3,095 2,995 Other, net 182 1,199
Gain from sale of business (85) — Gain from sale of an investment — (35) Changes in operating assets and liabilities, net (3,460) (2,202)
Cash provided by operating activities 4,674 4,930
Investing Activities: Capital expenditures (5,663) (5,116) Business acquisitions, net of cash acquired (179) — Proceeds from sale of business 123 — Proceeds from asset dispositions and other 42 135
Cash used in investing activities (5,677) (4,981)
Financing Activities: Principal payments on debt (38) (82) Proceeds from debt issuances 1,480 1,190 Proceeds from stock issuances 327 337 Dividends paid (535) (426) Purchase of treasury stock (1,017) (509) Other, net 10 18
Cash provided by financing activities 227 528 Effect of exchange rate changes on cash 72 (42)
Net (decrease) increase in cash and cash equivalents (704) 435
Cash and cash equivalents at beginning of period 3,969 3,534
Cash and cash equivalents at end of period $ 3,265 $ 3,969
18

FEDEX EXPRESS SEGMENT FINANCIAL HIGHLIGHTS
Fourth Quarter Fiscal 2018(Dollars in millions)
(Unaudited) Three Months Ended Twelve Months Ended May 31 May 31 2018 2017 % 2018 2017 % Revenues:
Package Revenue: U.S. Overnight Box $1,900 $1,782 7% $ 7,273 $ 6,955 5% U.S. Overnight Envelope 471 463 2% 1,788 1,750 2%
Total U.S. Overnight 2,371 2,245 6% 9,061 8,705 4% U.S. Deferred 942 928 2% 3,738 3,526 6%
Total U.S. Package Revenue 3,313 3,173 4% 12,799 12,231 5%
International Priority 1,963 1,797 9% 7,356 6,940 6% International Economy 877 775 13% 3,255 2,876 13%
Total International Export Package 2,840 2,572 10% 10,611 9,816 8% International Domestic 1 1,201 1,090 10% 4,587 4,227 9%
Total Package Revenue 7,354 6,835 8% 27,997 26,274 7% Freight Revenue:
U.S. 757 632 20% 2,797 2,527 11% International Priority 598 516 16% 2,179 1,910 14% International Economy 562 473 19% 1,916 1,740 10% International Airfreight 92 85 8% 368 355 4%
Total Freight Revenue 2,009 1,706 18% 7,260 6,532 11% Other Revenue 235 281 (16%) 915 1,018 (10%)
Total Express Revenue $9,598 $8,822 9% $36,172 $33,824 7% Operating Expenses:
Salaries and employee benefits 3,365 3,135 7% 13,096 12,278 7% Purchased transportation 1,336 1,228 9% 5,109 4,721 8% Rentals and landing fees 485 482 1% 1,987 1,947 2% Depreciation and amortization 431 416 4% 1,679 1,662 1% Fuel 801 625 28% 2,889 2,378 21% Maintenance and repairs 430 398 8% 1,753 1,553 13% Intercompany charges 533 492 8% 2,045 1,886 8% Other 1,227 1,158 6% 5,036 4,630 9%
Total Operating Expenses 8,608 7,934 8% 33,594 31,055 8%
Operating Income $ 990 $ 888 11% $ 2,578 $ 2,769 (7%)
Operating Margin 10.3% 10.1% 0.2 pts 7.1% 8.2% (1.1 pts) 1 - International Domestic revenues represent international intra-country operations.
19
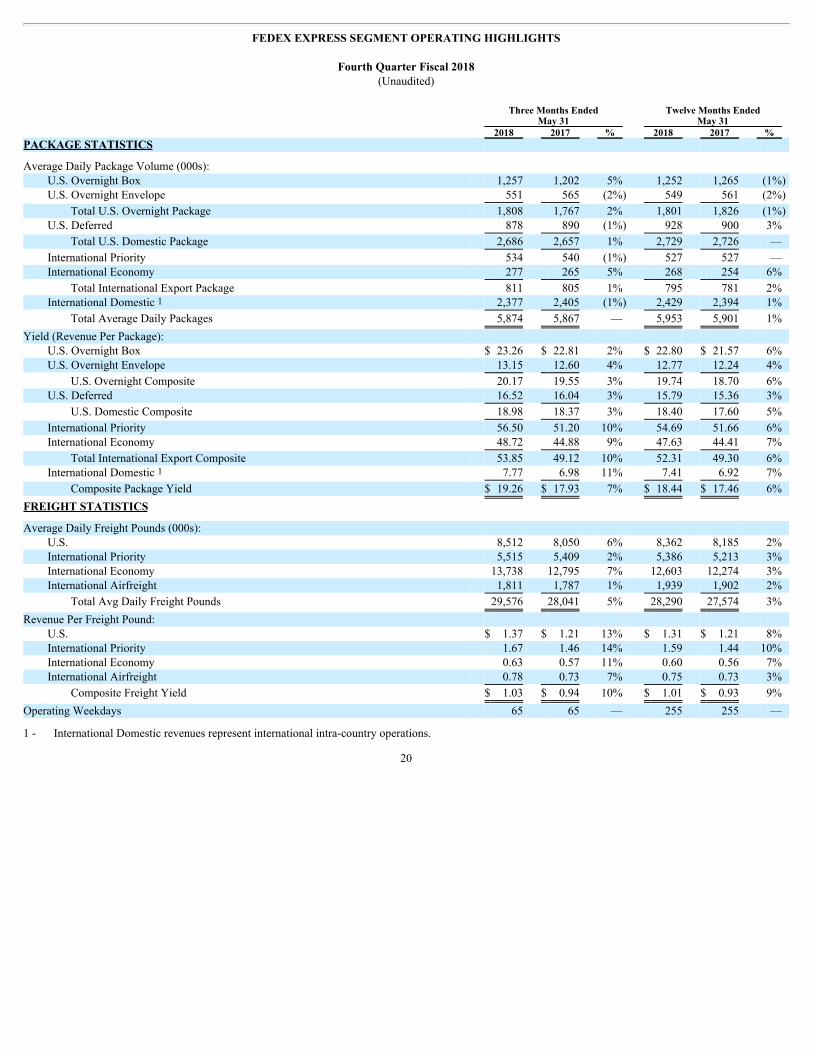
FEDEX EXPRESS SEGMENT OPERATING HIGHLIGHTS
Fourth Quarter Fiscal 2018(Unaudited)
Three Months Ended Twelve Months Ended May 31 May 31 2018 2017 % 2018 2017 % PACKAGE STATISTICS
Average Daily Package Volume (000s): U.S. Overnight Box 1,257 1,202 5% 1,252 1,265 (1%) U.S. Overnight Envelope 551 565 (2%) 549 561 (2%)
Total U.S. Overnight Package 1,808 1,767 2% 1,801 1,826 (1%) U.S. Deferred 878 890 (1%) 928 900 3%
Total U.S. Domestic Package 2,686 2,657 1% 2,729 2,726 —
International Priority 534 540 (1%) 527 527 — International Economy 277 265 5% 268 254 6%
Total International Export Package 811 805 1% 795 781 2% International Domestic 1 2,377 2,405 (1%) 2,429 2,394 1%
Total Average Daily Packages 5,874 5,867 — 5,953 5,901 1%
Yield (Revenue Per Package): U.S. Overnight Box $ 23.26 $ 22.81 2% $ 22.80 $ 21.57 6% U.S. Overnight Envelope 13.15 12.60 4% 12.77 12.24 4%
U.S. Overnight Composite 20.17 19.55 3% 19.74 18.70 6% U.S. Deferred 16.52 16.04 3% 15.79 15.36 3%
U.S. Domestic Composite 18.98 18.37 3% 18.40 17.60 5%
International Priority 56.50 51.20 10% 54.69 51.66 6% International Economy 48.72 44.88 9% 47.63 44.41 7%
Total International Export Composite 53.85 49.12 10% 52.31 49.30 6% International Domestic 1 7.77 6.98 11% 7.41 6.92 7%
Composite Package Yield $ 19.26 $ 17.93 7% $ 18.44 $ 17.46 6%
FREIGHT STATISTICS
Average Daily Freight Pounds (000s): U.S. 8,512 8,050 6% 8,362 8,185 2% International Priority 5,515 5,409 2% 5,386 5,213 3% International Economy 13,738 12,795 7% 12,603 12,274 3% International Airfreight 1,811 1,787 1% 1,939 1,902 2%
Total Avg Daily Freight Pounds 29,576 28,041 5% 28,290 27,574 3%
Revenue Per Freight Pound: U.S. $ 1.37 $ 1.21 13% $ 1.31 $ 1.21 8% International Priority 1.67 1.46 14% 1.59 1.44 10% International Economy 0.63 0.57 11% 0.60 0.56 7% International Airfreight 0.78 0.73 7% 0.75 0.73 3%
Composite Freight Yield $ 1.03 $ 0.94 10% $ 1.01 $ 0.93 9%
Operating Weekdays 65 65 — 255 255 —
1 - International Domestic revenues represent international intra-country operations.
20

FEDEX GROUND SEGMENT FINANCIAL AND OPERATING HIGHLIGHTS
Fourth Quarter Fiscal 2018(Dollars in millions)
(Unaudited) Three Months Ended Twelve Months Ended May 31 May 31 2018 2017 % 2018 2017 % FINANCIAL HIGHLIGHTS
Revenue $4,797 $4,296 12% $18,395 $16,503 11% Operating Expenses:
Salaries and employee benefits 745 653 14% 2,955 2,610 13% Purchased transportation 1,992 1,778 12% 7,936 7,177 11% Rentals 188 180 4% 754 696 8% Depreciation and amortization 177 162 9% 681 627 9% Fuel 2 2 — 12 10 20% Maintenance and repairs 82 78 5% 309 293 5% Intercompany charges 365 333 10% 1,443 1,316 10% Other 414 406 2% 1,700 1,495 14%
Total Operating Expenses 3,965 3,592 10% 15,790 14,224 11%
Operating Income $ 832 $ 704 18% $ 2,605 $ 2,279 14%
Operating Margin 17.3% 16.4% 0.9 pts 14.2% 13.8% 0.4 pts
OPERATING STATISTICS
Operating Weekdays 65 65 — 255 255 — Average Daily Package Volume (000s) 8,125 7,700 6% 8,336 7,896 6% Yield (Revenue Per Package) $ 9.05 $ 8.57 6% $ 8.63 $ 8.18 6%
21
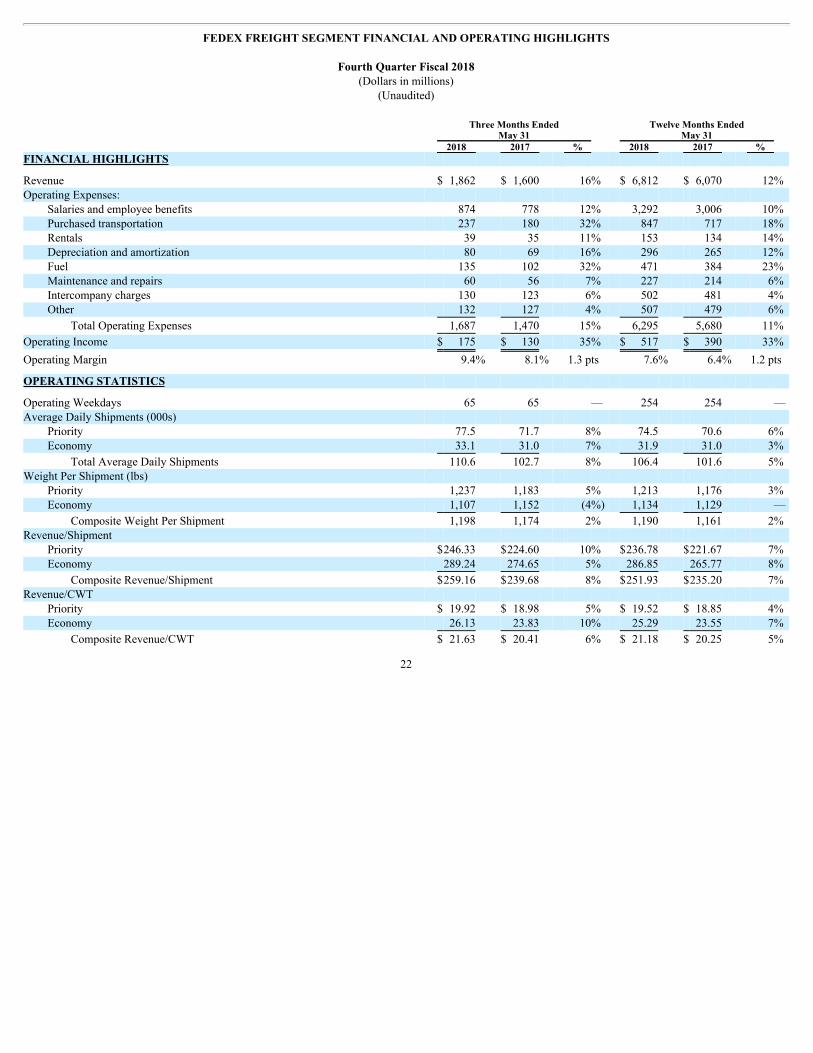
FEDEX FREIGHT SEGMENT FINANCIAL AND OPERATING HIGHLIGHTS
Fourth Quarter Fiscal 2018(Dollars in millions)
(Unaudited) Three Months Ended Twelve Months Ended May 31 May 31 2018 2017 % 2018 2017 % FINANCIAL HIGHLIGHTS
Revenue $ 1,862 $ 1,600 16% $ 6,812 $ 6,070 12% Operating Expenses:
Salaries and employee benefits 874 778 12% 3,292 3,006 10% Purchased transportation 237 180 32% 847 717 18% Rentals 39 35 11% 153 134 14% Depreciation and amortization 80 69 16% 296 265 12% Fuel 135 102 32% 471 384 23% Maintenance and repairs 60 56 7% 227 214 6% Intercompany charges 130 123 6% 502 481 4% Other 132 127 4% 507 479 6%
Total Operating Expenses 1,687 1,470 15% 6,295 5,680 11%
Operating Income $ 175 $ 130 35% $ 517 $ 390 33%
Operating Margin 9.4% 8.1% 1.3 pts 7.6% 6.4% 1.2 pts
OPERATING STATISTICS
Operating Weekdays 65 65 — 254 254 — Average Daily Shipments (000s)
Priority 77.5 71.7 8% 74.5 70.6 6% Economy 33.1 31.0 7% 31.9 31.0 3%
Total Average Daily Shipments 110.6 102.7 8% 106.4 101.6 5% Weight Per Shipment (lbs)
Priority 1,237 1,183 5% 1,213 1,176 3% Economy 1,107 1,152 (4%) 1,134 1,129 —
Composite Weight Per Shipment 1,198 1,174 2% 1,190 1,161 2% Revenue/Shipment
Priority $246.33 $224.60 10% $236.78 $221.67 7% Economy 289.24 274.65 5% 286.85 265.77 8%
Composite Revenue/Shipment $259.16 $239.68 8% $251.93 $235.20 7% Revenue/CWT
Priority $ 19.92 $ 18.98 5% $ 19.52 $ 18.85 4% Economy 26.13 23.83 10% 25.29 23.55 7%
Composite Revenue/CWT $ 21.63 $ 20.41 6% $ 21.18 $ 20.25 5%
22