Embed Size (px)
Citation preview
* Corresponding author: [email protected]
Feed Forward Neural Network Modeling for Rainfall Prediction
Hasbi Yasin1*, Budi Warsito2, Rukun Santoso3
1,2,3Department of Statistics, Faculty of Science and Mathematics, Diponegoro University, Semarang – Indonesia
Abstract. Prediction of rainfall data by using Feed Forward Neural Network (FFNN) model is proposed.FFNN is a class of neural network which has three layers for processing. In time series prediction, includingin case of rainfall data, the input layer is the past values of the same series up to certain lag and the outputlayer is the current value. Beside a few lagged times, the seasonal pattern also considered as an importantaspect of choosing the potential input. The autocorrelation function and partial autocorrelation functionpatterns are used as aid of selecting the input. In the second layer called hidden layer, the logistic sigmoid isused as activation function because of the monotonic and differentiable. Processing is done by the weightedsumming of the input variables and transfer process in the hidden layer. Backpropagation algorithm isapplied in the training process. Some gradient based optimization methods are used to obtain the connectionweights of FFNN model. The prediction is the output resulting of the process in the last layer. In eachoptimization method, the looping process is performed several times in order to get the most suitable resultin various composition of separating data. The best one is chosen by the least mean square error (MSE)criteria. The least of in-sample and out-sample predictions from the repeating results been the base ofchoosing the best optimization method. In this study, the model is applied in the ten-daily rainfall data ofZOM 136 Cokrotulung Klaten. Simulation results give a consecution that the more complex architectureis not guarantee the better prediction.
Keywords: rainfall; FFNN; prediction, RMSE
1. INTRODUCTIONNeural network modeling for rainfall prediction has
been rapidly developed in recent many years. Itdesiderated can respond the need of reliable modelling inrainfall prediction. Understanding the pattern of rainfalldata and get an accurate prediction are very importanttasks in hydrology and climate fields. Reliable rainfallprediction also give a great impact in forecasting therainfall data on daily, ten-daily or monthly and seasonaltime scales. It provide useful information for waterresource management, agricultural planning, andassociated crop insurance application significantimplications for food production, securing water suppliesfor major population centres, and minimizing flood risks.Some researches about rainfall prediction by usingneural network have been conducted conducted(Cigizoglu et al, 2009; Benmahdjouba et al., 2013; Asadiet al., 2013) [1-3]. Some other publications related tocomparison and developing new models also have beenconducted (Lin and Wu, 2009; Mekanik et al, 2013 ;Kim et al., 2016) [4-6]. In this research we applied FeedForward Neural Network (FFNN), a main class of neuralnetwork modelling, for rainfall prediction in ZOM 136Cokrotulung Klaten.
Some of the interesting parts of neural networkmodeling are procedures of determining the optimalinput, the number of hidden unit, the activation functionused in the hidden layer and the choosing ofoptimization method for obtaining the weights of the
network. Various procedures have been evolved forobtaining the most efficient and reasonable network inboth theoretically and practically. The optimizationtechnique for obtaining network weights is one of themain focus in neural network modelling. Variousstandard gradient based methods have been used toestimate the weights. Therefore, the activation functionpermitted in the hidden layer should be continue anddifferentiable functions. In this research, the logisticsigmoid and the linear function are used as activationfunctions in hidden layer and output layer, respectively.Various architecture have been conducted for choosingthe best one. In each architecture, the process is repeatedseveral times for getting the least Mean Square Error(MSE) as the based of choosing the best architecture.The three gradient based optimization are used tooptimize the neural network weights.
2. MATERIAL AND METHODSIn this section, the neural network model for time
series prediction is explained. Neural networkarchitecture consists of three layers namely input layer,hidden layer and output layer. Each layer has aconnection with the previous layer and called weight.Unlike in classification or regression problems, in neuralnetwork modelling for time series prediction the inputconsists of the past values of the same variable. Thelagged variables as input are determined by varioustechniques. Some researches employ the best ARIMA
https://doi.org/10.1051/e3sconf/201873 , (2018)E3S Web of Conferences 73ICENIS 2018
0 0505017 17
© The Authors, published by EDP Sciences. This is an open access article distributed under the terms of the Creative Commons Attribution License 4.0 (http://creativecommons.org/licenses/by/4.0/).

model for determining the input. While, the overfittingand underfitting technique also often be used asinquiring the alternative ones. Some other researchesutilize certain algorithm so that neural network model isfree-standing from other model. In this research the bestARIMA model is chosen for determining input.Architecture of neural network for time series predictionis described in Fig. 1. Output layer just have one neuronbecause of the univariate case. If the network is appliedin multivariate time series, the more than one neuron isneeded for describing the model.
Figure 1. Neural network architecture for time seriesprediction
In the form of mathematical model, the networkarchitecture can be described as follows.
(1)
where, is activation function at hidden layer and theweights vector of the network consists of weights frominput layer to hidden layer (wij), weights from bias tohidden layer (wbj), weights from hidden layer to output(wj), and weights from bias to output (wb). Therefore, thethree optimization methods often used in neural networkmodeling for time series prediction is briefly discussed.
Backpropagation algorithm in the FFNN modelconsists of three stages, namely feedforward of the inputpattern, calculating the error and adjusting the weights.In this algorithm, the initial weights are specified first.By the feedforward stage, the output of the initial pointsis calculated. Furthermore, the difference between outputand target, namely error, is found. Weights updating isdone by using a gradient based method for obtaining thesmaller error. The termination criteria are specified forstopping the iteration process. Maximum epochspermitted and minimum error reached are the two basicrules commonly used as the stopping criteria. In thisresearch we used the three gradient based methods forobtaining the weights of FFNN, that are GradientDescent, Levenberg-Marquardt and Quasi NewtonBFGS. Levenberg-Marquardt algorithm is a virtualstandard in nonlinear optimization. It is the most widelyused optimization algorithm. It outperforms simplegradient descent and other conjugate gradient methods in
a wide variety of problems. In many cases, it finds asolution even if it starts very far off the final minimum.It is a very popular curve-fitting algorithm used in manysoftware applications for solving generic curve-fittingproblems. However, as for many fitting algorithms, itfinds only a local minimum, which is not necessarily theglobal minimum. The Broyden–Fletcher–Goldfarb–Shanno (BFGS) method searches a stationary point of a(preferably twice continuously differentiable) function.A necessary condition for optimality of such problems isthat the gradient be zero. If the function has not aquadratic Taylor expansion near an optimum, the BFGSmethod is not guaranteed to converge. This method usesboth the first and second derivatives of the function.Gradient descent is a first-order optimization algorithm.To find a local minimum of a function, it need to takessteps proportional to the negative of the gradient (or ofthe approximate gradient) of the function at the currentpoint. Momentum method is an extension of Gradientdescent method, that reduces the risk of a getting stuckin a local minimum, as well as speeds up theconvergence considerably in cases where the processwould otherwise zigzag heavily. Momentum simply addsa fraction of the previous weight update to the currentone. When the gradient keeps pointing in the samedirection, this will increase the size of the steps takentowards the minimum. It is therefore often necessary toreduce the global learning rate when we use a lot ofmomentum.
3. RESULTS AND DISCUSSIONProcedure of neural network modelling by
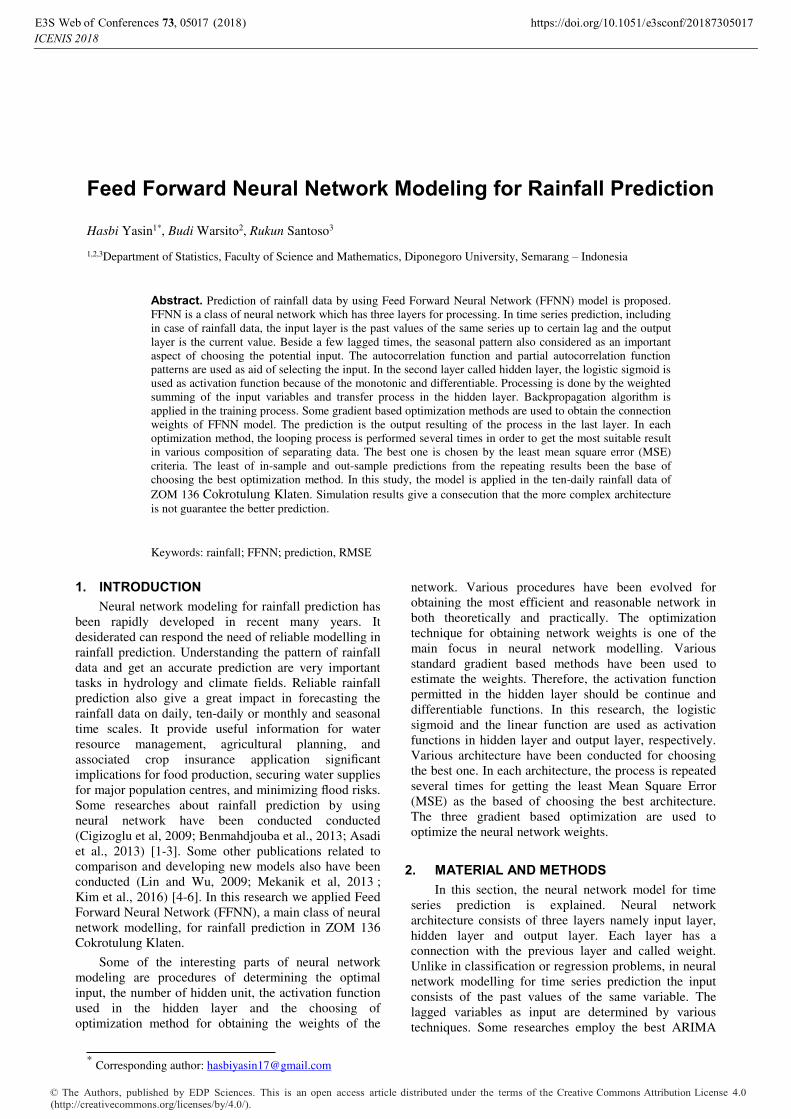
using standard gradient based optimization methods isapplied in the ten-daily rainfall data of ZOM 136Cokrotulung, Klaten, Central Java Indonesia fromJanuary 2010 until July 2018 with the length of 309. Wetried to divide the data into two parts with various ways.In the first experiment, the first 216 data (70%) is usedas training and the remaining 93 data (30%) as testing. Inthe second experiment, the first 247 data (80%) is usedas training and the remaining 62 data (20%) as testing,and the last experiment the first 278 data (90%) is usedas training and the remaining 31 data (10%) as testing. Ineach composition, the same architecture is repeated for30 times with 1-10 hidden units, respectively. Theactivation function used in hidden layer is logisticsigmoid. The maximum number of epochs in eachexperiment is 1000. The minimum root mean squareerror of each architecture is chosen for obtaining the bestone. We need to refer to the values of the series inprevious periods as the input. Determining laggedvariables as input is performed by ARIMA model. Inearly step, the investigations resulting the laggedvariables of 1, 2 and 18 as input. The summarize of theprocesses is shown in Table 1 whereas plot of the in-sample prediction of training data and plot of the out-sample prediction of testing data by using the FFNNmodel in one of the iterations in the composition of80:20 are shown in Fig. 1 and Fig. 2.
https://doi.org/10.1051/e3sconf/201873 , (2018)E3S Web of Conferences 73ICENIS 2018
0 0505017 17
2

* Corresponding author: [email protected]
0 50 100 150 200 2500
50
100
150
200
250
300
350
400Perbandingan Target & Output Data Training
Input
Targ
et/O
utpu
t
TargetOutput
Figure 1. Plot of the in-sample prediction of training databy using FFNN model of rainfall data in ZOM 136
0 10 20 30 40 50 60 700
50
100
150
200
250
300Perbandingan Target & Output Data Testing
Input
Targ
et/O
utpu
t
TargetOutput
Figure 2. Plot of the out-sample prediction of testing databy using FFNN model of rainfall data in ZOM 136
Table 1. MSE of the simulation results of the FFNN modelling for rainfall data in ZOM 136
MethodNumber of
hidden unitsMSE (70:30) MSE (80:20) MSE (90:10)
training testing training testing training testingLevenbergMarquardt
1 4.1188 2.8422 3.9301 2.8022 3.8221 2.53142 3.5636 2.6539 3.4541 2.7730 3.4382 2.55823 3.3426 3.7274 3.0883 3.4473 3.2104 3.24084 2.9685 3.2851 2.7897 3.2876 2.8928 3.34595 2.6997 3.7548 2.6816 3.8313 2.6995 3.30356 2.4385 4.5895 2.5553 4.0972 2.4444 4.09757 2.1505 4.6786 2.2640 4.4995 2.2861 5.24268 2.6979 4.2517 2.1055 3.7509 2.1644 3.69589 1.8876 6.6311 1.9329 4.7806 1.9265 3.120810 1.6476 5.2667 1.8566 4.7764 1.9886 6.3686
BFGS 1 4.1188 2.8422 3.9301 2.8022 3.8221 2.53142 3.5524 3.1232 3.4511 2.8181 3.4029 2.46013 3.3454 3.0057 3.2613 3.6890 3.1349 3.30954 3.0568 3.9355 2.8354 3.3102 2.8291 4.44335 2.6979 4.2517 2.7289 4.4600 2.6751 3.17946 2.4150 5.1342 2.4647 4.1706 2.4924 3.24627 2.1589 6.9416 2.1668 6.4382 2.2689 3.52148 1.9230 8.3038 1.9874 5.9726 2.2900 4.79239 2.0186 11.876 1.8498 3.1678 2.1067 5.139410 1.7660 3.0204 1.8990 14.397 2.0371 3.5021
GradientDescent
1 4.2300 2.6353 4.0235 2.7166 3.9598 2.49102 4.3406 2.9412 4.0891 2.9414 3.9255 2.58813 4.1520 2.9953 4.0321 2.6888 3.9116 2.48904 4.0773 2.8096 3.9594 3.0428 3.8149 2.62795 4.1800 2.8265 3.8858 2.7964 3.8464 2.75566 4.1005 2.7761 3.9106 2.6953 3.7502 2.51047 3.9610 3.2023 3.8622 2.7936 3.7699 2.40188 3.9977 2.8670 3.8305 2.9564 3.7324 2.48159 3.8898 2.8154 3.8532 2.8782 3.7338 2.560410 3.9750 2.5958 3.8829 2.7293 3.7003 2.6720
https://doi.org/10.1051/e3sconf/201873 , (2018)E3S Web of Conferences 73ICENIS 2018
0 0505017 17
3

* Corresponding author: [email protected]
Fig. 1 shows the actual versus in-sample
prediction of FFNN model in the rainfall data of ZOM
136. Generally, the seasonal pattern of the in-sample data
can be followed by the prediction. The period of
repetitive phenomena between both data are the same.
None the worse, the model has a blind side. There are
still several points far from as proper. Some points that
cannot be reached by the model are the extreme values. It
needs more extensive discussion for using the more
suitable optimization methods for optimizing neural
network related to the data type. The further open
question also can be discussed about the more
appropriate model for the data type. Similarly, the graph
of testing data versus out-sample prediction in Fig. 2 also
shows the resemblance between the two. Actual data
which has an extreme value cannot be reached by the
prediction but in general the out-sample prediction can
keep abreast the pattern of actual data.
The results of Table 1 show that a better in-
sample prediction is not give a guarantee that the out-
sample also better. In consequence, we should make
decision of fitting the best one by using the two criteria,
both in-sample and out-sample predictions. For the first
composition, the 70% as training and 30% as testing, it is
reasonable if we choose architecture with ten neurons in
hidden layer and BFGS as optimization technique for
constructing the selected one. The in-sample prediction
has minimum of mean square error, while the out-sample
prediction give a near the least one. Similar reason is
considerable for choosing architecture which has nine
neurons and BFGS optimization as the best architecture
of the second composition. In the third separation, 90%
as training and 10% as testing, selecting the optimal
number of hidden units is debatable. The one choice is
two hidden neurons -it is more balance between in-
sample and out-sample- and the other one is nine hidden
neurons. Both of them use Levenberg Marquardt as
optimization method. The decision is depended on
various factors. If the simplicity, parsimony and balanced
results take into consideration, the first choice is better.
The second choice is good for considering the strong
capability in-sample prediction.
4. CONCLUSIONProcedure of rainfall prediction by utilizing Feed
Forward Neural Network has been developed. The more
complex network architecture not give a guarantee of a
better prediction result. Levenberg Marquardt and BFGS
algorithm can be regarded as the main optimization
methods whereas Gradient Descent is not recommended
for the data type. Comparison of the results with the
other technique like heuristic optimization can be
regarded as an interesting problem for the future work.
5. ACKNOWLEDGEMENTThe authors would like to thank the Ministry of
Research, Technology and High Education Republic of
Indonesia which has provided research grants of PDUPT
Research Grant Program No. 101-24/UN7.P4.3/PP/2018
date 5 Pebruary 2018.
REFERENCES
1. Asadi, S., Shahrabi, J., Abbaszadeh, P.,
Tabanmehr, S., 2013, A new hybrid artificial
neural networks for rainfall–runoff process
modeling, Neurocomputing, 121, pp 470–480
2. Benmahdjouba, K., Ameura, Z., Boulifa, M., 2013,
Forecasting of Rainfall using Time Delay Neural
Network in Tizi-Ouzou (Algeria), Energy Procedia
36 ( 2013 ) 1138 – 1146
3. Cigizoglu, H.,K., Askin., P., Ozturk, A., Gurbuz,
A., Ayhan, O., Yildiz, M and Ucar, I., 2008,
Artificial Neural Network Models in Rainfall-
Runoff Modelling of Turkish Rivers, International
Congress on River Basin Management, pp. 560-571
4. Kim, S., Seo, Y., and Lee, C.J., 2016, Modeling of
Rainfall by Combining Neural Computation and
Wavelet Technique, Procedia Engineering, 154: pp
1231-1236
5. Lin, G.F dan Wu, M.C., 2009, A hybrid neural
network model for typhoon-rainfall forecasting,
https://doi.org/10.1051/e3sconf/201873 , (2018)E3S Web of Conferences 73ICENIS 2018
0 0505017 17
4

Journal of Hydrology 375 (2009) 450–458 (SOM
&MLP)
6. Mekanik, F., Imteaz, M.A., Trinidad, S.G.,
Elmahdi, A., 2013, Multiple Regression and
Artificial Neural Network for Long-Term Rainfall
Forecasting Using Large Scale Climate Modes,
Journal of Hydrology 503 (2013) 11–21
7. Wang, Y.M. and Traore, S., 2009, Time-lagged
recurrent network for forecasting episodic event
suspended sediment load in typhoon prone area,
International Journal of Physical Sciences Vol. 4
(9), pp. 519-528, Available online at
http://www.academicjournals.org/ijps
8. Yasin, H., 2014, Prediction of Weekly Rainfall in
Semarang City use Support Vector Regressions,
Prosiding Seminar Internasional the 4th ISNPINSA,
Hotel Patra Jasa Semarang
9. Yasin, H. dan Prahutama, A., 2015, Prediction of
Weekly Rainfall in Semarang City Use Support
Vector Regression (SVR) with Quadratic Loss
Function, International Journal of Science and
Engineering (IJSE), ISSN: 1086-5023, Vol. 9 No.1
https://doi.org/10.1051/e3sconf/201873 , (2018)E3S Web of Conferences 73ICENIS 2018
0 0505017 17
5