Embed Size (px)
Citation preview

Based on planting intentions from USDA’s NASS Prospective Plantings report and a weather-adjusted trend yield, corn production for 2015/16 is projected down 4 percent from 2014/15. The rapid pace of spring plantings—75 percent planted in the 18 major corn-producing States as of May 10 as compared to 55 percent in the previous year—is not expected to be a major factor in yield determination. Rather, summer weather has historically played a larger role in the variation in observed yields. Sorghum, barley, and oats production are projected to be up modestly for the 2015/16 marketing year. Sorghum exports in 2015/16 are anticipated to remain strong at 335 million bushels. Despite planting delays in Texas, early new-crop sorghum supplies are expected to be adequate to augment available 2014 old-crop supplies and support the 2014/15 export projection of 350 million bushels. World coarse grain beginning stocks for 2015/16 are forecast at 227.8 million tons, up 17.0 million from a year earlier and the largest in 15 years. The stocks increase swamps the 7.5-million-ton reduction in production, leaving global coarse grain supplies in 2015/16 up 9.6 million tons to a record 1,505.1 million. Global coarse grain feed and residual use is projected to increase a modest 1.6 percent in 2015/16 to a record 774.9 million tons. Growth in industrial use of coarse grains has slowed as biofuels produced from grain have become less fashionable and declining petroleum prices make them less economic. The increased 2015/16 use balances the increased supply, leaving world coarse grain ending stocks nearly unchanged from beginning stocks. However, more of those stocks are held in China. Recent Feed Outlook Special Articles “Boutique Brews, Barley, and the Balance Sheet,” pdf pages 18-23 of the January 2015 Feed Outlook report (http://www.ers.usda.gov/publications/fds-feed-outlook/fds-15a.aspx). “World Corn Use Expands Despite High Prices in 2012/13,” pdf pages 17-22 of the June 2013 Feed Outlook report (http://www.ers.usda.gov/publications/fds-feed-outlook/fds-13f.aspx). “Animal Unit Calculations—First Projections for the 2013/14 Crop Year,” pdf pages 25-30 of the May 2013 Feed Outlook report (http://www.ers.usda.gov/publications/fds-feed-outlook/fds-13e.aspx).
Feed Outlook Tom Capehart [email protected] Edward Allen [email protected] Jennifer Bond [email protected] U.S. 2015 Corn Production Projected Below 2014 Record, Corn Prices To Remain Weak
Economic Research Service Situation and Outlook FDS-15e May 14, 2015
Feed Chart Gallery will be updated on May 14, 2015 The next release is June 12, 2015 -------------- Approved by the World Agricultural Outlook Board.

Domestic Outlook
2 Feed Outlook/FDS-15e/May 14, 2015
Economic Research Service, USDA
Projected 2015/16 Corn Production Down 4 Percent U.S. corn planted area for 2015/16 is expected at 89.2 million acres, 1.4 million acres less than 2014/15 sown area, based on planting intentions published by USDA’s National Agricultural Statistics Service (NASS) in the March 31 Prospective Plantings report. If realized, this will be the third consecutive year of acreage decline and the lowest planted acreage in the United States since 2010. Harvested acreage is projected at 81.7 million acres, 2 percent less than 2014/15 and 92 percent of intended planted acres. Yields for 2015/16 are based on a weather-adjusted trend yield. At 166.8 bushels per acre, projected yields are 4.2 bushels per acre below the 2014 record of 171.0 bushels per acre. The weather-adjusted trend yield assumes average planting progress as of mid-May and normal summer weather. The yield is not adjusted for this spring’s rapid planting progress since summer weather plays a larger role in determining yields. Production for 2015/16 is projected at 13.6 billion bushels, 586 million bushels below the 2014/15 estimate. As of May 10, 75 percent of the corn crop had been planted in the 18 major corn-producing States included in the NASS Crop Progress survey. This share is up 55 percent from the same date last season and well ahead of the 2010-14 average of 57 percent. Nine of the 18 corn-producing States surveyed had year-to-year increases in planting progress of over 20 percent. In the northern belt, planting progress was 50 percent or more over last year for a number of States. Likewise, corn emergence is also ahead of last year. In the 18 States surveyed by NASS, 29 percent of the crop planted had emerged, compared with 16 percent for the 2014 crop at this point. Average emergence for 2010-14 was 24 percent at this point. In Illinois, one of the largest corn-producing States, emergence was 10 percent greater than last year at 42 percent. Corn Supply Forecast up for 2015/16 Production, the largest component of the U.S. corn supply, is projected at 13,630 million bushels, 586 million below the record crop in 2014/15, and would be the second-highest ever. Corn supplies, at 15,506 million bushels in 2015/16, are forecast 33 million bushels higher than the previous year. Although production is expected lower than in 2014/15, beginning stocks at 1,851 million bushels add 619 million bushels to supply. Corn Use Forecast up on Higher Feed and Residual, Exports, and Food, Seed, and Industrial Use Both domestic use and export forecasts for 2015/16 increase compared to 2014/15. Total use in 2015/16 is projected at 13,760 million bushels. Feed and residual use is projected up 50 million bushels year-to-year. Within food, seed, and industrial (FSI) use, ethanol is forecast unchanged from 2014/15 at 5,200 million bushels, sweeteners are steady at 750 million bushels, and starch is forecast up 10 million bushels to 240 million on higher expected use for construction and packaging. Total forecast FSI use is 6,560 million bushels, 13 million higher than 2014/15.

Domestic Outlook
3 Feed Outlook/FDS-15e/May 14, 2015
Economic Research Service, USDA
For 2014/15, FSI is reduced 48 million bushels to 6,547 million due to reduced corn used for high fructose corn syrup and starch, as indicated by year-to-date shipments. Corn used for glucose and dextrose was raised 10 million bushels this month. Competitive U.S. prices and growth in global demand support 2015/16 export prospects of 1,900 million bushels, 75 million bushels over the 2014/15 projection. For 2014/15, exports are raised 25 million bushels this month to 1,825 million based on the strong pace of recent inspections and shipments. Japan and Mexico remain the top destinations, but Colombia and Peru are up significantly year-to-year. Ending Stocks Projected Below 2014/15 Level At 1,746 million bushels, ending stocks for 2015/16 are projected 105 million below the 2014/15 forecast. For 2014/15, disappearance was lowered this month, boosting stocks by 24 million bushels. Corn Price Projected Lower With Higher 2014/15 Stocks The high end of the corn farm price forecast range in 2014/15 is lowered by 10 cents for a new midpoint of $3.65 per bushel, compared with $4.46 per bushel in 2013/14. Recent weakness in cash price bids and higher domestic ending stocks are behind the lower price outlook. The corn farm price range for 2015/16 is projected at $3.20 to $3.80 per bushel, for a midpoint of $3.50 per bushel. Few opportunities have been available in 2015 to forward price 2015 crop corn at prices above $4.00 per bushel. Feed Grain Supply and Use U.S. feed grain production for 2015/16 is forecast at 362.6 million metric tons, 14.3 million less than a year earlier, reflecting decreased corn production. Planted area for the four feed grains is projected down just slightly from 2014, with increases for sorghum, barley, and oats mostly offsetting the reduction in corn plantings. Feed grain yields per harvested acre are expected 3 percent lower than last year at 3.93 tons per acre, with an assumed return to trend yields. Combined with increased beginning stocks and slightly reduced forecast imports, supplies are projected at 415.2 million tons, 1.0 million higher than 2014/15. Total feed grain use in 2015/16 is projected at 368.2 million tons, 3.7 million above forecast use in 2014/15 due to expected higher use for feed and residual, FSI, and exports. Total disappearance in 2014/15 is forecast 0.5 million tons lower this month as reduced domestic use more than offsets increased exports. Feed and Residual Use On a September-August marketing year basis for 2015/16, U.S. feed and residual use for the four feed grains plus wheat is projected to total 144.3 million tons, up

Domestic Outlook
4 Feed Outlook/FDS-15e/May 14, 2015
Economic Research Service, USDA
2.6 million from the revised total of 141.8 million tons in 2014/15. Corn is forecast to account for 93 percent of feed and residual use, down from 94 percent in 2014/15. The projected index of grain-consuming animal units (GCAU) in 2015/16 is 94.7 million, up 1.5 million from 93.2 million in 2014/15. Feed and residual per GCAU is estimated at 1.52 tons, nearly unchanged from 2014/15. In the index components, GCAUs are increased for beef and dairy cattle, poultry, and pork. The forecasts for total meat and poultry production for 2015 are raised from last month, and 2016 is projected higher than the current year. For both 2015 and 2016, beef placements are higher due to larger calf crops boosting cattle placements in 2015 and 2016. Moderate increases in farrowings and increases in pigs per litter are projected to boost pork production in late 2015 and early 2016. Broiler production in 2015 is set to increase, and turkeys decline from last month’s projection. However, in 2016, both broilers and turkey production are forecast higher. Egg production is lowered for 2015 this month but expected higher for 2016 as problems with avian influenza are expected to be outweighed by favorable egg prices and moderate feed costs. Sorghum Production up Slightly for 2015/16 An 11-percent increase in sorghum planted area, as reported in the March Prospective Plantings report, supports a modest year-to-year increase in total U.S. sorghum production for 2015/16. Sorghum production is anticipated to reach 435 million bushels, up just slightly from the 2014/15 estimate of 433 million bushels. The relatively small gain in production, despite the more substantial gain in planted area, is attributable to a projected decline in yields. The 2015/16 yield estimate is based on average yields for 1990-2014, excluding years that are more than one standard deviation from the mean for the period. Abundant topsoil and subsurface moisture in Texas, where much of the U.S. sorghum crop is cultivated, is likely to boost regional yield prospects and may lift the national average above the current projection. If dry conditions, similar to those experienced in the 2012/13 marketing year, return to the major sorghum-producing States of Texas and Kansas, lower yields may result. From 2010 to 2014, the national yield averaged 60.5 bushels per acre, with a standard deviation of 8.3 bushels, indicative of a high degree of year-to-year yield variability and sensitivity to underlying horticultural variables. The 2015/16 trade forecast is supportive of robust and ongoing trade with China. In the new marketing year, fully 335 million bushels of the estimated 452-million-bushel sorghum supply, or 74 percent, is anticipated to be used for export. Industry sources have recently speculated that China is increasing inspections of U.S. sorghum at Chinese ports, thereby raising the probability of a phytosanitary issue being reported, potentially resulting in a rejected shipment. However, as speculation that the likelihood of such actions has increased, U.S. shipments to China have continued mostly apace, supporting a continued outlook for robust 2015/16 trade. In the forthcoming marketing year, sorghum feed and residual is projected to be equal to the 2014/15 figure at 85 million bushels. Likewise, FSI use, including for fuel ethanol, are unchanged from the current marketing year projection of 15 million bushels. Expectations of strong export market demand, coupled with

Domestic Outlook
5 Feed Outlook/FDS-15e/May 14, 2015
Economic Research Service, USDA
abundant corn supplies, are poised to support use patterns in 2015/16 that mimic those of 2014/15. As in the present marketing year, the sorghum season-average farm price is anticipated to exceed the corn price; a 30 cent sorghum premium is projected for 2015/16. The average sorghum farm price range for 2015/16 is $3.40 to $4.20 per bushel with a midpoint of $3.80 per bushel. This sorghum price is 108.6 percent of the projected corn price and is slightly lower than the 2014/15 price ratio of 109.5 percent. According to the most recent NASS Crop Progress report, sorghum planting progress is behind last year’s pace in Texas, where field days have been limited by rains and saturated soils. For the week ending May 10, 2015 (week 19), Texas growers had planted 64 percent of the 2014 acreage; this compares to the previous week’s 63 percent; the May 10, 2014, planting progress of 79 percent; and the 5-year average of 74 percent. From all angles, progress in Texas is relatively slow and has not been accelerating in recent weeks. Post-week 19 planting in 2014 and 2013 averaged increases in progress ranging from 1 to 8 percent, with the average weekly gain 2.4 and 4.6 percent, respectively. With 7.5 weeks remaining in the normal Texas planting season, planting progress akin to the 2013 and 2014 averages will support plantings equivalent to 82 and 98 percent of the 2014 area. If not offset by increased yields, reduced plantings will ultimately reduce the size of the Texas crop and the amount of new crop sorghum available to export before the September 1 start of the 2015/16 marketing year. Gains in Planted Area Support Barley Production Boost Undeterred by last season’s crop-damaging-weather nationwide, growers indicate intensions to plant nearly 10 percent more acres to barley in 2015 as compared to 2014. Producers in key barley-growing States Idaho, North Dakota, and Minnesota intend to increase planted area by 4 percent, 45 percent, and 20 percent, respectively; Montana barley planted area is expected to be identical to the 2014 estimate at 920,000 acres and account for 28 percent of total U.S. planted area in 2015. Gains in planted area, and resultant harvested area, combine with yields based on the 1990-2014 trend to return a production projection of 198 million bushels. If realized, the 2015/16 crop will be 22 million bushels, or approximately 12 percent larger than the 2014/15 crop. Planting of the 2015 barley crop is rapidly nearing completion with the five States reporting 88 percent of the crop in the ground as of the week ending May 10, 2015 (week 19). On the same date in 2014, just 54 percent of the crop was planted, slightly behind the 5-year average of 58 percent. Earlier planted barley has a lower risk of being frost damaged as harvest approaches. Notably, North Dakota barley is 76 percent planted, as compared to 6 percent planted by the same date in 2014. Late planted barley in North Dakota was damaged by adverse weather conditions in August and September 2014. On the 2015/16 balance sheet, production gains and imports (up 1 million bushels) are partly offset by reduced carry-in (down 5 million bushels), contributing to a total supply of 301 million bushels, up 18 million from 2014/15. Feed and residual use in 2015/16 is projected 20 million bushels larger than the 2014/15 forecast, with higher expected production. FSI use is projected up slightly from the 2014/15 estimate, largely based on the increasing proportion of malt-intensive craft beer

Domestic Outlook
6 Feed Outlook/FDS-15e/May 14, 2015
Economic Research Service, USDA
production. Use of imported malt and malt products slightly reduces the projected impact of craft expansion on malt barley demand. Prices received by farmers for barley in 2015/16 are expected to average $4.10 to $4.90 per bushel, with a midpoint of $4.50 per bushel. This compares to the 2014/15 average of $5.30 per bushel and mostly reflects lower year-to-year contract prices for malting barley. For comparison, North Dakota State University’s Farm Management Planning Guide indicates that the simple average price for malting barley in 2015/16 is anticipated to be $4.69 per bushel, with variation by region. Oats Production up Slightly in 2015/16 The March Prospective Plantings report indicates that area seeded to oats in 2015 is expected to be up 8 percent to 2.931 million acres. Gains in key dairy States Wisconsin and California combine with slight increases in many other States. Modest gains are offset somewhat by sizable year-to-year reductions in Iowa, Texas, Oregon, and Wyoming. Record-low plantings are anticipated for the latter three States. Harvested area for 2015/16 is set to increase to 1.10 million acres, up from 1.03 million for 2014/15 and, once multiplied by trend (1990-2014) yields of 65.5 bushels per acre, result in anticipated production of 72 million bushels. Total U.S. oats supply for 2015/16 is projected at 210 million bushels. Total oats use in 2015/16 is projected at 174 million bushels, up from 164 million in 2014/15. At 95 million bushels, feed and residual use is 10 million bushels higher than the previous year’s forecast. FSI use is projected at 77 million bushels, identical to the 2014/15 forecast and reflective of stagnant demand for oats for use in food manufacturing. Exports of oats are projected at 2 million bushels. A slight increase in 2014/15 imports this month boosts supply by 4 million bushels to 201 million; exports are reduced by 300,000 bushels and ending stocks are raised by the aggregated difference, 4.3 million bushels to 37.7 million, now the fourth-lowest ending stocks on record, including the 2015/16 projection. Ending stocks are expected to be 35.7 million bushels in 2015/16, a slight decrease from the 2014/15 carry-out projection and the second-lowest carryout on record. A significant decline in the season-average oats price is forecast for the 2015/16 marketing year. The decline follows multiple years of relatively high oats prices, driven, in part, by logistics between Canada and the United States. Recently, oats futures prices have dropped significantly and the oats price outlook puts oats prices more in line with historical relationships between oats and other feed grains. A year-to-year decline in corn and other grain prices puts downward pressure on the oats prices, now projected at $2.00 to $2.60 per bushel, with a midpoint price projection of $2.30 per bushel.
Hay Stocks Report Indicates More Abundant 2015 Supplies The May 12 NASS Crop Production report indicates that U.S. hay stocks on farms on May 1, 2015, totaled 24.5 million tons, a 28-percent increase over the 2014 figure of 19.2 million. With December 1, 2015, stocks reported at 92.0 million tons, the implied December-May disappearance is 67.5 million, down from a

Domestic Outlook
7 Feed Outlook/FDS-15e/May 14, 2015
Economic Research Service, USDA
disappearance of 70.1 million reported for the same period in 2013/14. Improved weather conditions in 2014 supported increased hay production, with some notable exceptions observed in areas of the Northeast where production was delayed due to winter-like weather that persisted through early spring. For 2015, producers intend to harvest 57.093 million acres of all types of hay, nearly identical to the area harvested in 2014. Prices for the 2014/15 marketing year are $180 per ton for all hay, up from the 2013/14 price of $176.
International Outlook
8 Feed Outlook/FDS-15e/May 14, 2015
Economic Research Service, USDA
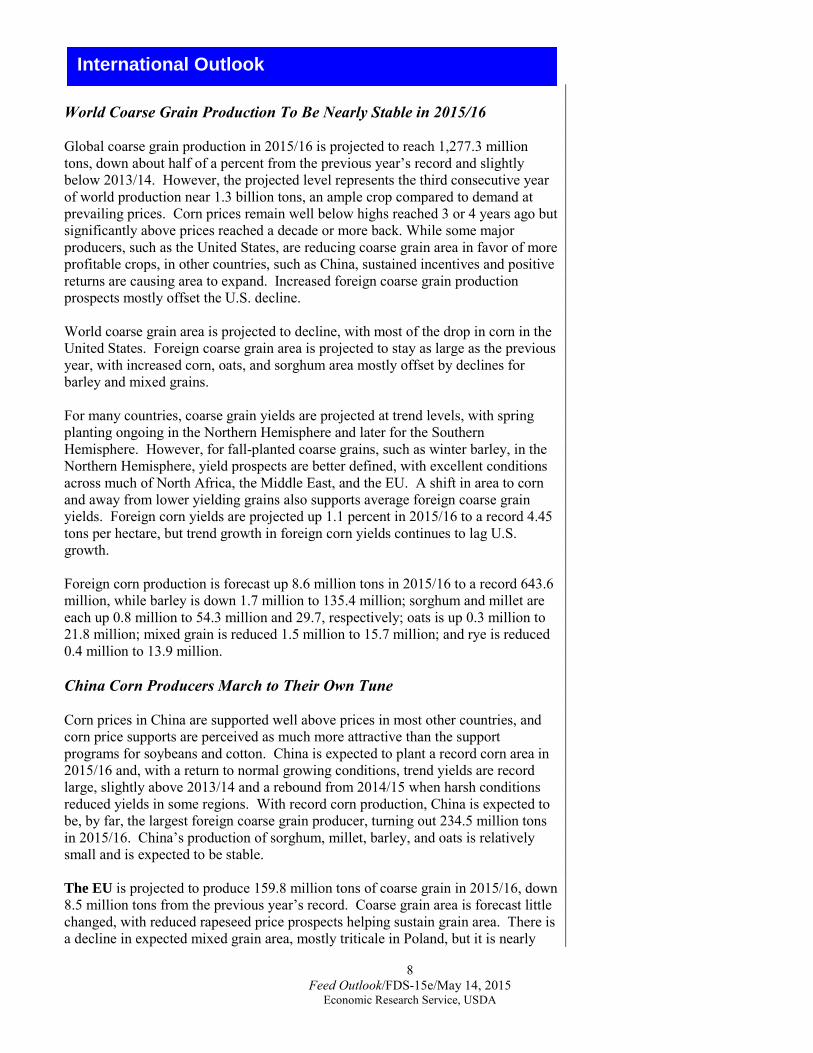
World Coarse Grain Production To Be Nearly Stable in 2015/16 Global coarse grain production in 2015/16 is projected to reach 1,277.3 million tons, down about half of a percent from the previous year’s record and slightly below 2013/14. However, the projected level represents the third consecutive year of world production near 1.3 billion tons, an ample crop compared to demand at prevailing prices. Corn prices remain well below highs reached 3 or 4 years ago but significantly above prices reached a decade or more back. While some major producers, such as the United States, are reducing coarse grain area in favor of more profitable crops, in other countries, such as China, sustained incentives and positive returns are causing area to expand. Increased foreign coarse grain production prospects mostly offset the U.S. decline. World coarse grain area is projected to decline, with most of the drop in corn in the United States. Foreign coarse grain area is projected to stay as large as the previous year, with increased corn, oats, and sorghum area mostly offset by declines for barley and mixed grains. For many countries, coarse grain yields are projected at trend levels, with spring planting ongoing in the Northern Hemisphere and later for the Southern Hemisphere. However, for fall-planted coarse grains, such as winter barley, in the Northern Hemisphere, yield prospects are better defined, with excellent conditions across much of North Africa, the Middle East, and the EU. A shift in area to corn and away from lower yielding grains also supports average foreign coarse grain yields. Foreign corn yields are projected up 1.1 percent in 2015/16 to a record 4.45 tons per hectare, but trend growth in foreign corn yields continues to lag U.S. growth. Foreign corn production is forecast up 8.6 million tons in 2015/16 to a record 643.6 million, while barley is down 1.7 million to 135.4 million; sorghum and millet are each up 0.8 million to 54.3 million and 29.7, respectively; oats is up 0.3 million to 21.8 million; mixed grain is reduced 1.5 million to 15.7 million; and rye is reduced 0.4 million to 13.9 million. China Corn Producers March to Their Own Tune Corn prices in China are supported well above prices in most other countries, and corn price supports are perceived as much more attractive than the support programs for soybeans and cotton. China is expected to plant a record corn area in 2015/16 and, with a return to normal growing conditions, trend yields are record large, slightly above 2013/14 and a rebound from 2014/15 when harsh conditions reduced yields in some regions. With record corn production, China is expected to be, by far, the largest foreign coarse grain producer, turning out 234.5 million tons in 2015/16. China’s production of sorghum, millet, barley, and oats is relatively small and is expected to be stable. The EU is projected to produce 159.8 million tons of coarse grain in 2015/16, down 8.5 million tons from the previous year’s record. Coarse grain area is forecast little changed, with reduced rapeseed price prospects helping sustain grain area. There is a decline in expected mixed grain area, mostly triticale in Poland, but it is nearly

International Outlook
9 Feed Outlook/FDS-15e/May 14, 2015
Economic Research Service, USDA
offset by increased area for rye and oats. Assuming normal growing conditions, yields in the EU in 2015/16 are not expected to approach the record levels reached a year earlier. Average corn yields are projected down 7 percent, dropping EU corn production 5.3 million tons. The winter barley crop has enjoyed a mostly favorable fall and mild winter with satellite imagery indicating a good crop, especially in Spain. EU barley yields are projected down 2 percent from the previous year’s record. Sub-Saharan Africa’s coarse grain production is projected to reach a record 107.9 million tons in 2015/16, up 2 percent year-to-year. Corn production is expected to recover from year-earlier low yields in South Africa but not reach the 2013/14 record levels. Sorghum production is projected down 2 percent from the 2014/15 record level but remains large. Sudan’s sorghum harvested area is forecast down 7 percent from the record posted a year earlier, but at 8 million hectares, is significantly above any other year. Brazil is forecast to produce 77.6 million tons of coarse grain in 2015/16, with 75.0 million tons of corn. Corn area is projected down 1 percent as first-crop corn is expected to continue to lose ground to soybeans. Average yield is expected to decline 3 percent, assuming a normal end to the rains for second-crop corn in Mato Grosso. India’s coarse grain production is projected to reach 41.4 million tons in 2015/16, up 5 percent from the previous year when monsoon rains fell short of normal. However, the projected production is lower than in 3 of the past 5 years. Total coarse grain area in 2015/16 is forecast up 3 percent from the previous year but is below earlier years. Corn harvested area peaked in 2013/14 and is expected to remain large at 9.2 million hectares, but millet and sorghum area, while up from the previous year’s low, have been trending lower over the last decade. Corn yields are expected to increase, but sorghum and millet remain mostly flat. Corn production is forecast to reach 23.5 million tons, with millet at 10.5 million and sorghum at 5.5 million. Russia is projected to produce 37.3 million tons of coarse grains in 2015/16, a drop of 8 percent from the previous year’s output. Barley harvested area is forecast down 9 percent, with oilseeds an attractive alternative to spring-planted barley. A return to trend yields indicates a modest year-to-year decline for barley. Corn area is expected to be maintained, and, with a strong trend growth in yields, record corn production is expected. Argentina is forecast to produce 33.7 million tons of coarse grain in 2015/16, up 5 percent from the previous year but less than in 2012/13 or 2013/14. Corn area harvested is expected up 5 percent, with producer’s seeking to rotate soybean area to maintain soil productivity. However, political and economic uncertainties are expected to limit the increase. A return to trend yields implies a 3-percent year-to-year decline, limiting corn production gains to 0.5 million tons to 25.0 million. Sorghum area is also up, more than offsetting a lower yield and boosting production prospects 0.5 million tons to 4.5 million. Barley area and yield are both forecast up in 2015/16, increasing production 0.7 million tons to 3.7 million. Ukraine’s coarse grain production in 2015/16 is expected to drop 15 percent to 33.3 million tons. Winter wheat prices limited winter barley area, and competitive

International Outlook
10 Feed Outlook/FDS-15e/May 14, 2015
Economic Research Service, USDA
returns for oilseeds are expected to reduce spring barley and corn area. Barley area is forecast down 19 percent, and, with yields returning to average levels, production is expected down by more than a third. Corn area and production declines are more modest, reducing production prospects 9 percent to 26.0 million. Production prospects for oats, rye, and millet are also down. Southeast Asia is projected to increase 2015/16 coarse grain production (nearly all corn) 4 percent to 33.2 million tons. Trend yield increases boost corn production prospects 2 percent in Indonesia to 9.6 million tons, while area expansion and trend yield increases boost prospects in the Philippines and Vietnam by 7 percent each to 8.5 million tons and 6.0 million, respectively. Trend yield increases in Thailand support a small increase in production prospects to 4.9 million tons. Mostly stable production is expected in other countries. Mexico’s 2015/16 coarse grain production is forecast up slightly at 32.0 million tons. Corn area is projected down 2 percent from the high level reached a year earlier, due to lower prices. With yields expected to match those of a year earlier, corn production is projected down 0.5 million tons to 23.5 million. Sorghum area is forecast up 6 percent, and projected yields are up slightly, boosting production 0.5 million tons to 7.8 million. Barley area and yield are boosting production prospects slightly. Canada is projected to produce 23.9 million tons of coarse grain in 2015/16, up 9 percent due to a rebound in area. A relatively dry spring has facilitated field preparation and planting. Planting surveys indicate significant increased area for oats and barley and a small increase for corn but a decline for mixed grain (triticale). Corn yields are projected higher, but oats yields are projected lower than a year earlier. Corn production is projected up 0.8 million tons to 12.3 million, while barley and oats are each up 0.6 million to 7.7 million and 3.5 million, respectively. Middle East coarse grain production in 2015/16 is forecast up 23 percent to 22.2 million tons. Winter rains were exceptionally abundant across most of the region during late 2014 and early 2015. Turkey’s barley production is expected to rebound 75 percent to 7.0 million tons. Expanding irrigation projects and abundant water in reservoirs supports prospects for corn area and yield in Turkey, boosting production prospects 1.0 million tons to 5.8 million. The barley production increases in Syria and Iraq are more modest as war has prevented planting crops in some areas, especially those controlled by ISIS. North Africa’s coarse grain production is forecast up 12 percent in 2015/16 to 12.6 million tons. Favorable rains have supported barley prospects for Morocco, increasing coarse grain production 76 percent to 3.5 million tons. Spotty rains and excessive spring heat limited production increases in Algeria, up 14 percent to 1.6 million tons. Egypt’s irrigated coarse grain crop prospects are mostly stable, with production up slightly to 6.9 million, with a small increase for corn. Australia is expected to produce 12.3 million tons of coarse grains in 2015/16, up 6 percent. A small increase in barley area is supported by prices in the export market, and a return to trend yields is an increase compared to the previous year. Barley production is projected up 0.7 million tons to 8.6 million. Sorghum prospects are up

International Outlook
11 Feed Outlook/FDS-15e/May 14, 2015
Economic Research Service, USDA
0.1 million tons to 2.1 million, with a small area increase partly offset by a lower expected yield. Revised 2014/15 Production Boosts the Record Global coarse grain production in 2014/15 is forecast up 4.5 million tons this month to a record 1,284.8 million. The largest increase is for Brazil, up 2.9 million tons to 80.6 million. Second-crop corn has received favorable rains through April and into May, a crucial period for development with the rainy season winding down and the dry season beginning in Mato Grosso. Corn production prospects are raised 3.0 million tons to 78.0 million, but downward revisions for oats and barley are slightly offsetting. Iran’s corn production is raised 1.3 million tons as the series is revised. Argentina’s corn production is raised 0.5 million tons to 24.5 million, based on good harvest reports. Nigeria’s sorghum production is increased 0.4 million tons to 6.7 million, based on increased area. Burma corn area and yield are increased, boosting production 0.2 million tons to 2.0 million. Partly offsetting are declines in production for Niger millet of 0.3 million tons and Chile corn of 0.1 million. Other 2014/15 production changes are smaller and mostly offsetting. Large Beginning Stocks Boost 2015/16 Supplies World coarse grain beginning stocks for 2015/16 are forecast at 227.8 million tons, up 17.0 million from a year earlier and the largest in 15 years. The stocks increase swamps the 7.5-million-ton reduction in production, leaving global coarse grain supplies in 2015/16 up 9.6 million tons to 1,505.1 million. Estimated coarse grain stocks are revised upward back for several years. Beginning stocks for 2014/15 are increased 3.1 million tons this month to 210.8 million. The largest increase is for Iran, up 1.9 million tons to 5.7 million, based on increased corn production estimated for 2012/13 through 2014/15. EU coarse grain stocks are revised up 0.6 million tons to 15.6 million due to increased production of corn, oats, and barley in 2013/14. Argentina’s coarse grain stocks are revised up 0.2 million tons to 3.3 million because of reduced corn and sorghum exports estimated for 2013/14. Kenya, Uruguay, and Chile each have coarse grain stocks boosted 0.1 million tons due to revised estimated trade for 2013/14. Numerous smaller revisions are mostly offsetting. The 2015/16 beginning stocks are the same as the 2014/15 ending stocks. Forecast ending stocks for 2014/15 are raised 5.0 million tons this month compared to the April report. The largest increase is for Iran, up 2.7 million tons to 7.3 million based on the revised corn production series. EU 2014/15 ending coarse grain stocks are forecast up 1.2 million tons this month to 17.2 million, with increased beginning stocks and reduced feed use more than offsetting increased exports. Argentina’s 2014/15 ending stocks are up 0.7 million tons, mostly due to increased corn production but also supported by beginning stocks. Saudi Arabia’s stocks are forecast up 0.5 million tons due to increased barley imports. However, Brazil’s 2014/15 coarse grain ending stocks are cut 0.6 million tons to 17.5 million, as the increased corn production is more than offset by increased exports and domestic use. Other changes are smaller.

Record World Coarse Grain Use Expected in 2015/16
orld Coarse Grain Use Expected in 2015/16 ernational Outlook
12 Feed Outlook/FDS-15e/May 14, 2015
Economic Research Service, USDA
Large coarse grain supplies in 2015/16 are expected to keep prices low enough to discourage production and encourage use. In most countries, low grain and oilseed prices have increased the profitability of feeding concentrate feeds to meat animals. Poultry and pork numbers are expanding despite disease issues in some regions. Global coarse grain feed and residual use is projected to increase a modest 1.6 percent in 2015/16 to a record 774.9 million tons. However, growth in the food, seed, and industrial (FSI) use category for each country is expected to be more sluggish, up 0.9 percent to 502.5 million summed up for all countries in the database. Food use of coarse grains is growing slower than population in most countries as consumers with income growth tend to shift away from consuming grain products to eating a more diverse diet. Seed use is always small, especially for corn. Growth in industrial use of coarse grains has slowed as biofuels produced from grain have become less fashionable and declining petroleum prices make it less economic. Industrial and food processing demand for starch and sweeteners supports some expansion of FSI. Global coarse grain disappearance also includes the difference between world exports and imports, an additional 3.2 million tons projected in 2015/16. However, this is down from 7.2 million a year earlier. China is the largest foreign coarse grain user, projected to reach 242.4 million tons in 2015/16, an increase of 1.3 percent. However, in the EU, coarse grain domestic use is expected to stagnate at 163.1 million tons. In Sub-Saharan Africa, coarse grain use is forecast up only 0.6 percent to 108.2 million. Brazil, the world’s largest meat exporter, is projected to increase coarse grain use 3.2 percent to 61.8 million. India, with a growing population and increasing poultry production, is also expected to increase coarse grain use 3.2 percent to 38.9 million tons. Turkey, with a large rebound in barley production, is projected to increase coarse grain use 9.9 percent to 13.9 million tons. However, in Russia, with a sharp reduction in barley production, coarse grain use is forecast down 1.1 percent to 31.8 million tons. Ending Stocks To Decline Slightly in 2015/16 With coarse grain production forecast a bit lower than disappearance, projected world ending stocks for 2015/16 are 224.4 million tons, down 3.4 million from a year earlier. Global corn ending stocks are expected to decline only 0.6 million tons to 191.9 million. While relatively little changed as a world total, corn stocks are expected to accumulate mostly in China, while tightening in the rest of the world. China’s corn stocks are projected to reach 90.9 million tons at the end of 2015/16, an increase of 11.0 million. China’s high support price for corn, expanding production, and modest demand growth caused by disease problems in the livestock sector combine to leave the government holding huge intervention stocks. Some agricultural policy reforms have been attempted for other crops but not for corn, and there is no sign of reform to the corn policy being implemented in time to change the outlook for 2015/16. The projected corn ending stocks are equal to 40 percent of China’s corn crop.

International Outlook
13 Feed Outlook/FDS-15e/May 14, 2015
Economic Research Service, USDA
For countries other than China, corn stocks are projected to drop 10 percent to 101.0 million tons. Among major exporters, decreases in corn stocks are projected for the United States (down 6 percent), Brazil (down 30 percent), Argentina (down 33 percent), and Ukraine (down 15 percent). World 2015/16 barley ending stocks are forecast down 10 percent to 22.1 million tons, and lower barley stocks have only occurred 3 times in the last 20 years. Barley demand for malting is notoriously price inelastic. China and Saudi Arabia, countries that often pay a premium, dominate global imports of barley. However, global barley area continues to decline and production stagnates due to limited profitability. Global Coarse Grain Trade Projected up Slightly in 2015/16 World coarse grain trade in 2015/16 is projected to reach 160.5 million tons, up 0.7 million from a year earlier but down 3 percent from the 2013/14 record. While corn trade is expected to expand, sorghum, oats, and rye trade are forecast down slightly and barley trade is projected down significantly. Across much of North Africa and the Middle East, barley production prospects are unusually good, potentially limiting import demand, while production prospects in Russia and Ukraine, important exporters, are down 18 and 34 percent, respectively. Global corn trade in October-September 2015/16 is projected to reach 123.0 million tons, up 3.4 million from corn trade forecast for 2014/15 but down 7.1 million from the record trade estimated for 2013/14. Ample supplies in most exporting countries in 2015/16 are expected to support lively competition and limit price increases. U.S. Corn Exports Projected up in 2015/16 U.S. corn exports in 2015/16 are projected to reach 48.5 million tons (1.9 billion bushels for the September-August marketing year), up 2.5 million tons from forecast 2014/15 exports but down 2.2 million from exports in 2013/14. Increased world trade in 2015/16 and reduced competition from Ukraine and the EU are expected to support U.S. prospects. However, Brazil’s large second-crop corn from 2014/15 is expected to provide stiff competition for U.S. exports early in 2015/16. At the end of April 2015, outstanding sales for 2015/16 delivery were only 2.2 million tons, the lowest of the last 5 years, but it is too early for outstanding sales to be an important indicator of 2015/16 shipments. Large U.S. corn supplies and relatively sluggish domestic demand is expected to maintain U.S. corn export quotes at levels competitors will struggle to profitably match. Brazil’s October-September trade year 2015/16 corn exports are projected up 3.5 million tons to 24.0 million. The bumper 2014/15 second-crop corn harvest will begin soon and provide ample exportable supplies for September 2015 through February 2016. Exchange rate developments and potential use of the PEPRO subsidy program are likely to influence the pace of sales and shipments. With a decline in Brazil’s projected 2015/16 corn crop, corn exports are expected to weaken after March 2016. Local marketing year 2015/16 (March 2016-February 2017) corn exports are projected to reach only 22.0 million tons, down 1.5 million from the previous year.

International Outlook
14 Feed Outlook/FDS-15e/May 14, 2015
Economic Research Service, USDA
Argentina’s corn exports in trade year 2015/16 are projected to match the previous year at 16.0 million tons. The production increase is small, domestic use is growing, and any policy changes associated with a new government elected in December are uncertain. Ukraine’s corn exports in 2015/16 are forecast to decline 2.0 million tons to 16.0 million, constrained by a smaller crop. Changes to 2015/16 prospects for second-tier corn exporters are mostly offsetting. Serbia is projected to increase exports 0.1 million tons to 3.0 million despite a smaller crop because of preferential access to the EU market. However, EU corn exports are forecast down 0.5 million tons to 2.5 million due to smaller production. India, with a larger corn harvest, is projected to increase exports 0.5 million tons to 2.0 million, and Paraguay is forecast up 0.3 million tons to 2.3 million. Exports from Russia and South Africa are projected stable at 2.5 million tons and 1.0 million, respectively. Modest Increases in Corn Imports Projected The EU is expected to increase corn imports 4.0 million tons to 12.0 million in 2015/16. A reduced corn harvest in the EU and strong demand for wheat exports are likely to limit domestic grain for feed use. Corn imports, especially from Serbia and the Ukraine, will be attractive, especially across southern Europe. Saudi Arabia is projected to increase corn imports 1.0 million tons to 4.5 million, with expanding poultry production and a shift toward feeding sheep a balanced compound feed ration instead of straight barley. Egypt is projected to import 8.0 million tons of corn, up 0.5 million, to support expanding use. South Korea is expected to increase corn imports 0.4 million tons to 10.0 million as corn is expected to be attractively priced compared to feed-quality wheat. Smaller increases in corn imports are forecast for Mexico, Algeria, Malaysia, Colombia, Israel, Kenya, Morocco, Taiwan, Tunisia, and other countries. Reduced corn imports are projected for Iran, down 2.0 million tons to 4.0 million, as earlier imports have built up large stocks. Indonesia is expected to cut corn imports 0.5 million tons to 3.0 million based on a larger crop and government policies focused on self-sufficiency. Turkey and Venezuela are expected to trim corn imports 0.3 million tons each to 1.2 million and 2.3 million, respectively, due to increased production in Turkey and economic problems in Venezuela. Smaller reductions in corn imports are projected for Japan, Vietnam, Chile, Peru, and other countries. U.S. 2014/15 Corn Export Forecast Raised U.S. corn exports for 2014/15 are raised 0.5 million tons to 46.0 million (up 25 million bushels to 1,825 million bushels for the September-August local marketing year). Increased export inspections in recent weeks and outstanding sales of 13.2 million tons at the end of April indicate a pickup in corn exports. Moreover, export price quotes show U.S. corn increasingly competitive. Census exports for the first half of 2015/16 are 20.5 million tons, down 7 percent from the previous year, while the increased trade-year export projection is down 9 percent. Other adjustments to 2014/15 corn export projections due to the recent pace of sales and shipments include a 1.0-million-ton reduction for India, as prices are not

International Outlook
15 Feed Outlook/FDS-15e/May 14, 2015
Economic Research Service, USDA
competitive; a 0.5-million-ton cut for Brazil, as port capacity is used to export soybeans; a small reduction for Serbia, based on trade data; and increases for the EU, up 0.5 million tons based on sales and export licenses, and Burma, up modestly based on shipments. Only small adjustments are made this month to 2014/15 corn import projections. U.S. Sorghum Exports to Decline in 2015/16 U.S. sorghum exports in 2015/16 are projected to reach 8.5 million tons, down 0.5 million from the previous year due to limited supplies. A significant portion of the 2015/16 U.S. crop is likely to be harvested and exported before the start of the October-September 2015/16 trade year. China’s sorghum imports are projected to increase 0.5 million tons to 9.0 million in 2015/16. World sorghum trade in 2015/16 almost matches the previous year as increased exports from Argentina and Australia mostly offset the U.S. decline.

Tables
16 Feed Outlook/FDS-15e/May 14, 2015
Economic Research Service, USDA
Beginning stocks Production Imports
Total supply
Food, seed, and industrial
use
Feed and residual
use Exports
Total disappear-
anceEnding stocks
Farm price 2/(dollars
per bushel)
Sep-Nov 989 10,755 35 11,779 1,466 2,060 221 3,746 8,033 6.87Dec-Feb 8,033 45 8,078 1,430 1,087 161 2,678 5,400 6.95Mar-May 5,400 40 5,440 1,567 921 186 2,674 2,766 7.04Jun-Aug 2,766 40 2,806 1,575 247 162 1,985 821 6.67Mkt yr 989 10,755 160 11,904 6,038 4,315 730 11,083 821 6.89
Sep-Nov 821 13,829 15 14,665 1,550 2,312 350 4,212 10,453 4.66Dec-Feb 10,453 7 10,459 1,607 1,451 393 3,451 7,008 4.40Mar-May 7,008 9 7,017 1,668 859 637 3,165 3,852 4.63Jun-Aug 3,852 6 3,858 1,678 411 537 2,626 1,232 4.06Mkt yr 821 13,829 36 14,686 6,503 5,034 1,917 13,454 1,232 4.46
Sep-Nov 1,232 14,216 5 15,452 1,610 2,223 408 4,241 11,211 3.55Dec-Feb 11,211 6 11,217 1,624 1,445 404 3,472 7,745Mkt yr 1,232 14,216 25 15,472 6,547 5,250 1,825 13,622 1,851 3.55-3.75
Mkt yr 1,851 13,630 25 15,506 6,560 5,300 1,900 13,760 1,746 3.20-3.80
Sep-Nov 22.95 247.74 1.09 271.78 24.92 79.68 27.34 131.94 139.85 6.86Dec-Feb 139.85 0.06 139.91 24.92 4.31 19.15 48.37 91.54 6.76Mar-May 91.54 5.52 97.06 25.86 16.51 13.58 55.95 41.11 6.67Jun-Aug 41.11 2.91 44.01 19.55 -6.91 16.22 28.86 15.15 5.30Mkt yr 22.95 247.74 9.57 280.27 95.24 93.59 76.29 265.11 15.15 6.33
Sep-Nov 15.15 392.33 0.01 407.49 45.00 97.71 33.39 176.10 231.39 4.28Dec-Feb 231.39 0.01 231.40 10.00 1.92 43.74 55.67 175.73 4.22Mar-May 175.73 0.01 175.74 12.00 4.91 66.41 83.32 92.42 4.68Jun-Aug 92.42 0.07 92.49 3.00 -12.78 68.24 58.46 34.03 4.11Mkt yr 15.15 392.33 0.09 407.57 70.00 91.76 211.78 373.54 34.03 4.28
Sep-Nov 34.03 432.58 0.21 466.82 10.36 150.41 83.45 244.22 222.59 3.62Dec-Feb 222.59 0.12 222.72 2.88 2.91 98.39 104.17 118.54Mkt yr 34.03 432.58 0.33 466.94 15.00 85.00 350.00 450.00 16.94 3.90-4.10
Mkt yr 16.94 435.00 451.94 15.00 85.00 335.00 435.00 16.94 3.40-4.20
Sorghum 2012/13
2013/14
2014/15
2015/16
Table 1--Feed grains: U.S. quarterly supply and disappearance (million bushels), 5/14/2015
Commodity, market year,and quarter 1/Corn 2012/13
2013/14
2014/15
2015/16

17Feed Outlook/FDS-15e/May 14, 2015
Economic Research Service, USDA
Beginning stocks Production Imports
Total supply
Food, seed, and industrial
use
Feed and residual
use Exports
Total disappear-
anceEnding stocks
Farm price 2/(dollars
per bushel)
Jun-Aug 60 219 5 284 38 45 3 86 198 6.40Sep-Nov 198 6 204 36 6 3 46 158 6.46Dec-Feb 158 6 164 35 11 1 47 117 6.44Mar-May 117 6 123 38 3 1 42 80 6.42Mkt yr 60 219 23 302 147 66 9 222 80 6.43
Jun-Aug 80 217 2 299 40 61 3 103 196 6.22Sep-Nov 196 5 201 39 -11 3 31 169 5.98Dec-Feb 169 4 173 37 10 4 52 122 6.03Mar-May 122 8 129 38 5 4 47 82 5.93Mkt yr 80 217 19 316 155 65 14 234 82 6.06
Jun-Aug 82 177 7 266 39 43 4 86 180 5.67Sep-Nov 180 4 184 38 -14 4 28 156 5.12Dec-Feb 156 6 163 37 5 3 45 118Mkt yr 82 177 24 283 152 40 14 205 78 5.30
Mkt yr 78 198 25 301 153 60 10 223 78 4.10-4.90
Jun-Aug 55 61 29 146 17 43 0 61 85 3.76Sep-Nov 85 27 112 18 21 0 39 73 3.84Dec-Feb 73 17 90 17 20 0 38 53 4.02Mar-May 53 20 72 24 12 0 36 36 4.35Mkt yr 55 61 93 209 76 96 1 173 36 3.89
Jun-Aug 36 65 17 118 17 37 0 55 63 3.72Sep-Nov 63 28 92 18 25 1 43 48 3.56Dec-Feb 48 20 68 16 16 0 33 35 3.71Mar-May 35 32 67 24 19 0 43 25 4.03Mkt yr 36 65 97 198 75 97 2 173 25 3.75
Jun-Aug 25 70 27 121 18 29 0 47 74 3.38Sep-Nov 74 24 99 18 13 0 32 67 3.13Dec-Feb 67 32 99 17 22 0 39 59Mkt yr 25 70 107 201 77 85 2 164 38 3.20
Mkt yr 38 72 100 210 77 95 2 174 36 2.00-2.60
Latest market year is projected; previous market year is estimated. Totals may not add due to rounding.1/ Corn and sorghum, September 1-August 31 marketing year; Barley and oats, June 1-May 31 marketing year.2/ Average price received by farmers based on monthly price weighted by monthly marketings. For the latest market year, quarterly prices are calculated by using the current monthly prices weighted by the monthly marketings for those months for the previous 5 years divided by the sum of marketings for those months.Source: USDA, World Agricultural Outlook Board, World Agricultural Supply and Demand Estimates and supporting materials.
Data run: 5/13/2015
Oats 2012/13
2013/14
2014/15
2015/16
Table 1--Feed grains: U.S. quarterly supply and disappearance, cont. (million bushels), 5/14/2015
Commodity, market year,and quarter 1/Barley 2012/13
2013/14
2014/15
2015/16

18 Feed Outlook/FDS-15e/May 14, 2015
Economic Research Service, USDA
Grain consuming animal units (millions)
110.8
93.2
94.7
2012/13 2013/14Sep 7.70 5.27Oct 7.48 5.13Nov 7.39 5.06Dec 7.23 5.06Jan 7.17 5.03Feb 7.15 5.32Mar 7.33 5.65Apr 6.57 5.65May 6.83 5.51Jun 6.94 5.14Jul 6.61 4.64Aug 5.98 4.48Mkt year 7.03 5.16
2012/13 2013/14Jun 5.15 6.88Jul 5.52 6.79Aug 5.78 5.88Sep 5.58 5.41Oct 5.51 5.50Nov 5.49 5.46Dec 5.29 5.77Jan 5.08 5.72Feb 5.16 5.64Mar 5.22 5.97Apr 5.00 6.24May 5.04 6.10Mkt year 5.32 5.95
Table 2--Feed and residual use of wheat and coarse grains, 5/14/2015
Market year andquarter 1/
Corn (million
metric tons)
Sorghum (million
metric tons)
Barley (million
metric tons)
Oats (million
metric tons)
Feed grains (million
metric tons)
Wheat (million
metric tons)
Energy feeds (million
metric tons)
Energy feeds per grain
consuming animal unit
2013/14 Q1 Sep-Nov 58.7 2.5 -0.2 0.4 61.4 -4.6 56.8Q2 Dec-Feb 36.9 0.0 0.2 0.3 37.4 -0.0 37.4Q3 Mar-May 21.8 0.1 0.1 0.4 22.4 -0.7 21.7Q4 Jun-Aug 10.4 -0.3 0.9 0.5 11.6 6.9 18.5MY Sep-Aug 127.9 2.3 1.0 1.6 132.8 1.5 134.3 1.2
2014/15 Q1 Sep-Nov 56.5 3.8 -0.3 0.3 60.2 -2.5 57.7Q2 Dec-Feb 36.7 0.1 0.1 0.4 37.3 0.6 37.8MY Sep-Aug 133.4 2.2 0.9 1.7 138.2 3.6 141.8 1.5
2015/16 MY Sep-Aug 134.6 2.2 1.1 1.5 139.4 4.9 144.3 1.5
1/ Corn and sorghum, September 1-August 31 marketing year; Barley and oats, June 1-May 31 marketing year.Source: USDA, World Agricultural Outlook Board, World Agricultural Supply and Demand Estimates and supporting materials.
Table 3--Cash feed grain prices, 5/14/2015
Mkt year and month 1/
Corn, No. 2 yellow, Central IL
(dollars per bushel)
Corn, No. 2 yellow, Gulf ports, LA
(dollars per bushel)
Sorghum, No. 2 yellow, Gulf ports, LA
(dollars per cwt)2013/14 2014/15 2012/13
4.78 3.16 8.15 4.14 12.97 9.849.31 8.52
2014/15 2012/13 2013/14 2014/15
8.18 4.54 13.10 8.86
7.914.20 3.09 8.16 4.15 13.20
9.044.13 3.75 7.85 4.55 13.14 9.34 9.854.10 3.45
10.16 10.704.13 3.67 7.70 4.44 13.13 9.77
7.85 4.43 13.32 10.57
10.414.33 3.65 7.70 4.41 13.12
4.98 3.59 7.11 4.38 12.18 9.974.64 3.66
4.72 7.50 12.42
7.104.37 7.58
3.59 6.07 10.01 8.413.74
4.31 7.58 12.66 9.53Barley, No. 2 feed, Minneapolis, MN
(dollars per bushel)
Barley, No. 3 malting, Minneapolis, MN
(dollars per bushel)
Oats, No. 2 white heavy, Minneapolis, MN
(dollars per bushel)2013/14 2014/15 2012/13 2014/15 2012/13
5.01 3.49 7.03 5.71 3.37 4.216.89 5.62 3.95 3.84
2013/14 2014/153.883.85
4.03 2.58 6.95 5.79 3.99 3.78 3.834.66 3.01
3.57 3.683.48 2.30 6.99 5.98 3.89 3.40
7.23 7.35 3.85 3.79
3.863.39 2.44 7.11 7.28 3.98
3.533.52 2.68 7.22 7.35 3.94 3.80 3.493.46 2.48
4.64 3.113.65 2.79 7.09 7.10 3.79 4.30
6.87 4.26 4.66
3.263.70 2.73 7.04 6.75 4.07
3.143.95 2.81 6.51 6.35 4.13 4.58 2.943.87 2.75
3.96 6.70 3.99 4.03
1/ Corn and sorghum, September 1-August 31 marketing year; Barley and oats, June 1-May 31 marketing year. Simple averageof monthly prices for the marketing year.Source: USDA, Agricultural Marketing Service, http://marketnews.usda.gov/portal/lg.
Data run: 5/13/2015
3.89 6.97 3.93 4.05

19 Feed Outlook/FDS-15e/May 14, 2015
Economic Research Service, USDA
2012/13 2013/14 2014/15488.46 355.00 90.13466.16 345.00 105.13460.09 401.88 143.30431.39 378.34 135.25440.67 388.75 117.25437.33 401.25 107.20422.07 405.50465.72 416.88496.78 412.50544.59 359.50464.91 310.00500.39 360.63468.21 377.93
2012/13 2013/14 2014/15463.59 216.50 111.48380.38 217.13 106.87320.42 220.50 135.83338.16 200.00 140.93410.39 214.38474.92 245.00424.37 243.50387.05 222.75413.74 184.50481.53 148.00461.38 116.88450.82 123.00417.23 196.01
Table 4--Selected feed and feed byproduct prices (dollars per ton), 5/14/2015
Mkt year and month 1/
Soybean meal, high protein,
Central Illinois, IL
Cottonseed meal, 41% solvent, Memphis, TN
Corn gluten feed, 21% protein,
Midwest
Corn gluten meal, 60% protein,
Midwest2013/14 2014/15 2012/13 2014/15 2012/13 2013/14 2012/13 2013/14 2014/15
Oct 443.63 381.50 343.00 346.88 226.50 157.50 753.50 601.25 549.38Nov 451.13 441.40 376.88 313.13 209.75 158.38 716.25 631.25 581.88Dec 498.31 431.74 345.00 334.38 203.34 168.00 673.34 638.13 613.50Jan 479.54 380.03 327.50 313.75 204.10 165.00 599.50 625.00 632.50Feb 509.25 370.39 279.38 302.50 209.88 167.50 584.38 668.13 631.25Mar 497.82 357.83 301.88 310.50 204.13 177.63 581.88 744.38 613.00Apr 514.01 314.50 176.70 166.60 540.50 784.00May 519.38 311.88 157.25 157.00 480.63 761.25Jun 501.72 329.38 151.00 131.88 550.00 694.50Jul 450.79 344.50 140.60 113.70 591.00 574.00Aug 490.33 330.00 123.13 109.25 565.63 572.88Sep 525.72 374.38 135.50 98.70 573.75 587.50Mkt yr 490.13 331.52 178.49 147.59 600.86 656.86
Meat and bone meal, Central US
Distillers dried grains, Central Illinois, IL
Wheat middlings, Kansas City, MO
Alfalfa hay, weighted-average
farm price 2/2013/14 2014/15 2012/13 2014/15 2012/13 2013/14 2012/13 2013/14 2014/15
Oct 385.53 385.00 278.00 96.00 208.57 153.37 212.00 193.00 194.00Nov 410.95 383.79 259.00 113.13 193.60 138.69 215.00 188.00 184.00Dec 459.57 424.22 261.67 159.30 217.37 198.00 217.00 186.00 183.00Jan 456.88 382.49 264.90 186.50 196.38 151.62 217.00 186.00 174.00Feb 438.75 370.63 271.13 187.13 197.47 150.24 218.00 190.00 172.00Mar 501.25 376.00 270.88 189.50 196.93 156.62 219.00 193.00 172.00Apr 560.00 242.40 183.64 133.38 213.00 207.00May 516.25 229.00 138.75 131.07 219.00 225.00Jun 506.88 235.88 147.13 102.43 218.00 222.00Jul 489.83 240.20 138.30 70.36 206.00 216.00Aug 464.37 232.13 120.91 81.24 199.00 209.00Sep 435.00 230.13 140.35 106.62 194.00 197.00Mkt yr 468.77 251.27 173.28 131.14 211.00 199.00 202.001/ October 1-September 30 except for hay. Simple average of monthly prices for the marketing year except for hay.2/ 1 30 S f Source: USDA, Agricultural Marketing Service, http://marketnews.usda.gov/portal/lg, and USDA, National Agricultural Statistics Service, http://www.nass.usda.gov/Data_and_Statistics/Quick_Stats/index.asp.
Table 5--Corn: Food, seed, and industrial use (million bushels), 5/14/2015
Mkt year and qtr 1/
High-fructose corn syrup
(HFCS)Glucose and
dextrose StarchAlcohol for
fuel
Alcohol for beverages
and manufacturing
Cereals and other
products Seed
Total food, seed, and
industrial use2013/14 Q1 Sep-Nov 113.44 74.07 62.15 1,215.75 34.32 49.95 0.00 1,549.68
Q2 Dec-Feb 110.11 74.33 60.76 1,275.53 35.97 49.82 0.00 1,606.52Q3 Mar-May 125.62 79.17 50.83 1,302.76 37.62 50.34 21.92 1,668.26Q4 Jun-Aug 128.53 80.89 44.85 1,339.96 32.52 50.41 1.08 1,678.24MY Sep-Aug 477.70 308.46 218.60 5,134.00 140.43 200.51 23.00 6,502.69
2014/15 Q1 Sep-Nov 115.54 74.62 62.33 1,272.82 34.62 50.22Q2 Dec-Feb 109.66 69.56 61.03 1,297.50 36.28
141.67 201.63 23.22 6,546.52
0.00 1,610.1450.06 0.00 1,624.08
MY Sep-Aug 450.00 300.00 230.00 5,200.00
2015/16 MY Sep-Aug 450.00 300.00 240.00 5,200.00 143.00
1/ September-August. Latest data may be preliminary or projected.Source: Calculated by USDA, Economic Research Service.
Date run: 5/13/2015
204.10 22.90 6,560.00

20 Feed Outlook/FDS-15e/May 14, 2015
Economic Research Service, USDA
2014/15 2014/15Sep 17.32 14.14Oct 17.44 13.30Nov 18.44 12.91Dec 18.89 13.90Jan 18.94 14.11Feb 18.71 13.93Mar 18.51 13.90Apr 17.90 14.08MayJunJulAugMkt year 2/
Table 6--Wholesale corn milling product and byproduct prices, 5/14/2015
Mkt year and month 1/
Corn meal, yellow, Chicago, IL
(dollars per cwt)
Corn meal, yellow, New York, NY
(dollars per cwt)
Corn starch, Midwest 3/
(dollars per cwt)
Dextrose, Midwest
(cents per pound)
High-fructose corn syrup (42%),
Midwest(cents per pound)
2013/14 2013/14 2014/15 2013/14 2013/14 2014/15 2013/14 2014/1527.17 28.82 18.99 21.04 35.35 34.50 25.88 21.2526.47 28.10 19.11 18.55 35.35 34.50 25.88 21.2526.22 27.95 20.14 15.64 34.10 34.50 24.38 21.2526.26 27.89 20.56 14.98 32.85 34.50 22.88 21.2524.69 26.44 20.61 14.41 29.62 37.00 20.79 23.2521.66 23.36 20.39 14.44 30.50 37.00 21.25 23.2521.50 23.24 20.06 14.68 30.50 37.00 21.25 23.2521.08 22.75 19.57 14.98 30.50 37.00 21.25 23.2520.21 21.88 15.64 30.50 21.2519.92 21.59 15.88 32.17 21.2518.56 20.23 15.49 34.50 21.2518.09 19.76 14.86 34.50 21.2522.65 24.33 15.88 32.54 22.38
1/ September-August. Latest month is preliminary.2/ Simple average of monthly prices for the marketing year.3/ Bulk-industrial, unmodified.Source: Milling and Baking News, except for corn starch which is from private industry.
Date run: 5/13/2015
Table 7--U.S. feed grain imports by selected sources (1,000 metric tons) 1/, 5/14/2015
Import and country/region---------- 2012/13 ---------- ---------- 2013/14 ---------- 2014/15Mkt year Jun-Mar Mkt year Jun-Mar Jun-Mar
Oats Canada 1,591 1,369 1,505 1,196 1,466Sweden 8 99 33 72Australia (No
)2 1 5 2 3
All other countries 0 0 67 39 71 Total 2/ 1,601 1,371 1,676 1,270 1,612
Malting barley Canada 342 294 242 158
Total 2/ 342 294 242
288All other countries 0 0 28
Other barley 3/ Canada 161 132 162 122All other countries
165 135 166 124
158 316
122
1251/ Grain only. Market year (June-May) and market year to date.2/ Totals may not add due to rounding.3/ Grain for purposes other than malting, such as feed and seed use.Source: U.S. Department of Commerce, Bureau of the Census, Foreign Trade Statistics.
Date run: 5/13/2015
4 3 4 2 3 Total 2/
21 Feed Outlook/FDS-15e/May 14, 2015
Economic Research Service, USDA
2014/15Mkt year Sep-Mar Mkt year Sep-Mar Sep-Mar
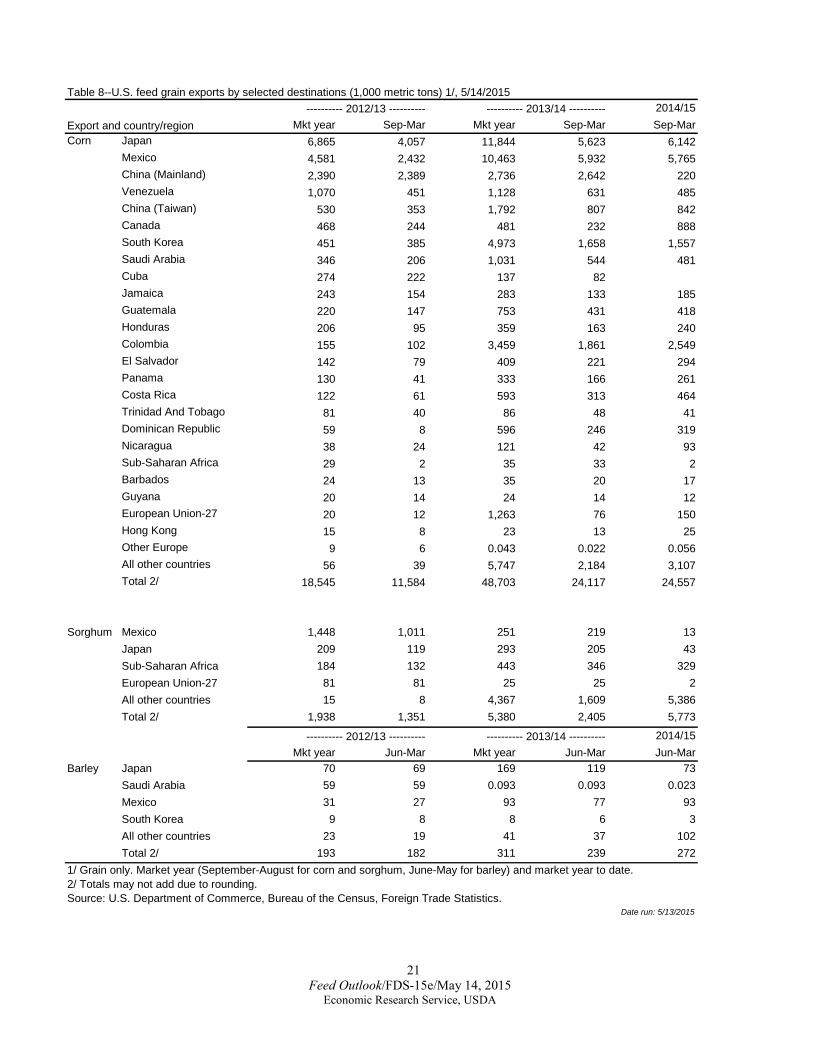
Japan 6,865 4,057 11,844 5,623 6,142Mexico 4,581 2,432 10,463 5,932 5,765China (Mainland) 2,390 2,389 2,736 2,642 220Venezuela 1,070 451 1,128 631 485China (Taiwan) 530 353 1,792 807 842Canada 468 244 481 232 888South Korea 451 385 4,973 1,658 1,557Saudi Arabia 346 206 1,031 544 481Cuba 274 222 137 82Jamaica 243 154 283 133 185Guatemala 220 147 753 431 418Honduras 206 95 359 163 240Colombia 155 102 3,459 1,861 2,549El Salvador 142 79 409 221 294Panama 130 41 333 166 261Costa Rica 122 61 593 313 464Trinidad And Tobago 81 40 86 48 41Dominican Republic 59 8 596 246 319Nicaragua 38 24 121 42 93Sub-Saharan Africa 29 2 35 33 2Barbados 24 13 35 20 17Guyana 20 14 24 14 12European Union-27 20 12 1,263 76 150Hong Kong 15 8 23 13 25Other Europe 9 6 0.043 0.022 0.056All other countries 56 39 5,747 2,184 3,107Total 2/ 18,545 11,584 48,703 24,117 24,557
Mexico 1,448 1,011 251 219 13Japan 209 119 293 205 43Sub-Saharan Africa 184 132 443 346 329European Union-27 81 81 25 25 2All other countries 15 8 4,367 1,609 5,386Total 2/ 1,938 1,351 5,380 2,405 5,773
2014/15Mkt year Jun-Mar Mkt year Jun-Mar Jun-Mar
Japan 70 69 169 119 73Saudi Arabia 59 59 0.093 0.093 0.023Mexico 31 27 93 77 93South Korea 9 8 8 6 3All other countries 23 19 41 37 102Total 2/ 193 182 311 239 272
Table 8--U.S. feed grain exports by selected destinations (1,000 metric tons) 1/, 5/14/2015
Export and country/region---------- 2012/13 ---------- ---------- 2013/14 ----------
Corn
Date run: 5/13/2015
Sorghum
---------- 2012/13 ---------- ---------- 2013/14 ----------
Barley
1/ Grain only. Market year (September-August for corn and sorghum, June-May for barley) and market year to date.2/ Totals may not add due to rounding. Source: U.S. Department of Commerce, Bureau of the Census, Foreign Trade Statistics.

Contacts and Links
22 Feed Outlook/FDS-15e/May 14, 2015
Economic Research Service, USDA
Feed Monthly Tables, (http://www.ers.usda.gov/publications/fds-feed-outlook/) Feed Chart Gallery, (http://www.ers.usda.gov/data-products/chart-gallery.aspx) Data Feed Grains Database (http://ers.usda.gov/data-products/feed-grains-database.aspx) is a queryable database that contains monthly, quarterly, and annual data on prices, supply, and use of corn and other feed grains. This includes data published in the monthly Feed Outlook and the annual Feed Yearbook reports. Related Websites Feed Outlook (http://usda.mannlib.cornell.edu/MannUsda/viewDocumentInfo.do?documentID=1273 WASDE) (http://usda.mannlib.cornell.edu/MannUsda/viewDocumentInfo.do?documentID=1194) Grain Circular (http://www.fas.usda.gov/grain/Current/default.asp) World Agricultural Production (http://www.fas.usda.gov/wap_arc.asp) Corn Briefing Room (http://ers.usda.gov/topics/crops/corn.aspx)
Contact Information Thomas Capehart (domestic), (202)-694-5313, [email protected] Edward Allen (international), (202)-694-5288, [email protected] Jennifer Bond, (economist), (202)-694-5326, [email protected] Verna Daniels (Web publishing), (202)-694-5301, [email protected] Subscription Information Subscribe to ERS e-mail notification service at http://www.ers.usda.gov/subscribe-to-ers-e-newsletters.aspx to receive timely notification of newsletter availability. Printed copies can be purchased from the USDA Order Desk by calling 1-800-363-2068 (specify the issue number) To order printed copies of the five field crop newsletters—cotton and wool, feed, rice, oil crops, and wheat—as a series, specify series SUB-COR-4043
The U.S. Department of Agriculture (USDA) prohibits discrimination in all its programs and activities on the basis of race, color, national origin, age, disability, and, where applicable, sex, marital status, familial status, parental status, religion, sexual orientation, genetic information, political beliefs, reprisal, or because all or a part of an individual’s income is derived from any public assistance program. (Not all prohibited bases apply to all programs.) Persons with disabilities who require alternative means for communication of program information (Braille, large print, audiotape, etc.) should contact USDA’s TARGET Center at (202) 720-2600 (voice and TDD). To file a complaint of discrimination write to USDA, Director, Office of Civil Rights, 1400 Independence Avenue, S.W., Washington, D.C. 20250-9410 or call (800) 795-3272 (voice) or (202) 720-6382 (TDD). USDA is an equal opportunity provider and employer.
E mail Notification Readers of ERS outlook reports have two ways they can receive an e-mail notice about release of reports and associated data. • Receive timely notification (soon after the report is posted on the web) via USDA’s Economics, Statistics and Market Information System (which is housed at Cornell University’s Mann Library). Go to http://usda.mannlib.cornell.edu/MannUsda/aboutEmailService.do and follow the instructions to receive e-mail notices about ERS, Agricultural Marketing Service, National Agricultural Statistics Service, and World Agricultural Outlook Board products. • Receive weekly notification (on Friday afternoon) via the ERS website. Go to http://www.ers.usda.gov/subscribe-to-ers-e-newsletters.aspx and follow the instructions to receive notices about ERS outlook reports, Amber Waves magazine, and other reports and data products on specific topics. ERS also offers RSS (really simple syndication) feeds for all ERS products. Go to http://www.ers.usda.gov/rss/ to get started.