Embed Size (px)
Citation preview
sustainability
Article
Feeding Models to Optimize Dairy Feed Rations in View ofFeed Availability, Feed Prices and Milk Production Scenarios
Othman Alqaisi 1,* and Eva Schlecht 2
�����������������
Citation: Alqaisi, O.; Schlecht, E.
Feeding Models to Optimize Dairy
Feed Rations in View of Feed
Availability, Feed Prices and Milk
Production Scenarios. Sustainability
2021, 13, 215. https://dx.doi.org/
10.3390/su13010215
Received: 30 October 2020
Accepted: 5 December 2020
Published: 4 January 2021
Publisher’s Note: MDPI stays neu-
tral with regard to jurisdictional claims
in published maps and institutional
affiliations.
Copyright: © 2021 by the authors. Li-
censee MDPI, Basel, Switzerland. This
article is an open access article distributed
under the terms and conditions of the
Creative Commons Attribution (CC BY)
license (https://creativecommons.org/
licenses/by/4.0/).
1 Animal and Veterinary Sciences Department, College of Agricultural & Marine Sciences,Sultan Qaboos University, Muscat 123, Oman
2 Animal Husbandry in the Tropics and Subtropics, University of Kassel and Georg-August UniversitätGöttingen, Steinstr. 19, 37213 Witzenhausen, Germany; [email protected]
* Correspondence: [email protected]
Abstract: In the global dairy production sector, feed ingredient price and availability are highlyvolatile; they may shape the composition of the feed ration and, in consequence, impact feed costand enteric methane (CH4) emissions. The objective of this study is to explore the impact of changesin feed ingredients’ prices and feed ingredients’ availability on dairy ration composition, feed costand predicted methane yield under different levels of milk production. To meet the research aim,a series of multi-period linear programming models were developed. The models were then usedto simulate 14 feed rations formulations, each covering 162 months and three dairy productionlevels of 10, 25 and 35 kg milk/d, representing a total of 6804 feed rations altogether. Across milkproduction levels, the inclusion of alfalfa hay into the feed rations declined from 55% to 38% whendaily milk production increased from 10 to 35 kg, reflecting the cows’ increased energy requirements.At a daily milk production level of 35 kg, CH4 production (per kg milk) was 21% and 53% lowerthan in average and low milk producing cows, respectively, whereas at 10 kg of milk productionthe potential to reduce CH4 production varied between 0.6% and 5.5% (average = 3.9%). At allproduction levels, a reduction in CH4 output was associated with an increase in feed costs. Overall,and considering feeding scenarios in low milk producing cows, feed cost per kg milk was 30% and37% higher compared to that of average and high milk production, respectively. The feed rationmodeling approach allows us to account for the interaction between feed ingredients over time,taking into consideration volatile global feed prices. Overall, the model provides a decision-makingtool to improve the use of feed resources in the dairy sector.
Keywords: LP modeling; feed cost minimization; dairy farming
1. Introduction
Global dairy production is expected to increase by 35% in the coming decade [1].Such growth requires judicious allocation of resources in terms of land, water, animals andfeed, in order to enhance the operation’s environmental as well as economic sustainability.Dairy feeding systems vary widely depending on geographical location, utilized breeds,production level and the availability of feed resources [2]. These variations may alsoreflect variations in feed costs, milk production costs and the emission of greenhousegasses (GHG), notably enteric methane (CH4) [3,4]. Furthermore, in the global dairyproduction sector, feed ingredient price and availability are highly volatile; they may shapethe composition of the feed ration and, in consequence, enteric CH4 emissions per animaland per kg of milk. A feed commodity switch that responds to changing feed prices mayinduce changes to the overall feed costs and CH4 yield. Alqaisi et al. (2019) [5] evaluateddairy feeding scenarios under alternative feed availabilities and relative prices. In thatstudy, only one level of milk production was considered for feed formulation, in order toexplain monthly variations in ration composition and feed costs. The current work providesfurther analyses and considers varying levels of milk production, since this typically varies
Sustainability 2021, 13, 215. https://dx.doi.org/10.3390/su13010215 https://www.mdpi.com/journal/sustainability
Sustainability 2021, 13, 215 2 of 15
between herds, between lactations and within the lactation period. These variables need tobe accounted for in feed formulation, since they are affecting feed costs and CH4 emissionsin dairy production. In dairy production, feed is the most expensive component, typicallyrepresenting 50–70% of total milk production costs [2,6]. Yet, the actual share of feed costsin the total milk production costs is highly dependent on feeding systems, which varywidely worldwide [2]. Feed costs are driven by the availability of feeds, feed input pricesand overall diet composition. Furthermore, dairy production level drives the feed costper day or per kg of milk produced, since it reflects the animal’s efficiency. However,information about feed cost under different milk production levels and the associatedCH4 emission is not thoroughly evaluated in the literature in relation to feed ingredientssupply. Alqaisi et al. (2019) [5] demonstrated that CH4 emission is associated with thefeeding system practiced (i.e., grain versus meal feeding). Using available historical marketfeed prices for feed formulation could be instrumental in providing estimates on feedration composition, overall feed costs and the resulting CH4 emissions under scenarios ofchanging feed availability (e.g., availability of corn and absence of wheat or barley) anddairy production levels.
Wilkinson and Garnsworthy (2017) [7] reported that the environmental impact of feeduse by dairy cows may be reduced via diet formulation but depends on the availability ofraw materials for concentrate feeds and level of milk output. In feed formulation, linearprogramming (LP) has been widely used to formulate least cost rations for livestock feedrequirements. However, the issues of commodity prices and dietary dynamics over time,and their relationship with feed ration composition, feed cost change, CH4 emission andmilk yield have not been comprehensively evaluated. In diet formulation, decisions needto be made frequently (daily, weekly or monthly). Therefore, the traditional LP approachneeds to incorporate changing feed prices, milk production levels and time variables toadequately depict necessary changes in rations that reduce costs and perhaps CH4 emis-sions. From an economic point of view, dairy farmers might be more interested in feed costreduction than CH4 emission mitigation. Historically, milk production cost was loweredby increasing milk yield [8]. However, reducing CH4 emissions has not been thoroughlyevaluated in relation to feed ingredient supply, which might become a challenging issue inthe future due to the disruption in ingredients production. Since increasing milk yield isassociated with improving feed efficiency, increasing milk production per cow has beenreported to reduce CH4 emissions per kg of milk [3,9]. With fluctuating feed commodityprices, multi-period LP modeling could be used to recommend dietary switching fromone feed commodity to the other (i.e., switch from corn to wheat, or from soybean meal(SBM) to distiller’s dried grains with solubles (DDGS)) [5]. The authors concluded thatthe magnitude of the feed commodity switch is price-dependent. Accordingly, this ap-proach can explore dietary options that result in varying CH4 emissions and may providefurther options for lowering feed costs and CH4 production under limited feed resourceavailability. Since we propose a feeding model that captures market price changes, dietcomposition might change accordingly, and therefore CH4 emissions might change subjectto the monthly dietary change instances. In this context, we hypothesize that the feedingredients’ inclusion rates are correlated with feed prices and determine feed cost aswell as the CH4 emissions of cows, whose effects depend on the level of milk production.Therefore, evaluating potential changes in feeding systems, feed cost and CH4 emissionsrequires a periodic (multi-period) tool that mimics the feed trading and feed productionprocess in response to feed ingredients’ availability. In consequence, the objectives of thisstudy are to (1) develop multi-period LP feed models for dairy cows with three levels ofmilk production, (2) demonstrate the potential use of the method in different commodityfeed availability situations (feeding scenarios), (3) illustrate the impact of a feed commodityswitch on the vulnerability of feeding systems and on CH4 emissions, and (4) explore therelationships between feed cost, feed commodity switch and the predicted CH4 emissions.
Sustainability 2021, 13, 215 3 of 15
2. Materials and Methods
Diet formulation is a continuous process based on daily, weekly and monthly trends.In the current study, we use global monthly feed commodity prices dependent on theiravailability. We hypothesize that changes in feed ration formulation, which are feed-price-dependent in an LP formulation, are correlated with the costs of individual feeds andaffect enteric CH4 emissions. The formulation considers three levels of milk production(10, 25 and 35 kg/d), representing a low, average and high milk production level. The threelevels correspond to usual variations in milk production levels between dairy herds andduring a lactation period, and they also represent distinctly different energy and nutrientrequirements. These variables will lead to different diets and provide changes to feed costsand CH4 emissions. In addition to the grains and cereal meals that are used to supplyenergy and protein to fulfil the animals’ requirements, alfalfa hay was used as a fiber sourcefor dairy cows; this choice is justified by its global importance in dairy cattle rations, anddue to the availability of its market prices.
2.1. Multi-Period LP Model
The proposed approach is based on monthly analyses of the output of linear program-ming models. The objective of the multi-period LP models is to produce a feed blend at aminimum cost in different periods (defined here as a month) and for cows varying in theirproduction, either between individuals, or within the lactation period of one individual.The model selects the optimal proportion of feed ingredients to produce the least costlydiet given feed nutritional composition, animal nutritional requirements and feed prices.Consequently, least feed costs are compared to commodity use alternatives (i.e., corn versuswheat) and enteric CH4 emissions that result from the LP formulation.
To determine the time (defined by the month) when a feed ration adjustment isrequired, and the proportion of an alternative feed commodity to be included into the newfeed ration, a multi-period LP model was developed for dairy cow feeding for 14 casescenarios representing the potential feed commodity availability in a region provided byinternational trade. These feeding scenarios allow for an evaluation of simulated dietsand their vulnerability to changes in feed availability options and feed price volatility.The first six scenarios (S1 to S6) were based on grains, and one meal source typically usedto formulate rations, while the remaining eight scenarios included additional options foragricultural by-products (meals).
Unlike static LP models, the multi-period LP model developed in this study minimizesa sequence of objective functions and provides time series relationships between decisionvariables and constraints via optimized solutions. The resulting relationships are estimatedusing the open source R programming software version 3.5 [10]. The model provides,but is not limited to, a sequence of results from multiple periods by retrieving valuesfrom a sequence of successfully solved single-period LP models. The results producedby this model allow the decision-maker to investigate the relationships between objectivefunction values, values of the decision variables, values of the constraints, dual variables(the reduced costs) and the sensitivity of the objective function. In many respects, themodel serves to provide an efficient sensitivity analysis of the optimal feed mix underalternative input prices and animal nutritional requirements.
2.2. Model Structure
The general structure of the multi-period LP is described for each milk productionlevel as follows:
f or t = 1, . . . , 162
minTCi =n
∑i=1
citxit
subject to
Sustainability 2021, 13, 215 4 of 15
aijtxit≥≤ bjt ∀ j ∈ J
xit ≥ 0
where TCt is the total cost of the feed ration in period t (month), cit is the per-unit cost offeed ingredient i at period t and xit is the quantity of feed ingredient i in the feed ration inperiod t. J is the set of nutrients that must be considered in the feed ration, with j being oneof the nutrients of the set of J, aijt the quantity of nutrient j in feed ingredient i in period tand bjt the required amount of each nutrient j in the feed ration in period t.
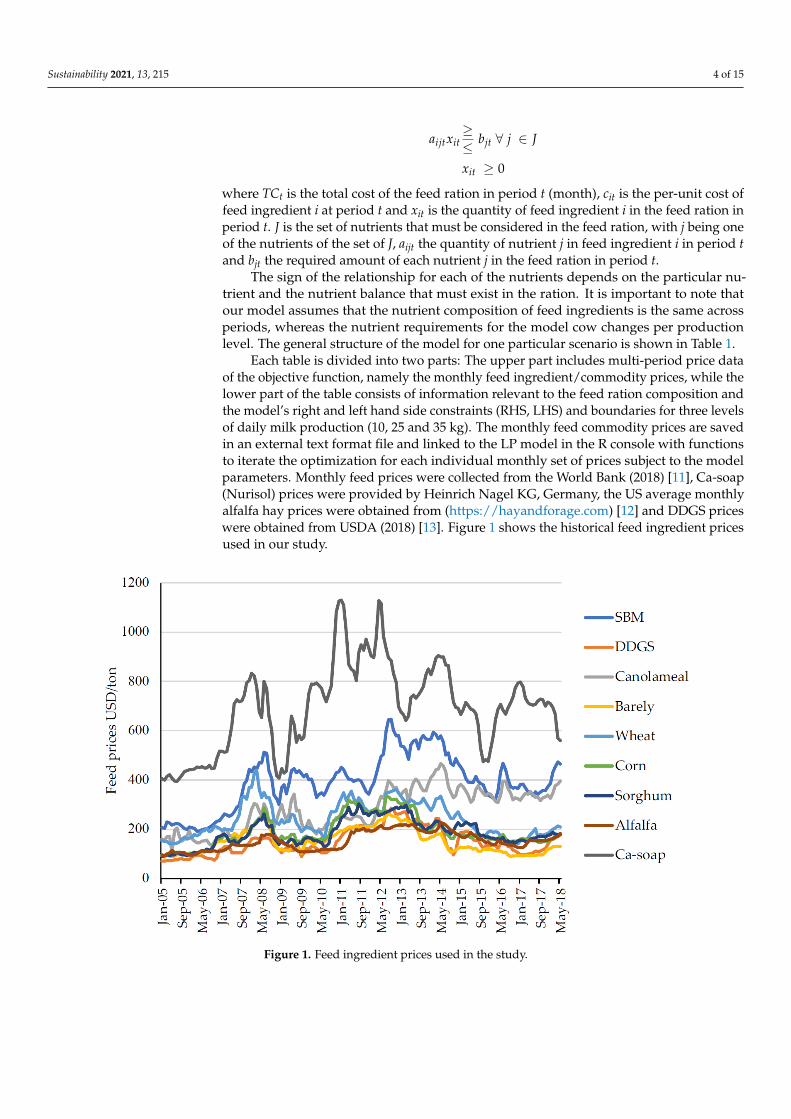
The sign of the relationship for each of the nutrients depends on the particular nu-trient and the nutrient balance that must exist in the ration. It is important to note thatour model assumes that the nutrient composition of feed ingredients is the same acrossperiods, whereas the nutrient requirements for the model cow changes per productionlevel. The general structure of the model for one particular scenario is shown in Table 1.
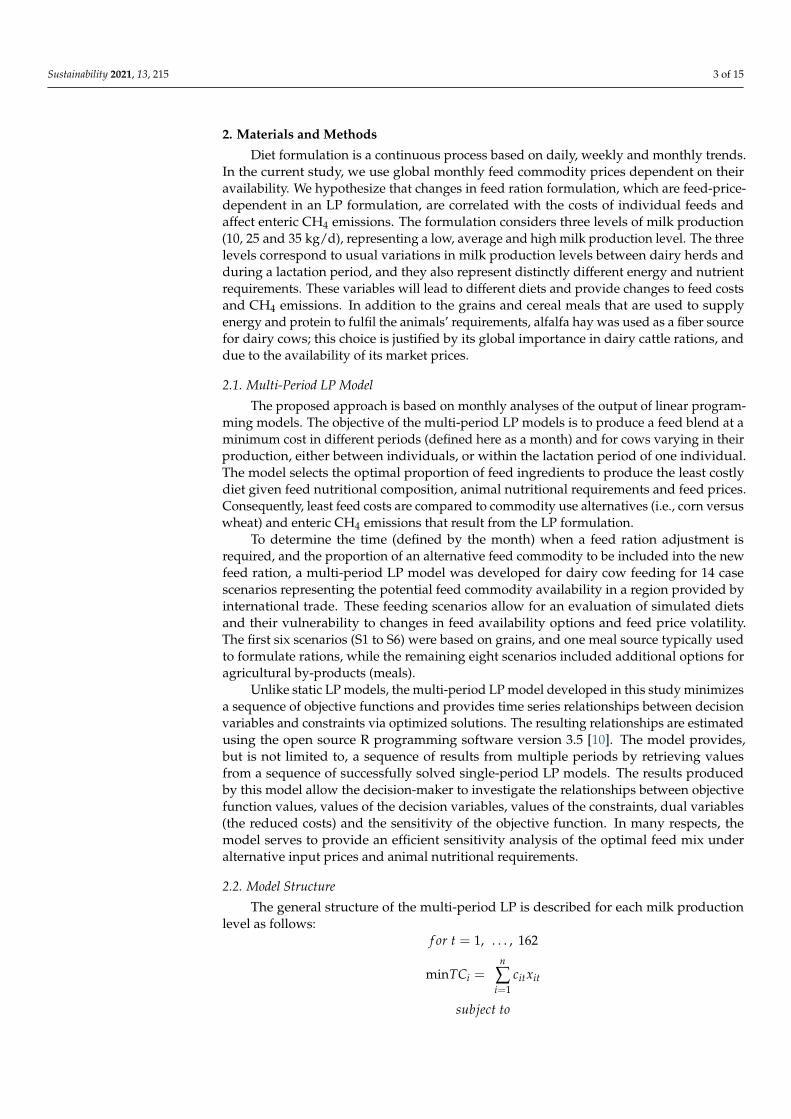
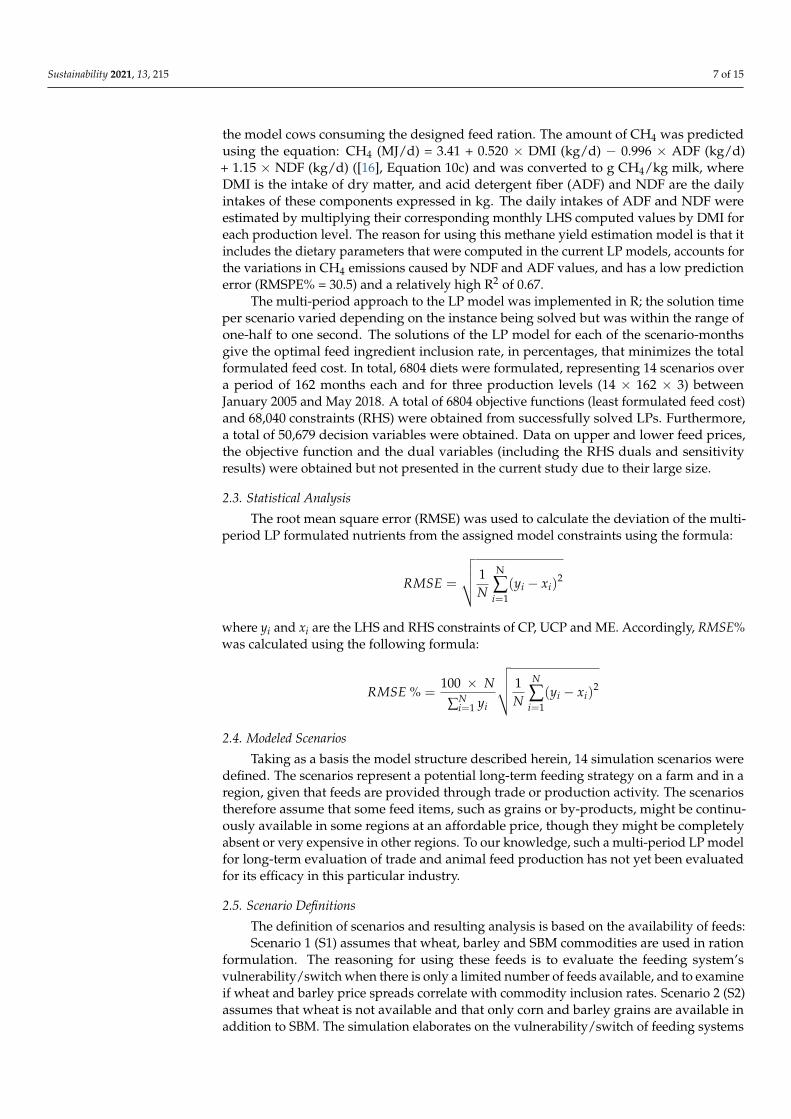
Each table is divided into two parts: The upper part includes multi-period price dataof the objective function, namely the monthly feed ingredient/commodity prices, while thelower part of the table consists of information relevant to the feed ration composition andthe model’s right and left hand side constraints (RHS, LHS) and boundaries for three levelsof daily milk production (10, 25 and 35 kg). The monthly feed commodity prices are savedin an external text format file and linked to the LP model in the R console with functionsto iterate the optimization for each individual monthly set of prices subject to the modelparameters. Monthly feed prices were collected from the World Bank (2018) [11], Ca-soap(Nurisol) prices were provided by Heinrich Nagel KG, Germany, the US average monthlyalfalfa hay prices were obtained from (https://hayandforage.com) [12] and DDGS priceswere obtained from USDA (2018) [13]. Figure 1 shows the historical feed ingredient pricesused in our study.
Sustainability 2020, 12, x FOR PEER REVIEW 6 of 16
Each table is divided into two parts: The upper part includes multi‐period price data of the
objective function, namely the monthly feed ingredient/commodity prices, while the lower part of
the table consists of information relevant to the feed ration composition and the model’s right and
left hand side constraints (RHS, LHS) and boundaries for three levels of daily milk production (10,
25 and 35 kg). The monthly feed commodity prices are saved in an external text format file and linked
to the LP model in the R console with functions to iterate the optimization for each individual
monthly set of prices subject to the model parameters. Monthly feed prices were collected from the
World Bank (2018) [11], Ca‐soap (Nurisol) prices were provided by Heinrich Nagel KG, Germany,
the US average monthly alfalfa hay prices were obtained from (https://hayandforage.com) [12] and
DDGS prices were obtained from USDA (2018) [13]. Figure 1 shows the historical feed ingredient
prices used in our study.
Figure 1. Feed ingredient prices used in the study.
The minimization of the objective function in each period is subject to a set of constraints. These
are the standard feed requirement variables for each milk production level, which are composed of
the weight of total formulated feed ration in kg or percentage dry matter (DM), metabolizable energy
(ME) in Megajoules (MJ), the dietary Crude Protein (CP) in gram per kg of DM, Undegradable Crude
Protein (UCP) in gram per kg of DM, Neutral Detergent Fiber (NDF) in percentage, physically
effective NDF (peNDF) in percentage, fat content in percentage, non‐fiber carbohydrate (NFC) in
percentage, Calcium (Ca) and Phosphorus (P) in gram per kg of DM. Furthermore, upper boundaries
were set to the model for the feed inclusion rate in the case of DDGS and RSM feeding. Ultimately,
the optimized feed ration results are given in dry matter percentages. The nutritional requirements
for the three standard model cows and feed composition data were taken from the NRC (2001) [14].
The peNDF content was calculated according to Mertens (1997) [15]. In particular, all “model cows”
are standard cows with daily milk production of 10, 25 and 35 kg, milk fat of 3.5%, milk protein of
3%, and gaining between 500 g and 300 g of live weight (including gravity products) per day.
The corresponding estimated DM feed intake is 12.4 kg per day for the low milk producing cow
(10 kg/d), 20.3 kg for the average milk producing cow (25 kg/d) and 23.6 kg per day for the high milk
producing cow (35 kg/d). Therefore, feed efficiency expressed as kg of milk per kg of DM intake
estimates would be 0.8, 1.23 and 1.5 for the low, average and high milk producing cow, respectively.
The ME concentrations were set to 8 MJ, 10 MJ and 11 MJ per kg of DM of the formulated ration and
Figure 1. Feed ingredient prices used in the study.
Sustainability 2021, 13, 215 5 of 15
Table 1. The multi-period LP model structure in R with decision variables, objective function and the RHS constraints for three milk production levels (10, 25 and 35 kg/d).
MonthlyFeed Prices SBM DDGS Canola
Meal Barley Wheat Corn Sorghum AlfalfaHay Ca-Soap Dicalcium
Phosphate
Objfn1 Ob1P1 Ob2P1 Ob3P1 Ob4P1 Ob5P1 Ob6P1 Ob7P1 Ob8P1 Ob9P1 Ob10P1Objfn2 Ob1P2 Ob2P2 Ob3P2 Ob4P2 Ob5P2 Ob6P2 Ob7P2 Ob8P2 Ob9P2 Ob10P2Objfn3 . . . . . . . . . . . . . . . . . . . . . . . . . . . . . .Objfnn Ob1Pn Ob2Pn Ob3Pn Ob4Pn Ob5Pn Ob6Pn Ob7Pn Ob8Pn Ob9Pn Ob10Pn
RHSConstraints
Constraints Unit SBM DDGS Canolameal Barley Wheat Corn Sorghum Alfalfa
hay Ca-soap Dicalciumphosphate
10 kgmilk 25 kg milk 35 kg
milk
Constraint 1 Weight kg 1 1 1 1 1 1 1 1 1 1 “=“ 1 1 1Constraint 2 CP g/kg DM 499 297 378 124 142 94 116 192 0 0 “≥“ 119 147 152Constraint 3 UCP g/kg DM 175 172 113 35 33 54 71 52 0 0 “≥“ 22 49 55Constraint 4 NFC % 27 16 19 63 70 76 69 25 0 0 “≤“ 44 44 44Constraint 5 Fat % 1.6 10 5.4 2.2 2.3 4.2 3.1 2.5 84.5 0 “≤“ 5 5 5
Constraint 6 ME MJ/kgDM 13.8 12.7 11.5 12.2 13 13.1 11.5 8.2 26.2 0 “≥“ 8 10 11
Constraint 7 NDF % 15 39 30 21 13 10 11 42 0 0 “≥“,“≤“ 27–35 27–33 27–33
Constraint 8 Ca g/kg DM 4 1 8 1 1 0 1 15 0 176 “≥“ 4.07 6.03 6.7Constraint 9 P g/kg DM 7.1 6.6 11.6 3.8 4.3 3 2.8 2.4 0 205 “≥“ 2.64 3.8 3.6Constraint 10 peNDF % 6 15.5 11.9 14.7 8 3.8 6.5 39.5 0 0 “≥“ 22 22 22
Upper bound % inf 20 15 inf inf inf inf inf inf 2Lower bound 0 0 0 0 0 0 0 0 0 0
RHS: right hand side, LP: linear programming, objfn1 to n: data represent the monthly objective function (feed price Ob1P1 to Ob10Pn) of each feed included in each LP model, inf: infinitive upper feed inclusionlimit, SBM: soybean meal, DDGS: distiller’s dried grains with solubles, CP: crude protein, UCP: undegradable crude protein, NFC: non-fiber carbohydrate, ME: metabolizable energy, NDF: neutral detergent fiber,Ca: calcium, P: phosphorus, peNDF: physically effective NDF calculated according to Mertens et al. (1997).
Sustainability 2021, 13, 215 6 of 15
The minimization of the objective function in each period is subject to a set of con-straints. These are the standard feed requirement variables for each milk production level,which are composed of the weight of total formulated feed ration in kg or percentage drymatter (DM), metabolizable energy (ME) in Megajoules (MJ), the dietary Crude Protein(CP) in gram per kg of DM, Undegradable Crude Protein (UCP) in gram per kg of DM,Neutral Detergent Fiber (NDF) in percentage, physically effective NDF (peNDF) in per-centage, fat content in percentage, non-fiber carbohydrate (NFC) in percentage, Calcium(Ca) and Phosphorus (P) in gram per kg of DM. Furthermore, upper boundaries were setto the model for the feed inclusion rate in the case of DDGS and RSM feeding. Ultimately,the optimized feed ration results are given in dry matter percentages. The nutritional re-quirements for the three standard model cows and feed composition data were taken fromthe NRC (2001) [14]. The peNDF content was calculated according to Mertens (1997) [15].In particular, all “model cows” are standard cows with daily milk production of 10, 25 and35 kg, milk fat of 3.5%, milk protein of 3%, and gaining between 500 g and 300 g of liveweight (including gravity products) per day.
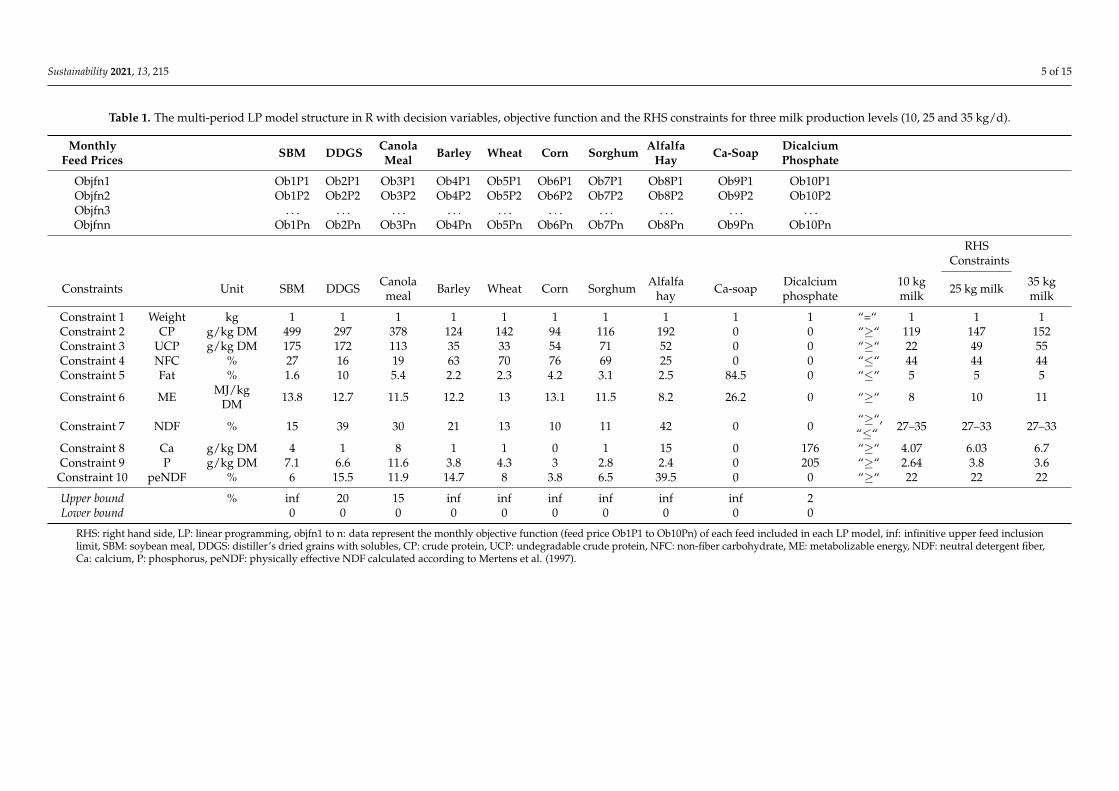
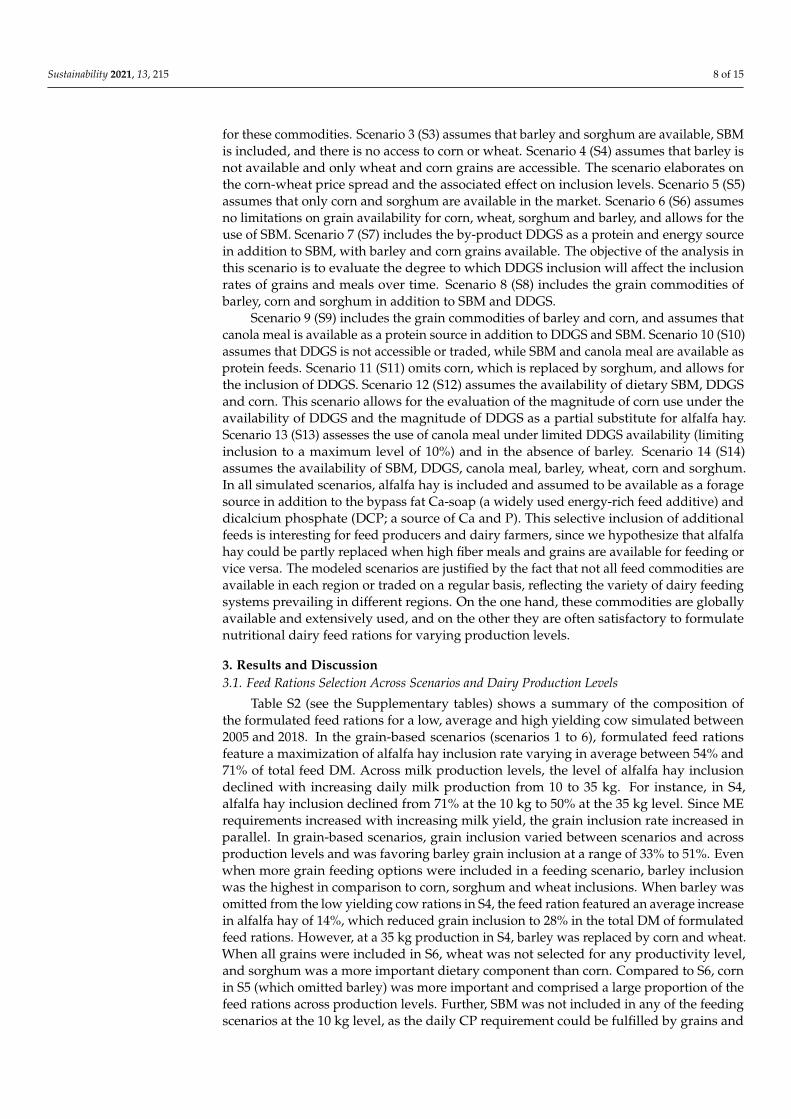
The corresponding estimated DM feed intake is 12.4 kg per day for the low milkproducing cow (10 kg/d), 20.3 kg for the average milk producing cow (25 kg/d) and23.6 kg per day for the high milk producing cow (35 kg/d). Therefore, feed efficiencyexpressed as kg of milk per kg of DM intake estimates would be 0.8, 1.23 and 1.5 for thelow, average and high milk producing cow, respectively. The ME concentrations were set to8 MJ, 10 MJ and 11 MJ per kg of DM of the formulated ration and CP concentrations wereset to 119 g, 141 g and 152 g per kg of DM of the formulated ration for the low, averageand high yielding cow, respectively [14]. UCP dietary content was set to 22 g, 49 g and55 g per kg of DM of the formulated ration for the low, average and high producing cow,respectively. The nutrient requirements and feed composition of the “model cows” arelisted in Table 1. Figure 2 illustrates the multi-period LP model inputs and outputs for14 dairy feeding scenarios and for three levels of milk production.
Feed ingredients composition per feeding scenario (14 scenarios)
Monthly feed ingredient prices (162 months)
Model inputs Model outputs
Nutrient requirements of cows(3 milk production levels)
LP formulation
Ration cost
Ration composition, ingredient switch
Nutrient limits
Methane yield
Reduced cost and sensitivity
Figure 2 Illustration of the multi-period linear programming feed formulation model inputs and outputs for 14 dairy feeding scenarios and for three levels of milkproduction.
Figure 2. Illustration of the multi-period linear programming feed formulation model inputs and outputs for 14 dairyfeeding scenarios and for three levels of milk production.
The modeling approach considers the variations in milk production level within aherd or between herds, which is expected to induce changes to the feed ration subjectto market feed prices. However, milk production fluctuation due to seasonal differencesbetween regions was not captured in the current analysis due to the added complexity ofincluding it in the same feeding model. The non-zero, non-negative constraint directionswere assumed in equality and non-equality forms.
The major objective of this study was to develop a decision-making tool with aneconomic perspective. Yet, for each scenario and each month, the analysis also providesresults for the enteric methane yield (CH4) that would be potentially emitted by each of
Sustainability 2021, 13, 215 7 of 15
the model cows consuming the designed feed ration. The amount of CH4 was predictedusing the equation: CH4 (MJ/d) = 3.41 + 0.520 × DMI (kg/d) − 0.996 × ADF (kg/d)+ 1.15 × NDF (kg/d) ([16], Equation 10c) and was converted to g CH4/kg milk, whereDMI is the intake of dry matter, and acid detergent fiber (ADF) and NDF are the dailyintakes of these components expressed in kg. The daily intakes of ADF and NDF wereestimated by multiplying their corresponding monthly LHS computed values by DMI foreach production level. The reason for using this methane yield estimation model is that itincludes the dietary parameters that were computed in the current LP models, accounts forthe variations in CH4 emissions caused by NDF and ADF values, and has a low predictionerror (RMSPE% = 30.5) and a relatively high R2 of 0.67.
The multi-period approach to the LP model was implemented in R; the solution timeper scenario varied depending on the instance being solved but was within the range ofone-half to one second. The solutions of the LP model for each of the scenario-monthsgive the optimal feed ingredient inclusion rate, in percentages, that minimizes the totalformulated feed cost. In total, 6804 diets were formulated, representing 14 scenarios overa period of 162 months each and for three production levels (14 × 162 × 3) betweenJanuary 2005 and May 2018. A total of 6804 objective functions (least formulated feed cost)and 68,040 constraints (RHS) were obtained from successfully solved LPs. Furthermore,a total of 50,679 decision variables were obtained. Data on upper and lower feed prices,the objective function and the dual variables (including the RHS duals and sensitivityresults) were obtained but not presented in the current study due to their large size.
2.3. Statistical Analysis
The root mean square error (RMSE) was used to calculate the deviation of the multi-period LP formulated nutrients from the assigned model constraints using the formula:
RMSE =
√√√√ 1N
N
∑i=1
(yi − xi)2
where yi and xi are the LHS and RHS constraints of CP, UCP and ME. Accordingly, RMSE%was calculated using the following formula:
RMSE % =100 × N
∑Ni=1 yi
√√√√ 1N
N
∑i=1
(yi − xi)2
2.4. Modeled Scenarios
Taking as a basis the model structure described herein, 14 simulation scenarios weredefined. The scenarios represent a potential long-term feeding strategy on a farm and in aregion, given that feeds are provided through trade or production activity. The scenariostherefore assume that some feed items, such as grains or by-products, might be continu-ously available in some regions at an affordable price, though they might be completelyabsent or very expensive in other regions. To our knowledge, such a multi-period LP modelfor long-term evaluation of trade and animal feed production has not yet been evaluatedfor its efficacy in this particular industry.
2.5. Scenario Definitions
The definition of scenarios and resulting analysis is based on the availability of feeds:Scenario 1 (S1) assumes that wheat, barley and SBM commodities are used in ration
formulation. The reasoning for using these feeds is to evaluate the feeding system’svulnerability/switch when there is only a limited number of feeds available, and to examineif wheat and barley price spreads correlate with commodity inclusion rates. Scenario 2 (S2)assumes that wheat is not available and that only corn and barley grains are available inaddition to SBM. The simulation elaborates on the vulnerability/switch of feeding systems
Sustainability 2021, 13, 215 8 of 15
for these commodities. Scenario 3 (S3) assumes that barley and sorghum are available, SBMis included, and there is no access to corn or wheat. Scenario 4 (S4) assumes that barley isnot available and only wheat and corn grains are accessible. The scenario elaborates onthe corn-wheat price spread and the associated effect on inclusion levels. Scenario 5 (S5)assumes that only corn and sorghum are available in the market. Scenario 6 (S6) assumesno limitations on grain availability for corn, wheat, sorghum and barley, and allows for theuse of SBM. Scenario 7 (S7) includes the by-product DDGS as a protein and energy sourcein addition to SBM, with barley and corn grains available. The objective of the analysis inthis scenario is to evaluate the degree to which DDGS inclusion will affect the inclusionrates of grains and meals over time. Scenario 8 (S8) includes the grain commodities ofbarley, corn and sorghum in addition to SBM and DDGS.
Scenario 9 (S9) includes the grain commodities of barley and corn, and assumes thatcanola meal is available as a protein source in addition to DDGS and SBM. Scenario 10 (S10)assumes that DDGS is not accessible or traded, while SBM and canola meal are available asprotein feeds. Scenario 11 (S11) omits corn, which is replaced by sorghum, and allows forthe inclusion of DDGS. Scenario 12 (S12) assumes the availability of dietary SBM, DDGSand corn. This scenario allows for the evaluation of the magnitude of corn use under theavailability of DDGS and the magnitude of DDGS as a partial substitute for alfalfa hay.Scenario 13 (S13) assesses the use of canola meal under limited DDGS availability (limitinginclusion to a maximum level of 10%) and in the absence of barley. Scenario 14 (S14)assumes the availability of SBM, DDGS, canola meal, barley, wheat, corn and sorghum.In all simulated scenarios, alfalfa hay is included and assumed to be available as a foragesource in addition to the bypass fat Ca-soap (a widely used energy-rich feed additive) anddicalcium phosphate (DCP; a source of Ca and P). This selective inclusion of additionalfeeds is interesting for feed producers and dairy farmers, since we hypothesize that alfalfahay could be partly replaced when high fiber meals and grains are available for feeding orvice versa. The modeled scenarios are justified by the fact that not all feed commodities areavailable in each region or traded on a regular basis, reflecting the variety of dairy feedingsystems prevailing in different regions. On the one hand, these commodities are globallyavailable and extensively used, and on the other they are often satisfactory to formulatenutritional dairy feed rations for varying production levels.
3. Results and Discussion3.1. Feed Rations Selection Across Scenarios and Dairy Production Levels
Table S2 (see the Supplementary tables) shows a summary of the composition ofthe formulated feed rations for a low, average and high yielding cow simulated between2005 and 2018. In the grain-based scenarios (scenarios 1 to 6), formulated feed rationsfeature a maximization of alfalfa hay inclusion rate varying in average between 54% and71% of total feed DM. Across milk production levels, the level of alfalfa hay inclusiondeclined with increasing daily milk production from 10 to 35 kg. For instance, in S4,alfalfa hay inclusion declined from 71% at the 10 kg to 50% at the 35 kg level. Since MErequirements increased with increasing milk yield, the grain inclusion rate increased inparallel. In grain-based scenarios, grain inclusion varied between scenarios and acrossproduction levels and was favoring barley grain inclusion at a range of 33% to 51%. Evenwhen more grain feeding options were included in a feeding scenario, barley inclusionwas the highest in comparison to corn, sorghum and wheat inclusions. When barley wasomitted from the low yielding cow rations in S4, the feed ration featured an average increasein alfalfa hay of 14%, which reduced grain inclusion to 28% in the total DM of formulatedfeed rations. However, at a 35 kg production in S4, barley was replaced by corn and wheat.When all grains were included in S6, wheat was not selected for any productivity level,and sorghum was a more important dietary component than corn. Compared to S6, cornin S5 (which omitted barley) was more important and comprised a large proportion of thefeed rations across production levels. Further, SBM was not included in any of the feedingscenarios at the 10 kg level, as the daily CP requirement could be fulfilled by grains and
Sustainability 2021, 13, 215 9 of 15
alfalfa hay. However, at 35 kg daily milk production, SBM inclusion increased and variedon average between 9% and 12%.
The low grain inclusion for the low yielding cow is driven by the low energy re-quirement of 8 MJ/kg DM, where a basic diet of barley and alfalfa hay could fulfill therequirements. Ca-soap was an important energy source at the high milk production level,but only in the grain-based feeding, with the inclusion rate varying between 1% and 2%.The dietary selection of Ca-soap was driven by the increasing ME demand of 11 MJ/kg ofDM in the high milk producing cow. Overall, grain-based feeding maximized the inclusionof SBM and alfalfa hay compared to multiple meal feeding scenarios. In the meal-basedscenarios (S7 to S14), the inclusion of DDGS and canola meal significantly reduced thealfalfa hay use compared to the grain-based scenarios. In average, alfalfa hay inclusionvaried between 30% and 63% for the high and low yielding cows, respectively, whereasDDGS inclusion varied between 6% and 20% for high and low yielding cows, respectively.Moreover, in the meal-based scenarios, SBM was only important in the absence of DDGSand barley grain. Compared to grain-based scenarios, the availability of additional mealsources such as DDGS and canola did not affect grain inclusion significantly. Unlike ingrain feeding scenarios in which SBM was not important for low producing cows’ rations,in the meal feeding scenarios DDGS was selected in all scenarios, except in S10, since canolameal was used in the formulation. The presence of additional meal sources minimizedthe inclusion of dietary SBM and alfalfa hay. In average, and taking all scenarios andproduction levels into account, dietary meal inclusion was 10% greater (i.e., 14% inclusionrate) in meal feeding scenarios than in grain feeding scenarios (i.e., 4% inclusion rate),while the alfalfa hay inclusion rate was 11% greater in the grain scenarios than in themeal scenarios (i.e., in average 52% versus 43% in the grain and meal feeding scenarios,respectively). Most of the dietary variations between grain and meal feeding scenarioswere driven by the greater inclusion rate of alfalfa hay in the grain feeding scenarios.Therefore, meals are important feeding sources for partly replacing alfalfa hay. Table S3(see the Supplementary tables) provides a summary of the dairy rations’ concentrations ofCP, UCP and ME and the associated optimization errors (representing deviations from theRHS constraints) for all studied scenarios and milk production levels from the solved timeseries analyses. The model evaluation is based on the calculated root mean squared error(RMSE) in absolute and percentage terms. In relation to the multiple formulation dataobtained from successfully solved LPs, the magnitude of the error in the proposed modelswas calculated. The major optimization errors are due to deviations in crude protein resultsimposed by the constraints on feed formulation requirements.
In feed ration formulation for low milk production, the average RMSE% for CP var-ied between 26% and 31% in grain- and meal-based diets, respectively (i.e., in average41 versus 53 g CP excess/kg DM formulated feed in grain and meal based diets, respec-tively), which is significantly greater than that under average and high milk production.At 25 kg milk diet formulation, RMSE% for CP was lowest and ranged between 10% and17% (i.e., 15 vs. 27 g CP excess/kg of DM in grain- and meal-based diets, respectively). Ata milk production of 35 kg, RMSE% for CP did not vary between grain- and meal-basedfeeding scenarios, with CP excess being 32 g/kg of DM formulated feed. In meal feedingscenarios, the decision of including SBM in high yielding cows’ diet is subject to DDGSand barley availability. For instance, in the absence of barley in S12 and S13, SBM wasincluded at different rates, in spite of DDGS being included in the formulation. Moreover,in grain feeding scenarios, SBM was included at maximum levels ranging between 9% and10%, which can be compared with DDGS inclusion rates of 18% and 20% in meal feedingscenarios with fully available DDGS and barley. Furthermore, ME was limiting in highyielding cows’ diets, in particular in the grain feeding scenarios, which justified a greaterinclusion of SBM, causing an excess in the formulated CP. This conclusion was supportedby the inclusion of additional energy supplied by Ca-soap, which was greater in the grainfeeding than in the meal feeding scenarios. However, RMSE% of ME was greatest in the10 kg milk feed ration (i.e., ME excess varied between 2 and 3 MJ/kg of DM), while it
Sustainability 2021, 13, 215 10 of 15
was lowest in the 35 kg milk diet. In this regard, Alqaisi et al. (2019) [5] stated that themagnitude at which the CP formulation error could be minimized depends on the levelof competitiveness between meal feeds, which is not only quality-dependent, but alsoprice-dependent.
3.2. Predicted Methane Production in Relation to Feed Cost
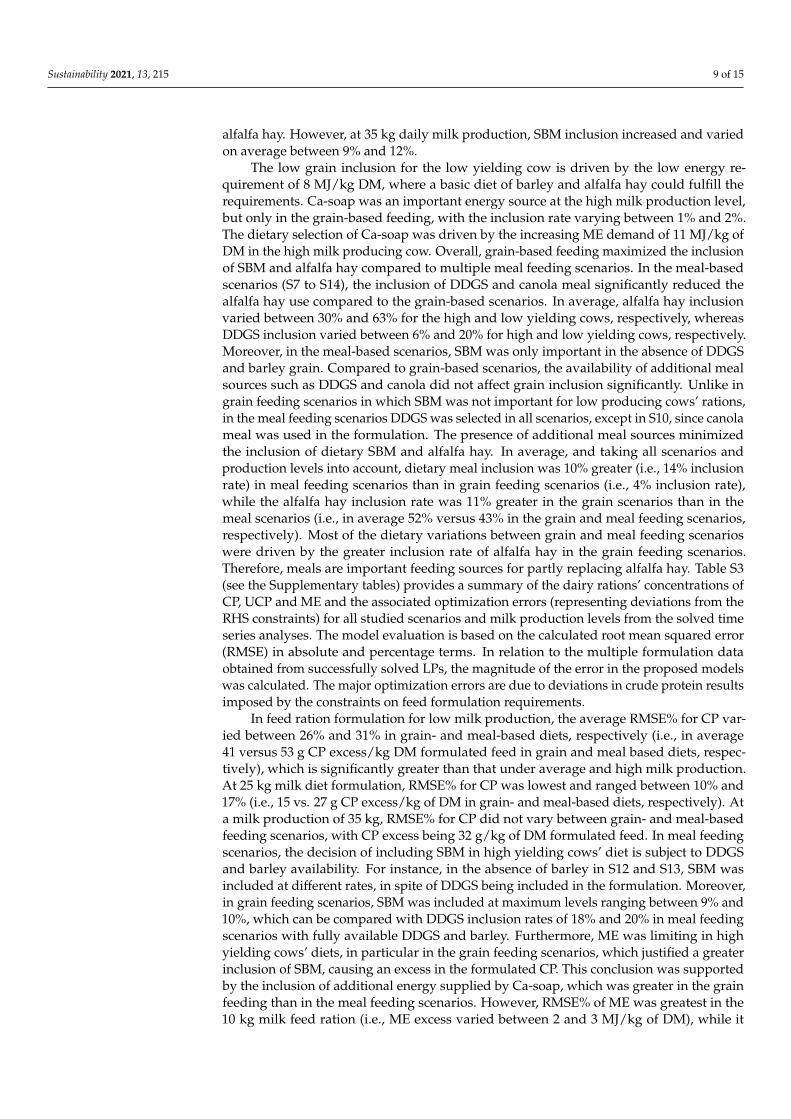
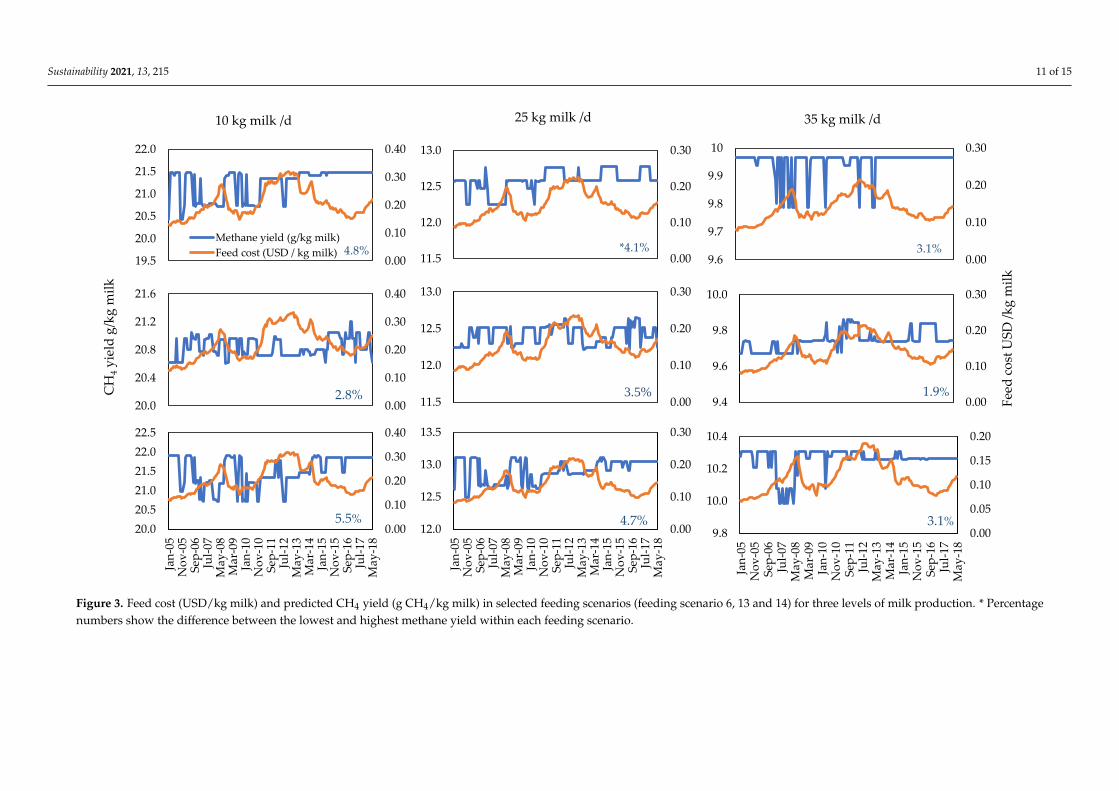
Figures 3 and 4 (and further graphical illustrations in the supplementary Figures S1–S3)show the predicted CH4 yield (g CH4/kg milk) and feed ration cost (USD/kg milk) at differentlevels of milk production and for different feeding scenarios throughout the study duration.The predicted levels of CH4 emissions reflect the feed ration composition across scenarios andlevels of milk production. In average, the emission of the 10 kg milk producing cow variedbetween 20.7 and 21.6 g CH4/kg milk. At 25 kg milk production, the predicted CH4 was40% lower compared to the 10 kg milk producing cow, and varied between 12.2 and 12.9 gCH4/kg milk. At a high daily milk production of 35 kg, CH4 production varied between9.47 and 10.25 g CH4/kg milk. This emission level is 21% and 53% lower than in the averageand low milk producing cows, respectively. The magnitude of CH4 reduction (the relativeproportion between minimum and maximum CH4 production) in each feeding scenario andacross production levels is elaborated in the same figures in percentage terms. At 10 kg milkproduction, the potential to reduce CH4 production varied between 0.6% in S1 and 5.5% in S8(average = 3.9%). At 25 kg milk production, the potential to reduce CH4 production was lowerthan in a 10 kg milk producing cow and varied between 0.1% and 5.7% (average = 3.2%). At35 kg milk production, the potential to reduce CH4 production was lower than in the 25 and10 kg milk producing cows and varied between 0.3 and 4.2% (average = 2.2%). Our resultscould be interpreted in such a way that the potential for selecting feed rations that reduceCH4 production declines with increasing milk production.
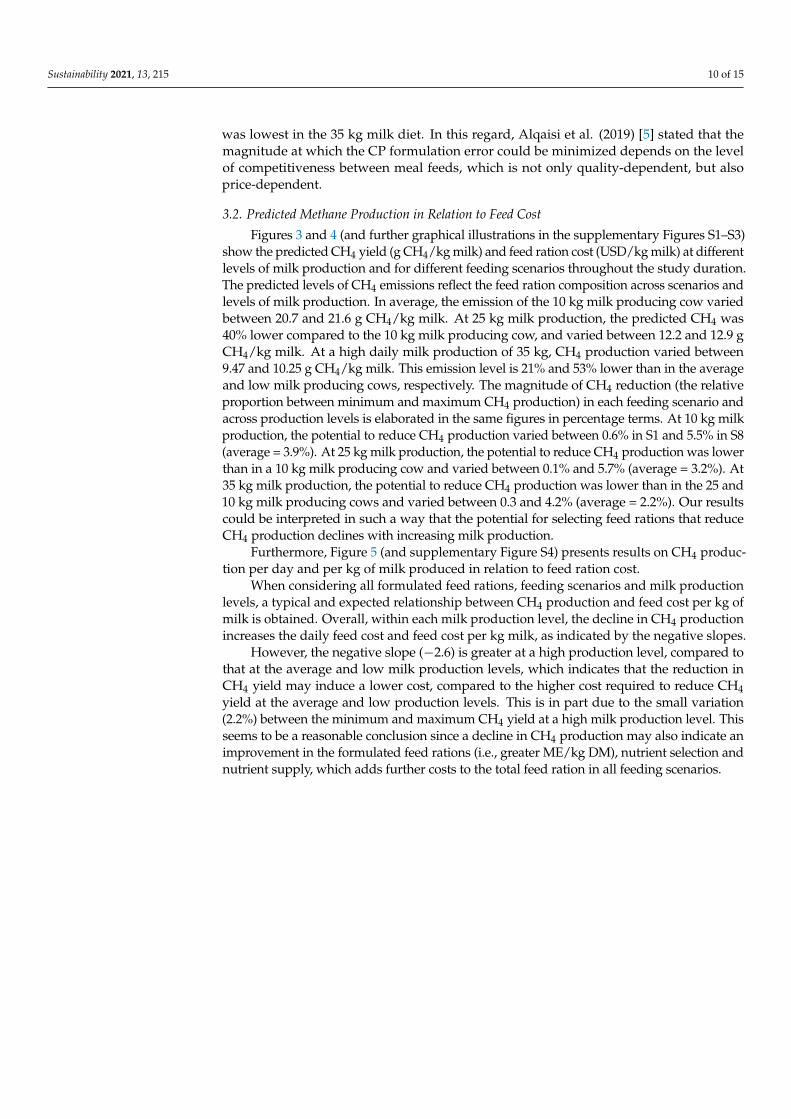
Furthermore, Figure 5 (and supplementary Figure S4) presents results on CH4 produc-tion per day and per kg of milk produced in relation to feed ration cost.
When considering all formulated feed rations, feeding scenarios and milk productionlevels, a typical and expected relationship between CH4 production and feed cost per kg ofmilk is obtained. Overall, within each milk production level, the decline in CH4 productionincreases the daily feed cost and feed cost per kg milk, as indicated by the negative slopes.
However, the negative slope (−2.6) is greater at a high production level, compared tothat at the average and low milk production levels, which indicates that the reduction inCH4 yield may induce a lower cost, compared to the higher cost required to reduce CH4yield at the average and low production levels. This is in part due to the small variation(2.2%) between the minimum and maximum CH4 yield at a high milk production level. Thisseems to be a reasonable conclusion since a decline in CH4 production may also indicate animprovement in the formulated feed rations (i.e., greater ME/kg DM), nutrient selection andnutrient supply, which adds further costs to the total feed ration in all feeding scenarios.
Sustainability 2021, 13, 215 11 of 15
10 kg milk /d 35 kg milk /d25 kg milk /d
0.00
0.10
0.20
0.30
0.40
20.0
20.4
20.8
21.2
21.6
0.00
0.10
0.20
0.30
0.40
20.0
20.5
21.0
21.5
22.0
22.5
Jan
-05
No
v-0
5S
ep-0
6Ju
l-07
May
-08
Mar
-09
Jan
-10
No
v-1
0S
ep-1
1Ju
l-12
May
-13
Mar
-14
Jan
-15
No
v-1
5S
ep-1
6Ju
l-17
May
-18
0.00
0.10
0.20
0.30
12.0
12.5
13.0
13.5
Jan
-05
No
v-0
5S
ep-0
6Ju
l-07
May
-08
Mar
-09
Jan
-10
No
v-1
0S
ep-1
1Ju
l-12
May
-13
Mar
-14
Jan
-15
No
v-1
5S
ep-1
6Ju
l-17
May
-18
0.00
0.10
0.20
0.30
9.4
9.6
9.8
10.0
0.00
0.05
0.10
0.15
0.20
9.8
10.0
10.2
10.4
Jan
-05
No
v-0
5S
ep-0
6Ju
l-07
May
-08
Mar
-09
Jan
-10
No
v-1
0S
ep-1
1Ju
l-12
May
-13
Mar
-14
Jan
-15
No
v-1
5S
ep-1
6Ju
l-17
May
-18
0.00
0.10
0.20
0.30
0.40
19.5
20.0
20.5
21.0
21.5
22.0
Methane yield (g/kg milk)
Feed cost (USD / kg milk)0.00
0.10
0.20
0.30
11.5
12.0
12.5
13.0
0.00
0.10
0.20
0.30
9.6
9.7
9.8
9.9
10
0.00
0.10
0.20
0.30
11.5
12.0
12.5
13.0
CH
4y
ield
g/k
g m
ilk
Fee
d c
ost
US
D /
kg
mil
k
4.8%
2.8%
*4.1%
3.5%
3.1%
1.9%
5.5% 3.1%4.7%
Figure 3. Feed cost (USD/kg milk) and predicted CH4 yield (g CH4/kg milk) in selected feeding scenarios (feeding scenario 6, 13 and 14) for three levels of milk production. * Percentage numbers show the difference between the lowest and highest methane yield within each feeding scenario
Figure 3. Feed cost (USD/kg milk) and predicted CH4 yield (g CH4/kg milk) in selected feeding scenarios (feeding scenario 6, 13 and 14) for three levels of milk production. * Percentagenumbers show the difference between the lowest and highest methane yield within each feeding scenario.
Sustainability 2021, 13, 215 12 of 15Sustainability 2020, 12, x FOR PEER REVIEW 12 of 16
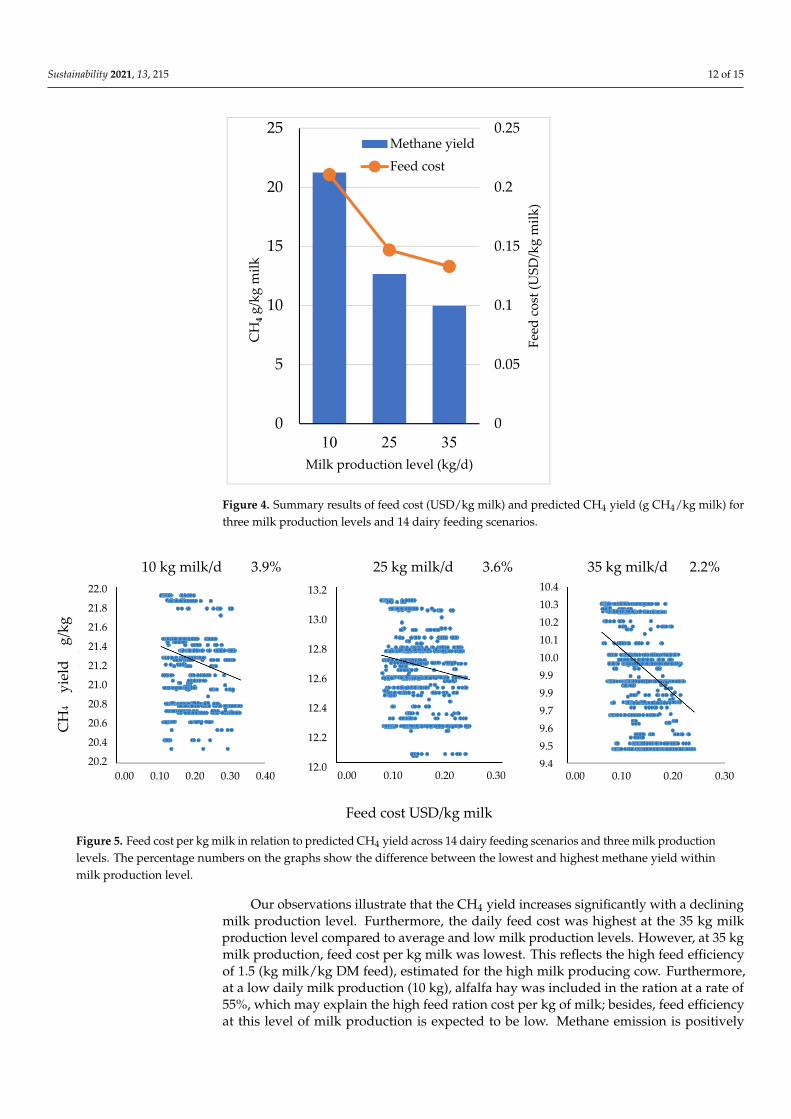
Figure 4. Summary results of feed cost (USD/kg milk) and predicted CH4 yield (g CH4/kg milk) for
three milk production levels and 14 dairy feeding scenarios.
Furthermore, Figure 5 (and supplementary Figure S4) presents results on CH4 production per
day and per kg of milk produced in relation to feed ration cost.
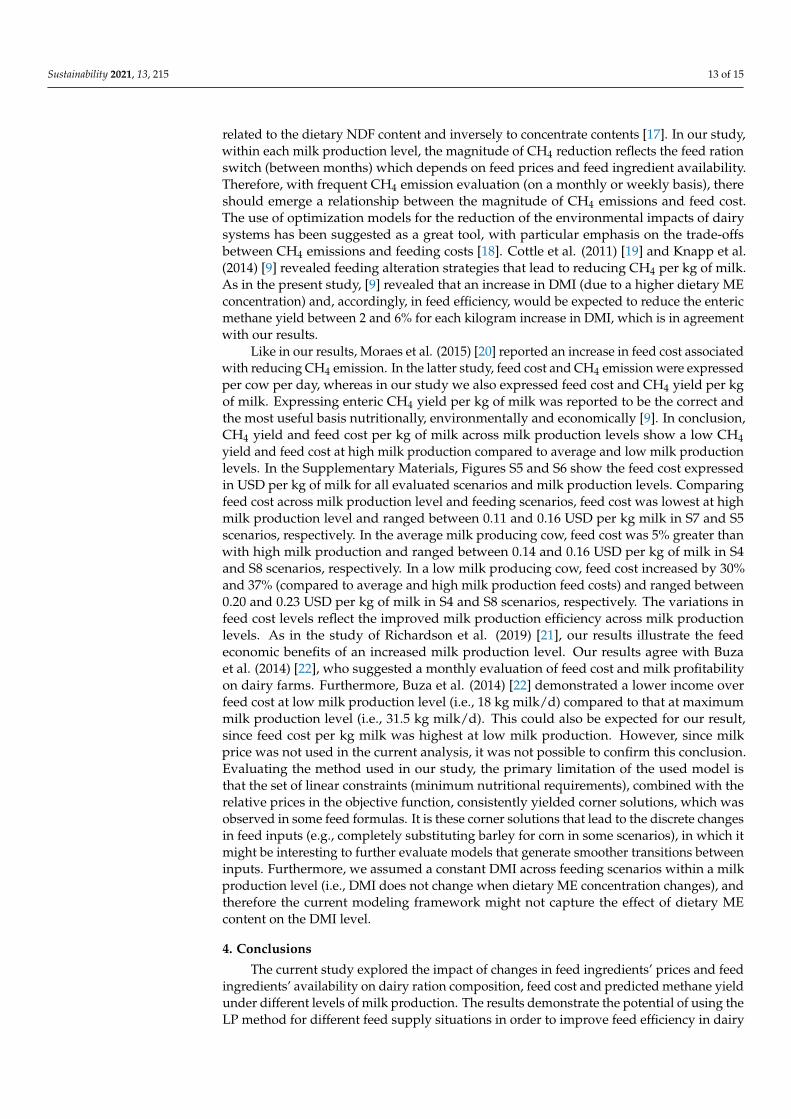
Figure 5. Feed cost per kg milk in relation to predicted CH4 yield across 14 dairy feeding scenarios
and three milk production levels. The percentage numbers on the graphs show the difference between
the lowest and highest methane yield within milk production level.
When considering all formulated feed rations, feeding scenarios and milk production levels, a
typical and expected relationship between CH4 production and feed cost per kg of milk is obtained.
Overall, within each milk production level, the decline in CH4 production increases the daily feed
cost and feed cost per kg milk, as indicated by the negative slopes.
However, the negative slope (−2.6) is greater at a high production level, compared to that at the
average and low milk production levels, which indicates that the reduction in CH4 yield may induce
a lower cost, compared to the higher cost required to reduce CH4 yield at the average and low
production levels. This is in part due to the small variation (2.2%) between the minimum and
maximum CH4 yield at a high milk production level. This seems to be a reasonable conclusion since
0
0.05
0.1
0.15
0.2
0.25
0
5
10
15
20
25
10 25 35
Feed cost (USD/kg m
ilk)
CH4g/kg m
ilk
Milk production level (kg/d)
Methane yield
Feed cost
Figure 4. Summary results of feed cost (USD/kg milk) and predicted CH4 yield (g CH4/kg milk) forthree milk production levels and 14 dairy feeding scenarios.
10 kg milk/d 3.9% 25 kg milk/d 3.6% 35 kg milk/d 2.2%
Feed cost USD/kg milk
CH
4 y
ield
g
/kg
22.0
21.8
21.6
21.4
21.2
21.0
20.8
20.6
20.4
20.2
13.2
13.0
12.8
12.6
12.4
12.2
12.0
10.4
10.3
10.2
10.1
10.0
9.9
9.9
9.7
9.6
9.5
9.4 0.00 0.10 0.20 0.30 0.40 0.00 0.10 0.20 0.30 0.00 0.10 0.20 0.30
Figure 5. Feed cost per kg milk in relation to predicted CH4 yield across 14 dairy feeding scenarios and three milk productionlevels. The percentage numbers on the graphs show the difference between the lowest and highest methane yield withinmilk production level.
Our observations illustrate that the CH4 yield increases significantly with a decliningmilk production level. Furthermore, the daily feed cost was highest at the 35 kg milkproduction level compared to average and low milk production levels. However, at 35 kgmilk production, feed cost per kg milk was lowest. This reflects the high feed efficiencyof 1.5 (kg milk/kg DM feed), estimated for the high milk producing cow. Furthermore,at a low daily milk production (10 kg), alfalfa hay was included in the ration at a rate of55%, which may explain the high feed ration cost per kg of milk; besides, feed efficiencyat this level of milk production is expected to be low. Methane emission is positively
Sustainability 2021, 13, 215 13 of 15
related to the dietary NDF content and inversely to concentrate contents [17]. In our study,within each milk production level, the magnitude of CH4 reduction reflects the feed rationswitch (between months) which depends on feed prices and feed ingredient availability.Therefore, with frequent CH4 emission evaluation (on a monthly or weekly basis), thereshould emerge a relationship between the magnitude of CH4 emissions and feed cost.The use of optimization models for the reduction of the environmental impacts of dairysystems has been suggested as a great tool, with particular emphasis on the trade-offsbetween CH4 emissions and feeding costs [18]. Cottle et al. (2011) [19] and Knapp et al.(2014) [9] revealed feeding alteration strategies that lead to reducing CH4 per kg of milk.As in the present study, [9] revealed that an increase in DMI (due to a higher dietary MEconcentration) and, accordingly, in feed efficiency, would be expected to reduce the entericmethane yield between 2 and 6% for each kilogram increase in DMI, which is in agreementwith our results.
Like in our results, Moraes et al. (2015) [20] reported an increase in feed cost associatedwith reducing CH4 emission. In the latter study, feed cost and CH4 emission were expressedper cow per day, whereas in our study we also expressed feed cost and CH4 yield per kgof milk. Expressing enteric CH4 yield per kg of milk was reported to be the correct andthe most useful basis nutritionally, environmentally and economically [9]. In conclusion,CH4 yield and feed cost per kg of milk across milk production levels show a low CH4yield and feed cost at high milk production compared to average and low milk productionlevels. In the Supplementary Materials, Figures S5 and S6 show the feed cost expressedin USD per kg of milk for all evaluated scenarios and milk production levels. Comparingfeed cost across milk production level and feeding scenarios, feed cost was lowest at highmilk production level and ranged between 0.11 and 0.16 USD per kg milk in S7 and S5scenarios, respectively. In the average milk producing cow, feed cost was 5% greater thanwith high milk production and ranged between 0.14 and 0.16 USD per kg of milk in S4and S8 scenarios, respectively. In a low milk producing cow, feed cost increased by 30%and 37% (compared to average and high milk production feed costs) and ranged between0.20 and 0.23 USD per kg of milk in S4 and S8 scenarios, respectively. The variations infeed cost levels reflect the improved milk production efficiency across milk productionlevels. As in the study of Richardson et al. (2019) [21], our results illustrate the feedeconomic benefits of an increased milk production level. Our results agree with Buzaet al. (2014) [22], who suggested a monthly evaluation of feed cost and milk profitabilityon dairy farms. Furthermore, Buza et al. (2014) [22] demonstrated a lower income overfeed cost at low milk production level (i.e., 18 kg milk/d) compared to that at maximummilk production level (i.e., 31.5 kg milk/d). This could also be expected for our result,since feed cost per kg milk was highest at low milk production. However, since milkprice was not used in the current analysis, it was not possible to confirm this conclusion.Evaluating the method used in our study, the primary limitation of the used model isthat the set of linear constraints (minimum nutritional requirements), combined with therelative prices in the objective function, consistently yielded corner solutions, which wasobserved in some feed formulas. It is these corner solutions that lead to the discrete changesin feed inputs (e.g., completely substituting barley for corn in some scenarios), in which itmight be interesting to further evaluate models that generate smoother transitions betweeninputs. Furthermore, we assumed a constant DMI across feeding scenarios within a milkproduction level (i.e., DMI does not change when dietary ME concentration changes), andtherefore the current modeling framework might not capture the effect of dietary MEcontent on the DMI level.
4. Conclusions
The current study explored the impact of changes in feed ingredients’ prices and feedingredients’ availability on dairy ration composition, feed cost and predicted methane yieldunder different levels of milk production. The results demonstrate the potential of using theLP method for different feed supply situations in order to improve feed efficiency in dairy
Sustainability 2021, 13, 215 14 of 15
production. The method further allows for the estimation of cows’ CH4 production subjectto dietary changes across months. Within each milk production level, the magnitude ofCH4 reduction reflects the monthly switch in feed commodities which depends on feedprice and feed availability. The study shows that CH4 mitigation has greater potentialin low producing cows than in average and high yielding cows. These cows are mostlylocated in low income countries in Asia, Africa and Latin America. Therefore, our resultscan be primarily utilized to improve the efficiency of low yielding cows, which wouldbe a key strategy to mitigate CH4 and improve economic benefits from dairy productionin different geographical locations. This conclusion is supported by the fact that feedingredients’ production may be disrupted in a particular geographical region for manyreasons, which may affect the supply to other regions. Finally, the model provides dietselection options that can improve dairy herds’ efficiency and mitigate the environmentalimpacts of milk production.
Supplementary Materials: The following are available online at https://www.mdpi.com/2071-1050/13/1/215/s1, Figure S1: Feed cost (USD/kg milk) and predicted CH4 yield (g CH4/kg milk) forfourteen feeding scenarios for the low milk producing cow (10 kg/d), Figure S2: Feed cost (USD/kgmilk) and predicted CH4 yield (g CH4/kg milk) for fourteen feeding scenarios for the average milkproducing cow (25 kg/d), Figure S3: Feed cost (USD/kg milk) and predicted CH4 yield (g CH4/ kgmilk) for fourteen feeding scenarios for the high milk producing cow (35 kg/d), Figure S4: Dailyfeed cost in relation to predicted CH4 yield across fourteen dairy feeding scenarios and three milkproduction levels, Figure S5: Minimum, maximum, and average feed ration cost USD/kg milk,Figure S6: Feed cost (USD /kg milk) in fourteen dairy feeding scenarios for three milk productionlevels between Jan 2005 and May 2018, Table S1: Summary of minimum, maximum, and averagefeed ingredient inclusion rate (% of dry matter) in fourteen dairy feeding scenarios and for threemilk production levels (10, 25 and 35 kg/d) formulated between January 2005 and May 2018 (totalformulated feed rations= 6804), Table S2: Statistics and RMSE of formulated crude protein (CP, g/kgDM), Undegradable crude protein (UCP, g/kg DM), and Metabolizable Energy (ME, MJ/kg DM) infourteen dairy feeding scenario and for three milk production levels between January 2005 and May2018 (total formulated feed rations= 6804).
Author Contributions: O.A. developed the models, collected data, analyzed the data and draftedthe earlier manuscript versions. E.S. edited the drafted manuscript and provided substantial inputsto the methods and discussion parts. Both authors have read and agreed to the published version ofthe manuscript.
Funding: This research received no external funding.
Acknowledgments: The authors would like to thank the German Academic Exchange Service (DAAD),whose fellowship program for visiting scientists (OA) enabled our cooperation on this work.
Conflicts of Interest: The authors declare no conflict of interest.
References1. Hemme, T. IFCN Dairy Report; International Farm Comparison Network, IFCN Dairy Research Center: Kiel, Germany, 2019.2. Hemme, T.; Alqaisi, O.A.; Ndambi, O.A.; Boelling, D. IFCN Contribution to the IDF/FAO/IFCN Joint Project, World Mapping of
Animal Feeding Systems in the Dairy Sector; International Dairy Federation: Rome, Italy, 2014.3. Hagemann, M.; Hemme, T.; Ndambi, O.A.; Alqaisi, O.; Sultana, M.N. Bechmarking of greenhouse gas emission of bovine milk
production systems for 38 countries. Anim. Feed Sci. Technol. 2011, 166, 46–58. [CrossRef]4. Alqaisi, O.; Hemme, T.; Latacz-Lohmann, U.; Susenbeth, A. Evaluation of food industry by-products as feed in semi-arid dairy
farming systems: The case of Jordan. Sustain. Sci. 2014, 9, 361–377. [CrossRef]5. Alqaisi, O.; Moares, L.; Ndambi, O.; Williams, R. Optimal dairy feed input selection under alternative feeds availability and
relative prices. Inf. Process. Agric. 2019, 6, 438–453. [CrossRef]6. Alqaisi, O.; Ndambi, O.A.; Hemme, T. Global view on feed cost and feed efficiency on dairy farms. All Feed 2011, 2.
Available online: http://www.allaboutfeed.net/Process-Management/Management/2011/7/Global-view-on-feed-costand-feed-efficiency-on-dairy-farms-AAF011993W/ (accessed on 17 October 2018).
7. Wilkinson, J.M.; Garnsworthy, P.C. Dietary options to reduce the environmental impact of milk production. J. Agric. Sci. 2017,155, 334–347. [CrossRef]
Sustainability 2021, 13, 215 15 of 15
8. Miglior, F.; Fleming, A.; Malchiodi, F.; Brito, L.F.; Martin, P.; Baes, C.F. A 100-Year Review: Identification and genetic selection ofeconomically important traits in dairy cattle. J. Dairy Sci. 2017, 100, 10251–10271. [CrossRef] [PubMed]
9. Knapp, J.R.; Laur, G.L.; Vadas, P.A.; Weiss, W.P.; Tricarico, J.M. Invited review: Enteric methane in dairy cattle production:Quantifying the opportunities and impact of reducing emissions. J. Dairy Sci. 2014, 97, 3231–3261. [CrossRef] [PubMed]
10. R Core Team. R: A Language and Environment for Statistical Computing; R Foundation for Statistical Computing: Vienna, Austria,2018; Available online: https://www.R-project.org/ (accessed on 25 November 2018).
11. World Bank. World Bank Monthly Commodity Feed Prices 2018. Available online: http://www.worldbank.org/en/research/commodity-markets (accessed on 12 February 2019).
12. Monthly US Hay Price. Available online: https://hayandforage.com (accessed on 12 February 2019).13. USDA. Biofuel Feedstock and Coproduct Market Data 2018. 2019. Available online: https://www.ers.usda.gov/webdocs/
DataFiles/53657/table09.xls?v=43074 (accessed on 12 February 2019).14. National Research Council (NRC). Nutrient Requirements of Dairy Cattle: Seventh Revised Edition; The National Academies Press:
Washington, DC, USA, 2001; pp. 266–289.15. Mertens, D.R. Creating a system for meeting the fiber requirements of dairy cows. J. Dairy Sci. 1997, 80, 1463–1481. [CrossRef]16. Ellis, J.L.; Kebreab, E.; Odongo, N.E.; McBride, B.W.; Okine, E.K.; France, J. Prediction of methane production from dairy and beef
cattle. J. Dairy Sci. 2007, 90, 3456–3467. [CrossRef] [PubMed]17. Yates, C.M.; Cammell, S.B.; France, J.; Beever, D.E. Prediction of methane emissions from dairy cows using multiple regression
analysis. In Proceedings of the British Society of Animal Science; British Society of Animal Science: Penicuik, UK, 2000; p. 94.18. Moraes, L.E.; Wilen, J.E.; Robinson, P.H.; Fadel, J.G. A linear programming model to optimize diets in environmental policy
scenarios. J. Dairy Sci. 2012, 95, 1267–1282. [CrossRef] [PubMed]19. Cottle, D.J.; Nolan, J.V.; Wiedemann, S.G. Ruminant enteric methane mitigation: A review. Anim. Prod. Sci. 2011, 51, 491–514. [CrossRef]20. Moraes, L.E.; Fadel, J.G.; Castillo, A.R.; Casper, D.P.; Tricarico, J.M.; Kebreab, E. Modeling the trade-off between diet costs and
methane emissions: A goal programming approach. J. Dairy Sci. 2015, 98, 5557–5571. [CrossRef]21. Richardson, C.M.; Baes, C.F.; Amer, P.R.; Quinton, C.; Martin, P.; Osborne, V.R.; Pryce, J.E.; Miglior, F. Determining the economic
value of daily dry matter intake and associated methane emissions in dairy cattle. Animal 2020, 14, 171–179. [CrossRef]22. Buza, M.H.; Holden, L.A.; White, R.A.; Ishler, V.A. Evaluating the effect of ration composition on income over feed cost and milk
yield. J. Dairy Sci. 2014, 97, 3073–3080. [CrossRef] [PubMed]