Embed Size (px)
Citation preview
I
Vol. 44: 113-129, 1988 I
MARINE ECOLOGY - PROGRESS SERIES Mar. Ecol. Prog. Ser.
Published May 5
Feeding of lantern fish Benthosema glaciale off the Nova Scotia Shelf
D. D. Sameoto
Department of Fisheries and Oceans, Biological Sciences Branch, Bedford Institute of Oceanography, PO Box 1006, Dartmouth, Nova Scotia, Canada B2Y 4A2
ABSTRACT: Benthosema glaciale populations on the slope of the Nova Scotia shelf were sampled at different months of the year on 8 occasions over 8 yr. Day/night vertical distributions are described in relation to distributions of their zooplankton prey. Feeding behavior was studied from stomach contents which showed feeding primarily on copepods during the night in the upper 200 m, but some daytime feeding at depths greater than 300 m. A modified Ivlev's electivity index showed B. glacjale positively selected certain species of copepods but not the most abundant Calanus finmarchicus, although this species was the most common species in its diet. B. glaciale tended to select copepod species whose body length was greater than 1 mm. Size range of prey increased with fish body length; however larger fish continued to feed on the same small prey as smaller fish. The estimated daily ration of B. glaciale decreased with body weight and ranged from 8 % of body weight for a 0.1 g fish to 2.5 % for a 3 g fish. The B. qlaciale population was estimated to consume between 0.2 and 0.1 % of the zooplankton biomass per day during spring but only 0.03 % in fall.
INTRODUCTION
The lantern fish Benthosema glaciale is the dominant mesopelagic fish in a zone between the 1000 m contour and the front of slope water of the Nova Scotian shelf (Sameoto 1982). This myctophid is known to migrate vertically each night to the upper 100 m of water to feed on zooplankton, its principle prey (Gjesaeter & Kawaguchi 1980), but little is known about its specific prey selection, the depth at which it feeds, or its daily ration. Nor is anything known about its feeding habits on the Nova Scotia slope during different seasons of the year. This study was designed to investigate the specific prey consumed by B. glaciale of various sizes, the depths and times at which feeding occurred, as well as changes in the feeding behaviour with different seasons of the year. In addition the daily ration in terms of fish body weight was estimated for different size classes of fish.
METHODS
Samples of zooplankton and mesopelagic fish were taken simultaneously with the BIONESS, a multiple net sampler with ten 1 m2 nets of mesh size 243 urn
0 Inter-Research/Pnnted in F. R. Germany
(Sameoto et al. 1980). The BIONESS measured depth, ..,,I.. U ~ ~ T T L C of water filtered by each net, speed iiiiuugh the
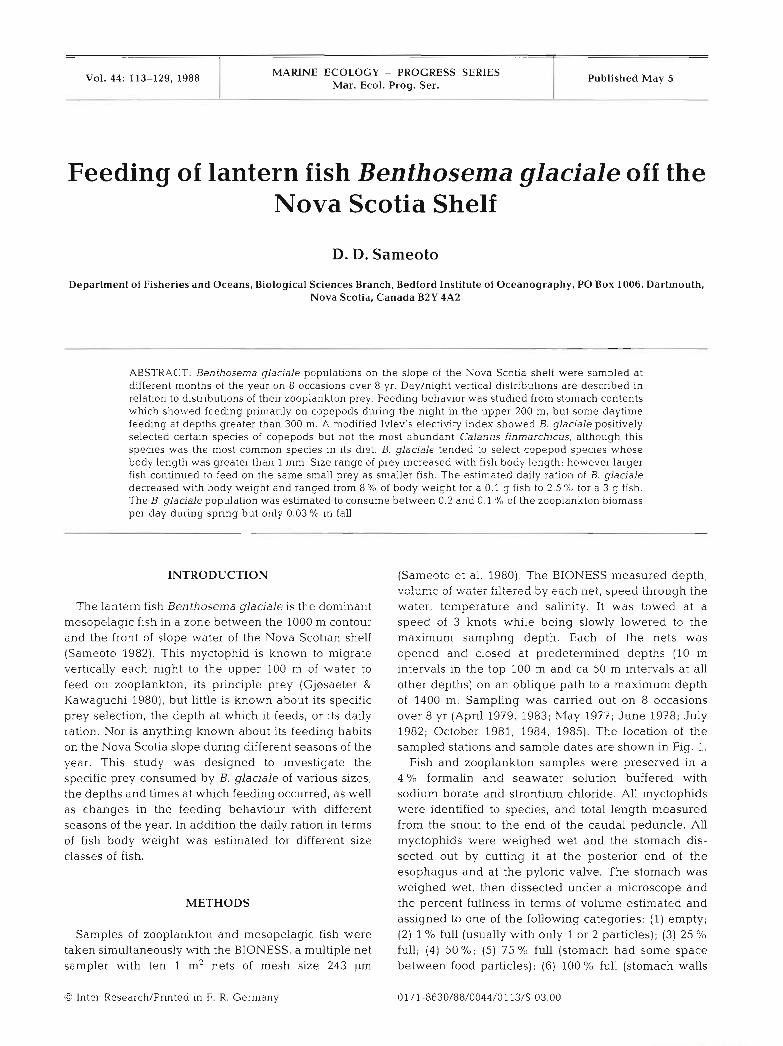
water, temperature and salinity. It was towed at a speed of 3 knots while being slowly lowered to the maximum sampling depth. Each of the nets was opened and closed at predetermined depths (10 m intervals in the top 100 m and ca 50 m intervals at all other depths) on an oblique path to a maximum depth of 1400 m. Sampling was carried out on 8 occasions over 8 yr (April 1979, 1983; May 1977; June 1978; July 1982; October 1981, 1984, 1985). The location of the sampled stations and sample dates are shown in Fig. 1.
Fish and zooplankton sanlples were preserved in a 4 O/O formalin and seawater solution buffered with sodium borate and strontium chloride. All myctophids were identified to species, and total length measured from the snout to the end of the caudal peduncle. All myctophids were weighed wet and the stomach dis- sected out by cutting it at the posterior end of the esophagus and at the pyloric valve. The stomach was weighed wet, then dissected under a microscope and the percent fullness in terms of volume estimated and assigned to one of the following categories: (1) empty; (2) 1 % full (usually with only 1 or 2 particles); (3) 25 % full; (4) 50 %; (5) 75 % full (stomach had some space between food particles); (6) 100 % full (stomach walls
114 Mar. Ecol. Prog. Ser. 44: 103-111. 1988
. . .. .,. I... .. .-. .-. I . .. .. ,._. _; -.: : . . . . , . . ........." . . :;. . ,., .:;. . , . . . . . . . . . , ,...:. .;.".'..'.;~;;.:. , - .: ,.:.:... 2"' -6 0
-7- D ,; C>'
,
- + ..fz~g:<.--->-.z ... <---L ;-:-A, .- . > _ L /:.
-- --__c__ - - --<,-' -- -..---.;yid - -- 7-
-/-~' F--
were stretched with no space apparent between food particles).
The stomach contents were identified to lowest pos- sible taxa, usually genera, and counted. The length and width of each particle were measured. The stomach lining was weighed wet and subtracted from the total weight of the stomach and contents to estimate the total weight wet of the contents.
The state of digestion of the stomach contents was estimated and assigned to one of the following categories; (1) complete digestion - all material unidentifiable; ( 2 ) partial digestion - whole copepods recognizable, with minimum to moderate digestion; (3) undigested - whole organisms in good condition. Fish of all lengths within each sample were examined for stomach contents.
The problem of postcapture ingestion ('net feeding') by fish is always a concern with in situ feeding studies, particularly with mesopelagic fish. Hopluns & Baird (1975) reviewed net feeding and concluded it was not a serious problem for many midwater fish. Clarke (1978, 1980), Rohwedder (1980) and Imsand (1981) found Little evidence of net feeding. Lancraft & Robison (1980) found only 5 O/O of the fish ingested artificial prey intro- duced into the cod end. The amount of artificial prey ingested varied wi.th species and was highest in the large species that were recovered alive from the nets and very low in the small fragile species of fish. The incidence of cod end feeding was higher by day than
Fig. 1. Location of sampling stations on the Nova Scotia slope. Each dot represents a
separate BIONESS station
night, and small particles were more readily consumed than large ones. Roe Pc Badcock (1984) examined the problem of net feeding in the RMT 8 (an opening and closing midwater trawl) and concluded that for plank- tivorous fish, including Benthosema, it was not an important problem and the small degree of contamina- tion due to the fish gulping in the net was probably undetectable.
Cod-end feed.ing during BIONESS sampling was not considered a serious problem for the following reasons. First, the fish when captured, even in short tows of 10 min or less, were usually dead or dylng even though their physical appearance was still very good. Second, the speed of the tow meant that the fish were forced against the mesh of the net and it is unlikely that they would be inclined or able to feed under these circum- stances. Third, the high numbers of fish with empty stomachs at all depths during both day and night indi- cate that cod end feeding was not a common occur- rence. There was no evidence that fish regurgitation was a problem with captured fish at any time.
A quantitative measure of food selection was made for fjsh at different depths using a modified Ivlev's electivity index, D,, (Jacobs 1974). This index was cal- culated as
D. = r - p ' r + p - 2 r p (1)
where r = proportion of a prey species in the stomach; p = proportion of that prey in the zooplankton sample.
Sameoto: Feeding of lantern fish 115
This index is different from Ivlev's (1961) in that it IS
independent of the relative abundance of the prey species. The value of D, varies from - 1 to 0 for negative selection and 0 to + 1 for positive selection.
RESULTS
Physical oceanography
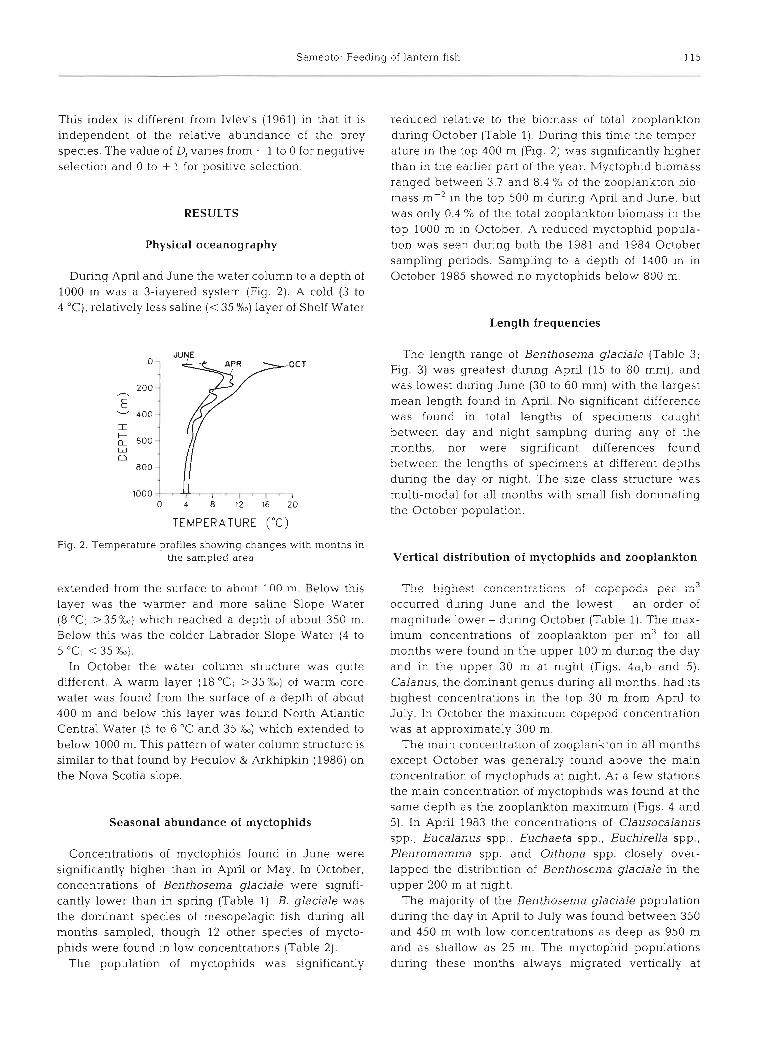
During April and June the water column to a depth of 1000 m was a 3-layered system (Fig. 2). A cold (3 to 4 "C), relatively less saline (< 35 %o) layer of Shelf Water
0 4 8 12 16 2 0
TEMPERATURE ("C)
Fig. 2. Temperature profiles showing changes with months in the sampled area
extended from the surface to a h o i ~ t I n n m Re!ow this layer was the warmer and more saline Slope Water (8 "C; > 35 %o) which reached a depth of about 350 m. Below this was the colder Labrador Slope Water (4 to 5 "C; < 35 %").
In October the water column structure was quite different. A warm layer (18 "C; >35%0) of warm core water was found from the surface of a depth of about 400 m and below this layer was found North Atlantic Central Water (5 to 6 "C and 35 %o) which extended to below 1000 m. This pattern of water column structure is similar to that found by Fedulov & Arkhipkin (1986) on the Nova Scotia slope.
Seasonal abundance of myctophids
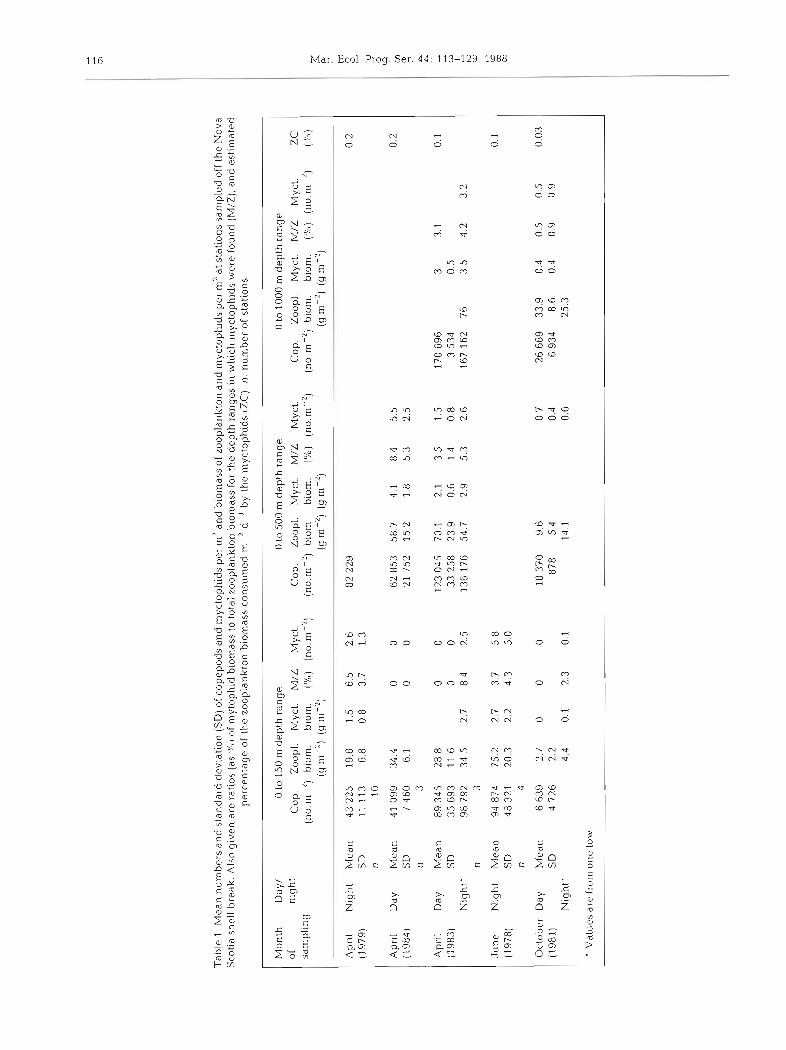
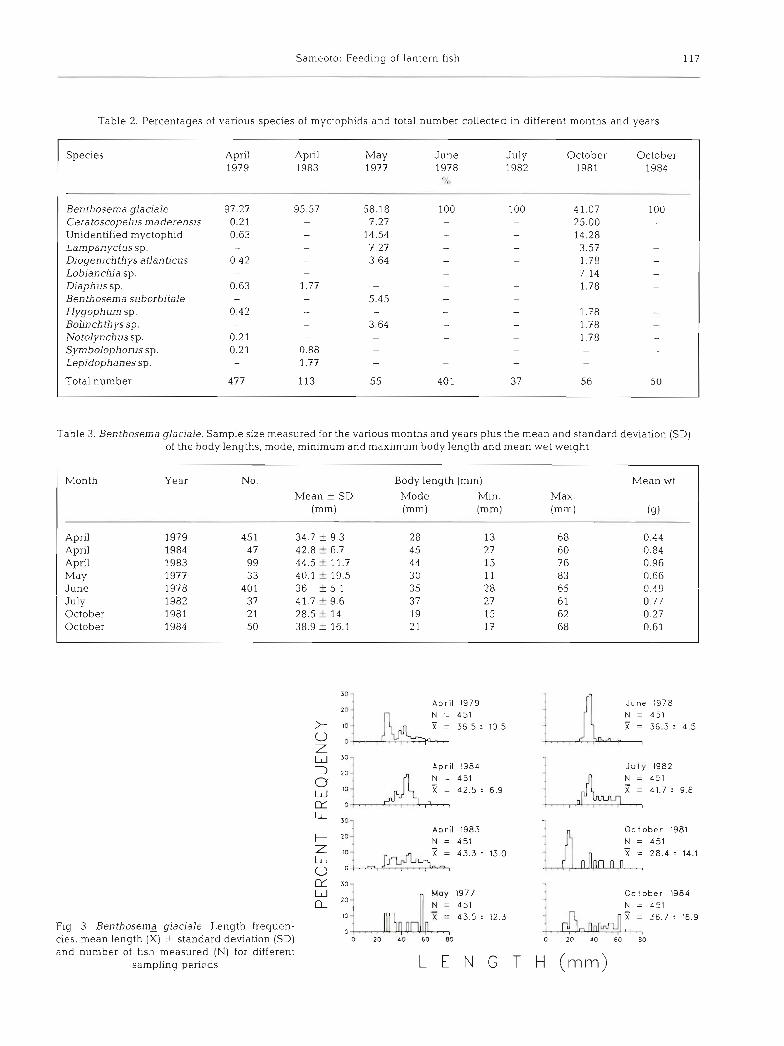
Concentrations of myctophids found in June were significantly higher than in April or May. In October, concentrations of Benthosema glaciale were signifi- cantly lower than in spring (Table 1). B. ylaciale was the dominant species of mesopelagic fish during all months sampled, though 12 other species of mycto- phids were found in low concentrations (Table 2) .
The population of myctophids was significantly
reduced relative to the biomass of total zooplankton during October (Table l). During this time the temper- ature in the top 400 m (Fig. 2 ) was significantly higher than in the earlier part of the year. Myctophid biomass ranged between 3.7 and 8.4 O/O of the zooplankton bio- mass m-' in the top 500 m during April and June, but was only 0.4 % of the total zooplankton biomass in the top 1000 m in October. A reduced myctophid popula- tion was seen during both the 1981 and 1984 October sampling periods. Sampling to a depth of 1400 m in October 1985 showed no myctophids below 800 m.
Length frequencies
The length range of Benthoserna glaciale (Table 3; Fig. 3) was greatest during April (15 to 80 mm), and was lowest during June (30 to 60 mm) with the largest mean length found in April. No significant difference was found in total lengths of specimens caught between day and night sampling during any of the months, nor were significant differences found between the lengths of specimens at different depths dunng the day or night. The size class structure was multi-modal for all months with small fish dominating the October population.
Vertical distribution of myctophids and zooplankton
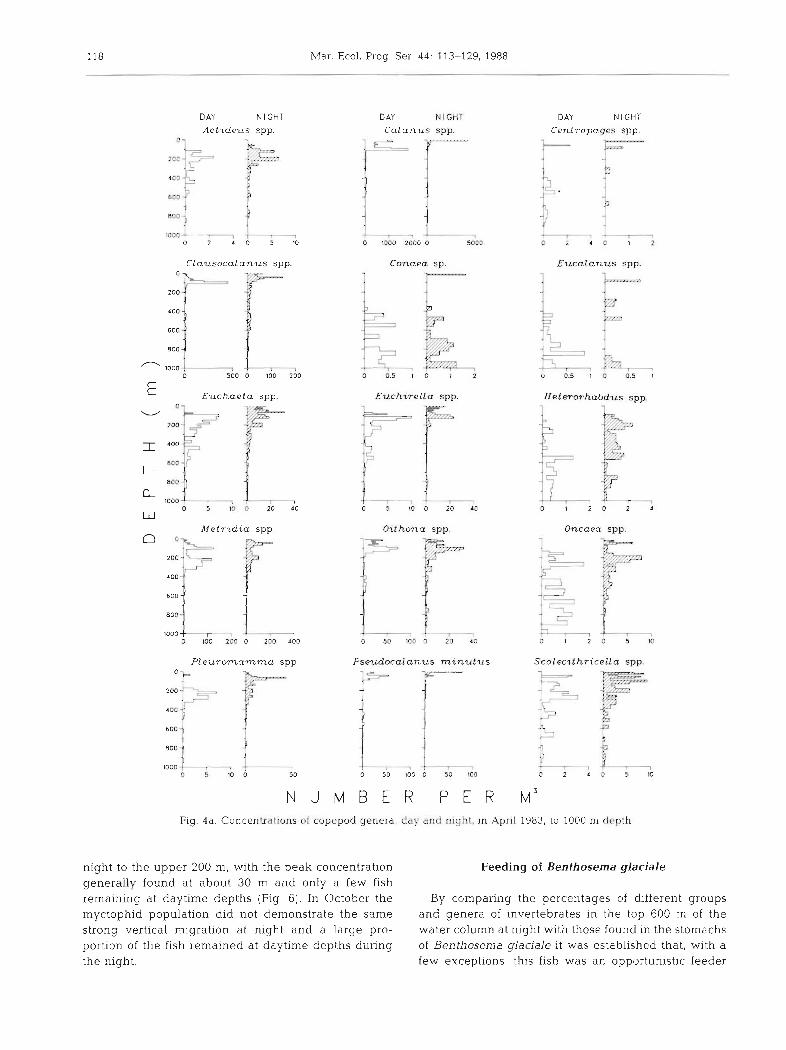
The highest concentraticns of ccpepods per m3 occurred d.uring June and the lowest - an order of magnitude lower - during October (Table 1). The max- imum concentrations of zooplankton per m3 for all months were found in the upper 100 m during the day and in the upper 30 m at night (Figs. 4a,b and 5). Calanus, the dominant genus during all months, had its highest concentrations in the top 30 m from April to July. In October the maximum copepod concentration was at approximately 300 m.
The main concentration of zooplankton in all months except October was generally found above the main concentration of myctophids at night. At a few stations the main concentration of myctophids was found at the same depth as the zooplankton maximum (Figs. 4 and 5). In April 1983 the concentrations of Clausocalanus spp., Eucalanus spp., Euchaeta spp., Euchirella spp., Pleurornarnrna spp. and Oithona spp. closely over- lapped the distribution of Benthosema ylaciale in the upper 200 m at night.
The majority of the Benthosema glaciale population during the day in April to July was found between 350 and 450 m with low concentrations as deep as 950 m and as shallow as 25 m. The myctophid populations during these months always migrated vertically at
Tab
le 1
. Mea
n n
um
ber
s an
d s
tan
dar
d d
evia
tion
(S
D) o
f co
pep
od
s an
d m
ycto
phid
s p
er m
' an
d b
iom
ass
of zo
opla
nkto
n an
d m
yct
op
hd
s p
er rn
2 a
t sta
tion
s sa
mp
led
off
th
e N
ova
Sco
tia
shel
l' b
reak
. Als
o gi
ven
are
rati
os (
as 'X
,) o
f rn
ytop
hid
biom
ass
to t
otal
zoo
plan
kton
bio
mas
s fo
r th
e d
epth
ran
ges
in
whi
ch r
nyct
ophi
ds w
ere
foun
d (M
/Z),
and
est
imat
ed
per
cen
tag
e or
the
zoo
plan
kton
bio
mas
s co
nsu
med
m-'
d-'
by t
he
myc
toph
ids
(ZC
). n:
nu
mb
er o
f st
atio
ns
Mon
th
Day
/ 0
to 1
50 m
dep
th r
ang
e 0
to 5
00 m
dep
th r
ang
e 0
to 1
000
m d
epth
ran
ge
of
nigh
t C
op
. Z
oopl
. M
yct.
M
/Z
Myc
t.
Co
p.
Zoo
pl.
Myc
t.
M/Z
M
yct.
C
op.
Zoo
pl.
Myc
t.
M/Z
M
yct.
Z
C
sam
pli
ng
(n
o.rn
')
bior
n.
biom
. (%
) (n
0.m
-')
(no.
rn-')
bi
orn.
bi
om.
(%)
(n~
.m.-
~) (
n0.m
-')
bior
n.
bior
n. (41) (n
o. m
')
('%
)
(g m
'1
(g m
-')
(g m
2)
(g m
-2)
(g m
-')
(g m
-2)
Ap
nl
Nig
ht
Mea
n
43 2
25
19
.8
1.5
6.5
2.6
8
2 2
29
0.2
(1
97
9)
SD
11
113
6
.8
0.8
3
.7
1.3
n
10
Apr
il D
ay
Mea
n
41 0
99
04.4
0
.2
(198
4)
SD
7
46
0
6.1
n 3
Apr
il
Day
M
ean
8
9 3
45
28.8
0.
l (1
983)
S
D
35
69
3
11
.6
Nig
ht'
98 7
92
34
.5
n 3
Jun
e N
lght
M
ean
94
874
75.2
0.1
(197
8)
SD
48
32
1
20
.3
n 4
Oct
ob
er
Day
M
ean
6
639
2.7
0.0
3
(198
1)
SD
4
726
2.2
Nig
ht'
4.
4
Val
ues
are
from
on
e to
w
Sameoto: Feeding of lantern fish 117
Table 2. Percentages of various species of myctophids and total number collected in different months and years
Species April April May June July October October 1979 1983 1977 1978 1982 1981 1984
<'/to
Benthosema glaciale 97.27 95.57 58.18 100 100 41.07 100 Ceratoscopelus maderensis 0.2 1 - 7.27 - - 25.00 - Unidentified myctophid 0.63 - 14.54 - 14.28 - Lampanyctus sp. - 7.27 3.57 Diogenichthys atlan ticus 0.42 3.64 1 7 8 Lobiancha sp. - - - 7.14 Diaph us sp 0.63 I 77 - 1.78 - Benthoserna suborbitale - 5.45 - -
Hygophum sp. 0.42 - 1.78 - Bolinchthyssp. - 3.64 1.78 - Notolynchus sp. 0.21 - - 1.78 - Symbolophorus sp. 0.21 0.88 - - - - - Lepidophanes sp. 1.77 - - - -
Total number 477 113 55 401 37 56 50
Table 3. Benthosema glaciale. Sample size measured for the various months and years plus the mean and standard deviation (SD) of the body lengths, mode, minimum and maxlmum body length and mean wet weight
Month No. Body length (mm) Mean wt
Mean f SD Mode Min. Max. (mm) (mm) (mm) (mm) (9)
April April April May June July October October
Fig. 3. Benthosema glaciale. Length frequen- cies, mean length (X) f standard deviation (SD) and number of fish measured (N) for different
sampling periods
April 1979 N = 451 X = 36.5 2 10.5
April 1984 N = 451 X = 42.5 2 6.9
::] April 1983 N = 451
June 1978 N = 451 X = 36.3 2 4 .5
J u l y 1982
October 1981 N = 451 X = 28.4 t 14.1
SO - - May 1977 Oc l ober 1984 20 -
N = 451 N = 451 X = 43.5 2 12.3 X = 36.7 : 16.9
0 20 40 60 80 !.-&&@L 0 20 40 60 80
L E N G T H (mm)
118 Mar. Ecol. Prog. Ser. 44: 113-129, 1988
DAY N I GH1
A e l - i d e u s s p p " - - fT-
1c; - -7 -- -.-. - . - d {Â¥"
DAY NIGHT
C a l a n u T spp. DAY N I G H T
C e n t r o p a g c s spp.
:+ 2-
4 BOO CSQ i
f ^ I
E u c a l a n u s spp. - C l a u s o c a l a n u s spp
800
C o n a e a sp -
-7"
0 0 5 1 0 1 2 500 0 100 200
 E u c h a e t a spp. E u c h i r e l l a s p p H e t e r o r h a b d u s spp.
O z t h o n a spp O n c a e a spp
Pl e u r o m a m m a spp. P s e u d o c a l a n u s m m u t u s S c o l e c i t h r i c e l i a spp
N U M B E R P E R M~ Fig. 4a. Concentrdtions of copepod genera, day and night, in April 1983, to 1000 m d f p t h
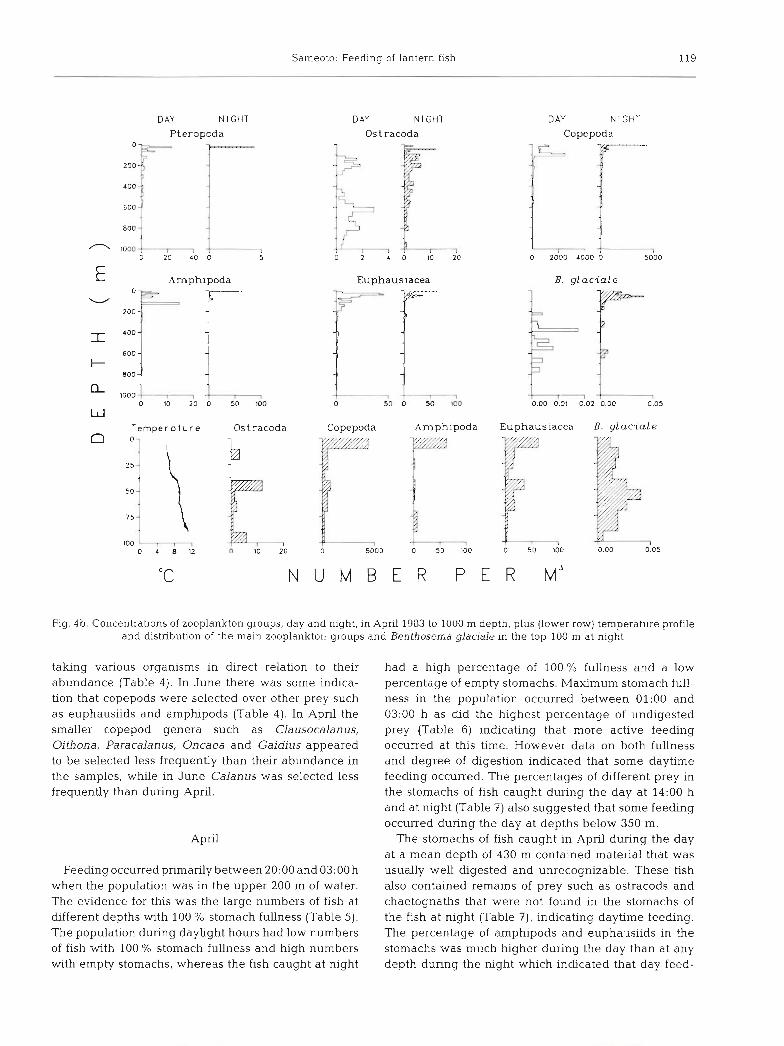
night to the upper 200 m, with the peak concentration Feeding of Benthosema glaciale generally found at about 30 m and only a few fish remaining at daytime depths (Fig. 6). In October the By comparing the percentages of different groups myctophid population did not demonstrate the same and genera of invertebrates in the top 600 m of the strong vertical migration at night and a large pro- water column at night with those found in the stomachs portion of the fish remained at daytime depths during of Benthosema glaciale it was established that, with a the night. few exceptions, this fish was an opportunistic feeder
Sarneoto: Feeding of lantern fish 119
D AY N l GHT
Pteropoda D AY N l GHT
OS tracoda D AY N l GHT
Copepoda
B. g l a c i a l e
Copepoda Amphipoda Euphausiacea B. g l a c i a l e Temperoture OS t racoda
U M B E R P E R
Fig. 4b. Concentrations of zooplankton groups, day and night, in April 1983 to 1000 m depth, plus (lower row) temperature profile and distribution of the main zooplankton groups and Benthosema glaciale in the top 100 m at night
taking various organisms in direct relation to their abundance (Table 4). In June there was some indica- tion that copepods were selected over other prey such as euphausiids and amphipods (Table 4). In April the smaller copepod genera such as Clausocalanus, Oithona, Paracalanus, Oncaea and Gaidius appeared to be selected less frequently than their abundance in the samples, while in June Calanus was selected less frequently than during April.
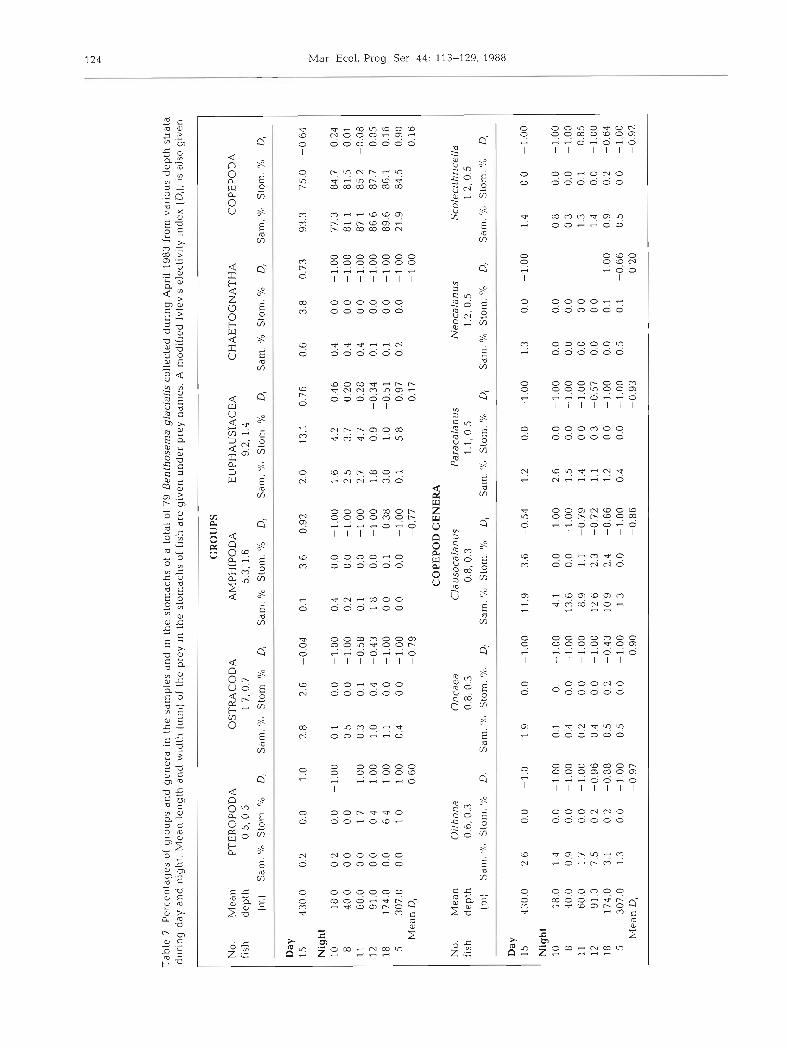
had a high percentage of 100% fullness and a low percentage of empty stomachs. Maximum stomach full- ness in the population occurred between 01:OO and 03:OO h as did the highest percentage of undigested prey (Table 6) indicating that more active feeding occurred at this time. However data on both fullness and degree of digestion indicated that some daytime feeding occurred. The percentages of different prey in the stomachs of fish caught during the day at 14:OO h and at night (Table 7) also suggested that some feeding occurred during the day at depths below 350 m.
The stomachs of fish caught in April during the day at a mean depth of 430 m contained material that was usually well digested and unrecognizable. These fish also contained remains of prey such as ostracods and chaetognaths that were not found in the stomachs of the fish at night (Table 7), indicating daytime feeding. The percentage of amphipods and euphausiids in the stomachs was much higher during the day than at any depth during the night which indicated that day feed-
April
Feeding occurred primarily between 20:OO and 03:OO h when the population was in the upper 200 m of water. The evidence for this was the large numbers of fish at different depths with 100 % stomach fullness (Table 5). The population during daylight hours had low numbers of fish with 100 % stomach fullness and high numbers with empty stomachs, whereas the fish caught at night
120 Mar. Ecol. Prog. Ser. 44: 113-129, 1988
A e t z d e u s s p p 0 7
TT-----? ' //
50- . . - . .
C a l a n u s s p p . -.,/,// /A--" ;,LY:.:
i
E u c h a e t a s p p EuchireLLa s p p . H e t e . r o r h a b d u s s p p .
M e t r i d i a s p p N a n n o c a l a n u s s p p . O z t h o n a spp .
1 yuuuuuuo
O n c a e a s p p P l e u r o m a m m a s p p
c P s e u d o c a l a n u s S c o l e c i t h r i c e l l a Copepoda OS t racoda Gast ropoda
A m p h i p o d a Euphauslacea Chae tognat h a Bent h o s e m a g l a c i a l e T e m p e r a t u r e
N U M B E R P E R M'
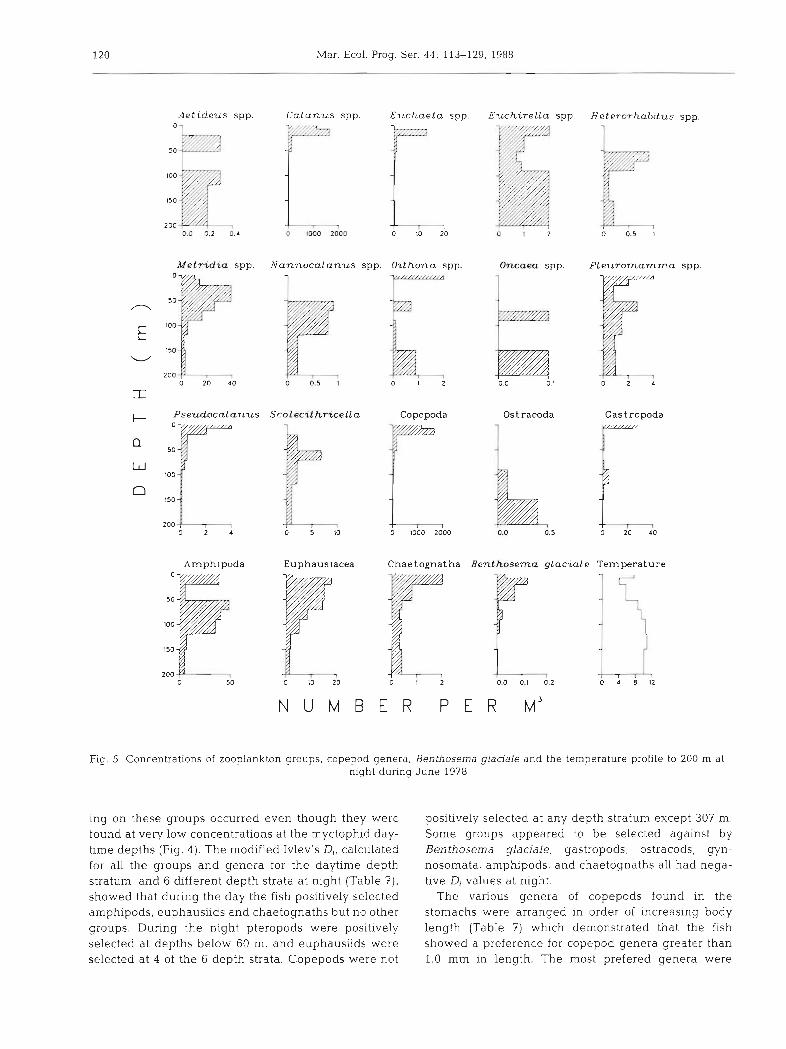
Fig. 5. Concentrations of zooplankton groups, copepod genera, Benthosema glaciale and the temperature profile to 200 m at night during June 1978
ing on these groups occurred even though they were found at very low concentrations at the myctophid day- time depths (Fig. 4). The modified Ivlev's D,, calculated for all the groups and genera for the daytime depth stratum, and 6 different depth strata at night (Table ?), showed that during the day the fish positively selected arnphipods, euphausilds and chaetognaths but no other groups. During the night pteropods were positively selected at depths below 60 m, and euphausiids were selected at 4 of the 6 depth strata. Copepods were not
positively selected at any depth stratum except 307 m. Some groups appeared to be selected against by Benthosema glaciale; gastropods, ostracods, gyn- nosornata, amphipods, and chaetognaths all had nega- tive Di values at night.
The various genera of copepods found in the stomachs were arranged in order of increasing body length (Table 7) which demonstrated that the fish showed a preference for copepod genera greater than 1.0 mm in length. The most prefered genera were
Sameoto: Feeding of lantern fish 121
A P R I L
D AY N l GHT
MAY / JUNE
N l GHT
O C T O B E R
D AY N l G H l
:: I ... 2
I- 3" -- 1981
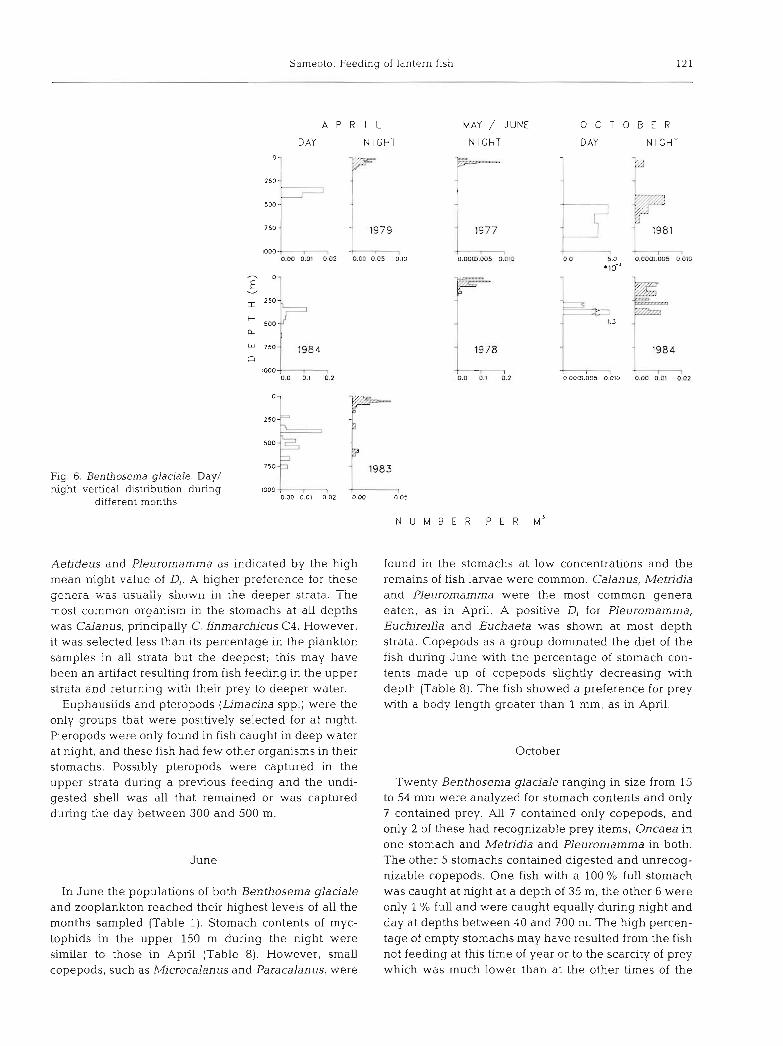
Fig. 6. Benthosema glaciale. Day/ night vertical distribution during 1000 .F- P l
different months 0 00 0.01 0.02 0.00 0.05
N U M B E R P E R Li3
Aetideus and Pleuromamma as indicated by the high mean night value of D,. A higher preference for these geiiern was iisiiaLiy s h u w r ~ irl the deeper strata. The most common organism in the stomachs at all depths was Calanus, principally C. finmarchicus C4. However, it was selected less than its percentage in the plankton samples in all strata but the deepest; this may have been an artifact resulting from fish feeding in the upper strata and returning with their prey to deeper water.
Euphausiids and pteropods (Limacina spp.) were the only groups that were positively selected for at night. Pteropods were only found in fish caught in deep water at night, and these fish had few other organisms in their stomachs. Possibly pteropods were captured in the upper strata during a previous feeding and the undi- gested shell was all that remained or was captured during the day between 300 and 500 m.
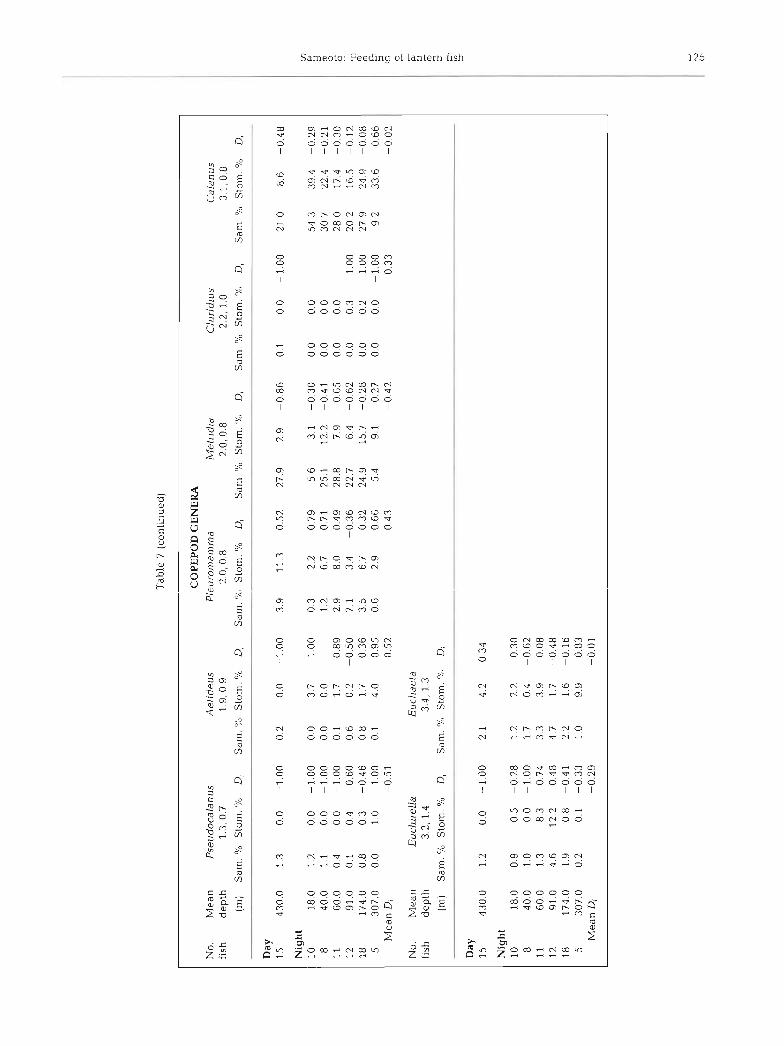
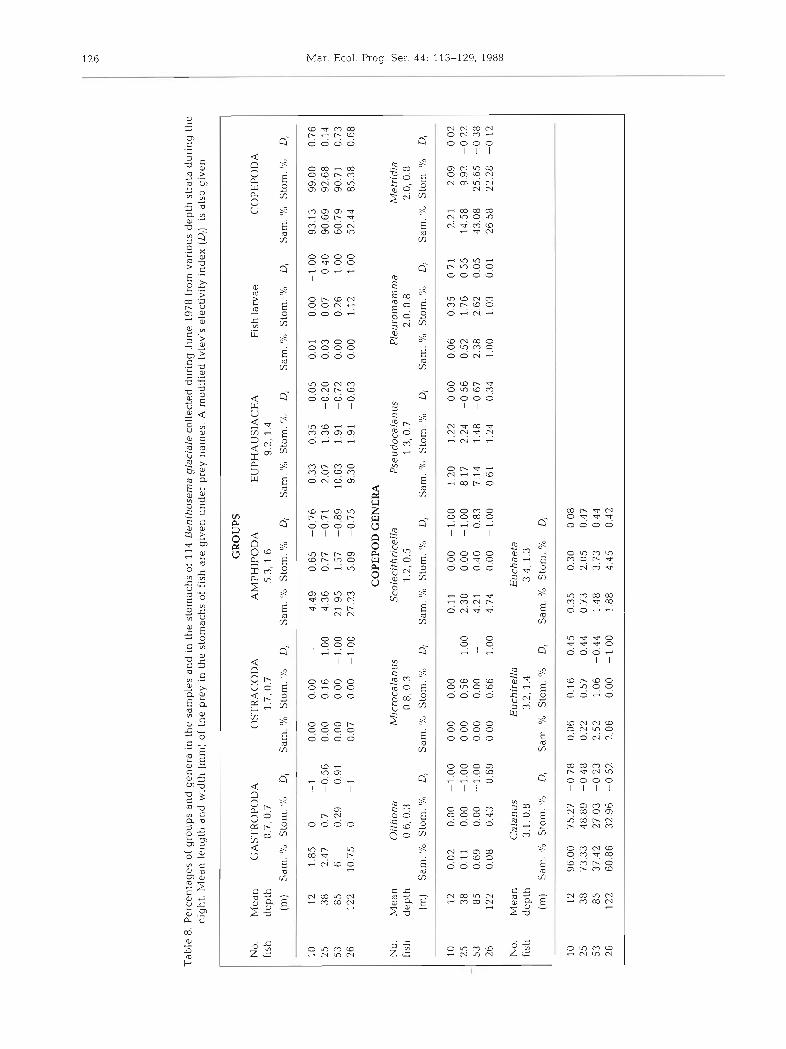
June
In June the populations of both Benthosema glaciale and zooplankton reached their highest levels of all the months sampled (Table 1). Stomach contents of myc- tophids in the upper 150 m during the night were similar to those in April (Table 8). However, small copepods, such as A4jcrocalanus and Paracalanus, were
found in the stomachs at low concentrahons and the remains of fish larvae were common. Calanus, Metndia and Pleuromamrna were the most common genera eaten, as in April. A positive Di for Pleuromarnma, Euchireilla and Euchaeta was shown at most depth strata. Copepods as a group dominated the diet of the fish during June with the percentage of stomach con- tents made up of copepods slightly decreasing with depth (Table 8). The fish showed a preference for prey with a body length greater than 1 mm, as in April.
October
Twenty Benthosema glaciale ranging in size from 15 to 54 mm were analyzed for stomach contents and only 7 contained prey. All 7 contained only copepods, and only 2 of these had recognizable prey items, Oncaea in one stomach and Metridia and Pleuromamma in both. The other 5 stomachs contained digested and unrecog- nizable copepods. One fish with a 100 % full stomach was caught at night at a depth of 35 m, the other 6 were only 1 % full and were caught equally during night and day at depths between 40 and 700 m. The high percen- tage of empty stomachs may have resulted from the fish not feeding at this time of year or to the scarcity of prey which was much lower than at the other times of the
122 Mar. Ecol. Prog. Ser. 44: 113-129, 1988
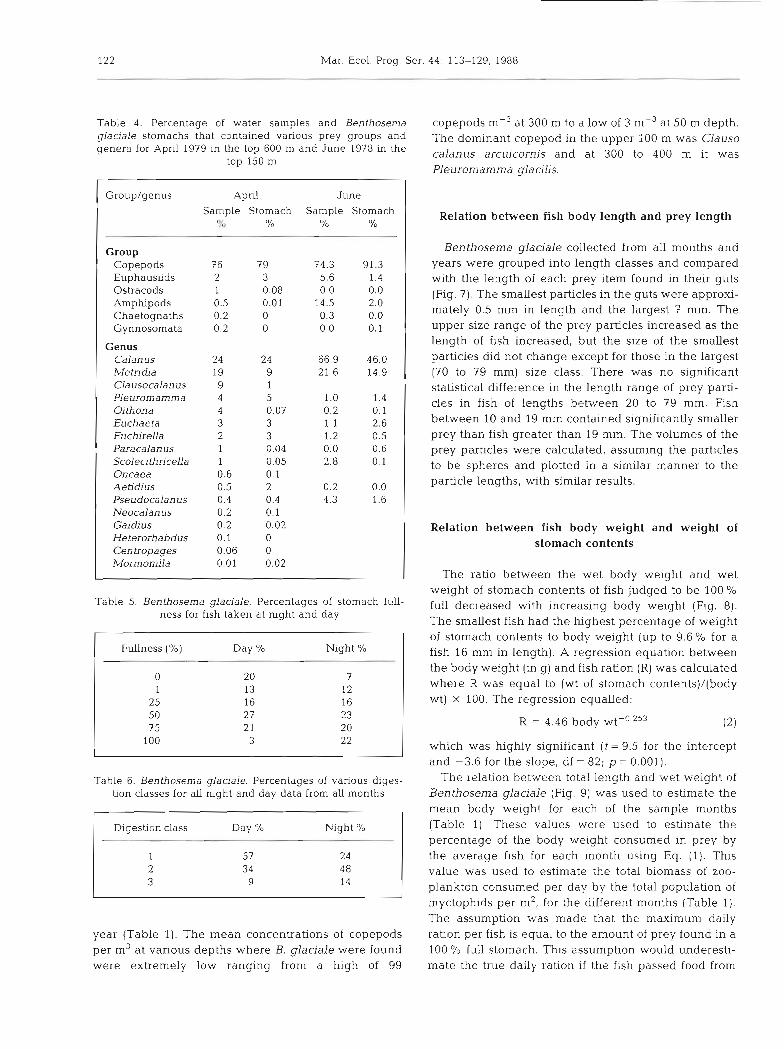
Table 4. Percentage of water samples and Benthosema glaciale stomachs that contained various prey groups and genera for Aprll 1979 in the top 600 m and June 1978 in the
top 150 m
Group/genus April June Sample Stomach Sample Stomach
To O/o "L0 O/o
Group Copepods 7 6 79 74.3 91.3 Euphausiids 2 3 5.6 1.4 Ostracods 1 0.08 0.0 0.0 Arnphipods 0.5 0.01 14.5 2.0 Chaetognaths 0.2 0 0.3 0.0 Gynnosomata 0.2 0 0.0 0.1
Genus Calan us 24 24 66.9 46.0 Me tn-&a 19 9 21.6 14.9 Clausocalanus 9 1 Pleuromamma 4 5 1.0 1.4 Oithona 4 0.07 0.2 0.1 Euchaeta 3 3 1.1 2.6 Euchirella 2 3 1.2 0.5 Paracalanus 1 0.04 0.0 0.6 Scolecithncella 1 0.05 2.8 0.1 Oncaea 0.6 0.1 Aetidius 0.5 2 3.2 0.0 Pseudocalanus 0.4 0.4 4.3 1.6 Neocalan us 0.2 0.1 Gaidius 0.2 0.02 Heterorhabdus 0.1 0 Centropages 0.06 0 MormoniLla 0.01 0.02
Table 5. Benthosema glaciale. Percentages of stomach full- ness for fish taken at night and day
Fullness (%) Day O/O Nlght %
0 20 7 1 13 12
25 16 16 50 27 23 75 2 1 20
100 3 22
Table 6. Benthosema glaciale. Percentages of various diges- tion classes for all night and day data from all months
Digestion class Day O/O Night %
14
year (Table 1). The mean concentrations of copepods per m3 at various depths where B. glaciale were found were extremely low ranging from a high of 99
copepods mP3 at 300 m to a low of 3 m-3 at 50 m depth. The dominant copepod in the upper 100 m was Clauso calanus arcuicornis and at 300 to 400 m it was Pleuromamma glacdis.
Relation between fish body length and prey length
Benthosema glaciale collected from all months and years were grouped into length classes and compared with the length of each prey item found in their guts (Fig. 7). The smallest particles in the guts were approxi- mately 0.5 mm in length and the largest 7 mm. The upper size range of the prey particles increased as the length of fish increased, but the size of the smallest particles did not change except for those in the largest (70 to 79 mm) size class. There was no significant statistical difference in the length range of prey par%- cles in fish of lengths between 20 to 79 mm. Fish between 10 and 19 mm contained significantly smaller prey than fish greater than 19 mm. The volumes of the prey particles were calculated, assuming the particles to be spheres and plotted in a similar manner to the particle lengths, with similar results.
Relation between fish body weight and weight of stomach contents
The ratio between the wet body weight and wet weight of stomach contents of fish judged to be 100 O/O
full decreased with increasing body weight (Fig. 8). The smallest fish had the hghest percentage of weight of stomach contents to body weight (up to 9.6 % for a fish 16 mm in length). A regression equation between the body weight (in g) and fish ration (R) was calculated where R was equal to (wt of stomach contents)/(body wt) X 100. The regression equalled:
R = 4.46 body wt-O 253
which was hghly significant ( t = 9.5 for the intercept and -3.6 for the slope, df = 82; p = 0.001).
The relation between total length and wet weight of Benthosema glaciale (Fig. 9 ) was used to estimate the mean body weight for each of the sample months (Table 1). These values were used to estimate the percentage of the body weight consumed in prey by the average fish for each month using Eq. (1). This value was used to estimate the total biomass of zoo- plankton consumed per day by the total population of myctophids per m2, for the different months (Table 1). The assumption was made that the maximum daily ration per fish is equal to the amount of prey found in a 100 % full stomach. This assumption would underesti- mate the true daily ration if the fish passed food from
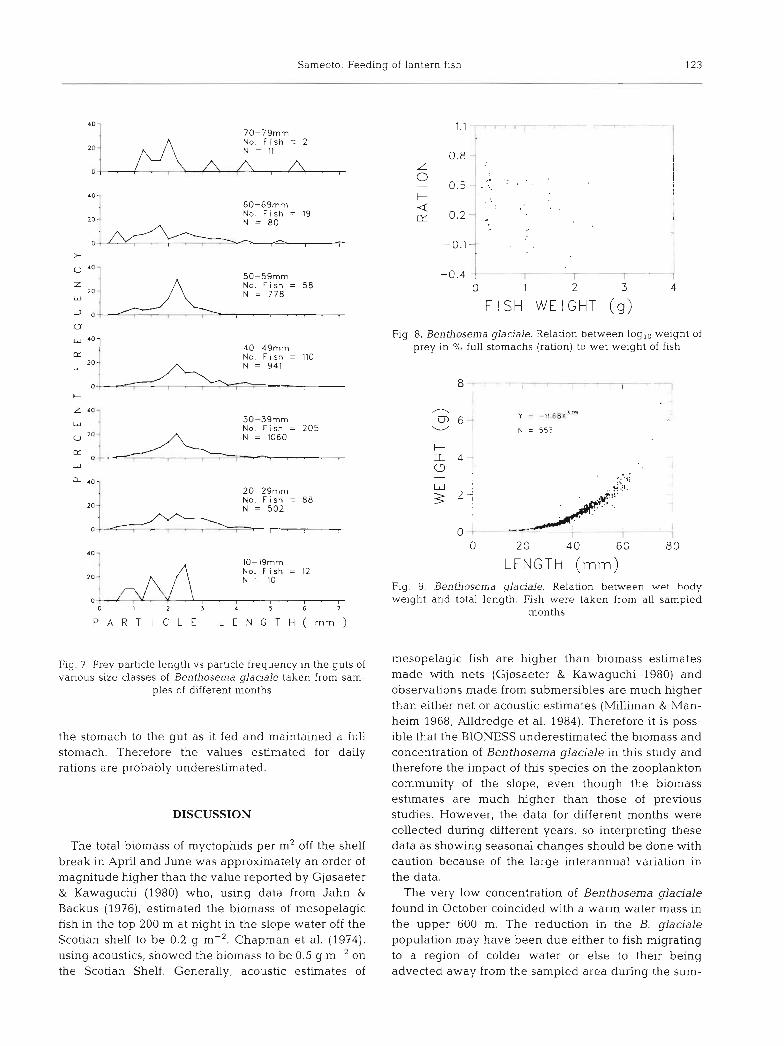
Sameoto: Feeding of lantern fish 123
70-79mm No. F i s h = 2 N = 11
40-
60-69mm
20 .l No. F i s h = 19 N = 80
0 T
50-59mrn No. F i s h = 58
40-49mm No. F i s h = 110 N = 941
+
30-39rnm No. F i s h = 205 N = 1060
-- J 20-29rnrn 1 No. F i s h = 88
A 10-l9mm
20 - No. F i s h = 12 A N = 10
P A R T I C L E i E N G T H ( m m )
Fig. 7 Prey particle length vs particle frequency in the guts of various size classes of Benthosema glaciale taken from sam-
ples of different months
the stomach to the gut as it fed and maintained a full stomach. Therefore the values estimated for daily rations are probably underestimated.
DISCUSSION
The total biomass of myctophids per m2 off the shelf break in Apnl and June was approximately an order of magnitude higher than the value reported by Gjssaeter & Kawaguchi (1980) who, using data from Jahn 81 Backus (1976), estimated the biomass of mesopelagic fish in the top 200 m at night in the slope water off the Scotian shelf to be 0.2 g m-'. Chapman et al. (1974), using acoustics, showed the biomass to be 0.5 g m-' on the Scotian Shelf. Generally, acoustic estimates of
1 -0.1 '
-0.4~i - -- - T 4 0 1 2 3 4
F l SH WE l GHT ( g )
Fig. 8. Benthosema ylaciale. Relation between loglo weight of prey in % full stomachs (ration) to wet weight of fish
0 2 0 4 0 60 8 0
LENGTH (mm) Fig. 9. Benthosema qlaciale. Relation between wet hody weight and total length. Fish were taken from all sampled
months
mesopelagic fish are higher than biomass estimates made with nets (Gjssaeter & Kawaguchi 1980) and observations made from submersibles are much higher than either net or acoustic estimates (Milliman & Man- heim 1968, Alldredge et al. 1984). Therefore it is poss- ible that the BIONESS underestimated the biomass and concentration of Benthosema glaciale in this study and therefore the impact of this species on the zooplankton community of the slope, even though the biomass estimates are much higher than those of previous studles. However, the data for different months were collected during hfferent years, so interpreting these data as showing seasonal changes should be done with caution because of the large interannual variation in the data.
The very low concentration of Benthosema glaciale found in October coincided with a warm water mass in the upper 600 m. The reduction in the B. glaciale population may have been due either to fish migrating to a region of colder water or else to their being advected away from the sampled area during the sum-
Tab
le 7
P
erce
nta!
jes
of
gro
up
s an
d g
ener
a in
the
sam
ple
s an
d I
n th
e st
omac
hs o
f a
tota
l of
79
Ben
lhos
ema
glac
iali
s co
llec
ted
du
rin
g A
pril
198
3 fr
om v
ario
us d
epth
str
ata
duri
ng d
ay a
ncl
nigh
t. M
ean
len
gth
an
d w
idth
(m
m) o
f th
e pr
ey i
n th
e sl
om
ach
s of
f~
sh are
give
n u
nd
er p
rey
nam
es.
A m
odif
ied
Ivle
v's
elec
tivi
ly i
ndex
(D
,), i
s al
so g
iven
GR
OU
PS
No.
M
ean
PT
ER
OP
OD
A
OS
TR
AC
OD
A
AM
PH
IPO
DA
E
UP
HA
US
IAC
EA
C
HA
ET
OG
NA
TH
A
CO
PE
PO
DA
fi
sh
dep
th
0.5,
0.5
1
.7.0
.7
5.3,
1.6
9.
2, 1
.4
(m)
Sar
n. %
S
tom
. D/o
D,
Sar
n. X
) S
torn
. D
, S
arn.
%
Sto
m. %
D
, S
am. "
h
Sto
m. %
D
, S
am. O
/o
Sto
m. %
D
, S
am. '%
S
tom
. 'X)
D
,
Day
1
5
430.
0
Nig
ht
10
18
.0
8
40.0
1
1
60
.0
12
91
.0
18
17
4.0
5
3
07
.0
Mea
n D
,
CO
PE
PO
D G
EN
ER
A
No.
M
ean
O
ilho
na
On
caea
C
larr
soca
lanu
s P
arac
alan
us
Neo
cala
nus
Sco
leci
tl~
rice
lla
fish
d
epth
0.
6. 0
.3
0.8
, 0.3
0
.8, 0
.3
1.1
, 0.5
1.
2, 0
.5
1.2
, 0.5
(rn)
S
drn
. 'X)
Sto
m. %
D
i S
am. 'X
, S
tom
. % Di
Sar
n. "/U
Sto
m. O
/O
D,
Sam
. "A,
S
lom
. %
D,
Sam
. S
tom
. '/o
D,
Sam
. 'X,
S
tom
. 'X,
D
,
Nig
ht
10
18.0
1.
4 0
.0
-1.0
0
0.1
0.
-1.0
0
4.1
0
.0
-1.0
0 2
.6
0.0
-1
.00
0.
0 0.
0 0
.8
0.0
-1
.00
8
4
0.0
0
.9
0.0
-1
.00
0.
4 0
.0
-1.0
0
13.6
0.
0 -1
.00
1.5
0.0
-1.0
0
0.0
0.
0 0.
3 0.
0 -1
.00
1
1
60.0
1.
7 0.
0 -1
.00
0.2
0
.0
-1.0
0 8.
9 1
.1
-0.7
9
1.4
0.0
-1
.00
0.0
0
.0
1.3
0.1
-0
.85
12
9
1.0
7
.5
0.2
-0
.96
0.
4 0
.0
-1.0
0 1
2.6
2.
3 -0
.72
1
.1
0.3
-0
.57
0.
0 0
.0
1.4
0.0
-1
.00
1
8
17
4.0
3.
1 0
.2
-0.8
8
0.5
0.2
-0
.43
1
0.9
2.
4 -0
.66
1.2
0.0
-1
.00
0
.0
0.1
1
.00
0
.9
0.2
-0
.64
5
3
07
.0
1.3
0.0
-1
.00
0.
5 0
.0
-1.0
0
1.3
0.
0 -1
.00
0
.4
0.0
-1
.00
0
.5
0.1
-0
.66
0
.5
0.0
-1
.00
M
ean
D,
-0.9
7
-0.9
0
-0.8
6
-0.9
3
0.20
-0
.92
Tab
le 7
(co
nti
nu
ed)
CO
PE
PO
D G
EN
ER
A
No.
M
ean
P
seu
do
cala
nu
s A
etld
eus
Plp
uro
mam
ma
Met
rid
ia
C11
irid
1 us
Cal
anu
s fi
sh
dep
th
1.3
, 0.7
1
.9, 0
.9
2.0
, 0.8
2
.0, 0
.8
2.2
. 1.0
3
1,0
8
(m)
Sam
. %
Sto
m. %
D
, S
am. %
S
tom
. %
D,
Sam
. %S
Sto
m. 5
%
D,
Sam
. %
Sto
m. "
10
D,
Sam
. %
Sto
m. "
A
D,
Sam
. %
Sto
m. "
/U
D,
Nig
ht
10
1
8.0
1
.2
0.0
-1.0
0
0.0
3.
7 1
.00
0
.3
2.2
0
.79
5
.6
3.1
-0
.30
0.0
0.
0 5
4.3
3
9.4
-0
.29
8
40.0
1
.1
0.0
-1
.00
0 0
0.
0 1
.2
6.7
0
.71
25
.1
12
.2
-0.4
1
0.0
0.
0 3
0.7
22
.4
-0.2
1
11
6
0.0
0
.4
0.0
-1
.00
0
1
1.7
0
.89
2.
9 8
.0
0.49
2
8.8
7
.9
-0.6
5
0.0
0.
0 2
8.0
1
7.4
-0
.30
12
9
1.0
0
.1
0.4
0
.60
0
.6
0.2
-0
.50
7.1
3
.4
-0.3
6
22
.7
6.4
-0.6
2
0.0
0
.3
1.00
2
0.2
1
6.5
-0
.12
1
8
17
4.0
0
.8
0.3
-0
.46
0.8
1
.7
0.3
6
3.5
6
.7
0.3
2
24
.9
15.7
-0
.28
0
.0
0.2
1.
00
27
.9
24 9
-0
.08
5
3
07
.0
0.0
1
.0
1.00
0
.1
4.0
0
.95
0
.6
2.9
0.6
6
5.4
9.
1 0
.27
0.
0 0.
0 -1
.00
9.2
3
3.6
0
.66
M
ean
D,
-0.5
1 0
.52
0
.43
0
.4
2
0.3
3
-0.0
2
No.
M
ean
E
uchi
reU
a E
uch
aeta
fi
sh
dep
th
3.2
, 1.4
3
.4, 1
.3
(m)
Sam
. '/o
Sto
m. '
10
D,
Sam
. 'X,
S
tom
. %
D,
Day
1
5
43
0.0
Nig
ht
10
1
8.0
8
4
0.0
1
1
60
.0
12
9
1.0
1
8
17
4.0
5
307.
0 M
ean
D,
Tab
le 8
. P
erce
ntag
es o
f gr
oups
an
d g
ener
a in
the
sam
ples
an
d In
the
sto
mac
hs o
f 11
4 B
enth
osem
a gl
acia
le c
olle
cl.e
d du
ring
Ju
ne
1978
fro
m v
ario
us d
epth
str
ata
duri
ng t
he
nigh
t. M
ean
len
gth
and
wid
th (
mm
) of
the
prey
in
the
stom
achs
of
f~sh
are
glve
n u
nd
er p
rey
nam
es.
A m
odif
ied
Ivle
v's
elec
tivi
ty i
nd
ex (
Di)
, is a
lso
give
n
No.
M
ean
G
AS
TR
OP
OD
A
fish
d
epth
0.
7, 0
.7
(m)
Sar
n. 'V
0
Sto
m. '
X)
D;
10
12
1.85
0
-1
25
38
2.
47
0.7
-0.5
6
53
85
6 0.
29
-0.9
1
26
122
10.7
5 0
-1
GR
OU
PS
OS
TR
AC
OD
A
AM
PN
IPO
DA
E
UP
HA
US
IAC
EA
F
ish
larv
ae
CO
PE
PO
DA
1.
7, 0
.7
5.3
, 1.6
9
.2, 1
.4
Sam
. %
Sto
m. '1
0 D
, S
arn.
O/u
Sto
m. %
D
, S
am. %
S
tom
. %
D,
Sam
. O/o
Sto
m.
D,
Sam
. 'X,
S
tom
. D
,
0.0
0
0.00
-
4.4
9
0.65
-0
.76
0.33
0
.35
0.
05
0.0
1
0.0
0
-1.0
0
93.1
3 9
9.0
0
0.7
6
0.0
0
0.16
1.
00
4.36
0.
77
-0.7
1
2.07
1.
36
-0.2
0 0
.03
0.
07
0.4
0
90
.69
9
2.6
8
0.14
0
.00
0
.00
-1
.00
21.9
5 1.
57
-0.8
9 10
.63
1.9
1
-0.7
2 0.
00
0.26
1
.00
6
0.7
9
90
.71
0
.73
0.
07
0.0
0
-1.0
0 27
.23
5.09
-0
.75
9.30
1.
91
-0.6
3 0.
00
1.12
1.
00
52.4
4 85
.38
0.68
CO
PE
PO
D G
EN
ER
A
No.
M
ean
O
itho
na
Mic
roca
lanu
s Sc
olec
ithr
icel
la
Pse
udoc
alan
us
Ple
urom
amm
a M
etri
dia
fish
d
epth
0.
6, 0
.3
0.8,
0.3
1
.2.0
.5
1.3
,0.7
2.
0, 0
.8
2.0,
0.8
(m)
Sam
. 'X,
S
tom
. 'K,
D
, S
am. %
S
tom
. %
D;
Sam
. %
Sto
m. %
D
, S
am. %
S
tom
. "lo
D
; S
am. %
S
tom
. 'V"
D;
Sam
. 'C
S
tom
. %
D,
No.
M
ean
C
alan
us
Euc
hire
lla
Euc
haet
a fi
sh
dep
th
3.1
, 0.8
3
.2, 1
.4
3.4.
1.3
(m)
Sam
. '!h
S
to~
n. 'K,
D,
Sar
n. O
/o S
tom
. "/o
D
, S
am. %
S
tom
. %
D,
Sameoto: Feeding of lantern fish 127
mer as the water was displaced by warmer water. Samples taken from depths down to 1400 m in October showed that the fish did not migrate deeper than their normal daytime depth of 300 to 800 m to avoid the warm water. The most likely explanation is that the fish remained with the cold water mass as it moved to the southwest, though few data exist on water mass move- ment in this region. The B. glaciale population prob- ably reappears in the late winter or early spring with the re-appearance of the cold water of the Labrador Current from the northeast.
The daytime vertical distribution of Benthosema glacjale showed a population concentration between 300 and 550 m with a maximum between 320 and 360m. These results were similar to those of Halliday (1970) who found the daytime centre of vertical distribution below 450 m. In the present study a few fish were caught during the day in the upper 30 m, and in all cases these fish had empty stomachs. It is reasonable to suggest that hunger may have caused these fish to break from the normal dayhight vertical migration pattern. During the night the majority of the population was found below the main concentration of copepods which was in the upper 30 m even though the highest concentration of B. glacialis was commonly found with the highest concentration of copepods. This suggests that most fish either feed below the highest concen- trations of prey or else make short excursions into the upper layers to feed and then return to the deeper water below the zooplankton maximum. The latter suggeseon is suppcrted b y the stsmach contcnts ~f :he fish in the top 200 m which contained a higher percen- tage of Calanus, a species concentrated in the top 30 to 50 m during all months.
Benthoseina glaciale in other regions feed primarily at night, but also feed during the day (Kinzer 1977). In the present study the feedmg pattern was similar to that reported by Gnzer (1977) in the Central Atlantic with the highest percentage of 100 % full and lowest percentage of empty stomachs being found between 22:OO and 03:OO h.
The daily ration of Benthosema glaciale, defined as the ratio between body weight and the weight of the contents of a 100 O/O full stomach, was similar to that of Lampanyctus mexicanus in the Gulf of California which ranged between 3.7 and 6.1 % (Holton 1969). Baird et al. (1975) found the maximum prey biomass for Diaphus taaningi from the Cariaco Trench was 0.8 % of dry body weight. Tseytlin & Gorelova (1978) estimated the specific daily ration of Myctophum nitidulurn in the equatorial Pacific of length of l l to 20 mm to be 13 % of body weight. The smallest Benthosema glaciale on the Scotian slope (about 16 mm) had a daily ration range of 3 to 10 % of body weight. These fish live in water at 4 to 8.5 "C, while M. nitidulum lives at between 22 and
34 "C suggesting a higher metabolic rate, and probably a higher ration.
Use of the weight of the contents of 100 % full stomachs as a measure of the daily ration most Likely underestimated the true ration, for some food was problably digested within 24 h or had passed from the stomach into the gut.
Roe & Badcock (1984) reported that Benthosema glaciale positively selected Metndia lucens but avoided the more numerous Clausocalanus, suggesting that B. glaciale selects its prey according to size. They found that B. glaciale actively fed at night, but that it also fed at its daytime depth, in agreement with the results of this study. Gjosaeter (1973b) observed that feeding of B, glaciale was greatest during the spring and summer, decreasing in fall and winter. He sug- gested that there may be a relationship between degree of filling of the stomachs and the volume of zooplankton per m3, which was highest during spring and summer, as also found in the present study which showed a low level of feeding in October when the zooplankton concentration was very low. Gjersaeter (1973b) found no relationship between feeding and temperature at the daytime depth of B. glaciale. On the Scohan slope the temperature at this depth showed a significant increase from April to October indicating greater penetration of warmer slope water late in the year. This warmer slope water had very low concen- trations of zooplankton and B. glaciale associated with it. Such low zooplankton concentrations may have inhei iced :he feeding behaviol of E. yidciciie so thdi few fish migrated vertically at night to feed in the upper water. Baird et al. (1975) estimated that the minimum prey density needed for feeding by Diaphus taaningi in the Cariaco Trench was 154 m-3. One can only speculate how long the population of B, glaciale on the Scotian slope could survive the zooplankton- impoverished October water mass with prey concen- trations of 50 to 99 m-3 at their daytime depth and 3 to 14 m-3 at their night-time depths.
Hartmann (1970) reported that 3 species of pleus- tonic fish in the subtropical North Atlantic broaden their food spectrum with increasing length, with the larger fish eating larger prey and abandoning the smaller prey. Paxton (1967) showed that in the Cahfor- nia current system only the largest specimens of 2 species of myctophids fed on fish. Scotto di Carlo et al. (1982) stated that the smallest Hygophum benoitiin the Straits of Messina tended to feed exclusively on copepods while the larger specimens shifted toward an euphausiid diet. They found that Myctophum punc- tatum had a mixed diet at all stages of their growth with prey diversity increasing with fish size. The pattern of increased prey diversity with increased body size was also shown for Stenobrachius leucopsarus in the east-
128 Mar. Ecol Prog. Ser.
ern Pacific (Collard 1970, Tyler Pc Pearcy 1975). Bentho- sema glaciale in the present study broadened its food spectrum with increasing fish length, but did not appear to stop feeding on the smallest prey as Hart- mann (1970) reported for the pleustonic fish. This means that the largest specimens of B. glaciale had the widest prey size range. Kinzer (1982) reported that B. glaciale var. thori in the Central Atlantic below 30 mm length fed primarily on copepods, but that individuals >30 mm also fed on euphausiids. Scotian slope speci- mens showed no indication of increased feeding on euphausiids with increased body length.
Scott di Carlo et al. (1982) reported that Hygophum benoiti and Myctophum punctatum rarely fed on small copepods (about 1 mm) and suggested this was due to the species using visual cues to locate their prey - large bioluminescent copepods such as Pleuromamma spp. Scotian slope Benthosema glaciale showed the highest positive selection for Pleurornamma spp. out of all the copepods off the Scotian shelf, the most common species being P. borealis. Metridia and Calanus, both of which were as large or larger than Pleuromamma and much more numerous, were negatively selected. These 2 genera were not concentrated at the same night-time depths as the main population of myc- tophids, whereas Pleuromamma was concentrated at these depths during both the day and night. It is also quite Likely that Pleuromamma and B, glaciale verti- cally migrated in syncrony since they had similar day/ night distributions, subjecting Pleuromamma to almost continuous predation.
Gj~sae te r (1973a) stated that Benthosema glacialis in Norwegian waters grows faster and has a higher max- imum length than it does off Nova Scotia. The largest specimen reported outside Norwegian waters was one taken in Greenland measuring 84 mm (Jensen 1948) which was estimated to be 7 to 8 yr old. The largest specimen collected by Halliday (1970) off the Scotian shelf was approximately 58 mm, much smaller than those collected during the present study. The differ- ence in the maximum sizes of the fish (83 mm for this study vs 58 mm for Halliday 1970) may have been due to the different types of the sampling gear used. Halli- day used a 6 ft (1.8 m) Isaccs-&dd midwater trawl which may be less efficient at capturing the larger B. glaciale. The presence of the large fish during May could have indicated a population of fish carried to the Scotian shelf region by the Labrador Current from the Labrador coastal region where a population of older and larger fish is reported to exist (Gjssaeter 1973a).
~ a f l i d a y (1970) found much lower numbers of Bentho- sema glaciale during September and October than In spring, sampling south of the area sampled in October in the present study. However B. glaciale was very abundant during September and October east of the
Grand Banks in the region of the Labrador Current. This suggests that the presence of B. glaciale along the edge of the Scotian shelf may be related to the pres- ence of the colder Labrador Current water in spring and summer, whlch was not present in October.
Acknowledgements. I thank MS M. K. Lewis for her very able assistance in the analysis of data and Drs R. J. Conover and A. R. Longhurst for their critical and constructive reviews of the manuscript.
LITERATURE CITED
Alldredge, A. L., Robison, B. H., Fleminger, A., Torres, J. J.. King, J. M., Hammer, W. M. (1984). Direct sampling and in situ observation of a persistent copepod aggregation in the mesopelagic zone of the Santa Barbara Basin. Mar. Biol. 80: 75-81
Balrd, R. C., Thomas, B., Hopklns, L , Wilson, D. F. (1975). Diet and feeding chronology of Diaphus taaningi (Myc- tophldae) in the Cariaco Trench. Copeia 2: 356-365
Chapman, R. P,, Bluy, 0. Z., Adington, R. H., Robison, A. E. (1974). Deep scattering layer spectra in the Atlantic and Pacific oceans and adjacent seas. J. acoustic Soc. Am. 56: 1722-1734
Clarke. T A. (1978). Die1 feeding patterns of 16 species of mesopelagic fishes from Hawaiian waters. Fish. Bull. U.S. 76: 495-513
Clarke, T A. (1980). Diets of fourteen species of vertically migrating mesopelagic f~shes in Hawaiian waters. Fish. Bull. U.S. 78: 619-640
Collard, S. B. (1970). Forage of some eastern Pacific midwater fishes. Copeia 2: 348-354
Fedulov, T P., Arkhipkin, A. J. (1986). Distribution of mass species of pelagic squid in spring between Nova Scotia and the Sargasso Sea as a function of hydrologic and dynamic water structure. Oceanology 26: 229-234
Gjosaeter, J. (1973a). Age, growth, and mortality of the myc- tophid fish Benthosema glaciale (Reinhardt), from western Norway. Sarsia 52: 1-14
Gjosaeter, J. (1973b). The food of the myctophid fish Bentho- serna glaciale (Reinhardt) from western Norway. Sarsia 52: 53-58
Gjosaeter, J., Kawaguchi, K. (1980). A review of the world resources of mesopelagic fish. FAO Fish. Tech. Pap. No. 193. FAO, Rome
Halliday, R G (1970). Growth and vertical distribution of the glacier lanterfish, Benthosema glaaale, in the Northwest- e m AtlanUc. J . Fish. Res. Bd Can. 27: 105-116
Hartmann, J. (1970). Verteilung und Nahrung des Ichthyo- neuston im subtropischen Nordostatlantik. 'Meteor' Forsch.-Ergebn., Reihe D 8: 1-60
Holton, A. A. (1969). Feeding behavior of a vertically migrat- ing lanternfish. Pacif. Sci. 23: 325-331
Hopkins, T L., Baird, R . C. (1975). Net feeding in mesopelaqc fishes Fish. Bull. U.S. 73: 908-914
Imsand, S. (1981). Comparison of the food of Triphoturus mexicanus and T nigrescens, two lanternfishes of the Pacific Ocean. Mar. Biol. 63: 87-100
Ivlev, V S. (1961). Experimental ecology of the feeding of fishes. Yale Univ. Press, New Haven. Conn.
Jacobs, J. (1974). Quantitative measurement of food selection. Oceologia (Berl.) 14: 413-417
Sameoto: Feeding of lantern fish 129
Jahn, A. E., Backus, R. H. (1976). On the mesopelagic fish fauna of slope water, Gulf Stream, and northern Sargasso Sea. Deep Sea Res. 23: 223-224
Kinzer, J . (1977). Observations on feeding habits of the mesopelagic fish Benthosema glaciale ( ~ ~ c t o p h i d a e ) off NW Africa. In: Anderson, W. R., Zahuranec, B. J . (eds.) Oceanic sound scattering prediction. Plenum Press, New York, p. 381-392
Kinzer, J. (1982). The food of four myctophid fish species off Northwest Africa. Rapp. P.-v. Reun Cons. int. Explor. Mer 180: 385-390
Lancraft, T. M. , Robison, B. H. (1980). Ev~dence of postcapture ingestion by midwater fishes in trawl nets. Fish. Bull. U.S. 77: 713-715
Milliman, J . D. , Manheim, F. T. (1968). Obsenrations in deep- scattering layers off Cape Hatteras, USA. Deep Sea Res. 15: 505-507
Paxton, J. R. (1967). A hstributional analysis for the lantern- fishes (Family Myctophidae) of the San Pedro Basin, California. Copeia 2: 422440
Roe, H. S. J., Badcock, J. (1984). The die1 migrations and distribution within a mesopelagic community on the North
East Atlantic. 5. Vertical migrations and feeding of fish Prog Oceanog. 13: 389-424
Rowedder, U. (1980). Feeding ecology of the myctophid Elec- trona antarctica, (Gunther. 1878) (Teleostei). Meeresfor- schung 27: 252-263
Sameoto, D. D. (1982). Zooplankton and micronekton abun- dance in acoustic layers on the Nova Scotian slope. Can. J. Fish. Aquat. Sci. 39: 760-777
Sameoto, D. D., Jaroszynki, L. O., Fraser, W. B. (1980). BIO- NESS, a new design in multiple net zooplankton samplers. Can. J . Fish. aquat. Sci. 37: 722-724
Scotto dl Carlo, B., Costanzo, G . , Fresi, E., Guglielmo, L.. Ianora, A. (1982). Feeding ecology and stranding mechan- isms In two lanternfishes, Hj~gophum benoiti and Myc- tophum punctatum. Mar Ecol. Prog. Ser. 9: 13-24
Tseythn, V. B., Gorelova, T. A. (1978). Study of the feeding of the lanternfish Myctophum nitidulum (Myctophdae, Pis- ces). Oceanology 18: 488-492
Tyler, H. R., Pearcy, W. G. (1975). The feeding habits of three species of lanternfish (Family Myctophidae) off Oregon. USA. Mar. Biol. 32: 7-11
This article was presented by Dr T Platt; it was accepted for printing on January 25, 1988