Embed Size (px)
Citation preview

University of Central Florida University of Central Florida
STARS STARS
Honors Undergraduate Theses UCF Theses and Dissertations
2018
Feeding the Children: A Paleodietary reconstruction of Juveniles Feeding the Children: A Paleodietary reconstruction of Juveniles
from Kuelap, Peru from Kuelap, Peru
Marley Denierio University of Central Florida
Part of the Archaeological Anthropology Commons, Biological and Physical Anthropology Commons,
and the Other Anthropology Commons
Find similar works at: https://stars.library.ucf.edu/honorstheses
University of Central Florida Libraries http://library.ucf.edu
This Open Access is brought to you for free and open access by the UCF Theses and Dissertations at STARS. It has
been accepted for inclusion in Honors Undergraduate Theses by an authorized administrator of STARS. For more
information, please contact [email protected].
Recommended Citation Recommended Citation Denierio, Marley, "Feeding the Children: A Paleodietary reconstruction of Juveniles from Kuelap, Peru" (2018). Honors Undergraduate Theses. 415. https://stars.library.ucf.edu/honorstheses/415

FEEDING THE CHILDREN: A PALEODIETARY RECONSTRUCTION OF JUVENILES
FROM KUELAP, PERU
by
MARLEY S. DENIERIO
A thesis submitted in partial fulfillment of the requirements for the Honors in the Major Program
in Anthropology in the College of Sciences and in the Burnett Honors College at the
University of Central Florida
Orlando, Florida
Fall Term, 2018
Thesis Chair: J. Marla Toyne, PhD

ii
ABSTRACT
Before reaching adulthood, every individual experiences a period of dependency, the
juvenile period, during which they rely on the older, more experienced members of their society
for their security, subsistence and care. This juvenile period is an important stage of life for
human physical and physiological development. In bioarchaeology, there has been limited
research conducted on juveniles, particularly, the development of their own social identity and
influences. The research method of stable carbon (C) and nitrogen (N) isotope analysis is used to
reconstruct the paleodiet of juveniles to determine their dietary composition. Specifically, this
research is focused on Kuelap, located in the highlands of Peru, a large settlement inhabited from
900-1535 AD, including pre-Inca (900-1469 AD) and Inca periods (1470-1535 AD). The
primary aim of this research is to determine if juveniles consumed different foods through
different time periods. Another aim of this research is to determine if juveniles were treated
differently than their adult counterparts. Bone collagen samples, primarily ribs, from 32 juveniles
were analyzed. The average δ13C value for the pre-Inca juveniles was –13.1‰, and –13.4‰ for
the Inca period juveniles. There was no statistically significant difference in δ13C values between
juvenile groups or between adult and juvenile subsamples. The average δ15N for the pre-Inca
juveniles was +8.1‰ and +7.8‰ for the Inca period juveniles. The Mann-Whitney U test
determined there was not a statistically significant difference in δ15N values between the juvenile
burial groups; however, there was a statistically significant difference between the juvenile and
adult subgroups. The findings suggest that there may have been preferential treatment toward or
metabolic stressors on the juvenile. The results of this study offer insights to availability of
dietary components, societal roles based on developmental age stages, and the potential role of
parenting in Kuelap.

iii
DEDICATION
To my family,
for inspiring my sense of adventure
and instilling in me respect for diverse cultures and peoples.

iv
ACKNOWLEDGEMENTS
It is with profound appreciation that I extend my gratitude to my teachers and professors who
challenged me to go above and beyond their expectations and who fostered my curiosity. I would
especially like to thank Dr. Reyes-Foster who introduced me to the fascinating fields in
anthropology and to Dr. Toyne for taking a chance on me as she inspired my lab work and
dedicated countless hours to coaching and mentoring me. Our research in Peru was a life-
changing experience.
I also thank my parents for demonstrating the courage to take me off the beaten path as we’ve
traveled around the world. You developed in me an open mind, resiliency, cultural competence
and appreciation for local diets for which I will be forever grateful.

v
TABLE OF CONTENTS
Chapter I. INTRODUCTION ......................................................................................................... 1
Basis of Research ........................................................................................................................ 1
Juvenile Bioarchaeological Reconstruction ................................................................................ 1
Research in the Andes ................................................................................................................. 2
Hypotheses .................................................................................................................................. 3
Chapter II. BACKGROUND .......................................................................................................... 6
Archaeology of the Andean Region ............................................................................................ 6
The Bioarchaeology of Juveniles ................................................................................................ 8
Isotope Analysis ........................................................................................................................ 13
Stable Carbon Isotopes .............................................................................................................. 14
Stable Nitrogen Isotopes and Presented Issues with Nitrogen Isotopes.................................... 15
Nitrogen Isotopes, Infants, and Weaning .................................................................................. 16
Bioarchaeology and Stable Isotopes ......................................................................................... 16
Chapter III. METHODS AND MATERIALS .............................................................................. 17
Sample Composition ................................................................................................................. 17
Methods ..................................................................................................................................... 20
Sample Preservation .................................................................................................................. 21
Analytical Methods ................................................................................................................... 22
Chapter IV. FINDINGS ................................................................................................................ 23
Calculated Sample Preservation ................................................................................................ 23
δ13C and δ15N Results ................................................................................................................ 23
Descriptive Statistics ................................................................................................................. 24
Statistical Analysis .................................................................................................................... 25
Chapter V. DISCUSSION ............................................................................................................ 27
Isotopic Change in Juveniles over Time ................................................................................... 27
Juvenile and Adult Isotopic Variation ....................................................................................... 30
Dietary Composition of Juveniles and Adults........................................................................... 31
Preferential Treatment of Juveniles........................................................................................... 32
Chapter VI. CONCLUSIONS ....................................................................................................... 34
Limitations ................................................................................................................................ 34
Sample Size and Time Limitations ........................................................................................... 35
Sample Type Limitations .......................................................................................................... 35
Future Directions ....................................................................................................................... 36

vi
APPENDICES .............................................................................................................................. 38
Appendix A: The modified Longin (1971) method used to extract collagen from bone .......... 39
Appendix B: Collagen yield, δ13C values and δ15N by juvenile subgroup (individuals are in
order of ascending age, Table 3). .............................................................................................. 42
Appendix C: δ13C values and δ15N values adjusted for diet by juvenile subgroup (individuals
are in order of ascending age, Table 3). .................................................................................... 43
Appendix D: Cwt%, Nwt% and C/N ratios for juvenile samples (individuals are in order of
ascending age, Table 3). ............................................................................................................ 44

vii
LIST OF TABLES
Table 1. Hypotheses and expectations…………………………………………………………… 4
Table 2. Age distribution of juveniles between the two burial contexts………………………... 17
Table 3. Ages and bone samples analyzed by juvenile subgroup…………………………......... 19
Table 4. Averages, standard deviation and ranges for δ13C and δ15N of juvenile
subgroups………………………………………………………………………………….. 24
Table 5. Averages and ranges for δ13C and δ15N of juvenile and adult
subgroups…………………………………………………………………………………... 24

viii
LIST OF FIGURES
Figure 1. Map of Peru with focus on area of study, Kuelap………………………………………7
Figure 2. Plan drawing of the archaeological site of Kuelap, Peru ………………...………….….8
Figure 3. Example of juvenile remains utilized in bioarchaeological studies ……………..…… 11
Figure 4. Bi-plot between juvenile burial and massacre δ13C and δ15N values………….………26
Figure 5. Bi-plot between juvenile and adult subgroups δ13C and δ15N values……………….…26
Figure 6. δ15N of juveniles by age, youngest to oldest, and subgroup………………………..….29
Figure 7. Andean food web comparing juvenile and adult subgroup isotope data adjusted for
diet………………………………………………………………………………………….. 32

1
Chapter I. INTRODUCTION
Basis of Research
The purpose of this research is to reconstruct paleodiet variation in the juveniles from
Kuelap, Peru through the analysis of stable isotopes. The juvenile bone samples used in this
study date from both the pre-Inca, Chachapoya, (900-1469 AD) and Inca periods (1470-1535
AD). The most useful stable isotopes in the reconstruction of paleodiet are carbon and nitrogen,
as δ13C and δ15N (DeNiro & Epstein, 1978). The sample size of the juveniles for this research
includes the bones of 32 individuals ranging in age from approximately 6 months to 19 years.
Peru was selected as the country of interest for this research for its geographical diversity and its
history of archaeological study and significance (Narváez, 1988; Ruiz Estrada, 2010). The 32
juveniles have been divided into two groups based on their chronological and burial context; a
pre-Inca burial group and an Inca period massacre group.
Variation in the dietary composition between the two juvenile subgroups will be
determined through the interpretation of δ13C and δ15N values. In addition, the research will
include a comparison of the juvenile samples to adults from Kuelap to determine if there are any
significant differences in dietary composition. The research aims to determine if juveniles
consumed a different diet than adults. This can be used to elucidate customary practices in which
juveniles were treated differently from adults. Reconstructing dietary trends and composition
within these different populations can enhance the knowledge of the Chachapoya culture in
Kuelap and identify how different members of society lived their daily lives.
1
Juvenile Bioarchaeological Reconstruction
The sub-discipline of bioarchaeology aims to provide an understanding of human life and
the environment in the past by analyzing bones or other archaeological materials. By completing
bioarchaeological studies, both the social and biological factors of a population can be
understood (Halcrow & Tayles. 2008). This research primarily focuses on the period of life
before adulthood is reached, the juvenile period. Specifically, early life events and their
consequences in later life, including disease incidences and nutritional patterns, can be better
understood by studying juveniles (Lewis, 2007). Information about similarities and differences in
how juveniles were treated throughout time or how they were treated compared with other
populations enhances our understanding about past societies. Knowing more about early
cultures, creates a greater appreciation for the past, enhances understanding of the treatment of
different subgroups in a society, and helps to discover how stressors affect subgroups differently
(Goodman & Armelagos, 1989). The research contributes to the current anthropological debate
on whether juveniles are treated differently cross-culturally (Hill, 2013). Today, new research
and media sources provide evidence that modern juvenile populations are nurtured and provided
for differently based on the socioeconomic, religious, political or geographic influences in their
community (Sofaer, 1994). The research also highlights the societal roles of subgroups and their
impact on the greater community.
Stable isotopic analysis utilizes elements from bone, in this case carbon and nitrogen
from extracted collagen, to reconstruct direct dietary components. In early stable isotopic
analysis studies, there was not much emphasis on the reconstruction of diet in juveniles (DeNiro
& Hastorf, 1984). Within the archaeological record, the value of juveniles was underestimated
(Larsen, 2015). Additionally, juvenile remains were not as easily found nor analyzed, primarily

2
due to poor preservation or absence from archaeological sites, creating an archaeological bias
(Halcrow & Tayles, 2012, Larsen, 2015). There was also a widely accepted belief that juvenile
samples would not provide accurate or precise data upon which to base a bioarchaeological
analysis. New bioarchaeological studies, however, offer evidence that juvenile remains provide
good isotope recovery and potential in the reconstruction of past lives (Dupras & Tocheri, 2007;
Tsutaya, 2017).
This thesis contributes an historical and cultural analysis of the change over time in the
treatment of juveniles in the past. The data and conclusions of this research will contribute to
future studies that compile dietary reconstructions from different locations and time periods to
formulate an extensive cross-cultural analysis.
Research in the Andes
In the last few decades, there has been a significant increase in bioarchaeological studies
globally, including bioarchaeological studies conducted in the Andean region of South America
(Andrushko et al., 2011; Knudson & Tung, 2010; Toyne 2015; Turner et al., 2013). This research
contributes to bioarchaeological investigations, since there are so few studies directly conducted
on juvenile remains, except in the case of human sacrifice (Andrushko et al., 2011; Toyne 2012;
2016; Turner et al., 2013). There have been stable isotopic studies conducted in the Andean
region; however, there have not been studies that explicitly compare juveniles and their diets.
The present research helps to create the framework for further bioarchaeological studies on
stable isotopes from juvenile skeletal remains within this region and beyond.

3
The sample used for this research is comprised of 32 well-preserved and well-
contextualized juvenile remains from Kuelap, Peru, located in the Andean highlands. These
juveniles are from two different contexts; the burial subgroup, within the pre-Inca time period at
Kuelap (900-1469 AD), and the massacre subgroup, within the time period after the Inca
conquest of Chachapoya (1470-1535 AD). There are questions that arise when studying juveniles
in any culture, many of which seek to understand if juveniles are treated the same way over
different periods of time, or, if adults, the caretakers of the juveniles, treat their juveniles
differently. This research attempts to address these aspects that have not been fully explored in
past research conducted in the Andean region.
Hypotheses
The research focus of this thesis aims to determine if juveniles were treated differently
over time, or, treated differently than adults, to identify changes in social identities and parenting
strategies. This research will test two major concerns: 1) the dietary differences between time
periods of the juvenile burials; and 2) the dietary differences between the juveniles and an adult
subgroup. Table 1 outlines the hypotheses and expectations for this research.
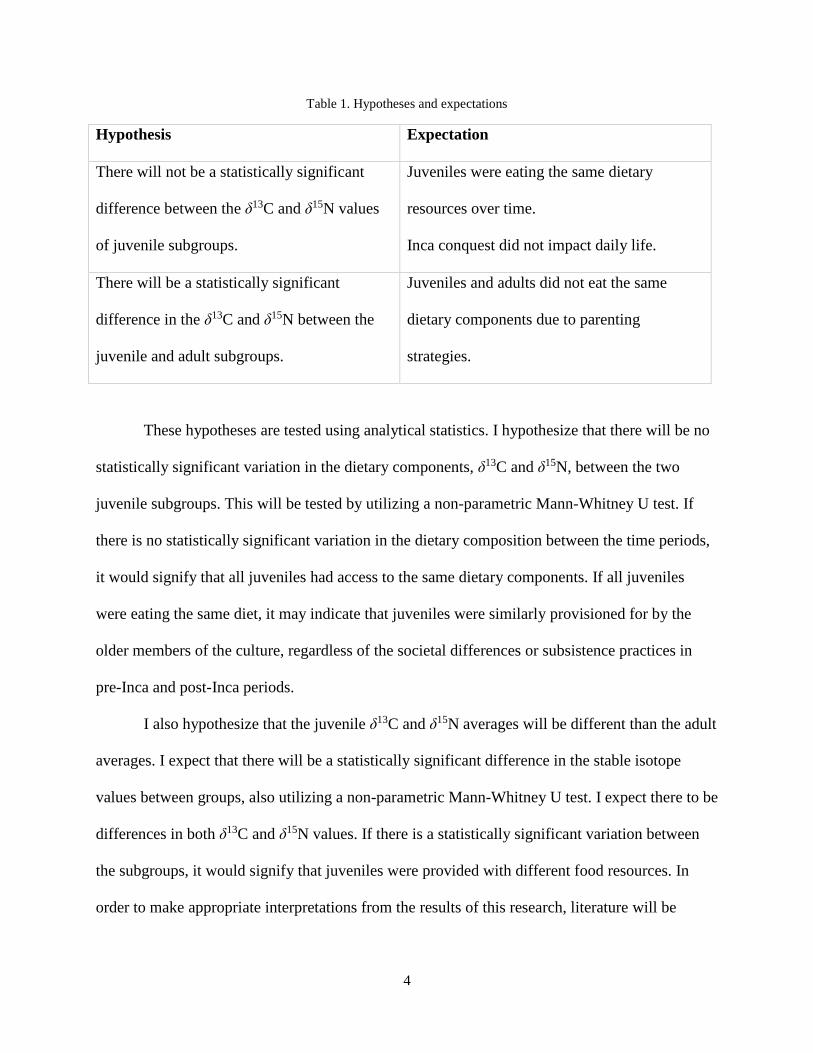
4
Table 1. Hypotheses and expectations
Hypothesis Expectation
There will not be a statistically significant
difference between the δ13C and δ15N values
of juvenile subgroups.
Juveniles were eating the same dietary
resources over time.
Inca conquest did not impact daily life.
There will be a statistically significant
difference in the δ13C and δ15N between the
juvenile and adult subgroups.
Juveniles and adults did not eat the same
dietary components due to parenting
strategies.
These hypotheses are tested using analytical statistics. I hypothesize that there will be no
statistically significant variation in the dietary components, δ13C and δ15N, between the two
juvenile subgroups. This will be tested by utilizing a non-parametric Mann-Whitney U test. If
there is no statistically significant variation in the dietary composition between the time periods,
it would signify that all juveniles had access to the same dietary components. If all juveniles
were eating the same diet, it may indicate that juveniles were similarly provisioned for by the
older members of the culture, regardless of the societal differences or subsistence practices in
pre-Inca and post-Inca periods.
I also hypothesize that the juvenile δ13C and δ15N averages will be different than the adult
averages. I expect that there will be a statistically significant difference in the stable isotope
values between groups, also utilizing a non-parametric Mann-Whitney U test. I expect there to be
differences in both δ13C and δ15N values. If there is a statistically significant variation between
the subgroups, it would signify that juveniles were provided with different food resources. In
order to make appropriate interpretations from the results of this research, literature will be

5
reviewed to understand the research already conducted in the Andes, juvenile bioarchaeology,
and stable isotopic analysis.
6
Chapter II. BACKGROUND
To situate this research, it is necessary to develop an understanding of Andean
archaeology and the history of juvenile bioarchaeology. This chapter includes a review of the
background literature for these topics to garner a better understanding and framework for this
research.
Archaeology of the Andean Region
Each region of the world provides unique insight to the past. The Andean region of
northern Peru is rich in ecological diversity, ranging from alpine grasslands to thorn forests
(Muscutt, 1998; Church & von Hagen, 2007). This variation in ecology influenced the customs
and practices of Peru’s different archaeological cultural groups.
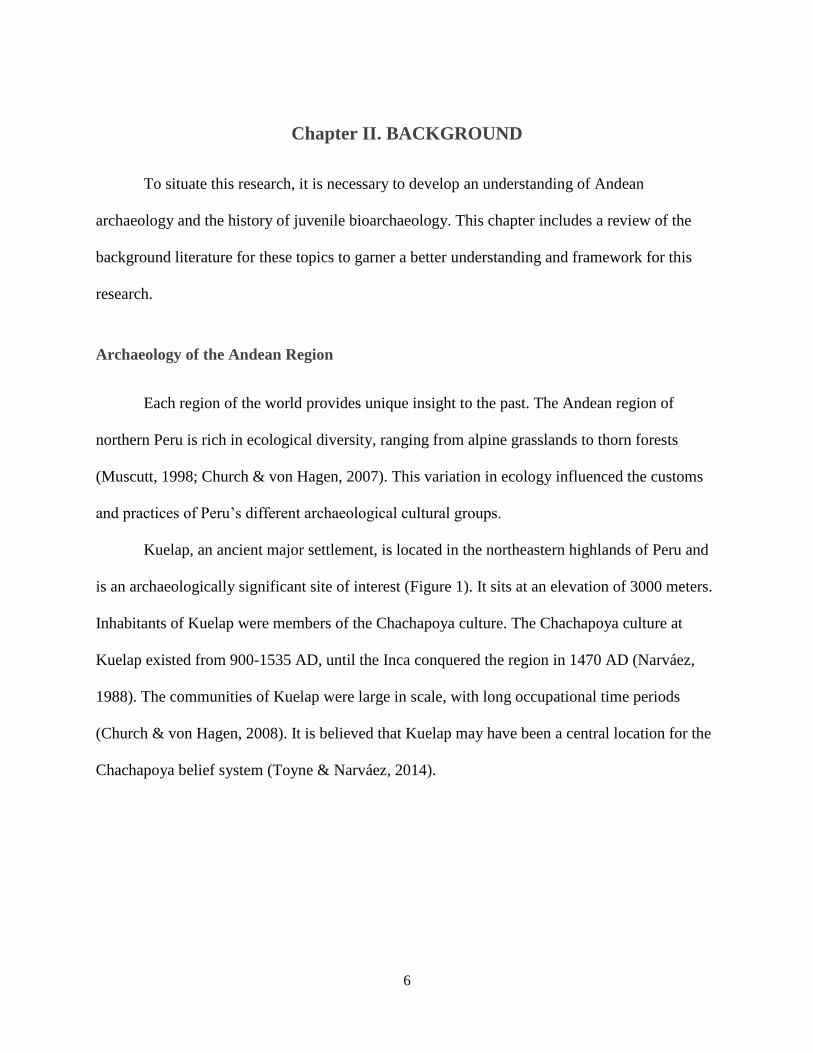
Kuelap, an ancient major settlement, is located in the northeastern highlands of Peru and
is an archaeologically significant site of interest (Figure 1). It sits at an elevation of 3000 meters.
Inhabitants of Kuelap were members of the Chachapoya culture. The Chachapoya culture at
Kuelap existed from 900-1535 AD, until the Inca conquered the region in 1470 AD (Narváez,
1988). The communities of Kuelap were large in scale, with long occupational time periods
(Church & von Hagen, 2008). It is believed that Kuelap may have been a central location for the
Chachapoya belief system (Toyne & Narváez, 2014).

7
Figure 1. Map of Peru with focus on area of study, Kuelap (Courtesy of Dr. Toyne)
With diverse ecological settings, come diverse subsistence strategies. Based on
zooarchaeological, paleobotany and historic records, the possible dietary components of
individuals living at Kuelap can be surmised (Michell, 2018). The inhabitants of Kuelap
primarily ate beans, maize, yucca and other tubers for plant resources (Narváez, 2013). They
typically relied on animals, such as guinea pigs, alpacas, rabbits and camelids for protein
resources (Narváez, 2013; Toyne et al., 2017). Some animals, such as guinea pigs, were raised in
the household for both dietary nutrition and economic purposes (Narváez, 1996).
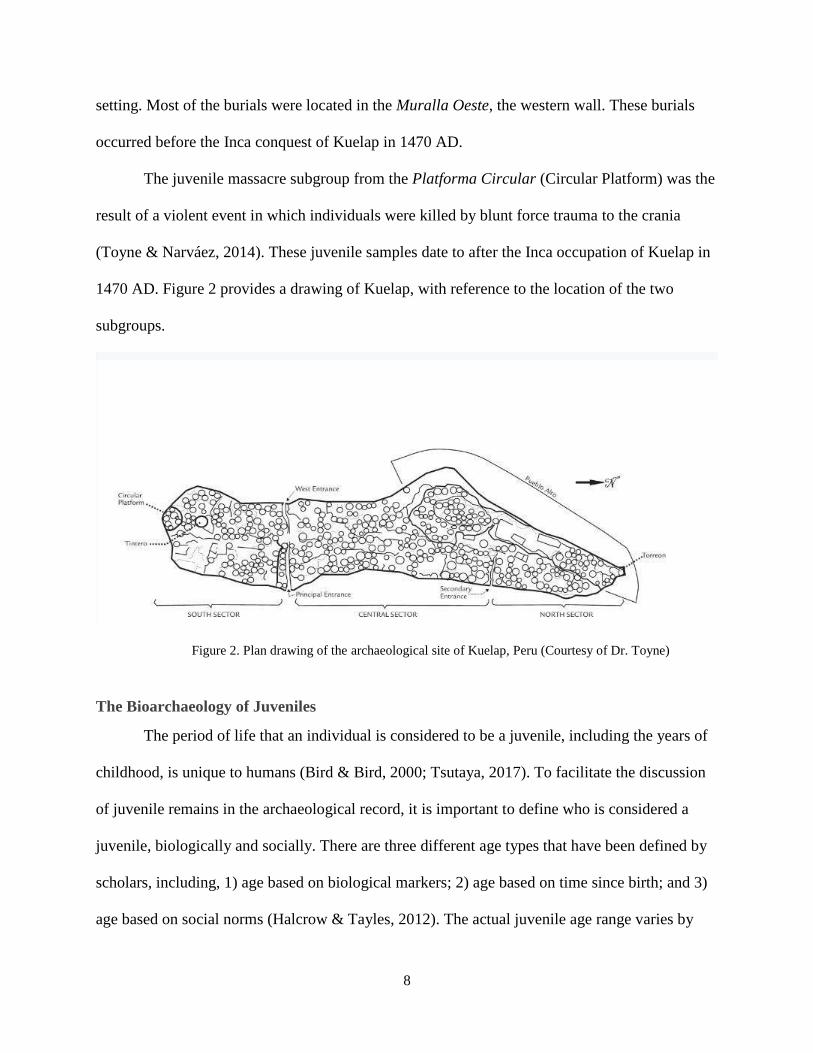
The Chachapoya exhibited complex mortuary behaviors, including burials within cave
walls, individual sarcophagi, and mummification (Ruiz Estrada, 2010; Nystrom et al., 2010). At
Kuelap, specifically, there is evidence of various mortuary practices. Within the Chachapoyas
region, the remains of individuals have been well-preserved, including many mummified
individuals (von Hagen & Guillen, 1998). The samples for this research represent a group of
juveniles exhumed from burials across the site, and a group found in a massacre mortuary
8
setting. Most of the burials were located in the Muralla Oeste, the western wall. These burials
occurred before the Inca conquest of Kuelap in 1470 AD.
The juvenile massacre subgroup from the Platforma Circular (Circular Platform) was the
result of a violent event in which individuals were killed by blunt force trauma to the crania
(Toyne & Narváez, 2014). These juvenile samples date to after the Inca occupation of Kuelap in
1470 AD. Figure 2 provides a drawing of Kuelap, with reference to the location of the two
subgroups.
Figure 2. Plan drawing of the archaeological site of Kuelap, Peru (Courtesy of Dr. Toyne)
The Bioarchaeology of Juveniles
The period of life that an individual is considered to be a juvenile, including the years of
childhood, is unique to humans (Bird & Bird, 2000; Tsutaya, 2017). To facilitate the discussion
of juvenile remains in the archaeological record, it is important to define who is considered a
juvenile, biologically and socially. There are three different age types that have been defined by
scholars, including, 1) age based on biological markers; 2) age based on time since birth; and 3)
age based on social norms (Halcrow & Tayles, 2012). The actual juvenile age range varies by

9
scholar (Bogin, 1997). The juvenile age range can also vary cross-culturally, as societies may
socially treat their younger populations differently and begin adulthood at different ages or
stages. For the purposes of this research, juveniles are defined as individuals younger than 19
years. This definition is used to account for the various biological growth and development
processes, from weaning to full maturity (Bogin, 1997).
Although a cross-cultural distinction does exist, the juvenile stage is generally identified
by treatment or by certain expectations within a given culture (Kamp, 2001). There is a notion of
a universal period of childhood based on a constructed social age in conjunction with biological
and psychological indices (Sofaer, 1994). The timeframe in which an individual is considered to
be a juvenile generally consists of a period of ‘dependency’; a concept developed in the early
modern period (Sofaer, 1994). During this time, there are specific biological and osteological
changes that occur in a juvenile, many of which are based on the environment; however, in all
cultures, the juvenile years produce a mixture of learning and biological growth as well as social,
political and economic learning (Sofaer, 1994). During this period of dependency, juveniles may
be provided for and treated differently than their adult counterparts, within their cultural context.
Traditionally, across disciplines, juveniles have not been considered significant
economic, social or political individuals in any given culture, or across time periods (Halcrow &
Tayles, 2008). Generally, there is a lack of focus on juveniles that carries across disciplines,
much of which comes from the belief that the behavior of juveniles is meaningless or simply
projections of the imagination, such as building stone piles or digging holes (Lewis, 2007
Juvenile activities, however, serve as a training period, not only for physical development, but
also to develop life skills as an adult and to cultivate personalities, belief systems and social
identities (Sofaer, 1994). Research on health and mortality rates in juvenile populations has
10
focused on the disease itself, not necessarily the effect on the juvenile or their society. Many
studies have simply recorded the number and cause of juvenile deaths within a particular region
(Lewis, 2007). They have stopped short of assessing the societal effect of juvenile death. By
studying the development of certain social identities, behaviors later in life can be understood.
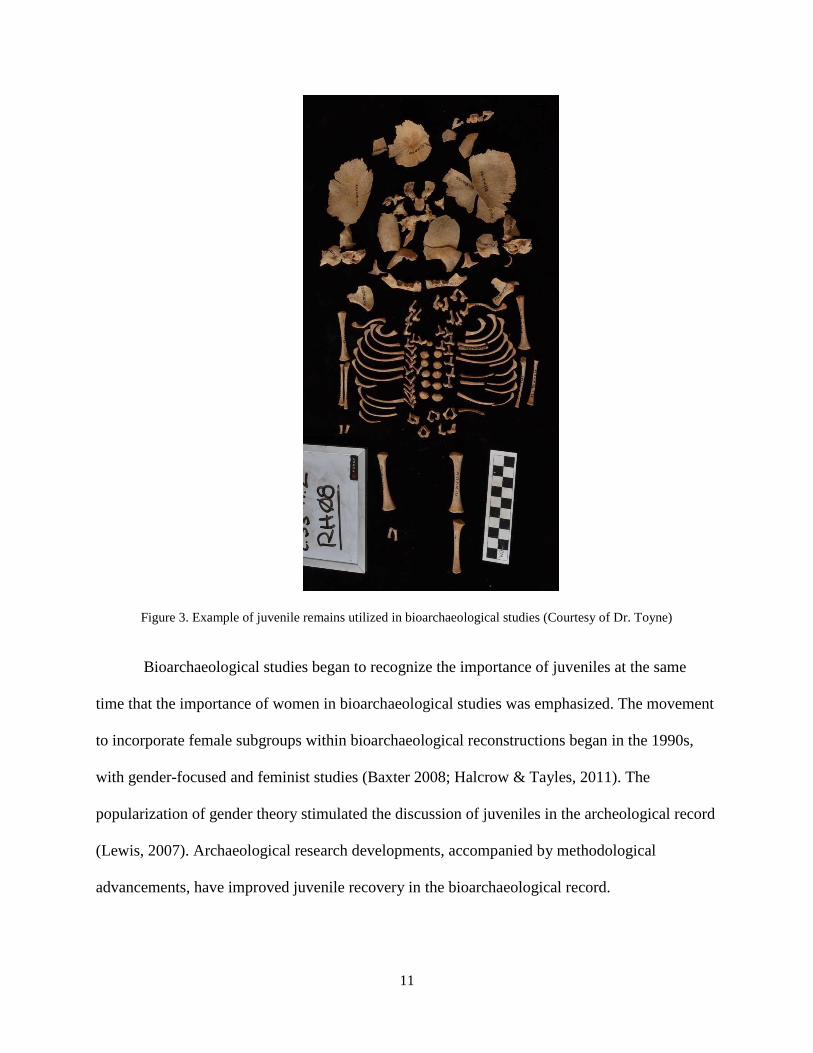
Studying juveniles in the bioarchaeological record does not come without its challenges.
Beyond the varying importance of juveniles within archaeological research, sample availability
may be limited. There is often an under-representation and poor preservation of juveniles within
mortuary contexts due to the porous nature of juvenile bones (Gordon & Buikstra, 1981;
Chamberlain, 2000; Lewis, 2007). Soils high in alkalinity or acidity may degrade preservation
(Gordon & Buikstra, 1981). There are situations, however, in which juvenile bones are deposited
in the archaeological record that display excellent preservation. Figure 3 provides an example of
juvenile remains that are preserved in excellent condition from Kuelap and that can be utilized
for bioarchaeological studies.
11
Figure 3. Example of juvenile remains utilized in bioarchaeological studies (Courtesy of Dr. Toyne)
Bioarchaeological studies began to recognize the importance of juveniles at the same
time that the importance of women in bioarchaeological studies was emphasized. The movement
to incorporate female subgroups within bioarchaeological reconstructions began in the 1990s,
with gender-focused and feminist studies (Baxter 2008; Halcrow & Tayles, 2011). The
popularization of gender theory stimulated the discussion of juveniles in the archeological record
(Lewis, 2007). Archaeological research developments, accompanied by methodological
advancements, have improved juvenile recovery in the bioarchaeological record.

12
An initial case for incorporating children into archeological studies was made by
Lillehammer (1989). Lillehammer (1989) argued that by studying the juvenile record, including
burial context and osteology, connections and inferences may be made about adulthood. From
the birth of an individual, everyday actions or treatments can influence how that individual lives
their life up to, and through, adulthood, including, predilection, habits, and belief systems.
Another case for the incorporation of juveniles into archeological studies was presented by
Hirschfield (2002). Hirschfield (2002) noted that childhood should be of great interest to
anthropologists since the primary purpose of anthropology is to discuss culture, and that culture
is learned. To understand the ways in which a culture survived or existed in daily life,
researchers should account for all demographic groups. This generates the largest scope possible
to deduce the most information possible in reconstruction. It has been argued, that when a group,
such as juveniles, are ignored in bioarchaeological studies, that the study can be rendered
incomplete, as not all variables are considered (Ardren, 2006).
Recently, there has been ethnographic and ethnohistorical research documented in the
Andean region (Abercrombie, 1998; Baitzel, 2017; Bolin, 2006; Sillar, 1994). Some of this
research focuses on early parent-child interactions and child-rearing practices, but few studies
exist that detail the juveniles themselves (Abercrombie, 1998; Baitzel, 2017). Past
bioarchaeological studies in the Andean region have often focused on child sacrifices during Inca
times, notably victim and trauma identification (Toyne, 2014). Conversely, this present research
focuses primarily on juvenile reconstructions of burial and sacrificial contexts, by studying diet,
a fundamental component of daily life.
13
Isotope Analysis
An isotope is “a form of the same element that differ in the number of neutrons in the
nucleus” (Fry, 2006, p.4). To be considered a stable isotope, the isotopes must not undergo
radioactive decay. The stable isotopes used most often in bioarchaeological research include the
elements hydrogen, carbon, nitrogen, oxygen, strontium, and sulfur (Meier-Augenstein, 2010).
These are found in varying abundances and are classified into their different forms based on their
mass. These classifications identify isotopes as ‘light’ or ‘heavy’. Light isotopes have fewer
neutrons in the nucleus; whereas, heavy isotopes have more neutrons in their nucleus (Fry,
2006). The difference between light and heavy isotopes does not correlate with their chemical
composition; but, is determined by chemical reactions, notably fractionation and mixing. Meier-
Augenstein (2011) notes that heavy stable isotopes typically undergo chemical reactions at a
slower rate than light stable isotopes.
Accounting for the processes of fractionation and mixing are vital in the reconstruction of
stable isotopes in diet. Fractionation occurs when isotopes differentiate from one another; mixing
occurs by creating a homogeneous substance (Fry, 2006). Fractionation is relatively more
complex than mixing and can be considered the “power controlling isotope distributions on this
planet” (Fry, 2006, p.12). There are several types of fractionation, such as equilibrium isotope
fractionation and the fractionation of isotopes that occur within physiochemical or biochemical
processes (Meier-Augenstein, 2010).
Stable isotope analysis has been selected as the methodology for this research as it is
accepted as a valid method to reconstruct the paleodiet of individuals across cultures and time
periods. It has been utilized in anthropological research to study migration, disease, and dietary
patterns (Katzenberg, 2012). The stable isotopes most frequently analyzed in the reconstruction
14
of paleodiet are carbon (δ13
C) and nitrogen (δ15
N) (Schoeninger & Moore, 1992; Katzenberg,
2008). Carbon and nitrogen ratios can determine the food resources that comprised the diet of
different individuals (DeNiro & Epstein, 1978). In dietary reconstruction, carbon isotopes reflect
an individual’s consumption of plants and nitrogen isotopes reflect an individual’s consumption
of protein (Ambrose & Norr, 1993).
Stable Carbon Isotopes
The reconstruction of plant dietary components in human diets can be determined
with carbon stable isotopes. δ13C values can help identify the photosynthetic pathway of the plant
consumed, including C3, C4, and CAM photosynthetic pathways. There will be different δ13C
values based on the photosynthetic pathway utilized by a plant. von Cremmerer (1992) states the
range of δ13C ratio for C3 plants is from –21‰ to –34‰; the range of δ13C for C4 plants is from
–8‰ to –15‰; CAM plants fall within a range most similar to C4 plants, but can overlap with the
range of C3 plants, depending on the aridity of the climate (von Cremmerer, 1992). There are
many examples of C3 plants, including rice, wheat, peanuts, beets, potatoes and spinach.
Common C4 plants include sugarcane and millets. In the Andes, examples of C3 plants consumed
are legumes; an example of highly consumed C4 is maize. The negative values correlate to the
smaller ratio of 13C compared to a carbon standard (DeNiro & Hastorf, 1984; von Cremmerer,
1992). The standard that δ13C values are compared to is Vienna Pee Dee Belemnite (VPDB).The
range of 13C/12C is determined dependent on atmospheric CO2, which reflects the conditions in
which the plants grew. An enrichment factor of 5‰ for δ13C was applied to the raw data to
reflect the original dietary source (DeNiro & Epstein, 1978).
15
Stable Nitrogen Isotopes and Presented Issues with Nitrogen Isotopes
Nitrogen isotopes help to determine the type of protein an individual consumed; whether
the protein is from a marine or terrestrial source (Ambrose, 1991). Like carbon, the δ15N value is
presented as a ratio; 15N/14N compared to AIR, as a standard. Nitrogen is incorporated into tissue,
representing the protein resources consumed. Specifically, nitrogen isotopes help to determine
the trophic level of the individual. The tropic levels correlate with the protein resource’s
placement in the hierarchy on a food chain, or food web. The higher the δ15N value, the higher
the trophic level of the protein source consumed; indicating that it was higher up on the food
chain (Hedges & Reynard, 2006). Different stressors in an individual can cause an alteration in
nitrogen values. An individual in a diseased state or undergoing metabolic stress may have
elevated δ15N levels (Reynard, 2006). Nitrogen can also be reflected in plants, based on their
growing conditions, particularly soils. An enrichment factor of 3‰ for δ15N was applied to the
raw data extracted to reflect the original dietary source (DeNiro & Epstein, 1978).
There are certain states of well-being that may also alter stable isotopic readings.
Stressors, commonly disease stressors either throughout life or that cause mortality, can alter the
chemical structure and readings of the bone (Fahy et al., 2017). These diseased states can cause
an increase in δ15N values, creating a bias that may skew the data points when individuals may
not actually be consuming foods from a higher trophic level. When in a disease state or under
periods of extreme stress, bones may turn over more frequently (Olsen et al., 2013).

16
Nitrogen Isotopes, Infants, and Weaning
In the early life of individuals, there is a period of life where an individual may directly
rely on their mother for nutrient intake. Weaning can be defined as the period of time when a
juvenile is slowing their consumption of breast milk and transitioning to solid foods more
commonly found in an adult’s diet (Williams et. al, 2005). Since these young children have often
not yet fully weaned off breast milk, their δ15N values may be enriched compared to those
individuals outside of the weaning period. Research has found that for weaning infants, the δ15N
values are enriched by 2.4‰ (DeNiro & Epstein, 1978). For the purposes of this research,
individuals were considered to be weaning if they were 1-3 years of age +/- 1 year.
Bioarchaeology and Stable Isotopes
When performing stable isotopic analysis to reconstruct past diets, the type of tissues
most frequently utilized are bones and teeth, since skeletons preserve more frequently due to the
higher mineral content than other soft tissues (Ambrose, 1990). For the purposes of this research,
bone samples were studied; specifically, the collagen of bone, which is part of the organic
portion of bone. Bone is comprised of 70% inorganic components (hydroxyapatite) and 30%
organic components (collagen) (Katzenberg, 2008). Collagen, a protein found in the bone, is
typically utilized as a source for reconstruction of human tissue as it can survive for thousands of
years (Tuross et al., 1980).
17
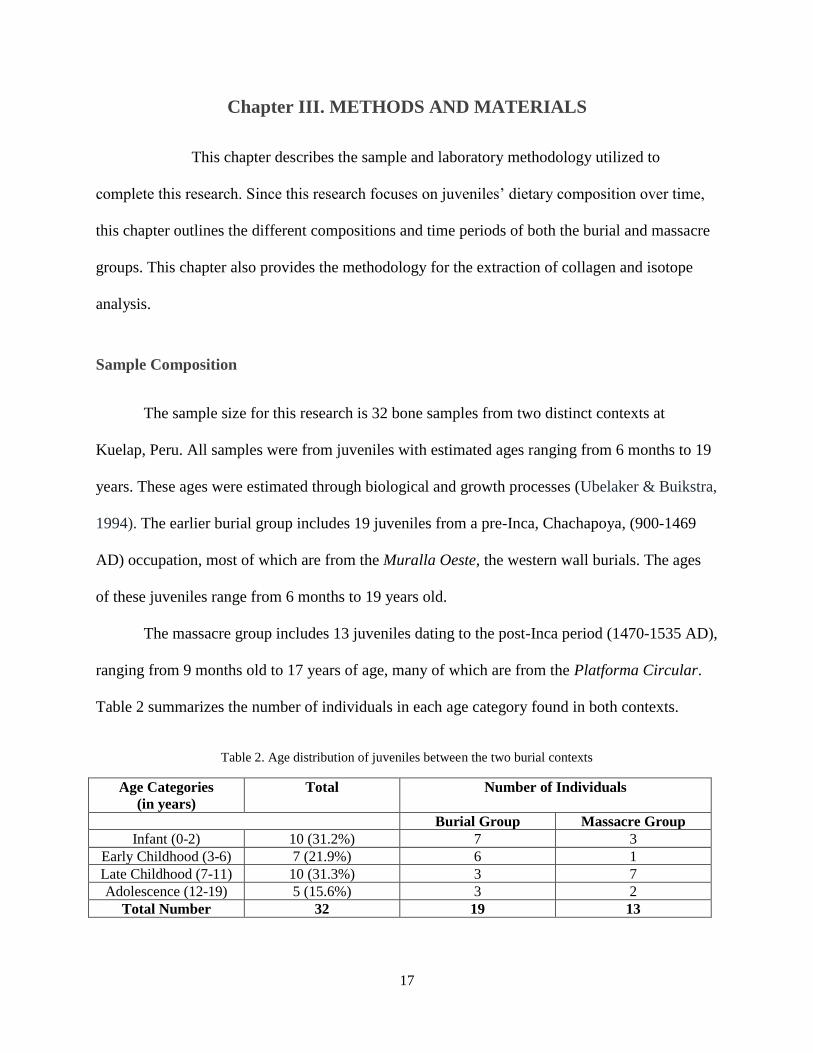
Chapter III. METHODS AND MATERIALS
This chapter describes the sample and laboratory methodology utilized to
complete this research. Since this research focuses on juveniles’ dietary composition over time,
this chapter outlines the different compositions and time periods of both the burial and massacre
groups. This chapter also provides the methodology for the extraction of collagen and isotope
analysis.
Sample Composition
The sample size for this research is 32 bone samples from two distinct contexts at
Kuelap, Peru. All samples were from juveniles with estimated ages ranging from 6 months to 19
years. These ages were estimated through biological and growth processes (Ubelaker & Buikstra,
1994). The earlier burial group includes 19 juveniles from a pre-Inca, Chachapoya, (900-1469
AD) occupation, most of which are from the Muralla Oeste, the western wall burials. The ages
of these juveniles range from 6 months to 19 years old.
The massacre group includes 13 juveniles dating to the post-Inca period (1470-1535 AD),
ranging from 9 months old to 17 years of age, many of which are from the Platforma Circular.
Table 2 summarizes the number of individuals in each age category found in both contexts.
Table 2. Age distribution of juveniles between the two burial contexts
Age Categories
(in years)
Total Number of Individuals
Burial Group Massacre Group
Infant (0-2) 10 (31.2%) 7 3
Early Childhood (3-6) 7 (21.9%) 6 1
Late Childhood (7-11) 10 (31.3%) 3 7
Adolescence (12-19) 5 (15.6%) 3 2
Total Number 32 19 13
18
Juvenile rib bones were selected for analysis due to their assumed equal rates in bone
turnover and bone remodeling; although, it should be noted that metabolic processes cause a
higher bone turnover rate in individuals younger than one year of age (Tsutaya & Yoneda, 2013).
Due to their location in the body, the ribs experience a faster turnover rate compared to some
other bones in the body (Parfitt, 2002). The amount of pressure exerted on the ribs by the lungs
and other internal organs cause the faster turnover rate in the rib bones. The faster turnover rate
of the rib bones helps to identify the diet of the individual closer to their time of death. This is
important in this dietary reconstruction as it can elucidate any dietary trends that may have
occurred in the juvenile subgroups closer to death and can help aid in comparison with the adult
sample, which were also rib samples. It should be noted that four of the juvenile samples utilized
bones other than rib bones, including cranium, fibula, a long bone fragment and radius. These
samples were included to augment sample size, contributing to a more viable and complete
study. Table 3 provides a list of the individual samples, including the estimated age at death and
skeletal element.

19
Table 3. Ages and bone samples analyzed by juvenile subgroup
Sample Number Age Sample Fragment
Burial
group
KPANTorVa Ent3A 6 months Rib
KSPlatI IIIÑ Ent3A 6 months Rib
K-PAS MO -VIII T' ENT10 9 months Rib
K-PAS MO -VIII T' ENT39 9 +/-3 months Rib
K-PAS MO -VIII U' ENT69 2 years +/-8 months Rib
K-PAS MO -VIII U' ENT57 3 +/-1 years Rib
K-PAS MO -VIII U' ENT52a 3-5 years Rib
KSPlatI IIIÑ Ent1B 4-6 years Rib
KC ME VK RH17 4-6 years Rib
K-PAS MO -VIII T' ENT33 6-8 years Rib
K-PAS MO -VIII T' ENT37 6-8 years Rib
K-PAS MO -VIII T' ENT12 8-10 years Cranium
KSTIN-VU Ent3 8-10 years Rib
K-PAC E1 -V Q' T2 ENT1 8-10 years Fibula
K-PAS MO -VIII U' ENT46 9 +/-3 years Rib
KSPlatI IIIÑ Ent4 9-11 years Rib
KSPlatC E2-VIa' Ent22 10-12 years Rib
KSTIN-IIIT Ent6 12-15 years Rib
KSTIN-IVV Ent11 15-19 years Rib
Massacre
group
KSPlatC E6-VIIz ENT105 3-9 months Rib
KSPlatC E2-VIIa' Ent26 2-4 years Rib
KSPlatC E6-VIIz,-VIIa' ENT75 2-4 years Rib
K-PAS MO -VIII T' ENT22 4-6 years Rib
KSPlatC E2-VIIa' Ent18c 5-7 years Rib
KSPlatC E4-VIa' ENT61 6-9 years Rib
KSPlatC-VIIZ Ent2 7-9 years Long bone fragment
KSPlatC E2-VIIa' Ent16a 7-9 years Radius
KSPlatC E3-VIa' Ent31 8-10 years Rib
KSPlatC E3-VIIa' Ent37a 10-12 years Rib
KSPlatC E4-VIa' ENT58 11-13 years Rib
KSPlatC-VIA' ENT50 15-17 years Rib
KSPlatC-VIIIZ ENT91 15-17 years Rib
The adult data utilized for comparison are from previous research conducted by Dr.
Toyne in Kuelap. This subgroup is comprised of 27 individuals of both sexes, ranging from
young adults to old adults. This research assumes that these adult individuals represent a uniform
sample for comparison. They were assumed to have consumed similar dietary components and

20
that none of the adults were undergoing a diseased state or were under metabolic stress. The data
regarding the adult sample can be found in Appendix C.
Methods
There have been several methods developed to extract collagen for paleodiet
reconstruction (Ambrose, 1990; Longin, 1971; Pestle, 2010). For the purposes of this research,
the method utilized for dietary reconstruction is a modified Longin (1971) method. This method
was selected as it thoroughly removes any humic acids or lipid substances that could skew the
data.
The process of collagen extraction began by cleaning each sample manually and then
with an ultrasonicator with distilled water to remove any dirt on the sample. Approximately ~1.0
gram samples were broken into uniform fragments for extraction. The lipids, and other organic
materials, were removed utilizing a 2:1 chloroform methanol mixture. The samples were then
slowly demineralized using 0.25 M hydrochloric acid (HCl), over a period of 2-3 weeks. Humic
acids were then removed from the sample with 0.1 sodium hydroxide (NaOH) solution. Once
humic acids were removed and samples reached a neutral pH of 7.0 by centrifuging multiple
times with distilled water, the collagen was gelatinized by using 0.25 M HCl and placed into an
oven to dry. The sample was heated in the oven at 90 degrees Celsius, and the leftover collagen
substrate was pipetted out and dried. The resulting collagen was weighed to calculate the
collagen yield. Appendix A outlines the step-by-step process used to extract the collagen.
After extraction, the collagen was sent to the Light Stable Isotope Mass Spec Lab at the
University of Florida in Gainesville Florida, to undergo the isotope-ratio mass spectrometry
(IRMS) analysis. IRMS provides accurate and precise readings of stable isotope values (Meier-

21
Augenstein, 2011). Condensing Meir-Augenstien’s work, the process begins with the
combustion of the organic sample into a gas, such as CO2, that is equivalent in isotopic
abundance to the original organic material. The gas flows into the IRMS and CO2 and N2 ions
are created. A fixed voltage and magnetic fields dictate the movement of these ions into Faraday
cup (FC) detectors. The type of detector depends on the atomic weight of isotope that is
measured. The FC counts the ions that are drawn to the detectors and respond to an isotopologue.
The ions can be differentiated and the abundance of the isotope can be determined. IRMS may
vary in their consistency; therefore, known standards must be applied to ensure the validity. Any
variation of variables in the process of stable isotopic analysis can affect the validity of a study.
To maintain accurate, precise and comparable results, certain standards within methods or
guidelines for variables should be set to provide justifiable and valid data and interpretations.
Sample Preservation
The collagen yield for each sample was calculated to help determine if the sample was
well-preserved. If not well-preserved, the samples may have undergone diagenetic processes that
could have skewed the results. A sample with a collagen yield > 1% is considered to be well-
preserved (Ambrose, 1990). The equation to calculate the collagen yield for samples is as
follows:
Another indicator of good preservation of collagen is in the atomic C/N ratio; which is
the ratio of the weight of collagen to the weight of nitrogen found in the collagen. The range
indicating good collagen preservation is from 2.9-3.6 (Ambrose, 1990). A third indicator of well-
% 𝐶𝑜𝑙𝑙𝑎𝑔𝑒𝑛 𝑌𝑖𝑒𝑙𝑑 = 𝑤𝑒𝑖𝑔ℎ𝑡 𝑜𝑓 𝑣𝑖𝑎𝑙 𝑤𝑖𝑡ℎ 𝑐𝑜𝑙𝑙𝑎𝑔𝑒𝑛 − 𝑤𝑒𝑖𝑔ℎ𝑡 𝑜𝑓 𝑣𝑖𝑎𝑙 𝑤𝑖𝑡ℎ𝑜𝑢𝑡 𝑐𝑜𝑙𝑙𝑎𝑔𝑒𝑛
(𝑑𝑟𝑦 𝑠𝑎𝑚𝑝𝑙𝑒 𝑤𝑒𝑖𝑔ℎ𝑡 ) × 100
22
preserved materials is %C and %N. Well-preserved carbon value will be ~35%; well-preserved
nitrogen value will be ~15%. The values of % weight carbon, % weight nitrogen and C/N ratio
can be found in Appendix B.
Analytical Methods
Statistical methods were used to analyze the data for each subgroup, including descriptive
statistics of the average, range, and standard deviation for both carbon and nitrogen isotopic
ratios. The standard deviation calculated the amount of variation within the data set for each
juvenile subgroup. A non-parametric Mann-Whitney U test was performed to compare the means
of both δ 13
C and δ15N values within the sample set and determine if there is a statistically
significant difference. The Mann-Whitney U test was chosen to be the most appropriate test for
this sample set as the sample set was small and the samples were independent. Madrigal (2012)
provides a formula for the calculation for the Mann-Whitney U-test:
U1 = (n1)(n2) + - ∑ R1, and U2 = (n1)(n2) – U1
Statistically significant different means would imply that the subgroups were consuming
different dietary components on average in their lifetimes. This could determine if juveniles were
eating differently based on their time period or differently from their adult counterparts. With
accumulation of the raw data of the juvenile subgroups and adult subgroups, further analysis
using the above statistics was completed. By utilizing these statistical methods, the difference
between juvenile subgroups and between the juvenile and adult subgroups can be conducted. If
there is a significant difference between subgroups, it would indicate a difference in dietary
components.
23
Chapter IV. FINDINGS
This chapter outlines the data produced and the results of the statistical analysis of the
carbon and nitrogen values to determine the difference, or lack thereof, in dietary composition of
juvenile subgroups and between adult and juvenile subgroups.
Calculated Sample Preservation
If the sample has a collagen yield > 1%, the sample is considered to be well-preserved
(Ambrose, 1990). All of the 32 samples had a collagen yield above the 1% threshold (Table 4).
These samples averaged 14.3% collagen yields; the lowest of these values was 6.3% yield; the
highest was 23.8% yield; therefore, they were all considered to be well-preserved showing a high
collagen content.
Another indicator of good preservation of collagen is in the atomic C/N ratio; which is
the ratio of the weight of collagen to the weight of nitrogen found in the collagen. The range
indicating good collagen preservation is from 2.9-3.6 (Ambrose, 1990). All of the values for the
juvenile subsamples fell within this range (Appendix B).
δ13C and δ15N Results
The sample collagen yields and raw δ 13
C values and δ15
N values for each sample
separated by burial group are listed in Appendix B. The δ 13
C values and δ15
N values adjusted
for diet are listed in Appendix C. These adjustments were made, as fractionation processes that
occur in the organic material of bone, collagen, do not directly represent dietary composition.
The adjustment percentages for both the δ 13
C values and δ15
N can be found in Chapter 2.

24
Descriptive Statistics
Descriptive statistics were used to analyze the mean, range, and standard deviation of
δ13C and δ15N values between the two juvenile subgroups, and between the juvenile subsamples
and adult subsample. The summary of the descriptive statistics of both juvenile burial groups can
be found in Table 4. The summary of the descriptive statistics for the juvenile subgroups and
adult subgroup can be found in Table 5.
Table 4. Averages, standard deviation and ranges for δ13C and δ15N of juvenile subgroups
Sample
Type
δ13C
Average
δ13C
Standard
Deviation
δ13C Range δ15N
Average
δ15N
Range
δ15N
Standard
Deviation
Burial
(n=19)
–13.1‰ 1.6 –16.1‰ to
–10.2‰
+8.1‰ +6.1‰ to
+12.4‰
1.5
Massacre
(n=13)
–13.4‰ 0.9 –15.0‰ to
–12.1‰
+7.8‰ +6.2‰ to
+11.3‰
1.5
Table 5. Averages and ranges for δ13C and δ15N of juvenile and adult subgroups
Sample Type δ
13C Average δ13C Range δ
15N Average δ
15N Range
Juvenile (n=32) –13.2‰ –16.1‰ to
–10.2‰
+8.0‰ +6.1‰ to
+12.4‰
Adult (n=27) –13.4‰ –15.5‰ to
–11.6‰ +7.4‰ +6.3‰ to
+8.2‰
25
Statistical Analysis
Figure 4 provides a bi-plot of δ13C and δ15N values for the juvenile burial groups. Most of
the juveniles’ δ13C and δ15N values overlap. The results of the Mann-Whitney U test between the
two juvenile burial groups, the burial and the massacre groups, for δ13C produced a two-tailed
significance of 0.57548, which is above the parameter for statistical significance at p ≤ 0.05. The
result of the non-parametric Mann-Whitney U test for δ15N between the juvenile burial groups is
0.11184, which is also above the parameter for statistical significance at p ≤ 0.05. From this
statistical analysis, it can be inferred that both juvenile subgroups were eating similar plant and
protein resources.
Figure 5 provides a bi-plot of δ13C and δ15N of the juvenile and adult subgroups. The
result of the non-parametric Mann Whitney U test for δ13C between the juvenile and adult
subgroups is 0.36812, which is greater than the parameter for statistical significance at p ≤ 0.05.
The result of the non-parametric Mann-Whitney U test for δ15N between the juvenile and adult
subgroups is 0.01178, which is within the parameter for statistical significance at p ≤ 0.05.
Therefore, there is a significant difference between the juvenile and the adult subgroups for δ15N
values, but not δ13C values. From this statistical analysis, it can be inferred that the juvenile and
adult subsamples were eating similar plant resources, but, different protein resources.

26
Figure 4. Bi-plot between juvenile burial and massacre δ13C and δ15N values.
Figure 5. Bi-plot between juvenile and adult subgroups δ13C and δ15N values.
0.0
2.0
4.0
6.0
8.0
10.0
12.0
14.0
-18.0-16.0-14.0-12.0-10.0-8.0-6.0-4.0-2.00.0
δ15N
δ13C
δ13C and δ15N for Juvenile Burial Groups
Burial Group
Massacre Group
0.0
2.0
4.0
6.0
8.0
10.0
12.0
14.0
-18.0-16.0-14.0-12.0-10.0-8.0-6.0-4.0-2.00.0
δ15N
δ13C
δ13C and δ15N for Juvenile and Adult Subgroups
Juvenile Samples
Adult Samples

27
Chapter V. DISCUSSION
There are several anthropological questions regarding paleodiet that can be answered
based on the results of the stable isotope analysis. From the δ13C and δ15N values of the
juveniles’ diet, the results provide the context for better understanding of the daily lives of
juveniles in the Kuelap community. This research tests the hypothesis that the juveniles from the
burial and massacre groups would reflect the same dietary components; suggesting that the food
resources in the community throughout time had not changed. The second hypothesis tested for
differences in diet between the juveniles and the adult samples of the population. Although diet
is not the only marker for different lifestyles, it is a necessity for all individuals and can reveal
potential trends in other aspects of differential daily life. This chapter focuses on a discussion
and interpretation of the results in relation to the stated hypotheses.
Isotopic Change in Juveniles over Time
The first hypothesis stated that there would not be a significant difference in the in δ13C
and δ15N averages between the juvenile burial and massacre groups.
The non-parametric Mann-Whitney U test was used to determine whether there existed a
statistically significant difference between the juvenile subgroups and their dietary preferences as
determined by the δ13C and δ15N values. There is not a statistically significant difference in δ13C
and δ15N values between the two burial groups. Thus, there was a not a change in dietary
resources over time, either in the consumption of plant materials or in the consumption of
proteins by juveniles. The non-significant differences in the δ13C results between time periods in
the juvenile subgroups could be attributed to a variety of factors, including, possible ecological
28
factors that may limit the growth of different food within Kuelap. In both time periods, there may
be factors that do not allow for the farming of certain plant resources. Due to climate conditions
and the availability of food resources, plant materials, such as maize or legumes, remained a
staple of the diet throughout the region. The consistency in the plant materials that were
consumed over time may also be explained by their ritual significance, their role in the
subsistence strategy, and growing conditions.
The range of δ15N is 6‰ in the diets between the juvenile burial and massacre subgroups.
This 6‰ difference suggests that there were protein dietary components consumed from two
trophic levels. Figure 6 provides a graph of the δ15N values for each juvenile sample. The range
in these values may indicate that different protein resources were consumed based on dietary
preferences. Some individuals may have consumed a diet comprised of foods with a lower
trophic level (i.e., vegetarians); other individuals may have consumed foods with a higher trophic
level, potentially due to the status in the society of their guardians or based on ritual significance.

29
Figure 6. δ15N of juveniles by age, youngest to oldest, and subgroup
There was not a statistical significance in the protein resources consumed between
juvenile subgroups. This suggests that even when the Inca administration took over in Kuelap in
1470 AD, the same protein sources remained common in the diet. This could be due to the
availability of the protein resources in the region. If there was a primary source of protein that
could easily be caught, cooked and consumed in Kuelap, regardless of the administration in
charge, those same resources would be prevalent in the environment and best suited for as
protein resources for consumption.
30
Juvenile and Adult Isotopic Variation
The second hypothesis stated that there would be a statistically significant difference in
δ13C and δ15N stable isotope values between the juvenile and the adult subgroups.
The Mann-Whitney U test determined that there is not a statistically significant difference
between subgroups in δ13C values. This indicates that the diet of juveniles was patterned after
those of their adult counterparts, or the resources that were available across the site. Similar to
the comparison between the juvenile subgroups, the non-significant δ13C values may be due to
the types of plant materials that could be grown in Kuelap, identification of certain plant
materials in the culture based on ritualistic or systematic belief systems, or established
subsistence strategies that would yield the best plant materials for ingestion.
Based on δ15N values, there is a statistically significant difference between the juvenile
subgroups and the adult subgroups. The difference in these values may be explained by a variety
of reasons. The δ15N values in the juvenile subgroups are almost always higher than the adult
subgroup. This would indicate that juveniles were consuming proteins from a higher trophic
level than the adults. Juveniles could have been fed differently than adults if they were
considered to be special members of their population. Since some of the juvenile samples came
from those in the weaning period of life (<3 years of age), it could be argued that weaning may
have elevated the δ15N levels of those individuals. This could account for 8 out of the total 32
juvenile samples for which the weaning trophic elevation could be applied. The remaining
juvenile samples are still elevated as compared to the adult samples, even though they exist
outside of the weaning period. Although it could be assumed that the higher δ15N values in
juveniles were due to eating proteins from a higher trophic level or weaning, these higher values
may represent a stressor within the skeletons of the juvenile subgroups. Elevated δ15N values in

31
an individual may be indicative of a disease or condition that puts an individual under metabolic
pressure, elevating their δ15N values. This explanation may be applied to these juveniles as
individuals that do not reach adulthood are considered to be the non-survivors of the group; the
juveniles may have died due to disease, marked isotopically in their bones.
Dietary Composition of Juveniles and Adults
The primary goal of this research was to compare two juvenile subgroups and an adult
subgroup to determine if there was any difference in the isotope values identified and thus,
subsistence practices over time, or based on age. These data also shed light on what each
individual at Kuelap may have been eating. Based on the adjusted for diet δ13C values for both
juveniles and adults, there is an indication of a mixed diet of C3 and C4 plant resources. The
presence of plants in the diet utilizing both photosynthetic pathways could be explained by the
importance of C3 resources, and maize, a C4 plant resource, in the Andean diet (Narváez, 2013).
Since there was a statistically significant difference in the δ15N values in the juvenile and adult
subgroups, it can be assumed that the protein consumption for juveniles was different than the
adults.
Figure 7 provides a graph of the values of δ13C and δ15N plotted to a previously
constructed Andean food web. It should be noted that although most of the values overlap in
their different dietary consumptions, there are some individuals, notably in the juvenile
subgroups that do not overlap.
32
Figure 7. Andean food web (Courtesy of Dr. Toyne) comparing juvenile and adult subgroup isotope data adjusted
for diet.
Preferential Treatment of Juveniles
Based on the data analyzed and discussed, it can be deduced that juveniles were treated
differently from their adult counterparts at Kuelap, in regards to protein consumption. There was
no statistically significant difference in δ13C, as determined by the non-parametric Mann-
Whitney U test; however, there was a statistically significant difference found in the δ15N values.
The plant foods consumed by adults may have been fed to juveniles in order to help them
survive. There appears to be the same plant dietary components consumed by all the juveniles in
Kuelap, whether due to environmental stress, belief system or subsistence patterns. Regardless of
the reason, the juveniles were given some form of special dietary treatment. Juveniles are

33
considered to be dependent on the older members of the community; therefore, they may provide
for juveniles differently, in order to extend their life expectancy (Lewis, 2007).

34
Chapter VI. CONCLUSIONS
The aim of this research is to provide an insight into the diet of juveniles and feeding
practices, in ancient Kuelap, Peru using stable isotopic analysis in order to conclude if juveniles
were treated differently than adults. There are several bioarchaeological applications for the
outcomes of this research.
Notably, in our modern North American culture, we do notice a differential treatment for
our juveniles; we emphasize special treatment for juveniles (Hill, 2013). Even postnatally,
children are treated differently than their adult counterparts. They are given special supplements
and foods with specific fortifications to aid the growth and development process. These same
supplements and fortifications may not present in the more mature members of a society. Based
on the differential societal roles, there is a practice of providing for children, patterned after their
parent’s preferences. There are instances, however, in which juveniles are treated differently than
their adult counterparts. More than likely, preferential treatment may be indicative of parents or
guardians concerned for the health and fitness of younger individuals in a culture.
Limitations
The research process and theory of stable isotopic analysis were beneficial in testing the
hypotheses. There is, however, as with all scientific investigations, room for improvement.
Paleodietary reconstruction is an important research methodology that analyzes stable isotopic
values extracted from the organic material in bone. Although stable isotopes are considered to be
the prime methodology to reconstruct diet, stable isotopic analysis provides a direct evidence of
an individual’s diet, but, bulk sampling reflects patterns in overall long term dietary composition.

35
Sample Size and Time Limitations
Sample size is often a limitation in research studies. The 32 juveniles are a good sample
size for a base study; however, with a longer time period to conduct research, more data could
have been extracted for analysis. The semesters during which the research was conducted
provided enough time for the process of stable isotope analysis of the samples provided. A larger
sample size would possibly be able to account for more variation or to elucidate other dietary
trends in the juvenile populations. Possible dietary trends based on age could be determined if
there were more individual samples within each age group. A larger number of individuals
included in the adult subsamples may have also been helpful in the same respect. If the study is
revisited in the future, it may also be beneficial to include adult samples from the same time
period as each juvenile subgroup to further account for differences in dietary patterns.
Sample Type Limitations
Although the ribs are useful to reconstruct the diet of juveniles, it would be interesting to
conduct studies on different skeletal elements. By conducting stable isotopic analysis on other
skeletal elements, different portions of the juvenile’s life could be considered, not just the period
of time closer to death. The analysis of teeth would be useful to incorporate, as they reflect the
diet of individuals when the teeth were first formed (Ambrose, 1990). Utilizing different portions
of the tooth as well, such as the tooth or crown, can produce insight about the ages at which
individuals consumed different dietary components throughout their lifetime (DeNiro & Epstein,
1978). Any differences between dietary composition while teeth were forming and after may
further determine if juveniles had been provided for differently from other subgroups, based on
their time within the juvenile period.
36
Future Directions
The research focused on juveniles from Kuelap, Peru, and not any other cultures or
archaeological sites. Cultures throughout different time periods have been examined for their
juveniles’ dietary composition and treatment. A cross-cultural comparison of regions during the
same time period, in locations relative to Kuelap, to determine dietary differences would be
beneficial to determine a pattern or trend of differential treatment for juveniles.
Although the research conducted focused on one cultural group and primarily aimed to
determine whether juveniles were treated differently that adults in respect to dietary
compositions, the findings can be applied to the broader anthropological field. Familial and
cultural patterns may be identified based on the differential treatment and food resources
provided to juveniles. These results can help reconstruct everyday life in a culture, the structure
of a culture, and the subsistence strategies of a culture.
Researchers may be able to provide insight into possible nutritional deficiencies or
disease patterns expressed in ill individuals at the time of death. This could be done by
comparing the isotopic readings of the juveniles to any known evidence of skeletal or dental
pathologies found within these skeletal remains. This may also be done by utilizing any
pathological data found on the skeletal remains of the juveniles to help narrow down the
possibility of a juvenile having a chronic illness that may have elevated these nitrogen levels.
By reconstructing the diet of juveniles, a more complete record of what individuals
consumed can be better developed for the past. The stable isotopic values may reveal what
juveniles were eating, but, the implications of what they were eating go beyond diet. Food is
vital to existence. By understanding the food resources juveniles consumed, we also develop an
understanding about survival strategies, ritual practices, and physical aspects of individuals

37
within any given society. Overall, looking at the change over time in the diet of individuals,
between age groupings and within age groupings, can allow for a better understanding of how
human societies have developed overtime.
Determining differences and similarities in the diet between juveniles and adults can
help reveal other trends in daily life for the ancient Chachapoya people. A statistically similar
diet in both the juvenile and adult subgroups highlights similarities in dietary patterns. In future
research, or a cross-cultural comparison with research already completed, the differential or
similar treatment of juveniles may be better understood.

38
APPENDICES

39
Appendix A: The modified Longin (1971) method used to extract collagen
from bone
1. Each sample was dry cleaned manually with a toothbrush, dental pick or Dremel to
remove any visible dirt or soils. Once the primary cleaning was completed, the sample
was placed into an ultrasonicator, with distilled water, to remove any remaining dirt
found within the sample.
2. The sample was dried in an oven at 60 degrees Celsius for ~24 hours.
3. The rib bone samples were broken down using a mortar and pestle to sizes from 2mm to
5mm until the sample weighed (~1.0 gram). During the process of breaking down the rib
sample, any further dirt found and the trabecular bone were removed, to avoid data
contamination by those two factors.
4. The weighed samples were placed into individual, labeled, centrifuge tubes.
5. Lipids were removed from each sample to mitigate any errors from reading the lipid
signature over the carbon and nitrogen within the bone. Each sample was brought to a
fume hood with ~10 ml of 2:1 chloroform and methanol, agitated and left for ~20
minutes.
6. The samples were removed from the fume hood and placed into a centrifuge for 10
minutes at 2.4 rpm.
7. The chloroform and methanol solution was pipetted off and steps 5-6 were repeated two
more times.
8. After steps 5-6 were completed three times in total, the samples were left to dry overnight
in the lab fume hood.

40
9. The bone samples were demineralized. This process began by adding 0.25 M HCl to the
centrifuge tubes.
10. After 24 hours, the 0.25 M HCl solution was pipetted off and 10 mL of distilled water
was added, before placing in the centrifuge for 10 minutes at 2.4 rpm.
11. Step 10 was repeated until reaching the pH of 2.5-3.0 and the samples were fully
demineralized. This process took 2-3 weeks, depending on the samples and their degree
of preservation. The bone samples that took the longest period of time to finish the
process were those that were the best preserved.
12. Humic acids were removed by adding ~10 mL of 0.1 M NaOH to each centrifuge tube.
The tubes were capped and slightly agitated every 5 minutes for 20 minutes.
13. After 20 minutes, the samples were centrifuged for 10 minutes at 2.4 rpm.
14. The samples were observed for potential color change. A golden color or no color change
indicated that the NaOH in the sample remained relatively clear. If the sample exhibited a
color change, Step 13 would be repeated until there was no color change.
15. Once all of the samples exhibited no color change, the NaOH was removed and ~10 mL
of distilled water was added to each sample and centrifuged for 10 minutes at 2.4 rpm.
16. Step 15 was repeated until the pH of each sample reached 7 ± 1.0 pH. Although variation
existed between the samples, it generally took ~12 rinses to neutralize each sample.
17. The process of gelatinizing and drying collagen began by adding 10 mL of 0.25 M HCl
into each centrifuge tube and centrifuging for 10 minutes at 2.4 rpm.
18. The HCl was pipetted off, 5 mL of distilled water was added, and the pH was checked to
ensure that the pH was in the 2.5-3.0 range.

41
19. The centrifuge tubes were capped and placed into an oven at 90 degrees Celsius for ~16
hours.
20. Once removed from the oven, the samples were centrifuged for 10 minutes at 2.4 rpm.
21. The collagen solution, minus the precipitate formed on the bottom of the tube, was
pipetted out and placed into pre-weighed glass test tubes.
22. The glass test tubes, uncapped, were placed into the oven at 90 degrees Celsius for ~24-
36 hours.
23. The samples were weighed to calculate collagen yield.
24. The samples were sent to the Light Stable Isotope Mass Spec Lab in the Department of
Geological Sciences at the University of Florida to undergo the IRMS process. The
resulting data was returned to the University of Central Florida’s laboratory.

42
Appendix B: Collagen yield, δ13C values and δ15N by juvenile subgroup
(individuals are in order of ascending age, Table 3).
Sample
Collagen Yield
% δ13C
(‰, VPDB) δ15N
(‰, AIR)
Burial
group
KPANTorVa Ent3A 22.3 –14.5 +8.3
KSPlatI IIIÑ Ent3A 17.4 –12.3 +9.9
K-PAS MO -VIII T' ENT10 13.9 –6.2 +9.2
K-PAS MO -VIII T' ENT39 7.7 –10.2 +9.3
K-PAS MO -VIII U' ENT69 10.7 –12.3 +10.7
K-PAS MO -VIII U' ENT57 16.3 –11.7 +10.3
K-PAS MO -VIII U' ENT52a 7.2 –13.7 +9.5
KSPlatI IIIÑ Ent1B 19.7 –14.3 +6.9
KC ME VK RH17 17.0 –14.0 +12.4
K-PAS MO -VIII T' ENT33 16.6 –12.0 +8.5
K-PAS MO -VIII T' ENT37 12.8 –12.1 +8.1
K-PAS MO -VIII T' ENT12 19.9 –11.1 +8.1
KSTIN-VU Ent3 18.9 –13.7 +8.9
K-PAC E1 -V Q' T2 ENT1 12.6 –15.7 +7.4
K-PAS MO -VIII U' ENT46 9.8 –12.8 +6.1
KSPlatI IIIÑ Ent4 23.8 –12.6 +7.6
K-PAS MO -VIII T' ENT22 18.8 –10.1 +8.0
KSTIN-IIIT Ent6 19.9 –13.2 +7.0
KSTIN-IVV Ent11 19.7 –11.2 +7.2
Massacre
group
KSPlatC E6-VIIz ENT105 13. –14.4 +10.6
KSPlatC E2-VIIa' Ent26 12.4 –15.0 +7.7
KSPlatC E6-VIIz,-VIIa' ENT75 6.2 –13.6 +8.1
KSPlatC E2-VIa' Ent22 12.1 –12.4 +7.2
KSPlatC E2-VIIa' Ent18c 12.2 –13.3 +7.8
KSPlatC E4-VIa' ENT61 9.6 –14.2 +6.4
KSPlatC-VIIZ Ent2 6.8 –13.7 +6.2
KSPlatC E2-VIIa' Ent16a 10.6 –13.1 +7.4
KSPlatC E3-VIa' Ent31 9.3 –13.1 +7.5
KSPlatC E3-VIIa' Ent37a 6.3 –12.1 +7.9
KSPlatC E4-VIa' ENT58 12.7 –12.5 +6.3
KSPlatC-VIA' ENT50 19.3 –12.4 +7.4
KSPlatC-VIIIZ ENT91 20.1 –13.0 +11.3

43
Appendix C: δ13C values and δ15N values adjusted for diet by juvenile
subgroup (individuals are in order of ascending age, Table 3).
Sample δ13C (‰ to Diet) δ15N (‰ to Diet)
Burial
Group
KPANTorVa Ent3A –19.5 +5.3
KSPlatI IIIÑ Ent3A –17.3 +3.9
K-PAS MO -VIII T' ENT10 –11.2 +6.2
K-PAS MO -VIII T' ENT39 –15.2 +6.3
K-PAS MO -VIII U' ENT69 –17.3 +7.7
K-PAS MO -VIII U' ENT57 –16.0 +7.3
K-PAS MO -VIII U' ENT52a –18.6 +3.3
KSPlatI IIIÑ Ent1B –19.3 +3.9
KC ME VK RH17 –19.0 +9.4
K-PAS MO -VIII T' ENT33 –17.0 +5.5
K-PAS MO -VIII T' ENT37 –17.1 +5.1
K-PAS MO -VIII T' ENT12 –17.1 +5.1
KSTIN-VU Ent3 –18.7 +5.9
K-PAC E1 -V Q' T2 ENT1 –15.7 +4.4
K-PAS MO -VIII U' ENT46 –17.8 +3.1
KSPlatI IIIÑ Ent4 –17.6 +4.6
K-PAS MO -VIII T' ENT22 –16.1 +5.0
KSTIN-IIIT Ent6 –18.2 +4.0
KSTIN-IVV Ent11 –16.2 +4.1
Massacre
group
KSPlatC E6-VIIz ENT105 –19.4 +7.3
KSPlatC E2-VIIa' Ent26 –20.0 +4.7
KSPlatC E6-VIIz,-VIIa' ENT75 –18.6 +5.1
KSPlatC E2-VIa' Ent22 –17.4 +4.1
KSPlatC E2-VIIa' Ent18c –18.3 +4.8
KSPlatC E4-VIa' ENT61 –19.2 +3.4
KSPlatC-VIIZ Ent2 –18.7 +3.2
KSPlatC E2-VIIa' Ent16a –18.1 +4.4
KSPlatC E3-VIa' Ent31 –18.1 +4.5
KSPlatC E3-VIIa' Ent37a –17.1 +4.9
KSPlatC E4-VIa' ENT58 –17.5 +3.3
KSPlatC-VIA' ENT50 –17.4 +4.4
KSPlatC-VIIIZ ENT91 –18.0 +8.3

44
Appendix D: Cwt%, Nwt% and C/N ratios for juvenile samples (individuals
are in order of ascending age, Table 3).
Sample Cwt% Nwt% C/N Ratio
Burial
group
KPANTorVa Ent3A 47.1 17.3 3.2
KSPlatI IIIÑ Ent3A 42.8 15.7 3.2
K-PAS MO -VIII T' ENT10 47.6 17.3 3.2
K-PAS MO -VIII T' ENT39 46.6 17.3 3.1
K-PAS MO -VIII U' ENT69 42.9 15.9 3.1
K-PAS MO -VIII U' ENT57 45.7 16.9 3.1
K-PAS MO -VIII U' ENT52a 46.9 17.2 3.2
KSPlatI IIIÑ Ent1B 45.4 16.7 3.2
KC ME VK RH17 43.5 16.0 3/2
K-PAS MO -VIII T' ENT33 45.2 16.7 3.2
K-PAS MO -VIII T' ENT37 45.3 16.7 3.2
K-PAS MO -VIII T' ENT12 45.7 16.5 3.2
KSTIN-VU Ent3 46.7 16.9 3.2
K-PAC E1 -V Q' T2 ENT1 47.0 16.9 3.2
K-PAS MO -VIII U' ENT46 44.0 16.0 3.2
KSPlatI IIIÑ Ent4 42.6 15.5 3.2
K-PAS MO -VIII T' ENT22 47.3 17.1 3.1
KSTIN-IIIT Ent6 42.2 15.3 3.2
KSTIN-IVV Ent11 39.1 14.2 3.2
Massacre
group
KSPlatC E6-VIIz ENT105 44.2 16.2 3.2
KSPlatC E2-VIIa' Ent26 45.0 16.5 3.2
KSPlatC E6-VIIz,-VIIa' ENT75 47.0 17.4 3.1
KSPlatC E2-VIa' Ent22 46.8 17.1 3.2
KSPlatC E2-VIIa' Ent18c 47.2 17.3 3.2
KSPlatC E4-VIa' ENT61 43.0 15.7 3.2
KSPlatC-VIIZ Ent2 38.2 14.4 3.2
KSPlatC E2-VIIa' Ent16a 40.2 14.6 3.2
KSPlatC E3-VIa' Ent31 46.7 17.2 3.2
KSPlatC E3-VIIa' Ent37a 41.2 15.0 3.2
KSPlatC E4-VIa' ENT58 45.7 16.7 3.2
KSPlatC-VIA' ENT50 40.0 14.5 3.2
KSPlatC-VIIIZ ENT91 47.3 17.6 3.1
45
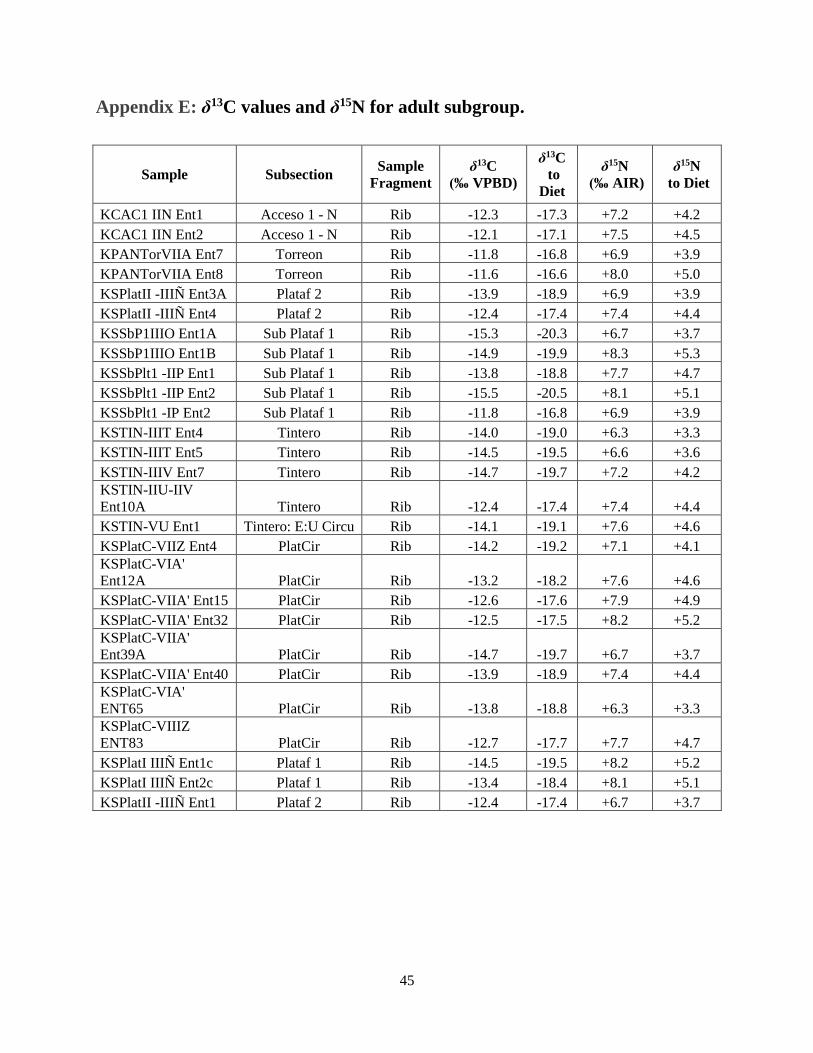
Appendix E: δ13C values and δ15N for adult subgroup.
Sample Subsection Sample
Fragment
δ13C
(‰ VPBD)
δ13C
to
Diet
δ15N
(‰ AIR)
δ15N
to Diet
KCAC1 IIN Ent1 Acceso 1 - N Rib -12.3 -17.3 +7.2 +4.2
KCAC1 IIN Ent2 Acceso 1 - N Rib -12.1 -17.1 +7.5 +4.5
KPANTorVIIA Ent7 Torreon Rib -11.8 -16.8 +6.9 +3.9
KPANTorVIIA Ent8 Torreon Rib -11.6 -16.6 +8.0 +5.0
KSPlatII -IIIÑ Ent3A Plataf 2 Rib -13.9 -18.9 +6.9 +3.9
KSPlatII -IIIÑ Ent4 Plataf 2 Rib -12.4 -17.4 +7.4 +4.4
KSSbP1IIIO Ent1A Sub Plataf 1 Rib -15.3 -20.3 +6.7 +3.7
KSSbP1IIIO Ent1B Sub Plataf 1 Rib -14.9 -19.9 +8.3 +5.3
KSSbPlt1 -IIP Ent1 Sub Plataf 1 Rib -13.8 -18.8 +7.7 +4.7
KSSbPlt1 -IIP Ent2 Sub Plataf 1 Rib -15.5 -20.5 +8.1 +5.1
KSSbPlt1 -IP Ent2 Sub Plataf 1 Rib -11.8 -16.8 +6.9 +3.9
KSTIN-IIIT Ent4 Tintero Rib -14.0 -19.0 +6.3 +3.3
KSTIN-IIIT Ent5 Tintero Rib -14.5 -19.5 +6.6 +3.6
KSTIN-IIIV Ent7 Tintero Rib -14.7 -19.7 +7.2 +4.2
KSTIN-IIU-IIV
Ent10A Tintero Rib -12.4 -17.4 +7.4 +4.4
KSTIN-VU Ent1 Tintero: E:U Circu Rib -14.1 -19.1 +7.6 +4.6
KSPlatC-VIIZ Ent4 PlatCir Rib -14.2 -19.2 +7.1 +4.1
KSPlatC-VIA'
Ent12A PlatCir Rib -13.2 -18.2 +7.6 +4.6
KSPlatC-VIIA' Ent15 PlatCir Rib -12.6 -17.6 +7.9 +4.9
KSPlatC-VIIA' Ent32 PlatCir Rib -12.5 -17.5 +8.2 +5.2
KSPlatC-VIIA'
Ent39A PlatCir Rib -14.7 -19.7 +6.7 +3.7
KSPlatC-VIIA' Ent40 PlatCir Rib -13.9 -18.9 +7.4 +4.4
KSPlatC-VIA'
ENT65 PlatCir Rib -13.8 -18.8 +6.3 +3.3
KSPlatC-VIIIZ
ENT83 PlatCir Rib -12.7 -17.7 +7.7 +4.7
KSPlatI IIIÑ Ent1c Plataf 1 Rib -14.5 -19.5 +8.2 +5.2
KSPlatI IIIÑ Ent2c Plataf 1 Rib -13.4 -18.4 +8.1 +5.1
KSPlatII -IIIÑ Ent1 Plataf 2 Rib -12.4 -17.4 +6.7 +3.7

46
REFERENCES CITED
Abercrombie, T.A. (1998). Pathways of memory and power: ethnography and history among an
Andean people. Madison: University of Wisconsin Press.
Ambrose, S.H. (1990). Preparation and characterization of bone and tooth collagen for isotopic
analysis. Journal of Archaeological Sciences, 17, 431-451.
Ambrose, H.S., & Norr, L. (1993). Experimental evidence for the relationship of the carbon
isotope ratios of whole diet and dietary protein to those of bone collagen and carbonate. In J.B.
Lambert & G. Grupe (Eds.), Prehistoric Human Bone (pp. 1-29). Berlin, Germany: Springer.
Andrushko, V.A., Buzon, M.R., Gibaja, A.M., McEwan, G.F., Simonetti, A., & Creaser, R.A.
(2011). Investigating a child sacrifice event from the Inca heartland. Journal of Archaeological
Science, 38(2), 323-333.
Ardren, T. (2006). Setting the table: Why children and childhood are important in an
understanding of ancient Mesoamerica. In T. Ardren & S. Huston (Eds.). The Social Experience
of Childhood in Ancient Mesoamerica (pp. 3-24). Boulder; University Press of Colorado.
Baitzel, S. (2017). Parental grief and mourning in the ancient Andes. Journal of Archaeological
Method and Theory, 25, 178-201.
Baxter, J.E. (2008). Introduction: The archaeology of childhood in context. Archaeological
Papers of the American Anthropological Association, 15, 1-9.
Bird, D.W., & Bird, B.R. (2000). The ethnoarchaeology of juvenile foragers: Shellfishing
strategies among Meriam children. Journal of Anthropology and Archaeology, 19, 461–476.
Bolin, I. (2006). Growing up in a culture of respect: child rearing in highland Peru. Austin:
University of Texas Press.
Bogin, B. (1997). Evolutionary hypotheses for human childhood. Yearbook of Physical
Anthropology, 40, 63–89.
Buikstra, J. E. & Ubelaker, D.H (1994). Standards: For data collection from human skeletal
remains. Fayetteville, Arkansas: 3rd Printing.
von Cremmerer, S. (1992). Carbon isotope discrimination in C3-C4 intermediates. Plant, Cell
and Environment, 15, 1063-1072.
Chamberlain, A.T. (2000). Minor concerns: A demographic perspective on children in past
societies. In: Derevenski Sofaer J., (Ed.). Children and Material Culture. New York: Routledge.
P206-212.
Church, W.B., & von Hagen, A. (2007). Chachapoyas: Cultural development at an Andean cloud
forest crossroads. In Silverman H., Isbell W.H. (Eds.). The Handbook of South American
Archaeology. Springer, New York, NY.

47
Dean, C. (2002). Andean androgyny and the making of men. In C.F. Klein (Ed.), Gender in pre-
Hispanic America: A symposium at Dumbarton Oak (pp. 143-182). Washington, D.C.:
Dumbarton Oaks Research Library and Collection.
DeNiro, M.J., & Epstein, S. (1978). Influence of diet on the distribution of carbon isotopes in
animals. Geochimica et Cosmochimica Acta, 42, 495-506.
DeNiro, M.J., & Hastorf, C.A. (1984). Alteration of I5N/14N and 13C/12C ratios of plant matter
during the initial stages of diagenesis: Studies utilizing archaeological specimens from Peru.
Geochimica et Cosmochimica Acta, 49, 97-115.
Dupras, D.L., & Tocheri, M.W. (2007). Reconstructing infant weaning histories at Roman Period
Kellis, Egypt using stable isotope analysis of dentition. American Journal of Physical
Anthropology, 134, 63-74.
Fahy, G.E., Deter, C., Pitfield, R., Miskiewicz, J.J., Mahoney, P. (2017). Bone deep: Variation in
stable isotope ratios and histomorphometric measurements of bone remodelling within adult
humans. Journal of Archaeological Science, 87, 10-16.
Finucane, B.C. (2007). Mummies, maize and, manure: Multi-tissue table isotope analysis of late
prehistoric human remains from the Ayacucho Valley, Peru. Journal of Archaeological Sciences,
34-2115-2124.
Fry, B. (2006). Stable Isotope Ecology. New York: Springer.
Garvie-Lok, S.J., Varney, T.L., Katzenberg, M.A. (2004). Preparation of bone carbonate for
stable isotope analysis: the effects of treatment time and acid concentration. Journal of
Archaeological Science, 31, 763-776.
Gordon, C.C. & Buikstra, J. (1975). Nutritional individuality. In M. Katz, G. T. Keusch & L. J.
Mata (Eds.) Interactions of Nutrition and Infection. Guatemala City, Panama: American Journal
of Diseases in Childhood, pp. 422–424.
Halcrow, S. E., & Tayles, N. (2008). The bioarchaeological investigation of childhood and social
age: Problems and prospects. Journal of Archaeological Method and Theory, 15, 190–215.
Halcrow, S. E., & Tayles, N. (2011). The bioarchaeological investigation of children and
childhood. In: S.C. Agarwal & B. Glencross (Eds). Social Bioarchaeology, 333-360.
Hill, M.D. (2013). Growing up Quechua: Ethnic identity, narrative, and the cultural politics of
childhood migration in Cusco, Peru. Childhood, 20, 383-397.
Hedges, R.E.M., & Reynard, L.M. (2007). Nitrogen isotopes and the tropic level of humans in
archaeology. Journal of Archaeological Science, 34, 1240-1251.
Katzenberg, M.A. (2008). Chapter 13: Stable isotope analysis: A tool for studying past diet,
demography and life history. In. M.A. Katzenberg & S.R. Saunders (Eds.), Biological
Anthropology of the Human Skeleton. (2nd Ed. pp. 413-441). New York: John Wiley and Sons,
Inc.

48
Koch, P.L. (2007). Isotopic study of the biology of modern and fossil vertebrates. In: R.
Michener & K. Lajtha (Eds.), Stable Isotopes in Ecology and Environmental Science (2nd Ed. Pp.
99-154). Oxford, UK: Blackwell.
Larsen, C.S. (2015). Bioarchaeology: Interpreting behavior from the human skeleton. (2nd Ed.)
Cambridge: Cambridge University Press.
Lewis, M.E. (2007). The bioarchaeology of children. New York: Cambridge University Press.
Longin, R. (1971). New method of collagen extraction for radiocarbon dating. Nature, 230, 241-
242.
Meier-Augenstein, W. (2011). Stable isotope forensics and introduction to the forensic
application of stable isotope analysis. Hoboken, NJ: Wiley-Blackwell.
Michell, S.M. (2018). Animals of the cloud forest: Isotopic variation of archaeological faunal
remains from Kuelap, Peru. Orlando, FL: University of Central Florida.
Muscutt, K. (1998). Warriors of the cloud: Lost civilization in the upper Amazon of Peru.
Albuquerque: University of New Mexico Press.
Narváez, L.A. (1988). Kuelap: Una ciudad fortificada en los Andes nororientales de amazonas,
Perú. Arqueol Arquit, 115-142.
Nystrom, K.C., Buikstra, J.E., Muscutt, K. (2010). Chachapoya mortuary behavior: A
consideration of method and meaning. Revista de Anthropologia Chilena, 42, 477-495.
Olsen, K.C., White, C.D, Longstaffe, F.J., von Heykin, K., McGlynn, G., Grupe, G., Rühli, F.J.
(2013). Intraskeletal isotopic compositions (δ13C δ15N) in bone collagen: nonpathological and
pathological variation. American Journal of Physical Anthropology, 1-7.
Parfitt, A.M. (2002) Misconceptions (2): turnover is always higher in cancellous than in cortical
bone. Bone 30: 807–809.
Pestle, W.J. (2010). Chemical, elemental and isotopic effects of acid concentration and treatment
duration on ancient bone collagen: an exploratory study. Journal of Archaeological Science, 37,
3124-3128.
Ruiz Estrada, A. (2010). Huaytapallana, arte rupestre de chachapoyas. Investigaciones sociales,
14, 53-65.
Schoeninger, M.J., Moore, K. (1992). Bone stable isotope studies in archaeology. Journal of
World Prehistory, 6, 247-296.
Sillar, B. (1994). Playing with god: cultural perceptions of children, play and miniatures in the
Andes. Archaeological review from Cambridge, 13(2), 47–63.
Sofaer Derevenski, J. (1994). Where are the children? Accessing children in the past.
Archaeological Review Cambridge, 13, 7-20.
Sofaer Derevenski, J. (2000). Children and material culture. New York: Routledge.

49
Szpak, P., White, CD., Longstaffe, FJ., Millaire, JF., & Vásquez Sánchez, VF. (2013). Carbon
and nitrogen isotopic survey of northern Peruvian plants: baselines for paleodietary and
paleoecological studies. PLOS ONE, 8, e53763.
Tieszen, L.L., & Fagre, T. (1993). Carbon isotopic variability in modern and archeological
maize. Journal of Archaeological Sciences, 20, 25-40.
Toyne, J.M. (2015). Tibial surgery in ancient Peru. International Journal of Paleopathology, 8,
29-35.
Toyne, J.M., Church, W.B., Tello, J.L.C., & Gamarra, R.M. (2017). Exploring imperial
expansion using an isotopic analysis of paleodietary and paleomobility indicators in
Chachapoyas, Peru. American Journal of Physical Anthropology, 1-22.
Toyne, J.M. & Narváez , L.A. (2014) Chapter 13: The fall of Kuelap. Bioarchaeological analysis
of death and destruction on the Eastern slopes of the Andes. In: A.K. Scherer & J.W. Verano
(Eds.) Embattled Bodies, Embattles Places: War in Pre-Columbian Mesoamerica and the Andes.
Washington, D.C.: Dumbarton Oaks Research Library and Collection.
Tsutaya, T. (2017). Post-weaning diet in archaeological human populations: A meta-analysis of
carbon and nitrogen stable isotope ratios of child skeletons. American Journal of Physical
Anthropology, 164, 546-557.
Tsutaya, T. & Yoneda, M. (2013). Quantitative reconstruction of weaning ages in archaeological
human populations using bone collagen nitrogen isotope ratios and approximate Bayesian
computation. PLOS ONE, 10(3), e0119778.
Turner, B.L., Klaus, H.D., Livengood, S.V., Brown, L.E., Saldaña, F., & Wester, C. (2013). The
variable roads to sacrifice: Isotopic investigations of human remains from Chotuna-Huaca de Los
Sacrificios, Lambayeque, Peru. American Journal of Physical Anthropology, 151(1), 22-3.
Williams JS, White CD, and Longstaffe FJ. 2005. Trophic level and macronutrient shift effects
associated with the weaning process in the Postclassic Maya. American Journal of Physical
Anthropology 128(4):781-790.
Wood, J.W., Milner, G.R, Harpending, H.C., & Weiss, K.M. (1992). The osteological paradox:
Problems of inferring prehistoric health from skeletal samples. Current Anthropology, 33, 343-
363.
Zanden, M.J.V, & Rasmussen, J.B. (2001). Variation in trophic fractionation: Implications for
aquatic food web studies. Limnology and Oceanography, 46, 2061-2066.