Embed Size (px)
Citation preview

2009 PLAINS NUTRITION COUNCIL SPRING CONFERENCE
April 9-10, 2009 San Antonio, Texas
Publication No. AREC 09-18
Texas AgriLife Research and Extension Center
Texas A&M System Amarillo

The Plains Nutrition Council
2009 Spring Conference
2008-09 Officers And Executive Committee
Kendall Karr, President Justin Gleghorn, 1st Vice President Jim MacDonald, 2nd Vice President
Clint Krehbiel, Past President Ted McCollum III, Secretary/Treasurer
The Plains Nutrition Council 6500 Amarillo Blvd West
Amarillo, Texas 79106


The 2009 Plains Nutrition Council Spring Conference Thursday, April 9 1:00 PM Welcome and Introduction - Dr. Kendall Karr, President Plains Nutrition
Council, Cactus Feeders, Amarillo 1:10 PM Technology, Agriculture, and the Environment - Alex Avery, Center for Global
Food Issues, Hudson Institute, Washington, D.C. (Sponsored by PFIZER, INTERVET/SCHERING-PLOUGH, and ELANCO)
2:10 PM Healthy Animals, Healthy People - Dr. Guy Loneragan, West Texas A&M
University, Canyon 3:00 PM Break and View Graduate Student Posters 3:30 PM Panel discussion – The Past, Present and Future
Academics and Research – Dr. Fred Owens, Pioneer Hi-Bred International, Johnston, Iowa
Beef Processing – Dr. Dell Allen, Derby, KS Nutrition Consulting – Dr. Hollis Klett, Nutrition Services Associates,
Greeley, CO Feedyard Operations and Management – Jack Rhoades, Cactus Feeders,
Amarillo 5:00 View Graduate Student Posters 5:30-7:30 Reception (Sponsored by CARGILL ANIMAL NUTRITION) Friday, April 10 8:00 AM PNC Business Meeting 8:15 AM University Updates - Oklahoma State University - Dr. Clint Krehbiel
Colorado State University - Dr. John Wagner 9:00 AM Direct-fed Microbials - Dr. Mike Brown, West Texas A&M University, Canyon 9:45 AM Graduate Student Poster Recognition and Awards 9:55 AM Break and View Posters 10:30 AM The Costs and Benefits of Grid Marketing – Dr. Ty Lawrence, West Texas A&M
University, Canyon 11:15 AM Intrepreting Research Results - Dr. Mike Galyean, Texas Tech University,
Lubbock 12:00PM Adjourn


We appreciate the continuing support of our 2009 PNC Sponsors
Platinum
Cargill Animal Nutrition Elanco
Intervet/Schering-plough
Gold Plus
pfizer Nova microbial Technologies
Zinpro Lallemand Animal nutrition Nutrition Physiology Corp.
Sweet bran westway
Gold
Fort Dodge animal health Min-Ad
Quali Tech
Silver
Diamond V Global Animal Products Kemin microBeef Technologies


TABLE OF CONTENTS Invited Presentations Page Beef: A Case Study of the Environmental and Consumer Benefits of High-Yield Agriculture Alex Avery, Hudson Institute, Center for Global Food Issues, Churchville, VA…………………………………………..………………………….. 1 The Beef Packing Industry - Past, Present and Future Del Allen, Derby, KS……... 16
Nutrition Consulting - The Past, Present and Future R. Hollis Klett, Greeley, CO.. 22 Feed Yard Operations and Management - Past, Present and Future Jack Rhoades, Cactus Feeders, Amarillo, TX………………………………………………………………….. 28 Feedlot Beef Production-Past, Present and Future – Academics and Research Fred Owens, Pioneer Hi-Bred Int'l, Johnston, IA………….………………………………... 32
Beef Marketing 101 + Ty’s 5 Rules of Engagement Ty E. Lawrence, West Texas A&M University, Canyon………………………………………..……………………………… 40
Direct-fed Microbials for Growing and Finishing Cattle Mike Brown, and T. G. Nagaraja, West Texas A&M University, Canyon, and Kansas State University, Manhattan……………………………………………………………..………………………….. 42 Interpreting Research Results: Applied Statistical Principles M. L. Galyean and N. A. Elam, Texas Tech University, Lubbock, and New Mexico State University, Clayton Livestock Research Center, Clayton ………………………..……………………… 62
Research Updates
Oklahoma State University - Interaction of nutrition, health, management, and technology to improve the efficiency of cattle feeding C. R. Krehbiel, C. J. Richards, R. B. Hicks, D. L. VanOverbeke, D. L. Step, B. P. Holland, L. O. Burciaga-Robles, and L. E. Sims, Oklahoma State University, Stillwater…………….. 72 Colorado State University - 2009 Plains Nutrition Council University Update J. J. Wagner, T. E. Engle, S. L. Archibeque, and R. M. Enns, Colorado State University, Lamar and Fort Collins………………………………………………….………. 76

Graduate Student Research Presentations Page Got Starlings? Evaluation of Feed Depredation by European Starlings B. E. Depenbusch, C. D. Lee, G. L. Parsons, and J. S. Drouillard, Kansas State University, Manhattan …………….………………..………………………..…………… 93 The Economic Impact of Increasing Corn Price and Supplementation Decisions on Economics of Beef Production Systems W. A. Griffin, T. J. Klopfenstein, G. E. Erickson, D. R. Mark, and K. M. Rolfe, University of Nebraska-Lincoln………………… 93 Crude Protein, Ash, Phosphorus, Neutral Detergent Fiber, and Starch Concentrations in Particle Size Distributions of Corn Steam Flaked to Varying Bulk Densities K. E. Hales, N. A. Cole, A. Leytem, M. L. Galyean, Texas Tech University, Lubbock, USDA-ARS Conservation and Production Research Laboratory, Bushland, TX, and USDA-ARS Northwest Irrigation and Soils Research Laboratory, Kimberly, ID……………………………………………………………………………………… 94 Bovine Respiratory Disease: Effect of Morbidity during Preconditioning on Feedlot Growth Performance and Carcass Characteristics B. P. Holland, L. O. Burciaga-Robles, D. L. Step, D. L. VanOverbeke, and C. R. Krehbiel, Oklahoma State University, Stillwater……………………………………………………………………... 95 Use of Microarray to Determine Genes Differentially Expressed in Muscle and Subcutaneous Fat of Heifers Never Treated or Considered Chronically Morbid After a 63-d Preconditioning Program J. Johnson, D. R. Stein, L. O. Burciaga-Robles, B. P. Holland, D. L. Step, U. E. DeSilva, and C. R. Krehbiel, Oklahoma State University, Stillwater………………………………………………………… 95 Effect of Bambermycins and Level of Distillers Grains plus Solubles on Performance and Carcass Characteristics of Feedlot Steers J.M. Kelzer, G.I. Crawford, E.R. Loe, A.E. Wertz-Lutz, and B.D. Rops, University of Minnesota, St. Paul, Extension Regional Center, University of Minnesota, Hutchinson, and South Dakota State University, Brookings…………………………………………………………… 96 Effects of Adding MIN-AD to Steam-flaked Corn-based Diets With or Without Wet Corn Distillers Grain on Performance by Beef Cattle During Receiving and Finishing Phases M. L. May, M. J. Quinn, N. Di-Lorenzo, D. R. Smith, K. E. Hales, D. Simms, and M. L. Galyean. Texas Tech Univ., Lubbock and MIN-AD, Inc., Amarillo…………………………………………………………………………………………… 97 Optimal Roughage Level in Finishing Diets Containing Combinations of Flaked Corn and Dried Distiller’s Grains with Solubles Kevin Miller, Matt Shelor, Garrett Parsons, And Jim Drouillard, Kansas State University, Manhattan…………….. 97

Graduate Student Research Presentations (cont’d) Page The Effect of Ensilage Storage Duration and Proportion of Wet Distiller’s Grains and Straw on in situ Dry Matter Disappearance K. L. Neuhold, J. J. Wagner, T. E. Engle, S. L. Archibeque, and K. S. Sellins, Colorado State University, Fort Collins and Lamar………………………………………………………………………… 98 Comparison of Revalor XS, a New Single Dose Implant, to a Revalor IS and Revalor S Implant Strategy in Finishing Steers C. A. Nichols, G. E. Erickson, J. T. Vasconcelos, M. N. Streeter, B. D. Dicke, D. J. Jordan, R. J. Cooper, T. L. Scott and T. J. Klopfenstein, University of Nebraska, Lincoln, University of Nebraska Panhandle Research and Extension Center, Intervet/Schering-Plough, Inc., Millsboro, DE and Cattlemen’s Nutrition Services, Lincoln, NE………………………………………. 99 Dose and Release Pattern of Anabolic Implants Affects Growth of Finishing Beef Steers S. L. Parr, K. Y. Chung, J. P. Hutcheson, W. T. Nichols, D. A. Yates, M. N. Streeter, R. S. Swingle, and B. J. Johnson, Texas Tech University, Lubbock, Intervet/Schering-Plough Animal Health, De Soto, KS, and Cactus Research Ltd., Amarillo, TX……………………………………………………………………………………… 99 Effects of Extended Zilmax Withdrawal on Performance, Carcass Traits, and Shear-force Value of Steaks from Finishing Heifers G. L. Parsons, B. E. Depenbusch, C. D. Reinhardt , D. A. Yates, J. P. Hutcheson, and J. S. Drouillard, Kansas State University, Manhattan, and Intervet/Schering-Plough, Desoto, KS………. 100 Effects of Ruminally Degradable N in Diets Containing Wet Corn Distiller’s Grains and Steam-flaked Corn on Feedlot Cattle Performance and Carcass Characteristics C. H. Ponce, M. S. Brown, N. A. Cole, C. L. Maxwell, and J. C. Silva, West Texas A&M University, Canyon, and USDA-ARS Conservation and Production Research Laboratory, Bushland, TX…………………………………………….. 101
Effects on Ruminal pH, Hydrogen Sulfide Concentration, and Feed Intake When Using Wet Distillers Grains with Solubles to Adapt Cattle to Finishing Diets Compared to Forage K. M. Rolfe, G. E. Erickson, T. J. Klopfenstein, and J. T. Vasconcelos, University of Nebraska, Lincoln……………………………………………….. 101 The Impact of Trace Mineral Source, Water Quality, and Short-term Choline Supplementation on Performance and Carcass Characteristics of Finishing Steers J.S. Schutz, J.L. Seabrook, K.L. Neuhold, J.J. Wagner, M. de Veth, T.E. Engle, Colorado State University, Fort Collins and Lamar, and Balchem Corporation, New Hampton, NY………………………………………………………………………………… 102
Graduate Student Research Presentations (cont’d) Page Effects of Type and Amount of Supplementation on Performance, Carcass Characteristics, and Gene Expression of Adipose Tissue in Steers Wintered on Dormant Native Range E.D. Sharman, P.A. Lancaster, G.G. Hilton, C.R. Krehbiel, H.T. Purvis, D.R. Stein, U. DeSilva, and G.W. Horn, Oklahoma Agricultural Experiment Station, Stillwater…………………………………………………………………. 103 Effects of Sulfur and Monensin Concentrations on in vitro Dry Matter Disappearance, Hydrogen Sulfide Production, and Volatile Fatty Acids D. R. Smith, N. DiLorenzo, J. Leibovich, M. L. May, M. J. Quinn, J. W. Homm, and M. L. Galyean, Texas Tech University, Lubbock and Elanco Animal Health, Greenfield, IN… 103 Identification of Bovine Respiratory Disease Related Metabolic Fingerprints in Beef Steers S. J. Terrill, C. R. Krehbiel, R. D. Madden, J. W. Dillwith, and L. O. Burciaga-Robles, Oklahoma State University, Stillwater ………………………………….. 104 High sulfur content of dried distiller’s grains with solubles impacts ruminal fermentation, feedlot cattle performance, and carcass characteristics S. Uwituze, M.K. Shelor, G.L. Parsons, K. K. Karges, M.L. Gibson, L.C. Hollis, and J.S. Drouillard, Kansas State University and Dakota Gold Research Assn…………………… 105 Effect of Timing of Bovine Viral Diarrhea Virus Exposure in Relation to Mannheimia haemolytica Challenge on Immune Response and Muscle and Fat Gene Expression Changes in Growing Steers L. Carlos-Valdez, L. O. Burciaga-Robles, D. L. Step, A. W. Confer, R. W. Fulton, U. DeSilva, X. Gou and C. R. Krehbiel, Oklahoma State University, Stillwater……………………………………… 106 Feedlot Incidences of Sulfur Induced Polio and Ruminal Hydrogen Sulfide Levels with Varying Hay Level Inclusion in Byproduct Diets S.J. Vanness, N. F. Meyer, T. J. Klopfenstein and G. E Erickson, University of Nebraska – Lincoln…. 106 Performance, Carcass Traits, and Core Body Temperature of Finishing Beef Cattle Offered Zilpaterol Hydrochloride J. L. Wahrmund, B. P. Holland, C. R. Krehbiel, M. N. Streeter, D. A. Yates, J. P. Hutcheson, W. T. Nichols, C. L. Goad, and C. J. Richards, Oklahoma State University, Stillwater and Intervet/Schering-Plough Animal Health, De Soto, KS …………………………………………………………………….. 107


1
Beef: A Case Study of the Environmental and Consumer Benefits of High-Yield Agriculture
Alex Avery
Hudson Institute, Center for Global Food Issues Churchville, VA
Due to heightened concerns of the public, environmental activists, and policy makers over the supposed eco-impacts of livestock production, there have been a number of claims that organic and grass-fed beef production was better for the environment than so-called “factory feedlot” beef production. There have also been claims that grass-fed beef was safer for consumers, based on supposed lower risk of more harmful types of E. coli and other pathogenic bacteria. The evidence is now clear that neither of these claims is sustainable. In fact, grain-finished beef produced with the aid of hormones requires only one-third as much total land per pound and results in 40 percent less CO2-equivalent greenhouse gas (GHG) emissions compared to organic, grass-only beef production. Multiple studies in the U.S. and Germany have all reached this same conclusion. Yet it is also now clear that the popular culture war against modern farming, and beef in particular, will continue under the guise of health and other rationales. The question is: does this matter to the feed beef industry?
Hudson Eco-Beef Report In the early part of 2007, we were approached about conducting a comprehensive analysis of the environmental safety and benefits of modern, feedlot beef production to address claims of environmental superiority by proponents of organic and grass-fed beef. We readily agreed because it was completely in line with our long-standing advocacy for High Yield Conservation. HYC is essentially “producing more per acre, leaving more for nature.” In other words, producing more food/fiber on existing farmlands (and with existing agricultural resources) means we won’t have to turn wildlife habitats and natural landscapes into additional farmland. We’re beginning to make headway into the mainstream media with the notion that modern farming is not an enemy of Mother Nature or a threat to public health. The first breakthrough specifically with the eco-beef report was a June 2008 cover article in Wired magazine, entitled “10 Inconvenient Truths: Get Ready to Rethink What it Means to be Green.” Number 3 on the list of 10 was “Organics Are Not the Answer.” The case study of how organic farming can be worse for the environment was feedlot beef. Based on our report, we were able to show the senior editor who wrote the article that even the UN’s alarmist report Livestock’s Long Shadow supported the case that grass-fed beef was harder on the planet. Once she saw that even the UN report advocated more intensive livestock production (couched in very dodgy, nebulous language that never comes directly out and states this), she stopped arguing and began writing her article. Interestingly, Wired magazine also advocated Genetically Engineered crops, nuclear power, used rather than hybrid cars, and logging of some old-growth forest! (I’d like to think my own book, The Truth About Organic Foods, also played a part in this article)

2
Since mid-2008, there have been a number of other independent analyses that conclude grass-fed beef requires more resources and results in greater waste and GHG emissions. In August of 2008, the group Foodwatch and the German Institute for Ecological Economy Research concluded that “The production of one kilo of grass-fed beef causes the same amount of emissions as driving 70.4 miles in a compact car. Because of more intensive production methods, producing one kilo of conventional beef is the equivalent of driving only 43.9 miles.” This is essentially the exact same conclusion as our own analysis, showing 40% higher GHG emissions per pound in grass-fed beef. Most recently, Nathan Pelletier of Dalhousie University in Halifax, Nova Scotia presented a paper at the annual AAAS meeting demonstrating grass-finishing beef produced more GHG emissions. He told Science News, “We do see significant differences in the GHG intensities [of grass vs grain finishing]. It’s roughly on the order of 50 percent higher in grass-finished systems.” Science News noted that this flew in the face of what most environmentalists have argued. In fact, this report was linked at a blog at the New York Times, who apparently couldn’t believe our report of a year earlier, or the German report, but finally paid attention to it because it was reported at a populist science magazine. In order for you to have a complete understanding of the math, below is the full contents of the relevant portions of our report.
Land Use and Greenhouse Gas Emissions from beef production There is considerable concern about the impact of agriculture – and meat production in particular – on land use, energy, and greenhouse gas emissions. In November of 2006, the United Nations Food and Agriculture Organization (FAO) released a widely-cited report examining this issue, ominously titled “Livestock’s Long Shadow.”1 According to the FAO’s estimates, livestock are responsible for 18 percent of humanity’s carbon dioxide-equivalent greenhouse gas emissions, or more than transportation as a single sector of the economy. (Note: of the 18%, 6% is assumed from clearing of rainforest for animal feed production) The FAO highlighted that it wasn’t just respiration of CO2 and exhalation/flatulence of methane that contribute to possible climate change forcing, but that land-use changes and energy used to produce fertilizers also contribute. Specifically, according to the UN FAO, poultry and livestock are responsible for 9 percent of all human-sourced CO2 emissions, 37 percent of methane emissions, and 65 percent of nitrous oxide emissions. Any assessment of the environmental impact of beef production systems and technologies must therefore account for these emissions and compare them with alternatives. In the case of beef, there are two major post-weaning production paradigms in the U.S. and Canada: cattle feedlots utilizing a mixed ration of grain, forage (hay, alfalfa, etc) and growth promoting hormones versus pasture- or grass-based finishing. Both systems have their respective
1 UN FAO. 2006. Livestock’s Long Shadow: Environmental issues and options. Available
online: http://www.virtualcentre.org/en/library/key_pub/longshad/A0701E00.pdf

3
advantages and disadvantages. But the two have different environmental impacts, in terms of land used and emissions of green house gases per pound of beef produced. Beef produced in feedlots with the help of growth enhancing hormones requires significantly less total land (including feed crops) and creates substantially fewer greenhouse gasses in the process. To get a handle on the relative magnitude of differences in resource and environmental costs of the two production approaches, we relied upon a model created by a group at Iowa State University to compare the profitability of various niche beef production methods.2 This economic model was funded by the Leopold Center for Sustainable Agriculture at ISU in order to help farmers considering transitioning to alternative beef production methods such as organic and natural. The model farms assumed equal herd size (100 cows), equal pre-weaning mortality, equal corn yields (150 bushels per acre), equal grass productivity, and well-managed pastures for fall, spring, and summer. It then adjusted land needs and productivity using the Cornell Net Carbohydrate and Protein System (CNCPS) model. The CNCPS was “developed to predict requirements, feed utilization and nutrient excretion for dairy and beef cattle in unique production settings,” and is well regarded in examining the resource costs and efficiencies of the various beef production systems as well as the impact of using growth-promoting hormones. It must be stressed that that the ISU model parameters likely underestimate the benefits of grain-feeding beef cattle with the aid of growth promoting hormones. Why? The ISU model assumes conventional grain-fed cattle are fed in a feedlot for 303-329 days before slaughter, whereas most cattle spend no more than 220-240 days in a feedlot and usually only about 150 days. According to July, 2007 Cattle Fax, the average U.S. beef animal spends 150 days on feed.3 This means that beef cattle typically spend 20-50% less time in a feedlot than assumed in the ISU model. If these shorter, real-world finishing periods were compared, the environmental benefits of feedlot systems would be even more striking compared to grass-based finishing. Nonetheless, the ISU comparison serves as a useful baseline comparison that, while favoring the grass-fed system, still demonstrates the benefits of finishing cattle in feedlots using growth promoting pharmaceuticals. Environmental Cost Comparison While the ISU group examined five production systems (organic grass-fed, organic grain-fed, natural grass-fed, natural grain-fed, and conventional grain-fed with hormones), we will examine
2 Acevedo, N., J.D. Lawrence, and M. Smith. 2006. Organic, Natural and Grass-Fed Beef:
Profitability and constraints to Production in the Midwestern U.S. Report to Leopold Center for Sustainable Agriculture, Iowa State University. http://www.iowabeefcenter.org/content/Organic_Natural_Grass_Fed_Beef_2006.pdf
3 Cattle Marketing Information Service, Inc. Summary of Activity. Cattle Fax Update, Issue 28, volume XXXIX, July 13, 2007.

4
the resource costs for just three: organic grass-fed, natural grain-fed, and conventional grain-fed with growth promoting hormones. The modeled grass-fed system assumes small frame cattle, as recommended for grass-finishing. This means that they have smaller cows to feed, a smaller calf weaned, and a smaller animal sold for slaughter. The grain fed model system assumes medium-framed animals, accounting for the differences in cow size and calf weights at weaning. Both assume a spring-born calf weaned on November 1. Accordingly, a grass-based finishing operation with 100-cow herd requires 660 acres of pasture and hay, whereas the grain-fed farm requires 365 acres of pasture, hay, and corn. The model assumes the farms sell 77 feeders (48 steers and 29 heifers) at the end of the process, retaining 20 replacement heifers for the next cycle, and assuming a 3 percent pre-weaning death loss.
Table 1. Model results for starting weight, days on feed, final weight and carcass weight for the three systems
Organic grass-fed
Natural grain-fed
Conventional grain-fed
Starting weight, lbs 425 475 475 Days on feed 366 329 303 Post weaning daily gain, lbs 1.65 2.36 3.06 Feed:Gain, dry matter 10.99 7.12 6.22 Marketing date 2-Nov 26-Aug 31-Jul Final weight, lbs 1,029 1,251 1,401 Dressing percent 61% 63% 63% Carcass weight, lbs (beef yield) 623 782 876 Total system beef production, lbs 47,971 60,214 67,452
Land Costs of Beef Finishing Systems The three systems return different amounts of beef based on the differing performance of the animals under the different production paradigms, which in turn affect the amount of resources used per pound of beef produced. The biggest factors in resource use efficiency are:
1. The 11 percent smaller frame size of the grass-fed animals (and subsequently lower finished weight)
2. The 20 percent longer finishing period (days on feed) in the grass-fed system 3. The 80 percent larger land area needed to feed cows due to the lower energy density of
grass versus grain. To calculate land costs per pound of beef in the three model farms, we multiply the total farm acreage and the number of days on feed. We then divide this number by the total pounds of finished beef produced.

5
For the grass fed system, 100 cows on 660 acres for 366 days on feed:
660 acres X 366 days on feed = 241,560 acre-days. The average grass-fed organic cow yielded a carcass weight of 623 pounds. Multiplied by the 77 animals sold for slaughter, the total beef yield was 47,971 lbs. This yields a land use per pound of beef produced:
241,560 acre-days ÷ 47,971 lbs beef = 5.04 acre-days/pound finished beef. The land costs per pound of beef for the three finishing systems are given in Figure 1 below.
5.04
1.991.640123456
Organic grassGrain w/o GPGrain w/ GPs
Land per pound of beef(acre-days)
Figure 1. Land area needed to produce a pound of beef during finishing phase
Thus, grain-finished beef produced using growth promoting implants and ionophores is 3 times more land efficient than organic grass-fed beef, requiring only one-third of the land per pound of beef in the ISU model. When compared to natural grain-fed finishing (i.e. grain-fed in feedlots but without hormones and ionophores), the conventional method is 20 percent more land efficient. Thus, growth promoting implants and ionophores conserve considerable land for other purposes by allowing a substantial increase in land use efficiency over grain-based feeding alone. This reality is reflected in far more than just models. Individual trials on growth promoting implants report increases in average daily gain (ADG) from -5 to +38 percent, with an average increase of nearly 14 percent. Conversely, the individual trial effects of growth promoting implants on feed to gain (FTG) range from +7.7 down to nearly 23 percent, with an average decrease of 8.8 percent.4 These are substantial gains in feed use efficiency over grain-based finishing alone that translate into reduced feed requirements and, thus, substantial gains in land use for other purposes.
4 Lawrence, J.D. and M.A. Ibarburu. 2006. Economic analysis of pharmaceutical technologies in
modern beef production. www.econ.iastate.edu/faculty/lawrence/pharmaeconomics2006.pdf

6
Habitat Conservation Quotient In terms of a farm footprint, the use of grain finishing with growth promoting hormones allows a 20 percent reduction in land needed for beef finishing over grain-based finishing alone. Compared to grass-based cattle production, grain-finishing with growth promoting implants increases land use efficiency three-fold. The land use efficiencies of these three systems (from Figure 1) can be translated into a Habitat Conservation Quotient (HCQ, see Figure 2). For example, each acre of land devoted to grain-finishing beef (both feedlot acres and land needed to grow the feed) saves 1.5 acres of land that would be needed to produce the same amount of beef in an organic grass-finished system. Thus, the grain-finishing system earns a HCQ of 1.5.
2.07
1.5
0
0 0.5 1 1.5 2 2.5
Farmland Conservation Capacity
Organic grass
Grain without GPs
Grain with GPs
Habitat Conservation Quotient
Figure 2. Relative land/habitat conservation capacity based on the amount of land needed to produce a pound of beef from Figure 1. Grass finishing of beef is an efficient use of poorer-quality farmland less suited for growing feed crops. There are several regions on the globe where grass production is arguably the best, most environmentally sensitive use of farmland. In such places, grass-based beef production is a “good” use of such farmland, especially given the growing consumer demand for grass-based beef. However, in areas with land suitable for growing feed crops, grain finishing is the “better,” more resource-efficient use of the land. Finally, grain finishing with the aid of growth promoting implants and ionophores represents arguably the “best”, most efficient use of the farmland resource. Producing beef in this manner scores a HCQ of 2.07, meaning that each acre of land devoted to producing beef in feedlots with the aid of growth promotant hormones and ionophores conserves 2.07 acres of land that would otherwise need to be farmed if the beef was produced under organic grass management. (Remember that these are likely an underestimate of the habitat/land conservation capacity of grain finishing with growth promoting pharmaceuticals because they are based on the ISU economic model that assumes cattle spend twice as long in feedlots than they actually spend)

7
Given: • the growing world population • the increased per capita demand for beef and other high-quality animal proteins • the severely limited land area on which to produce food, feed, and fiber for humanity
(currently estimated 40% of total world land area) • increased pressures to conserve natural and biodiverse habitats for nature
It is imperative that we use each and every farmland acre to its best and most productive use. To that end, we should view each system in terms of its overall land use efficiency. While utilizing grass and grazing lands for beef production converts a human inedible resource into a nutritious edible protein, grain feeding utilizes cropland in a fundamentally land-conserving manner by allowing more land to be devoted to other human uses or by allowing humanity to conserve wildlife habitats that would otherwise be converted to farmlands.
Greenhouse Gas Emissions Associated with Beef Production A second key metric in assessing the eco-impact of beef production is the emission of greenhouse gases (GHGs) into the atmosphere. All livestock production results in the release of carbon dioxide from the respiration of the animals themselves, secondary methane (CH4) production from animal waste decomposition and (in the case of ruminants) enteric fermentation, emissions of CO2 from the production of synthetic nitrogen fertilizers used to grow livestock feed grain, and nitrous oxides (NOx) production from farmland and manure management. According to the U.S. Environmental Protection Agency, U.S. agriculture accounts for 7 percent of total U.S. CO2-equivalent greenhouse gas emissions in 2005.5 Of this 7 percent, beef production accounted for roughly one-third, or 2% of total U.S. emissions. Roughly half of beef’s share of agricultural emissions is from methane emissions related to manure and enteric fermentation (~1% of U.S. total) and half from nitrous oxides from crop and grasslands (~1% of U.S. total). Assessing greenhouse gas emissions from different livestock production systems can be a complex exercise because numerous factors affect the production of these gases in beef cows, including increased production of methane with decreasing dietary energy density and regional differences in greenhouse gas production relating to pasture quality and crop production methods. These factors and accounting have been extensively studied as part of the United Nations Intergovernmental Panel on Climate Change (IPCC). 1. CO2 from Respiration According to the Kyoto protocol, carbon dioxide emitted due to livestock respiration is not considered to be a net source of CO2 emissions because the emitted CO2 itself came from plant matter created through the conversion of atmospheric CO2. According to the UN FAO, however,
5 EPA. 2007. Inventory of U.S. Greenhouse Gas Emissions and Sinks: 1990-2005.
http://www.epa.gov/climatechange/emissions/usinventoryreport.html

8
beef and buffalo emit nearly 2 billion tons of CO2 annually via respiration, and each cow emits roughly 3.8 lbs of CO2/year by respiration for each pound of live weight.6 Using this number, we can roughly estimate the amount of respired CO2 for our three finishing systems with the following formula:
[[Final live weight + Starting weight] ÷ 2] x 3.8 x [Days on feed, i.e. percent of 1 full year] = CO2 emitted/animal/year
[CO2 /animal/year] x 100 = total herd emissions
We can then divide the estimated herd CO2 emissions by the total pounds of finished beef from the 77 sold animals to calculate respiration CO2/lb beef produced.
Table 2. Carbon dioxide emissions from cattle grown under different systems
Organic Grass-fed
Natural Grain-fed
Conventional Grain-fed
Average live weight per animal, lbs 727 863 938 per animal CO2 from respiration, lbs 2,768 2,951 2,958 Herd CO2 from respiration, lbs 276,800 295,100 295,800 CO2 emissions from respiration per pound finished beef, lbs 5.77 4.9 4.39
As shown in Table 2, grass-fed beef results in 30 percent greater CO2 emissions per pound of beef from respiration compared to modern grain-fed finishing. The use of hormones and ionophores results in about a 10 percent reduction in per-pound respiration CO2 emissions compared to not using these inputs. However, CO2 from respiration is such a small source that the EPA does not even account for it. 2. CO2 from Nitrogen Fertilizer Production (Grain-fed system only) Because no synthetic nitrogen fertilizers were applied to organic pastures, there are zero CO2 emissions from fertilizer in the grass-fed system. According to the UN FAO, the production of nitrogen fertilizer for animal feed accounts for more than 40 million tons of CO2 emissions per year. The FAO calculates CO2 emissions based on the energy needed to produce a ton of fertilizer and estimates of carbon emissions per terajoule of energy involved in the nitrogen fixation process. According to the FAO, about 2.5 lbs of CO2 are emitted per pound of nitrogen fertilizer manufactured. Using a reasonable estimate of 150 lbs of nitrogen to produce the 150 bushel/acre corn yield assumed in the Iowa State model, we can calculate CO2 emissions from feed production per animal and then convert to “per pound of beef” emissions estimates. In the ISU model, the conventional grain-fed cattle each consumed 1,780 lbs of corn silage and 79.1 bushels of corn over the full finishing process. At 150 bu/acre, corn will yield about 20 tons
6 UN FAO. 2006. op cit page 96, Table 3.6.

9
of corn silage at 65% moisture, so 1,800 lbs of corn silage represents about 5 percent of an acre’s harvest. The ~80 bushels of corn grain represent 53 percent of an acre’s harvest. Combined, they represent roughly 60 percent of the 150 lbs of nitrogen fertilizer applied, which is 90 lbs. At 2.5 lbs of CO2 per pound of nitrogen fertilizer, this totals 225 lbs CO2 emissions per cow.7 After multiplying by 100 (total cow herd) and dividing by the total beef produced (67,452 lbs) we find that conventional grain-fed beef results in 0.33 pound of CO2 equivalent GHG emissions per pound of beef. For the “natural” grain-fed beef, it works out to 0.35 lbs of CO2 equivalent emissions per pound of beef. 3. Methane from Digestion (enteric fermentation) and Cattle Manure Another GHG we must address is methane produced as part of the natural biology of ruminant animals like cows. Unlike swine and poultry, ruminant animals harbor a bacterial flora in their multi-chambered rumen that generates significant amounts of methane as a natural part of their fermentation of plant fibers into digestible sugars. Because methane is considered to be 23 times more powerful as an atmospheric GHG, each pound of methane is equivalent to 23 pounds of CO2. As you will see, methane emissions account for a significant share of greenhouse gas emissions from beef production. One of the largest factors affecting methane production in cattle is the quality of the feed. Higher quality feeds produce less methane than lower quality feeds. Thus, a diet higher in grain will result in less methane emissions. According to the recently revised UN IPCC Tier 2 estimates for North America, grazing cattle will produce 110 lbs of methane per head per year whereas grain-fed cattle in feedlots will produce only 57.2 lbs.8 Note: Monensin increases the efficiency of fermentation in the rumen, which consequently lowers methane emissions, as well as manure excretion – both of which will reduce overall methane production even further than grain feeding and the use of other growth promotants. According to recent research, use of monensin reduced methane emissions by nearly 10 percent in dairy cows.9 Other research suggests monensin may reduce methane emissions in beef cattle by as much as 25 percent.10 These effects were not considered in this analysis, but their positive environmental impact should be recognized.
7 This excludes the 1,555 lbs of corn gluten feed produced as a byproduct of ethanol wet-milling.
No reliable estimates for CO2 emissions per ton or lbs of corn gluten feed could be found. However, as the rest of the calculations show, the other corn feed accounts for less than 5% of total CO2 equivalent emissions, so this omission does not substantially impact the results.
8 UN FAO, 2006, op cit, Table A3.1, page 385. North America “Grazing” EF of 50 kg methane/head/year vs. “Industrial” of 26kg/hd/yr. There are 2.2 lbs in 1 kilogram.
9 Odongo, N.E., R. Bagg, G. Vessie, P. Dick, M.M. Or-Rashid, S.E. Hook, J.T. Gray, E. Kebreab, J. France, and B.W. McBride. 2007. Long-term effects of feeding monensin on methane production in lactating dairy cows. J. Dairy Sci 90:1781-1788.
10 Tedeschi, L.O., D.G. Fox, and T.P. Tylutki, 2003. Potential environmental benefits of ionophores in ruminant diets. J Environ Qual 32:1591-1602.

10
In addition to the enteric fermentation, we must account for manure methane emissions, estimated by the IPCC Tier 2 at 2.2 lbs per head per year for grass-fed cattle and 20.9 lbs per head per year for grain-fed cattle.11 Because of methane’s greater warming power as a greenhouse gas, these methane emissions are equivalent to 1,800 and 2,600 lbs of CO2 per cow per year (Table 3). Table 3. Methane emissions from cattle grown under different systems
Grass-fed Grain-fedEnteric fermentation emission, lbs 110 57.2 Manure CH4 emissions, lbs 2.2 20.9 Total methane emissions estimates per head per year, lbs 112.2 78.1 CO2 equivalent methane emissions values per head per year 2,580 1,796.3
To calculate the CO2-equivalent GHG emissions per pound of beef, we need to account for the different finishing lengths (303 days for conventional feedlot, 329 days for “natural grain-fed” and 366 days for organic grass-fed) and divide this by the total pounds of beef produced (Table 4). Table 4. Estimated CO2-equivalent emissions
Grazing “Natural” feedlot
Conventional feedlot
CO2 equivalent emissions per head at slaughter, lbs 2,586 1,619 1,491 CO2 equivalent emissions per herd, lbs 258,600 161,900 149,117 CO2 equivalent methane per pound beef produced, lbs 5.39 2.69 2.21
Greenhouse Gas Emissions Totals The CO2 equivalent GHG emissions per pound of beef from these three sources can now be totaled (Table 5). As can be seen in Figure 3, organic grass-fed beef results in more than 60 percent more CO2-equivalent GHG emissions per pound of beef from these three sources than conventional beef production. Growth promoting hormones account for fully 25 percent of the emissions reductions.
11 UN FAO, 2006, op cit, Table A3.2, page 387. “North America” EF of 9.5 kg
methane/head/year was chosen to represent grain-fed feedlot production because the vast majority of U.S. beef production is feedlot. “China” and “S. America” EF of 1 kg methane/head/year was chosen to represent grass-fed production because most beef in these regions is grass pastured.

11
Table 5. Total CO2 GHG emissions per pound of produced from three different systems
Grazing “Natural” feedlot
Conventional feedlot
Respiration, lbs 5.77 4.9 4.39 N fertilizer use, lbs 0 0.35 0.33 Methane from enteric fermentation and manure, lbs 5.39 2.69 2.21 Total CO2 equivalent emissions per pound of beef (excluding NOx) 11.16 7.94 6.93
Total Greenhouse Gas Emissionsper pound of beef
0
3
6
9
12
ConventionalGrain
Natural Grain Organic Grass
lbs
CO
2
equ
ival
ents
Figure 3. Greenhouse gas emissions per pound (excluding NOx)
4. N2O from crop and manure management The one aspect of greenhouse gas emissions not yet accounted for in this analysis is nitrous oxide, or N2O. While this is perhaps the most significant GHG from beef production, accounting for up to half of the total greenhouse gases associated with all aspects of beef production, it is also the trickiest to estimate. N2O is released from all agricultural land, both cropland and grass and grazing lands, and varies considerably based on a multitude of factors, including soil type, fertilizer applications, crop/plant growth, moisture levels, soil organic carbon, rainfall, temperature, and more. Because of this inherent and large variability, it is not possible to apply a simple, generalized “N2O factor” to different production systems. However, a group of researchers (Colorado State University, Texas A & M University, and University of Hamburg) has been evaluating GHG emission between different beef production systems using sophisticated computer models and specific location parameters to gain insight

12
into N2O dynamics.12 Their studies have shown that of total CO2-equivalent GHG emissions from beef production, 48% are from N2O (all sources – animal manure, crop N-fertilization, legume and waste using IPCC 2001 factors), 41% are from methane (40% enteric, 1% manure), and 11% are from fuel CO2 (both fuel and fertilizer). The cow-calf phase of production emits 75% of beef system GHGs, with emissions of just over 16 kg CO2-equivalent GHG per kg of product. This is about twice that of the stocker phase, and nearly three-fold that of the feedlot phase, for a total of 22 kg GHG/kg product. They report that these ratios change little during the different beef production scenarios. Of the five scenarios they modeled, the system with the lowest N2O emissions per kg of product was the intensive grazing and direct placement of calves into a feedlot. As they stated, “the sooner [calves] were placed in the feedlot the lower the overall GHG/kg product.” So while N2O emissions are a major GHG in beef production, there do not seem to be major differences between production systems and what differences there are indicate that feedlot systems that grow animals rapidly have the lowest N2O emissions.
Recent Studies and Concerns About Aquatic Impacts Within the last decade, a number of environmental groups have suggested that the use of growth promoting hormones and pharmaceuticals in beef production may be inadvertently impacting aquatic communities. In part, these concerns arise out of findings that hormonally active compounds are released from municipal waste water treatment facilities into surface waters where they have altered fish reproductive development. The amount of discharge from municipal waste water treatment facilities is large, is sent directly into surface waters, and includes both natural human hormones as well as supplemental hormones from birth control pills and hormone replacement therapies. Thus, these situations are very different from and not directly comparable to the runoff from cattle feedlots and fields where cattle waste is applied as fertilizer. However, they raise questions about possible impacts. It must be stressed that current methodologies used in these studies are at the cutting edge of hormone detection and testing capabilities. There is still considerable question as to the accuracy and sensitivity of these methodologies. For example, from 1999 to 2000, researchers with the U.S. Geological Survey conducted extensive testing of stream water from various monitoring stations and reported finding numerous reproductive hormones at fairly high frequencies (10-20% of samples).13 However,
12 Johnson, D.E., H.W. Phetteplace, A.F. Seidl, U.A. Schneider and McCarl, B.A. 2003.
Management variations for U.S. beef production systems: Effects on greenhouse gas emissions and profitability. 3rd International Methane and Nitrous Oxide Mitigation Conference. Beijing, China. http://www.coalinfo.net.cn/coalbed/meeting/2203/papers/agriculture/AG047.pdf
13 Kolpin, D.W., E.T. Furlong, M.T. Meyer, E.M. Thurman, S.D. Zaugg, L.B. Barber, and H.T. Buxton. 2002. Pharmaceuticals, hormones, and other organic wastewater contaminants in U.S. streams, 1999-2000: A national reconnaissance. Env.. Sci. Technol. 36:1202-1211.

13
their analysis was not based on validated assays (tests) and the accuracy and reliability of these methods remains an open question. Subsequent analysis indicates that there may be many confounders to these data and assays.14 For example, concentrations of several synthetic hormones used only in human pharmaceutical products (used in contraceptives and hormone replacement therapies) were found by the USGS researchers at two rural monitoring stations at levels substantially higher than would be anticipated, given these sampling site’s lack of downstream proximity to a human wastewater treatment works or other expected source. One group of scientists subsequently suggested that this difference may be due to interference of the test by natural organic materials in the water that could not be resolved by the analytical method used, resulting in a false positive. The take home message is that studies addressing downstream and “local” steroid contamination from animal production units must use validated testing methods and valid sampling to assure the sample is reflecting the true source of the steroid(s). Regardless, several groups have examined this issue in recent years and the results, while intriguing, are also reassuring. In 2004, a group of university and EPA researchers examined fathead minnows from directly below the effluent outfall of a feedlot and compared them to minnows from a stream receiving manure-fertilized field runoff and minnows from a stream not impacted by runoff from cattle production.15 They reported finding differences in the ratios of various hormones in minnows from the upstream and downstream sites. However, they did not observe characteristics in any minnows indicative of exposure to environmental estrogens. As they stated, “we confirmed that all [minnows] collected were adults and that the reproductive stage of the gonads in males and females did not vary among sites.” The water from a waste retention pond at the base of the feedlot exhibited hormonal activity in an ultra-sensitive test. But to what extent this was due to natural hormones in the waste or supplemental hormones from implants or feed-added MGA was not examined. Nor is it surprising that undiluted cattle waste would exhibit hormonal activity in the highly sensitive test used (monkey kidney cells genetically-engineered to contain the human androgen hormone receptor and the sensitive luciferase “reporter” enzyme). In 2002/2003, a group of EPA researchers examined water from the discharge drain of a cattle feedlot in central Ohio using the same ultra-sensitive assay (genetically-engineered monkey kidney cells).16 Indeed, at times the undiluted feedlot drain water registered hormonal activity.
14 Anderson, P.D., V.J. D’Aco, P. Shanahan, S.C. Chapra, M.E. Buzby, V.L. Cunningham, B.M.
DuPlessie, E.P. Hayes, F.J. Mastrocco, N.J. Parke, J.C. Rader, J.H. Samuelian and B.W. Schwab. 2003. Screening analysis of human pharmaceutical compounds in U.S. surface waters. Env. Sci. Technol. 38(3):838-849.
15 Orlando E.F., A.S. Kolok, G.A. Binzcik, J.L. Gates, M.K. Horton, C.S. Lambright, L.E. Gray, A.M. Soto and L.J. Guillette. 2004. Endocrine-Disrupting effects of cattle feedlot effluent on an aquatic sentinel species, the fathead minnow. Env. Health Perspect. 112(3):353-358.
16 E.J. Durham, C.S. Lambright, E.A. Makynen, J. Lazorchak, P.C. Hartig, V.S. Wilson, L.E. Gray and G.T. Ankley. 2006. Identification of metabolites of trenbolone acetate in androgenic runoff from a beef feedlot. Env. Health Perspect. 114(supp 1):65-68.

14
However, other times it did not. For four of nine sampling periods, no differences were observed between feedlot drain water and water from upstream (575 meters) or downstream (381 meters) of the feedlot. Most importantly, while roughly 50 percent of the water samples taken directly from the feedlot drain exhibited some hormonal activity in the ultra-sensitive test, at no time did any of the samples from 380 meters downstream ever exhibit elevated hormonal activity. In short, while such research should continue to fully characterize and confirm the rapid degradation and low eco-transport of growth-promoting pharmaceuticals, none of these findings are alarming or indicate a significant environmental threat.
Environmental Conclusions In sum, using a model system endorsed by sustainable agriculture advocates and the emissions factors stipulated by the United Nations Intergovernmental Panel on Climate Change, we find that organic grass-fed beef production requires three times more land and results in 60 percent more greenhouse gas emissions (excluding N2O) compared to grain feeding with the aid of growth promoting hormones. While this is not an “indictment” of grass-based beef production, as cattle efficiently turn a human inedible resource (grass) into a highly valuable and nutritious edible product, it clearly illustrates that modern feedlot beef production and growth promoting hormones both offer significant environmental benefits. The synergistic combination of grain-feeding in feedlots and growth-promoting hormones and ionophores allow for the production of considerably more beef per acre of land and result in significantly less greenhouse gas emissions per pound of beef.

15

16
The Beef Packing Industry - Past, Present and Future
Del Allen, PhD Derby, KS
The beef processing industry has a long and colorful history that is tied to the development of the U.S. This is particularly true of the mid-west and Great Plains areas of the country. The first cattle introduced into the U.S. were utilized for milk and power, with meat being a by-product. The meat industry was a localized and seasonal industry that served local populations. As the population of the U.S. crossed the Appalachian Mountains and spread into the soil rich mid-western states, the meat industry developed as a means of marketing corn. This was primarily done via the feeding and slaughtering of swine in the early 1800's. Initially, the livestock were driven east across the Appalachians’ to markets in the more heavily populated areas. The first recorded cattle drive cattle drive in the north was in 1805 from Circleville, Ohio to the eastern markets (table 1). The slaughter industry developed slowly in the mid-west in the early part of the 19the century with Cincinnati becoming the first major center of pork slaughter, followed by Chicago after the civil war (table1). Beef cattle production, raising and slaughter became big business after the civil war. Following the war, Texas had a surplus of cattle with no market. The railroads were being built and had reached the northern Great Plains. With the market in Chicago, the cattle in Texas, the driving of cattle from Texas to the railroads commenced. The U.S. Department of Agriculture was formed in 1862 and began taking a census of total cattle numbers in 1865. The latter part of the 19th century saw the beginnings of large volume packing companies such as Swift, Armour, Wilson and Patrick Cudahay as well as the development of other major livestock marketing centers at what were termed the river markets, among them were Omaha, Kansas City, St. Louis, St. Paul and St. Joseph.
Cattle Numbers
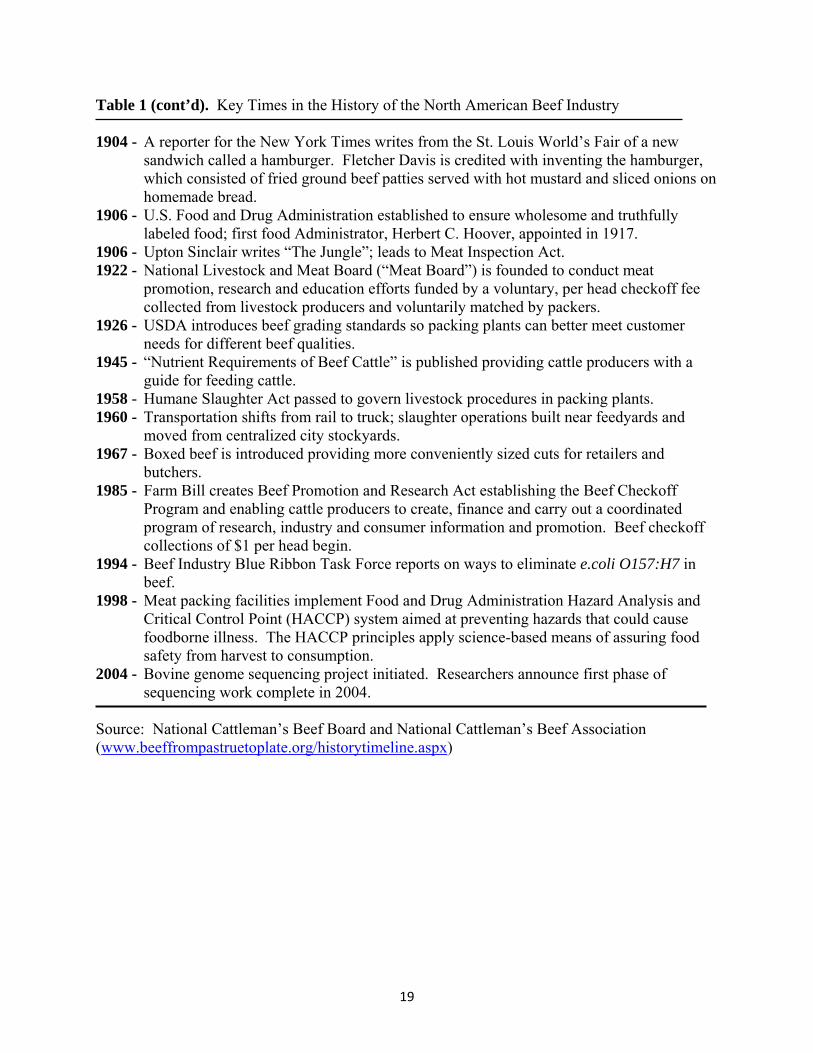
In 1865, USDA, in its’ initial count of cattle, estimated that there were 21 million head of total cattle in the U.S. (Figure 1). From 1865 to 1880, there was a rapid increase in the numbers of total cattle and/or improved methods of statistically estimating numbers or both since in 1880, total of 57 million were reported. Between 1880 and 1955 cattle numbers remained relatively flat with 66 million head reported in 1955. Increasing popularity, affluence and increasing population numbers created a tremendous increase in demand for beef resulting in a surge in cattle numbers with them peaking in 1978 at 130 million plus head. Numbers since that time have been in decline and the January 2009 cattle inventory report showed them at 94.5 million head (USDA Cattle Inventory Report, January 2009). This is the lowest total inventory report of total numbers since 1959 when there were a reported 93.3 million head. Total cow numbers shown in the January 2009 report were at 41million head. Economic conditions, high feed costs, periodic drought, fixed costs and the average age of producers all are contributing to a continuing decline in cow numbers, the basic production engine of the U.S. beef industry, and presuming continued decline, feedlot and packing plant capacity will also be reduced in future years. During 2008, cow and bull slaughter represented 20% of total slaughter but during 5 of the past 6 months, it has been above 20% of total slaughter probably due the dry conditions present in parts of the U.S. in addition to the uncertain economic conditions of the time.

17
Industry Consolidation
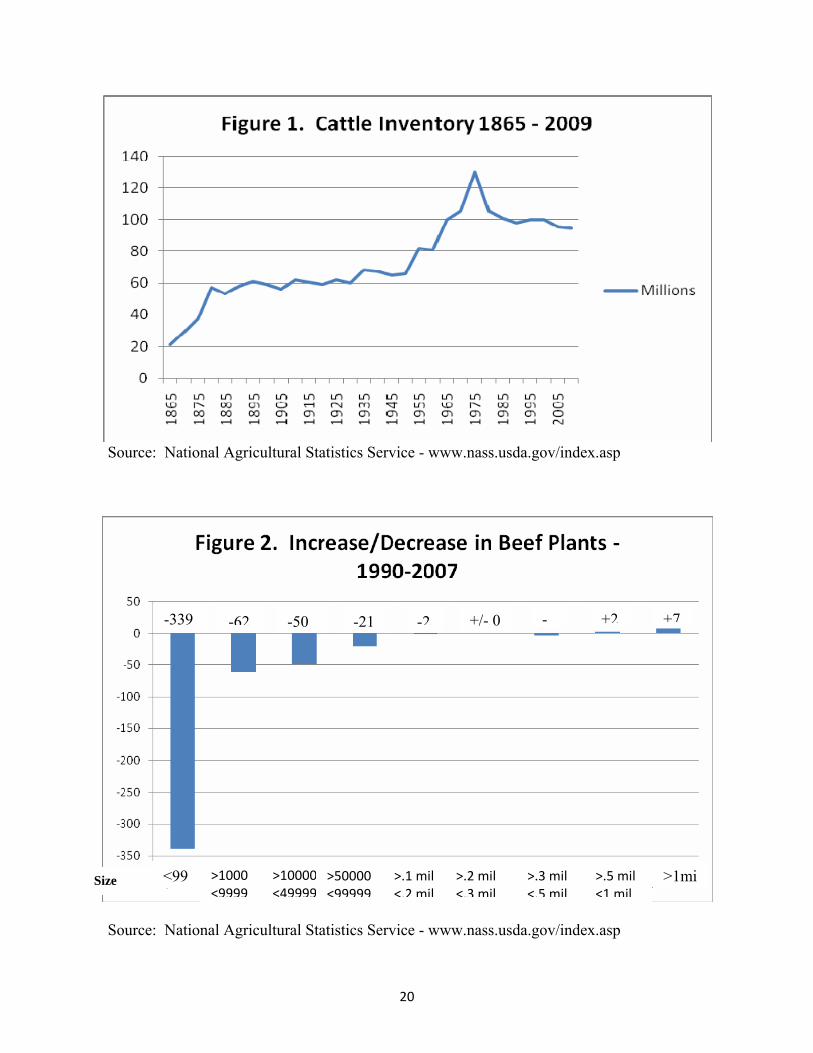
Packing plant size has increased over the past 20 years and numbers of plants have decreased (Figure 2). In 1990, there were a total of 1,105 FSIS Inspected plants that slaughtered one head or more of cattle. This number in 2007 had declined to 626, or a decrease of 469 plants. During these same years, the number of plants that slaughter more than 1 million head per year has increased from 7 to 14 and the percentage of fed cattle slaughtered by large plants greater than ½ million annual slaughter capacity increased from 65 to 93%. Due the increase size and slaughter capacity of the larger plants, total slaughter capacity has remained flat to increasing. Total daily slaughter capacity for cattle is estimated at 139,000 head (Table 2). The top ten companies slaughtering cattle have a total daily slaughter capacity of 107,475 of the 139,000 or 77.3% of the total daily capacity. With a total daily capacity of 139,000 head, the industry has been operating at 80 to 85% of capacity most of the time during the past 2 to 3 years. The consolidation of fed cattle slaughter has seen the greatest increase during the years 1991to 2007 going from 64.8% slaughtered in plants killing greater than 500,000 annually to 93.2% in 2007 (table 3). This combined with decreasing numbers have forced packers to compete for available supply in an attempt to operate at capacities and contain costs per unit of production. This competition for available cattle has caused most packers in the past few years to relax some discounts on cattle that produce carcasses formerly discounted. This has been especially true of weight discounts and as a result, food service and retail customers currently are becoming increasingly critical of cuts that are to big, especially in the middle meat items.
Packer Survivability
Which packers and/or plants will survive? This will depend on multiple factors, one of which is obviously financial stability. Several packers currently have large debt loads and if the current government stimulus efforts create inflation in the next 2 to 3 years resulting in increases in interest rates, those with large debt loads will be hard pressed pay those interest costs and maintain competitiveness with those that do not have comparable debt loads. If this scenario develops, it could put some companies under tremendous pressure to reduce capacity which would probably be done by closing of additional plants. Declining cattle numbers will put immense pressure on packing companies as they compete for slaughter numbers. This will be especially true in regions of the U.S. where fed cattle numbers have been minimal even during good years. Plant maintenance will play a part in determining which packer will maintain competitiveness in the next few years. Many of the large plants were built in the 1960's through the 1980's. Some companies have done a much better job of plant modernization and maintenance than others. Those that have done so are much better positioned to survive than those that have not. Another factor that will determine who survives and which plants remain open relates to which packer is successful in forming alliances with feedlot companies that also survive to insure cattle

18
supply. This will create increasing pressure on vertical integration, either through ownership of feedlots but more probably through the continuing trend of forming alliances with feedlots. The survivability of both feedlots and packers may depend on these criteria as much as any of those mentioned.
Summary
The beef packing industry is, like all other segments, ultimately dependent upon the base production unit, the cow-calf producer. Due a variety of factors, the base production segment of the beef industry is shrinking which will cause all other segments including the packing industry to reduce capacity. This reduction in supply and capacity will continue in a reduction state until supply is restricted to the point that profitability returns to the industry. The continued reduction in cow-calf numbers and the resulting reduction in available feeder cattle will cause continued consolidation in the feedlot segment as well as the packing industry. In an attempt to ensure supply, there will be greater vertical integration, mostly via contractual arrangements, between industry segments. Losses in profitability will also force packers to push for innovation as a means to reduce costs. One of the great inefficiencies that exist in the industry currently is the wide variation in animal size and carcass traits that exists. In order to maximize efficiency, packers may, in the future, put constraints on the size and/or types of animals that they will process. This will be especially true in vertically integrated supply chains where this will be addressed jointly by both the supplier and the packer. Table 1. Key Times in the History of the North American Beef Industry 1519 - Hernando Cortez brings first cattle to North American continent, setting up ranches in
Mexico. Often the cattle roamed wild and later came to the United States by way of Texas and California. Around the same time, a cattle industry is also emerging in Florida.
1805 - First recorded Northern cattle drive from Circleville, Ohio. Western farmers seek livestock markets in populous East.
1852 - Railroads reach Chicago from east, adding to the westward spread of livestock raising and feeding. Five different railroads establish their own stockyards there.
1862 – President Abraham Lincoln creates the U.S. Department of Agriculture (USDA) to administer agricultural programs. It is called “the peoples department” because farmers make up more than half the population.
1865 - Union Stockyards in Chicago becomes hub of the livestock industry. 1867 - Kansas Pacific Railroad reaches Abilene, Kansas, establishing a gateway for Texas trail
herds to reach eastern consumer markets. Cattle drives begin. First shipment of cattle from Abilene to Chicago.
1878 - Meat packer Gustavus Swift perfects the refrigerated railcar, greatly expanding the market for perishable products.
(cont’d on following page)
19
Table 1 (cont’d). Key Times in the History of the North American Beef Industry 1904 - A reporter for the New York Times writes from the St. Louis World’s Fair of a new
sandwich called a hamburger. Fletcher Davis is credited with inventing the hamburger, which consisted of fried ground beef patties served with hot mustard and sliced onions on homemade bread.
1906 - U.S. Food and Drug Administration established to ensure wholesome and truthfully labeled food; first food Administrator, Herbert C. Hoover, appointed in 1917.
1906 - Upton Sinclair writes “The Jungle”; leads to Meat Inspection Act. 1922 - National Livestock and Meat Board (“Meat Board”) is founded to conduct meat
promotion, research and education efforts funded by a voluntary, per head checkoff fee collected from livestock producers and voluntarily matched by packers.
1926 - USDA introduces beef grading standards so packing plants can better meet customer needs for different beef qualities.
1945 - “Nutrient Requirements of Beef Cattle” is published providing cattle producers with a guide for feeding cattle.
1958 - Humane Slaughter Act passed to govern livestock procedures in packing plants. 1960 - Transportation shifts from rail to truck; slaughter operations built near feedyards and
moved from centralized city stockyards. 1967 - Boxed beef is introduced providing more conveniently sized cuts for retailers and
butchers. 1985 - Farm Bill creates Beef Promotion and Research Act establishing the Beef Checkoff
Program and enabling cattle producers to create, finance and carry out a coordinated program of research, industry and consumer information and promotion. Beef checkoff collections of $1 per head begin.
1994 - Beef Industry Blue Ribbon Task Force reports on ways to eliminate e.coli O157:H7 in beef.
1998 - Meat packing facilities implement Food and Drug Administration Hazard Analysis and Critical Control Point (HACCP) system aimed at preventing hazards that could cause foodborne illness. The HACCP principles apply science-based means of assuring food safety from harvest to consumption.
2004 - Bovine genome sequencing project initiated. Researchers announce first phase of sequencing work complete in 2004.
Source: National Cattleman’s Beef Board and National Cattleman’s Beef Association (www.beeffrompastruetoplate.org/historytimeline.aspx)
20
Source: National Agricultural Statistics Service - www.nass.usda.gov/index.asp
Source: National Agricultural Statistics Service - www.nass.usda.gov/index.asp
-339 -62 -50 -21 -2 +/- 0 - +2 +7
Size <999
>1000 <9999
>10000 <49999
>50000 <99999
>1mi>.5 mil <1 mil
>.3 mil <.5 mil
>.2 mil <.3 mil
>.1 mil <.2 mil

21
Table 2. Top Ten Beef Slaughters and Estimated Daily Capacity for Each and Total Estimated Daily Capacity for FSIS Beef Slaughter - November, 2008
Company Name Daily Capacity Cargill Meat Solutions 25,850 JBS Swift1 25,800 Tyson Foods 27,375 National Beef Packing Co. 13,100 American Foods Group, LLC 5,200 Nebraska Beef, Inc. 3,000 Greater Omaha Packing Co. 2,650 Creekstone Farms 1,600 AB Foods 1,500 Sam Kane Packing 1,400 Top Ten Estimated Daily Capacity 107475 Total Estimated Daily Capacity Beef Slaughter 139000
Source: Sterling Marketing, Inc. 1JBS acquisition of Smithfield Beef Group approved October, 2008 Table 3. Percentage of FSIS Fed and Total Slaughter Large Plants (500,000+ annually)
Year % of FSIS Fed Slaughter % of FSIS Total Slaughter 1991 64.8 52.7 1992 74.5 60.2 1993 77.2 60.7 1994 80.8 65.2 1995 83.5 67.2 1996 82.1 63.2 1997 83.3 65.9 1998 83.9 68.6 1999 83.7 69.1 2000 89.1 74.0 2001 88.1 72.3 2002 85.2 70.3 2003 89.1 71.4 2004 78.8 65.3 2005 82.0 68.4 2006 84.0 69.2 2007 93.2 76.0
Source: National Agricultural Statistics Service - www.nass.usda.gov/index.asp

22
Nutrition Consulting - The Past, Present and Future
R. Hollis Klett, PhD Consulting Nutritionist
Greeley, CO
Nutrition consultants are entrusted to develop programs for their customers and are normally responsible for all aspects relating to feeding programs in their clients feedyards. This knowledge base has come from early books like Morrison’s Feeds and Feeding first published in 1898, Church’s Feeds and Feeding, NRC publications and research from both private and commercial sources. Much of our most recent support information is related to commercial and on new products introduced into the feeding industry and on by-products from the bio-fuel industry. The role of the consulting nutritionist is highly variable. Their exact responsibility is dependent on the extent that the feedyard wants them involved. It can range from participating in the management to ration formulation only. However, they are normally required to oversee the total feeding program which makes them responsible for not only cattle performance but also for maximizing cost of gain which affects the economic outcome of the cattle program.
Past The consulting nutritionist we know today has evolved from servicing small Midwest feedlots that produced their own feed. As feedlots moved west and became much larger, so began the profession of the Consulting Nutritionist. In the beginning, the nutritionist did not have to sell their program but rather had to sell the feedlot on the fact that they needed to use a nutritionist. The nutritionist has had to adapt to changing feed ingredients, feed additives, equipment such as micro machines, larger steam flakers, new feedmill designs and probably the biggest of all, computers and computer software.
Ingredients A number of ingredients used in the past are no longer available. Examples, to name a few are beet and citrus pulp, hominy, alfalfa cubes and beet molasses. A ration in 1975 might have been:
Ingredient Pounds Corn 1490 Alfalfa Cubes 245 Cane Molasses 80 Supplement 70 Cottonseed meal 60 Animal Fat 55 2000

23
Several of these ingredients have been replaced by corn bran, corn gluten, distiller’s grains and others from new technology and industries.
Energy Value Forty years ago TDN and estimated net energy (ENE) were widely used to provide energy values in formulations. Now the California Net Energy system is used. It was first proposed in 1968 and then appeared in the 1976 and 1984 NRC publications. It is now the predominate energy system used in feed evaluation by ruminant nutritionists.
Proximate Analysis The Proximate Analysis is still in general use. The use of ADF and NDF analyses have been added to more accurately measure fiber and soluble carbohydrate utilization. Protein requirements and utilization now are evaluated using UIP and DCP. Many new pieces of equipment are now found in labs that did not exist 35 years ago. This advancement in technology has made the consultant’s evaluation of feedstuffs more accurate and provides the science for many decisions they make today.
Feed Additives The Feed Compendium has provided a source of information relating to the use of all feed additives. Now, the same information is available on the product’s website. A list of some of the additives used both in the past and present is listed below. Feed Additives Past and Present
Bacitracin - Baciferm Neomycin/Oxytetracycline Bambermycins-Flavomycin & Gain Pro Poloxalene - Bloat Guard Chlortetracycline Rabon Aureomycin Ractopamine DES-Diethystilbestrol Tylosin - Tylan 100 Fenbendazole - Safe Guard Virginiamycin - V Max Laidlomycin - Cattlyst Zilpaterol Melengestrol - MGA Lasalocid - Bovatec Monensin - Rumensin
Many of the above are not available and some that were approved are not in use.
Implants The use of implants have remained as a tool to nutritionists. Diethylstilbestrol was the signature implant for many years. It has been replaced today by estradiol and trenbolone acetate (TBA). The development of TBA has probably been the greatest discovery in implant technology. The use of estradiol and TBA make up most of the present day commercial implants. Variances in
24
their concentration along with new technology controlling rate of release constitutes the family of implants now in use.
Other Nutrition Products Organic minerals were first developed in the early 1960’s. Their value relates to better absorption in the animal’s digestive system. Extensive research data are available on these products. Commercial buffers are now widely used to assist in maintaining normal rumen function. These have become important because of the high grain diets nutritionists are using to achieve better performance. Other nutrition products include probiotics, enzyme, specific amino acids, etc. These have been used very selectively. Research is continuing to try and find a routine place for them in the nutrition program.
Computers and Software In the ‘70’s, only a few computers were available to nutritionists for formulating. The old Sci Data System formed the basis of “least or best cost” formulation. Today there are many software programs in use. This is one of the most significant advancements experienced in the past 35-40 years. The computer has also become the “backbone” of feedlot management. The Feedyard software programs in concert with nutrition software have brought about many innovations that were not available before. This has brought about calculations and analyses can be made in minutes where before it took days.
Feedmill Designs In the past, “continuous flow” and batch mills were predominate. These are now being replaced by mills with bunkers and stationary mixers. A tractor has become the primary power source. These are cheaper to operate, cost less to maintain and are just as efficient.
Past to Present The transition of cattle feeding from the past to the present has been influenced by cattle marketing programs. This is evident when reviewing performance data for the past 21 years. These observations include almost 10,000,000 cattle. These data show that cattle are being fed longer and to heavier weights. Average daily gain and feed conversion appeared to be related to year effects and not heavier weights. Costof gains were relatively steady until 2007 and 2008 when commodity prices reached an all time high. The nutritionists have adapted their programs to meet the demand for producing heavier slaughter weights. Genetics has also helped to achieve this outcome.

25
Performance and Costs for Feedyard Cattle – Steers
Performance and Costs of Feedyard Cattle – Heifers
By Products The pressure to use alternative fuels to reduce the dependency on foreign oil has resulted in higher costs for feed ingredients. The feedyards and nutritionists have found it necessary to take advantage of by-products from the ethanol and bio-diesel industries. These products in addition to others such as sweet bran and corn gluten pellets are now major components of feedyard formulations.
Future for Consulting Nutritionist The future for nutrition consulting depends on what happens to the livestock industry. At present (4/01/09), it is very difficult to ascertain which direction the livestock industry will go. It is expected to continue in some form similar to the present. However , factors such as economy,
Year In Weight
Out Weight
Days On Feed
ADG Feed Conversion
COG
1988 683 1124 158 2.83 6.51 46.76 1992 705 1166 159 2.92 6.61 52.85 1996 690 1194 163 3.13 6.28 66.2 2000 692 1209 168 3.11 6.17 45.34 2004 683 1225 180 2.99 6.36 56.82 2007 691 1266 192 2.98 6.59 70.97 2008 697 1270 185 3.08 6.51 87.02
Represents 5,228,550 head
Year
In Weight
Out Weight
Days On Feed
ADG
Feed Conversion
COG
1988 614 999 145 2.66 6.65 49.43 1992 650 1053 152 2.69 6.72 55.32 1996 644 1095 159 2.87 6.51 69.91 2000 641 1107 170 2.78 6.41 48.51 2004 636 1115 177 2.69 6.64 60.31 2007 628 1150 195 2.65 6.83 74.35 2008 639 1157 183 2.79 6.75 91.79
Represents 4,372,009 head

26
environmental issues, animal rights and bio security may determine the direction taken in the future.
Economy This is the most immediate issue that has to be dealt with. It is too early to know what the passage of the stimulus bill will do for the general economy which could have an adverse effect on the livestock industry.
Environmental and Animal Rights The environmental and animal rights issues are the most serious issues to be dealt with in the future. This has to be dealt with through industry associations and legislation.
Bio Security Concerns about bio security have decreased as an issue at this time. However, it has not “gone away”.
Cow Numbers Also of concern is the decrease in cattle population. This is because of droughts, economics and urban development. Foreign countries such as Brazil will most likely become more involved.
Future Consulting Roles The day to day work of the consultant will probably not change much. What will change is the pressure to improve performance and profitability while dealing with other issues. The following areas may be considered in the future:
1. Become more involved as a management team member 2. Know what decisions management is making with regard to marketing 3. Provide a strong database so management can make risk management decisions 4. Be detailed in visits to the yards 5. Keep abreast of outside influences 6. Become involved in industry related associations 7. Become better business-minded

27
28
Feed Yard Operations and Management - Past, Present and Future
Jack Rhoades Senior Vice President, Cactus Feeders
Amarillo, TX Early in the decade of the 1960’s the high plains area had vast amounts of grain sorghum and wheat produced. Grain elevators were built and grain was stored under government loans. The grain would be sold at a price above the loan price plus storage. During this period most of this production was shipped to livestock operations in Arizona and California. Grain shipments were by rail on flat bottomed box cars and unloaded at the destination using mortar boards. Also, feeder cattle were sent to the west coast for finishing. Various grain and cattle entrepreneurs saw the obvious opportunity with the added benefit of a favorable climate and began building feed yard facilities in the high plains area. Once the building started the expansion was rapid and continued into the early seventies when over capacity and numbers of finished cattle caused a market crash lasting 19 months; at the time the longest in history. In 1970 total cattle inventory was 112 million head and continued going up to a peak of 132 million in 1975. During the cattle feeding facility build up phase finished cattle had to be sold and shipped out of the area into Kansas or the, so called, river markets in the Midwest until:
• 1968/69 Missouri Beef Packers at Friona, Texas began operations • 1971 Missouri Beef Packers at Plainview, Texas opened • 1975 Iowa Beef Packers at Amarillo, Texas began operations • American Beef Packing was built at Cactus, Texas in the early seventies and went
bankrupt in 1975 leaving many cattle feeders without payment. The prompt payment law was enacted shortly thereafter.
• 1980 Iowa Beef Packers in Finney county, Kansas opened During this period another phenomenon was occurring. The growth of grain elevators had begun on the south plains where grain production was occurring, however, once demand from cattle feeding sharply increased, and dropping water tables impacted production, grain inventories diminished. The south plains transformed from an area of grain abundance to one of grain deficiency. Simultaneously, the government began buying acres to keep them out of production and government storage payments became a thing of the past. This lead to a shift in grain production to the northern plains, where underground water was abundant and farming economics favored corn over grain sorghum. However, grain production in this region was not sufficient to meet regional demand; therefore it became necessary to import grain from the Midwest. Individuals, with the help of some industry organizations, approached railroad car manufacturers to build a hopper - bottomed, metal grain car. Railroad companies realized the market potential and when it all came together Midwest grain began to move to this area. Elevator operators that

29
had the financial strength began building unloading facilities to accommodate the rail cars and the unit train was born. Elevators without the capability to unload rail cars were unable to compete in the market and many were sold to the larger, financially stronger companies. After the market crash in the early seventies many cattle feeding facilities were for sale; cattle on feed numbers hit their low in 1975. Numbers subsequently increased back to average in the 7 million head range, however; there was not much growth until 1990. Cattle feeding in the high plains had found some stability and the industry began to mature. By 1980 the computer was widely used and for the first time we had daily yard and bunk sheets. Accounting and billing was made easier and close outs were quickly generated. More importantly, with the advent of the computer cattle performance information was readily available and used by management to better implement changes coming from research of new technologies, ration composition and feeding practices. As cattle feeding progressed through the eighties and the business stabilized, it was attracting more graduates from universities around the country with the effect of some university curriculums targeting feed yard management. The concept of value - based marketing became reality in the late eighties and has grown in popularity ever since. Today there is still much debate about the pros and cons of this practice, but the basic premise is that you are paid for what you produce and when correctly done will send accurate market signals up and down the production chain. During this era and continuing today regulations from agencies such as FDA, USDA, and EPA have grown and became more stringent. Many of the early regulations were reasonable and somewhat logical; however some of the recent environmental regulations and impending regulations have become onerous and illogical. Competition and economic efficiencies have led to consolidations in cattle feeding but have also forced the same practice in livestock allied businesses. Consolidation is occurring in feeder cattle procurement, the packing industry, retail and pharmaceutical sectors. In spite of popular opinion, labor and related problems have changed little over time. Quality, skilled personnel are still in demand. However, in most instances training of people has taken greater emphasis. On - the - job and safety training are common today. During the nineties many doctors, food nutritionist’s and dieticians declared a war on fat and market signals reverberated throughout the industry with the most significant change being in genetics used by cattle producers. Simultaneously, more branded beef products appeared in retail meat cases. As competition in the feeding industry became formidable, feed yard owners and managers sought ways to improve bottom line performance in cattle and in their operation. Management started thinking of innovative ways to do things and focused on areas where a process could be done cheaper or faster. Advancements included things such as bigger and fewer feed trucks,

30
faster and more mobile pen cleaning equipment that covered more ground in the same period. Feed milling enhancements lead to greater and more efficient feed production. Labor costs, which typically represent 50% of a feed yard budget, were closely scrutinized and numbers of employees have been reduced from 1.1 or more employee/1000 head to less than 1.0 employee/1000 head. The industry had morphed into a highly competitive business. Today we live in the age of readily accessible information, sophisticated equipment to monitor virtually every production aspect of a cattle feeding operation, from the biological to the mechanical. These advances no doubt contribute to live animal performance and along with genetic improvements have allowed feed conversions to come down and gains and out weight to go higher. Since pounds of saleable weight are the main economic driver in each level of beef production, animals today are finishing at weights never before experienced. Also today, news and market information are current and readily accessible. Commodity futures markets are necessary and are important to cattle feeding operators for mitigating risk. Brokers and producers (those in possession of the underlying asset) have regulated position limits. However, the Commodity Futures Trading Commission can grant exemptions and expand position limits which have allowed certain interests (funds) to amass huge positions in futures. There are pros and cons to whether this exemption is good. Increased volatility is a certainty. Electronic overnight trading of commodities allows for these markets to function while you sleep; now that’s progress! As stated earlier, environmental regulations have become increasingly onerous and impractical. Nutrient management plans are beneficial and most operators as good land stewards; realize the importance of balancing soil nutrients; this is reasonable. But when operators are forced to report calculated emissions in writing and orally to a county judge and impossible particulate emission controls are imposed, it’s unreasonable. We have an industry that has matured and become very efficient both biologically and operationally. With increasing regulations and without expanding global markets the growth of the industry will be limited. And regulations are not the only deterrent to growth. Well funded and very bold animal rights groups are getting their message out. Their negative messages concerning health and animal welfare issues are escalating even claiming that vegans are better lovers! The most damaging aspect of their agenda is the influence on our younger generation that portrays animals as human in books and on screen; the Bambi effect. They’ve been allowed to express their points of view in schoolbooks, their web sites portray anyone in production agriculture as a villain and cruel to animals in their care. The future of beef production is unclear. Will we continue to increase weights of finished cattle when today an 850 pound carcass is the average? What’s the incentive for innovations when new technologies come under attack and sound science is not allowed to prevail?

31
How long before even larger discounts are placed on heavy carcass weights? What’s the message to the consumer of natural and organic beef products? Will it make a difference knowing the country of origin? Today U.S. total cattle inventory is 95 million head, the smallest since January 1, 1959. Will cattle numbers ever grow again? Although the future of beef production today is unclear, imagine the uncertainties the early cattle feeding pioneers faced. They had vision and courage to follow that vision. Today we are benefactors of that vision. Our problems are different than yesterday but in spite of the problems, there will be survivors. The efficient, well financed operators will continue to produce safe, nutritious beef products, the preferred choice. We will be challenged by changes, but changes will be made and this industry will persevere and prosper. Sources: Dean Rhea, Rhea Commodities, Canyon, Texas Don Riffe, Stratford Grain, Stratford, Texas Paul Engler, Cactus Operating, Ltd. Amarillo, Texas Thanks to: Dr. Spencer Swingle, Cactus Operating, Ltd. Dr. Paul DeFoor, Cactus Operating, Ltd.

32
Feedlot Beef Production - Past, Present and Future Academics and Research
Fred Owens, PhD
Pioneer Hi-Bred Int'l Johnston, IA
Colleges, universities, and research institutions serve the beef industry primarily through teaching students, conducting pertinent research, and providing assistance and recommendations to individuals involved with the feedlot industry. Steps to enhance this service are outlined below.
Teaching/Instruction
Training of employees, of scientists (nutritionists, veterinarians), support personnel (from truck drivers and pen riders to accountants) and others (regulators, and legislators) is provided through formalized instruction at academic institutions. Through internships, mentor employers provide students with experience. On-the-job training for specific occupations typically follows a degree program. Although ignorance may be bliss, true appreciation depends on familiarity. Considering the physical isolation from its consumers and regulators, animal agriculture faces a growing predicament. According to the Geography of Agriculture, “Although 45% of the world's population makes their living through agriculture, the proportion of the population involved in agriculture ranges from about 2% in the United States to about 80% in some parts of Asia and Africa. There are two types of agriculture, subsistence and commercial. Millions of subsistence farmers in the world produce only enough crops to feed their families.” Unlike much of the world, the US has been blessed with an abundance of highly productive soils, a relatively stable climate amenable to crop and animal production, and a stable government that has encouraged competition and productivity by agricultural entrepreneurs. But with only 2% of the population involved in agriculture, consumers and typical (voting) citizens know little about routine agricultural practices and sustainability. People who adopt and endorse a vegetarian lifestyle typically lack a full understanding of the facts about agriculture and human nutrition. And legislators and regulators and their aides, both the state and national level, often are trained in political science, not agriculture. As a result, the scientific basis and practical aspects of agricultural production often are misunderstood or ignored when new laws are enacted or new regulations are proposed. How can the academic community deepen public knowledge about and appreciation for animal production?
1. Encourage development, assembly, and distribution of “white papers” that address topics of public and legislative concern. Providing the media (often uninformed or misinformed) with immediate access to such science-based documents should help counter unfounded challenges to animal agriculture. For credibility, these short, condensed papers should be prepared by independent scientists (e.g., Council on Agricultural Science and Technology; American Society of Animal Science) given

33
sufficient resources by industry (National Cattlemen’s Beef Association; American Feed Industry Association). To stimulate discussion about these topics at colleges, departments or outside groups could sponsor and give awards for oral presentations or debates on important issues. Potential topic areas might include:
a. Methane and Beef Production b. Beef and food safety: Control of E coli and salmonella c. Mad cow disease d. Animal welfare e. Bioterrorism and our food supply f. Impacts of beef production on air and water quality g. Beef production efficiency: Use of non-competitive feed resources h. Beef – A source of essential dietary nutrients i. Impact of animal products on human welfare in developing countries j. Biotech - Effects on production efficiency and food safety k. Antibiotic use in livestock production l. What animals versus people prefer in terms of environmental control,
exercise, space m. State and federal regulations and policies regarding care and use of
animals.
2. At Land Grant institutions, a general science course in agricultural production practices should be required of all students so that future consumers and voters recognize and appreciate the role of production agriculture in the US economy. Modern consumers may think that food is created at the grocery store or in a laboratory, not on a farm or ranch, and few children today have an uncle or grandparent on a farm where occasional visits will expose them to farm and ranch practices.
3. Equitation and companion animal courses provide students with an appreciation for
animals and animal agriculture. After my daughter discussed the importance of the rural mail delivery system in a Speech class at Cornell, one coed from Long Island asked, “What is a mail box?” Many students at this Land Grant school in upstate New York had never stepped foot on a farm and probably never will!
4. Exposure to animal agriculture can be increased by tours to or vacations at farms or dude
ranches, attendance at county and state fairs, petting zoos, and participation in 4-H and FFA. Elementary and secondary coursework packages designed by extension specialists and commodity groups for primary and secondary school teachers that discuss products, production, and nutrition can help increase public appreciation for agriculture. PETA and HSUS develop and distribute teaching aids and games to elementary teachers and often wage public awareness campaigns to raise funds by castigating animal agriculture. Consequently, it should come as no surprise when regulations, legislation, and referendums related to animal agriculture ignore scientific facts and adverse impacts on economic sustainability of livestock production and the availability and price of food.

34
Products with low cost (e.g., food in the US; free advice from a feedlot consultant) seldom are appreciated. But will higher food costs increase public appreciation of agriculture? Consider your own reaction to an increased cost of fuel. Do you appreciate oil companies more when you pay more for gasoline? Likewise, increased food costs in the future likely will be blamed on producers of agricultural products even though the true causes probably rest with higher input costs and more stringent local, state or federal restrictions and regulations. What molds the public view of animal production and livestock producers? Two touchpoints: Animals as pets and the news media. Most people are familiar with pets and pet care, but they also should be familiar with wild animals (pit bulldogs, mad chimps, tigers) that are intractable, and with exotic zoo animals that need to be confined to protect zoo visitors. People feed wild birds in their back yard but still attempt to control the population of ravens or blackbirds. They relish seeing wild deer except when one suddenly appears in their headlights. When viewed broadly, the public should comprehend readily the differences in cognitive ability and tractability of different animals. Diversity in viewing various species should improve public understanding of standard animal care practices (e.g., castration; horn tipping) involving the safety of humans and productivity of animals. When livestock in feedlots are equated to domesticated pets, their confinement and care is substandard, but when contrasted with wild ruminants (e.g., bison, deer, antelope), the health care and feeding of both grazing and feedlot cattle are highly commendable. Within the media, the viewpoints and opinions of reporters and broadcasters prevail. What makes headlines and draws readers and viewers? Sensational stories: Cases of animal abuse, inhumane management, livestock odors, overgrazing and erosion, antibiotic resistance attributed to livestock feeding, and food handling that can lead to food-borne disease and death. Officials responsible for enforcing numerous laws and regulations seldom are contacted about or interviewed during the brief news coverage. The viewer usually assumes such problems are widespread leading to doubt about the ethics and practices of the entire agricultural community. The public image of animal agriculture will not improve without some proactive effort. What steps by the academic community might help to enhance the image of animal agriculture in the US?
1. Industry and university groups should emphasize the low cost, the wide availability, and the wholesomeness of animal products.
2. Posted signs indicating that the average US farm or ranch provides food for 200 Americans should line every major interstate highway. Bumper stickers reading “If you were fed today, thank the US farmer” should be posted on every farm and ranch vehicle in the US.
3. With every piece of legislation and every new regulation enacted by a governmental agency, the Government Accounting Office should calculate and publicize both the short and long term annual cost for consumers. Effects of non-governmental policies [e.g., How much extra does the typical family pay to have their milk BST free?] also need more scrutiny and public attention. Such budgetary analysis could be mandated by congressional representatives from agricultural states.
4. Farms and ranches that have been controlled by the same family for generations should receive publicized awards to illustrate sound land stewardship.

35
5. Control of animal diseases and reduced exposure of animals and of humans to pathogens and pandemics should be contrasted with conditions of the past within the US (Foot and Mouth disease, brucellosis, and tuberculosis) that still remain in many parts of the world.
6. Informative science-based targeted publications are needed to update human nutritionists, dietitians and physicians about the value of animal products in the human diet in the US. Increased exposure and “white papers” should help educate editors and reporters provide balanced articles on issues.
7. International organizations need to be alerted to research that demonstrates the improvements in health and mental capacity of children attributable to an increased intake of animal products.
8. Studies that demonstrate the strong economic importance of animal agriculture in villages of developing countries need to be compiled and distributed to governmental agencies responsible for foreign aid programs. Groups endorsing increased animal production in developing countries (e.g., Heifer International; Winrock International) deserve commendation and support.
9. Cooking instructions and toll-free hotlines should be included on labels with all retail meat cuts. Posted diagrams showing the origin of various meat cuts are little help for consumers but instead often prove distracting.
10. In response to each instance of news coverage of an animal production issue, a designated spokesperson from the academic community should issue a press release that condemns illegal practices, points out to the news media the current regulations that are designed to prevent such problems, and indicates precisely who at what specific governmental agency is responsible for law enforcement. Distribution of the appropriate “white paper” to the media at this point also could help to educate reporters about specific issues.
Research/Extension
The first edition of Morrison’s Feeds and Feeding was published in the 19th century, so the scientific basis of animal nutrition has a long and colorful history. Most major problems in nutrition, health, and production of livestock have been solved. Only with sticker shock about the prices of grain or abrupt shifts in the availability of diet ingredients or additives is the expertise of the nutritionist truly appreciated. Likewise, veterinary care becomes routine and rightly involved more with prevention than with treatment until disaster strikes. The question is not whether disaster will strike, but when? Producers in North America have been extremely fortunate considering the many epidemic animal diseases on our doorstep. Considering the leaky borders of the US, it seems surprising that disease outbreaks (e.g., foot and mouth disease) have not occurred here. Despite its drawbacks, traceback systems to detect sources of problems are needed. Should border surveillance fail to thwart entry of epidemic animal diseases, the impact on food production in the US and overall effects on the US economy would be devastating both for animal producers and consumers. What research topics hold promise for animal agriculture in the face of these challenges?
1. Feedlot diets could be customized to meet requirements more precisely for specific animal types and ages, environmental conditions, and stress levels. In light of

36
environmental concerns, providing surplus amounts of certain nutrients must be avoided. The cost-benefit ratio of supplying energy or specific nutrients at levels below that needed to maximize gain and efficiency needs attention. Formulation must consider least-cost performance and least-cost production, not merely least-cost diets. . .
2. Feedlot production will benefit indirectly from improved precision of genetic selection of breeding stock based on gene markers. Expectations include improved disease resistance, production efficiency, and carcass marbling.
3. Competition from other industries and other livestock sectors with feedlots for commodities and for energy sources likely will increase. Unique advantages of ruminants include their capacity to graze and utilize forage inaccessible for mechanical harvest, to consume and utilize a wide diversity of feeds rich in fiber and high in water content, and to tolerate numerous feed-borne toxins. Dependence on industrial byproducts and feeds unsuitable for other uses likely will increase. This increases the need for rapid screening procedures to evaluate the safety and nutritive value of such feeds. As fuel prices rise, so too will competition for feed by-products (e.g., fermentation to produce methane; direct combustion to generate electricity).
4. Based on the BST story, mega-retailers that market animal products likely will play a larger role in restricting use of antibiotics, estrogenic and androgenic implants, and imposing animal care regulations in the future. Public perception, whether based on scientific facts or not, becomes reality. Public interest has expanded in the areas of humane animal treatment and the environmental and ecological impacts of livestock production. High and increasing standards in animal care, handling, and harvest should be expected from companies that market animal products. Mega-retailers can benefit from “Inspection Teams” with scientific expertise in animal care and animal health that can certify that production methods are safe and humane. Such teams will help retailers address consumer and stockholder demands. Supportive research in this area would include more detailed study of animal behavior and housing, and examination of the close interactions between nutrition, immunity, and health. Although behavioral studies will increase public focus on animal care and stress, practices may be detected that will improve efficiency and productivity of feedlot cattle.
5. Anticipating restricted use of antibiotics and the limited availability of new animal drugs and vaccines in the future, immune responsiveness is an exciting frontier in basic science. New and improved sanitation practices at feedlots including more sophisticated animal quarantine practices and shower-in shower-out facilities for feedlot employees and visitors can be expected. Probiotic therapies hold promise for overwhelming certain pathogens. Plants, herbs, and microbes are being screened in a search for “natural” antibiotic substitutes. But if a novel compound improves livestock production through controlling deleterious microbes, why should it not be classified as an antibiotic and classified as a new animal drug? Which is preferable? A new vehicle or drug (or spouse) that has not been extensively tested or a slightly used model with its known idiosyncrasies?
6. Future restrictions may limit use of androgenic and estrogenic hormones and anabolic agents in livestock production. Consequently, a deeper understanding about hormonal and genetic factors that control body composition and energetic efficiency (e.g., residual feed intake) is needed. Cloning technologies should help speed progress in this area. Conversely, if residue levels of specific hormones and anabolic agents in animal

37
produces could be elevated adequately and had effects on humans, beef could become a specialty product to make consumers leaner and more muscular! Elevated concentrations of certain residues might be desired by consumers in the future!
Several activities by which academic-industry interactions might increase feedlot efficiency and productivity as well as the image of animal production include:.
1. Re-classification of the Plains Nutrition Council as the “Great Plains Section” of the American Society of Animal Science (ASAS). Currently, feedlot research is divided among states in the Southern, Western, and Midwest sections of ASAS. Such division decreases interaction between research institutions and dilutes contact between producers and users of research information. Formal recognition of this new ASAS section would increase physical and fiscal funding for PNC meetings, lead to greater focus of individual and cooperative research on feedlot issues, and increase interaction between the feedlot industry and research students and faculty. Currently, the PNC and Southwest Nutrition Conference help fill this void on an informal basis, but unlike the swine industry, the cattle feedlot industry is divided and under-represented in terms of research support and recognition at the national level.
2. Establish committees within the most appropriate scientific or commodity organization (PNC, ASAS, Federation of Animal Science Societies, American Registry of Professional Animal Scientists, National Forage Testing Association, Feed Analysis Consortium, NCBA) to pinpoint researchable problems that need increased research attention and extension efforts. Possible areas:
a. Improved analytical expertise – Certification of feed analysis labs beyond forage analysis, e.g., special lipid procedures (DDGS), mycotoxin quantification, NIR development, organized ring tests, and publicize recommendations.
b. Data handling and analysis – Provide readers of published research with both beta and alpha statistics to avoid faulty interpretation and application of research findings.
c. Provide advice and assistance to individuals seeking to organize symposia and conferences and to publish proceedings related to pertinent feedlot issues.
d. Support joint or cooperative efforts of research teams to concentrate research efforts and to compile and analyze data on specific feedlot challenges (e.g., distillers’ product evaluation; feed additive value, waste management, E. coli screening). Teams should provide reports and summaries to the feedlot industry at trade meetings, not simply at scientific conferences.
e. Establish animal handling, health, and management certification criteria (similar to ISO-9000 methods) and organize evaluation teams to certify adherence at commercial production units similar to the Animal Care Committees at academic institutions.
f. Provide state and federal legislative committees, USDA program chairs, and project evaluation committees with biennially updated lists of the primary and important researchable problems in feedlot production, management, nutrition, and health.
In summary, academic institutions have helped train personnel involved with feedlot beef production and people that serve feedlots with services in terms of nutrition, health,

38
administration, accounting, and livestock and commodities trading. Diet formulation, grain processing, and animal handling and health care methods are based largely on research tests and findings from academic or research institutions. For the future, academic institutions should emphasize enhanced science-based education of voters, regulators, the media, and politicians concerning agricultural production, sustainability and appropriate food choices. In the face of continued scrutiny of agricultural production practices by animal activists, environmentalists, large retail firms, and governmental regulators, our academic institutions should work more closely with commodity groups to enlarge certification programs. Such programs can assure that practices involved with production of wholesome beef are founded on sound science in terms of animal and human welfare, product safety, and environmental stewardship. Overall, the feedlot industry has an outstanding record of providing the public with nutrient dense economical products that have improved the health and well-being of consumers. Activities to spread that message and improve the public image of animal production should increase consumer demand and enhance support of research to further improve feedlot productivity, efficiency, and sustainability.

39

40
Beef Marketing 101 + Ty’s 5 Rules of Engagement
Ty E. Lawrence, PhD West Texas A&M University
Canyon
Multiple marketing opportunities, including live-pen, carcass-pen, and carcass-individual merit are afforded to fed cattle producers. To maximize margin opportunities, cattle feeders must choose the marketing method that maximizes use of their available labor and knowledge resources. Producers whom choose the live-pen option market their cattle as an entire pen based on the prevailing live cattle price at the time of sale. In the live-pen market, the greatest risk and greatest reward are both held by the buyer of those cattle. The producer sells the cattle as they cross the feedlot scale, subsequently, the producers risk ends when the cattle leave the feedyard. Producers in the upper Midwest often choose the carcass-pen option by default as the live-pen option is not available. In this method, cattle are sold as a pen of hot carcasses. The greatest risk and greatest reward still remains with the buyer; however, this method carries more risk for the producer because of improper handling that may cause bruising and poor workmanship that may lead to excessive trim losses. Producers, whom choose the carcass-individual merit method, market each individual carcass on its own merit, based on hot carcass weight, USDA quality grade, USDA yield grade, and other quality or yield adjustments. In this method, the greatest risk and greatest reward remain with the cattle producer. The first rule of engagement is for producers to develop a non-adversarial relationship with one or more beef processors. Furthermore, I advise producers to learn and understand the meat business, to understand what the processor needs from the cattle feeder supplier, and to understand what the final customer is asking of the beef processor. The carcass-individual merit marketing method discounts producers for outlier carcasses, which include those outside a specified weight range, carcasses with inadequate intramuscular fat, and carcasses with excessive trimmable waste fat. Additional discounts may be imposed for other quality (advanced skeletal maturity, dark-firm-dry condition, ecchymosis, steatosis), yield (dairy-type muscling), or international trade (3 or more permanent incisors) attributes. To successfully manage margin opportunities when marketing carcasses on an individual merit basis, producers should adhere to the second rule of engagement - know with some level of confidence how the cattle will perform in the grading cooler. Unknown cattle are difficult to predict, even for a well-trained evaluator, and producers are advised to retain and utilize cattle grading history. To reduce the variation and therefore the opportunity for outlier carcasses, producers are advised to follow the third rule of engagement – sort cattle in a manner that allows them to accomplish rule 2. Producers also need to realize that the beef processor already knows more about their cattle than they do. I advise cattle feeders to become number crunchers, to learn how to manage populations and distributions, and learn when, where, and how to market their cattle. This knowledge begins with the understanding of carcass grid calculations. First, cattle feeders must understand the difference between fixed-value and variable-value premiums and discounts and how to manage the pen of cattle to optimize these value assessments. Fixed-value premiums (i.e. USDA Prime) and discounts (i.e. dark-firm-dry condition) are based on a set value whereas variable-value premiums (i.e. YG 1) discounts (i.e. YG 4) are often based on the average of a specific processing facility. In the variable-value scenario, the producer may only receive a premium for the percentage of YG 1 carcasses that exceed the average of the facility. In contrast, producers whom are able to market cattle that

41
have fewer YG 4 carcasses than the facility average may receive a “negative discount” (i.e. a premium). A key point of the variable-value scenario is that the processing facility average and therefore the marketing target are often based on a specific facility and may range widely with significant disparity amongst regions of the cattle feeding complex. Furthermore, cattle feeders must understand the importance of selling carcasses on the correct grid; do not sell high yielding cattle on a quality based grid and do not sell high quality cattle on a yield based grid. The final rule of selling carcass on a merit basis is to understand that feeding to USDA Choice may not maximize revenue. Producers should to be aware of the historical Choice-Select spread and are advised to purchase feeder cattle with the estimated value spread at the time of sell in mind.

42
Direct-fed Microbials for Growing and Finishing Cattle
Mike Brown and T. G. Nagaraja1 Feedlot Research Group, West Texas A&M University, Canyon
Department of Diagnostic Medicine and Pathobiology, Kansas State University, Manhattan
In 2008, livestock producers were exposed to higher prices of many commodities. The December 2008 corn futures contract encompassed a peak of nearly $8.00/bushel and a low of approximately $3.30/bushel. These higher input costs for feed grains and other ingredients placed renewed emphasis on the efficiency of converting feed into live or carcass weight to minimize cost of gain by feedlot cattle. Direct-fed microbials are one broad category of technologies that can improve production efficiency. Commercially available products range from extracts of fungal cultures to viable cultures of fungi and bacteria. Added emphasis has been placed on direct-fed microbials in the production of natural beef because a number of safe, highly efficacious products that improve production efficiency cannot be used in natural beef programs. However, natural and organic beef production in the 4th quarter of 2008 accounted for only 1.8% of the quantity of retail beef sold and 2.8% of retail beef revenue (NCBA, 2009). The objective of this paper is to describe the modes of action and expected growth performance response of commercially available direct-fed microbials for growing and finishing cattle. Readers are referred to previous reviews of direct-fed microbials on ruminal fermentation (Martin and Nisbet, 1992) and on ruminant performance (Krehbiel et. al, 2003).
Value of performance improvement VetLife (2004) conducted a population-level analysis of the practical responses from feeding direct-fed microbials (DFM) using the Benchmark database. Although data did not differentiate between specific products, they provide useful insight into the full compliment of effects that DFM may possess. Data were supplied to the database by feedyards participating in the Benchmark program, and feedyards were surveyed regarding use of DFM during a specific time frame (118 responding feedyards used DFM and 149 responding feedyards did not). Closeout records from those feedyards (10,900,504 cattle) from 1 Januray 2003 to 31 May 2004 were utilized in the analysis, which was balanced for location, grain processing, cattle weight, season, and feedyard size. Across all weight classes, steers fed a DFM gained weight 1.9% more rapidly (3.19 vs 3.13 lb/day; P < 0.05) and required 1.9% less feed/unit of gain (6.24 vs 6.36; P < 0.05) than steers that did not receive a DFM. Heifers fed a DFM gained weight 1.4% more rapidly (2.89 vs 2.85 lb/day; P < 0.05) and required 3.9% less feed/unit of gain (6.42 vs 6.68; P < 0.05). The impact of DFM on health was also assessed. Cattle with less than $20/animal in processing and medicine costs and fed a DFM displayed 3.75% greater ADG than cattle not fed a DFM, but this improvement became approximately 8.5% for cattle with > $20/animal in processing and medicine costs. Death loss was reduced by 0.15 percentage points for cattle fed a DFM and having an initial weight of 700 to 799 and 800 to 899 lb (P < 0.01), but death loss was not altered 1 Correspondence: M. S. Brown (phone: 806-651-2559, fax: 806-651-2504, e-mail: [email protected]) and T. G. Nagaraja (phone: 785-532-1214, fax: 785-532-4851, email: [email protected] ).

43
by feeding a DFM for cattle with an initial weight < 700 lb. These population-level data suggest that DFM improve growth performance, that the performance improvement may be greater in higher-risk cattle and heifers, and that mortality by cattle with an initial weight of 700 to 900 lb is reduced. However, these data not describe the efficacy of individual products under controlled conditions to allow differentiation among currently available products. Each experiment conducted represents a balance between available resources and statistical sensitivity. This trade-off is particularly important for extrapolating growth performance data to commercial production. Often times, replication in a given study falls short of the needed sensitivity to declare statistical significance of responses that are less than approximately 5% in magnitude. All practitioners accept risk in the process of selecting and recommending technologies for purchase by clients. This risk becomes less as the quantity and repeatability of data for a given product becomes greater. Ultimately, the magnitude of response that is needed in production to warrant incorporation or use in an economically favorable manner will depend on the cost of the product or technology and indirect costs of implementation. For example, a 3% improvement in feed efficiency from reduced DMI (same ADG) would have an approximate value of $9.90/head for a ‘typical’ steer consuming 22 lb of DM over 150 days if the ration cost (including markup for yardage) is $200/ton of DM (Table 1). Improvements in production that are economically important may be smaller than those that are often detectable in single, controlled experiments, although meta-analysis is a useful tool to assess responses for multiple trials where available. Thus, there is no assurance that a numeric improvement in performance will be a repeatable response until sufficient data are available to evaluate. A key determinant regarding whether a product is utilized within a specific facility is the cost required to receive the demonstrated benefit. Growth-promoting implants have long been the products with the most attractive cost:benefit, which many might describe as > 15:1. If we assume that some product will improve feed efficiency of this ‘typical steer’ by 2% with a ration cost of $200/ton of DM, one would essentially save $6.50/animal during the feeding period (Table 1). The ratio of the added cost from the product relative to the $6.50 gained would be 15:1 if the added cost was $0.43/head for the 150-day feeding period (Figure 1), but this ratio is reduced to 5:1 if the added cost totals $1.30/head. Each nutritionist and(or) feedlot manager will determine the cost:benefit needed that warrants utilizing a given product rather than directing that capital to other uses such as competing products, employee training, facility improvement, placing more cattle on feed, etc. The subsequent discussion will focus on observed production efficiency responses and potential modes of action of DFM products available today. We have strived to present a complete listing of commercially available products in each category (Table 2); however, we recognize that we may have inadvertently omitted some products and likely present less than the entire database that may exist for a given product. The following product categories and specific products within categories are not listed in any particular order.

44
Fungal-origin products Extracts of Aspergillus oryzae Amaferm (strain NRRL -458; Biozyme Inc., St. Joseph, MO) has been commercially available for many years, but the vast majority of the focus has been on dairy cow applications. Dhuyvetter et al. (1995) fed a 55% concentrate diet to growing heifers (12 pens of 7 head each) for 84 days in a 2 x 2 factorial of GainPro (+ or -) and Amaferm (+ or -). Heifer DMI was not altered when either product was fed alone, but DMI was reduced (0.25 lb/day) when both GainPro and Amaferm were fed together. Heifer ADG and feed efficiency were improved 5 to 6% when either Amaferm or GainPro were fed, whereas the response was largely additive for both ADG and feed efficiency when both products were fed. Allison and McCraw (1989) fed corn silage-based diets with either 0 or 2.5 oz of VitaFerm/day (Amaferm content not specified) to 56 growing steers (2 pens/treatment) over 126 days (initial weight = 506 lb). Overall ADG did not differ between treatments; steers fed VitaFerm gained 2.43 lb/day, whereas steers fed the control diet gained 2.34 lb/day. Biozyme (1985) reported on an experiment evaluating diets containing 2 or 3 oz/day of VitaFerm without an ionophore, and in diets containing Rumensin and Tylan (30 and 15 g/ton, respectively) with 0 or 2 oz/day of VitaFerm. Steers began the study weighing 755 lb and were fed for 129 days (12 pens/treatment, 10 steers/pen). Overall ADG was improved by feeding 2 oz of VitaFerm/day when Rumensin and Tylan were not fed. However, feed efficiency did not differ among treatments. A newly developed product known as Amaize (Alltech Inc.) that possesses alpha amylase activity was tested by Tricarico et al. (2007). In Exp. 1, yearling steers were fed finishing diets based on steam-flaked corn with alfalfa hay or cottonseed hulls as the roughage source (included at 5.7% NDF from roughage) with or without Amaize (0 or 950 dextrinizing units/kg DM) until slaughter (6 pens/treatment). The effects of roughage source and extract inclusion did not interact with growth performance data; neither roughage source nor extract inclusion altered performance. However, feeding the extract numerically reduced gain efficiency when alfalfa hay was fed, but numerically increased gain efficiency when cottonseed hulls were fed. In Exp. 2, yearling heifers (4 pens/treatment, 4 head/pen) fed either 580 or 1160 units of enzyme activity/kg of DM gained weight 8.9% more rapidly than heifers that did not receive the extract in 85% concentrate diets based on either high-moisture or dry-rolled corn, but gain efficiency was not altered. Growth performance was not altered by extract inclusion in the third experiment in which DMI was restricted to achieve a programmed rate of gain. Supplemental amylase does not increase the extent of starch digestion in the rumen, but alters fermentation products (increased butyrate and decreased propionate molar proportions) suggesting altered microbial activity. Based on pure culture studies, the proposed mode of action of supplemental amylase is that the intermediate products of starch degradation (amylodextrins, maltotriose, maltose, glucose, etc.) from amylolytic bacteria cross feed nonamylolytic bacteria resulting in increased starch utilization and altered fermentation products (Tricarico et al., 2007).. Yeast cultures Data describing the response by finishing cattle to Diamond V XP yeast (Saccharomyces cerevisiae and growth medium) were reported by Hinman et al. (1995). Yearling steers were fed

45
diets based on barley and potato processing residue for 115 days that did or did not contain XP (6 pens/treatment, 6 head/pen). The feeding rate for XP was 85 g/animal daily for 28 days and 28 g/animal daily from day 29 to slaughter. Feed intake did not differ among treatments (9.64 and 9.83 kg/d for – and + XP), whereas ADG (1.46 and 1.56 kg/day; 6.8%) and gain efficiency (151.8 and 158.3; 4.3%) were improved by XP. Cole et al. (1992) conducted two experiments with stressed calves fed XP. In Exp. 1, growth and health performance were not altered by feeding 0 or 0.75% XP (48 g/day). In Exp. 2, growth performance was not altered by XP, but calves fed XP (0.75, 1.125, and 1.5%) required fewer days of treatment for respiratory disease. Zinn et al. (1999) fed stressed calves XP for 28 days of a 56-day study (28.4 g/day; 4 pens/treatment). Growth performance was not altered by treatment, whereas calves fed XP displayed lower morbidity (19.6 and 41.1% for + and – XP). Belknap et al. (2007) fed recently weaned steers and heifers 0 or 0.25% XP (targeting 14 g/day) for 28 days (7 to 8 calves/pen, 5 pens/treatment). Calves were previously creep-fed for 111 days and were weaned from a resident cow herd the day before the study began; no transportation was required to relocate calves for the study. However, calves were medicated with chlortetracycline and sulfamethazine. Calves fed XP were 9 lb heavier at the end of the study due to more rapid ADG (8% greater) than control calves. Feed efficiency did not differ among treatments because calves fed XP tended to consume more feed. Amaferm may improve the efficiency of growth in growing and finishing, but few data are available. Diamond V XP has reduced morbidity of stressed calves and has improved the efficiency of growth by healthy cattle. Active, lyophilized yeast Two experiments were reported by Keyser et al. (2007) examining growth and health performance by stressed calves fed ProTernative SF (Ivy Natural Solutions, Overland Park, KS), which contains Saccharomyces cerevisiae yeast (subspecies boulardii CNCM I-1079). Heifers in two Exp. were fed 65 to 70% concentrate diets with or without 0.5 g of ProTernative/day over 35 days. In Exp. 1 (15 pens/treatment), heifers were given a metaphylactic dose of florfenicol at processing. Growth performance was not altered by treatment, but morbidity was reduced by feeding ProTernative SF (14 vs 24% morbidity). In Exp. 2, heifers were not given a metaphylactic dose of antibiotic. Neither growth performance nor morbidity was altered by ProTernative; however, morbidity was numerically reduced by ProTernative SF (33 vs 40%). A third experiment with the same treatments (M. Brown, unpublished observations) was conducted in 2007 with newly received heifers (10 pens/treatment) fed for 35 days. Feed intake, ADG, and feed efficiency did not differ among treatments (11.6 lb/day, 2.71 lb/day, and 4.31:1 for control and 11.2 lb/day, 2.71 lb/day, and 4.14:1 for ProTernative SF). Morbidity was not altered by treatment, but the numeric reduction in the number of heifers treated more than once for respiratory disease (39%) was similar in magnitude observed by Keyser et al. (2007) in Exp. 1. Bechtel et al. (2006) evaluated ProTernative CF (Saccharomyces cerevisiae subspecies boulardii CNCM I-1077) in a 112-day finishing study with yearling steers. Treatments included a control diet with Rumensin and Tylan (RT; 30 and 7.5 g/ton, respectively), control plus ProTernative CF (0.4 g/animal daily), and ProTernative CF without Rumensin and Tylan (8 animals/pen, 7 pens/treatment). Steers were fed a 93% concentrate diet based on steam-flaked corn. Feed intake tended to be greater for ProTernative CF without RT than for the control diet (24.7 vs 23.8

46
lb/day), and ADG was increased for ProTernative with RT compared to the control (4.18 vs 4.00 lb/day). Feed efficiency was not different across treatments. Saf Agri manufactures a Saccharomyces cerevisiae product, Procreatin-7, and the heat-stable version, Biosaf. Garcia Estefan (1999) fed yearling heifers an 87% concentrate diet based on steam-flaked corn containing 0, 5, or 20 g of Biosaf/day for 142 days (3 pens/treatment, 70 heifers/pen). Heifers fed 5 and 20 g/day gained weight more rapidly (1.18 and 1.27 kg/day) than heifers that did not receive Biosaf (1.12 kg/day), and consumed more feed (7.93 and 7.67 kg/day, respectively) than heifers that did not receive Biosaf (7.36 kg/day). Thus, feed efficiency was not altered by treatment. Alltech Inc. has compiled a great deal of data on the efficacy of Yea-Sacc (8417 and 1026) in numerous beef production systems around the world. However, data discussed here reflect those derived from studies approximating production conditions in the US. Dawson (1994) fed steer calves (500 lb initial weight) 10.5 or 12.5% CP diets based on corn silage (no ionophore) with 0 or 10 g of Yea-Sacc 8417/day for 88 days(6 pens/treatment, 4 steers/pen). The effects of CP and Yea-Sacc did not interact for growth performance data. Feeding Yea-Sacc increased ADG by 8% at both dietary CP (2.50 vs 2.70 lb/d at 10.5% and 2.96 vs 3.21 lb/d at 12.5% CP) and increased DMI by 6% at 10.5% CP and 3% at 12.5% CP. Thus, feed efficiency was not altered by Yea-Sacc. Using early-weaned heifer calves (324 lb), Anderson (1993) reported that heifers fed Yea-Sacc (15 g/d) gained weight more 11% rapidly (2.14 and 2.38 lb/d for 0 and 15 g/d) than heifers fed a control ration in a 55-day growth study (3 pens/treatment, 8 head/pen). Heifer DMI was numerically greater for heifers receiving Yea-Sacc (12.96 and 13.76 lb/d), whereas feed efficiency was not altered by treatment (6.06 and 5.78 for 0 and 15 g/d). McLeod et al. (1991) fed 551-lb steers a 70% concentrate diets for 112 days. Treatments included 0 or 2000 ppm Yea-Sacc 1026 and 0 or 25 ppm monensin (3 pens/treatment, 6 head/pen). Yeast tended to increase steer ADG, but monensin did not alter ADG (1.28, 1.32, 1.37, and 1.36 kg/d for negative control, monensin only, yeast only, and the combination). Yeast tended to increase DMI, whereas monensin reduced DMI (10.63, 9.46, 10.77, and 10.15, respectively). An interaction between yeast and monensin was evident for feed efficiency; feed efficiency was the poorest for the control, intermediate for yeast only and the combination, and the most ideal for monensin (8.26, 7.19, 7.88, and 7.45 for negative control, monensin only, yeast only, and the combination). Thus, Yea-Sacc achieved approximately 1/3 the improvement in feed efficiency that was obtained with monensin alone. In a finishing experiment, Birkelo (1994) fed 0 or 10 g/day of Yea-Sacc to yearling steers fed 90% concentrate diets for 95 days (12 pens/treatment, 9 steers/pen). Steer DMI was not altered by feeding Yea-Sacc (24.7 and 24.8 lb/d for 0 and 10 g/d), but ADG was increased by 4.3% (3.72 and 3.88 lb/d for 0 and 10 g/d). Feed efficiency was numerically improved by 6.5% by Yea-Sacc. Bovi-Sacc is a newer product developed by Alltech that is a combination of Yea-Sacc 8417, mannanoligosaccharides, and a lactate-producing bacteria. A pilot study (Alltech Inc., unpublished observations) conducted in a commercial feedyard tested 0 or 10 g/day Bovi-Sacc in finishing diets without an ionophore (3 pens/treatment, 100 head/pen). Average daily gain was not altered by treatment (2.29 and 2.34 lb/d for 0 and 10 g/d), but feed intake was reduced 7.6% (18.3 and 16.9 lb/d) by Bovi-Sacc. Thus, feed efficiency was improved 8.8% (7.96 and 7.26)

47
when cattle were fed Bovi-Sacc. In a subsequent study (V. Anderson and J. Schoonmaker, unpublished observations), steers were fed 85% concentrate diets with either monensin (27 g/ton) or Bovi-Sacc. Cattle were fed for 154 days (4 pens/treatment, 8 head/pen). Overall ADG (3.07 and 2.93 lb/day for monensin and Bovi-Sacc), DMI (21.7 and 21.4 lb/d), and feed efficiency (7.0 and 7.3) were not different among treatments. These data suggest that the collection of components in Bovi-Sacc may reduce DMI as opposed to the increase typically seen with yeast feeding. Rossi (2006) fed calves (528 lb initial weight) a control diet based on corn silage without monensin, 250 mg/day monensin, or 8 g of Yea-Sacc 1026 and 8 g Bio-Mos/day for 84 days. Performance was not altered by treatment, although feed efficiency was numerically improved 10.5% by monensin and 3.5% by Yea-Sacc and Bio-Mos. ProTernative SF seems to be beneficial for reducing morbidity in stressed calves that are fed an ionophore, but improvements in performance during short feeding periods of approximately 40 days may not be likely. ProTernativeCF appears promising and seems to increase DMI and ADG with no change in the efficiency of growth. Yea-Sacc studies discussed have involved healthier cattle primarily fed higher forage rations. These data suggest that cattle fed Yea-Sacc may eat more feed and gain more rapidly (approximately 3% or more) than cattle not receiving the product.
Active, lyophilized bacteria
Chr. Hansen manufactures Probios (L. acidophilus, L. planetarum, L. casei, and E. faecium) for beef cattle applications. Although Chr. Hansen has been involved in several experiments in Canada exploring the mode of action of existing or developmental bacterial DFM, production study data available from 6 reports were presented by Krehbiel et al. (2003) and are briefly summarized here. Feeding the product at processing and(or) throughout the entire feeding period of newly received calves (approximately 30 days) improved feed efficiency 6% across trials. Brown et al. (2006) conducted a finishing study to evaluate the efficacy of Micro-Cell LA (L. acidophilus BG2FO4; Lallemand Animal Nutrition) and Micro-Cell PB (P. freudenreichii P-63). Yearling steers were fed a 91% concentrate diet with either tap water or Micro-Cell LA for 28 days followed by Micro-Cell PB until slaughter after 140 days on feed (10 pens/treatment, 10 steers/pen). Steer DMI (20.6 and 20.2 lb/d), ADG (3.59 and 3.57 lb/d), and feed efficiency (5.78 and 5.70) were not different between steers fed the control diet and those fed Micro-Cell, respectively. Krehbiel et al. (2004) reported that growth performance was not altered by yearling steers fed a 90% concentrate control diet or the control diet with Micro-Cell LA followed by Micro-Cell PB (6 pens/treatment, 6 steers/pen). However, Huck et al. (2000) indicated that ADG and feed efficiency were improved 5% by finishing heifers fed Micro-Cell LA for 28 days followed by Micro-Cell PB. Nutrition Physiology Corp. has accumulated a substantial database of controlled studies with strains of L. acidophilus and P. freudenreichii in their Bovamine product as well as developmental strains. In an early study in which a 90% concentrate diet without an ionophore was not fed to yearling steers (5 pens/treatment), Bovamine reduced DMI by 6.8% and improved feed efficiency by 6.5% (Nutrition Physiology Corp., unpublished observations). Krehbiel et al. (2003) summarized data from 6 studies involving 1249 cattle in 184 pen observations. Across all treatments involving multiple doses and strains, DMI was increased 1.6% (9.22 and 9.37 kg/d) and ADG was increased 2.6% (1.56 and 1.60 kg/d) by feeding the

48
bacterial direct-fed microbials; feed efficiency was not altered among treatments (5.92 and 6.02 for with and without the direct-fed microbial, respectively). A summary of 7 steer studies (including Holsteins) involving 1,100 cattle that were conducted from 2003 to 2006 (Nutrition Physiology Corp., unpublished observations) indicated that DMI was not altered by Bovamine (19.74 and 19.89 lb/day for without and with Bovamine), but ADG was increased 2.3% (3.54 and 3.62 lb/day) and feed efficiency tended to be improved 1.6% (5.57 and 5.48) by feeding Bovamine for an average of 210 days. Since the 7-trial summary was prepared, an additional 5 finishing studies have been conducted with basal diets ranging from 0 to 30% distiller’s grains with solubles. Vasconcelos et al. (2008) reported that feed efficiency was improved 2.9% for steers fed Bovamine (averaged across three dosages of L. acidophilus) in two experiments (12 pens/treatment and 5 steers/pen in each Exp.), although DMI and ADG were not influenced by treatment. NPC (2008a) reported that growth performance over 168 days was not altered by feeding Bovamine in diets with 18% wet corn distiller’s grains with solubles compared to a non-medicated control diet (8 pens/treatment, 10 animals/pen), but liver abscess incidence was reduced when Bovamine was fed (39 vs 24%). NPC (2008b) fed diets containing 30% wet corn distiller’s grains with solubles with Rumensin and Tylan for 143 days to steers receiving the control diet or the control diet with Bovamine. Growth performance did not differ among treatments. NPC (2008c) indicated that adjusted feed efficiency was improved when Bovamine was fed (6.11 vs 6.30) in diets containing 30% wet corn distiller’s grains with solubles compared to a control diet (10 pens/treatment, 7 animals/pen). The manufacturer is in the process of conducting a meta-analysis of these three distiller’s experiments with other previous research involving wet corn gluten feed for greater insight into efficacy in byproduct-containing diets. The most studied DFM, Bovamine, seems to increase the efficiency of growth by 1.5 to 2%. A smaller number of studies by Lallemand with Micro-Cell LA and PB suggests that a comparable improvement in efficiency may be expected. The earlier data on Probios that up to a 6% improvement in the efficiency of growth by newly received calves may be expected.
Mode of Action
General Direct fed microbials exert their effects on the microbial flora of the gut, which could be in the rumen or at the lower gut, both in the small and large intestines (Figure 2). The influence on gut microbes is based on the information derived from the following areas of investigation in relation to feeding of DFM (Fuller, 1999; Huber, 1997; Nagaraja et al., 1997)
a. Changes in the numbers and population types of bacteria in the lower gut (contents or feces) or in the rumen.
b. Changes in the metabolic activity, measurable by fermentation products changes without detectable changes in the composition of the bacterial flora in the lower gut or in the rumen.
c. Reduction in clinical or subclinical infections and/ or increased animal performance (weight gain, feed conversion, milk production, etc).

49
Changes in numbers and population types are often assessed by enumerating bacterial genera or functional groups of bacteria such as lactobacilli, bifidobacteria, or coliforms, which often fail to detect more subtle changes at the species or strain level. When lactic acid-producing bacteria, such as lactobacilli, are fed to animals, there is frequently (but not always) a detectable increase in the viable counts of the organisms fed. Although changes in composition of gut flora are interesting, they are not very meaningful in terms of the importance of these changes to the host. However, changes in the metabolic activity of the gut flora can be more readily related to the physiology of the host. Information on the mode of action of bacterial DFM with regard to microbial changes or even changes in fermentation products is sparse and their propensity to colonize the gut is seldom assessed. However, there are some studies concerning mode of action of fungal cultures. In cattle, changes in the ruminal bacterial flora have been documented with supplementation of fungal DFM, yeasts and Aspergillus oryzae (discussed below). Yeast is an obligate aerobe and is not likely to grow in the anaerobic environment of the rumen, but still has stimulating effects on the growth of bacteria (Martin and Nesbit, 1992). Generally, bacterial DFM is assumed to impact more in the lower gut region and fungal DFM more in the rumen. Active, lyophilized bacteria In case of bacterial DFM, questions that have not been addressed are whether the organisms can overcome the ruminal microbial barrier to exert any effects in the intestine and even whether there are any ruminal fermentation effects. There are some reports of lactobacilli feeding on alterations in ruminal fermentation products, but the results are highly inconsistent. Although it is accepted that DFM have impact on gut microbial ecosystem, there is no agreement as to how these changes are brought about. However, several mechanisms are proposed (Figures 2 and 3). Production of antimicrobial substances. A wide variety of antimicrobial substances are produced by probiotic bacteria. They include organic acids, bacteriocins, hydrogen peroxide, etc. Organic acids, mainly lactic acid and VFA, suppress intestinal pathogens. Many of the DFM, such as Bifidobacterium, Enterococcus, Lactobacillus, Pediococcus, and Streptococcus, are better adapted to grow in acidic conditions than are pathogens like E. coli and Salmonella. Bacteriocins are proteins or peptides produced by certain bacterial species that have narrow spectrum activity, generally against closely related bacteria. Bacteriocin activity has generally been demonstrated in in vitro studies, however, their role in the gut in altering bacterial flora has not been demonstrated. One limitation of bacteriocins is whether, being a protein, they can survive digestion by the host. Hydrogen peroxide, a metabolite of certain bacteria, can have a direct antibacterial effect, but again there is little evidence of its activity in the gut. Competition for attachment sites. The persistence of bacteria in the intestinal tract is generally facilitated by their ability to attach on to the wall, thereby resisting being flushed out by the normal peristaltic activity of the gut. Therefore, it is logical to suggest that if the sites on the wall are saturated with beneficial bacteria, pathogens like E. coli, Salmonella, will be unable to colonize the gut.

50
Competition for nutrients. Microbes that enter the gut should be able to utilize the available nutrients. Because gut contents are rich in nutrients, it is difficult to accept that nutrients could be limiting for microbial growth. However, a limitation of one nutrient may be sufficient to limit the growth of bacteria. Immunostimulation. Gut-associated lymphatic tissue, located just below the mucosa, is the first responder to provide defense against antigens and pathogens. The secretory immunoglobulins (mainly IgA and to some extent IgG) are the main protecting mechanism. The cell mediated immune response is mediated by macrophages and cytotoxic T cells. Oral intake of lactobacilli, in some instances, has been shown to increase IgA secretion. The normal microbial flora stimulates the immune defense of the gut and it is speculated that probiotics may share common antigens with that of the indigenous flora as well as invading pathogens. Certain bacterial DFM are believed to improve ruminal function. Feeding of lactate-producing DFM (Lactobacillus, Enterococcus, etc) alone or in combination with lactate-utilizing bacteria (Propionibacterium) have shown some indications of reduced ruminal acidosis (higher ruminal pH, increased acetate, or alteration systemic acid base variables) (Ghorbani et al., 2002; Elam et al., 2003; Nocek et al., 2006). The concept behind elevation of ruminal pH with a lactic acid producing DFM is that production of a ‘tonic’ concentration of lactic acid may stimulate and sustain an active population of lactic acid utilizers in the rumen (Nocek et al., 2003). It is difficult to believe that feeding a DFM is needed to produce a tonic concentration of lactic acid, when rumen is loaded with lactic acid-producing bacteria, particularly in cattle that are supplemented with grain. However, there is evidence of reduced ruminal acidosis with feeding of Enterococcus faecium or Lactobacillus sp., alone or in combination with Propionibacterium (Ghorbani et al., 2002; Nocek et al., 2006; Oetzel et al., 2007). Fungal DFM It is generally believed that fungal cultures mediate their effects via ruminal microbes, primarily bacteria and fungi, but not ciliated protozoa (Figure 4). Certain yeasts and aerobic fungi are present in the ruminal contents, but most are few in number, transient and nonfunctional. There is some question whether yeasts can multiply or even remain viable in the rumen, because of anaerobioisis. Apparently, viable cells are required because autoclaving yeast culture destroys its efficacy in altering ruminal fermentation. Yeasts or AO extract have been shown to increase the number of ruminal bacteria (Beharka and Nagaraja, 1998; Mutsvanaga, et al., 1992; Newbold et al., 1995) and alter the fermentation products (increase the proportion of propionic acid [Newbold et al., 1995] and decreased lactic acid concentration). Among ruminal bacteria, two functional groups, fiber digesting and lactate utilizing bacteria, are stimulated by inclusion of fungal cultures (Callaway and Martin, 1997; Martin and Nisbet, 1992). How exactly yeasts and AO stimulate microbial growth is unknown. It is theorized that yeasts and AO provide micronutrients (“unidentified growth factors”). The stimulation of fibrolytic bacteria could explain the increase in fiber digestibility reported from in vitro, in situ and in vivo studies. Additionally, increased ruminal lactic acid utilization in the rumen because of increased growth of lactic acid fermenters could result in higher ruminal pH thus favoring increased fiber digestibility (Nisbet and Martin, 1992). More importantly, AO extract stimulates growth of ruminal fungi by almost 20%, and it is well established that ruminal fungi are active in digesting

51
fiber. Apparently, part of the response is brought about by stimulation of ruminal fungi by AO extract. Fungal cultures may stabilize the ruminal environment by alleviating the depression in ruminal pH in cattle fed grain-based diets. The higher pH is often associated with lower lactate concentration in the ruminal fluid, particularly in in vitro fermentation studies with rapidly fermentable substrates. The reason for increased lactate utilization is because of stimulation of bacteria, such as Selenomonas ruminantium, and Megasphaera elsdenii, two dominant lactate utilizing bacteria in the rumens of grain-fed cattle (Martin and Nisbet, 1992). The stimulation of growth is probably because of increased lactate uptake caused by yeasts or AO extract.
Food Safety implications of DFM
The use of DFM for preharvest food safety, which is basically intended to displace or inhibit food-borne pathogens in the gut to reduce their shedding in the feces, is not a new concept. The term that is applied to describe microbial feed supplements intended to reduce or eliminate gut pathogens, and therefore, improve host health is competitive exclusion (CE). The basis for feeding DFM to exclude pathogens stems from the understanding that normal and healthy gut flora are required to protect host animal against colonization of the intestinal tract by non-indigenous microorganisms. Support for this concept comes from three types of experimental evidence:
1. Germ-free animals are more susceptible to intestinal pathogens than conventional animals with normal gut flora.
2. Administration of antibiotics to animals that reduce or deplete normal gut flora makes them more susceptible to intestinal pathogens.
3. Protective effect of the gut flora can be restored by inoculating animals with fecal suspensions from healthy animals.
Basically, CE cultures inhibit or cause significant reduction in the population of food-borne bacteria and suggested mechanisms include production of inhibitory compounds (lactic acid, VFA, or bacteriocins), competition for attachment sites, competition for nutrients, even immunostimulation. Feeding of cattle with DFM to reduce fecal shedding of E. coli O157:H7, a serotype that has emerged as a major food-borne pathogen, is a promising preharvest intervention strategy. Escherichia. coli O157:H7 is carried asymptomatically in the gut by cattle and is shed in the feces. Reduction in the number of cattle that shed the organism and reduction in the pathogen load of cattle that are shedding the organism would significantly diminish potential contamination of beef, produce and water. Several research efforts have focused on the potential of lactic acid bacteria (Lactobacillus acidophilus or other species) to reduce prevalence of E. coli O157 in feedlot cattle (Brashears et al., 2003; Elam et al., 2003; Peterson et al., 2007; Younts-Dahl, et al., 2005). Probiotics have either an indirect effect by altering microbial populations or a direct inhibitory or competitive effect on E. coli O157, reducing the ability of E. coli O157 to survive in the gut and shed in feces. Brashears et al. (2003) have reported on the selection of strains that have anti-E. coli O157 activity and conducted a feeding study to show reduction in the prevalence of E. coli O157 in feedlot cattle. Cattle supplemented with a strain of Lactobacillus acidophilus (NPC 747) showed as much as 50% reduction in fecal prevalence and up to 83% reduction in hide prevalence at the time of slaughter compared to the control group.

52
The DFM is currently used in the feedlot industry to improve animal performance and has no food safety claim.
Summary
A variety of direct-fed microbial products are available in the marketplace that may improve performance of growing and finishing cattle. The data reviewed only address product efficacy, and potential customers will certainly factor in the value of service provided in addition to direct and indirect product costs to decide if utilization of a given product is warranted. The majority of the products need further demonstration of efficacy in the feedlot environment to allow nutritionists and feedlot managers to identify a rigorous estimate of expected changes in growth performance and reach a clear conclusion on the value of a specific product. Pro-Ternative and XP yeast products have reduced morbidity by stressed calves, whereas Amaferm and Yea-Sacc may be expected to enhance growth rate of growing cattle fed higher forage diets by approximately 3% or more. In the presence of an ionophore, data suggest that improvements in growth performance of approximately 2.5% are expected by finishing cattle fed bacterial products; however, the published data are by far most clear for Bovamine. Research to delineate mode of action of DFM is limited. There is evidence that supplemented enzymes are able to resist proteolysis and exert hydrolytic activities in the rumen. Among DFM, it is generally believed that fungal DFM have ruminal effects and bacterial DFM exert their effects in the lower gut. The food safety implications of bacterial DFM appear promising and have received considerable interest. Generating data in future studies utilizing diets with higher inclusions of byproduct feeds such as corn gluten feed and distiller’s grains will be useful as the industry moves forward in a time of higher and more dynamic feed grain prices. Continued development is needed to identify products or combinations of products that may aid in the control of digestive deaths in order to allow slight increases in energy density and efficiency of growth by cattle fed under natural programs.
Literature Cited Allison, B. C., and R. L. McCraw. 1989. Efficacy of VitaFerm formula for stocker calves.
November Animal Science Dept. Newsletter, North Carolina State University. Anderson, V. L. 1993. Diets fed with and without Yea-Sacc 1026 for early-weaned beef calves.
Alltech Inc. Report Yea-Sacc-051-engRT. Beauchemin, K. A., L. M. Rode, and D. Karren. 1999. Use of feed enzymes in feedlot finishing
diets. Can. J. Anim. Sci. 79:243-246. Beauchemin, K. A., D. Colombato, D. P. Morgavi, and W. Z. Yang. 2003. Use of exogenous
fibrolytic enzymes to improve feed utilization by ruminants. J. Anim. Sci. (E. Suppl. 2):E37-E47.
Beauchemin, K. A., C. R. Krehbiel, and C. J. Newbold. 2006. Enzymes, bacterial direct-fed microbials and yeast: principles for use in ruminant nutrition. p. 251-284. In: Biology of

53
Nutrition in Growing Animals. R. Mosenthin, J. Zentek, and T. Zebrowska (eds.), Elsevier Ltd., NY.
Bechtel, R., K. S. Eng, and D. Hutcheson. 2006. Effects of ProTernative continuous fed formula (Saccharomyces cerevisiae CNCM I-1077) on performance of finishing cattle fed natural and medicated rations. Ivy Natural Solutions technical bulletin 206-104.
Beharka, A. A., and T. G. Nagaraja. 1998. Effect of Aspergillus oryzae extract alone or in combination with antimicrobial compounds on ruminal bacteria. J. Dairy Sci. 81:1591–1598.
Belknap, C. R. R. R. Scott, and J. C. Forcherio. 2007. Effect of yeast culture on 28-day performance of newly weaned, low-stress beef calves. J. Dairy Sci (Suppl. 1):551(Abstr.).
Biozyme, 1985. Horton feedlot and research center report. Technical Report TR10-12-5, Biozyme Enterprises, St. Joseph, MO.
Birkelo, C. 1994. Effect of Yea-Sacc 8417 on performance of finishing steers. J. Anim. Sci. 72(Suppl. 1):291 (Abstr.).
Brashears, M. M., M. L. Galyean, G. H. Loneragan, J. E. Mann, and K. Killinger-Mann. 2003. Prevalence of Escherichia coli O157:H7 and performance by beef feedlot cattle given Lactobacillus direct-fed microbials. J. Food Prot. 66:748–754.
Brown, M., C. Smith, and D. Mitchell. 2006. Effects of Micro-Cell on feedlot performance by yearling beef steers. Beef Cattle Research in Texas 2006, pp. 67-70, Department of Animal Science, Texas A&M University, College Station.
Burroughs, W., W. Woods, S. A. Ewing, J. Greig, and B. Theurer. 1960. Enzyme additions to fattening cattle rations. J. Anim. Sci. 19:458-464.
Callaway, E. S., and S. A. Martin. 1997. Effects of Saccharomyces cerevisiae culture on ruminal bacteria that utilize lactate and digest cellulose. J. Dairy Sci. 80:2035–2044.
Cole, N. A., C. W. Purdy, and D. P. Hutcheson. 1992. Influence of yeast culture on feeder calves and lambs. J. Anim. Sci. 70:1682-1690.
Cranston, J. J., C. R. Krehbiel, L. J. McBeth, and R. A. Ball. 2005. Effects of roughage level and Fibrozyme supplementation on performance and carcass characteristics of finishing steers. Oklahoma State Animal Science Research Report, Stillwater.
Dawson, K. 1994. Evaluation of the protein-sparing effect of Yea-Sacc 8417 in growing cattle. Alltech Inc. Report Yea-Sacc-040-engRT.
Dhuvyetter, D., J. Caton, K. Ringwall, and G. Ottmar. 1995. Effects of GainPro (Bambermycins) and Amaferm (Aspergillus oryzae) fed to growing heifer calves in North Dakota. North Dakota State Animal and Range Science Research Report, Fargo.
Elam, N. A., J. F. Gleghorn, J. D. Rivera, M. L. Galyean, P. J. Defoor, M. M. Brashears, and S. M. Younts-Dahl. 2003. Effects of live cultures of Lactobacillus acidophilus (strains NP45 and NP51) and Propionibacterium freudenreichii on performance, carcass, and intestinal characteristics, and Escherichia coli strain O157 shedding of finishing beef steers. J. Anim. Sci. 81:2686–2698.
Fuller, R. 1999. Modulation of the intestinal microflora by probiotics. p. 33-45, In: Probiotics, Other Nutritional Factors and Intestinal Microflora. L. A. Hanson and R. H. Yolken (eds.) Nutrition Workshop series, vol. 42, Nestle Lte., Veveyl/Lippincott-Raven Publ., Philadelphia, PA.
Garcia Estefan, A. 1999. Feedyard performance and carcass traits of cattle as influenced by stocker phase implant strategy and yeast culture (Saccharomyces cerivisiae 8 x 10⁹ CFU/g; Biosaf) supplementation during the feedyard phase. PhD dissertation, Texas A&M University, College Station.

54
Ghorbani, G. R., D. P. Morgavi, K. A. Beauchemin, and J. A. Z. Leedle. 2002. Effects of bacterial direct-fed microbials on ruminal fermentation, blood variables, and the microbial populations of feedlot cattle. J. Anim. Sci. 80:1977–1980.
Hinman, D. D., S. J. Sorensen, and P. A. Momont. 1995. Effect of yeast culture on steer performance, apparent diet digestibility, and carcass measurements when used in a barley and potato finishing diet. Prof. Anim. Sci. 14:173-177.
Huber, J. T. 1997. Probiotics in cattle. p.162-186. In: Probiotics 2. Application and Practical Aspects. R. Fuller (ed.), Chapman and Hall, London, UK.
Huck, G. L., K. K. Kreikemeier, and G. A. Ducharme. 2000. Effect of feeding two microbial additives in sequence on growth performance and carcass characteristics of finishing heifers. Kansas Cattlemen’s Day Report, pp. 32-34.
Keyser, S. A., J. P. McMeniman, D. R. Smith, J. C. MacDonald, and M. L. Galyean. 2007. Effects of Saccharomyces cerevisiae subspecies boulardii CNCM I-1079 on feed intake by healthy beef cattle treated with florfenicol and on health and performance of newly received beef heifers. J. Anim. Sci. 85:1264-1273.
Krehbiel, C. R., J. S. Ward, D. L. Step, L. J. McBeth, J. B. Morgan, and R. A. Ball. 2004. Effects of cultures of Lactobacillus acidophilus (BG2FO4) and Propionicbacterium freudenreichii P-63 with or without Levucell SB (Saccharomyces cerivisiae) on feedlot performance, carcass merit, and Escherichia coli O157:H7 shedding by finishing beef steers. Okla. State University Animal Science Research Report, Stillwater, OK.
Krehbiel, C. R., S. R. Rust, G. Zhang, and S. E. Gilliland. 2003. Bacterial direct-fed microbials in ruminant diets: Performance response and mode of action. J. Anim. Sci. 81(E. Suppl. 2):E120-E132.
Martin, S. A., and D. J. Nisbet. 1992. Effect of direct-fed microbials on rumen microbial fermentation. J. Dairy Sci. 75:1736-1744.
McLeod, K. R., K. J. Karr, K. A. Dawson, D. K. Aaron, and G. E. Mitchell. 1991. Influence of yeast culture and monensin on ruminal metabolic endproducts and feedlot performance. Alltech Inc. Report Yea-Sacc-060-engRT.
Morgavi, D. P., K. A. Beauchemin, V. L. Nsereko, L. M. Rode, A. D. Iwaasa, W. Z. Yang, T. A. McAllister, and Y. Wang. 2000. Synergy between ruminal fibrolytic enzymes and enzymes from Trichoderma longibrachiatum. J. Dairy Sci. 83:1310-1321.
Morgavi, D. P., K. A. Beauchemin, V. L. Nsereko, L. M. Rode, T. A. McAllister, A. D. Iwaasa, Y. Wang, and W. Z. Yang. 2001. Resistance of feed enzymes to proteolytic inactivation by rumen microorganisms and gastrointestinal proteases. J. Anim. Sci. 79:1621–1630.
Mutsvangwa, T., I. E. Edwards, J. H. Topps, and G. F. M. Paterson. 1992. The effect of dietary inclusion of yeast culture (Yea-Sacc) on patterns of rumen fermentation, food intake and growth of intensively fed bulls. Anim. Prod. 55:35–41.
Nagaraja, T. G., C. J. Newbold, C. J. Van Nevel, and D. I. Demeyer. 1997. Manipulation of ruminal fermentation. p. 523–632. In: The Rumen Microbial Ecosystem. P. N. Hobson and C. S. Stewart, ed. Blackie Acad. and Prof., London.
NCBA. 2009. Fresh research exposes rapid growth of natural/organic beef. Available at: http://www.beefretail.org . Accessed 6 March 2009.
Newbold, C. J., R. J. Wallace, and F. M. McIntosh. 1995. Different strains of Saccharomyces cerevisiae differ in their effects on ruminal bacterial numbers in vitro and in sheep. J. Anim. Sci. 73:1811–1818.

55
Nisbet, D. J., and S. A. Martin. 1991. Effects of Saccharomyces cerevisiae culture on lactate utilization by the ruminal bacterium Selenomonas ruminantium. J. Anim. Sci. 69:4628–4633.
Nocek, J. E., and W. P. Kautz. 2006. Direct-fed microbial supplementation on ruminal digestion, health, and performance of pre- and postpartum dairy cattle. J. Dairy Sci. 89:260–266.
NPC. 2008a. The value of lactic acid cultures on performance and carcass characteristics in all-natural finishing diets containing wet distiller’s grains, 15% diet DM. Nutrition Physiology Corp. Technical Bulletin.
NPC. 2008b. The value of lactic acid cultures on performance and carcass characteristics of feedlot steers fed a diet consisting of dry-rolled corn and wet distiller’s grains, 30% diet DM. Nutrition Physiology Corp. Technical Bulletin.
NPC. 2008c. The value of Lactobacillus acidophilus combined with Propionibacterium freudenreichii on performance and carcass characteristics of feedlot steers fed wet distiller’s grains. Nutrition Physiology Corp. Technical Bulletin.
Oetzel, G. R., K. M. Emery, W. P. Kautz, and J. E. Nocek. 2007.Direct-fed microbial supplementation and health and performance of pre- and postpartum dairy cattle: a field trial. J Dairy Sci. 90: 2058-2068.
Peirera, A., and R. A. Zinn. 2001. Influence of Fibrozyme on growth performance of yearling steers. J. Anim. Sci. 79(Suppl. 2):142(Abstr.).
Peterson R. E., T. J. Klopfenstein, G. E. Erickson, J. Folmer, S. Hinkley, R. A. Moxley, and D. R. Smith. 2007. Effect of Lactobacillus acidophilus strain NP51 on Escherichia coli O157:H7 fecal shedding and finishing performance in beef feedlot cattle. J. Food Prot. 70:287-291.
Tricarico, J. M., M. D. Abney, M. L. Galyean, J. D. Rivera, K. C. Hanson, K. R. McLeod, and D. L. Harmon. 2007. Effects of a dietary Aspergillus oryzae extract containing alpha amylase activity on performance and carcass characteristics of finishing beef cattle. J. Anim. Sci. 85:802-811.
Vetlife. 2004. Effects of direct fed microbial products on performance and health of feedlot cattle. Technical Bulletin.
Wallace, R. J., L. Arthaud, and C. J. Newbold. 1994. Influence of Yucca shidigera extract on ruminal ammonia concentrations and ruminal microorganisms. Appl. Environ. Microbiol. 60: 1762-1767.
Wallace, R. J., N. R. McEwan, F. M. McIntosh, B. Teferedegne, and C. J. Newbold. 2002. Natural products as manipulators of rumen fermentation. Asian-Australas. J. Anim. Sci. 10:1458–1468.
Wallace, R. J., and C. J. Newbold. 1992. Probiotics for ruminants. p. 317 in Probiotics: The Scientific Basis. R. Fuller, ed. Chapman and Hall, London, U.K.
Younts-Dahl, S. M., G. D. Osborn, M. J. Galyean, J. D. Rivera, G. H. Lonergan, and M. M. Brashears. 2005. Reduction of Escherichia coli O157 in finishing beef cattle by various doses of Lactobacillus acidophilus in direct-fed microbials. J. Food Prot. 68:6-10.
Wang, Y., T. A. McAllister, L. J. Yanke, and P. R. Cheeke.2000. Effect of steroidal saponin from Yucca schidigera extract on ruminal microbes. J. Appl. Microbiol. 88:887-96.
Zinn, R. A., E. G. Alvarez, S. Rodriguez, and J. Salinas. 1999. Influence of yeast culture on health, performance, and digestive function of feedlot steers. Proc. West. Sec. Amer. Soc. Anim. Sci. 50:335-338.

56
Zinn, R. A., E. G. Alvarez, M. F. Montano, A. Plascencia, and J. E. Ramirez. 1998. Influence of tempering on the feeding value of rolled corn in finishing diets for feedlot cattle. J. Anim. Sci. 76:2239-2246.
Table 1. Influence of ration cost on the value of improvements in feed efficiency (no change in ADG, reduced DMI).
Improvement in feed efficiencya Ration cost 2% 3% 4% 5%
$150/ton of DM $4.95 $7.42 $9.90 $12.37 $200/ton of DM $6.60 $9.90 $13.20 $16.50 $250/ton of DM $8.25 $12.37 $16.50 $20.62 $300/ton of DM $9.90 $14.85 $19.80 $24.75
aAssumes DMI of 22 lb/day, ADG of 3.5 lb/day, and 150 days on feed. Figure 1. Cost to benefit ratio reflecting the added feed cost from feed additives that would improve feed efficiency 2% for a typical steer fed a ration priced at $200/ton of DM (including markup) for 150 days (reduced feed cost of $6.50/animal).
0.320.43
0.65
1.30
$0.00
$0.20
$0.40
$0.60
$0.80
$1.00
$1.20
$1.40
Cost:benefit
Cost
/ani
mal
fed,
$
1:201:151:101:5

57
Table 2. Compilation of currently available direct-fed microbials for use in feedlot cattle
Product name Organism(s) Manufacturer Dose/animal daily
Fungal cultures Amaferm Aspergillus oryzae Biozyme, Inc. 2 to 3 g Amaize Aspergillus oryzae Alltech, Inc. - XP Saccharomyces cerevisiae
and growth media Diamond V 14 to 85 g
Viable fungi
Biosaf Saccharomyces cerevisiae LeSaffre Feed Additives 5 to 20 g Yea-Sacc Saccharomyces cerevisiae Alltech, Inc. 10 to 15 g Proternative CF and SF Saccharomyces cerevisiae Ivy Natural Solutions 0.5 g
Bacterial cultures Bovamine Lactobacillus acidophilus
Propionibacterium freudenreichii
Nutrition Physiology Corp. 0.05 g
Microcell LA Lactobacillus acidophilus BG2FO4
Lallemand Animal Nutrition 0.05 g
Microcell PB freudenreichii freudenreichii P-63
Lallemand Animal Nutrition 0.05 g
MicroCell Gold Lactobacillus acidophilus BT1386 and BG2FO4 and Lactobacillus buchneri 40788
Lallemand Animal Nutrition 0.05 g
Probios Lactobacillus acidophilus, Lactobacillus planetarum, Lactobacillus casei, and Enterococcus faecium
Chr. Hansen 0.05 g
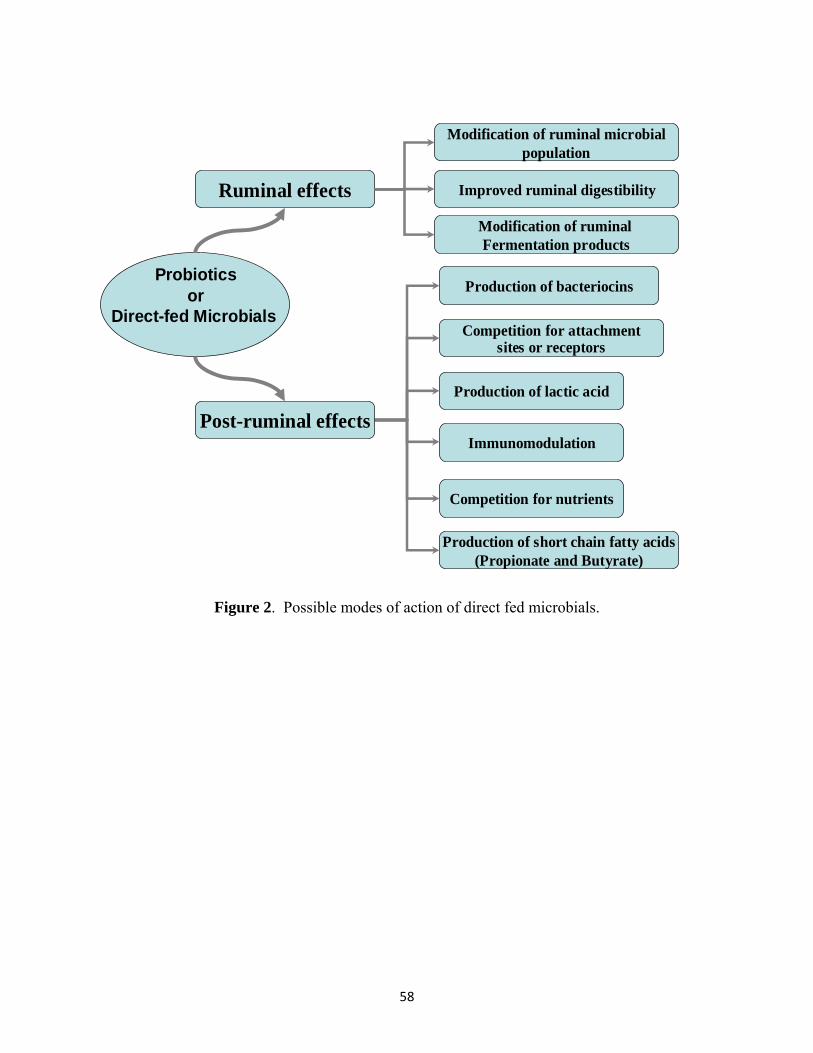
58
Production of short chain fatty acids(Propionate and Butyrate)
Production of bacteriocins
Production of lactic acid
Competition for nutrients
Immunomodulation
Probioticsor
Direct-fed MicrobialsCompetition for attachment
sites or receptors
Modification of ruminal microbialpopulation
Ruminal effects
Post-ruminal effects
Improved ruminal digestibility
Modification of ruminalFermentation products
Figure 2. Possible modes of action of direct fed microbials.

59
Provision of nutrients
Better absorption of nutrients
Improved digestion
Competition for attachment sites
Reduction of pathogens
Immunostimulation
Figure 3. Possible effects of direct-fed microbials in the lower gut.

60
Stimulation of Ruminal Bacteriaand Fungi
Fungal DFM
Increased Microbial CellProtein Synthesis
Improved Cattle Productivity
Lactate-fermenting Bacteria
Enhanced lactate utilization
Moderation of ruminal pH
Fiber-fermenting bacteria
Enhanced fiber fermentation
Increased feed Intake
(Growth factors (vitamins, enymes, peptides)(Use of Oxygen?)
(Unknown Growth factors)
Figure 4. Mode of action of fungal direct fed microbials.

61

62
Interpreting Research Results: Applied Statistical Principles
M. L. Galyean and N. A. Elam Texas Tech University, Lubbock
New Mexico State University, Clayton Livestock Research Center, Clayton Statistics – the study of methods and procedures for collecting, classifying, summarizing, and analyzing data and for making scientific inferences from such data. (Remington and Schork, 1970)
• Two major categories: o Descriptive statistics – statistics used to organize and describe data, not
necessarily to make implications or draw conclusions Examples – mean (average), range, frequency, and variance How much? How often? How variable? Can be used to describe a complete population or only a sample
o Inferential statistics – statistics used for reaching conclusions on the basis of incomplete information
Reaching conclusions about a population from a subset or sample of the population
Descriptive statistics on samples are used to draw inferences about populations
Conclusions about populations that are made by drawing samples are called statistical inferences – these inferences have a probability of being true or false
Common Descriptive Statistics
• Measures of central tendency o Mode – most frequently occurring value in a set of observations
1, 2, 2, 4, 4, 4, 5, 5 → Mode = 4
o Median – the middle value in a set of observations ordered by size 1, 2, 4, 5, 9 → Median = 4
o Mean – sum of all observations divided by the number of observations – the
simple average 1, 2, 4, 5, 8 → Sum = 20/5 → Mean = 4
o Weighted mean – sum of all observations multiplied by the weight for each
observation divided by the sum of the weights Best example – grade point average – weight each grade by the credit
hours for each course

63
• Measures of variability
o Range – largest value minus smallest value 1, 2, 4, 5, 8 → Range = 8 – 1 = 7
o Variance – sum of the square of the difference between each observation and the
mean divided by the number of observations minus 1 (degrees of freedom) Σ(x - x )2/(n – 1)
o Standard deviation – square root of the variance
Types of Variables and Distributions
• Variables – discrete or continuous o Discrete – between any 2 observable values, there is at least 1 non-observable
value Count data = discrete whole numbers
o Continuous – between any 2 observable values, there is another observable value
Body weight – between 750 lb and 751 lb, 750.5 lb is a potentially observable value
o Random variables – discrete or continuous variables that have various values or sets of values with various probabilities
• Distributions of random variables o A distribution of a population represents the relative frequency with which
different values of a random variable occur
o Examples Binomial distribution – 2 outcomes – heads and tails for a coin toss Normal distribution – “bell-shaped” curve
• The distribution of many random variables of interest in biology approximates a normal distribution
Image source: http://hawaii.hawaii.edu/math/Courses/Math100/Chapter4/Notes/G3/NormalCurve.png

64
• Each normal distribution is defined by a mean (μ)and a variance (σ2; standard deviation = σ)
Sampling and the Central Limit Theorem
• Random sample – a sample taken from a population in such a way that every member of the population has the same probability of selection, and selection of one unit is independent of another unit
o Random samples avoid bias and inadvertent omission of samples o Statistical theory is built on random sampling
• The Central Limit Theorem – the distribution of the means of random samples of a fixed
size will approximate a normal distribution, with the mean of the sample distribution equal to the mean of the population distribution
o Thus, the sample mean is an unbiased estimate of the population mean o Standard error of the mean – the standard deviation of the distribution of sample
means is called the standard error of the mean Calculated as the sample standard deviation divided by the square root of
the number of observations per sample Are Statistics Important in a Feedlot?
• Statistical principles should be applied to any sampling procedure – for example, feed sampling for nutrient analysis
o How many feed samples does one need to take to ensure that nutrient content is measured accurately?
o Inadequate or excessive sampling methods waste time and money
• Statistical principles need to be applied to “in-house” research and to evaluation of “product” tests
o Example – paired-pen studies with one implant vs. another How can one be sure that the difference is real and not the result of
chance? Why are “big” differences sometimes not statistically significant?
Accuracy and Precision
• Accuracy – the degree of agreement between a value obtained by a procedure and the actual or true value of the quantity being measured
o True value is rarely known for populations o True value might be the target value – for example, formulated CP value of a diet

65
• Precision – the closeness of a number of similar measurements to a common value o Common value is usually the mean o Closeness to common value reflects variance o Coefficient of variation is a common measure of precision
CV, % = (standard deviation/mean) x 100
Image source: http://www.mhhe.com/physsci/chemistry/chang7/esp/folder_structure/ch/m2/s2/index.htm Application of Statistical Principles to Sampling
• The problem – A finishing diet is formulated to have 13.5% CP. An employee is assigned to take feed bunk samples of the diet that are sent in for analysis of CP. How many samples of the diet does the employee need to take to ensure that it contains the desired CP of 13.5%?
• Question to ask – How certain does the employee need to be that the CP value is 13.5%? • Answer
o Assume 10, 5, 2, and 1% of the target value as possible answers for desired closeness to the target:
Example for 10%: 13.5% x 0.1 = ± 1.35% Example for 1%: 13.5% x 0.01 = ± 0.135%
• The number of samples to be collected depends on the following factors:
o Desired closeness to the target value o Precision (CV) of the sampling procedure o Probability of saying there is a difference when there really is not one o Probability of saying there is not a difference when there really is one
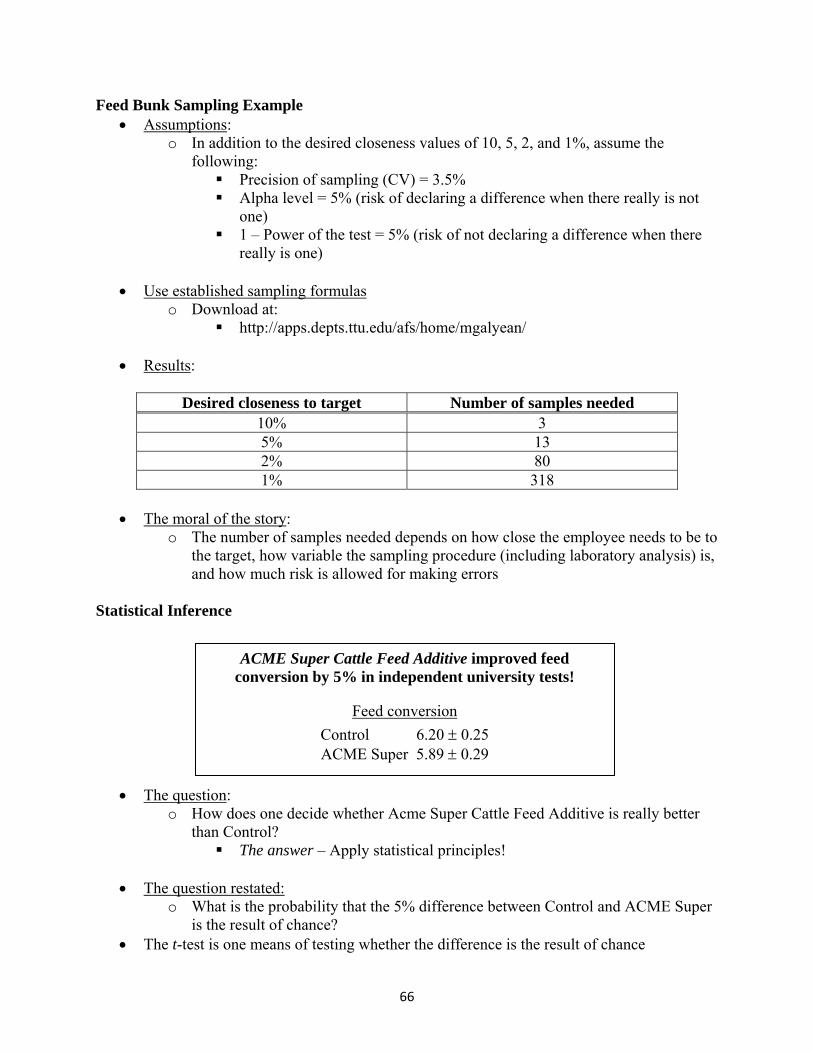
66
Feed Bunk Sampling Example • Assumptions:
o In addition to the desired closeness values of 10, 5, 2, and 1%, assume the following:
Precision of sampling (CV) = 3.5% Alpha level = 5% (risk of declaring a difference when there really is not
one) 1 – Power of the test = 5% (risk of not declaring a difference when there
really is one)
• Use established sampling formulas o Download at:
http://apps.depts.ttu.edu/afs/home/mgalyean/
• Results:
Desired closeness to target Number of samples needed 10% 3 5% 13 2% 80 1% 318
• The moral of the story:
o The number of samples needed depends on how close the employee needs to be to the target, how variable the sampling procedure (including laboratory analysis) is, and how much risk is allowed for making errors
Statistical Inference
• The question: o How does one decide whether Acme Super Cattle Feed Additive is really better
than Control? The answer – Apply statistical principles!
• The question restated:
o What is the probability that the 5% difference between Control and ACME Super is the result of chance?
• The t-test is one means of testing whether the difference is the result of chance
ACME Super Cattle Feed Additive improved feed conversion by 5% in independent university tests!
Feed conversion Control 6.20 ± 0.25 ACME Super 5.89 ± 0.29

67
Calculations and Assumptions
• Assume that the university test involved 5 pens for each treatment • Assume that our alpha level is 5% (the probability that we say there is a difference when
there really is not one)
• The pooled standard error of the mean is 0.27 o tcalc = (6.20 – 5.89)/√2 x 0.27 = 0.81 o t0.05, 8 (one-tailed test) = 1.860 – the tcalc would need to be this large or larger for
the difference to be significant at the 5% level – only 5 chances in 100 that the difference is not real and is the result of chance
o Thus, the t-calc indicates that, given the variability, it is fairly common to see a difference between treatments in feed conversion that is this large (5%) merely as a result of chance – so, do not buy stock in Acme Super!
• One alternative to the t-test would be to conduct an analysis of variance (AOV) o In our example, the variance attributable to differences between the 2 treatment
groups divided by the variance attributable to differences among pens on the same treatment equals the F-test for treatment
o For our 2 treatments, the critical F0.05, 1,8 = 5.32 – thus, the observed value of F would need to be this large or larger of the difference to be significant at the 5% level
Note that in the case of only 2 treatments, the value of F = t2 o The AOV approach would be typical for situations involving more than 2
treatments
• A useful thumb rule: o Multiply the standard error by 3 – if this value overlaps the difference between the
means, the difference is not likely “significant” But, be careful – mixed model analyses produce pooled standard errors
that include random effects, which inflates the standard error – for mixed model analyses, use the standard error of the difference between the means
Some Possible Statistical Quagmires
• “Deads-in” vs. “deads-out” comparisons – In most feeding trials it is fairly common for individual animals (these animals are most often sampling units within the experimental unit of the pen) to succumb to ailments/afflictions that prohibit them from finishing a trial (i.e., death or removal from the experiment). Thus, a common question becomes whether to analyze the data statistically on a deads-in or deads-out basis.
o Things to consider:
Mortality is important in economic calculations, but mortality is rarely tested for statistical significance (and when tested is rarely significant)

68
Thus, using deads-in data for statistical analysis potentially attributes random error associated with mortality to the fixed effects of treatments
o The basis behind an AOV is to determine the relevance (significance) of biological responses associated with the treatments applied
As described previously, the relevant test in the AOV is the F-test, which is the ratio of the variation among treatments to the variation within treatments
An animal only contributes to the sources of variation if it is alive In other words, if an animal contributes to the sources of variation at the
beginning of a trial, it is important that the same animal contributes to the sources of variation at the end of the trial
o Recommendation – use deads-out data to evaluate treatment responses, test mortality/removal data statistically, and apply economic analyses to the resulting data rather than using deads-in calculations
• Confounding – confounding occurs when the effect of one factor or variable cannot be
separated from that of another factor or variable o Often a common problem in field trials and demonstration studies o Example – Treatment A is applied to 5 pens of cattle at the ABC Feedlot and the
Control is applied to 5 pens of cattle at the XYZ Feedlot, which is located across the road. Cattle are received from 1 source, and implants and diets are the same. Is the comparison between Treatment A and Control valid?
Regardless of the similarities between Feedlot ABC and Feedlot XYZ, treatment is confounded with feedlot
We might be able to control for many of the differences, but unless Treatment A and Control are represented in both feedlots, we can never be certain that the difference is solely a function of the treatment
o Temporal confounding also is a potential problem in field studies Example – same feedlot, but treatments applied at different times of the
year or at a different time in the feeding period
• Bias – bias occurs when a measurement is not accurate – the measurement is consistently over- or under-estimated
o Bias is not random error, but reflects systematically “missing the mark” Examples: a scale that consistently weighs high or low; an instrument
that consistently gives readings that are too high or too low Relative to previous information about accuracy and precision, bias results
in inaccurate measurements Control for bias by routinely calibrating instruments
• Check weights, calibration standards, recovery estimates
• Interactions – interactions occur when the effect of 1 factor depends on another factor (i.e., lack of independence between or among experimental factors)
o Important in “factorial arrangements” of treatments, repeated measures, and “pooled” data
o Example

69
2 x 2 factorial arrangement of treatments • Grain source (corn or barley) • Grain processing – (dry-rolled or steam-flaked grain)
o F:G for corn vs. barley averaged over processing method = 6.15 vs. 6.45 o F:G for steam-flaked vs. dry-rolled grain averaged over grain source = 6.00 vs.
6.60 Averages do not accurately reflect the results – corn is not always better
than barley, and the effect of steam flaking is much greater for corn than for barley
o Interactions can occur even when the lines do not cross Magnitude of the response for 1 factor changes with levels of the other
factor
• Pooled data – similar experiments are often conducted at multiple locations or repeated over multiple times
o Treatments must be the same at the different locations or times o Other experimental conditions should be as similar as possible
Example – Diet grain source and processing method, roughage source, cattle type, etc., should be similar
Examine data carefully for bias and confounding before pooling Check for trial x treatment interactions to ensure consistency of treatment
responses over trials • If the experimental design does not allow for testing of the
interaction, do not pool the data o Watch out for confounding and bias in pooled data
• Meta-analysis – similar to pooled data analysis, but frequently done with treatment or group means from studies reported in the literature
o Reasonably common in behavioral and social sciences, and increasingly used in medical science and other areas of biology

70
Does not require the same experimental design for all studies, but the comparison of interest must occur in all studies
o Care must be taken in deciding whether to include an experiment in the meta-analysis
Studies are often “weighted” based on the number of observations per treatment mean
o “Effect size” is the common measurement of interest Calculated as – treatment response minus control response divided by the
standard deviation (i.e., a Z-transformation) • This approach places all studies on the same relative scale
o As with pooled data in general, care must be taken to avoid confounding and bias Screen data carefully for inclusion in the meta-analysis
o Meta-analysis might have utility for “commercial” research Allows for sorting out the effects of sampling error It is important for sponsors of research not to “bury” results of
experiments that do not fit the desired outcome, as these studies could be important contributors to a meta-analysis approach
Literature Cited Remington, R. D., and M. A. Schork. 1970. Statistics with Applications to the Biological and
Health Sciences. Prentice-Hall, Inc., Englewood Cliffs, NJ.

71

72
Research Updates
Oklahoma State University
Interaction of nutrition, health, management, and technology to improve the efficiency of cattle feeding
C. R. Krehbiel1, C. J. Richards1, R. B. Hicks1, D. L. VanOverbeke1, D. L. Step2, B. P. Holland1, L. O. Burciaga-Robles1, and L. E. Sims1
1Department of Animal Science and 2Department of Veterinary Clinical Sciences Oklahoma State University, Stillwater
Research conducted at Oklahoma State University (OSU) in the area of receiving and feedlot cattle emphasizes nutrition and management effects on health, performance and carcass merit. Recent research has evaluated: 1) potential markers and technology for determining bovine respiratory disease, and 2) effects of co-product feeds on performance, carcass merit and meat quality. Several posters are presented at this meeting from work conducted by graduate students at OSU, and therefore are not discussed in this proceedings paper (see abstracts). Previous research conducted at OSU in the area of stocker and feedlot nutrition/management can be accessed at http://www.ansi.okstate.edu/research/researchreport/. Sorting heifers with high risk of bovine respiratory disease based on arrival serum haptoglobin concentration. B. P. Holland, L. O. Burciaga-Robles, D. L. Step, and C. R. Krehbiel. Heifers (n = 337; intial BW = 531 ± 37 lb) were assembled at a western Kentucky order buyer facility and shipped in two groups 595 miles to Stillwater, OK. Upon arrival blood was collected and serum analyzed for haptoglobin (Hp) concentration. Heifers were sorted into 3 groups according to arrival Hp concentration. Groups were LOW (<1 μg/100 mL), MED (1 to 3 μg/100 mL), and HIGH (>3 μg/100 mL). Within 36 h after arrival, calves were penned according to groups and fed for a 63-d receiving/growing period. Body weight and blood for Hp analysis were collected on d 7, 14, 21, 42, and 63. Blood for Hp analysis was also collected at the time of antimicrobial treatment for bovine respiratory disease (BRD). Haptoglobin concentrations on arrival were 0.79, 1.93, and 7.60 μg/100 mL for LOW, MED, and HIGH, respectively (P < 0.01). On d 7, Hp tended (P = 0.08) to be greater for HIGH than LOW and MED. Similarly, Hp tended (P = 0.09) to be least for LOW, intermediate for MED, and greatest for HIGH on d 21. Arrival BW was greater for LOW and HIGH than MED (P < 0.01). However, BW did not differ throughout the remainder of the trial (P > 0.27). Average daily gain was least (P = 0.01) for HIGH from d 1 to 7, but no other differences (P > 0.19) in ADG were observed. Overall DMI was not different (P = 0.89) among treatments, but was greater (P = 0.02) for LOW (13.8 lb/d) and MED (12.7 lb/d) than HIGH (11.4 lb/d) from d 1 to 21. Overall morbidity due to BRD was greater (P = 0.01) for MED and HIGH (66.9 and 76.2%, respectively) than for LOW (50.8%). The number of heifers requiring three treatments was also greater (P = 0.01) for MED and HIGH (28.2 and 28.5%, respectively) than for LOW (9.78%). However, heifers considered chronically ill was greatest (P = 0.03) for MED (18.3%), intermediate for HIGH (9.6%), and least for LOW (5.2%). Total mortality and case fatality rate did not differ (P > 0.68) among groups. Average daily gain and DMI early in the growing period, as well as overall morbidity, were affected by

73
arrival Hp concentration. Arrival Hp concentration may be a beneficial tool for making management decisions for calves with high risk of BRD. Measurement of breath biomarkers and serum haptoglobin to determine bovine respiratory disease (BRD) in newly received heifers L. O. Burciaga-Robles, B. P. Holland, D. L. Step, C. R. Krehbiel, C. J. Richards, L. E. Sims The objective was to evaluate exhaled nitrous oxide (eN2O), exhaled carbon monoxide (eCO), and serum haptoglobin concentrations as diagnostic tools for determining BRD, and to determine if a combination of biomarkers and response variables would be useful for predicting health outcomes of heifers. A total of 183 heifers were used. Body weight, breath markers, serum haptoglobin concentration, and rectal and ruminal temperature were recorded and analyzed. Body weight at the time of the first and second antimicrobial treatment did not differ (P > 0.05) from arrival, whereas BW at the time of administration of the third antimicrobial treatment was lower (P < 0.05) compared with arrival and first antimicrobial treatment. Body temperature was lower (P < 0.05) at arrival compared with during antimicrobial treatment. Ratio of eN2O/eCO2 was lowest at arrival, intermediate during the first and second antimicrobial treatments, and greatest during the third antimicrobial treatment (P = 0.001). Ratio of eCO/eCO2 was greater (P < 0.0001) during antimicrobial treatment compared with the ratio at arrival. Concentration of serum haptoglobin was greatest (P < 0.05) at the time of the first antimicrobial treatment, lowest during the second and third antimicrobial treatments, and intermediate at arrival. Arrival eN2O/eCO2 and eCO/eCO2 and concentration of haptoglobin did not differ (P > 0.12) in heifers subsequently treated 1, 2, or 3 times. Although breath analysis was successfully implemented, neither arrival temperature, eN2O, eCO nor haptoglobin were accurate in predicting future BRD events. However, these biomarkers might support the diagnosis of BRD. A comparison of single vaccination to vaccination and revaccination with a modified live BHV1-BVDV (type 1 and 2)-PI3V-BRSV vaccine in the prevention of bovine respiratory disease D. L. Step, C. R. Krehbiel, L. O. Burciaga-Robles, B. P. Holland, R. W. Fulton, A. W. Confer, D. T. Bechtol, D. L. Brister, J. P. Hutcheson, H. Newcomb The objective was to compare the health and performance of cattle receiving a single MLV respiratory vaccination to cattle receiving two vaccinations. Six-hundred-twelve mixed breed male calves with unknown health histories were randomly assigned to two treatments during preconditioning and four treatments during finishing. All calves were administered a MLV respiratory vaccine. Eleven days later, the revaccinated (REVAC) group received a second injection of the same vaccine. During finishing, animals from each treatment were assigned to: 1) vaccination with a MLV vaccine; or 2) given no MLV respiratory vaccination. Health observations were performed daily. Blood and performance variables were measured throughout the experiment. During preconditioning, no differences were noted in performance or antibody production. BRD morbidity was lower for the single vaccine group; however, days to first treatment were not different between treatment groups. No differences in BW, ADG, or DMI among treatments were observed during the finishing phase. REVAC steers had an improved F:G regardless of vaccination protocol in the finishing phase. When the number of days on feed for each treatment was compared, there were no differences between treatments in treatment success, chronics or mortality in the preconditioning period. There were no differences in animal performance except for an improvement in F:G for REVAC steers at the feedlot. Results suggest

74
that a single vaccination was as efficacious as a vaccination followed by revaccination with a MLV vaccine in high-risk calves, although F:G was improved in the revaccinated group during the finishing period. Distiller’s grains in steam-flaked corn based diets R. B. Hicks, D. L. OverOverbeke, P. K. Camfield, J. J. Martin, T. K. Dye, B. P. Holland, C. L. Maxwell, C. R. Krehbiel, and C. J. Richards One hundred and eighty mixed steers (899 ± 62 lb) were blocked by weight (six blocks) and randomly allotted into six head pens to evaluate inclusion of distiller’s grains in flaked corn finishing diets. Treatments were: 1) steam flaked corn control finishing diet, or inclusion of 2) 10% dry distiller’s grains, 3) 10% wet distiller’s grains, 4) 20% wet distiller’s grains, or 5) 30% wet distiller’s grains. All diets contained 8.0% chopped alfalfa. All diets were balanced to contain a minimum of 13% CP and meet 105% of the estimated DIP requirement. Cattle averaged 123 days on feed with a range of 101 to 143. There was no difference (P > 0.11) in final BW, ADG, or DMI which averaged 1368 lb, 3.83 lb/d, and 23.1 lb/d, respectively. Feed efficiency calculated with final live BW shrunk 4% resulted in a treatment tendency (P = 0.07) with a linear decrease (P = 0.04) as level of wet distiller’s grains increased. Feed efficiency calculated with carcass adjusted final BW resulted in no treatment affect (P = 0.29) with an average of 0.166 lb of gain per lb of DMI. There was no difference (P > 0.12) in carcass weight, dressing percentage, fat thickness, kidney pelvic heart fat, ribeye area, or yield grade which averaged 888 lb, 64.96%, 0.52 in, 2.36%, 14.05 in2, and 3.15, respectively. A main treatment effect (P = 0.03) was observed for marbling score. This experiment indicates that inclusion of up to 10% dry or 30% wet distiller’s grains into steam flaked corn finishing diets did not result in any consistently detectable influence on animal performance or carcass characteristics. The influence of feeding various levels of wet and dry corn distiller’s grains to yearling steers on carcass characteristics, meat quality and retail case life of longissimus muscle. L. A. Kinman, D. L. VanOverbeke, C. J. Richards, R. B. Hicks, and C. R. Krehbiel Due to increased production of ethanol, inclusion of distiller’s grains in diets for feedlot cattle is on the rise. The objective of this experiment was to determine the effects of wet (WDG) or dry (DDG) distillers grains on final product quality. Yearling steers (n = 176) were assigned to one of five treatment groups: steam flaked corn (SFC), 10% DDG, 10% WDG, 20% WDG or 30% WDG. One inch steaks were cut from strip loins and identified for simulated retail display, Warner-Bratzler shear force (WBSF) analysis, sensory panel determination, and fatty acid composition. Treatment had no effect on adjusted fat thickness and USDA yield and quality grades. Steaks from cattle fed 10% WDG and 30% WDG had lower WBSF values than steaks from cattle fed 20% WDG. Trained sensory panelists found no differences in overall tenderness and off-flavors. No effects were observed in total saturated and monounsaturated fatty acid composition among treatments; however, 20% WDG had a higher proportion of polyunsaturated and n-6 fatty acids. Data suggest that feeding WDG at higher levels (20% or 30%) does not affect eating quality, but shelf life of strip loin steaks were shorter. Further research needs to be conducted to evaluate methods that aid in increasing shelf life of steaks from cattle fed higher rates of WDG.

75

76
Colorado State University
2009 Plains Nutrition Council University Update J. J. Wagner1, T. E. Engle2, S. L. Archibeque3, and R. M. Enns2
The Southeast Colorado Research Center (SECRC) was established in June of 2005 when Five Rivers Ranch Cattle Feeding LLC gifted Continental Beef Research to the Animal Sciences Department of Colorado State University (CSU). The research center is comprised of 168 nine-head pens, cattle processing and sorting facilities, and a feed mill and office complex. The addition of SECRC expanded the one time capacity of the CSU feedlot facilities from around 1100 to over 2600 head. Over the past few years, several studies have been completed covering a variety of feedlot nutrition and management topics. Publications for 2006 through 2008 generated from SECRC are listed in Appendix A. Highlights from a number of recently completed studies, or studies that are currently in progress, are described in this paper.
Starch Retrogradation
Starch retrogradation is the reassociation of starch molecules separated during gelatinization (Rooney and Pflugfelder, 1986). The extent of retrogradation depends upon several factors including moisture content and temperature (Rooney and Pflugfelder, 1986) and thus it seems very likely that method of storage for steam-flaked corn may influence retrogradation. Recent studies have suggested that the method of handling steam-flaked corn after the flaking process is complete may influence dry matter digestion and starch availability (SA). Ward and Galyean (1999) demonstrated a 39% reduction in SA but a 4% increase in in vitro dry matter disappearance (IVDMD) for steam-flaked corn that was taken to a storage bin by a drag chain and leg conveyor and stored as compared with samples taken with a shovel directly below the rolls. McMeniman et al (2007) demonstrated a 6% reduction in IVDMD and a 48% reduction in SA for steam-flaked corn collected upon exit from a leg-filled storage bin as compared with flakes collected directly beneath the rolls. McMeniman and Galyean (2007) studied simulated air lift and conveyor leg takeaway systems for steam-flaked corn. Simulated conveyor leg samples had 40% lower SA and 6.5% lower IVDMD at 24 h incubation as compared with samples from a simulated air lift system. It is not known whether these differences in SA or IVDMD have an influence on cattle performance. Mixed results were observed in preliminary performance research studies conducted at the SECRC. A study to investigate the effect of steam-flaked corn (SFC) storage method on in situ DM disappearance and enzymatic starch availability (SA) was recently conducted at SECRC. Steam-flaked corn (28 lb/bu) was sampled immediately off the roller for five consecutive days and immediately prior to feeding on the following day. Two storage methods for SFC were evaluated: 1. stored overnight in an enclosed metal bin (BIN) or 2) stored overnight on a concrete slab allowing SFC to cool (SLAB). Samples of SFC collected pre- and post-storage for 1 Professor and General Manager; Southeast Colorado Research Center; Colorado State University; 2830 US Hwy
50; Lamar, CO 81052; (O) 719.829.4663; [email protected]. 2Associate Professor; Animal Sciences Department; Colorado State University. 3 Assistant Professor; Animal Sciences Department; Colorado State University.

77
each storage method were submitted to a commercial laboratory1 for SA using in vitro gas production methodology. Additional samples were collected and prepared for in situ work through a 2mm screen. Dacron bags were filled with ground SFC at 10mg/cm2 surface area. Bags were placed sequentially into the rumen of 2 steers to allow fermentation times of 0, 2, 4, 8, 12, 24, 48, and 72 hr. After removal from the rumen, bags were washed manually and then dried in a 60 ºC forced air oven for 48 hr. Polynomial curves, pre- and post-storage, were generated over incubation time for each storage method and day. The area under each curve was calculated and used for statistical analysis of the in situ data. Starch availability data are summarized in Table 1. The amount of gas produced during three hours of incubation was higher (P < 0.01) for SFC stored on the concrete slab as compared with bin-stored SFC (44.8 versus 34.2 mls). Incubation of post-storage samples produced less gas (P < 0.0001) indicating poorer SA as compared with pre-storage samples (29.7 versus 49.3 mls). The interaction between storage method and time of sampling (pre- versus post-storage) was not significant (P > 0.26). Starch availability may have been reduced 47.8% by storage for SFC stored overnight in a bin versus 32.3% for SFC stored outside overnight on a concrete slab. Figures 1 and 2 illustrate the effects of overnight storage and fermentation time on in situ DM disappearance for bin-stored and concrete slab-stored SFC, respectively. These figures represent the average values for all sample days. Similar figures were generated for each sampling day. Area under each curve was calculated and data are listed in Table 2. Differences for in situ DM disappearance associated with storage method were not significant (P > 0.89) averaging 53.95 versus 54.23% over all incubation times for the BIN and SLAB treatments, respectively. In situ DM disappearance was reduced (P < 0.08) during storage from 57.93% for samples collected off the rolls to 51.25% for samples collected after overnight storage. The interaction between storage method and time of sampling was not significant (P > 0.64). The average reduction in in situ DM disappearance was 11.7% for bin stored corn versus 8.2% for SFC stored on a concrete slab. However, the reduction in DM disappearance during storage that was observed for each storage method varied widely among the daily samples. Even though enzymatic SA estimates were reduced for SFC stored under hot conditions in an overhead bin, storage method did not consistently affect in situ DM disappearance from SFC. Additional laboratory analysis intended to calculate in situ starch disappearances are planned.
Nitrogen Utilization and Excretion
Research has recently been completed or is in progress investigating various aspects of nitrogen utilization and excretion. In a currently unpublished study utilizing a steam-flaked corn (28 lb/bu) based finishing diet fed to heavy-weight yearling steers, dry matter intake (P < 0.06), average daily gain (P < 0.04), and final body weight (P < 0.05) increased linearly as DIP was increased from 5.36 to 9.36% crude protein equivalent (CPE) of diet DM (Table 3). No effect on feed efficiency was observed. There was a tendency (P < 0.08) for hot carcass weight to increase linearly with increasing DIP. Fat depth measured at the 12th rib (P < 0.04) and Yield Grade calculated from carcass measurements (P < 0.04) increased linearly and there was a linear decrease (P < 0.05) in the likelihood that an individual carcass within a pen would qualify for the USDA Yield Grade 1 and 2 categories as dietary DIP increased (Table 4). Interestingly, there 1SDK Labs, Hutchinson, KS.

78
was a linear reduction (P < 0.004) in the liver abscess rate associated with increasing dietary DIP concentration. The two diets with the highest DIP concentration and the two lowest liver abscess rates contained approximately 1.15 and 1.49% urea on a dry matter basis, respectively. Additional research is being contemplated to examine if at least part of the NPN effect commonly seen in steam-flaked corn finishing diets is due to urea acting as a buffer in the rumen when fed at high concentrations. It is also plausible that high dietary NPN may volatilize in the bunk reducing meal size and rate of consumption and thus increasing the frequency of meals by cattle. In a recently completed preliminary study, ammonia emissions from the feedlot pen surface were measured at d9 and d42 of Optaflexx1 feeding. Although results were not statistically significant, feeding 400 mg Optaflexx per head daily reduced ammonia emissions by 9.9 and 17.8% for d9 and d42, respectively. A larger scale follow-up study that is currently in progress, examines beta-agonist feeding, combined with crude protein (CP) withdrawal, as a management practice to reduce nitrogen excretion and ammonia emissions. The study is designed as a 3 x 4 factorial experiment. Factors being evaluated include: no beta agonist administration versus Optaflexx fed at 200 mg per head daily for 28 days or Zilmax2 fed at 75 mg per head daily for 20 days; and four CP withdrawal treatments.
Crude protein withdrawal treatments include: 1. 13.5% CP, 3.5% CPE from NPN, d1 through slaughter; 2. 13.5% CP, 3.5% CPE from NPN, d1 up until the last 28 days prior to slaughter
followed by 12.5% CP, 3.5% CPE from NPN for the last 28 days; 3. 13.5% CP, 3.5% CPE from NPN, d1 up until the last 28 days prior to slaughter
followed by 12.5% CP, 2.5% CPE from NPN for the last 28 days; and 4. 13.5% CP, 3.5% CPE from NPN d1 up until the last 28 days prior to slaughter
followed by 11.5% CP, 1.5% CPE from NPN for the last 28 days. Average daily gain and nitrogen intake will be determined the last 28 days of the study. Nitrogen retention will be calculated from ADG and nitrogen excretion will be assumed to equal nitrogen intake minus calculated retention. Nightingale et al (2008) summarized a study that investigated whether oscillating dietary CP concentration, which may improve N retention of finishing beef steers, would reduce total N inputs while yielding comparable performance, regardless of implant status. One hundred and eighteen Angus steers (358 ± 9 kg) were used in a completely randomized block design with a 2x2 factorial arrangement of treatments, and fed in 12 pens. The steers were fed either a 1) Control, steam-flaked corn (28 lb/bu) based diet (11.7% CP; n = 6 pens), or 2) Control and a steam-flaked based corn diet with no added urea (9.6%CP) oscillated on a 48-h interval for each feed (OSC, n = 6 pens). Additionally, steers either received no implant (6 pens), or were implanted with Revalor S (n = 6 pens) at the beginning of the study. Dry matter intake did not differ among dietary treatments (P = 0.13), but increased (P = 0.003) from 10.86 kg/d to 11.56 kg/d when cattle were implanted. By design, N intake was decreased (P < 0.001) from 0.276 kg/d to 0.249kg/d when steers were fed the OSC diet instead of the Control diet. This equated to a total reduction (P = 0.009) in N intake from 32.01 to 28.86 kg/hd over the course of the 116 d 1Ractopamine HCl, Elanco Animal Health, Greenfield, IN. 2Zilpaterol HCl, Intervet/Schering-Plough Animal Health, DeSoto, KS.

79
finishing period. There was no difference in final live weight due to diet (P = 0.82) or implant (P = 0.16). Implanted cattle had a greater (P < 0.001) ADG than non-implanted cattle, yet there was no diet x implant interaction (P = 0.80) or dietary (P = 0.78) effect on ADG. There were no interactions (P ≥ 0.36) between implant status and diet on any measured carcass characteristics. There was no difference in corrected yield grade (P = 0.44), marbling (P = 0.47), fat thickness (P = 0.10), or rib eye area (P = 0.43). Steers fed the OSC diet had no difference in premium value above base carcass value (P = 0.17), or total carcass value (P = 0.93) compared to steers fed the control diet. Cattle that were implanted had a numerical (P = 0.15) increase in hot carcass weight, and a subsequent numerical increase (P = 0.19) in total carcass value from $1099 to $1157/carcass, even though there was a decrease (P = 0.008) in marbling score compared to non-implanted cattle. It appears that oscillating dietary protein will decrease N inputs without compromising productivity or quality of feedlot steers regardless of implant status.
Winter Feedlot Management Severe winter storms in southeast Colorado in December of 2006 and January 2007 resulted in severe economic losses for the cattle feeding industry. Feed delivery and body weight data from an aborted research study at SECRC were analyzed to determine the cost of the blizzard (Wagner et al., 2008). Two hundred fourteen steers were weighed on December 26, 2006 and average weight (minus four percent pencil shrink) was 1230 lb ± 48. Over the following 58 day period there was a 7.0% death loss and average daily gain was -0.29 lb ± 0.46 for steers. Average steer weight (minus four percent pencil shrink) was 1212 lb ± 41 on February 22, 2007. Daily dry matter intake averaged 21.3 lb/hd/d. Net energy required for maintenance (NEm) was 21.9176 mcal/hd/d or 0.1919 mcal per kg SBW0.75. These data indicate that NEm required during and in the aftermath of a major winter weather event may be 2.5 fold higher than NEm required (0.077*SBW0.75) under thermal neutral conditions. Total cost per head associated with the poor performance observed in this study includes feed, interest, yardage, and death loss costs over the 58 day study period. These costs are shown in Table 6. Several assumptions were made in order to calculate these costs. Yardage rate was assumed to equal $0.35 per head per day. Ration costs were assumed to be $5.16, $6.33, $7.50, $8.68, or $9.85 per cwt as-fed ration based on corn costing $2.50, $3.50, $4.50, $5.50, or $6.50 per bushel at 15% moisture. Ration dry matter concentration was 70 %. Initial pay weight of the steers was 890 lb and initial price was assumed to be $80, $100, $120, or $140 per cwt. Shrink for the steers was 4 % upon arrival. Interest rate of 8 % was applied only to the initial cost of the steers. Steers were on feed 95 days prior to the study period and feed to gain ratio prior to the study period was 5.34 lb dry matter per lb gain. Processing and medicine costs prior to the study start were $20.00 per head. Death loss costs were 7 % of the steer value at the start of the study period. Steer value at the start of the study period included initial steer cost plus processing and medicine, yardage, interest and feed costs prior to the study period. These calculations show that economic losses associated with a catastrophic winter weather event may range from $185 per head when feed and feeder cattle are inexpensive to over $323 per head when feed and feeder cattle are expensive. Performance by cattle in the aftermath of a severe winter storm event may be severely impaired leading to catastrophic economic losses. A significant part of the poor performance may likely
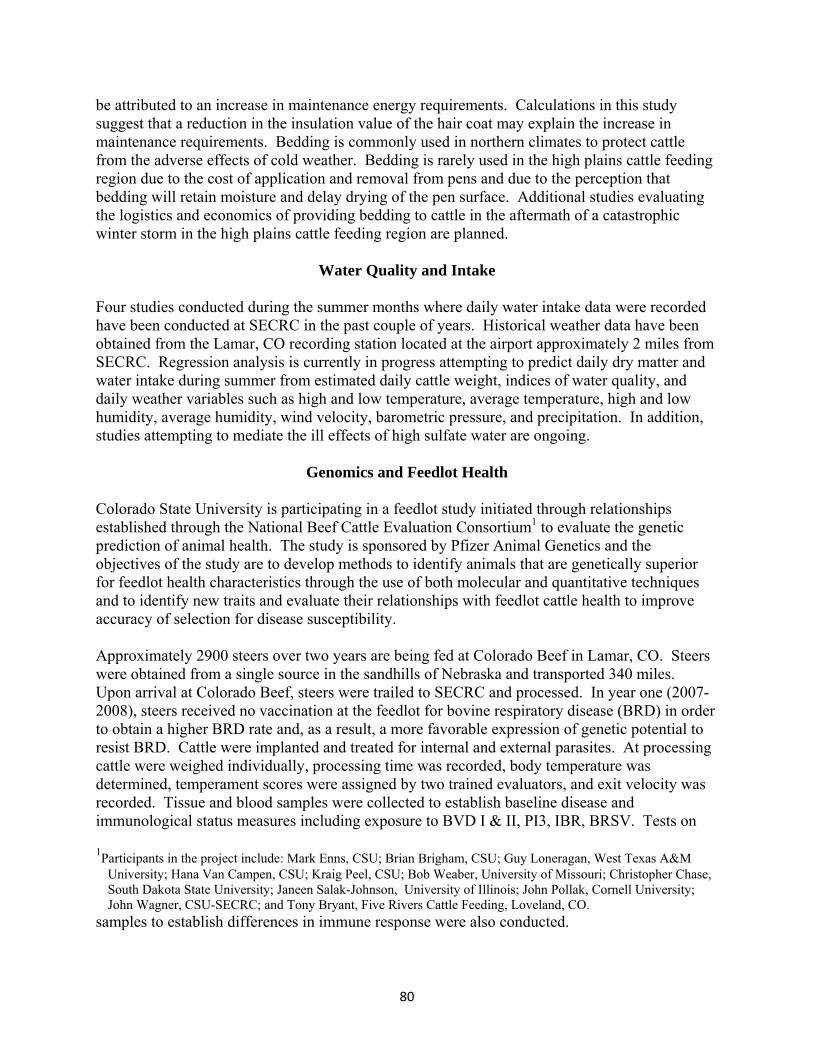
80
be attributed to an increase in maintenance energy requirements. Calculations in this study suggest that a reduction in the insulation value of the hair coat may explain the increase in maintenance requirements. Bedding is commonly used in northern climates to protect cattle from the adverse effects of cold weather. Bedding is rarely used in the high plains cattle feeding region due to the cost of application and removal from pens and due to the perception that bedding will retain moisture and delay drying of the pen surface. Additional studies evaluating the logistics and economics of providing bedding to cattle in the aftermath of a catastrophic winter storm in the high plains cattle feeding region are planned.
Water Quality and Intake
Four studies conducted during the summer months where daily water intake data were recorded have been conducted at SECRC in the past couple of years. Historical weather data have been obtained from the Lamar, CO recording station located at the airport approximately 2 miles from SECRC. Regression analysis is currently in progress attempting to predict daily dry matter and water intake during summer from estimated daily cattle weight, indices of water quality, and daily weather variables such as high and low temperature, average temperature, high and low humidity, average humidity, wind velocity, barometric pressure, and precipitation. In addition, studies attempting to mediate the ill effects of high sulfate water are ongoing.
Genomics and Feedlot Health
Colorado State University is participating in a feedlot study initiated through relationships established through the National Beef Cattle Evaluation Consortium1 to evaluate the genetic prediction of animal health. The study is sponsored by Pfizer Animal Genetics and the objectives of the study are to develop methods to identify animals that are genetically superior for feedlot health characteristics through the use of both molecular and quantitative techniques and to identify new traits and evaluate their relationships with feedlot cattle health to improve accuracy of selection for disease susceptibility. Approximately 2900 steers over two years are being fed at Colorado Beef in Lamar, CO. Steers were obtained from a single source in the sandhills of Nebraska and transported 340 miles. Upon arrival at Colorado Beef, steers were trailed to SECRC and processed. In year one (2007-2008), steers received no vaccination at the feedlot for bovine respiratory disease (BRD) in order to obtain a higher BRD rate and, as a result, a more favorable expression of genetic potential to resist BRD. Cattle were implanted and treated for internal and external parasites. At processing cattle were weighed individually, processing time was recorded, body temperature was determined, temperament scores were assigned by two trained evaluators, and exit velocity was recorded. Tissue and blood samples were collected to establish baseline disease and immunological status measures including exposure to BVD I & II, PI3, IBR, BRSV. Tests on 1Participants in the project include: Mark Enns, CSU; Brian Brigham, CSU; Guy Loneragan, West Texas A&M
University; Hana Van Campen, CSU; Kraig Peel, CSU; Bob Weaber, University of Missouri; Christopher Chase, South Dakota State University; Janeen Salak-Johnson, University of Illinois; John Pollak, Cornell University; John Wagner, CSU-SECRC; and Tony Bryant, Five Rivers Cattle Feeding, Loveland, CO.
samples to establish differences in immune response were also conducted.
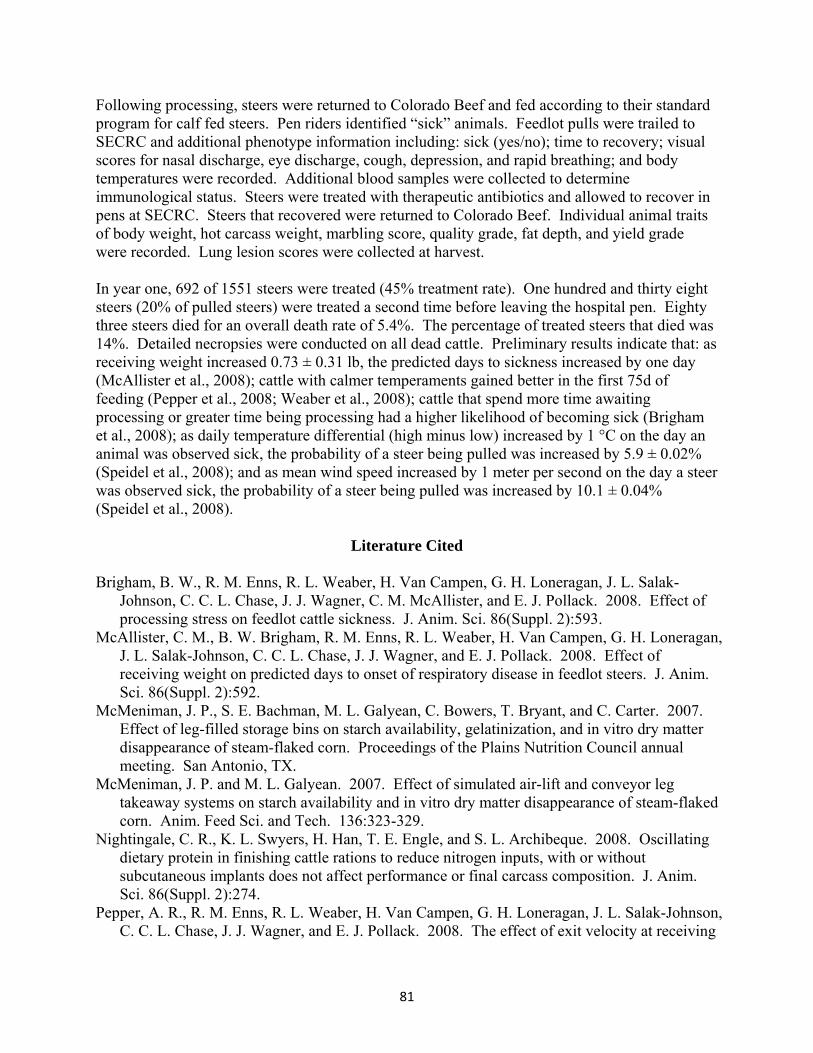
81
Following processing, steers were returned to Colorado Beef and fed according to their standard program for calf fed steers. Pen riders identified “sick” animals. Feedlot pulls were trailed to SECRC and additional phenotype information including: sick (yes/no); time to recovery; visual scores for nasal discharge, eye discharge, cough, depression, and rapid breathing; and body temperatures were recorded. Additional blood samples were collected to determine immunological status. Steers were treated with therapeutic antibiotics and allowed to recover in pens at SECRC. Steers that recovered were returned to Colorado Beef. Individual animal traits of body weight, hot carcass weight, marbling score, quality grade, fat depth, and yield grade were recorded. Lung lesion scores were collected at harvest. In year one, 692 of 1551 steers were treated (45% treatment rate). One hundred and thirty eight steers (20% of pulled steers) were treated a second time before leaving the hospital pen. Eighty three steers died for an overall death rate of 5.4%. The percentage of treated steers that died was 14%. Detailed necropsies were conducted on all dead cattle. Preliminary results indicate that: as receiving weight increased 0.73 ± 0.31 lb, the predicted days to sickness increased by one day (McAllister et al., 2008); cattle with calmer temperaments gained better in the first 75d of feeding (Pepper et al., 2008; Weaber et al., 2008); cattle that spend more time awaiting processing or greater time being processing had a higher likelihood of becoming sick (Brigham et al., 2008); as daily temperature differential (high minus low) increased by 1 °C on the day an animal was observed sick, the probability of a steer being pulled was increased by 5.9 ± 0.02% (Speidel et al., 2008); and as mean wind speed increased by 1 meter per second on the day a steer was observed sick, the probability of a steer being pulled was increased by 10.1 ± 0.04% (Speidel et al., 2008).
Literature Cited
Brigham, B. W., R. M. Enns, R. L. Weaber, H. Van Campen, G. H. Loneragan, J. L. Salak-Johnson, C. C. L. Chase, J. J. Wagner, C. M. McAllister, and E. J. Pollack. 2008. Effect of processing stress on feedlot cattle sickness. J. Anim. Sci. 86(Suppl. 2):593.
McAllister, C. M., B. W. Brigham, R. M. Enns, R. L. Weaber, H. Van Campen, G. H. Loneragan, J. L. Salak-Johnson, C. C. L. Chase, J. J. Wagner, and E. J. Pollack. 2008. Effect of receiving weight on predicted days to onset of respiratory disease in feedlot steers. J. Anim. Sci. 86(Suppl. 2):592.
McMeniman, J. P., S. E. Bachman, M. L. Galyean, C. Bowers, T. Bryant, and C. Carter. 2007. Effect of leg-filled storage bins on starch availability, gelatinization, and in vitro dry matter disappearance of steam-flaked corn. Proceedings of the Plains Nutrition Council annual meeting. San Antonio, TX.
McMeniman, J. P. and M. L. Galyean. 2007. Effect of simulated air-lift and conveyor leg takeaway systems on starch availability and in vitro dry matter disappearance of steam-flaked corn. Anim. Feed Sci. and Tech. 136:323-329.
Nightingale, C. R., K. L. Swyers, H. Han, T. E. Engle, and S. L. Archibeque. 2008. Oscillating dietary protein in finishing cattle rations to reduce nitrogen inputs, with or without subcutaneous implants does not affect performance or final carcass composition. J. Anim. Sci. 86(Suppl. 2):274.
Pepper, A. R., R. M. Enns, R. L. Weaber, H. Van Campen, G. H. Loneragan, J. L. Salak-Johnson, C. C. L. Chase, J. J. Wagner, and E. J. Pollack. 2008. The effect of exit velocity at receiving

82
and re-implant on average daily gain and weight at re-implant. J. Anim. Sci. 86(Suppl. 2):593.
Rooney, L. W. and R. L. Pflugfelder, 1986. Factors affecting starch digestibility with special emphasis on sorghum and corn. J. Anim. Sci. 63:1607-1623.
Speidel, S. E., R. M. Enns, R. L. Weaber, H. Van Campen, G. H. Loneragan, J. L. Salak-Johnson, C. C. L. Chase, J. J. Wagner, and E. J. Pollack. 2008. The role of daily ambient temperature range and mean wind speed on sickness of feedlot cattle. J. Anim. Sci. 86(Suppl. 2):593.
Wagner, J. J., P. T. Grubb, and T. E. Engle. 2008. Case Study: The effects of severe winter weather on net energy for maintenance required by yearling steers. Professional Animal Scientist 24:494-499.
Ward, C. F. and M. L. Galyean. 1999. The relationship between retrograde starch as measured by starch availability estimates and in vitro dry matter disappearance of steam-flaked corn. Burnett Center Internet Progress Report. No. 2. Accessed August 3, 2007.
Weaber, R. L., R. M. Enns, H. Van Campen, G. H. Loneragan, J. L. Salak-Johnson, C. C. L. Chase, J. J. Wagner, and E. J. Pollack. 2008. Correlations among measures of temperament, weight and gain of steers at placement and reimplant in a commercial feedyard. J. Anim. Sci. 86(Suppl. 2):592.
Table 1. Effect of sampling time and steam-flaked corn storage method on enzymatic starch availability, expressed as mls of gas produced in a three hour time period. Bin-stored Slab-stored Day Roll Post-storage %
Difference Roll Post-storage % Difference
1 47 20 57.4 54 35 35.2 2 39 25 35.9 51 27 47.1 3 35 20 42.9 53 40 24.5 4 50 25 50.0 55 35 36.4 5 55 26 52.7 54 44 18.5 Average 45.2 23.2 47.8 53.4 36.2 32.3 Bin versus Slab Stored, P < 0.009; Pre versus post-storage, P < 0.0001; Interaction, P > 0.26. Table 2. Effect of sampling time and steam-flaked corn storage method on in situ dry matter disappearance, expressed as area under the curve. Bin-stored Slab-stored Day Roll Post-storage %
Difference Roll Post-storage % Difference
1 5417.7 4301.6 20.6 5919.4 4842.7 18.2 2 5576.8 4602.3 17.5 5787.2 4695.0 18.9 3 5932.0 5798.1 2.3 6084.5 5376.7 11.6 4 5775.5 5606.6 2.9 5815.4 5047.7 13.2 5 5945.6 4990.6 16.1 4672.0 5988.8 -28.2 Average 5729.6 5057.2 11.7 5653.3 5192.2 8.2 Bin versus Slab Stored, P > 0.89; Pre versus post-storage, P < 0.08; Interaction, P > 0.64.

83
Table 3. Least squares means showing the effect of degradable intake protein (DIP) concentration on cumulative feedyard performance. Theoretical DIP, Crude protein equivalent DIP Contrasts Item 5.36 6.36 7.36 8.36 9.36 SEMa Linear Quad. Initial weight, lb 868 874 868 874 868 14 0.9657 0.3474 Final weight, lb 1331 1335 1344 1370 1358 19 0.0480 0.7864 ADG, lb/hd/db 3.81 3.80 3.91 4.08 4.04 0.10 0.0322 0.9987 DMI, lb/hd/dc 21.03 21.03 21.67 22.15 22.25 0.58 0.0596 0.9835 Feed/Gain 5.52 5.56 5.55 5.45 5.52 0.14 0.8153 0.9607 Gain/Feed, lb/cwt
18.18 18.08 18.06 18.54 18.15 0.49 0.8031 0.9700
aStandard error of the least square mean bAverage daily gain cDry matter intake Table 4. Least squares means showing the effect of degradable intake protein (DIP) concentration on carcass merit. Theoretical DIP, Crude protein equivalent DIP Contrasts Item 5.36 6.36 7.36 8.36 9.36 SEMa Linear Quad. HCW, lbb 839 837 855 858 855 13 0.0771 0.6288 Dressing percent
62.98 62.74 63.61 62.79 62.96 0.31 0.9852 0.3205
Fat depth, in. 0.48 0.49 0.52 0.54 0.51 0.03 0.0354 0.0972 REA, sq. in.c 13.33 12.89 13.23 12.82 13.24 0.23 0.6886 0.2139 KPH, %d 1.87 1.94 1.88 1.89 1.95 0.04 0.3454 0.6004 Yield Gradee 2.99 3.17 3.20 3.38 3.18 0.13 0.0381 0.0626 YG1 and YG2f 51.47 40.28 31.43 28.17 36.11 0.0498 0.0866 YG3f 41.18 50.00 50.00 49.30 55.56 0.2470 0.8341 YG4 and YG5f 7.35 9.72 18.57 22.53 8.33 0.2999 0.0154 Marbling, unitsg 3.95 4.01 3.95 3.99 4.10 0.09 0.2809 0.5768 QG Ch and Prh 39.71 37.50 32.86 40.85 31.94 0.4672 0.9657 QG Selectf 52.94 56.94 60.00 53.52 58.33 0.6925 0.7191 QG sub-Selectf 7.35 5.56 7.14 5.63 9.72 0.6240 0.4281 Liver abscessesi 16.18 8.33 10.00 2.82 2.78 0.0035 0.9657 aStandard error of the least square mean bHot Carcass Weight cRibeye Area dKidney, Pelvic, and Heart fat eCalculated from carcass measurements fPercentage of individual carcasses gMarbling score units, 3.00 = Slight00, 4.00 = Small00 hPercentage of individual carcasses grading USDA Choice and Prime iPercentage of individual livers showing signs of abscesses

84
Table 5. Feedlot performance and carcass characteristics of steers fed a static level of dietary protein (Control) or Oscillating dietary protein (Osc)1 and either implanted with no implant (None), or a standard implant (Syn)2
. Diet Implant strategy P-valuec Item Control Osc None Syn SE Diet Implant G × I DMI, kg/hd/d 11.36 11.06 10.86 11.56 0.24 0.39 0.08 0.80 N intake, g/hd/d 276.0 248.8 254.3 270.4 2.5 0.01 0.01 0.65 3N intake, kg/hd 32.01 28.86 29.50 31.37 0.64 0.01 0.07 0.87 G:F 0.166 0.172 0.163 0.175 0.004 0.33 0.06 0.69 4G:N 6.83 7.64 6.97 7.50 0.18 0.01 0.06 0.76 ADG, kg/steer 1.89 1.90 1.76 2.02 0.04 0.79 0.01 0.84 Initial BW, kg 366 361 364 363 12 0.76 0.95 0.98 Final BW, kg 586 581 568 599 14 0.82 0.16 0.94 HCW, kg 355 350 342 363 9.1 0.73 0.15 0.86 Marblingc 478 491 514 455 12 0.47 0.01 0.51 Quality graded 280 294 293 281 3.9 0.04 0.05 0.36 Fat thickness, cm
1.49 1.38 1.42 1.45 0.04 0.10 0.64 0.74
LM area, cm2 79.9 78.2 77.6 80.6 1.5 0.43 0.19 0.96 Yield grade 3.38 3.31 3.31 3.37 0.10 0.44 0.55 0.92 1Diets: Control (11.67% CP); Osc: Low (9.60 % CP) and Control diets oscillated on a 48-h interval 2Synovex-S (Fort Dodge Animal Health, Overland Park, KS) 3Total N intake over the entire 116 day finishing period 4Kg BW gain: kg N intake

85
Table 6. The effect of corn and feeder cattle prices on economic losses ($ per head) associated with a catastrophic winter storm. Cattle Pricea Cornb price, $ per bushel Item $ per cwt 2.50 3.50 4.50 5.50 6.50 Feed costsc 91.08 111.79 132.51 153.22 173.94 Yardaged 20.30 20.30 20.30 20.30 20.30 Intereste 80.00 9.05 9.05 9.05 9.05 9.05 100.00 11.31 11.31 11.31 11.31 11.31 120.00 13.58 13.58 13.58 13.58 13.58 140.00 15.84 15.84 15.84 15.84 15.84 Death lossf 80.00 65.27 67.69 70.12 72.54 74.97 100.00 77.99 80.41 82.84 85.26 87.69 120.00 90.71 93.13 95.56 97.98 100.40 140.00 103.42 105.85 108.27 110.70 113.12 Total costsg 80.00 185.69 208.83 231.98 255.12 278.26 100.00 200.68 223.82 246.96 270.10 293.24 120.00 215.66 238.80 261.94 285.08 308.22 140.00 230.64 253.78 276.92 300.06 323.20 a 890 lb pay weight b 15 % moisture c 21.3 lb per day dry matter intake for the 58 day study period and diet dry matter concentration was 70 % d $0.35 per head daily for the 58 day study period e 8 % on initial calf value f 7 % of the steer value at the start of the study period calculated from initial calf value and production costs up to the start of the study g Feed plus yardage, interest, and death loss costs

86
F igure 1. E ffec t of s toring S F C in overhead bin (HOT) on in s itu DM dis appearance.
y = ‐0.0105x2 + 1.3344x + 49.683
y = ‐0.011x2 + 1.4784x + 36.023
30.00
40.00
50.00
60.00
70.00
80.00
90.00
100.00
0 10 20 30 40 50 60 70 80
Hours F ermentation
Perce
ntage Disap
pea
rance
pre‐s torage
pos t‐s torage
F igure 2. E ffec t of s toring S F C on conc rete (C OOL ) on in s itu DM dis appearance.
y = ‐0.0141x2 + 1.6508x + 43.453
y = ‐0.0132x2 + 1.6589x + 35.202
30.00
40.00
50.00
60.00
70.00
80.00
90.00
100.00
0 10 20 30 40 50 60 70 80
Hours F ermentation
Perce
ntage Disap
pea
rance
pre‐s torage
pos t‐s torage

87
Appendix A - PUBLICATIONS
Archibeque, S. L., T. Borch, T. E. Engle, J. J. Wagner, and H. Han. 2008. Potential endocrine disruptors from dairies and feedlots, and environmental implications. Proc. 2008 Intermountain Nutr. Conf.
Archibeque, S. L., T. E. Engle, J. J. Wagner, H. Han, and E. Kebreab. 2008. Calculating the carbon footprint of livestock production. Proc. 69th Minnesota Nutr. Conf. (Suppl)
Brigham, B. W., R. M. Enns, R. L. Weaber, H. Van Campen, G. H. Loneragan, J. L. Salak-Johnson, C. C. L. Chase, J. J. Wagner, C. M. McAllister, and E. J. Pollack. 2008. Effect of processing stress on feedlot cattle sickness. J. Anim. Sci. 86(Suppl. 2):593.
Crawford, G. I., C. D. Keeler, J. J. Wagner, C. R. Krehbiel, G. E. Erickson, M. B. Crombie, and G. A. Nunnery. 2008. Effects of calcium magnesium carbonate and roughage level on feedlot performance, ruminal metabolism, and site and extent of digestion in steers fed high-grain diets. J. Anim. Sci. 86:2998-3013.
Davis, N. E., J. J. Wagner, T. E. Engle, and M. J. Corbin. 2008. Evaluation of ractopamine-hydrochloride on growth performance and carcass characteristics of feedlot heifers. Plains Nutrition Council. Texas Agrilife Research and Extension Pub. AREC 08-19:115.
Dorton, K. L., T. E. Engle, R. M. Enns, and J. J. Wagner. 2007. Effects of trace mineral supplementation, source, and growth implants on immune response of growing and finishing feedlot steers. Prof. Anim. Scientist 23(1):29.
Grubb, P. T., J. J. Wagner, and T. E. Engle. 2008. The effect of severe winter weather on net energy required for maintenance by yearling steers. J. Anim. Sci. 86(Suppl. 2):328.
Homm, J. W., W. J. Platter, M. J. Corbin, J. J. Wagner, N. E. Davis, J. S. Drouillard, and C. K. Walker. 2008. Effects of Ractopamine HCl on growth performance and carcass sharacteristics of feedlot heifers. J. Anim. Sci. 86(Suppl. 2):183.
Lacey, J. L., T. E. Engle, J. J. Wagner, and J. Seabrook. 2008. The effects of trace mineral source and water quality on health and performance of newly received cattle and the impact of trace mineral source and choline supplementation on carcass characteristics of steers. http://ansci.colostate.edu/files/research_reports/08ResearchReports/Lacey_TraceMineralsWaterQuality2008.pdf.
Lacey, J. L., J. J. Wagner, and T. E. Engle. 2008. Predicting daily water intake by yearling steers during summer. http://ansci.colostate.edu/files/research_reports/08ResearchReports/Lacey_WaterIntake2008.pdf.
Lacey, J. L., J. J. Wagner, and T. E. Engle. 2008. Predicting water intake by yearling steers during the summer. J. Anim. Sci. 86(Suppl. 2):181.
Lacey, J. L., J. J. Wagner, T. E. Engle, and J. W. Spears. 2008. The effects of potassium source and water quality on performance and carcass characteristics of feedlot steers. http://ansci.colostate.edu/files/research_reports/08ResearchReports/Lacey_WaterQualityandPotassium2008.pdf.
Lacey, J. L., J. J. Wagner, T. E. Engle, and J. W. Spears. 2008. The effects of dietary cation – anion balance on feedlot performance and carcass characteristics. http://ansci.colostate.edu/files/research_reports/08ResearchReports/Lacey_DCAB2008.pdf.
Lacey, J. L., J. J. Wagner, T. E. Engle, J. W. Spears, and S. L. Archibeque. 2008. The effects of dietary potassium source and water quality on performance and carcass characteristics of finishing cattle. J. Anim. Sci. 86(Suppl. 3):130.

88
McAllister, C. M., B. W. Brigham, R. M. Enns, R. L. Weaber, H. Van Campen, G. H. Loneragan, J. L. Salak-Johnson, C. C. L. Chase, J. J. Wagner, and E. J. Pollack. 2008. Effect of receiving weight on predicted days to onset of respiratory disease in feedlot steers. J. Anim. Sci. 86(Suppl. 2):592.
Neuhold, K. L., J. J. Wagner, D. A. Wallace, D. Chase, R. K. Peel, and T. E. Engle. 2008. Southeast Colorado Fed Beef Program. http://ansci.colostate.edu/files/research_reports/08ResearchReports/Neuhold_FedBeef2008.pdf.
Pepper, A. R., R. M. Enns, R. L. Weaber, H. Van Campen, G. H. Loneragan, J. L. Salak-Johnson, C. C. L. Chase, J. J. Wagner, and E. J. Pollack. 2008. The effect of exit velocity at receiving and re-implant on average daily gain and weight at re-implant. J. Anim. Sci. 86(Suppl. 2):593.
Sharman, E. D., T. E. Engle, J. J. Wagner, C. K. Larson, J. S. Schutz, and N. E. Davis. 2008. The effects of trace mineral source on performance and health of newly received steers and the impact of cobalt concentration on performance and lipid metabolism in finishing steers. Professional Animal Scientist 24:430-438.
Sharman, E. D., J. J. Wagner, T. E. Engle, J. S. Schutz, and N. E. Davis. 2006. The effects of trace mineral source on performance and health of newly received cattle. Cplorado State University. Animal Science Research Report.
Sharman, E. D., J. J. Wagner, T. E. Engle, J. S. Schutz, and N. E. Davis. 2006. The effects of trace mineral source on performance and health of newly received cattle. Colorado Nutrition Roundtable. Poster Presentation.
Sharman, E. D., J. J. Wagner, C. K. Larson, J. S. Schutz, N. E. Davis, and T. E. Engle. 2008. The effect of organic cobalt concentration on performance, carcass characteristics, tissue metabolites, and lipid metabolism in feedlot steers. Plains Nutrition Council. Texas Agrilife Research and Extension Pub. AREC 08-19:115.
Schutz, J. S., E. D. Sharman, J. J. Wagner, C. K. Larson, N. E. Davis, and T. E. Engle. 2008. The effects of trace mineral source on performance and health of newly received steers and the impact of cobalt concentration on performance and lipid metabolism in finishing steers. J. Anim. Sci. 86(E-Suppl. 2):139.
Schutz, J. S., J. J. Wagner, and T. E. Engle. 2007. Effects of bunk scoring on feedlot steer intake. J. Anim. Sci. 85(suppl. 2):150.
Schutz, J. S., J. J. Wagner, and T. E. Engle. 2007. The effect of bunk management score on dry matter intake by feedlot steers. Colorado State University. Animal Science Research Report.
Schutz, J. S., J. J. Wagner, T. E. Engle, E. D. Sharman, and N. E. Davis. 2006. Effect of feeding frequency on feedlot steer performance. Colorado Nutrition Roundtable. Poster Presentation.
Schutz, J. S., J. J. Wagner, T. E. Engle, E. D. Sharman, and N. E. Davis. 2006. Effect of feeding frequency on feedlot steer performance. Colorado State University. Animal Science Research Report.
Schutz, J. S., J. J. Wagner, T. E. Engle, E. D. Sharman, and N. E. Davis. 2007. Effect of feeding frequency on feedlot steer performance. J. Anim. Sci. 85(suppl. 2):165.
Speidel, S. E., R. M. Enns, R. L. Weaber, H. Van Campen, G. H. Loneragan, J. L. Salak-Johnson, C. C. L. Chase, J. J. Wagner, and E. J. Pollack. 2008. The role of daily ambient temperature range and mean wind speed on sickness of feedlot cattle. J. Anim. Sci. 86(Suppl. 2):593.
Wagner, J. J. 2006. B-vitamins and beef cattle production: Effects on performance and health. Colorado Nutrition Roundtable. Presentation.

89
Wagner, J. J. 2007. Sulfur toxicity in feedlot cattle. In Beef Performance Edge. ADM Alliance Nutrition. Beef Issue 14, Spring/Summer
Wagner, J. J. 2008. Sulfur toxicity in feedlot cattle. Proceedings for the “Use of Ethanol By-Products in Beef Cattle Operations” meeting. Oklahoma Panhandle Research and Extension Center, Goodwell, OK.
Wagner, J. J. and N. E. Davis. 2006. A meta-analysis evaluation of feeding MGA® to feedlot heifers implanted with TBA. Colorado State University. Animal Science Research Report.
Wagner, J. J. and N. E. Davis. 2007. A meta-analysis evaluation of feeding MGA® to feedlot heifers implanted with TBA. J. Anim. Sci. 85(suppl. 2):149.
Wagner, J. J., N. E. Davis, and C. D. Reinhardt. 2007. A meta-analysis evaluation of feeding melengestrol acetate to feedlot heifers implanted with estradiol, trenbolone acetate, or the combination of estradiol and trenbolone acetate. Prof. Anim. Scientist 23(6):625.
Wagner, J. J., T. E. Engle, Jos. J. Wagner, J. L. Lacey, and G. Walker. 2008. The effects of ZinMet® brand zinc methionine on feedlot performance and carcass merit in crossbred yearling steers. Professional Animal Scientist 24:420-429.
Wagner, J. J., P. T. Grubb, and T. E. Engle. 2008. Case Study: The effects of severe winter weather on net energy for maintenance required by yearling steers. Professional Animal Scientist 24:494-499.
Wagner, J. J., P. T. Grubb, and T. E. Engle. 2008. The effects of severe winter weather on net energy for maintenance required by yearling steers. http://ansci.colostate.edu/files/research_reports/08ResearchReports/Wagner_NEmWinter2008.pdf.
Wagner, J. J., J. L. Lacey, and T. E. Engle. 2007. The effect of organic trace minerals on feedyard performance and carcass merit in crossbred yearling steers. Colorado State University. Animal Science Research Report.
Wagner, J. J., J. L. Lacey, and T. E. Engle. 2008. The effect of organic trace minerals on feedyard performance and carcass merit in crossbred yearling steers. J. Anim. Sci. 86(Suppl. 3):121.
Wagner, J. J., K. L. Neuhold, T. C. Bryant, T. E. Engle, and S. L. Archibeque. 2007. Effect of finishing ration protein reduction on performance and carcass characteristics of feedlot steers. Colorado State University. Animal Science Research Report.
Wagner, J. J., K. L. Neuhold, T. C. Bryant, T. E. Engle, S. L. Archibeque. 2008. Effect of finishing ration protein reduction on performance and carcass characteristics of feedlot steers. J. Anim. Sci. 86(Suppl. 3):121.
Wagner, J. J., Jos. J. Wagner, T. E. Engle, and G. Walker. 2008. The effect of ZinMet® brand zinc methionine on feedyard performance and carcass merit in crossbred yearling steers. J. Anim. Sci. 86(Suppl. 2):139.
Weaber, R. L., R. M. Enns, H. Van Campen, G. H. Loneragan, J. L. Salak-Johnson, C. C. L. Chase, J. J. Wagner, and E. J. Pollack. 2008. Correlations among measures of temperament, weight and gain of steers at placement and reimplant in a commercial feedyard. J. Anim. Sci. 86(Suppl. 2):592.

90

91

92

93
2009 Graduate Student Research Presentations
Got Starlings? Evaluation of Feed Depredation by European Starlings B. E. Depenbusch, C. D. Lee, G. L. Parsons, and J. S. Drouillard, Kansas State University, Manhattan
During much of the year, European Starlings are inconspicuously dispersed into small flocks feeding on seeds, fruits, and insects. However, during winter months, starlings form larger flocks ranging from several hundred to over 1 million birds. Starlings eat nearly 2 pounds of feed per month, half of which is consumed directly from the feed bunk. In the current study, feed deliveries increased by 36% for cattle fed a traditional “meal” diet (i.e., 82% steam-flaked corn and 6% alfalfa hay) compared to cattle fed the same ingredients as extruded pellets during a period of severe Starling infestation. Following seasonal dispersal of Starlings in early March, feed deliveries of the traditional meal diet fell to pre-starling levels while feed deliveries of extruded diet remained unchanged. In a second study, we evaluated feed selection and depredation by Starlings with commonly fed finishing diets. The diets were placed into sections of the feed bunk which were made unavailable to the cattle by a secured wire-mesh cattle panel. Of the original 30 pounds of steam-flaked corn (82%) and alfalfa hay (6%) diet placed in the feed bunk, only 4 pounds of residual feed were recovered (P < 0.05) after Starlings returned to their evening roost. Starlings preferentially selected steam-flaked corn (i.e., starch), thereby concentrating the crude protein and crude fiber fractions (P < 0.05) in the residual feed. Similar trends for feed disappearance were observed for the dry-rolled corn (85%) with alfalfa hay (6%) diet; the steam-flaked corn (78%) with corn silage (12%) diet; and the diet containing steam-flaked corn (66%), alfalfa hay (6%), and distiller’s grain (25%). Crude protein content was not different between the fresh and residual feed for the diet containing dry-rolled corn and alfalfa hay or the diet containing steam-flaked corn and corn silage. Quantity and chemical composition of the extruded feed were not different (P > 0.05) for the fresh and residual feed. Starlings can consume substantial amounts of feed. Given the option, Starlings will preferentially select the starch portion of the diet, thereby creating variations in ration composition. Forming the total mixed ration into an extruded pellet can prevent feed depredation by Starlings. The Economic Impact of Increasing Corn Price and Supplementation Decisions on Economics of Beef Production Systems W. A. Griffin, T. J. Klopfenstein, G. E. Erickson, D. R. Mark, and K. M. Rolfe, University of Nebraska-Lincoln Eight-years of data comparing calf-fed and yearling production systems were utilized to determine differences in profitability with increasing corn prices and supplementation decisions prior to feedlot entry. Profitability was calculated using 2007 prices for grazing cost, ingredients other than corn, and fed cattle price. Corn was priced at $2.50, $4.50, and $6.50/bushel. Initial calf purchase price was determined assuming calf-feds (enter feedlot at weaning) were a breakeven opportunity. Yearlings grazed cornstalks during winter to early spring and grazed Sandhills range from early spring to late summer. At the conclusion of the grazing season yearlings were finished in the feedlot. Three different winter supplementation practices were evaluated for the yearling system: supplementing with 5.9 lb of corn and supplement (CORN), 5.0 lb of wet corn gluten feed (WCGF) priced at 90% the price of corn, and 4.0 lb of wet distillers grains (WDGS) priced at 70% the price of corn. When corn price was $2.50 and $4.50/bushel, yearlings fed CORN (P > 0.61) and WCGF (P > 0.19) were similar in profitability

94
compared to calf-feds. When corn price was $6.50/ bushel yearlings fed WCGF were $46.45/steer (P = 0.04) and CORN was numerically $31.62/steer more profitable (P = 0.13) than calf-feds. When yearlings were supplemented WDGS, profitability was not different for yearlings when corn price was $2.50/bushel (P = 0.30). However, profitability was greater for yearlings fed WDGS compared to calf-feds when corn price was $4.50 (P = 0.03) and $6.50/ bushel (P < 0.01). As corn price increased profitability for long yearlings compared to calf-feds increased when yearlings were supplemented CORN (- $11.08 to $31.62/steer), WCGF ($9.19 to $46.45/steer), and WDGS ($22.70 to $81.56/ steer). From this study we conclude that as corn prices increase supplementation programs can have a large impact on profitability differences between calf-fed and long yearling programs. Crude Protein, Ash, Phosphorus, Neutral Detergent Fiber, and Starch Concentrations in Particle Size Distributions of Corn Steam Flaked to Varying Bulk Densities K. E. Hales1, N. A. Cole2, A. Leytem3, M. L. Galyean1, 1Department of Animal and Food Sciences, Texas Tech University, Lubbock; 2USDA-ARS Conservation and Production Research Laboratory, Bushland, TX; and 3USDA-ARS Northwest Irrigation and Soils Research Laboratory, Kimberly, ID The particle size distribution that results from steam flaking cereal grains could be related to differences in the chemical composition of steam-flaked (SF) vs. unprocessed grain. Particle size distribution and associated CP, P, NDF, and starch concentrations in corn steam flaked to bulk densities of 22, 26, and 30 pounds/bushel was evaluated by tempering whole shelled corn with 13% added moisture (wt/vol) for approximately 18 h and steam conditioning for 20 min, followed by flaking to the desired densities. Resulting SF corn was sieved to determine the proportions in particle size categories of > 8,000 µm, 4,760 to 8,000 µm, 2,360 to 4,760 µm, 1,180 to 2,360 µm, 600 to 1,180 µm, and < 600 µm. Concentrations of CP, P, NDF, and starch were analyzed in the particle size fractions and in the whole flakes. Data were analyzed as a completely randomized design with batch (5 to 6 batches per bulk density) as the experimental unit using the Mixed procedure of SAS. There were interactions (P < 0.01) between sieve size and bulk density for the proportions of chemical components within each sieve size. The proportion of starch, CP, ash, and NDF in particles collected on the largest sieve (>8,000 µm) decreased (P < 0.05) as bulk density decreased. In addition, the proportion of total starch within particles of 4,760 to 8,000 µm was greater (P < 0.05) for 22 and 26 than for 30 pound/bushel flakes. For total CP, the proportion collected on the 1,180 and 4,760 µm screens was greater (P < 0.05) for 22 than for 30 pound/bushel flakes. The proportion of P in particles greater than 4,760 µm in size decreased (P < 0.05) with more extensive grain processing, whereas it was greater (P < 0.05) for 22 than 26 and 30 pound/bushel flakes in the particles smaller than 1,180 µm. The proportions of total NDF and ash in the 1,180 µm particles increased (P < 0.05) with decreasing bulk density. Concentrations of starch, CP, ash, P, and NDF in the whole flakes were not affected by bulk density. The greatest proportion of corn grain particles was in the 8,000-µm screen, whereas the 600-µm sieve had the least particles. Therefore, within the range of bulk density we evaluated nutrients are not lost during steam flaking; however, some nutrients accumulate in finer particles created during the steam flaking process. If smaller particles are disproportionately sampled, flaked corn would seem to differ in composition from the intact grain.

95
Bovine Respiratory Disease: Effect of Morbidity during Preconditioning on Feedlot Growth Performance and Carcass Characteristics B. P. Holland1, L. O. Burciaga-Robles1, D. L. Step2, D. L. VanOverbeke1, and C. R. Krehbiel1, 1Department of Animal Science and 2Department of Veterinary Clinical Sciences, Oklahoma State University, Stillwater
Heifers with expected high risk of Bovine Respiratory Disease (BRD; n= 337; initial BW = 241.3 ± 16.6 kg) were assembled at a Kentucky order buyer facility and delivered to Stillwater, OK in September 2007. During a 63-d preconditioning period, morbidity and mortality attributed to BRD were 57.6% and 8.6%, respectively. Immediately following preconditioning, heifers were grouped according to health outcome category and allotted to finishing pens (5 to 7 heifers/pen). Heifers were never treated for BRD (0X; n = 9 pens), treated one time (1X; n = 9 pens), two times (2X; n = 6 pens), 3 times (3X; n = 6 pens), or designated as chronically ill (C; n = 2 pens). Arrival BW was not different (P = 0.21) among treatment categories. However, disease incidence during preconditioning decreased growth (P < 0.001), resulting in BW of 318, 305, 294, 273, and 242 kg for 0X, 1X, 2X, 3X, and C, respectively, at the start of the finishing phase. Estimates on the LM, taken by ultrasound on d 65 and 122, were combined with BW and visual appraisal to target common average end point within category and block. On average, heifers were slaughtered on d 163 for 0X, 1X, and 2X, d 182 for 3X, and 189 for C (P < 0.01). Final BW was similar for heifers treated 0, 1, 2, or 3 times, but tended to be lower (P = 0.06) for heifers deemed chronically ill. Heifers had similar (P = 0.13) ADG among BRD treatment categories, but DMI was lower (P < 0.01) for C. Therefore, G:F was greatest (P < 0.001) for C, intermediate for 2X and 3X, and least for 0X and 1X. Longissimus muscle area, when estimated by ultrasound on d 65 and 122, and fat thickness over the 13th rib were decreased (P < 0.05) as the number of BRD treatments increased. Additionally, ultrasound estimates of intramuscular fat tended (P < 0.09) to decrease as the number of BRD treatments increased. Similar to BW, HCW was lower (P = 0.03) for C than other categories. Marbling score tended (P = 10) to be lower for 3X and C than for 0X, 1X, and 2X, but no other differences in carcass traits were detected (P > 0.24). Less than 20 additional days on feed were required for heifers treated 3 times to have similar weights and carcass characteristics to heifers never treated for BRD. Segregating and ‘re-starting’ animals with multiple BRD treatments may be a viable alternative to realizing these cattle. Use of Microarray to Determine Genes Differentially Expressed in Muscle and Subcutaneous Fat of Heifers Never Treated or Considered Chronically Morbid After a 63-d Preconditioning Program J. Johnson, D. R. Stein, L. O. Burciaga-Robles, B. P. Holland, D. L. Step, U. E. DeSilva, and C. R. Krehbiel, Oklahoma State University, Stillwater The objective was to determine gene expression changes in growing heifers due to bovine respiratory disease (BRD) using microarray analysis. Tissue biopsy samples from the LM and s.c. fat (SCF) between the 12th and 13th rib from heifers never treated against BRD (HEALTHY; n = 5) and heifers classified as chronically morbid (CHRONIC; n = 5) were collected after a 63 d preconditioning program. CHRONIC was defined as animals receiving at least three antimicrobial treatments and a loss of BW during the previous 21 d on feed. Hybridizations utilizing a long oligo bovine array were performed. Preprocessing and normalization of data was accomplished using the R-project statistical environment with the Bioconductor and LIMMA packages through the GenePix AutoProcessor (GPAP 3.2).

96
Significance level for differentially expressed genes was set at P < 0.01 with a twofold change or greater. Ontology analysis of the differentially expressed genes was carried out using GFINDer with emphasis on biological process and molecular function. To further elucidate the interaction(s) of annotated genes within the context of metabolic or signaling pathways, Ingenuity Pathways Analysis (IPA) was utilized to identify the most relevant biological mechanisms, pathways and functions of the differentially expressed genes. Of the 186 differentially expressed genes in LM (143 down- and 43 up-regulated) and the 121 differentially expressed genes in SCF (44 down- and 77 up-regulated); 146 and 97, respectively, had known ontology. Differentially expressed genes were mapped to pathways involved in immunological functions, metabolism, catalytic activities, binding, proteolysis, apoptosis, translation, transcription, growth, and transport of nutrients. These differences in gene expression across tissues and between treatment groups will provide a better understanding of the impact BRD has on immune response and animal growth. Effect of Bambermycins and Level of Distillers Grains plus Solubles on Performance and Carcass Characteristics of Feedlot Steers J.M. Kelzer1, G.I. Crawford2, E.R. Loe3, A.E. Wertz-Lutz3, and B.D. Rops3,1University of Minnesota, St. Paul, 2Extension Regional Center, University of Minnesota, Hutchinson, 3South Dakota State University, Brookings. The response of bambermycins, a medicated feed additive (MFA), is not well understood in high-grain feedlot diets. An experiment was conducted to evaluate effects of bambermycins (GAINPRO®, Huvepharma, Inc.) and monensin and tylosin (Rumensin® and Tylan®, Elanco Animal Health) on performance, carcass characteristics, and economic analysis when supplemented to steers consuming feedlot diets containing modified distillers grains plus solubles (mDGS). Two hundred fifty-six crossbred yearling steers averaging 931 ± 60 lb initial BW were sorted by weight into three blocks in a randomized complete block design with a 2 x 2 factorial arrangement of treatments. Factors included: MFA (bambermycins at 20 mg/hd daily, BAMB, or a combination of monensin and tylosin at respective 380 and 90 mg/hd daily, MON+TYL) and level of mDGS inclusion (15%, 15mDGS, and 30% of diet DM, 30mDGS). Steers were fed a 63 Mcal/cwt NEg diet containing a 1:1 combination of dry-rolled and high-moisture corn once daily. Total d on feed were 104 and 126 d for heavy and intermediate weight and light weight steers, respectively. Final live BW (P = 0.095) and DMI (P = 0.05) increased with 15mDGS and 30mDGS+BAMB compared to 30mDGS+MON+TYL (1375, 1375, 1380 vs. 1338 ± 12 lb and 28.1, 28.0, 27.7 vs. 26.5 ± 0.3 lb/d) for 15mDGS+BAMB, 15mDGS+MON+TYL, 30mDGS+BAMB, and 30mDGS+MON+TYL, respectively. Overall ADG tended (P = 0.08) to improve with BAMB compared to MON+TYL but was not affected by mDGS level. Feed conversion was not altered by mDGS, MFA, or their interaction and averaged 6.9 ± 0.1. Hot carcass weight and LM area were not affected by mDGS, MFA, or their interaction and averaged 798 ± 7 lb and 12.5 ± 0.2 in2. Steers fed BAMB had greater back fat thickness (P = 0.03) than steers fed MON+TYL. Marbling scores and percentage of CAB carcasses were greater (P < 0.01) with BAMB than with MON+TYL and tended (P < 0.10) to be greater with 15mDGS than with 30mDGS. Carcasses from 30mDGS+BAMB graded 80.3% choice while carcasses from 30mDGS+MON+TYL graded 54.7% choice (P = 0.04); however, BAMB produced more yield grade 4 carcasses (P = 0.02). When economics were evaluated on the 30mDGS treatments, live and carcass values for BAMB were $1,208 and $1,124/hd compared to $1,171 and $1,087/hd for MON+TYL. Cost of gain was $0.06/lb less for BAMB

97
than for MON+TYL ($0.82 vs. $0.88/lb). When combining total cost of gain with final market value, BAMB returned an additional $27 over MON+TYL. Compared to monensin and tylosin, including bambermycins in feedlot diets containing 30% mDGS improved feedlot performance and carcass quality, increased live and carcass value, and reduced cost of gain. Effects of Adding MIN-AD to Steam-flaked Corn-based Diets With or Without Wet Corn Distillers Grain on Performance by Beef Cattle During Receiving and Finishing Phases M. L. May, M. J. Quinn, N. Di-Lorenzo, D. R. Smith, K. E. Hales, D. Simms1, and M. L. Galyean. Texas Tech Univ., Lubbock and 1MIN-AD, Inc., Amarillo Effects of wet corn distillers grain (WCDG) and MIN-AD were evaluated in a 42-d receiving trial (220 steers; initial BW = 615.8 lb) and a subsequent finishing trial (192 steers). Both phases were completely randomized block designs with a 2 x 2 factorial arrangement of dietary treatments in steam-flaked corn-based diets. Factors were: (1) no added MIN-AD or MIN-AD added at 0.75% of the dietary DM; and (2) 0 or 15% wet corn distillers grains (DM basis). No MIN-AD supplementation x WCDG addition interactions were detected for performance responses (P ≥ 0.076) in either the receiving or finishing period. Neither MIN-AD nor WCDG affected ADG, DMI, G:F, or 42-d BW (P > 0.129) during the receiving period. Compared with controls, cattle fed WCDG in the finishing phase had greater ADG (P < 0.01; 3.21 vs. 3.03 lb/d) and DMI (P < 0.01; 21.80 vs. 20.53 lb/d), increased final BW (P < 0.01; 1,325.3 vs. 1,290.8 lb), and HCW (P < 0.01; 859.2 vs. 838.6 lb), but G:F was not affected (P = 0.97) by WCDG. Simple-effect means (interaction P-value = 0.044) for calculated NEg concentration were 0.62, 0.64, 0.62, and 0.61 Mcal/lb of DM (SE = 0.007) for the 0% WCDG without MIN-AD, 0% WCDG with MIN-AD, 15% WCDG without MIN-AD, and 15% WCDG with MIN-AD treatments, respectively, with the NEg concentration for 0% WCDG with MIN-AD differing (P < 0.01) from the 15% WCDG with MIN-AD treatment, but no other differences among treatments. Fecal pH of cattle fed 15% WCDG was less than for controls (P < 0.05; 5.99 vs. 6.29). Feeding WCDG had no effect on dressing percent (P = 0.32), LM area (P = 0.33), 12th rib fat (P = 0.51), KPH (P = 0.92), calculated yield grade (P = 0.51), marbling score (P = 0.19), percentage of Choice or greater carcasses (P = 0.75), or incidence of liver abscesses (P = 0.81). Supplementing cattle with MIN-AD increased LM area (P = 0.031; 12.89 vs. 12.58 square inches), but finishing phase ADG (P = 0.46), DMI (P = 0.55), G:F (P = 0.75), final BW (P = 0.063), HCW (P = 0.103), dressing percent (P = 0.67), 12th rib fat (P = 0.61), KPH% (P = 0.94), calculated yield grade (P = 0.24), marbling score (P = 0.97), percentage of Choice or greater carcasses (P = 0.55), and incidence of liver abscesses (P = 0.77) were not affected by MIN-AD. Results suggest that feeding 15% (DM basis) WCDG in a steam-flaked corn-based diet did not affect cattle performance during the receiving period, but it increased DMI, ADG, final BW, and HCW during the finishing period. Supplemental MIN-AD did not affect performance and did not interact with the addition of WCDG. Optimal Roughage Level in Finishing Diets Containing Combinations of Flaked Corn and Dried Distiller’s Grains with Solubles Kevin Miller, Matt Shelor, Garrett Parsons, And Jim Drouillard, Kansas State University, Manhattan Flaked corn finishing diets containing dried distillers grains with solubles (DDGS) were fed to crossbred heifers (n=298, initial BW=739 lb) to determine optimal concentration of alfalfa hay

98
as the source of roughage. Cattle were stratified by weight and allotted, within strata, to 20 dirt-surfaced pens with 15 animals per pen. Diets consisted of steam-flaked corn (density = 28 lb/bu) with 25% DDGS, 8% corn steep liquor, and ground alfalfa hay at 3, 6, 9, 12, or 15% of diet DM (4 pens per level of alfalfa hay). Monensin, tylosin, and melengestrol acetate were fed at the rates of 300, 90, and 0.5 mg/heifer daily. Cattle were fed once daily ad libitum for 126 days and then transported to a commercial abattoir for harvest. Carcass data was collected following a 24-h chill. Heifers fed 3, 6, 9, 12, and 15% alfalfa had DMI of 23.6, 24.4, 24.8, 26.1, and 25.4 lb/d, respectively (linear P<0.01, quadratic P<0.05). Feed efficiencies were not impacted (linear, P=0.19; quadratic, P = 0.82) by roughage level (6.96, 6.99, 6.97, 7.16, 7.16, for 3, 6, 9, 12, and 15% alfalfa, respectively). Hot carcass weight tended to increase with increasing level of roughage (741, 749, 754, 761, 753 lb for 3, 6, 9, 12, and15% roughage, respectively; linear effect, P=0.096). Daily gain was increased by 7.7% for heifers fed 12% roughage compared to those fed 3% roughage. Yield grade increased linearly (P<0.05) as percent alfalfa in the diet increased. There was a tendency for a quadratic effect of alfalfa hay level on deposition of intramuscular fat (P = 0.06), with 9% alfalfa yielding the most marbling. The percentages of carcasses grading USDA Choice or better were 59, 67, 63, 55, and 49 for cattle fed 3, 6, 9, 12, and 15% roughage, respectively (linear, P = 0.15, quadratic, P = 0.23). In this study, based on the first derivative of 2nd order polynomials, maximum values for feed intake, hot carcass weight, and marbling score were achieved with 14.1, 11.5, and 8.6% alfalfa hay, respectively. The optimal level of alfalfa in flaked corn diets with distiller’s grains is therefore a function of the performance measures that are regarded as being of greatest interest or economic impact. The Effect of Ensilage Storage Duration and Proportion of Wet Distiller’s Grains and Straw on in situ Dry Matter Disappearance K. L. Neuhold, J. J. Wagner, T. E. Engle, S. L. Archibeque, and K. S. Sellins, Colorado State University, Fort Collins and Lamar The objective of this study was to investigate the effect of the proportion of wet distiller’s grains (WDG) and wheat straw (WS) and ensilage storage duration on in situ DM disappearance. WDG and WS were mixed at three different ratios of WDG to WS 100:0, 90:10, 80:20, 70:30, and 0:100. 90:10, 80:20, 70:30 were packed into experimental silos. Silos were made out of PVC pipe (3.8 cm x 15.0 cm) caped on one end and sealed with a removable rubber cap on the other end. Mixtures were ensiled for 0, 4, 8, 12, and 24 d. Samples were prepared for in situ evaluation by drying the entire silo contents for each time point for 48 hr at 60 ºC and then grinding the sample through a 2 mm screen. A mass to area ratio of 10 mg sample/cm2 was utilized for each in situ bag. Bags were incubated in two fistulated steers for 0, 4, 8, 12, 24, 48, and 72 h. Steers were fed a high concentrate diet (70 % steam flaked corn), for 21 d then in situ fermentation was initiated. After the 72 h time point, steers were switched to a high roughage diet (50 % corn silage and 50 % alfalfa) for 21 d and then in situ fermentation was initiated. After the 72 h incubation, in situ bags were washed, dried for 48 hr at 60 ºC, and DM disappearance calculated. Polynomial curves were generated over incubation time within each ensiling time by steer diet. The area under each curve was calculated and Proc mixed was used for statistical analysis. Days ensiled had no impact on DM disappearance. The straw to WDG was a significant (P < 0.0001) source of variation for DM disappearance. One hundred percent WDG had the greatest disappearance, followed by 90:10, 80:20, 70:30, and WS ( 56.17, 46.92, 42.07, 36.07, 27.12 lsm respectively). Diet (high concentrate or high roughage diet) was also a significant (P < 0.0001) source of variation for DM disappearance (36.7, 46.9 lsm respectively). Samples across all time

99
points had greater DM disappearance when incubated in steers consuming a high roughage diet compared to steers consuming a high concentrate diet. Using WS to facilitate storage of WDG did not improve in situ disappearance of WS. Comparison of Revalor XS, a New Single Dose Implant, to a Revalor IS and Revalor S Implant Strategy in Finishing Steers C. A. Nichols1, G. E. Erickson1, J. T. Vasconcelos2, M. N. Streeter3, B. D. Dicke4, D. J. Jordan4, R. J. Cooper4, T. L. Scott4 and T. J. Klopfenstein1, 1University of Nebraska, Lincoln, 2University of Nebraska Panhandle Research and Extension Center, 3Intervet/Schering-Plough, Inc., Millsboro, DE and 4Cattlemen’s Nutrition Services, Lincoln, NE A commercial feedlot experiment was performed to compare the effects of a Revalor IS/ Revalor S (RevIS-S) implant strategy to a Revalor XS (RevXS) single implant strategy on performance and carcass characteristics of feedlot cattle. Yearling steers (n = 1,356; initial BW = 689.3 ± 35.2 lb) were used in a randomized complete block design trial with initial arrival date as the blocking factor. Steers were allocated to pens based on sorting every 2 steers into 1 of 2 pens prior to processing. Pens were assigned randomly to 1 of 2 implant treatments. Cattle on the RevIS-S treatment were reimplanted on d80 with Revalor S. Mean days on feed was 157. Diets consisted of 54.9% dry rolled corn, 35% WDGS, 5.5% mixed hay and 4.6% liquid supplement (DM basis). Live performance was calculated from pen BW shrunk 4%. Data were analyzed using the MIXED procedure of SAS and Chi Square distribution analysis for quality and yield grade. There were no differences (P > 0.10) in DMI due to treatment. Using final BW calculated from HCW, there were no differences (P > 0.10) in final BW, ADG, or G:F. No differences in final BW, ADG and G:F (P > 0.10) were observed for live performance. Marbling score, 12th rib fat, LM area and yield grade were unaffected (P > 0.10) by implant strategies. Steers on the RevXS treatment had a greater number of low choice carcasses (P < 0.01) and a lower number of select carcasses (P < 0.01) compared to RevIS-S, with 58% of RevXS cattle grading low choice and 50% of RevIS-S cattle grading low choice. Steers on the RevXS treatment tended to have a greater (P = 0.11) number of USDA Yield Grade 5 carcasses. Aside from improved quality grade, cattle implanted with Revalor XS performed similar to cattle implanted initially with Revalor IS followed by Revalor S. Dose and Release Pattern of Anabolic Implants Affects Growth of Finishing Beef Steers S. L. Parr1, K. Y. Chung1, J. P. Hutcheson2, W. T. Nichols2, D. A. Yates2, M. N. Streeter2, R. S. Swingle3, and B. J. Johnson1, 1Texas Tech University, Lubbock, 2Intervet / Schering-Plough Animal Health, De Soto, KS, and 3Cactus Research Ltd., Amarillo, TX Revalor-XS, a new anabolic implant, has a polymer coating on 6 of the 10 pellets. This coating results in a more sustained anabolic release pattern over time. Data demonstrating the effect of this release pattern on steer performance and carcass characteristics are limited. Three experiments were used to evaluate the effect of trenbolone acetate (TBA) and estradiol-17β (E2) dose and release pattern on performance and carcass characteristics of English and English cross-finishing beef steers. All data were analyzed as a randomized block or randomized complete block design with pen as the experimental unit. In Exp. I, steers (n = 2,153; 4 to 7 pens/treatment; initial BW = 694 lb) were fed an average of 173 d. Treatments were: (1) no implant (NI); (2) Revalor-S (120 mg TBA and 24 mg E2; REV-S; (3) Revalor-IS followed by

100
REV-S (cumulatively 200 mg TBA and 40 mg E2; reimplanted at 68 to 74 d; REV-IS/S); and (4) Revalor-XS (200 mg TBA and 40 mg E2; REV-X). Carcass-adjusted final BW was greater (P < 0.05) for REV-X and REV-IS/S than for REV-S (1345, 1341, and 1318 lb respectively). Daily DMI did not differ (P > 0.10) among the 3 implant treatments, but carcass-adjusted F/G was less (P < 0.05) for REV-X and REV-IS/S than for REV-S (5.09 and 5.13 vs. 5.32). Both HCW and LM area were greater (P < 0.05) for REV-X and REV-IS/S than for REV-S. Marbling scores were greatest (P < 0.05) for NI and REV-S and least (P < 0.05) for REV-IS/S. In Exp. II, steers (n = 5,773; 10 pens/treatment; initial BW = 862 lb) were fed an average of 131 d, with treatments of REV-S, REV-IS/S (reimplanted at 44 to 47 d), and REV-X. Carcass-adjusted final BW (1318 lb), ADG (3.48 lb), DMI (20.71 lb), F/G (5.97), and HCW (823 lb) did not differ (P > 0.10) among treatments. Yield grade was greatest for REV-S and least for REV-IS/S (P < 0.05) and quality grade was less (P < 0.05) for REV-IS/S than for REV-S and REV-X. In Exp. III, steers (n = 1,833; 10 pens/treatment; initial BW = 611 lb) were fed an average of 197 d and received either REV-IS/S (reimplanted at 90 to 103 d) or REV-X. Carcass-adjusted final BW (1377 vs. 1396 lb) and ADG (3.99 vs. 3.89 lb) were greater (P < 0.05) for REV-X-implanted steers. Daily DMI (19.78 lb) did not differ between treatments, but F/G tended (P < 0.10) to be less (4.89 vs. 5.07) and HCW was greater (873 vs. 861 lb; P < 0.05) for REV-X than for REV-IS/S. These data indicate that when TBA/E2 dose is equal, the altered release rate associated with REV-X may improve performance and marbling score, but these effects may depend on the length of the feeding period. Effects of Extended Zilmax Withdrawal on Performance, Carcass Traits, and Shear-force Value of Steaks from Finishing Heifers G. L. Parsons1, B. E. Depenbusch1, C. D. Reinhardt 1, D. A. Yates2, J. P. Hutcheson2, and J. S. Drouillard1, 1Kansas State University, Manhattan, and 2Intervet/Schering-Plough, Desoto, KS A feedlot study was conducted to determine if extended withdrawal of zilpaterol hydrochloride (Z) would ameliorate negative effects on marbling score and shear force without sacrificing improvement in carcass weight. Crossbred heifers (n = 450; 1031 ± 60.0 lb) were blocked into heavy and light groups. Within block cattle were stratified by BW and allocated randomly to feedlot pens containing 7 to 10 heifers each, with 9 pens/treatment. Treatments were arranged as a 2 × 3 factorial, with factors consisting of Z fed at 0 or 7.5 g/Ton DM and withdrawal times (W) of 3, 10, or 17 d. Heifers were implanted with Revalor-H and fed steam flaked corn-based finishing diets once daily, at ad libitum intake, which supplied roughly 300 mg monensin, 90 mg tylosin, and 0.5 mg melengestrol acetate per animal daily. Zilpaterol was fed for 20 d. With the exception of yield grade, there were no Z×W interactions (P > 0.10). Feeding Z improved USDA yield grade compared with controls after 3 and 10 d of withdrawal, but no differences were detected between Z and controls with 17 d withdrawal. Feeding Z for 20 d did not affect DMI, ADG, or gain efficiency (P > 0.10), but increased HCW, dressing percentage, and longissimus muscle area (P < 0.01), and decreased marbling scores (P < 0.01). Feeding Z increased HCW by 28.2, 17, and 11.5 lbs at 3, 10, and 17 d of withdrawal, respectively (P > 0.54). Marbling scores were 457, 466, and 459 in control cattle, and 401, 445, and 442 in Z cattle after 3, 10, and 17 d of withdrawal, respectively (P > 0.14). Increasing W increased final BW, HCW, marbling scores (P < 0.04), and back fat (P < 0.03) which can also be explained by increasing days on feed. Whole loins were collected from 15 randomly selected cattle per treatment in each block and wet aged in vacuum bags for 7, 14, and 21d. There was an

101
interaction between treatment and days of aging with respect to shear force (P = 0.05), with steaks from Z having 1.56 lbs higher shear value after aging 3 d, 1.15 lb higher shear after 14 d, and 0.85 lbs higher shear after 21 d.However, extending withdrawal from 3 to 10 or 17 d did not alter shear force differences between Z and controls. Feeding Z for 20 d increases carcass weight, muscle, and leanness, but reduces marbling score and tenderness. This study suggests no benefit in extending withdrawal time after feeding zilpaterol hydrochloride for 20 d. Effects of Ruminally Degradable N in Diets Containing Wet Corn Distiller’s Grains and Steam-flaked Corn on Feedlot Cattle Performance and Carcass Characteristics C. H. Ponce1, M. S. Brown1, N. A. Cole2, C. L. Maxwell1, and J. C. Silva1, 1Feedlot Research Group, Department of Agricultural Sciences, West Texas A&M University, Canyon, and 2USDA-ARS Conservation and Production Research Laboratory, Bushland, TX Assessment of degradable N needs in diets containing wet corn distiller’s grains with solubles (WCDGS) is needed to aid the cattle feeding industry in managing feed costs and potential environmental issues. Yearling steers (n = 525; initial weight = 822 +/- 28 lb) were housed in 56 pens (9 to 10 steers/pen) and received treatments in a 2 x 3 + 1 factorial. Factors included WCDGS (15 or 30% of DM) and non-protein N (NPN; 0, 1.5, or 3.0% of DM) from urea. The control diet without WCDGS contained 3.0% NPN (1.06% urea) and cottonseed meal. Steers were fed twice daily for 129 d and WCDGS was obtained three times/week from a local plant. Final shrunk BW was less (P < 0.02) for 30% WCDGS than for the control or 15% WCDGS. Overall DMI was not different (P > 0.31) between the control diet and 15 or 30% WCDGS, but overall DMI increased linearly (P = 0.04) as NPN increased. Overall ADG and gain efficiency were affected by both WCDGS and NPN (interaction, P < 0.12). Overall ADG for steers fed 15% WCDGS was greater for 1.5 and 3.0% NPN than for 0% NPN (P < 0.07, quadratic); however, ADG was not influenced by NPN for 30% WCDGS. Overall ADG was not different between the control and 15% WCDGS, but ADG was lower (P < 0.02) for 30% than for 15% WCDGS. Overall gain efficiency among steers fed 15% WCDGS was greatest for 1.5% NPN and least for those fed 0% (P < 0.07, quadratic), whereas gain efficiency decreased linearly (P < 0.09) as NPN increased in 30% WCDGS diets. No interactions between WCDGS and NPN were evident for carcass traits. Dressing percent was greater (P < 0.01) for the control diet than for 15% or 30% WCDGS (65.1, 64.2, and 63.9% for control, 15% WCDGS, and 30% WCDGS, respectively). Hot carcass weight was not different between the control and 15% WCDGS (P = 0.44), whereas carcass weight was less for 30% WCDGS than for 15% WCDGS (P < 0.01). Other carcass measurements were not different among treatments. Data suggest that optimum performance occurs between 1.5 and 3.0% NPN when diets contain 15% WCDGS, and with 1.5% NPN or less when diets contain 30% WCDGS. Effects on Ruminal pH, Hydrogen Sulfide Concentration, and Feed Intake When Using Wet Distillers Grains with Solubles to Adapt Cattle to Finishing Diets Compared to Forage K. M. Rolfe, G. E. Erickson, T. J. Klopfenstein, and J. T. Vasconcelos, University of Nebraska, Lincoln
Eight ruminally fistulated steers (766 ± 74 lb) were used to determine effects of using wet distillers grains with solubles (WDGS) when adapting cattle to a finishing diet. Steers were assigned randomly to one of two adaptation systems: 1) alfalfa hay decreased from 45% to 7.5% inclusion and dry-rolled corn increased while 5% supplement and 35% WDGS were constant

102
(CON) and 2) WDGS decreased from 87.5% to 35% inclusion and dry-rolled corn increased while 5% supplement and 7.5% alfalfa were constant (TRT). Four, 7-d adaptation diets (step 1 to 4) were fed within each adaptation system followed by 7 d on a common finishing diet (52.5% dry-rolled corn, 35% WDGS, 7.5% alfalfa hay, and 5% supplement; DM basis). Ruminal pH and DMI were monitored continuously with wireless submersible pH probes and feed bunks suspended from load cells. On the last day of each step, ruminal H2S was measured 8 and 23 h post feeding. In step 1, no differences in ruminal pH were observed; however, TRT steers had lower DMI (P < 0.01) than CON steers. In step 2, steers on TRT had lower DMI (P = 0.01), lower average pH (P = 0.01) and greater H2S (P = 0.08). In step 3, TRT steers had lower DMI (P = 0.06) and average pH (P = 0.01) compared to CON steers. No differences in DMI, pH, or H2S were observed between TRT and CON steers on the finishing diet (P > 0.36). No drastic decreases in DMI or ruminal pH (SD similar to CON) were observed in steers adapted with TRT, with lowest average pH (5.43) on the finishing diet. Steers on TRT had greater H2S only during step 2, with the greatest concentration being 0.78 μmol H2S gas /mL rumen gas collected, but based on previous research and visual appraisal, sulfur was not a problem. Adapting cattle to finishing diets with WDGS may lower DMI and pH, but appeared to “adapt” cattle to corn since no differences were observed on the finishing diet. The Impact of Trace Mineral Source, Water Quality, and Short-term Choline Supplementation on Performance and Carcass Characteristics of Finishing Steers J.S. Schutz1, J.L. Seabrook1, K.L. Neuhold1, J.J. Wagner1, M. de Veth2, T.E. Engle1, 1Colorado State University, Fort Collins, and 2Balchem Corporation, New Hampton, NY Two hundred and eighty eight steers (316.0 ± 13.8 kg) were utilized to determine the effects of trace mineral source, water quality, and choline supplementation on performance and carcass characteristics. Upon entry into the feedlot, cattle were processed, randomly assigned to trace mineral and water treatments (2 x 2 factorial), and housed in 9 head pens. Trace mineral treatments consisted of: 1) control, 15 mg Cu/kg DM, 20 mg Mn/kg DM, and 45 mg Zn/kg DM supplemental trace minerals in inorganic form and 2) organic, iso-concentrations to the inorganic trace minerals composed of 50% organic and 50% inorganic trace mineral. Water treatments consisted of: 1) a blend of reverse osmosis and well water (1072.4 mg SO4/L) and 2) well water (2377.5 mg SO4/L). Standard receiving and finishing diets were fed twice daily. Twenty nine days prior to harvest, 4 pens per trace mineral and water treatment were supplemented with 20 g of protected choline/h/d and the remaining 4 pens served as the controls (0 g of supplemental choline). Steers were weighed on d 0, 28 and then at approximately 56 d increments until the experiment was terminated. There were no trace mineral source x time, trace mineral source x water quality, or trace mineral source x water quality x time interactions for BW, ADG, DMI, G/F, or F/G. Initial and final body weights, ADG, DMI, F/G and G/F were similar across trace mineral and water treatments. Choline supplementation for only the last 29 d on feed did not impact performance. Morbidity, mortality, and percent repulls were similar across trace mineral and water treatments. Steers receiving organic trace mineral had an improved USDA yield grade compared to steers receiving inorganic trace minerals (2.61 vs 2.82, respectively, P<0.03). Steers consuming well water tended (P < 0.08) to have greater longissimus muscle area (REA) and lower (P < 0.08) calculated YG than steers consuming RO water. Other carcass characteristics parameters were not affected by water quality, trace mineral source, or choline supplementation.

103
Effects of Type and Amount of Supplementation on Performance, Carcass Characteristics, and Gene Expression of Adipose Tissue in Steers Wintered on Dormant Native Range E.D. Sharman, P.A. Lancaster, G.G. Hilton, C.R. Krehbiel, H.T. Purvis, D.R. Stein, U. DeSilva, and G.W. Horn, Oklahoma Agricultural Experiment Station, Stillwater
Additional benefit to the stocker/feeder cattle phase of production could be realized by influencing adipose tissue development prior to finishing. Glucose is the primary carbon source for fatty acid synthesis in intramuscular fat and provision of additional starch to young beef calves has been shown to increase marbling deposition. Our objective was to examine potential effects of high-starch versus high-fiber energy supplements on the development of marbling and gene expression of adipose tissues by stocker cattle grazing dormant tallgrass native range. Angus cross steer calves (N = 53; 268 kg ± 5.91) grazed dormant tallgrass native range for 122 d and were supplemented 5 d/wk with: (1) 1.02 kg·hd-1·d-1 of a 40% CP, CSM-based supplement (CON) to meet DIP requirement, (2) 40% CP supplement plus corn supplement at 1% BW (CORN), (3) 40% CP supplement plus soyhull supplement at 1% BW (SBH), or (4) 40% CP supplement plus distillers dried grains with solubles supplement at 1% BW (DDGS). Following the stocker phase, 3 steers per treatment were harvested (intermittent harvest) for measurement of carcass characteristics and collection of perirenal (PR) and subcutaneous (SC) adipose tissues. Adequate amounts of intramuscular adipose tissue could not be collected. Remaining steers were fed a dry-rolled corn finishing diet for 113 d before harvest. Total RNA was extracted from adipose tissues, and gene expression of lipogenic enzymes determined using qRT-PCR. ADG by steers on dormant native range was 0.20a, 0.54c, 0.34b, and 0.35b kg·d-1 for treatments 1-4, respectively, and was increased (P < 0.01) by supplementation. Marbling scores of the intermittent harvest steers were 120, 137, 150, and 157 (SEM = 25.4), respectively, (100 = practically devoid and 200 = traces) and were not different (P = 0.75) among treatments. Feedlot performance and final marbling score were similar among treatments. Treatment had no effect on gene expression of glycolytic enzymes in SC or PR suggesting that glucose utilization was not altered by supplement type. Glycerol-3-phosphate dehydrogenase gene expression was greater (P < 0.05) in both adipose depots for supplemented vs. CON steers (3.15 vs. 1.00 and 2.68 vs. 1.00 fold change for SC and PR, respectively). A treatment by tissue interaction (P < 0.10) was observed for fatty acid synthase (FAS) and acetyl-CoA synthetase (ACS) gene expression. FAS and ACS gene expression were greater (P < 0.05) for supplemented vs. CON steers in PR (6.70 vs. 1.00 and 3.25 vs. 1.00 fold change, respectively), but not SC. SBH and DDGS steers had greater (P < 0.05) ACS gene expression (3.46 vs. 1.00 fold change) than CORN steers in SC, but not KPH. Even though ADG was increased by energy supplementation, type and amount of supplement did not influence marbling; however, energy supplementation more than type of supplement influenced adipose tissue metabolism of stocker cattle wintered on dormant native range. Effects of Sulfur and Monensin Concentrations on in vitro Dry Matter Disappearance, Hydrogen Sulfide Production, and Volatile Fatty Acids D. R. Smith1, N. DiLorenzo1, J. Leibovich1, M. L. May1, M. J. Quinn1, J. W. Homm2, and M. L. Galyean1, 1Texas Tech University, Lubbock and 2Elanco Animal Health, Greenfield, IN Ruminally cannulated, Jersey crossbred steers were used to evaluate effects of monensin (M) and sulfur (S) on in vitro hydrogen sulfide (H2S) production. In Study 1, two steers were adapted (>

104
14 d) to a 75% concentrate diet (steam-flaked corn-[SFC] based), and ruminal fluid was collected approximately 4 h after feeding. Incubations (24 h) were conducted using a 3:1 ratio of McDougall’s buffer:ruminal fluid. Substrate DM (approximately 0.63 g; comprised of 85.2% SFC, 9% alfalfa hay, 5% cottonseed meal, and 0.8% urea) was added to duplicate, 125-mL serum bottles to allow for gas collection. A Na2SO4 solution was added to yield S equivalent to 0.2, 0.4, and 0.8% of substrate DM, and M was added at concentrations of 0, 2, 4, and 6 mg/L of culture volume. Head-space gas was analyzed for H2S by spectrophotometry using the N-N-dimethyl-p-phenylenediamine method. The 24-h IVDMD for each treatment was determined in duplicate, 50-mL tubes. Incubations were replicated on 3 separate days, and data were analyzed as a randomized complete block design with a 3 (S) x 4 (M) factorial arrangement of treatments. No effects of M (P = 0.29) or the M × S interaction (P = 0.41) were detected for H2S production. Increasing S linearly increased (P < 0.01) H2S production (mmoles/g of fermentable DM). The IVDMD (average 70.0%) was not affected by M (P = 0.93), S (P = 0.18), or the M × S interaction (P = 0.56). Total VFA concentrations were not affected by M (P = 0.87), S (P = 0.14), or the M × S interaction (P = 0.86). Increasing M linearly decreased (P ≤ 0.01) molar proportions of acetate, butyrate, and the acetate:propionate ratio (A:P), while linearly increasing (P < 0.01) molar proportions of propionate. In Study 2, two steers were adapted (> 21 d) to a 75% concentrate diet (SFC base) that contained (DM basis) 15% wet corn distillers grains with solubles (WDGS) and monensin at 22 mg/kg of DM. Substrate DM was comprised of 75.4% SFC, 15% WDGS, 9% alfalfa hay, and 0.6% urea. Procedures, treatments, and statistical analyses were as described for Study 1. No effects of M (P = 0.93) or the M × S interaction (P = 0.99) were noted for H2S production; however, increasing S linearly increased (P < 0.01) H2S production. No effects of M (P = 0.16), S (P = 0.43), or the M × S interaction (P = 0.10) were noted for IVDMD (average 70.9%). Total VFA concentrations were not affected by M (P = 0.40), S (P = 0.26), or the M × S interaction (P = 0.59). Increasing M linearly decreased (P < 0.05) molar proportions of acetate, butyrate, and the acetate:propionate ratio (A:P), while linearly increasing (P < 0.01) molar proportions of propionate. Increasing S concentration increased in vitro H2S production, but monensin did not affect in vitro H2S production. Likewise, increasing S concentrations did not affect in vitro VFA concentrations or molar proportions, and the commonly reported changes in VFA molar proportions were evident with monensin regardless of S concentration. [The IVDMD and H2S production data from these experiments were reported previously by Smith et al., 2009; ASAS Midwest Section abstracts] Identification of Bovine Respiratory Disease Related Metabolic Fingerprints in Beef Steers S. J. Terrill1, C. R. Krehbiel1, R. D. Madden2, J. W. Dillwith2, and L. O. Burciaga-Robles1, Departments of 1Animal Science and 2Entomology and Plant Pathology, Oklahoma State University, Stillwater
Bovine respiratory disease (BRD) is the most costly disease in North American feedlots. It is commonly caused by a combination of viral and bacterial pathogens, such as bovine viral diarrhea virus and Mannheimia haemolytica. Diagnosis of this disease, however, is still highly subjective. Metabolomics, or the study of the total metabolic contents of a biological tissue or fluid, may provide an objective diagnosis. By combining gas chromatography and mass spectrometry (GC/MS), patterns in the metabolic fingerprints of both healthy and diseased cattle can be examined to identify specific biomarkers. For the present experiment, 24 Angus crossbred steers were divided into four treatment groups (n = 6). Treatments were: 1) exposure

105
to two BVDV persistently infected (PI) steers for 72 h (BVDV), 2) exposure to the PI-BVDV steers and intracheally challenged with M. haemolytica on d 0 (BVDV+MH), 3) intratracheally challenged with M. haemolytica on d 0 (MH), and 4) no challenge (Control). Plasma samples were taken at -72, 12, 24, and 48 h before and after infection. Using a GC/MS platform, a total metabolic fingerprint was identified. Principal component analysis (PCA) was performed, and data were grouped according to treatment at each time point. Preliminary biomarker analysis indicates that amino acids, glycerol, and linoleic acid may be responsible for some of the changes in the metabolic fingerprint. GC/MS metabolic fingerprinting is a promising technique that may provide for better diagnosis and identification of feedlot cattle with BRD. High sulfur content of dried distiller’s grains with solubles impacts ruminal fermentation, feedlot cattle performance, and carcass characteristics S. Uwituze1, M.K. Shelor1, G.L. Parsons1, K. K. Karges2, M.L. Gibson2, L.C. Hollis1, and J.S. Drouillard1, 1Kansas State University and 2Dakota Gold Research Assn When in excess, dietary sulfur can be deleterious to cattle performance and health. We conducted 2 studies to evaluate effects of sulfur content in dried distiller’s grains with solubles (DDGS) on ruminal gas concentrations, ruminal fermentation characteristics, diet digestibility, feedlot performance, and carcass characteristics of finishing steers. Experiment 1 utilized crossbred steers (n = 76; 904 ± 6 lbs BW) in a randomized complete block design with a 2 × 2 factorial arrangement of treatments. Factors consisted of dietary sulfur concentration (0.42% and 0.65% of DM; LS and HS, respectively), and grain processing method (steam-flaked or dry-rolled corn; SFC and DRC, respectively). HS was achieved by spiking DDGS with sulfuric acid. All diets included 8.6% roughage and 30% DDGS (DM basis). Steers were assigned randomly within weight block to treatments, and housed in individual, concrete-surfaced, partially enclosed pens equipped with individual feed bunks and water fountains. Steers were fed ad libitum amounts of their respective diets at approximately 0800 h each day. On d 69, 83, 90, 97, and 104, ruminal gas samples were aspirated through a needle at 0, 4, 8, and 12 h after feeding by puncturing the ruminal wall at the paralumbar fossa, and then analyzed for concentrations of hydrogen sulfide (H2S) and methane (CH4) by gas chromatography. Steers were harvested on d 140, and carcass data were collected following a 48-h chill. In experiment 2 we evaluated ruminal fermentation in 12 ruminally cannulated Angus cross steers fed the same diets used in the finishing study. Two 15-d experimental periods were used, each consisting of a 12-d diet adaptation phase and 3-d sample collection phase. Ruminal digesta samples were collected at 2-h intervals post feeding during the collection phase. Ruminal pH was measured immediately after sampling. Concentrations of ruminal ammonia and VFA were determined, and fecal samples were used to determine total tract digestibility of DM, OM, NDF, CP, starch, and ether extract. In the finishing trial, no interactions between grain processing method and sulfur level were observed. Steers fed diets with HS had 8.9% lower DMI, 12.9% poorer ADG, 4.3% lighter carcass weights (P < 0.01); and tended to be less efficient (P = 0.13) than steers fed diets with LS. Steers fed HS had less KPH fat (P = 0.009) and lower incidence of liver abscesses (P = 0.05) compared to steers fed LS. Cattle fed HS had higher (P < 0.001) ruminal concentrations of H2S compared to cattle fed LS diets, and H2S was inversely related (P < 0.01) to ADG (r = -0.42), DMI (r = -0.43), and Gain:Feed (r = -0.20). In the metabolism trial, HS was associated with a decrease in DM intake (P = 0.08), and increases in ruminal pH and apparent total tract digestibility of DM and ether extract (P < 0.05). Cattle fed HS had greater ruminal ammonia but lower total VFA and

106
propionate concentrations (P < 0.01). These effects were more exaggerated in cattle fed DRC (interaction, P < 0.01). Feeding distiller’s grains that are high in dietary sulfur may decrease feed intake by beef steers and compromise growth performance and carcass characteristics of feedlot cattle. Effect of Timing of Bovine Viral Diarrhea Virus Exposure in Relation to Mannheimia haemolytica Challenge on Immune Response and Muscle and Fat Gene Expression Changes in Growing Steers L. Carlos-Valdez1, L. O. Burciaga-Robles1, D. L. Step2, A. W. Confer3, R. W. Fulton3, U. DeSilva1, X. Gou1 and C. R. Krehbiel1, 1Department of Animal Science, 2Department of Veterinary Clinical Sciences, and 3Department of Veterinary Pathobiology, Oklahoma State University, Stillwater The objective was to determine the effects of an intratracheal Mannheimia haemolytica serotype 1A (MH) challenge following short-term exposure (72 h) to Bovine Viral Diarrhea Virus (BVDV) type 1b persistently infected calves (PI) on serum concentrations of BVDV, whole cell (WC), and leukotoxin (Lkt) antibody titers and gene expression changes of TLR4, NFkB, TNFα, and IL6 in longissimus dorsi muscle (LDM) and subcutaneous fat (SCF) of growing beef steers. Eighteen crossbred steers (initial BW = 314 ± 31 kg) were randomly allocated to treatments: 1) steers not exposed to steers PI with BVDV or challenged with MH (CON); 2) steers exposed to steers PI with BVDV for 72 h followed by an intratracheal challenge with MH 12 h post BVDV exposure (EarlyCh); and 3) steers exposed to steers PI with BVDV for 72 h followed by an intratracheal challenge with MH 72 h after BVDV exposure (LateCh). Serum samples were taken -7, -1, 0, 2, 4, 7, 14, 28 and 42 d to measure antibody concentrations and biopsies were performed for the collection of LDM and SCF at -156, 12, 24, 48 and 72 h relative to MH challenge. There was an increase (P < 0.0001; SEM= 8.60) in serum concentration of BVDV neutralization antibody titers in EarlyCh and LateCh groups compared with CON at 28 and 42 d. In addition, there were increasing concentrations (P < 0.009; P < 0.02) of serum M. haemolytica WC and Lkt antibodies in EarlyCh and LateCh steers compared with CON steers. Expression of TLR4, NFkB, TNFα and IL6 in LDM were up-regulated (P < 0.02) for EarlyCh steers compared with LateCh and CON steers. Similarly, TLR4 (P < 0.03), NFkB (P = 0.07), and IL6 (P < 0.03) were up-regulated in SCF for EarlyCh and LateCh steers compared with CON steers. We conclude that muscle and adipose tissue alter expression of cytokines in response to pathogens related to bovine respiratory disease. Increasing production of cytokines could alter nutrient metabolism and ultimately decrease animal growth.
Feedlot Incidences of Sulfur Induced Polio and Ruminal Hydrogen Sulfide Levels with Varying Hay Level Inclusion in Byproduct Diets S.J. Vanness, N. F. Meyer, T. J. Klopfenstein and G. E Erickson, University of Nebraska - Lincoln Data were compiled from 4103 cattle on byproduct feeding experiments. Incidence of polioencephalomalacia was small (0.13% or 4/3147) in diets containing 0.46% S or less. Incidences increased as cattle were fed diets above 0.46% S (3/857) and especially above 0.56% (6/99). The objective was to determine if ruminal pH impacts H2S concentration in the rumen by changing grass hay levels in finishing diets. In Exp. 1, 7 ruminally canulated steers were adapted with 3 adaptation diets and a common finisher all containing 50% DM wet distillers grains plus solubles (WDGS) with 0.50, 0.48, 0.46 and 0.44% S, respectively. Alfalfa was decreased in these
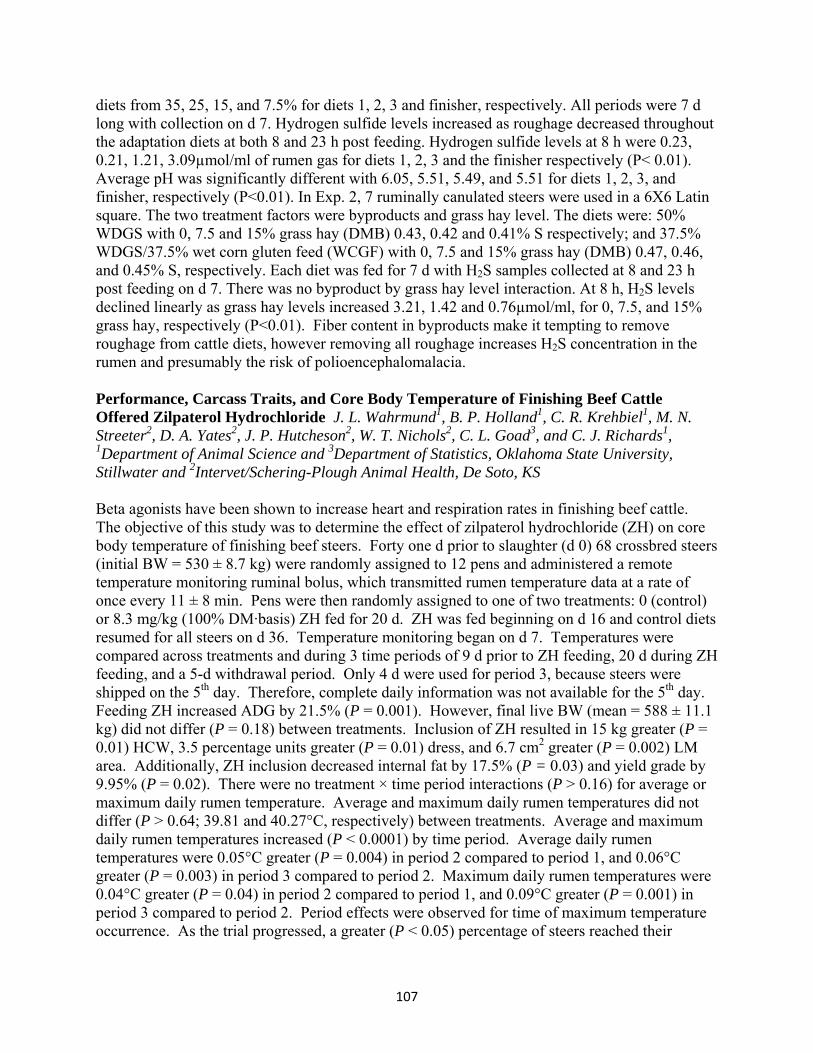
107
diets from 35, 25, 15, and 7.5% for diets 1, 2, 3 and finisher, respectively. All periods were 7 d long with collection on d 7. Hydrogen sulfide levels increased as roughage decreased throughout the adaptation diets at both 8 and 23 h post feeding. Hydrogen sulfide levels at 8 h were 0.23, 0.21, 1.21, 3.09µmol/ml of rumen gas for diets 1, 2, 3 and the finisher respectively (P< 0.01). Average pH was significantly different with 6.05, 5.51, 5.49, and 5.51 for diets 1, 2, 3, and finisher, respectively (P<0.01). In Exp. 2, 7 ruminally canulated steers were used in a 6X6 Latin square. The two treatment factors were byproducts and grass hay level. The diets were: 50% WDGS with 0, 7.5 and 15% grass hay (DMB) 0.43, 0.42 and 0.41% S respectively; and 37.5% WDGS/37.5% wet corn gluten feed (WCGF) with 0, 7.5 and 15% grass hay (DMB) 0.47, 0.46, and 0.45% S, respectively. Each diet was fed for 7 d with H2S samples collected at 8 and 23 h post feeding on d 7. There was no byproduct by grass hay level interaction. At 8 h, H2S levels declined linearly as grass hay levels increased 3.21, 1.42 and 0.76µmol/ml, for 0, 7.5, and 15% grass hay, respectively (P<0.01). Fiber content in byproducts make it tempting to remove roughage from cattle diets, however removing all roughage increases H2S concentration in the rumen and presumably the risk of polioencephalomalacia. Performance, Carcass Traits, and Core Body Temperature of Finishing Beef Cattle Offered Zilpaterol Hydrochloride J. L. Wahrmund1, B. P. Holland1, C. R. Krehbiel1, M. N. Streeter2, D. A. Yates2, J. P. Hutcheson2, W. T. Nichols2, C. L. Goad3, and C. J. Richards1, 1Department of Animal Science and 3Department of Statistics, Oklahoma State University, Stillwater and 2Intervet/Schering-Plough Animal Health, De Soto, KS Beta agonists have been shown to increase heart and respiration rates in finishing beef cattle. The objective of this study was to determine the effect of zilpaterol hydrochloride (ZH) on core body temperature of finishing beef steers. Forty one d prior to slaughter (d 0) 68 crossbred steers (initial BW = 530 ± 8.7 kg) were randomly assigned to 12 pens and administered a remote temperature monitoring ruminal bolus, which transmitted rumen temperature data at a rate of once every 11 ± 8 min. Pens were then randomly assigned to one of two treatments: 0 (control) or 8.3 mg/kg (100% DM·basis) ZH fed for 20 d. ZH was fed beginning on d 16 and control diets resumed for all steers on d 36. Temperature monitoring began on d 7. Temperatures were compared across treatments and during 3 time periods of 9 d prior to ZH feeding, 20 d during ZH feeding, and a 5-d withdrawal period. Only 4 d were used for period 3, because steers were shipped on the 5th day. Therefore, complete daily information was not available for the 5th day. Feeding ZH increased ADG by 21.5% (P = 0.001). However, final live BW (mean = 588 ± 11.1 kg) did not differ (P = 0.18) between treatments. Inclusion of ZH resulted in 15 kg greater (P = 0.01) HCW, 3.5 percentage units greater (P = 0.01) dress, and 6.7 cm2 greater (P = 0.002) LM area. Additionally, ZH inclusion decreased internal fat by 17.5% (P = 0.03) and yield grade by 9.95% (P = 0.02). There were no treatment × time period interactions (P > 0.16) for average or maximum daily rumen temperature. Average and maximum daily rumen temperatures did not differ (P > 0.64; 39.81 and 40.27°C, respectively) between treatments. Average and maximum daily rumen temperatures increased (P < 0.0001) by time period. Average daily rumen temperatures were 0.05°C greater (P = 0.004) in period 2 compared to period 1, and 0.06°C greater (P = 0.003) in period 3 compared to period 2. Maximum daily rumen temperatures were 0.04°C greater (P = 0.04) in period 2 compared to period 1, and 0.09°C greater (P = 0.001) in period 3 compared to period 2. Period effects were observed for time of maximum temperature occurrence. As the trial progressed, a greater (P < 0.05) percentage of steers reached their

108
maximum daily temperature late in the afternoon (1500 – 1800) compared to late in the evening (0000 – 0300). A greater (P = 0.02) percentage of steers reached their maximum daily temperature between 1500 and 1800 as a result of ZH inclusion, indicating that a greater number of ZH steers began to cool down in the late afternoon. These data indicate that when fed for 20 d, ZH improves performance and carcass traits, and has no impact on daily average and maximum core body temperature of finishing beef steers. However, a greater number of steers offered ZH began to cool down in the late afternoon compared to control.

109

110