Embed Size (px)
Citation preview

OFFERING MEMORANDUM
Feels Like Home
3393 Kirby RdMemphis, TN 38115
SENIOR LIVING RESIDENCES

Feels Like Home CONTENTS
Exclusively Marketed by:
Curtis BradenPrincipal Broker(901) 881-2070License # TN: 284224, MS19110, AR [email protected]
We obtained the following information above from sources we believe to be reliable. However, we have not verified its accuracy and make no guarantee, warranty or representation about it. It is submitted subject to the possibility of errors, omissions, change of price, rental or otherconditions, prior sale, lease or financing, or withdrawal without notice. We include projections, opinions, assumptions or estimates for example only, and they may not represent the current or future performance of the property. You and your tax and legal advisors should conduct yourown investigation of the property and transaction.
01 Executive Summary Investment Summary 4 Unit Mix Summary 5
02 Property Description Property Features 6 Aerial Map 7 Property Images 8
03 Sale Comps Sale Comparables 13 Sale Comparables Summary 15 Sale Comparables Charts 16 Sale Comparables Map 17
05 Financial Analysis Income & Expense Analysis 18 Multiyear Cash Flow Assumptions 19 Cash Flow Analysis 20 Disposition Sensitivity Analysis 22
06 Demographics Demographics 23 Demographic Charts 24

The information contained in the following offering memorandum is proprietary and strictly confidential. It is intended to be reviewed only by the party receiving it from Braden, Braden & Bradenand it should not be made available to any other person or entity without the written consent of Braden, Braden & Braden. By taking possession of and reviewing the information contained herein the recipient agrees to hold and treat all such information in the strictest confidence. The recipient further agrees thatrecipient will not photocopy or duplicate any part of the offering memorandum. If you have no interest in the subject property, please promptly return this offering memorandum to Braden, Braden& Braden. This offering memorandum has been prepared to provide summary, unverified financial and physical information to prospective purchasers, and to establish only a preliminary level ofinterest in the subject property. The information contained herein is not a substitute for a thorough due diligence investigation. Braden, Braden & Braden has not made any investigation, and makes no warranty or representationwith respect to the income or expenses for the subject property, the future projected financial performance of the property, the size and square footage of the property and improvements, thepresence or absence of contaminating substances, PCBs or asbestos, the compliance with local, state and federal regulations, the physical condition of the improvements thereon, or financialcondition or business prospects of any tenant, or any tenant’s plans or intentions to continue its occupancy of the subject property. The information contained in this offering memorandum has been obtained from sources we believe reliable; however, Braden, Braden & Braden has not verified, and will not verify, any of theinformation contained herein, nor has Braden, Braden & Braden conducted any investigation regarding these matters and makes no warranty or representation whatsoever regarding the accuracyor completeness of the information provided. All potential buyers must take appropriate measures to verify all of the information set forth herein. Prospective buyers shall be responsible for theircosts and expenses of investigating the subject property.
Feels Like Home Confidentiality and Disclaimer | 03
CONFIDENTIALITY AND DISCLAIMER
PROPERTY SHOWINGS ARE BY APPOINTMENT ONLY.PLEASE CONTACT BRADEN, BRADEN & BRADEN FOR MORE DETAILS.Copyright © 2019 CREOP, LLC. All Rights Reserved.

Feels Like Home Investment Summary | 04
OFFERING SUMMARYADDRESS 3393 Kirby Rd
Memphis TN 38115COUNTY ShelbyMARKET South CentralSUBMARKET South EastBUILDING SF 111,205LAND SF 293,246NUMBER OF UNITS 130YEAR BUILT 1989YEAR RENOVATED Started 2015APN 09-3500-0-0486OWNERSHIP TYPE Fee Simple
FINANCIAL SUMMARYOFFERING PRICE $6,100,000PRICE PSF $54.85PRICE PER UNIT $46,923OCCUPANCY 30.00 %NOI (CURRENT) $77,553NOI (Market) $1,403,440CAP RATE (CURRENT) 1.27 %CAP RATE (Market) 23.01 %GRM (CURRENT) 2.28GRM (Market) 1.90
DEMOGRAPHICS 1 MILE 3 MILE 5 MILE2019 Population 18,012 102,374 213,7852019 Median HH Income $31,388 $45,662 $54,2292019 Average HH Income $41,223 $65,041 $81,470
Braden, Braden & Braden has been given the honor to bring to market aOne Hundred and Twenty unit Upscale Value Add Senior Independentand Assisted Housing Apartment Community. Feels Like Home is in needof about Three hundred Thousand Dollars to finish out the project andinitiate an aggressive leasing campaign.
Located just minutes from the international airport, this community offersaccess to anywhere in the city within minutes. Nestled away in a veryhighly sought out rental area of Memphis TN.

Feels Like Home Unit Mix Summary | 05
Actual MarketUnit Mix # Units Square Feet Current Rent Rent PSF Monthly Income Market Rent Market Rent
PSFMarket Income
1 bd + 1 ba 55 0 $1,650 $90,750 $1,800 $0 $99,0002 bd + 2 ba 13 0 $2,200 $28,600 $2,500 $0 $32,5001 bd + 1 ba 4 0 $1,800 $7,200 $2,100 $0 $8,4002 bd + 2 ba 10 0 $2,500 $25,000 $2,800 $0 $28,000
Studio + 1 ba 5 0 $1,350 $6,750 $1,500 $0 $7,500Studio + 1 ba 17 0 $1,450 $24,650 $1,600 $0 $27,200Studio + 1 ba 18 0 $1,550 $27,900 $1,800 $0 $32,400Studio + 1 ba 8 0 $1,550 $12,400 $1,800 $0 $14,400
Totals/Averages 130 0 $1,717 $223,250 $1,918 $249,400

Feels Like Home Property Features | 06
PROPERTY FEATURESNUMBER OF UNITS 130BUILDING SF 111,205LAND SF 293,246LAND ACRES 6.73YEAR BUILT 1989YEAR RENOVATED Started 2015# OF PARCELS 1ZONING TYPE R-THBUILDING CLASS BLOCATION CLASS CNUMBER OF STORIES 2NUMBER OF BUILDINGS 9NUMBER OF PARKING SPACES 150PARKING RATIO 1.38/1000
MECHANICALHVAC PTAC and CentralFIRE SPRINKLERS Yes
UTILITIESWATER Owner PaysTRASH Owner PaysGAS Owner PaysELECTRIC Owner PaysRUBS NO
CONSTRUCTIONFOUNDATION Concrete SlabFRAMING WoodEXTERIOR StuccoPARKING SURFACE AsphaltROOF Pitched ShingleLANDSCAPING Trees/Bushes/Flowers

Feels Like Home Aerial Map | 07

Feels Like Home Property Images | 08

Feels Like Home Property Images | 09

Feels Like Home Property Images | 10

Feels Like Home Property Images | 11

Feels Like Home Property Images | 12

Feels Like Home Sale Comparables | 13
1
Town Village Audubon Park950 CherryMemphis, TN 38117
TOTAL UNITS 246
YEAR BUILT 2001
SALE PRICE $13,000,000
PRICE/UNIT $52,846
PRICE/SF $64.99
OCCUPANCY 90.00 %
CLOSING DATE 9/7/2016
DISTANCE 6.9 miles
Price/Unit Range $40,816 - $52,846
LOW HIGH
DOM Range
LOW HIGH
Notes Senior Housing Facility
2
Summer Oaks Senior LivingApts4030 SummerMemphis, TN 38122
TOTAL UNITS 32
YEAR BUILT 1963
SALE PRICE $1,350,000
PRICE/UNIT $42,188
PRICE/SF $38.72
OCCUPANCY 95.00 %
CLOSING DATE 10/30/2017
DISTANCE 11.4 miles
Price/Unit Range $40,816 - $52,846
LOW HIGH
DOM Range
LOW HIGH
Notes Senior Housing Apartments

Feels Like Home Sale Comparables | 14
3
Hope Heights Tower383 madisonMemphis, TN 38103
TOTAL UNITS 147
YEAR BUILT 1956
SALE PRICE $6,000,000
PRICE/UNIT $40,816
PRICE/SF $69.91
OCCUPANCY 100.00 %
CLOSING DATE 12/19/2018
DISTANCE 17.9 miles
Price/Unit Range $40,816 - $52,846
LOW HIGH
DOM Range
LOW HIGH
Notes Senior Housing Facility
S
Feels Like Home3393 Kirby RdMemphis, TN 38115
TOTAL UNITS 130
YEAR BUILT 1989
ASKING PRICE $6,100,000
PRICE/UNIT $46,923
PRICE/SF $54.85
CAP RATE 1.27 %
GRM 2.28
OCCUPANCY 30.00 %
Cap Rate Range 1.27 % - 1.27 %
LOW HIGH
Price/Unit Range $40,816 - $52,846
LOW HIGH

Feels Like Home Sale Comparables Summary | 15
PROPERTY Units Built Sale Price Price/Unit PSF Close Date DISTANCE (mi)
1 950 CherryMemphis, TN 38117 246 2001 $13,000,000 $52,846 $64.99 9/7/2016 6.90
2 4030 SummerMemphis, TN 38122 32 1963 $1,350,000 $42,188 $38.72 10/30/2017 11.40
3 383 madisonMemphis, TN 38103 147 1956 $6,000,000 $40,816 $69.91 12/19/2018 17.90
AVERAGES 142 1973 $6,783,333.33 $45,283 $57.87 10/29/2017 12.07
SUBJECT 130 1989 $6,100,000 $46,923 $54.85

Feels Like Home Sale Comparables Charts | 16
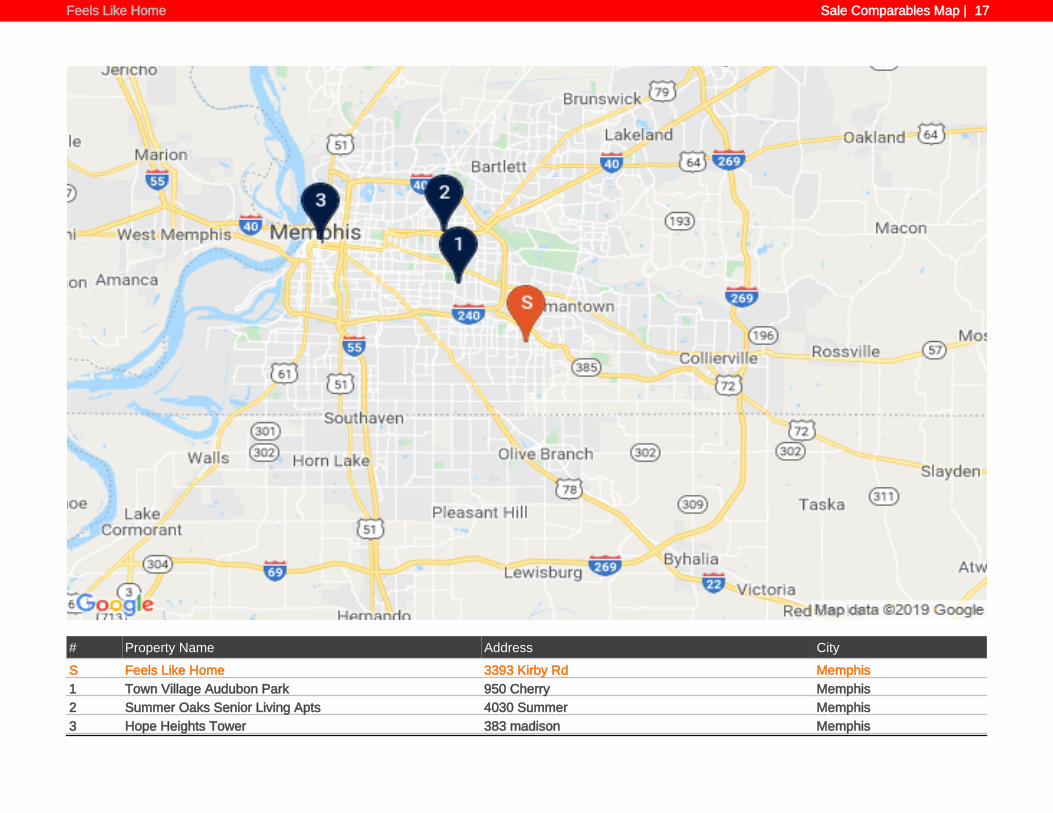
Feels Like Home Sale Comparables Map | 17
# Property Name Address CityS Feels Like Home 3393 Kirby Rd Memphis1 Town Village Audubon Park 950 Cherry Memphis2 Summer Oaks Senior Living Apts 4030 Summer Memphis3 Hope Heights Tower 383 madison Memphis

Feels Like Home Income & Expense Analysis | 18
INCOME CURRENT MARKETGross Potential Income $2,679,000 $3,216,000
Less: General Vacancy $1,875,300 $160,800
Effective Gross Income $803,700 $3,055,200
Less: Expenses $726,147 $1,651,760
Net Operating Income $77,553 $1,403,440
EXPENSES CURRENT MARKET
Real Estate Taxes $462 $60,000 $1,423 $185,000
Insurance $588 $76,500 $769 $100,000
Management Fee $309 $40,185 $1,175 $152,760
Marketing $277 $36,000
Repairs & Maintenance $252 $32,800 $577 $75,000
Food $440 $57,200 $1,154 $150,000
Landscaping $231 $30,000 $369 $48,000
Administration/Pone/Cable/Internet $165 $21,504 $1,000 $130,000
Utilities $1,185 $154,000 $2,308 $300,000
Payroll Expense $1,954 $253,958 $3,654 $475,000
Total Operating Expense $5,586 $726,147 $12,706 $1,651,760
Expense / SF $6.52 $14.85
% of EGI 90.35 % 54.06 %
Per Unit Per Unit
REVENUE ALLOCATION
DISTRIBUTION OF EXPENSES

Feels Like Home Multiyear Cash Flow Assumptions | 19
GLOBALSale Price $6,100,000

Feels Like Home Cash Flow Analysis | 20
CASH FLOWCalendar Year CURRENT Year 2 Year 3 Year 4 Year 5 Year 6 Year 7 Year 8 Year 9 Year 10Gross Potential RevenueGross Rental Income $2,679,000 $3,216,000 $3,216,000 $3,216,000 $3,216,000 $3,216,000 $3,216,000 $3,216,000 $3,216,000 $3,216,000Gross Potential Income $2,679,000 $3,216,000 $3,216,000 $3,216,000 $3,216,000 $3,216,000 $3,216,000 $3,216,000 $3,216,000 $3,216,000General Vacancy $1,875,300 $160,800 $160,800 $160,800 $160,800 $160,800 $160,800 $160,800 $160,800 $160,800Effective Gross Income $803,700 $3,055,200 $3,055,200 $3,055,200 $3,055,200 $3,055,200 $3,055,200 $3,055,200 $3,055,200 $3,055,200Operating ExpensesReal Estate Taxes $60,000 $185,000 $185,000 $185,000 $185,000 $185,000 $185,000 $185,000 $185,000 $185,000Insurance $76,500 $100,000 $100,000 $100,000 $100,000 $100,000 $100,000 $100,000 $100,000 $100,000Management Fee $40,185 $152,760 $152,760 $152,760 $152,760 $152,760 $152,760 $152,760 $152,760 $152,760Marketing $36,000 $36,000 $36,000 $36,000 $36,000 $36,000 $36,000 $36,000 $36,000Repairs & Maintenance $32,800 $75,000 $75,000 $75,000 $75,000 $75,000 $75,000 $75,000 $75,000 $75,000Food $57,200 $150,000 $150,000 $150,000 $150,000 $150,000 $150,000 $150,000 $150,000 $150,000Landscaping $30,000 $48,000 $48,000 $48,000 $48,000 $48,000 $48,000 $48,000 $48,000 $48,000Administration/Pone/Cable/Internet $21,504 $130,000 $130,000 $130,000 $130,000 $130,000 $130,000 $130,000 $130,000 $130,000Utilities $154,000 $300,000 $300,000 $300,000 $300,000 $300,000 $300,000 $300,000 $300,000 $300,000Payroll Expense $253,958 $475,000 $475,000 $475,000 $475,000 $475,000 $475,000 $475,000 $475,000 $475,000Total Operating Expense $726,147 $1,651,760 $1,651,760 $1,651,760 $1,651,760 $1,651,760 $1,651,760 $1,651,760 $1,651,760 $1,651,760Net Operating Income $77,553 $1,403,440 $1,403,440 $1,403,440 $1,403,440 $1,403,440 $1,403,440 $1,403,440 $1,403,440 $1,403,440
Effective Gross Income vs Operating Expenses Cash Flow

Feels Like Home Cash Flow Analysis | 21
Calendar Year CURRENT Year 2 Year 3 Year 4 Year 5 Year 6 Year 7 Year 8 Year 9 Year 10Financial MetricsCash on Cash Return b/t 1.27 % 23.01 % 23.01 % 23.01 % 23.01 % 23.01 % 23.01 % 23.01 % 23.01 % 23.01 %CAP Rate 1.27 % 23.01 % 23.01 % 23.01 % 23.01 % 23.01 % 23.01 % 23.01 % 23.01 % 23.01 %Operating Expense Ratio 90.35 % 54.06 % 54.06 % 54.06 % 54.06 % 54.06 % 54.06 % 54.06 % 54.06 % 54.06 %Gross Multiplier (GRM) 2.28 1.90 1.90 1.90 1.90 1.90 1.90 1.90 1.90 1.90Breakeven Ratio 90.35 % 54.06 % 54.06 % 54.06 % 54.06 % 54.06 % 54.06 % 54.06 % 54.06 % 54.06 %Price / SF $54.85 $54.85 $54.85 $54.85 $54.85 $54.85 $54.85 $54.85 $54.85 $54.85Price / Unit $46,923 $46,923 $46,923 $46,923 $46,923 $46,923 $46,923 $46,923 $46,923 $46,923Income / SF $7.22 $27.47 $27.47 $27.47 $27.47 $27.47 $27.47 $27.47 $27.47 $27.47Expense / SF $6.52 $14.85 $14.85 $14.85 $14.85 $14.85 $14.85 $14.85 $14.85 $14.85
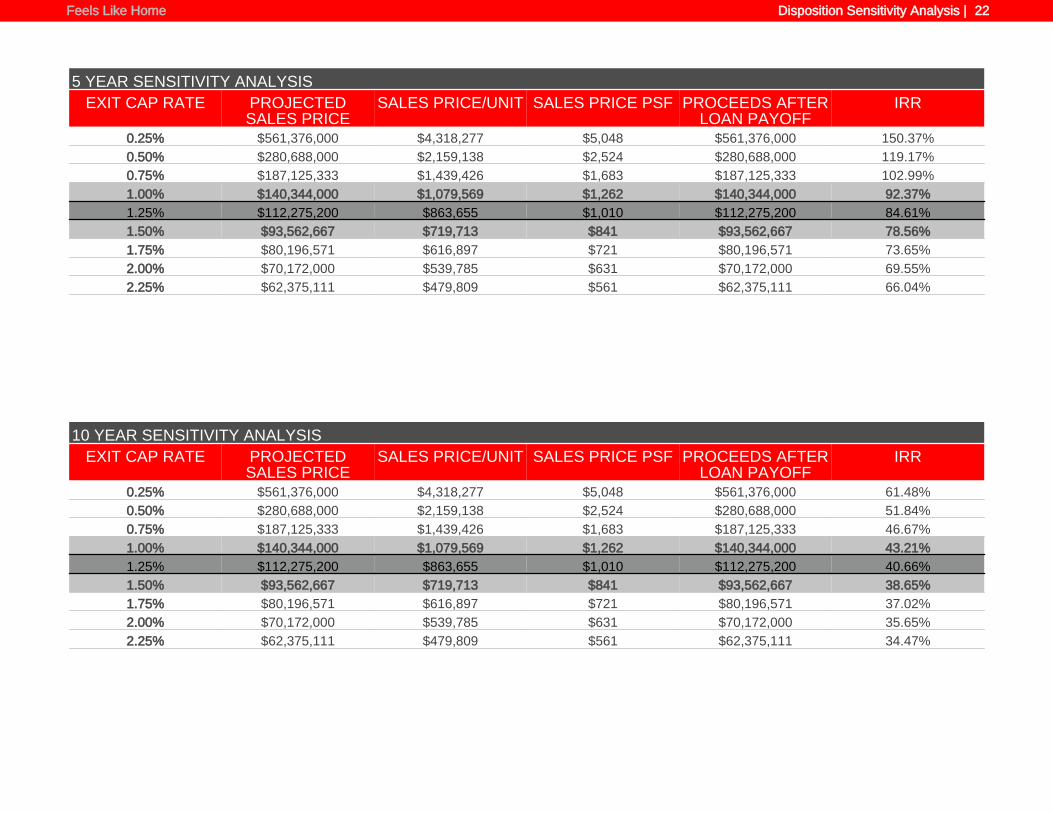
Feels Like Home Disposition Sensitivity Analysis | 22
5 YEAR SENSITIVITY ANALYSISEXIT CAP RATE PROJECTED
SALES PRICESALES PRICE/UNIT SALES PRICE PSF PROCEEDS AFTER
LOAN PAYOFFIRR
0.25% $561,376,000 $4,318,277 $5,048 $561,376,000 150.37%0.50% $280,688,000 $2,159,138 $2,524 $280,688,000 119.17%0.75% $187,125,333 $1,439,426 $1,683 $187,125,333 102.99%1.00% $140,344,000 $1,079,569 $1,262 $140,344,000 92.37%1.25% $112,275,200 $863,655 $1,010 $112,275,200 84.61%1.50% $93,562,667 $719,713 $841 $93,562,667 78.56%1.75% $80,196,571 $616,897 $721 $80,196,571 73.65%2.00% $70,172,000 $539,785 $631 $70,172,000 69.55%2.25% $62,375,111 $479,809 $561 $62,375,111 66.04%
10 YEAR SENSITIVITY ANALYSISEXIT CAP RATE PROJECTED
SALES PRICESALES PRICE/UNIT SALES PRICE PSF PROCEEDS AFTER
LOAN PAYOFFIRR
0.25% $561,376,000 $4,318,277 $5,048 $561,376,000 61.48%0.50% $280,688,000 $2,159,138 $2,524 $280,688,000 51.84%0.75% $187,125,333 $1,439,426 $1,683 $187,125,333 46.67%1.00% $140,344,000 $1,079,569 $1,262 $140,344,000 43.21%1.25% $112,275,200 $863,655 $1,010 $112,275,200 40.66%1.50% $93,562,667 $719,713 $841 $93,562,667 38.65%1.75% $80,196,571 $616,897 $721 $80,196,571 37.02%2.00% $70,172,000 $539,785 $631 $70,172,000 35.65%2.25% $62,375,111 $479,809 $561 $62,375,111 34.47%

Feels Like Home Demographics | 23
POPULATION 1 MILE 3 MILE 5 MILE
2000 Population 17,740 98,260 197,241
2010 Population 16,899 99,485 207,909
2019 Population 18,012 102,374 213,785
2024 Population 18,495 103,770 217,369
2019 African American 14,023 69,984 120,073
2019 American Indian 24 246 502
2019 Asian 143 1,839 5,613
2019 Hispanic 2,150 9,573 18,534
2019 White 2,065 22,450 72,388
2019 Other Race 1,452 6,248 11,751
2019 Multiracial 300 1,573 3,346
2019-2024: Population: Growth Rate 2.65 % 1.35 % 1.65 %
2019 HOUSEHOLD INCOME 1 MILE 3 MILE 5 MILE
less than $15,000 1,375 4,618 8,536
$15,000-$24,999 1,536 4,364 7,391
$25,000-$34,999 1,278 4,872 8,615
$35,000-$49,999 1,539 7,107 12,621
$50,000-$74,999 1,152 7,492 16,286
$75,000-$99,999 343 3,759 8,461
$100,000-$149,999 277 3,946 10,856
$150,000-$199,999 76 1,311 4,234
$200,000 or greater 61 1,276 5,073
Median HH Income $31,388 $45,662 $54,229
Average HH Income $41,223 $65,041 $81,470
HOUSEHOLDS 1 MILE 3 MILE 5 MILE
2000 Total Housing 9,179 41,752 82,434
2010 Total Households 7,384 37,851 79,970
2019 Total Households 7,638 38,745 82,081
2024 Total Households 7,799 39,258 83,502
2019 Average Household Size 2.35 2.63 2.60
2000 Owner Occupied Housing 1,814 23,193 50,574
2000 Renter Occupied Housing 6,462 15,894 26,885
2019 Owner Occupied Housing 1,254 19,476 47,529
2019 Renter Occupied Housing 6,384 19,269 34,551
2019 Vacant Housing 1,721 5,183 8,950
2019 Total Housing 9,359 43,928 91,031
2024 Owner Occupied Housing 1,341 20,073 49,096
2024 Renter Occupied Housing 6,458 19,185 34,406
2024 Vacant Housing 1,779 5,410 9,395
2024 Total Housing 9,578 44,668 92,897
2019-2024: Households: Growth Rate 2.10 % 1.30 % 1.70 %
Source: esri

Feels Like Home Demographic Charts | 24
1 Mile Radius 3 Mile Radius 5 Mile Radius
2019 Household Income
1 Mile Radius 3 Mile Radius 5 Mile Radius
2019 Population by Race

Feels Like Home Demographic Charts | 25
2019 Household Occupancy - 1 Mile Radius
Average Income Median Income
2019 Household Income Average and Median

Feels Like Home
CONFIDENTIALITY and DISCLAIMERThe information contained in the following offering memorandum is proprietary and strictly confidential. It isintended to be reviewed only by the party receiving it from Braden, Braden & Braden and it should not bemade available to any other person or entity without the written consent of Braden, Braden & Braden.
By taking possession of and reviewing the information contained herein the recipient agrees to hold and treatall such information in the strictest confidence. The recipient further agrees that recipient will not photocopy orduplicate any part of the offering memorandum. If you have no interest in the subject property, pleasepromptly return this offering memorandum to Braden, Braden & Braden. This offering memorandum has beenprepared to provide summary, unverified financial and physical information to prospective purchasers, and toestablish only a preliminary level of interest in the subject property.
The information contained herein is not a substitute for a thorough due diligence investigation. Braden, Braden& Braden has not made any investigation, and makes no warranty or representation with respect to the incomeor expenses for the subject property, the future projected financial performance of the property, the size andsquare footage of the property and improvements, the presence or absence of contaminating substances,PCBs or asbestos, the compliance with local, state and federal regulations, the physical condition of theimprovements thereon, or financial condition or business prospects of any tenant, or any tenant’s plans orintentions to continue its occupancy of the subject property.
The information contained in this offering memorandum has been obtained from sources we believe reliable;however, Braden, Braden & Braden has not verified, and will not verify, any of the information containedherein, nor has Braden, Braden & Braden conducted any investigation regarding these matters and makes nowarranty or representation whatsoever regarding the accuracy or completeness of the information provided. Allpotential buyers must take appropriate measures to verify all of the information set forth herein. Prospectivebuyers shall be responsible for their costs and expenses of investigating the subject property.
Exclusively Marketed by:
Curtis BradenPrincipal Broker(901) 881-2070License # TN: 284224, MS19110, AR [email protected]
powered by CREOP