Embed Size (px)
Citation preview
7 Reinforced Concrete
By Peter W. Somers, S.E. Originally developed by Finley A. Charney, PhD, P.E.
7.1 SEISMIC DESIGN REQUIREMENTS ........................................................................................ 7 7.1.1 Seismic Response Parameters ................................................................................................ 7
7.1.2 Seismic Design Category ....................................................................................................... 8 7.1.3 Structural Systems ................................................................................................................. 8
7.1.4 Structural Configuration ........................................................................................................ 9 7.1.5 Load Combinations ................................................................................................................ 9
7.1.6 Material Properties ............................................................................................................... 10
7.2 DETERMINATION OF SEISMIC FORCES ............................................................................. 11 7.2.1 Modeling Criteria ................................................................................................................. 11
7.2.2 Building Mass ...................................................................................................................... 12 7.2.3 Analysis Procedures ............................................................................................................. 13
7.2.4 Development of Equivalent Lateral Forces ......................................................................... 13 7.2.5 Direction of Loading ............................................................................................................ 19
7.2.6 Modal Analysis Procedure ................................................................................................... 20 7.3 DRIFT AND P-DELTA EFFECTS ............................................................................................. 21
7.3.1 Torsion Irregularity Check for the Berkeley Building ........................................................ 21 7.3.2 Drift Check for the Berkeley Building ................................................................................ 23
7.3.3 P-delta Check for the Berkeley Building ............................................................................. 27 7.3.4 Torsion Irregularity Check for the Honolulu Building ........................................................ 29
7.3.5 Drift Check for the Honolulu Building ................................................................................ 29 7.3.6 P-Delta Check for the Honolulu Building ........................................................................... 31
7.4 STRUCTURAL DESIGN OF THE BERKELEY BUILDING .................................................. 32
7.4.1 Analysis of Frame-Only Structure for 25 Percent of Lateral Load ..................................... 33 7.4.2 Design of Moment Frame Members for the Berkeley Building .......................................... 37
7.4.3 Design of Frame 3 Shear Wall ............................................................................................. 60
FEMA P-751, NEHRP Recommended Provisions: Design Examples
7 – 2
7.5 STRUCTURAL DESIGN OF THE HONOLULU BUILDING ................................................. 66
7.5.1 Compare Seismic Versus Wind Loading ............................................................................. 66 7.5.2 Design and Detailing of Members of Frame 1 .................................................................... 69
Chapter 7: Reinforced Concrete
7 – 3
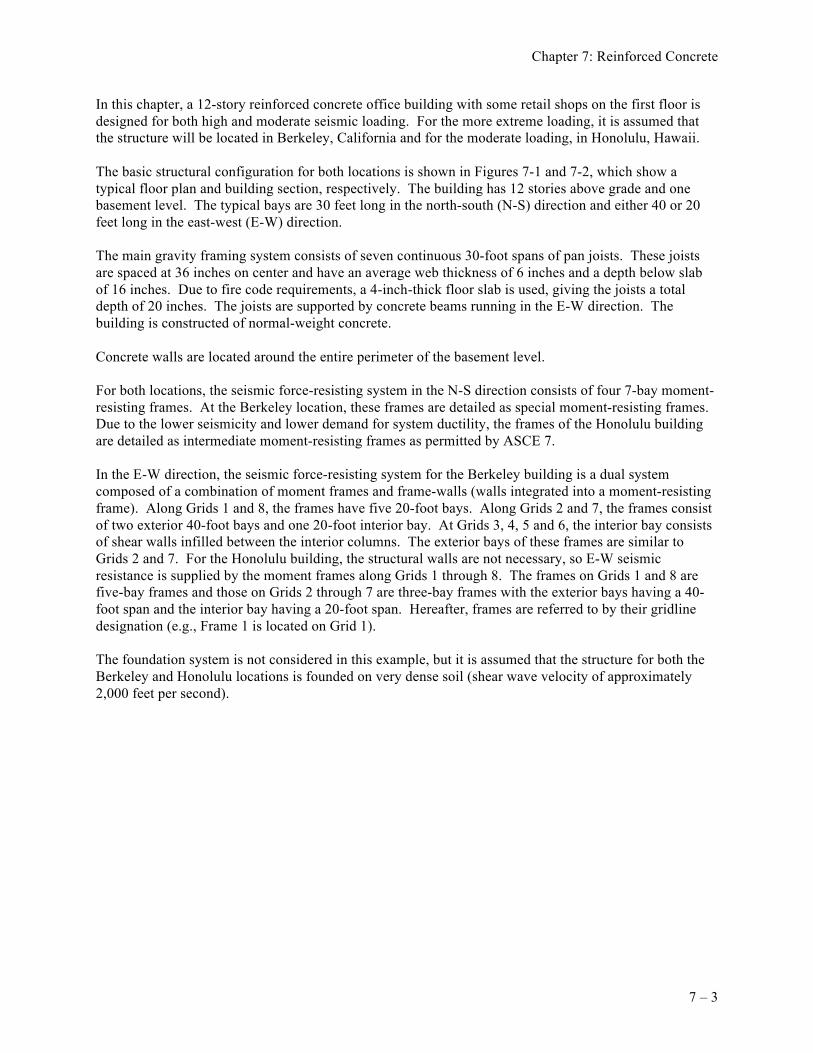
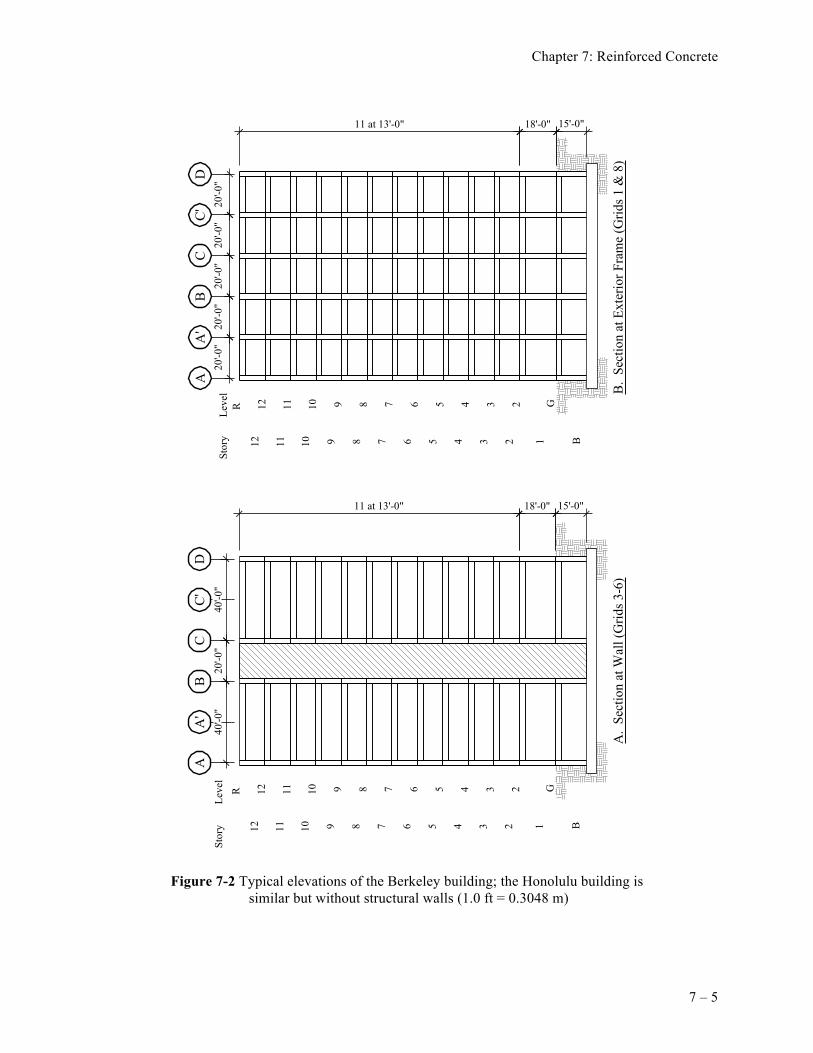
In this chapter, a 12-story reinforced concrete office building with some retail shops on the first floor is designed for both high and moderate seismic loading. For the more extreme loading, it is assumed that the structure will be located in Berkeley, California and for the moderate loading, in Honolulu, Hawaii. The basic structural configuration for both locations is shown in Figures 7-1 and 7-2, which show a typical floor plan and building section, respectively. The building has 12 stories above grade and one basement level. The typical bays are 30 feet long in the north-south (N-S) direction and either 40 or 20 feet long in the east-west (E-W) direction. The main gravity framing system consists of seven continuous 30-foot spans of pan joists. These joists are spaced at 36 inches on center and have an average web thickness of 6 inches and a depth below slab of 16 inches. Due to fire code requirements, a 4-inch-thick floor slab is used, giving the joists a total depth of 20 inches. The joists are supported by concrete beams running in the E-W direction. The building is constructed of normal-weight concrete. Concrete walls are located around the entire perimeter of the basement level. For both locations, the seismic force-resisting system in the N-S direction consists of four 7-bay moment-resisting frames. At the Berkeley location, these frames are detailed as special moment-resisting frames. Due to the lower seismicity and lower demand for system ductility, the frames of the Honolulu building are detailed as intermediate moment-resisting frames as permitted by ASCE 7. In the E-W direction, the seismic force-resisting system for the Berkeley building is a dual system composed of a combination of moment frames and frame-walls (walls integrated into a moment-resisting frame). Along Grids 1 and 8, the frames have five 20-foot bays. Along Grids 2 and 7, the frames consist of two exterior 40-foot bays and one 20-foot interior bay. At Grids 3, 4, 5 and 6, the interior bay consists of shear walls infilled between the interior columns. The exterior bays of these frames are similar to Grids 2 and 7. For the Honolulu building, the structural walls are not necessary, so E-W seismic resistance is supplied by the moment frames along Grids 1 through 8. The frames on Grids 1 and 8 are five-bay frames and those on Grids 2 through 7 are three-bay frames with the exterior bays having a 40-foot span and the interior bay having a 20-foot span. Hereafter, frames are referred to by their gridline designation (e.g., Frame 1 is located on Grid 1). The foundation system is not considered in this example, but it is assumed that the structure for both the Berkeley and Honolulu locations is founded on very dense soil (shear wave velocity of approximately 2,000 feet per second).
FEMA P-751, NEHRP Recommended Provisions: Design Examples
7 – 4
Figure 7-1 Typical floor plan of the Berkeley building; the Honolulu building is similar but without structural walls (1.0 ft = 0.3048 m)
Figure 7-2A
102'-6"
5 at 20'-0"
212'
-6"
7 at
30'
-0"
Figure 7-2B
N
8
7
6
5
4
3
2
1
A A' B C C' D
Chapter 7: Reinforced Concrete
7 – 5
Figure 7-2 Typical elevations of the Berkeley building; the Honolulu building is similar but without structural walls (1.0 ft = 0.3048 m)
R 12 11 10 9 8 7 6 5 4 3 2 G
Leve
lSt
ory B 1 2 3 4 5 6 7 8 9101112
11 at 13'-0" 18'-0" 15'-0"
40'-0
"20
'-0"
40'-0
"
R 12 11 10 9 8 7 6 5 4 3 2 G
Leve
lSt
ory B 1 2 3 4 5 6 7 8 9101112
11 at 13'-0" 18'-0" 15'-0"
20'-0
"
A.
Sect
ion
at W
all (
Grid
s 3-6
)B
. Se
ctio
n at
Ext
erio
r Fra
me
(Grid
s 1 &
8)
AA
'B
CC
'D
AA
'B
CC
'D
20'-0
"20
'-0"
20'-0
"20
'-0"
FEMA P-751, NEHRP Recommended Provisions: Design Examples
7 – 6
The calculations herein are intended to provide a reference for the direct application of the design requirements presented in the 2009 NEHRP Recommended Provisions (hereafter, the Provisions) and its primary reference document ASCE 7-05 Minimum Design Loads for Buildings and Other Structures (hereafter, the Standard) and to assist the reader in developing a better understanding of the principles behind the Provisions and ASCE 7. Because a single building configuration is designed for both high and moderate levels of seismicity, two different sets of calculations are required. Instead of providing one full set of calculations for the Berkeley building and then another for the Honolulu building, portions of the calculations are presented in parallel. For example, the development of seismic forces for the Berkeley and Honolulu buildings are presented before structural design is considered for either building. The design or representative elements then is given for the Berkeley building followed by the design of the Honolulu building. Each major section (development of forces, structural design, etc.) is followed by discussion. In this context, the following portions of the design process are presented in varying amounts of detail for each structure: 1. Seismic design criteria 2. Development and computation of seismic forces 3. Structural analysis and drift checks 4. Design of structural members including typical beams, columns and beam-column joints in Frame 1;
and for the Berkeley building only, the design of the shear wall on Grid 3 In addition to the Provisions and the Standard, ACI 318-08 is the other main reference in this example. Except for very minor exceptions, the seismic force-resisting system design requirements of ACI 318 have been adopted in their entirety by the Provisions. Cases where requirements of the Provisions, the Standard and ACI 318 differ are pointed out as they occur. In addition to serving as a reference standard for seismic design, the Standard is also cited where discussions involve gravity loads, live load reduction, wind loads and load combinations. The following are referenced in this chapter: ACI 318 American Concrete Institute. 2008. Building Code Requirements and Commentary for
Structural Concrete. ASCE 7 American Society of Civil Engineers. 2005. Minimum Design Loads for Buildings and
Other Structures. ASCE 41 American Society of Civil Engineers. 2006. Seismic Rehabilitation of Existing
Buildings, including Supplement #1. Moehle Moehle, Jack P., Hooper, John D and Lubke, Chris D. 2008. “Seismic design of
reinforced concrete special moment frames: a guide for practicing engineers,” NEHRP Seismic Design Technical Brief No. 1, produced by the NEHRP Consultants Joint Venture, a partnership of the Applied Technology Council and the Consortium of Universities for Research in Earthquake Engineering, for the National Institute of Standards and Technology, Gaithersburg, MD., NIST GCR 8-917-1
Chapter 7: Reinforced Concrete
7 – 7
The structural analysis for this chapter was carried out using the ETABS Building Analysis Program, version 9.5, developed by Computers and Structures, Inc., Berkeley, California. Axial-flexural interaction for column and shear wall design was performed using the PCA Column program, version 3.5, created and developed by the Portland Cement Association.
For Berkeley, California, the short period and one-second period spectral response acceleration parameters SS and S1 are 1.65 and 0.68, respectively. For the very dense soil conditions, Site Class C is appropriate as described in Standard Section 20.3. Using SS = 1.65 and Site Class C, Standard Table 11.4-1 lists a short period site coefficient, Fa, of 1.0. For S1 > 0.5 and Site Class C, Standard Table 11.4-2 gives a velocity based site coefficient, Fv, of 1.3. Using Standard Equation 11.4-1 and 11.4-2, the adjusted maximum considered spectral response acceleration parameters for the Berkeley building are: SMS = FaSS = 1.0(1.65) = 1.65 SM1 = FvS1 = 1.3(0.68) = 0.884 The design spectral response acceleration parameters are given by Standard Equation 11.4-3 and 11.4-4: SDS = 2/3 SMS = 2/3 (1.65) = 1.10 SD1 = 2/3 SM1 = 2/3 (0.884) = 0.589 The transition period, Ts, for the Berkeley response spectrum is:
0.589 0.535 sec1.10
D1s
DS
STS
= = =
Ts is the period where the horizontal (constant acceleration) portion of the design response spectrum intersects the descending (constant velocity or acceleration inversely proportional to T) portion of the spectrum. It is used later in this example as a parameter in determining the type of analysis that is required for final design. For Honolulu, the short-period and one-second period spectral response acceleration parameters are 0.61 and 0.18, respectively. For Site Class C soils and interpolating from Standard Table 11.4-1, the Fa is 1.16 and from Standard Table 11.4-1, the interpolated value for Fv is 1.62. The adjusted maximum considered spectral response acceleration parameters for the Honolulu building are: SMS = FaSS = 1.16(0.61) = 0.708 SM1 = FvS1 = 1.62(0.178) = 0.288 and the design spectral response acceleration parameters are: SDS = 2/3 SMS = 2/3 (0.708) = 0.472 SD1 = 2/3 SM1 = 2/3 (0.288) = 0.192
FEMA P-751, NEHRP Recommended Provisions: Design Examples
7 – 8
The transition period, Ts, for the Honolulu response spectrum is:
0.192 0.407 sec0.472
D1s
DS
STS
= = =
According to Standard Section 1.5, both the Berkeley and the Honolulu buildings are classified as Occupancy Category II. Standard Table 11.5-1 assigns an occupancy importance factor, I, of 1.0 to all Occupancy Category II buildings. According to Standard Tables 11.6-1 and 11.6-2, the Berkeley building is assigned to Seismic Design Category D and the Honolulu building is assigned to Seismic Design Category C.
The seismic force-resisting systems for both the Berkeley and the Honolulu buildings consist of moment-resisting frames in the N-S direction. E-W loading is resisted by a dual frame-wall system in the Berkeley building and by a set of moment-resisting frames in the Honolulu building. For the Berkeley building, assigned to Seismic Design Category D, Standard Table 12.2-1 requires that all concrete moment-resisting frames be designed and detailed as special moment frames. Similarly, Standard Table 12.2-1 requires shear walls in dual systems to be detailed as special reinforced concrete shear walls. For the Honolulu building assigned to Seismic Design Category C, Standard Table 12.2-1 permits the use of intermediate moment frames for all building heights. Standard Table 12.2-1 provides values for the response modification coefficient, R, the system overstrength factor, Ω0 and the deflection amplification factor, Cd, for each structural system type. The values determined for the Berkeley and Honolulu buildings are summarized in Table 7-1.
Table 7-1 Response Modification, Overstrength and Deflection Amplification Coefficients for Structural Systems Used
Location Response Direction Building Frame Type R Ω0 Cd
Berkeley N-S Special moment frame 8 3 5.5
E-W Dual system incorporating special moment frame and special shear wall 7 2.5 5.5
Honolulu N-S Intermediate moment frame 5 3 4.5 E-W Intermediate moment frame 5 3 4.5
For the Berkeley building dual system, Standard Section 12.2.5.1 requires that the moment frame portion of the system be designed to resist at least 25 percent of the total seismic force. As discussed below, this requires that a separate analysis of a frame-only system be carried out for loading in the E-W direction.
Chapter 7: Reinforced Concrete
7 – 9
Based on the plan view of the building shown in Figure 7-1, the only potential horizontal irregularity is a Type 1a or 1b torsional irregularity (Standard Table 12.3-1). While the actual presence of such an irregularity cannot be determined without analysis, it appears unlikely for both the Berkeley and the Honolulu buildings because the lateral force-resisting elements of both buildings are distributed evenly over the floor. However, this will be determined later. As for the vertical irregularities listed in Standard Table 12.3-2, the presence of a soft or weak story cannot be determined without analysis. In this case, however, the first story is suspect, because its height of 18 feet is well in excess of the 13-foot height of the story above. However, it is assumed (but verified later) that a vertical irregularity does not exist.
The combinations of loads including earthquake effects are provided in Standard Section 12.4. Load combinations for other loading conditions are in Standard Chapter 2. For the Berkeley structure, the basic strength design load combinations that must be considered are: 1.2D + 1.6L (or 1.6Lr) 1.2D + 0.5L ± 1.0E 0.9D ± 1.0E In addition to the combinations listed above, for the Honolulu building wind loads govern the design of a portion of the building (as determined later), so the following strength design load combinations should also be considered: 1.2D + 0.5L ± 1.6W 0.9D ± 1.6W The load combination including only 1.4 times dead load will not control for any condition in these buildings. In accordance with Standard Section 12.4.2 the earthquake load effect, E, be defined as:
0.2E DSE Q S Dρ= + where gravity and seismic load effects are additive and
0.2E DSE Q S Dρ= − where the effects of seismic load counteract gravity. The earthquake load effect requires the determination of the redundancy factor, ρ, in accordance with Standard Section 12.3.4. For the Honolulu building (Seismic Design Category C), ρ = 1.0 per Standard Section 12.3.4.1.
FEMA P-751, NEHRP Recommended Provisions: Design Examples
7 – 10
For the Berkeley building, ρ must be determined in accordance with Standard Section 12.3.4.2. For the purpose of the example, the method in Standard Section 12.3.4.2, Method b, will be utilized. Based on the preliminary design, it is assumed that ρ = 1.0 because the structure has a perimeter moment frame and is assumed to be regular based on the plan layout. As discussed in the previous section, this will be verified later. For the Berkeley building, substituting E and with ρ taken as 1.0, the following load combinations must be used for seismic design: (1.2 + 0.2SDS)D + 0.5L ± QE (0.9 - 0.2 SDS)D ± QE Finally, substituting 1.10 for SDS, the following load combinations must be used: 1.42D + 0.5L ± QE 0.68D ± QE For the Honolulu building, substituting E and with ρ taken as 1.0, the following load combinations must be used for seismic design: (1.2 + 0.2SDS)D + 0.5L ± QE (0.9 - 0.2SDS)D ± QE Finally, substituting 0.472 for SDS, the following load combinations must be used: 1.30D + 0.5L ± QE 0.80D ± QE The seismic load combinations with overstrength given in Standard Section 12.4.3.2 are not utilized for this example because there are no discontinuous elements supporting stiffer elements above them and collector elements are not addressed.
For the Berkeley building, normal-weight concrete of 5,000 psi strength is used everywhere (except as revised for the lower floor shear walls as determined later). All reinforcement has a specified yield strength of 60 ksi. As required by ACI 318 Section 21.1.5.2, the longitudinal reinforcement in the moment frames and shear walls either must conform to ASTM A706 or be ASTM A615 reinforcement, if the actual yield strength of the steel does not exceed the specified strength by more than 18 ksi and the ratio of actual ultimate tensile stress to actual tensile yield stress is greater than 1.25. The Honolulu building also uses 5,000 psi concrete and ASTM A615 Grade 60 reinforcing steel. ASTM 706 reinforcing is not required for an intermediate moment frame.
Chapter 7: Reinforced Concrete
7 – 11
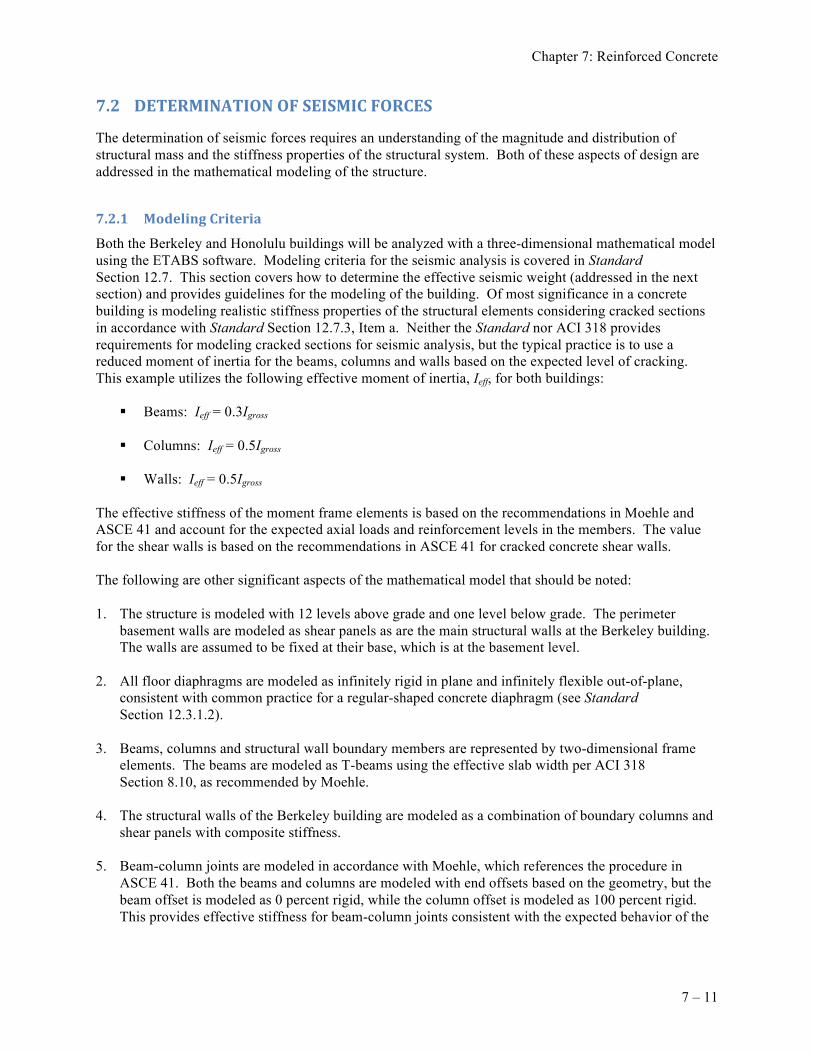
The determination of seismic forces requires an understanding of the magnitude and distribution of structural mass and the stiffness properties of the structural system. Both of these aspects of design are addressed in the mathematical modeling of the structure.
Both the Berkeley and Honolulu buildings will be analyzed with a three-dimensional mathematical model using the ETABS software. Modeling criteria for the seismic analysis is covered in Standard Section 12.7. This section covers how to determine the effective seismic weight (addressed in the next section) and provides guidelines for the modeling of the building. Of most significance in a concrete building is modeling realistic stiffness properties of the structural elements considering cracked sections in accordance with Standard Section 12.7.3, Item a. Neither the Standard nor ACI 318 provides requirements for modeling cracked sections for seismic analysis, but the typical practice is to use a reduced moment of inertia for the beams, columns and walls based on the expected level of cracking. This example utilizes the following effective moment of inertia, Ieff, for both buildings:
Beams: Ieff = 0.3Igross Columns: Ieff = 0.5Igross
Walls: Ieff = 0.5Igross
The effective stiffness of the moment frame elements is based on the recommendations in Moehle and ASCE 41 and account for the expected axial loads and reinforcement levels in the members. The value for the shear walls is based on the recommendations in ASCE 41 for cracked concrete shear walls. The following are other significant aspects of the mathematical model that should be noted: 1. The structure is modeled with 12 levels above grade and one level below grade. The perimeter
basement walls are modeled as shear panels as are the main structural walls at the Berkeley building. The walls are assumed to be fixed at their base, which is at the basement level.
2. All floor diaphragms are modeled as infinitely rigid in plane and infinitely flexible out-of-plane,
consistent with common practice for a regular-shaped concrete diaphragm (see Standard Section 12.3.1.2).
3. Beams, columns and structural wall boundary members are represented by two-dimensional frame
elements. The beams are modeled as T-beams using the effective slab width per ACI 318 Section 8.10, as recommended by Moehle.
4. The structural walls of the Berkeley building are modeled as a combination of boundary columns and
shear panels with composite stiffness. 5. Beam-column joints are modeled in accordance with Moehle, which references the procedure in
ASCE 41. Both the beams and columns are modeled with end offsets based on the geometry, but the beam offset is modeled as 0 percent rigid, while the column offset is modeled as 100 percent rigid. This provides effective stiffness for beam-column joints consistent with the expected behavior of the
FEMA P-751, NEHRP Recommended Provisions: Design Examples
7 – 12
joint: strong column-weak beam condition. (While the recommendations in Moehle are intended for special moment frames, the same joint rigidities are used for Honolulu for consistency.)
6. P-delta effects are neglected in the analysis for simplicity. This assumption is verified later in this
example. 7. While the base of the model is located at the basement level, the seismic base for determination of
forces is assumed to be at the first floor, which is at the exterior grade.
Before the building mass can be determined, the approximate size of the different members of the seismic force-resisting system must be established. For special moment frames, limitations on beam-column joint shear and reinforcement development length usually control. An additional consideration is the amount of vertical reinforcement in the columns. ACI 318 Section 21.4.3.1 limits the vertical steel reinforcing ratio to 6 percent for special moment frame columns; however, 3 to 4 percent vertical steel is a more practical upper-bound limit. Based on a series of preliminary calculations (not shown here), it is assumed that for the Berkeley building all columns and structural wall boundary elements are 30 inches by 30 inches, beams are 24 inches wide by 32 inches deep and the panel of the structural wall is 16 inches thick. It has already been established that pan joists are spaced at 36 inches on center, have an average web thickness of 6 inches and, including a 4-inch-thick slab, are 20 inches deep. For the Berkeley building, these member sizes probably are close to the final sizes. For the Honolulu building (which does not have the weight of concrete walls and ends up with slightly smaller frame elements: 28- by 28-inch columns and 20- by 30-inch beams), the masses computed from the Berkeley member sizes are slightly high but are used for consistency. In addition to the building structural weight, the following superimposed dead loads are assumed:
Roofing = 10 psf
Partition = 10 psf (see Standard Section 12.7.2, Item 2)
Ceiling and M/E/P = 10 psf
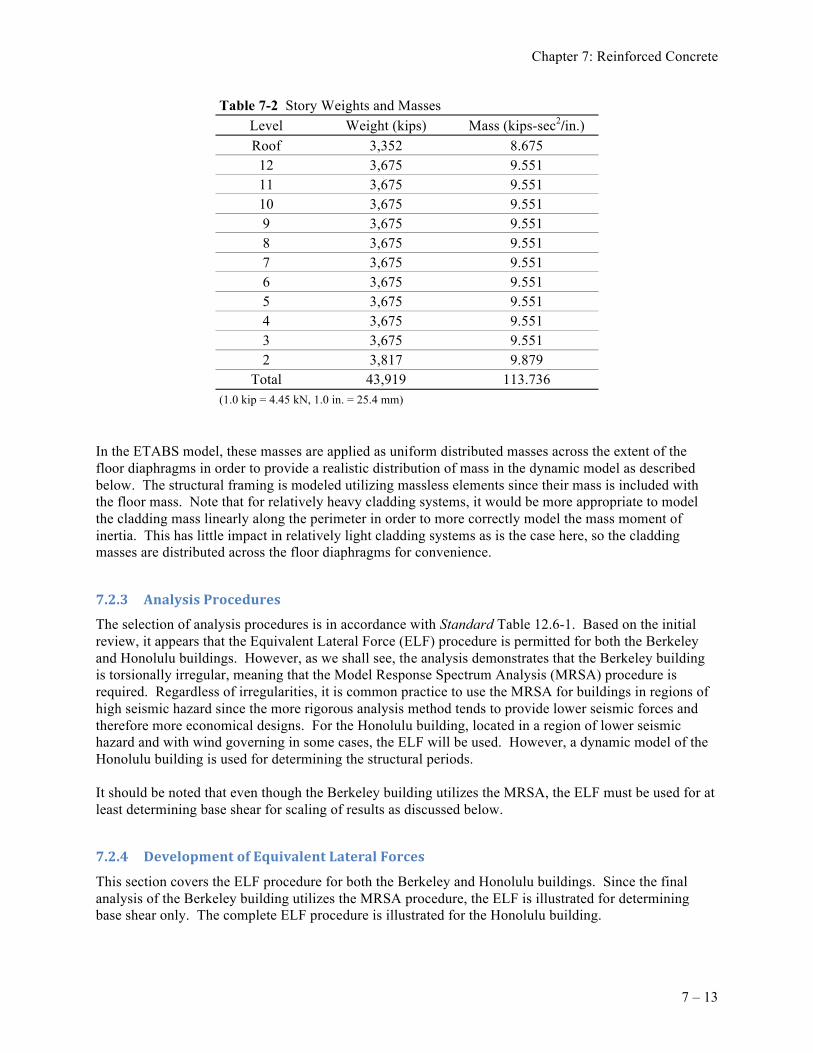
Curtain wall cladding = 10 psf (on vertical surface area) Based on the above member sizes and superimposed dead load, the individual story weights and masses are listed in Table 7-2. These masses are used for the analysis of both the Berkeley and the Honolulu buildings. Note from Table 7-2 that the roof and lowest floor have masses slightly different from the typical floors. It is also interesting to note that the average density of this building is 12.4 pcf, which is in the range of typical concrete buildings with relatively high floor-to-floor heights.
Chapter 7: Reinforced Concrete
7 – 13
Table 7-2 Story Weights and Masses Level Weight (kips) Mass (kips-sec2/in.) Roof 3,352 8.675
12 3,675 9.551 11 3,675 9.551 10 3,675 9.551 9 3,675 9.551 8 3,675 9.551 7 3,675 9.551 6 3,675 9.551 5 3,675 9.551 4 3,675 9.551 3 3,675 9.551 2 3,817 9.879
Total 43,919 113.736 (1.0 kip = 4.45 kN, 1.0 in. = 25.4 mm)
In the ETABS model, these masses are applied as uniform distributed masses across the extent of the floor diaphragms in order to provide a realistic distribution of mass in the dynamic model as described below. The structural framing is modeled utilizing massless elements since their mass is included with the floor mass. Note that for relatively heavy cladding systems, it would be more appropriate to model the cladding mass linearly along the perimeter in order to more correctly model the mass moment of inertia. This has little impact in relatively light cladding systems as is the case here, so the cladding masses are distributed across the floor diaphragms for convenience.
The selection of analysis procedures is in accordance with Standard Table 12.6-1. Based on the initial review, it appears that the Equivalent Lateral Force (ELF) procedure is permitted for both the Berkeley and Honolulu buildings. However, as we shall see, the analysis demonstrates that the Berkeley building is torsionally irregular, meaning that the Model Response Spectrum Analysis (MRSA) procedure is required. Regardless of irregularities, it is common practice to use the MRSA for buildings in regions of high seismic hazard since the more rigorous analysis method tends to provide lower seismic forces and therefore more economical designs. For the Honolulu building, located in a region of lower seismic hazard and with wind governing in some cases, the ELF will be used. However, a dynamic model of the Honolulu building is used for determining the structural periods. It should be noted that even though the Berkeley building utilizes the MRSA, the ELF must be used for at least determining base shear for scaling of results as discussed below.
This section covers the ELF procedure for both the Berkeley and Honolulu buildings. Since the final analysis of the Berkeley building utilizes the MRSA procedure, the ELF is illustrated for determining base shear only. The complete ELF procedure is illustrated for the Honolulu building.
FEMA P-751, NEHRP Recommended Provisions: Design Examples
7 – 14
7.2.4.1 Period Determination. Requirements for the computation of building period are given in Standard Section 12.8.2. For the preliminary design using the ELF procedure, the approximate period, Ta, computed in accordance with Standard Equation 12.8.7 can be used: x
a t nT C h= The method for determining approximate period will generally result in periods that are lower (hence, more conservative for use in predicting base shear) than those computed from a more rigorous mathematical model. If a more rigorous analysis is carried out, the resulting period may be too high due to a variety of possible modeling simplifications and assumptions. Consequently, the Standard places an upper limit on the period that can be used for design. The upper limit is T = CuTa where Cu is provided in Standard Table 12.8-1. For the N-S direction of the Berkeley building, the structure is a reinforced concrete moment-resisting frame and the approximate period is calculated according to Standard Equation 12.8-7 using Ct = 0.016 and x = 0.9 per Standard Table 12.8-2. For hn = 161 feet, Ta = 1.55 seconds and SD1 > 0.40 for the Berkeley building, Cu = 1.4 and the upper limit on the analytical period is T = 1.4(1.55) = 2.17 seconds. For E-W seismic activity in Berkeley, the structure is a dual system, so Ct = 0.020 and x =0.75 for “other structures.” The approximate period, Ta = 0.90 second and the upper limit on the analytical period is 1.4(0.90) = 1.27 seconds. For the Honolulu building, the Ta = 1.55 second period computed above for concrete moment frames is applicable in both the N-S and E-W directions. For Honolulu, SD1 is 0.192 and, from Standard Table 12.8-1, Cu can be taken as 1.52. The upper limit on the analytical period is T = 1.52(1.55) = 2.35 seconds. For the detailed period determination at both the Berkeley and Honolulu buildings, computer models were developed based on the criteria in Section 7.2.1. A summary of the Berkeley analysis is presented in Section 7.2.6, but the fundamental periods are presented here. The computed N-S period of vibration is 2.02 seconds. This is between the approximate period, Ta = 1.55 seconds and CuTa = 2.17 seconds. In the E-W direction, the computed period is 1.42 seconds, which is greater than both Ta = 0.90 second and CuTa = 1.27 seconds. Therefore, the periods used for the ELF procedure are 2.02 seconds in the N-S direction and 1.27 seconds in the E-W direction. For the Honolulu building, the computed periods in the N-S and E-W directions are 2.40 seconds and 2.33 seconds, respectively. The N-S period is similar to the Berkeley building because there are no walls in the N-S direction of either building, but the Honolulu period is higher due to the smaller framing member sizes. In the E-W direction, the increase in period from 1.42 seconds at the Berkeley building to 2.33 seconds indicates a significant reduction in stiffness due to the lack of the walls in the Honolulu building. For both the E-W and the N-S directions, Ta for the Honolulu building is 1.55 seconds and CuTa is 2.35 seconds. Therefore, for the purpose of computing ELF forces, the periods are 2.35 seconds and 2.33 seconds in the N-S and E-W directions, respectively.
Chapter 7: Reinforced Concrete
7 – 15
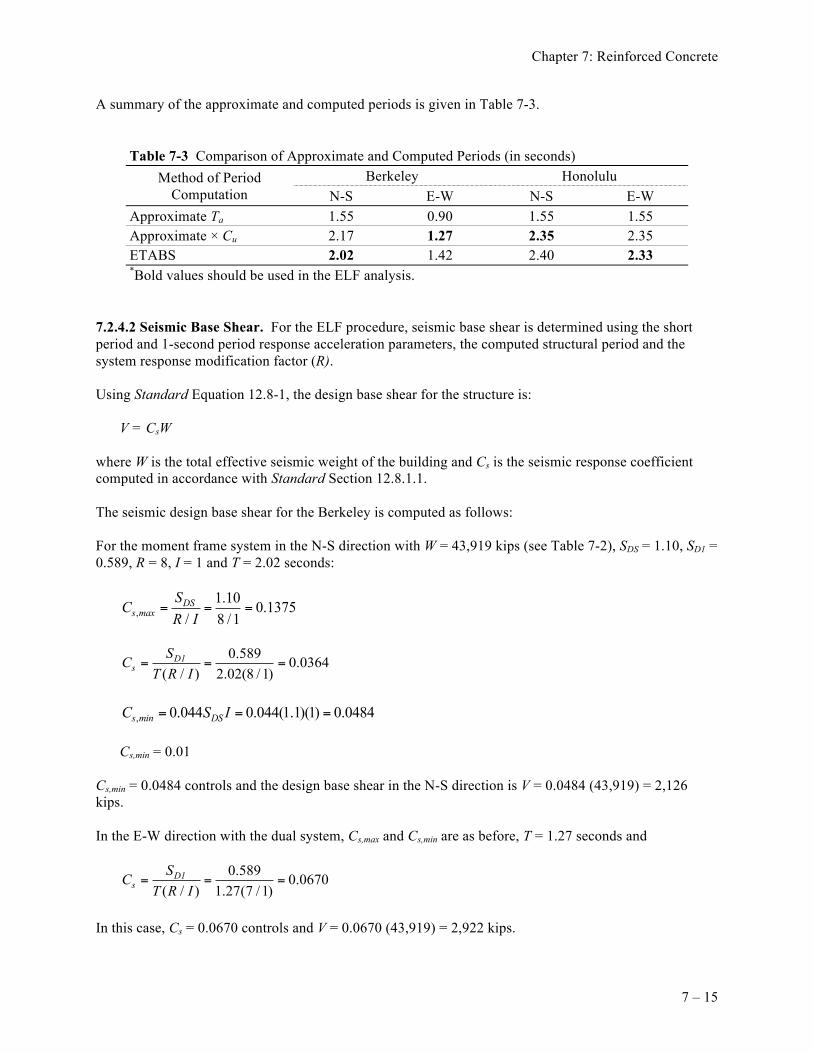
A summary of the approximate and computed periods is given in Table 7-3.
Table 7-3 Comparison of Approximate and Computed Periods (in seconds) Method of Period
Computation Berkeley Honolulu
N-S E-W N-S E-W Approximate Ta 1.55 0.90 1.55 1.55 Approximate × Cu 2.17 1.27 2.35 2.35 ETABS 2.02 1.42 2.40 2.33 *Bold values should be used in the ELF analysis.
7.2.4.2 Seismic Base Shear. For the ELF procedure, seismic base shear is determined using the short period and 1-second period response acceleration parameters, the computed structural period and the system response modification factor (R). Using Standard Equation 12.8-1, the design base shear for the structure is: V = CsW where W is the total effective seismic weight of the building and Cs is the seismic response coefficient computed in accordance with Standard Section 12.8.1.1. The seismic design base shear for the Berkeley is computed as follows: For the moment frame system in the N-S direction with W = 43,919 kips (see Table 7-2), SDS = 1.10, SD1 = 0.589, R = 8, I = 1 and T = 2.02 seconds:
,1.10 0.1375
/ 8 /1DS
s maxSCR I
= = =
0.589 0.0364( / ) 2.02(8 /1)D1
sSC
T R I= = =
, 0.044 0.044(1.1)(1) 0.0484s min DSC S I= = = Cs,min = 0.01 Cs,min = 0.0484 controls and the design base shear in the N-S direction is V = 0.0484 (43,919) = 2,126 kips. In the E-W direction with the dual system, Cs,max and Cs,min are as before, T = 1.27 seconds and
0.589 0.0670( / ) 1.27(7 /1)D1
sSC
T R I= = =
In this case, Cs = 0.0670 controls and V = 0.0670 (43,919) = 2,922 kips.
FEMA P-751, NEHRP Recommended Provisions: Design Examples
7 – 16
For the Honolulu building, base shears are computed in a similar manner and are nearly the same for the N-S and the E-W directions. With W = 43,919 kips, SDS = 0.474, SD1 = 0.192, R = 5, I = 1 and T = 2.35 seconds in the N-S direction:
,0.472 0.0944
/ 5 /1DS
s maxSCR I
= = =
0.192 0.0163( / ) 2.35(5 /1)D1
sSC
T R I= = =
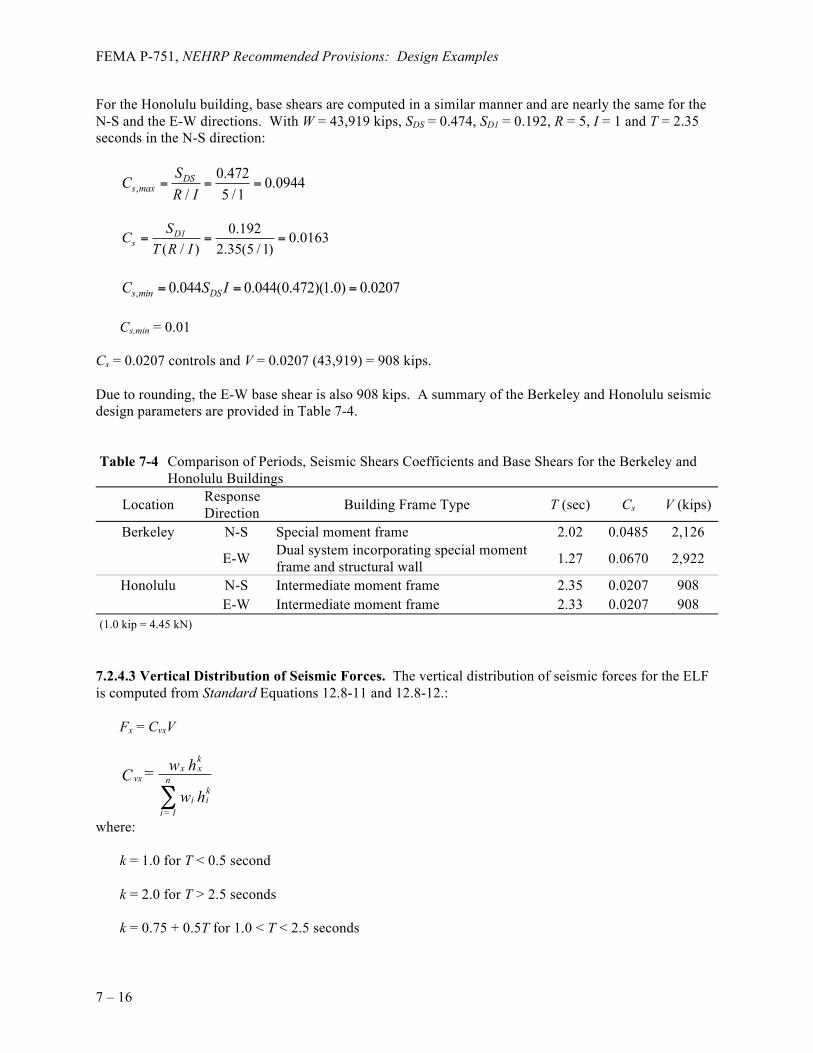
, 0.044 0.044(0.472)(1.0) 0.0207s min DSC S I= = = Cs,min = 0.01 Cs = 0.0207 controls and V = 0.0207 (43,919) = 908 kips. Due to rounding, the E-W base shear is also 908 kips. A summary of the Berkeley and Honolulu seismic design parameters are provided in Table 7-4. Table 7-4 Comparison of Periods, Seismic Shears Coefficients and Base Shears for the Berkeley and
Honolulu Buildings
Location Response Direction Building Frame Type T (sec) Cs V (kips)
Berkeley N-S Special moment frame 2.02 0.0485 2,126
E-W Dual system incorporating special moment frame and structural wall 1.27 0.0670 2,922
Honolulu N-S Intermediate moment frame 2.35 0.0207 908 E-W Intermediate moment frame 2.33 0.0207 908
(1.0 kip = 4.45 kN) 7.2.4.3 Vertical Distribution of Seismic Forces. The vertical distribution of seismic forces for the ELF is computed from Standard Equations 12.8-11 and 12.8-12.: Fx = CvxV
k
x xvx n
ki i
i = 1
w h = C w h∑
where: k = 1.0 for T < 0.5 second k = 2.0 for T > 2.5 seconds k = 0.75 + 0.5T for 1.0 < T < 2.5 seconds
Chapter 7: Reinforced Concrete
7 – 17
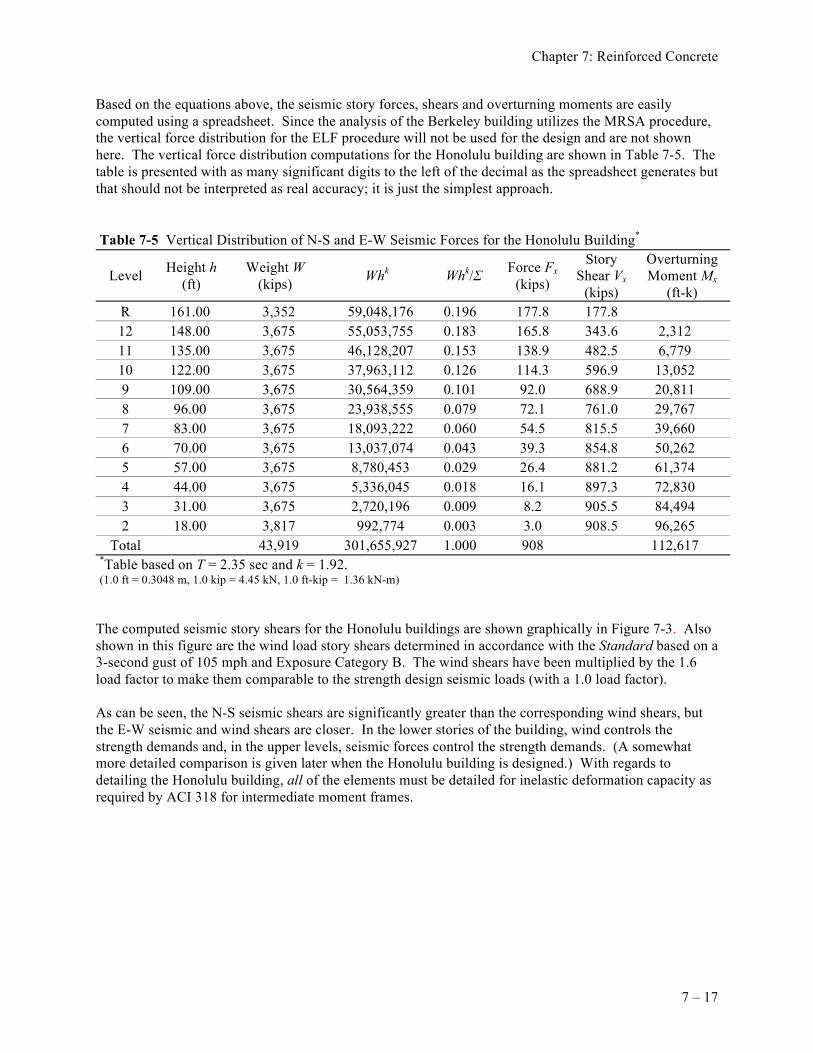
Based on the equations above, the seismic story forces, shears and overturning moments are easily computed using a spreadsheet. Since the analysis of the Berkeley building utilizes the MRSA procedure, the vertical force distribution for the ELF procedure will not be used for the design and are not shown here. The vertical force distribution computations for the Honolulu building are shown in Table 7-5. The table is presented with as many significant digits to the left of the decimal as the spreadsheet generates but that should not be interpreted as real accuracy; it is just the simplest approach. Table 7-5 Vertical Distribution of N-S and E-W Seismic Forces for the Honolulu Building*
Level Height h (ft)
Weight W (kips) Whk Whk/Σ Force Fx
(kips)
Story Shear Vx
(kips)
Overturning Moment Mx
(ft-k) R 161.00 3,352 59,048,176 0.196 177.8 177.8 12 148.00 3,675 55,053,755 0.183 165.8 343.6 2,312 11 135.00 3,675 46,128,207 0.153 138.9 482.5 6,779 10 122.00 3,675 37,963,112 0.126 114.3 596.9 13,052 9 109.00 3,675 30,564,359 0.101 92.0 688.9 20,811 8 96.00 3,675 23,938,555 0.079 72.1 761.0 29,767 7 83.00 3,675 18,093,222 0.060 54.5 815.5 39,660 6 70.00 3,675 13,037,074 0.043 39.3 854.8 50,262 5 57.00 3,675 8,780,453 0.029 26.4 881.2 61,374 4 44.00 3,675 5,336,045 0.018 16.1 897.3 72,830 3 31.00 3,675 2,720,196 0.009 8.2 905.5 84,494 2 18.00 3,817 992,774 0.003 3.0 908.5 96,265
Total 43,919 301,655,927 1.000 908 112,617 *Table based on T = 2.35 sec and k = 1.92. (1.0 ft = 0.3048 m, 1.0 kip = 4.45 kN, 1.0 ft-kip = 1.36 kN-m)
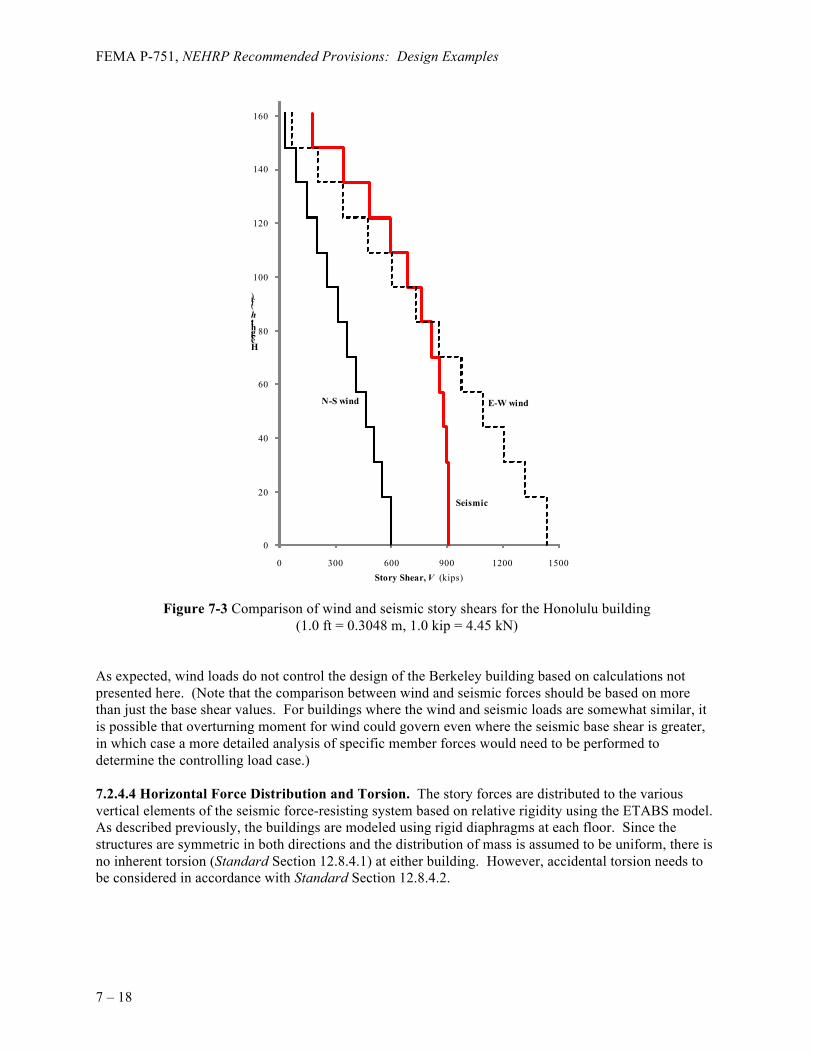
The computed seismic story shears for the Honolulu buildings are shown graphically in Figure 7-3. Also shown in this figure are the wind load story shears determined in accordance with the Standard based on a 3-second gust of 105 mph and Exposure Category B. The wind shears have been multiplied by the 1.6 load factor to make them comparable to the strength design seismic loads (with a 1.0 load factor). As can be seen, the N-S seismic shears are significantly greater than the corresponding wind shears, but the E-W seismic and wind shears are closer. In the lower stories of the building, wind controls the strength demands and, in the upper levels, seismic forces control the strength demands. (A somewhat more detailed comparison is given later when the Honolulu building is designed.) With regards to detailing the Honolulu building, all of the elements must be detailed for inelastic deformation capacity as required by ACI 318 for intermediate moment frames.
FEMA P-751, NEHRP Recommended Provisions: Design Examples
7 – 18
Figure 7-3 Comparison of wind and seismic story shears for the Honolulu building (1.0 ft = 0.3048 m, 1.0 kip = 4.45 kN)
As expected, wind loads do not control the design of the Berkeley building based on calculations not presented here. (Note that the comparison between wind and seismic forces should be based on more than just the base shear values. For buildings where the wind and seismic loads are somewhat similar, it is possible that overturning moment for wind could govern even where the seismic base shear is greater, in which case a more detailed analysis of specific member forces would need to be performed to determine the controlling load case.) 7.2.4.4 Horizontal Force Distribution and Torsion. The story forces are distributed to the various vertical elements of the seismic force-resisting system based on relative rigidity using the ETABS model. As described previously, the buildings are modeled using rigid diaphragms at each floor. Since the structures are symmetric in both directions and the distribution of mass is assumed to be uniform, there is no inherent torsion (Standard Section 12.8.4.1) at either building. However, accidental torsion needs to be considered in accordance with Standard Section 12.8.4.2.
Seismic
E-W windN-S wind
0
20
40
60
80
100
120
140
160
0 300 600 900 1200 1500
Height, h(ft)
Story Shear, V (kips)
Chapter 7: Reinforced Concrete
7 – 19
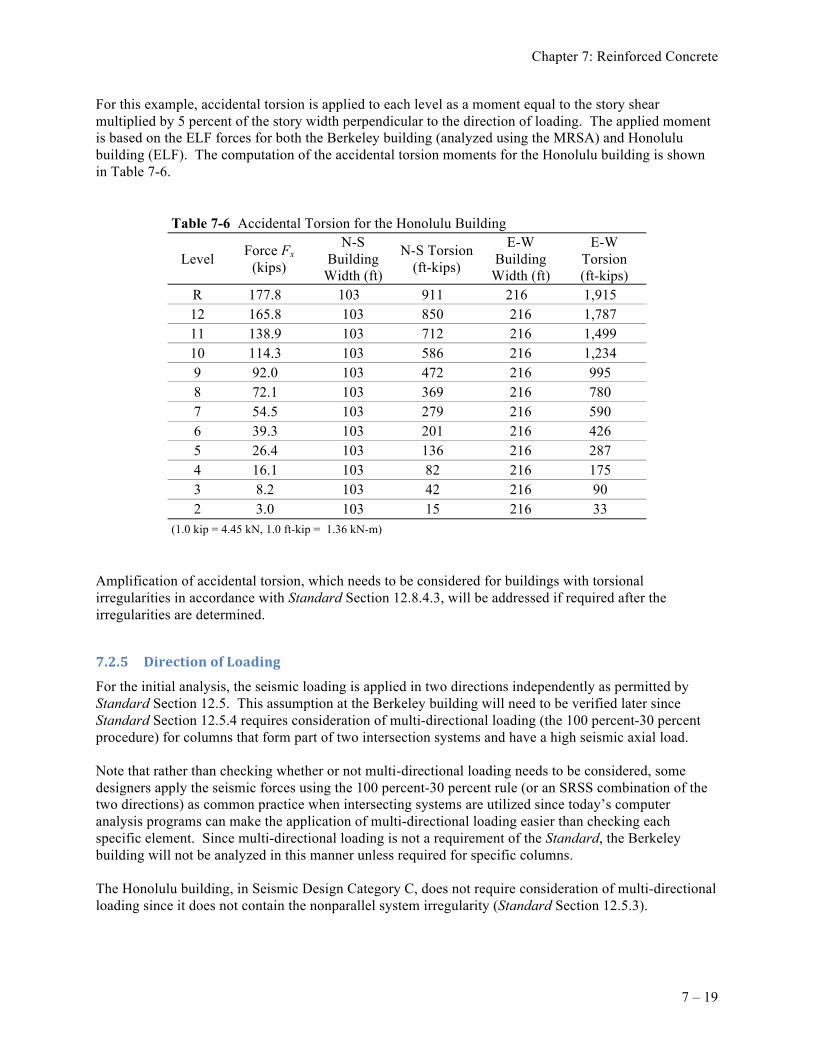
For this example, accidental torsion is applied to each level as a moment equal to the story shear multiplied by 5 percent of the story width perpendicular to the direction of loading. The applied moment is based on the ELF forces for both the Berkeley building (analyzed using the MRSA) and Honolulu building (ELF). The computation of the accidental torsion moments for the Honolulu building is shown in Table 7-6.
Table 7-6 Accidental Torsion for the Honolulu Building
Level Force Fx (kips)
N-S Building
Width (ft)
N-S Torsion (ft-kips)
E-W Building
Width (ft)
E-W Torsion (ft-kips)
R 177.8 103 911 216 1,915 12 165.8 103 850 216 1,787 11 138.9 103 712 216 1,499 10 114.3 103 586 216 1,234 9 92.0 103 472 216 995 8 72.1 103 369 216 780 7 54.5 103 279 216 590 6 39.3 103 201 216 426 5 26.4 103 136 216 287 4 16.1 103 82 216 175 3 8.2 103 42 216 90 2 3.0 103 15 216 33
(1.0 kip = 4.45 kN, 1.0 ft-kip = 1.36 kN-m) Amplification of accidental torsion, which needs to be considered for buildings with torsional irregularities in accordance with Standard Section 12.8.4.3, will be addressed if required after the irregularities are determined.
For the initial analysis, the seismic loading is applied in two directions independently as permitted by Standard Section 12.5. This assumption at the Berkeley building will need to be verified later since Standard Section 12.5.4 requires consideration of multi-directional loading (the 100 percent-30 percent procedure) for columns that form part of two intersection systems and have a high seismic axial load. Note that rather than checking whether or not multi-directional loading needs to be considered, some designers apply the seismic forces using the 100 percent-30 percent rule (or an SRSS combination of the two directions) as common practice when intersecting systems are utilized since today’s computer analysis programs can make the application of multi-directional loading easier than checking each specific element. Since multi-directional loading is not a requirement of the Standard, the Berkeley building will not be analyzed in this manner unless required for specific columns. The Honolulu building, in Seismic Design Category C, does not require consideration of multi-directional loading since it does not contain the nonparallel system irregularity (Standard Section 12.5.3).
FEMA P-751, NEHRP Recommended Provisions: Design Examples
7 – 20
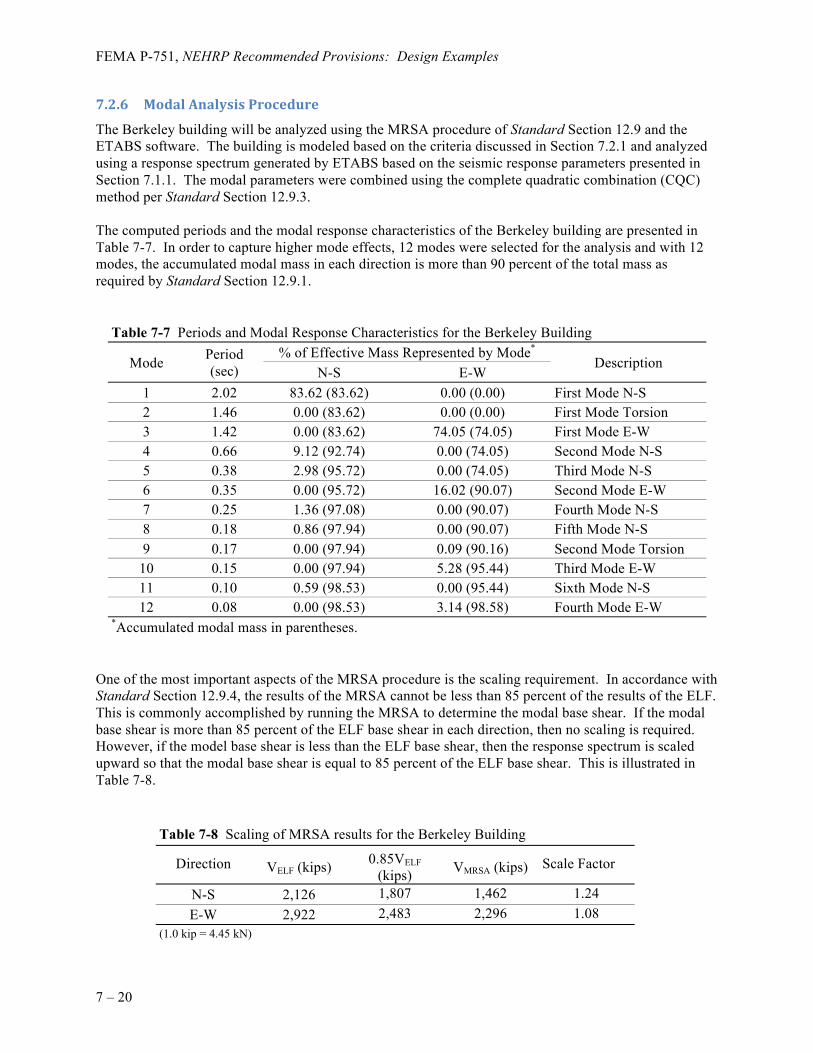
The Berkeley building will be analyzed using the MRSA procedure of Standard Section 12.9 and the ETABS software. The building is modeled based on the criteria discussed in Section 7.2.1 and analyzed using a response spectrum generated by ETABS based on the seismic response parameters presented in Section 7.1.1. The modal parameters were combined using the complete quadratic combination (CQC) method per Standard Section 12.9.3. The computed periods and the modal response characteristics of the Berkeley building are presented in Table 7-7. In order to capture higher mode effects, 12 modes were selected for the analysis and with 12 modes, the accumulated modal mass in each direction is more than 90 percent of the total mass as required by Standard Section 12.9.1.
Table 7-7 Periods and Modal Response Characteristics for the Berkeley Building
Mode Period (sec)
% of Effective Mass Represented by Mode* Description
N-S E-W 1 2.02 83.62 (83.62) 0.00 (0.00) First Mode N-S 2 1.46 0.00 (83.62) 0.00 (0.00) First Mode Torsion 3 1.42 0.00 (83.62) 74.05 (74.05) First Mode E-W 4 0.66 9.12 (92.74) 0.00 (74.05) Second Mode N-S 5 0.38 2.98 (95.72) 0.00 (74.05) Third Mode N-S 6 0.35 0.00 (95.72) 16.02 (90.07) Second Mode E-W 7 0.25 1.36 (97.08) 0.00 (90.07) Fourth Mode N-S 8 0.18 0.86 (97.94) 0.00 (90.07) Fifth Mode N-S 9 0.17 0.00 (97.94) 0.09 (90.16) Second Mode Torsion
10 0.15 0.00 (97.94) 5.28 (95.44) Third Mode E-W 11 0.10 0.59 (98.53) 0.00 (95.44) Sixth Mode N-S 12 0.08 0.00 (98.53) 3.14 (98.58) Fourth Mode E-W
*Accumulated modal mass in parentheses. One of the most important aspects of the MRSA procedure is the scaling requirement. In accordance with Standard Section 12.9.4, the results of the MRSA cannot be less than 85 percent of the results of the ELF. This is commonly accomplished by running the MRSA to determine the modal base shear. If the modal base shear is more than 85 percent of the ELF base shear in each direction, then no scaling is required. However, if the model base shear is less than the ELF base shear, then the response spectrum is scaled upward so that the modal base shear is equal to 85 percent of the ELF base shear. This is illustrated in Table 7-8.
Table 7-8 Scaling of MRSA results for the Berkeley Building
Direction VELF (kips) 0.85VELF (kips) VMRSA (kips) Scale Factor
N-S 2,126 1,807 1,462 1.24 E-W 2,922 2,483 2,296 1.08
(1.0 kip = 4.45 kN)
Chapter 7: Reinforced Concrete
7 – 21
Therefore, the response spectrum functions for the Berkeley analysis will be scaled by 1.24 and 1.08 in the N-S and E-W directions, respectively, which will result in the modal base shears being equal to 85 percent of the static base shears. As discussed previously, the accidental torsion requirement for the model analysis will be satisfied by applying the torsional moments computed for the ELF procedure as a static load case that will be combined with the dynamic load case for the MRSA forces.
The checks of story drift and P-delta effect are contained in this section, but first, deflection-related configuration checks are performed for each building. As discussed previously, these structures could contain torsional or soft-story irregularities. The output from the drift analysis will be used to determine if either of these irregularities is present in the buildings. However, the presence of a soft story irregularity impacts only the analysis procedure limitations for the Berkeley building and has no impact on the design procedures for the Honolulu building.
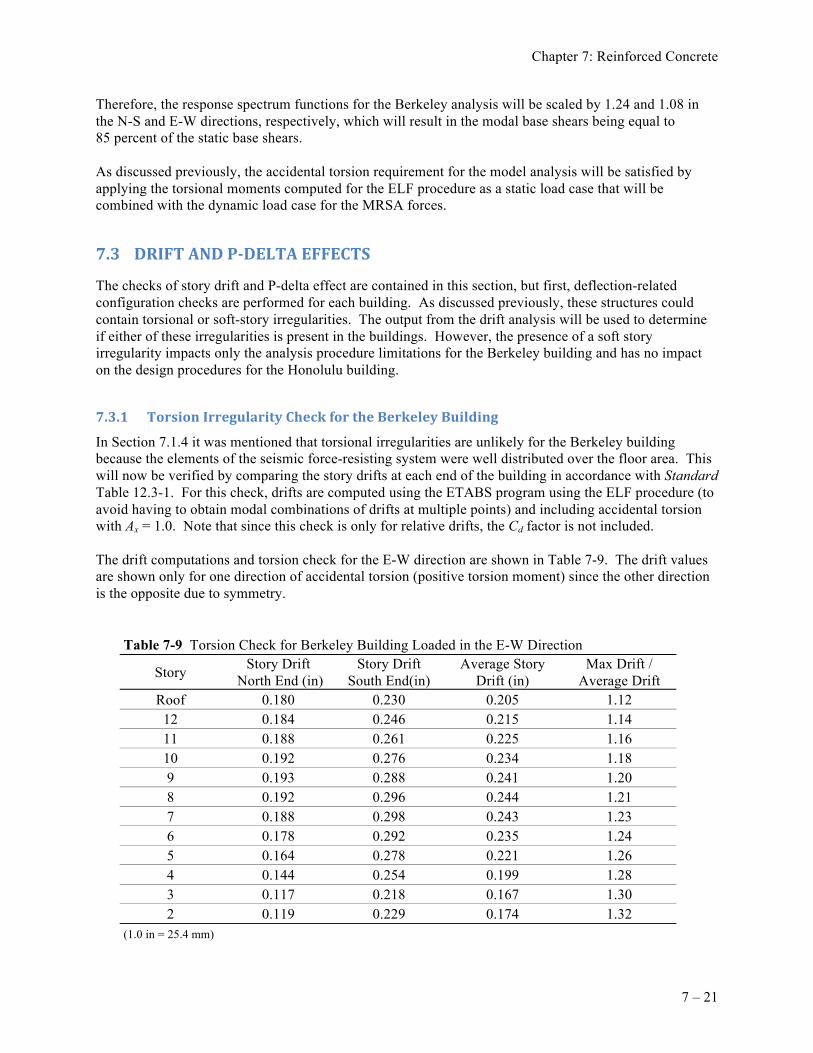
In Section 7.1.4 it was mentioned that torsional irregularities are unlikely for the Berkeley building because the elements of the seismic force-resisting system were well distributed over the floor area. This will now be verified by comparing the story drifts at each end of the building in accordance with Standard Table 12.3-1. For this check, drifts are computed using the ETABS program using the ELF procedure (to avoid having to obtain modal combinations of drifts at multiple points) and including accidental torsion with Ax = 1.0. Note that since this check is only for relative drifts, the Cd factor is not included. The drift computations and torsion check for the E-W direction are shown in Table 7-9. The drift values are shown only for one direction of accidental torsion (positive torsion moment) since the other direction is the opposite due to symmetry.
Table 7-9 Torsion Check for Berkeley Building Loaded in the E-W Direction
Story Story Drift North End (in)
Story Drift South End(in)
Average Story Drift (in)
Max Drift / Average Drift
Roof 0.180 0.230 0.205 1.12 12 0.184 0.246 0.215 1.14 11 0.188 0.261 0.225 1.16 10 0.192 0.276 0.234 1.18 9 0.193 0.288 0.241 1.20 8 0.192 0.296 0.244 1.21 7 0.188 0.298 0.243 1.23 6 0.178 0.292 0.235 1.24 5 0.164 0.278 0.221 1.26 4 0.144 0.254 0.199 1.28 3 0.117 0.218 0.167 1.30 2 0.119 0.229 0.174 1.32
(1.0 in = 25.4 mm)
FEMA P-751, NEHRP Recommended Provisions: Design Examples
7 – 22
As can be seen from the table, a torsional irregularity (Type 1a) does exist at Story 8 and below because the ratio of maximum to average drift exceeds 1.2. This is counterintuitive for a symmetric building but can happen for a building in which the lateral elements are located towards the center of a relatively long floor plate, as occurs here. This configuration results in a relatively large accidental torsion load but relatively low torsional resistance. For loading in the N-S direction, similar computations (not shown here) demonstrate that the structure is torsionally regular. The presence of the torsional irregularity in the E-W direction has several implications for the design:
The qualitative determination for using the redundancy factor, ρ, equal to 1.0 is not applicable per Standard Section 12.3.4.2, Item b, as previously assumed in Section 7.1.5. For the purposes of this example, we will assume ρ = 1.0 based on Standard Section 12.3.4.2, Item a. Due to the number of shear walls and moment frames in the E-W direction, the loss of individual wall or frame elements would still satisfy the criteria of Standard Table 12.3-3. This would have to be verified independently and if those criteria were not met, then analysis would have to be revised with ρ = 1.3.
The ELF procedure is not permitted per Standard Table 12.6-1. This does not change the
analysis since we are utilizing the MRSA procedure.
The amplification of accidental torsion needs to be considered per Standard Section 12.8.4.3. The Ax factor is computed for each floor in this direction and the analysis is revised. See below.
Story drifts need to be checked at both ends of the building rather than at the floor centroid, per
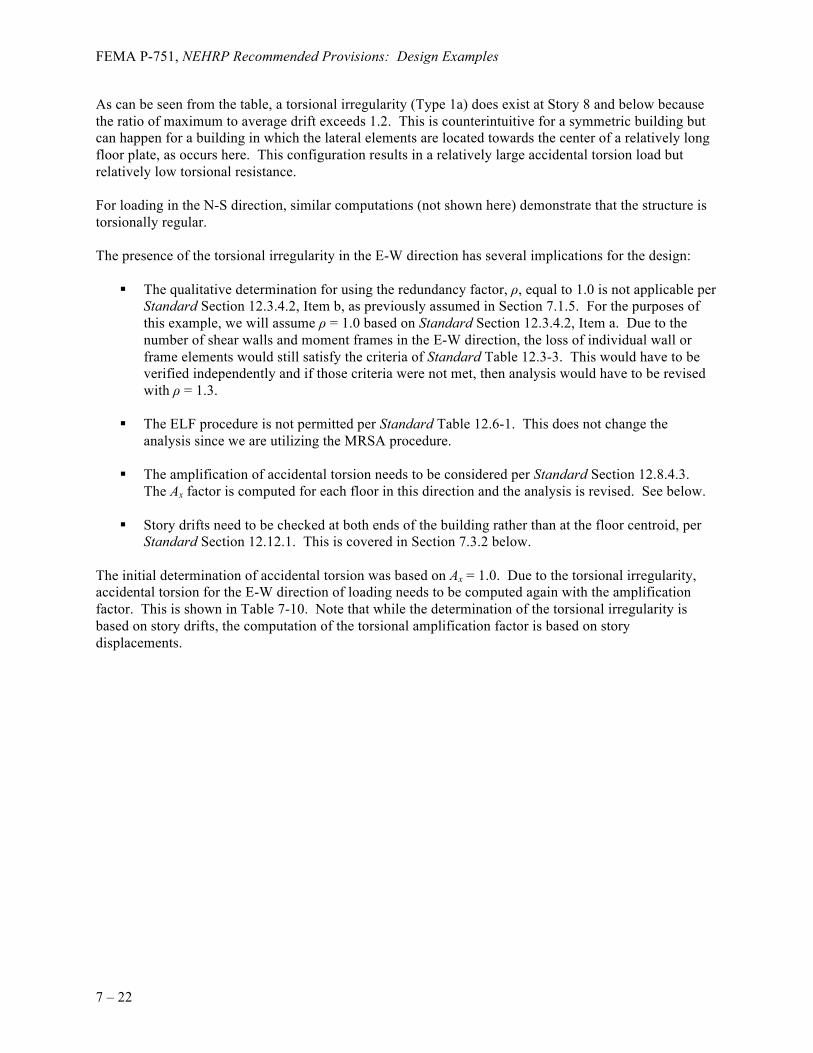
Standard Section 12.12.1. This is covered in Section 7.3.2 below. The initial determination of accidental torsion was based on Ax = 1.0. Due to the torsional irregularity, accidental torsion for the E-W direction of loading needs to be computed again with the amplification factor. This is shown in Table 7-10. Note that while the determination of the torsional irregularity is based on story drifts, the computation of the torsional amplification factor is based on story displacements.
Chapter 7: Reinforced Concrete
7 – 23
Table 7-10 Accidental Torsion for the Berkeley Building
Level Force Fx (kips)
E-W Building
Width (ft)
E-W Torsion
(ft-k)
Max Displ (in)
Ave Displ (in) Ax
E-W Torsion,
AxMta (ft-k) Roof 474.8 213 5,045 3.17 2.60 1.03 5,186
12 463.3 213 4,923 2.94 2.40 1.04 5,128 11 408.0 213 4,335 2.69 2.18 1.06 4,575 10 354.7 213 3,769 2.43 1.96 1.07 4,029 9 303.5 213 3,225 2.15 1.72 1.08 3,493 8 254.6 213 2,706 1.87 1.48 1.10 2,970 7 208.2 213 2,213 1.57 1.24 1.11 2,463 6 164.5 213 1,748 1.27 1.00 1.13 1,976 5 123.8 213 1,316 0.98 0.76 1.15 1,511 4 86.6 213 920 0.70 0.54 1.17 1,075 3 53.3 213 567 0.45 0.34 1.19 674 2 26.1 213 278 0.23 0.17 1.20 333
(1.0 kip = 4.45 kN, .0 ft = 0.3048 m, 1.0 ft-kip = 1.36 kN-m) With the revised accidental torsion values for the E-W direction of loading, the ETABS model is rerun for the drift checks and member design in subsequent sections.
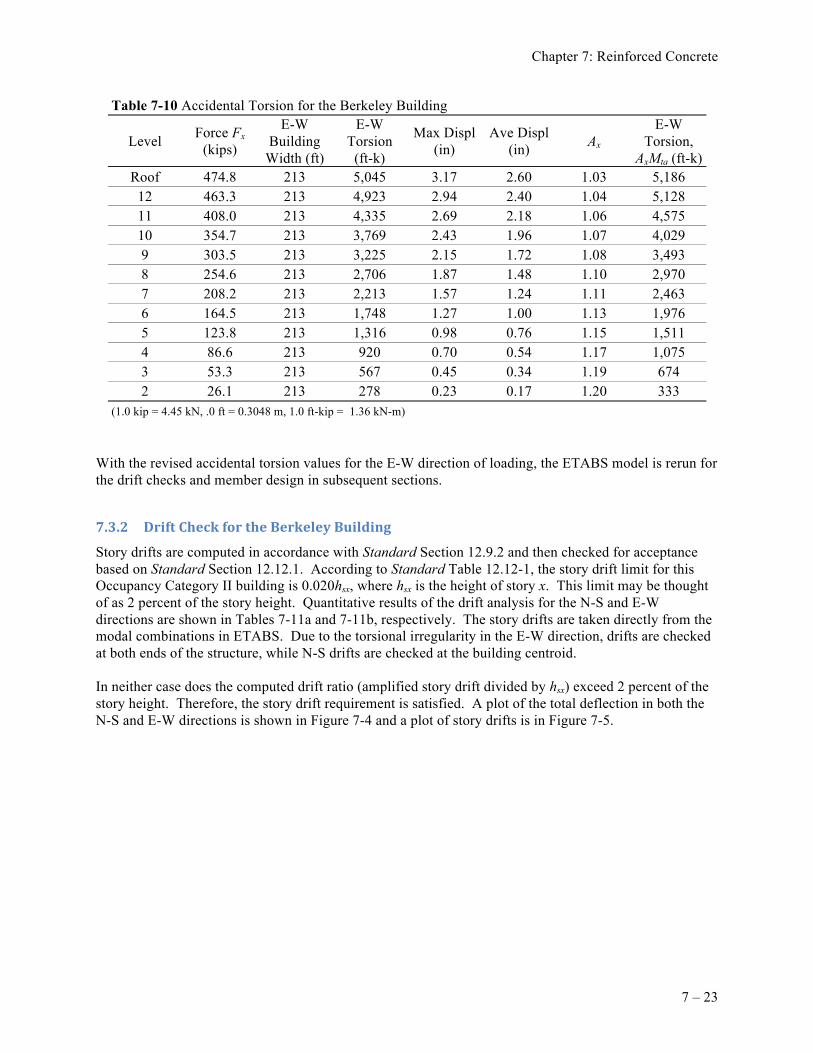
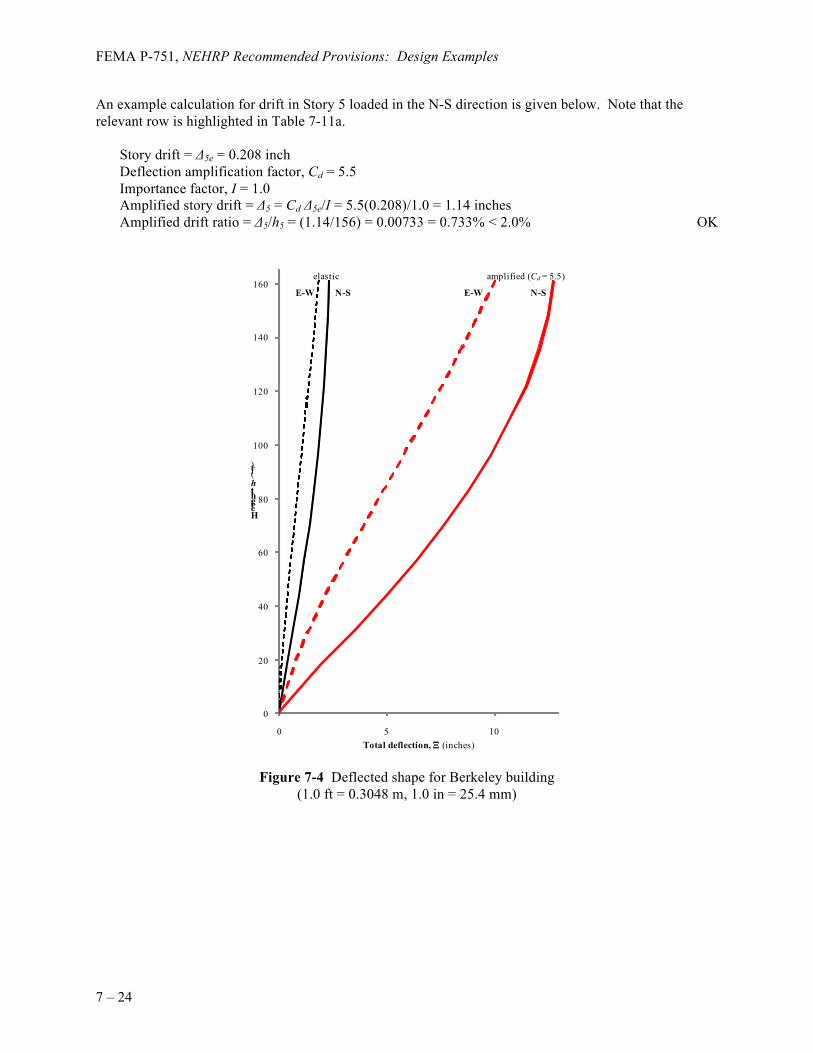
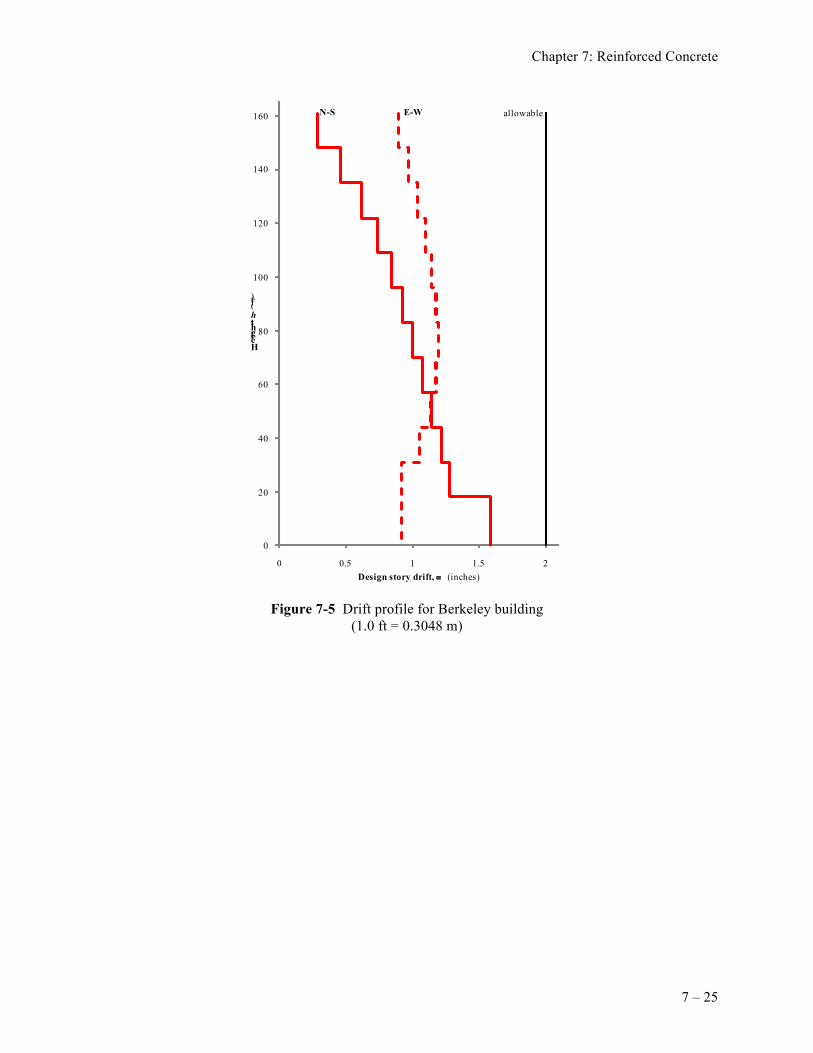
Story drifts are computed in accordance with Standard Section 12.9.2 and then checked for acceptance based on Standard Section 12.12.1. According to Standard Table 12.12-1, the story drift limit for this Occupancy Category II building is 0.020hsx, where hsx is the height of story x. This limit may be thought of as 2 percent of the story height. Quantitative results of the drift analysis for the N-S and E-W directions are shown in Tables 7-11a and 7-11b, respectively. The story drifts are taken directly from the modal combinations in ETABS. Due to the torsional irregularity in the E-W direction, drifts are checked at both ends of the structure, while N-S drifts are checked at the building centroid. In neither case does the computed drift ratio (amplified story drift divided by hsx) exceed 2 percent of the story height. Therefore, the story drift requirement is satisfied. A plot of the total deflection in both the N-S and E-W directions is shown in Figure 7-4 and a plot of story drifts is in Figure 7-5.
FEMA P-751, NEHRP Recommended Provisions: Design Examples
7 – 24
An example calculation for drift in Story 5 loaded in the N-S direction is given below. Note that the relevant row is highlighted in Table 7-11a.
Story drift = Δ5e = 0.208 inch Deflection amplification factor, Cd = 5.5 Importance factor, I = 1.0 Amplified story drift = Δ5 = Cd Δ5e/I = 5.5(0.208)/1.0 = 1.14 inches Amplified drift ratio = Δ5/h5 = (1.14/156) = 0.00733 = 0.733% < 2.0% OK
Figure 7-4 Deflected shape for Berkeley building (1.0 ft = 0.3048 m, 1.0 in = 25.4 mm)
E-W N-S E-W N-S
0
20
40
60
80
100
120
140
160
0 5 10
Height, h(ft)
Total deflection, Ξ (inches)
elastic amplified (Cd = 5.5)
Chapter 7: Reinforced Concrete
7 – 25
Figure 7-5 Drift profile for Berkeley building (1.0 ft = 0.3048 m)
N-S E-W allowable
0
20
40
60
80
100
120
140
160
0 0.5 1 1.5 2
Height, h(ft)
Design story drift, ≅ (inches)
FEMA P-751, NEHRP Recommended Provisions: Design Examples
7 – 26
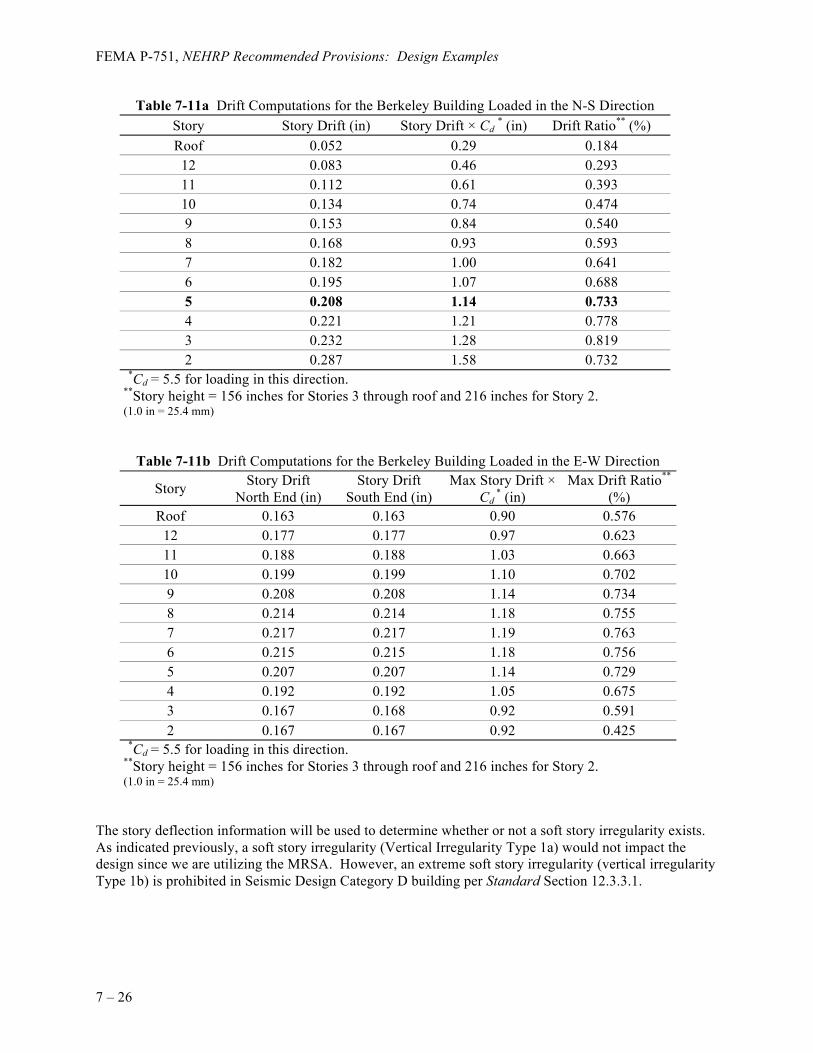
Table 7-11a Drift Computations for the Berkeley Building Loaded in the N-S Direction Story Story Drift (in) Story Drift × Cd * (in) Drift Ratio** (%) Roof 0.052 0.29 0.184
12 0.083 0.46 0.293 11 0.112 0.61 0.393 10 0.134 0.74 0.474 9 0.153 0.84 0.540 8 0.168 0.93 0.593 7 0.182 1.00 0.641 6 0.195 1.07 0.688 5 0.208 1.14 0.733 4 0.221 1.21 0.778 3 0.232 1.28 0.819 2 0.287 1.58 0.732
*Cd = 5.5 for loading in this direction. **Story height = 156 inches for Stories 3 through roof and 216 inches for Story 2. (1.0 in = 25.4 mm)
Table 7-11b Drift Computations for the Berkeley Building Loaded in the E-W Direction
Story Story Drift North End (in)
Story Drift South End (in)
Max Story Drift × Cd
* (in) Max Drift Ratio**
(%) Roof 0.163 0.163 0.90 0.576
12 0.177 0.177 0.97 0.623 11 0.188 0.188 1.03 0.663 10 0.199 0.199 1.10 0.702 9 0.208 0.208 1.14 0.734 8 0.214 0.214 1.18 0.755 7 0.217 0.217 1.19 0.763 6 0.215 0.215 1.18 0.756 5 0.207 0.207 1.14 0.729 4 0.192 0.192 1.05 0.675 3 0.167 0.168 0.92 0.591 2 0.167 0.167 0.92 0.425
*Cd = 5.5 for loading in this direction. **Story height = 156 inches for Stories 3 through roof and 216 inches for Story 2. (1.0 in = 25.4 mm)
The story deflection information will be used to determine whether or not a soft story irregularity exists. As indicated previously, a soft story irregularity (Vertical Irregularity Type 1a) would not impact the design since we are utilizing the MRSA. However, an extreme soft story irregularity (vertical irregularity Type 1b) is prohibited in Seismic Design Category D building per Standard Section 12.3.3.1.
Chapter 7: Reinforced Concrete
7 – 27
However, Standard Section 12.3.2.2 lists an exception:
Structural irregularities of Types 1a, 1b, or 2 in Table 12.3-2 do not apply where no story drift ratio under design lateral load is less than or equal to 130 percent of the story drift ratio of the next story above…. The story drift ratios of the top two stories of the structure are not required to be evaluated.
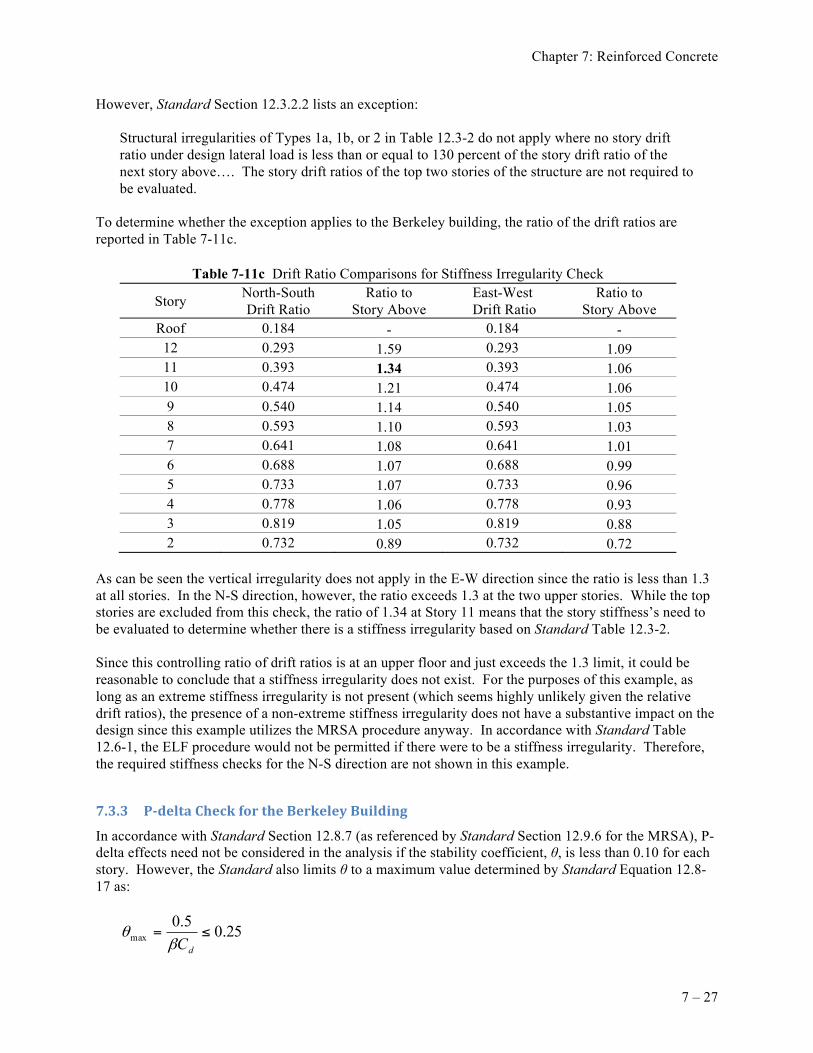
To determine whether the exception applies to the Berkeley building, the ratio of the drift ratios are reported in Table 7-11c.
Table 7-11c Drift Ratio Comparisons for Stiffness Irregularity Check
Story North-South Drift Ratio
Ratio to Story Above
East-West Drift Ratio
Ratio to Story Above
Roof 0.184 - 0.184 - 12 0.293 1.59 0.293 1.09 11 0.393 1.34 0.393 1.06 10 0.474 1.21 0.474 1.06 9 0.540 1.14 0.540 1.05 8 0.593 1.10 0.593 1.03 7 0.641 1.08 0.641 1.01 6 0.688 1.07 0.688 0.99 5 0.733 1.07 0.733 0.96 4 0.778 1.06 0.778 0.93 3 0.819 1.05 0.819 0.88 2 0.732 0.89 0.732 0.72
As can be seen the vertical irregularity does not apply in the E-W direction since the ratio is less than 1.3 at all stories. In the N-S direction, however, the ratio exceeds 1.3 at the two upper stories. While the top stories are excluded from this check, the ratio of 1.34 at Story 11 means that the story stiffness’s need to be evaluated to determine whether there is a stiffness irregularity based on Standard Table 12.3-2. Since this controlling ratio of drift ratios is at an upper floor and just exceeds the 1.3 limit, it could be reasonable to conclude that a stiffness irregularity does not exist. For the purposes of this example, as long as an extreme stiffness irregularity is not present (which seems highly unlikely given the relative drift ratios), the presence of a non-extreme stiffness irregularity does not have a substantive impact on the design since this example utilizes the MRSA procedure anyway. In accordance with Standard Table 12.6-1, the ELF procedure would not be permitted if there were to be a stiffness irregularity. Therefore, the required stiffness checks for the N-S direction are not shown in this example.
In accordance with Standard Section 12.8.7 (as referenced by Standard Section 12.9.6 for the MRSA), P-delta effects need not be considered in the analysis if the stability coefficient, θ, is less than 0.10 for each story. However, the Standard also limits θ to a maximum value determined by Standard Equation 12.8-17 as:
25.05.0max ≤=
dCβθ
FEMA P-751, NEHRP Recommended Provisions: Design Examples
7 – 28
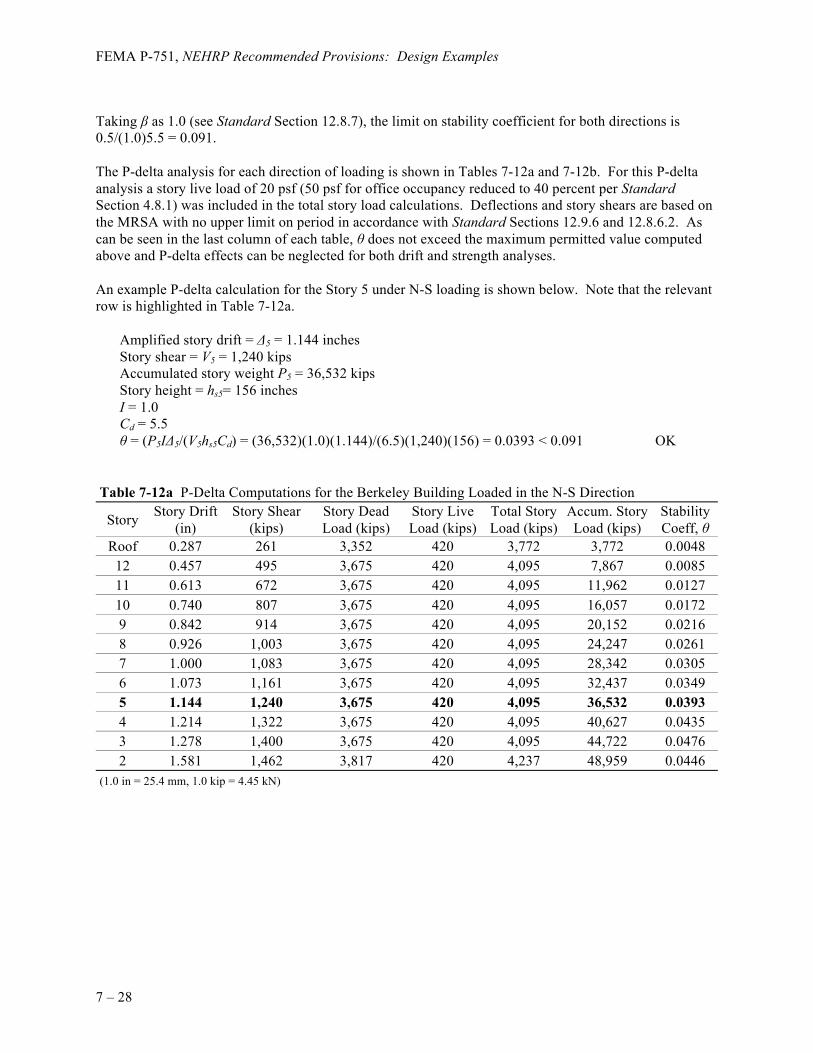
Taking β as 1.0 (see Standard Section 12.8.7), the limit on stability coefficient for both directions is 0.5/(1.0)5.5 = 0.091. The P-delta analysis for each direction of loading is shown in Tables 7-12a and 7-12b. For this P-delta analysis a story live load of 20 psf (50 psf for office occupancy reduced to 40 percent per Standard Section 4.8.1) was included in the total story load calculations. Deflections and story shears are based on the MRSA with no upper limit on period in accordance with Standard Sections 12.9.6 and 12.8.6.2. As can be seen in the last column of each table, θ does not exceed the maximum permitted value computed above and P-delta effects can be neglected for both drift and strength analyses. An example P-delta calculation for the Story 5 under N-S loading is shown below. Note that the relevant row is highlighted in Table 7-12a.
Amplified story drift = Δ5 = 1.144 inches Story shear = V5 = 1,240 kips Accumulated story weight P5 = 36,532 kips Story height = hs5= 156 inches I = 1.0 Cd = 5.5 θ = (P5IΔ5/(V5hs5Cd) = (36,532)(1.0)(1.144)/(6.5)(1,240)(156) = 0.0393 < 0.091 OK
Table 7-12a P-Delta Computations for the Berkeley Building Loaded in the N-S Direction
Story Story Drift (in)
Story Shear (kips)
Story Dead Load (kips)
Story Live Load (kips)
Total Story Load (kips)
Accum. Story Load (kips)
Stability Coeff, θ
Roof 0.287 261 3,352 420 3,772 3,772 0.0048 12 0.457 495 3,675 420 4,095 7,867 0.0085 11 0.613 672 3,675 420 4,095 11,962 0.0127 10 0.740 807 3,675 420 4,095 16,057 0.0172 9 0.842 914 3,675 420 4,095 20,152 0.0216 8 0.926 1,003 3,675 420 4,095 24,247 0.0261 7 1.000 1,083 3,675 420 4,095 28,342 0.0305 6 1.073 1,161 3,675 420 4,095 32,437 0.0349 5 1.144 1,240 3,675 420 4,095 36,532 0.0393 4 1.214 1,322 3,675 420 4,095 40,627 0.0435 3 1.278 1,400 3,675 420 4,095 44,722 0.0476 2 1.581 1,462 3,817 420 4,237 48,959 0.0446
(1.0 in = 25.4 mm, 1.0 kip = 4.45 kN)
Chapter 7: Reinforced Concrete
7 – 29
Table 7-12b P-Delta Computations for the Berkeley Building Loaded in the E-W Direction
Story Story Drift (in)
Story Shear (kips)
Story Dead Load (kips)
Story Live Load (kips)
Total Story Load (kips)
Accum. Story Load (kips)
Stability Coeff, θ
Roof 0.899 463 3,352 420 3,772 3,772 0.0085 12 0.972 843 3,675 420 4,095 7,867 0.0106 11 1.035 1,104 3,675 420 4,095 11,962 0.0131 10 1.096 1,275 3,675 420 4,095 16,057 0.0161 9 1.145 1,396 3,675 420 4,095 20,152 0.0193 8 1.177 1,512 3,675 420 4,095 24,247 0.0220 7 1.191 1,645 3,675 420 4,095 28,342 0.0239 6 1.180 1,787 3,675 420 4,095 32,437 0.0250 5 1.137 1,927 3,675 420 4,095 36,532 0.0251 4 1.054 2,073 3,675 420 4,095 40,627 0.0241 3 0.921 2,215 3,675 420 4,095 44,722 0.0217 2 0.918 2,296 3,817 420 4,237 48,959 0.0165
(1.0 in = 25.4 mm, 1.0 kip = 4.45 kN)
A test for torsional irregularity for the Honolulu building can be performed in a manner similar to that for the Berkeley building. Based on computations not shown here, the Honolulu building is not torsionally irregular. This is the case because the walls, which draw the torsional resistance towards the center of the Berkeley building, do not exist in the Honolulu building. Therefore, the torsional amplification factor, Ax = 1.0 for all levels and the accidental torsion moments used for the analysis do not need to be revised.
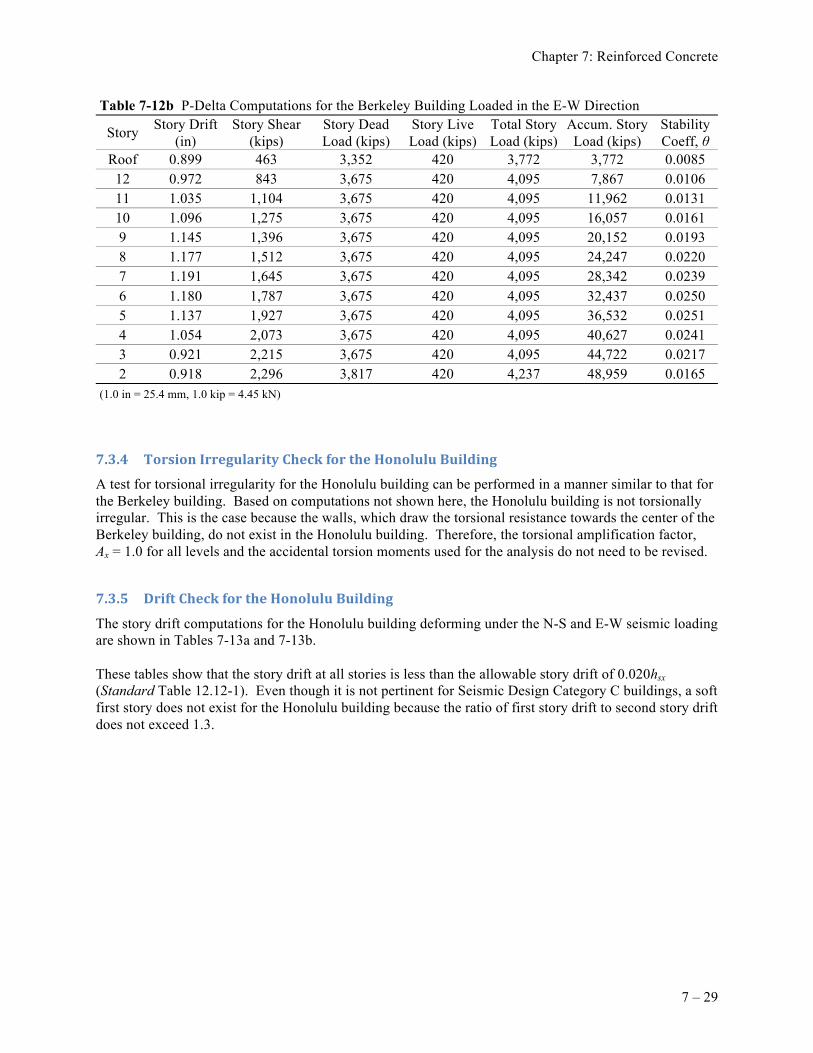
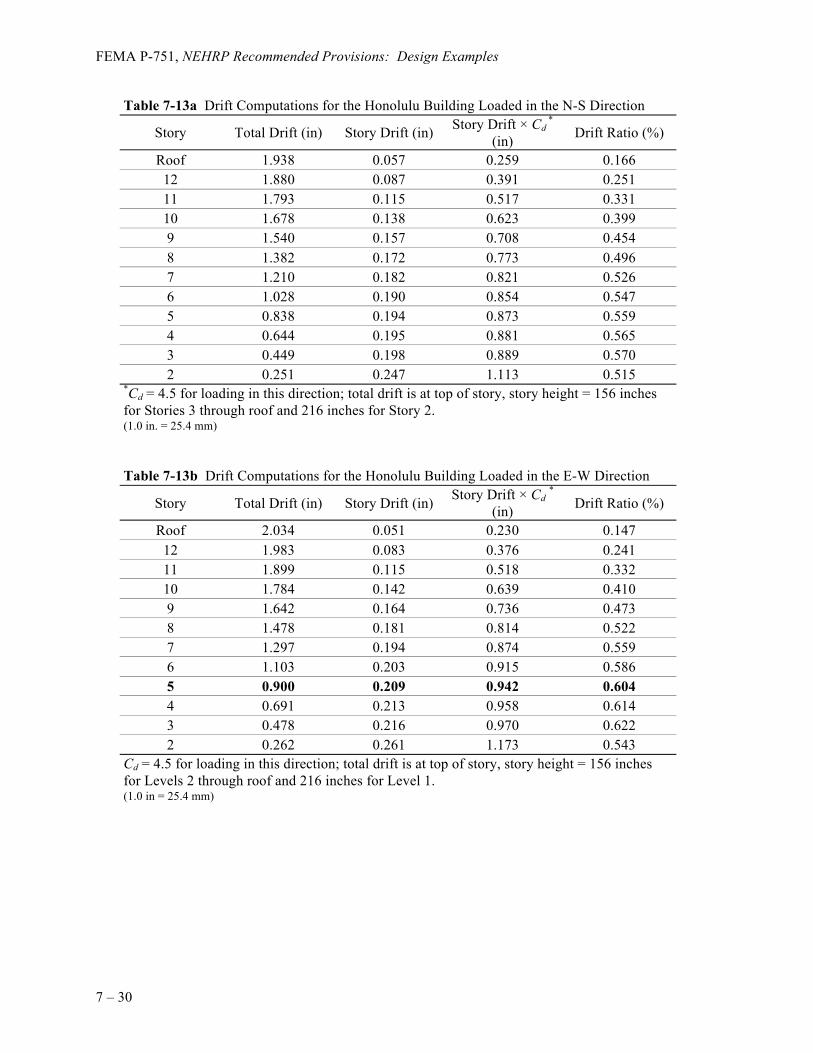
The story drift computations for the Honolulu building deforming under the N-S and E-W seismic loading are shown in Tables 7-13a and 7-13b. These tables show that the story drift at all stories is less than the allowable story drift of 0.020hsx (Standard Table 12.12-1). Even though it is not pertinent for Seismic Design Category C buildings, a soft first story does not exist for the Honolulu building because the ratio of first story drift to second story drift does not exceed 1.3.
FEMA P-751, NEHRP Recommended Provisions: Design Examples
7 – 30
Table 7-13a Drift Computations for the Honolulu Building Loaded in the N-S Direction
Story Total Drift (in) Story Drift (in) Story Drift × Cd *
(in) Drift Ratio (%)
Roof 1.938 0.057 0.259 0.166 12 1.880 0.087 0.391 0.251 11 1.793 0.115 0.517 0.331 10 1.678 0.138 0.623 0.399 9 1.540 0.157 0.708 0.454 8 1.382 0.172 0.773 0.496 7 1.210 0.182 0.821 0.526 6 1.028 0.190 0.854 0.547 5 0.838 0.194 0.873 0.559 4 0.644 0.195 0.881 0.565 3 0.449 0.198 0.889 0.570 2 0.251 0.247 1.113 0.515
*Cd = 4.5 for loading in this direction; total drift is at top of story, story height = 156 inches for Stories 3 through roof and 216 inches for Story 2. (1.0 in. = 25.4 mm)
Table 7-13b Drift Computations for the Honolulu Building Loaded in the E-W Direction
Story Total Drift (in) Story Drift (in) Story Drift × Cd * (in) Drift Ratio (%)
Roof 2.034 0.051 0.230 0.147 12 1.983 0.083 0.376 0.241 11 1.899 0.115 0.518 0.332 10 1.784 0.142 0.639 0.410 9 1.642 0.164 0.736 0.473 8 1.478 0.181 0.814 0.522 7 1.297 0.194 0.874 0.559 6 1.103 0.203 0.915 0.586 5 0.900 0.209 0.942 0.604 4 0.691 0.213 0.958 0.614 3 0.478 0.216 0.970 0.622 2 0.262 0.261 1.173 0.543
Cd = 4.5 for loading in this direction; total drift is at top of story, story height = 156 inches for Levels 2 through roof and 216 inches for Level 1. (1.0 in = 25.4 mm)
Chapter 7: Reinforced Concrete
7 – 31
A sample calculation for Story 5 of Table 7-13b (highlighted in the table) is as follows:
Deflection at top of story = δ5e =0.900 inches Deflection at bottom of story = δ4e = 0.691 inch Story drift = Δ5e = δ5e - δ4e = 0.900 - 0.0691 = 0.209 inch Deflection amplification factor, Cd = 4.5 Importance factor, I = 1.0 Amplified story drift = Δ5 = Cd Δ5e/I = 4.5(0.209)/1.0 = 0.942 inch Amplified drift ratio = Δ5 / h5 = (0.942/156) = 0.00604 = 0.604% < 2.0% OK
Therefore, story drift satisfies the drift requirements.
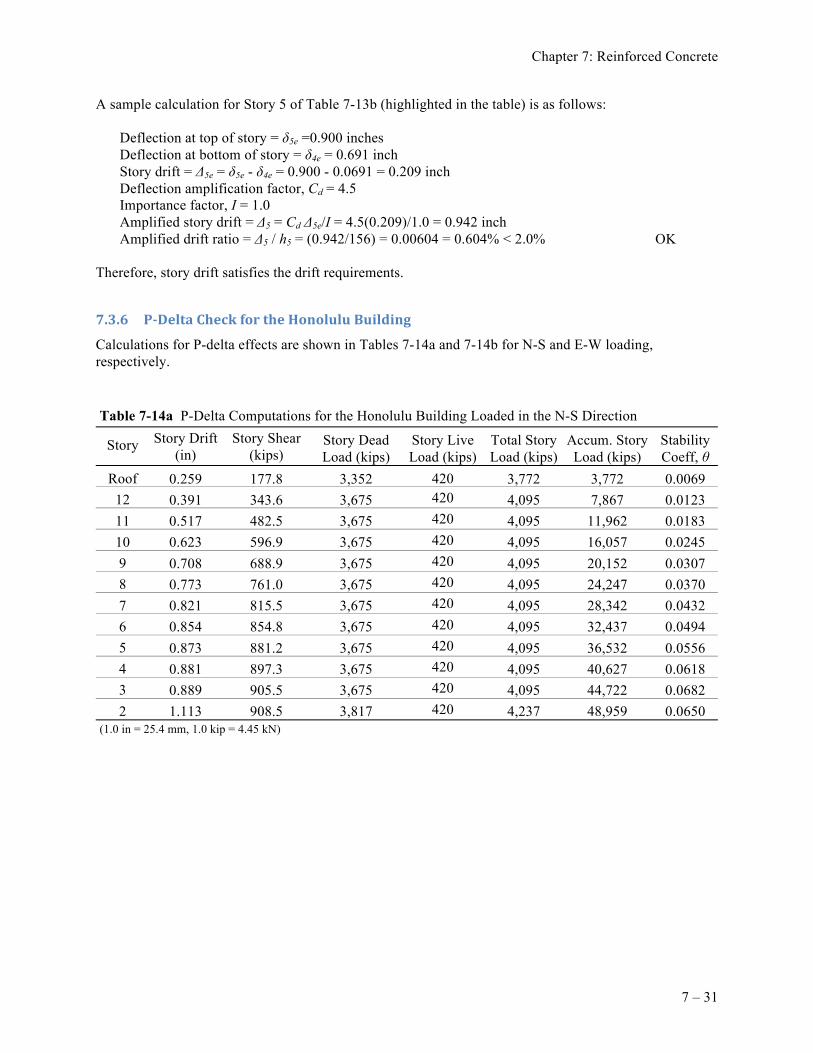
Calculations for P-delta effects are shown in Tables 7-14a and 7-14b for N-S and E-W loading, respectively. Table 7-14a P-Delta Computations for the Honolulu Building Loaded in the N-S Direction
Story Story Drift (in)
Story Shear (kips)
Story Dead Load (kips)
Story Live Load (kips)
Total Story Load (kips)
Accum. Story Load (kips)
Stability Coeff, θ
Roof 0.259 177.8 3,352 420 3,772 3,772 0.0069 12 0.391 343.6 3,675 420 4,095 7,867 0.0123 11 0.517 482.5 3,675 420 4,095 11,962 0.0183 10 0.623 596.9 3,675 420 4,095 16,057 0.0245 9 0.708 688.9 3,675 420 4,095 20,152 0.0307 8 0.773 761.0 3,675 420 4,095 24,247 0.0370 7 0.821 815.5 3,675 420 4,095 28,342 0.0432 6 0.854 854.8 3,675 420 4,095 32,437 0.0494 5 0.873 881.2 3,675 420 4,095 36,532 0.0556 4 0.881 897.3 3,675 420 4,095 40,627 0.0618 3 0.889 905.5 3,675 420 4,095 44,722 0.0682 2 1.113 908.5 3,817 420 4,237 48,959 0.0650
(1.0 in = 25.4 mm, 1.0 kip = 4.45 kN)
FEMA P-751, NEHRP Recommended Provisions: Design Examples
7 – 32
Table 7-14b P-Delta Computations for the Honolulu Building Loaded in the E-W Direction
Story Story Drift (in)
Story Shear (kips)
Story Dead Load (kips)
Story Live Load (kips)
Total Story Load (kips)
Accum. Story Load (kips)
Stability Coeff, θ
Roof 0.230 177.8 3,352 420 3,772 3,772 0.0079 12 0.376 343.6 3,675 420 4,095 7,867 0.0128 11 0.518 482.5 3,675 420 4,095 11,962 0.0183 10 0.639 596.9 3,675 420 4,095 16,057 0.0239 9 0.736 688.9 3,675 420 4,095 20,152 0.0296 8 0.814 761.0 3,675 420 4,095 24,247 0.0351 7 0.874 815.5 3,675 420 4,095 28,342 0.0407 6 0.915 854.8 3,675 420 4,095 32,437 0.0462 5 0.942 881.2 3,675 420 4,095 36,532 0.0515 4 0.958 897.3 3,675 420 4,095 40,627 0.0568 3 0.970 905.5 3,675 420 4,095 44,722 0.0626 2 1.173 908.5 3,817 420 4,237 48,959 0.0617
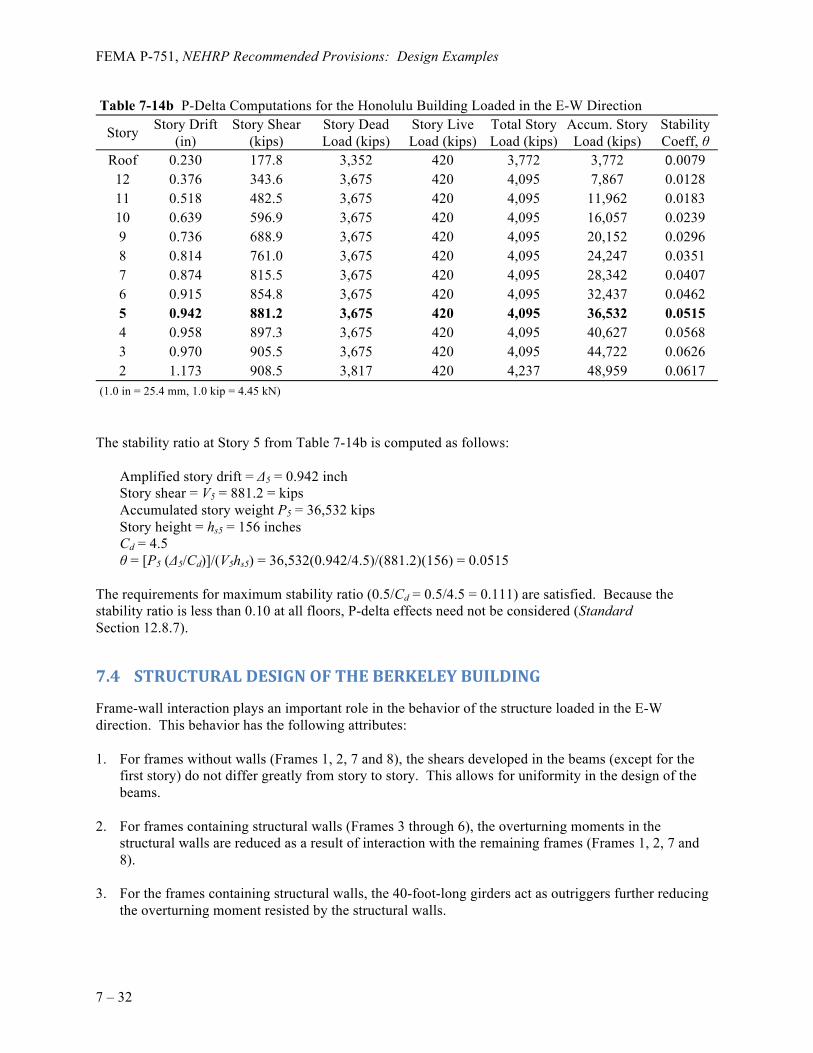
(1.0 in = 25.4 mm, 1.0 kip = 4.45 kN) The stability ratio at Story 5 from Table 7-14b is computed as follows:
Amplified story drift = Δ5 = 0.942 inch Story shear = V5 = 881.2 = kips Accumulated story weight P5 = 36,532 kips Story height = hs5 = 156 inches Cd = 4.5 θ = [P5 (Δ5/Cd)]/(V5hs5) = 36,532(0.942/4.5)/(881.2)(156) = 0.0515
The requirements for maximum stability ratio (0.5/Cd = 0.5/4.5 = 0.111) are satisfied. Because the stability ratio is less than 0.10 at all floors, P-delta effects need not be considered (Standard Section 12.8.7).
Frame-wall interaction plays an important role in the behavior of the structure loaded in the E-W direction. This behavior has the following attributes: 1. For frames without walls (Frames 1, 2, 7 and 8), the shears developed in the beams (except for the
first story) do not differ greatly from story to story. This allows for uniformity in the design of the beams.
2. For frames containing structural walls (Frames 3 through 6), the overturning moments in the
structural walls are reduced as a result of interaction with the remaining frames (Frames 1, 2, 7 and 8).
3. For the frames containing structural walls, the 40-foot-long girders act as outriggers further reducing
the overturning moment resisted by the structural walls.
Chapter 7: Reinforced Concrete
7 – 33
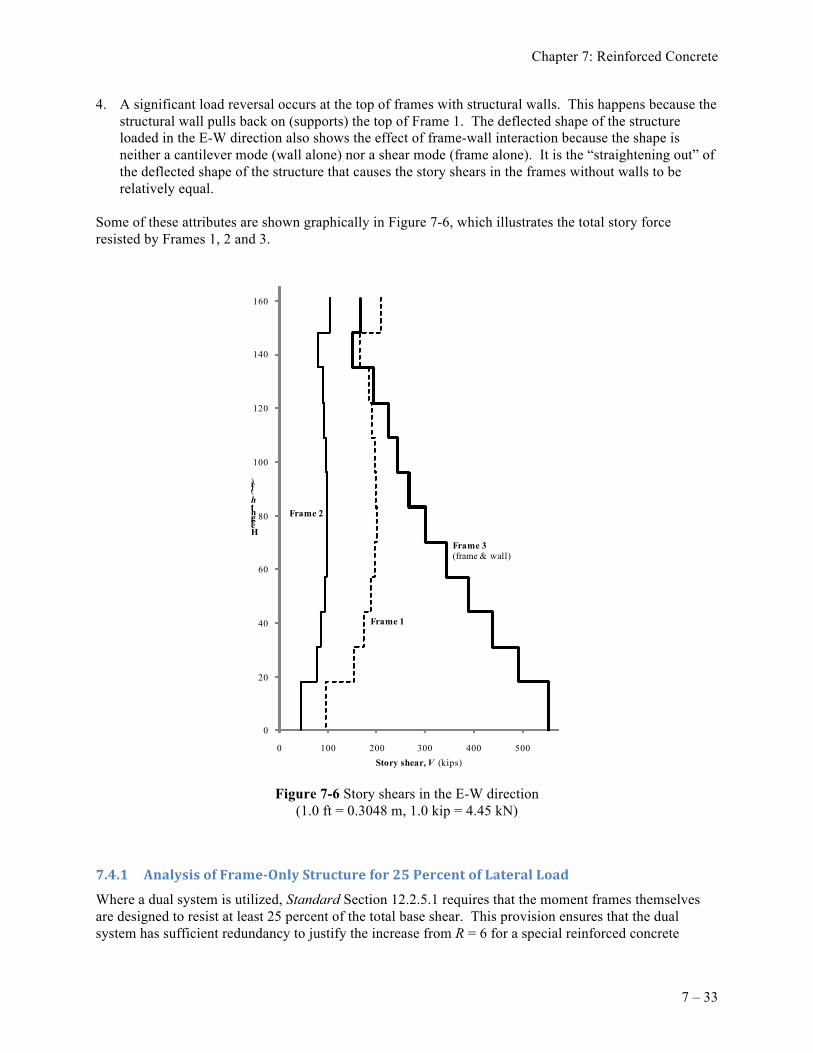
4. A significant load reversal occurs at the top of frames with structural walls. This happens because the structural wall pulls back on (supports) the top of Frame 1. The deflected shape of the structure loaded in the E-W direction also shows the effect of frame-wall interaction because the shape is neither a cantilever mode (wall alone) nor a shear mode (frame alone). It is the “straightening out” of the deflected shape of the structure that causes the story shears in the frames without walls to be relatively equal.
Some of these attributes are shown graphically in Figure 7-6, which illustrates the total story force resisted by Frames 1, 2 and 3.
Figure 7-6 Story shears in the E-W direction (1.0 ft = 0.3048 m, 1.0 kip = 4.45 kN)
Where a dual system is utilized, Standard Section 12.2.5.1 requires that the moment frames themselves are designed to resist at least 25 percent of the total base shear. This provision ensures that the dual system has sufficient redundancy to justify the increase from R = 6 for a special reinforced concrete
Frame 1
Frame 2
0
20
40
60
80
100
120
140
160
0 100 200 300 400 500
Height, h(ft)
Story shear, V (kips)
Frame 3(frame & wall)
FEMA P-751, NEHRP Recommended Provisions: Design Examples
7 – 34
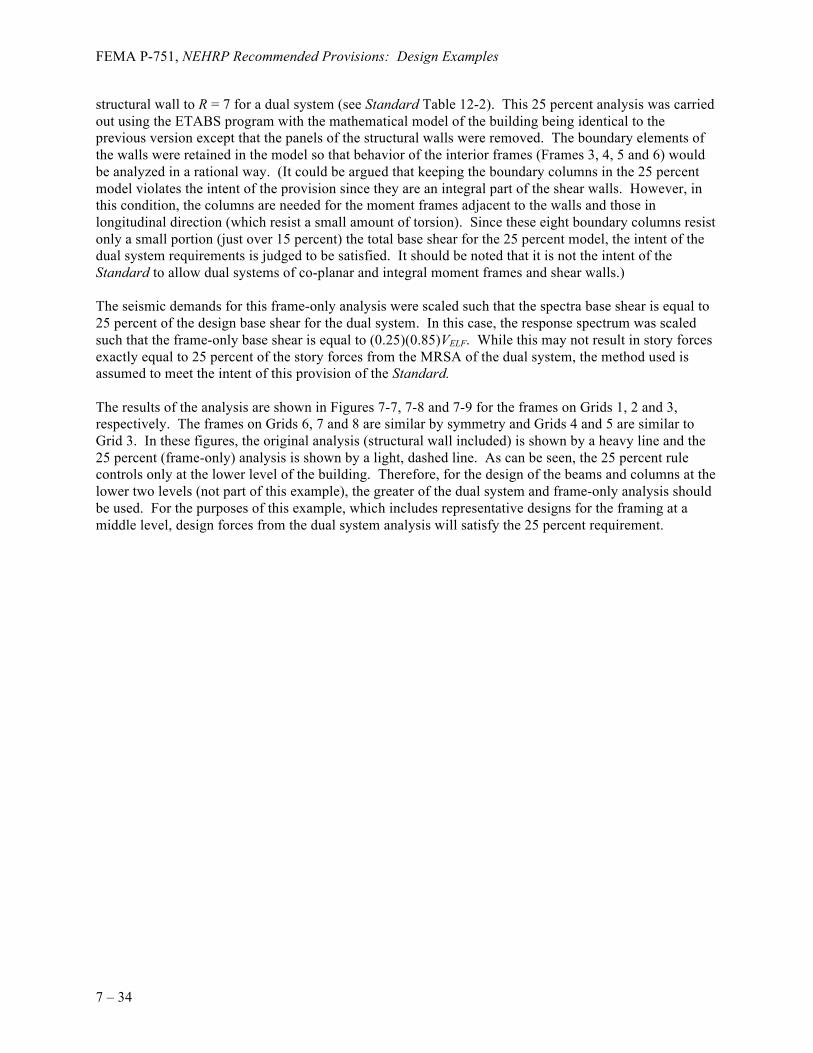
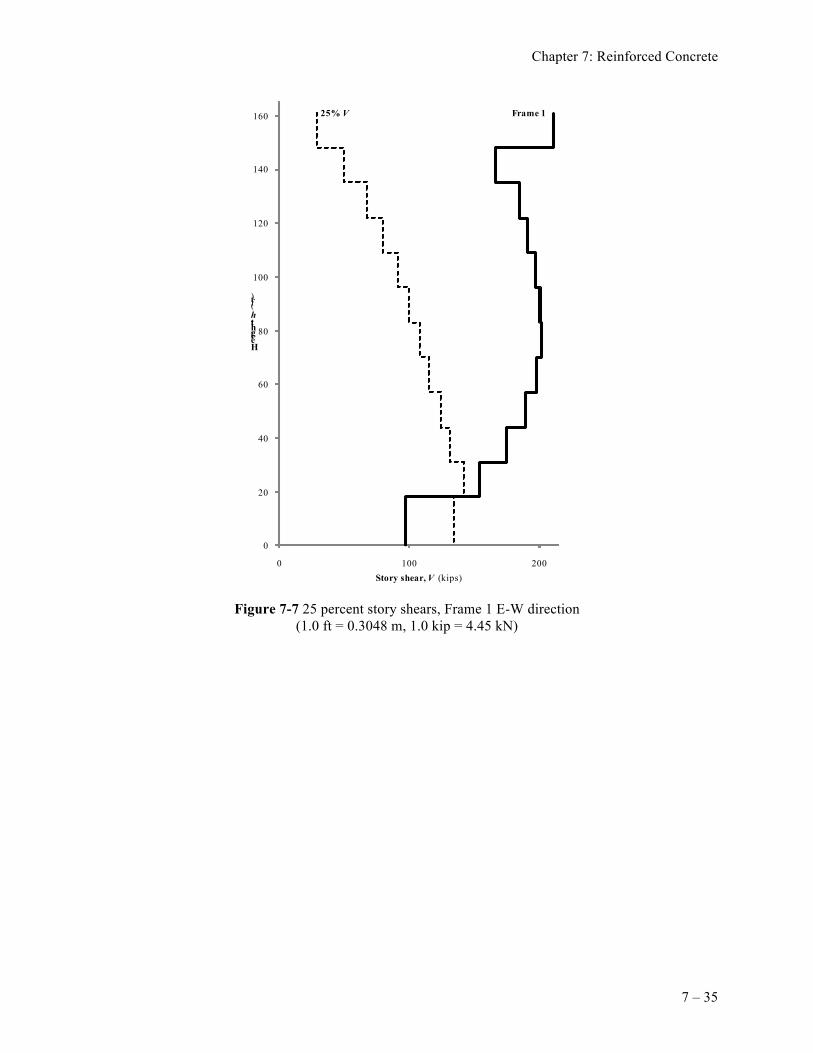
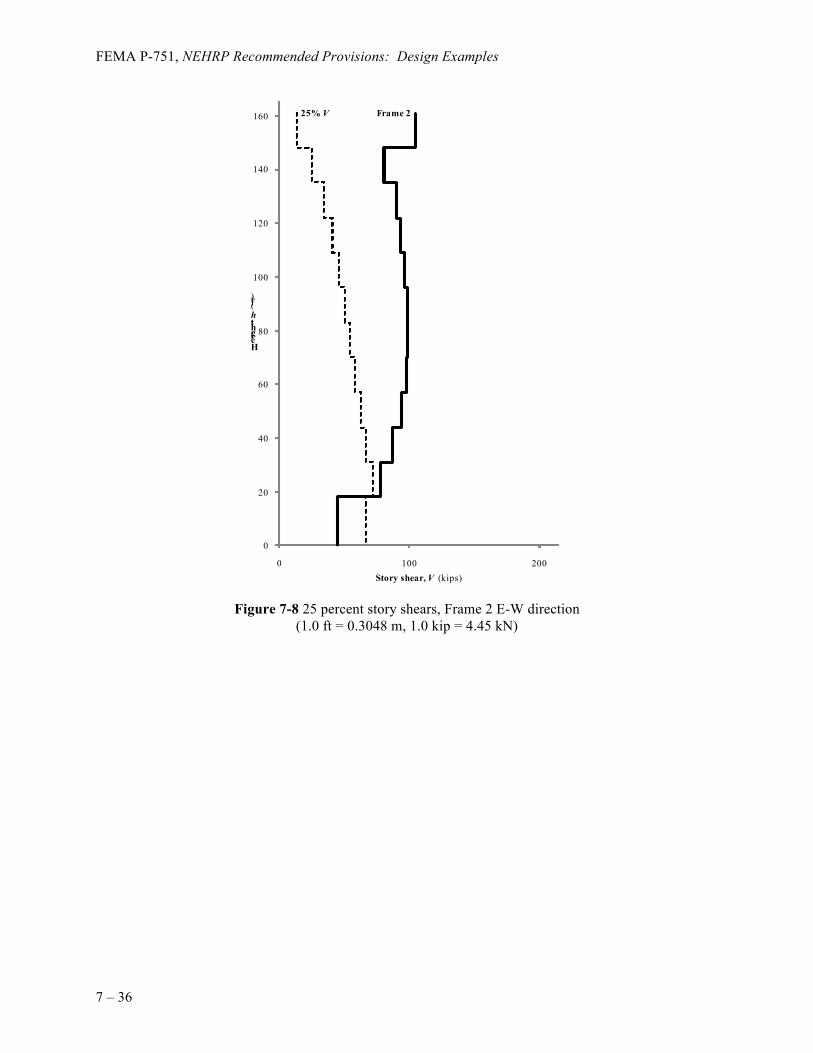
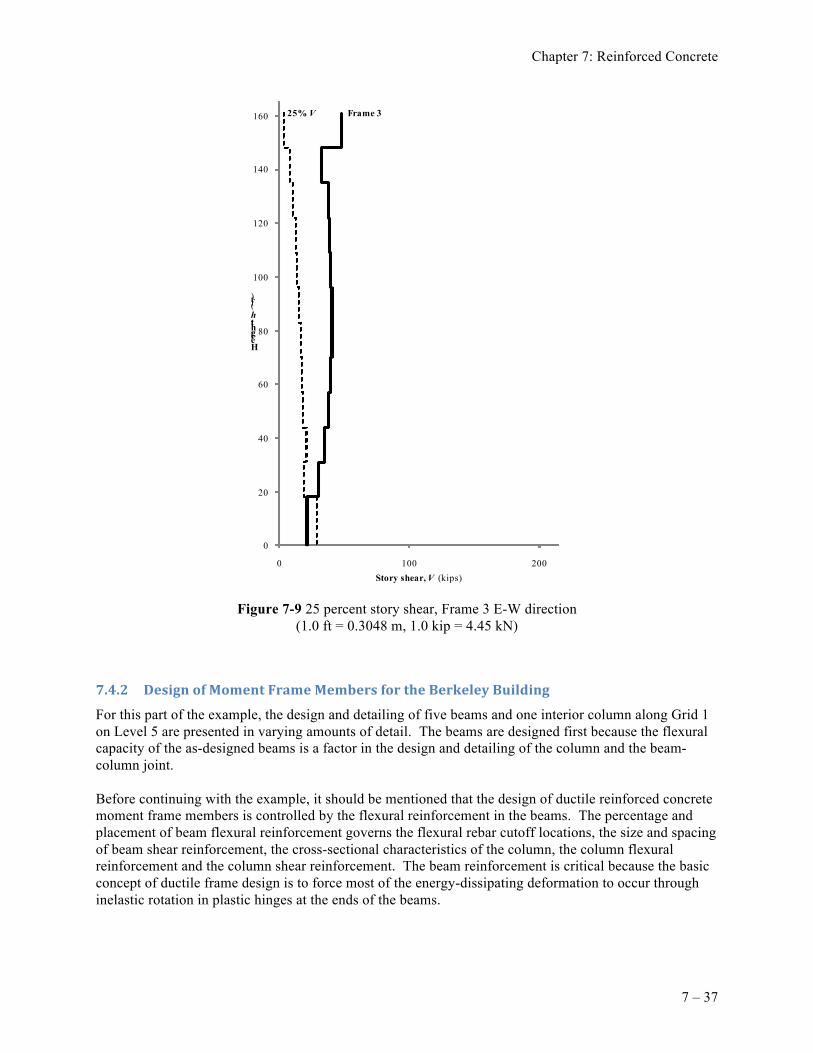
structural wall to R = 7 for a dual system (see Standard Table 12-2). This 25 percent analysis was carried out using the ETABS program with the mathematical model of the building being identical to the previous version except that the panels of the structural walls were removed. The boundary elements of the walls were retained in the model so that behavior of the interior frames (Frames 3, 4, 5 and 6) would be analyzed in a rational way. (It could be argued that keeping the boundary columns in the 25 percent model violates the intent of the provision since they are an integral part of the shear walls. However, in this condition, the columns are needed for the moment frames adjacent to the walls and those in longitudinal direction (which resist a small amount of torsion). Since these eight boundary columns resist only a small portion (just over 15 percent) the total base shear for the 25 percent model, the intent of the dual system requirements is judged to be satisfied. It should be noted that it is not the intent of the Standard to allow dual systems of co-planar and integral moment frames and shear walls.) The seismic demands for this frame-only analysis were scaled such that the spectra base shear is equal to 25 percent of the design base shear for the dual system. In this case, the response spectrum was scaled such that the frame-only base shear is equal to (0.25)(0.85)VELF. While this may not result in story forces exactly equal to 25 percent of the story forces from the MRSA of the dual system, the method used is assumed to meet the intent of this provision of the Standard. The results of the analysis are shown in Figures 7-7, 7-8 and 7-9 for the frames on Grids 1, 2 and 3, respectively. The frames on Grids 6, 7 and 8 are similar by symmetry and Grids 4 and 5 are similar to Grid 3. In these figures, the original analysis (structural wall included) is shown by a heavy line and the 25 percent (frame-only) analysis is shown by a light, dashed line. As can be seen, the 25 percent rule controls only at the lower level of the building. Therefore, for the design of the beams and columns at the lower two levels (not part of this example), the greater of the dual system and frame-only analysis should be used. For the purposes of this example, which includes representative designs for the framing at a middle level, design forces from the dual system analysis will satisfy the 25 percent requirement.
Chapter 7: Reinforced Concrete
7 – 35
Figure 7-7 25 percent story shears, Frame 1 E-W direction (1.0 ft = 0.3048 m, 1.0 kip = 4.45 kN)
Frame 125% V
0
20
40
60
80
100
120
140
160
0 100 200
Height, h(ft)
Story shear, V (kips)
FEMA P-751, NEHRP Recommended Provisions: Design Examples
7 – 36
Figure 7-8 25 percent story shears, Frame 2 E-W direction (1.0 ft = 0.3048 m, 1.0 kip = 4.45 kN)
Frame 225% V
0
20
40
60
80
100
120
140
160
0 100 200
Height, h(ft)
Story shear, V (kips)
Chapter 7: Reinforced Concrete
7 – 37
Figure 7-9 25 percent story shear, Frame 3 E-W direction (1.0 ft = 0.3048 m, 1.0 kip = 4.45 kN)
For this part of the example, the design and detailing of five beams and one interior column along Grid 1 on Level 5 are presented in varying amounts of detail. The beams are designed first because the flexural capacity of the as-designed beams is a factor in the design and detailing of the column and the beam-column joint. Before continuing with the example, it should be mentioned that the design of ductile reinforced concrete moment frame members is controlled by the flexural reinforcement in the beams. The percentage and placement of beam flexural reinforcement governs the flexural rebar cutoff locations, the size and spacing of beam shear reinforcement, the cross-sectional characteristics of the column, the column flexural reinforcement and the column shear reinforcement. The beam reinforcement is critical because the basic concept of ductile frame design is to force most of the energy-dissipating deformation to occur through inelastic rotation in plastic hinges at the ends of the beams.
Frame 325% V
0
20
40
60
80
100
120
140
160
0 100 200
Height, h(ft)
Story shear, V (kips)
FEMA P-751, NEHRP Recommended Provisions: Design Examples
7 – 38
In carrying out the design calculations, three different flexural strengths are used for the beams. These capacities are based on the following:
Design strength: φ = 0.9, tensile stress in reinforcement at 1.00 fy Nominal strength: φ = 1.0, tensile stress in reinforcement at 1.00 fy
Probable strength: φ = 1.0, tensile stress in reinforcement at 1.25 fy
Various aspects of the design of the beams and other members depend on the above capacities are as follows:
Beam rebar cutoffs: Design strength
Beam shear reinforcement: Probable strength of beam
Beam-column joint strength: Probable strength of beam
Column flexural strength: 6/5 × nominal strength of beam
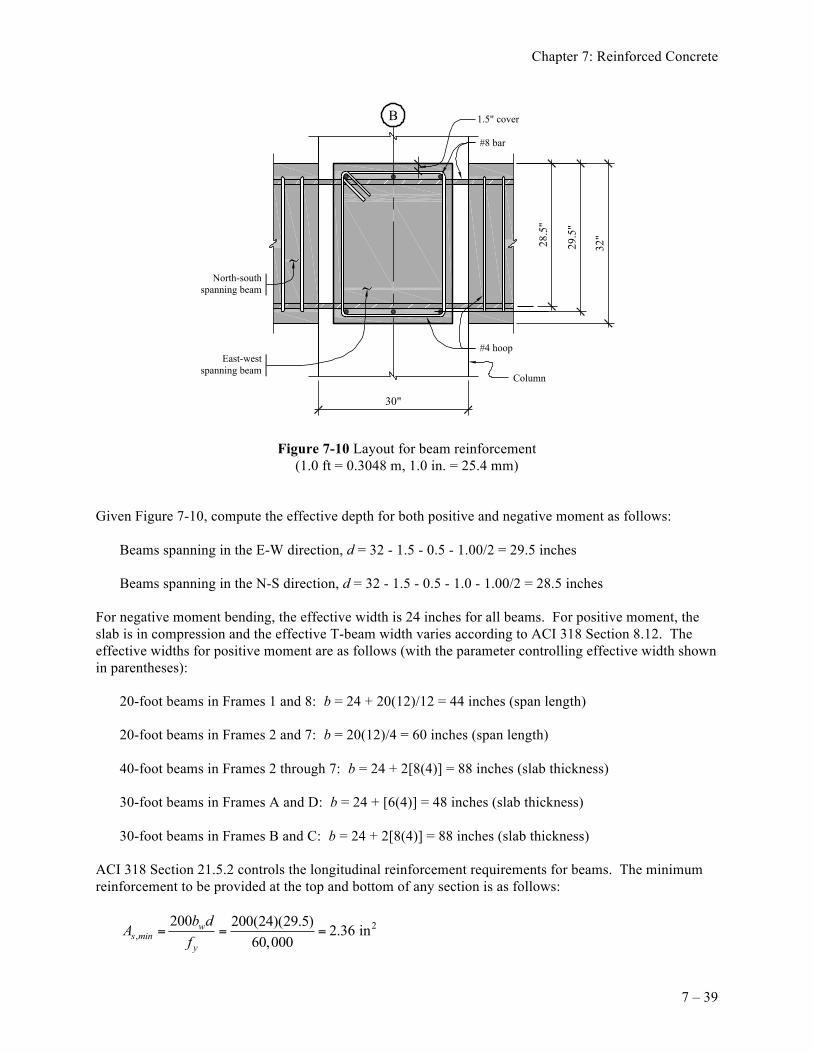
Column shear strength: Probable strength of column or beam In addition, beams in ductile frames will always have top and bottom longitudinal reinforcement throughout their length. In computing flexural capacities, only the tension steel will be considered. This is a valid design assumption because reinforcement ratios are quite low, yielding a depth to the neutral axis similar to the depth of the compression reinforcement. Finally, a sign convention for bending moments is required in flexural design. In this example, where the steel at the top of a beam section is in tension, the moment is designated as a negative moment. Where the steel at the bottom is in tension, the moment is designated as a positive moment. All moment diagrams are drawn using the reinforced concrete or tension-side convention. For beams, this means negative moments are plotted on the top and positive moments are plotted on the bottom. For columns, moments are drawn on the tension side of the member. 7.4.2.1 Preliminary Calculations. Before the quantity and placement of reinforcement is determined, it is useful to establish, in an overall sense, how the reinforcement will be distributed. The preliminary design established that the moment frame beams would be 24 inches wide by 32 inches deep and the columns would be 30 inches by 30 inches. Note that the beam widths were selected to consider the beam-column joints “confined” per ACI 318 Section 21.7.4.1, which requires beam widths of at least 75 percent of the column width. In order to determine the effective depth used for the design of the beams, it is necessary to estimate the size and placement of the reinforcement that will be used. In establishing this depth, it is assumed that #8 bars will be used for longitudinal reinforcement and that hoops and stirrups will be constructed from #4 bars. In all cases, clear cover of 1.5 inches is assumed. Since this structure has beams spanning in two orthogonal directions, it is necessary to layer the flexural reinforcement as shown in Figure 7-10. The reinforcement for the E-W spanning beams was placed in the upper and lower layers because the strength demand for these members is somewhat greater than that for the N-S beams.
Chapter 7: Reinforced Concrete
7 – 39
Figure 7-10 Layout for beam reinforcement (1.0 ft = 0.3048 m, 1.0 in. = 25.4 mm)
Given Figure 7-10, compute the effective depth for both positive and negative moment as follows:
Beams spanning in the E-W direction, d = 32 - 1.5 - 0.5 - 1.00/2 = 29.5 inches Beams spanning in the N-S direction, d = 32 - 1.5 - 0.5 - 1.0 - 1.00/2 = 28.5 inches
For negative moment bending, the effective width is 24 inches for all beams. For positive moment, the slab is in compression and the effective T-beam width varies according to ACI 318 Section 8.12. The effective widths for positive moment are as follows (with the parameter controlling effective width shown in parentheses):
20-foot beams in Frames 1 and 8: b = 24 + 20(12)/12 = 44 inches (span length) 20-foot beams in Frames 2 and 7: b = 20(12)/4 = 60 inches (span length) 40-foot beams in Frames 2 through 7: b = 24 + 2[8(4)] = 88 inches (slab thickness) 30-foot beams in Frames A and D: b = 24 + [6(4)] = 48 inches (slab thickness) 30-foot beams in Frames B and C: b = 24 + 2[8(4)] = 88 inches (slab thickness)
ACI 318 Section 21.5.2 controls the longitudinal reinforcement requirements for beams. The minimum reinforcement to be provided at the top and bottom of any section is as follows:
2,
200 200(24)(29.5) 2.36 in60,000
ws min
y
b dAf
= = =
30"
1.5" cover
#8 bar
#4 hoopEast-west
spanning beam
32"
29.5
"
28.5
"
North-southspanning beam
B
Column
FEMA P-751, NEHRP Recommended Provisions: Design Examples
7 – 40
This amount of reinforcement can be supplied by three #8 bars with As = 2.37 in2. Since the three #8 bars will be provided continuously top and bottom, reinforcement required for strength will include these #8 bars. Before getting too far into member design, it is useful to check the required tension development length for hooked bars since the required length may control the dimensions of the exterior columns and the boundary elements of the structural walls. From Equation 21-6 of ACI 318 Section 21.7.5.1, the required development length is as follows:
65y b
dhc
f dl
f=
′
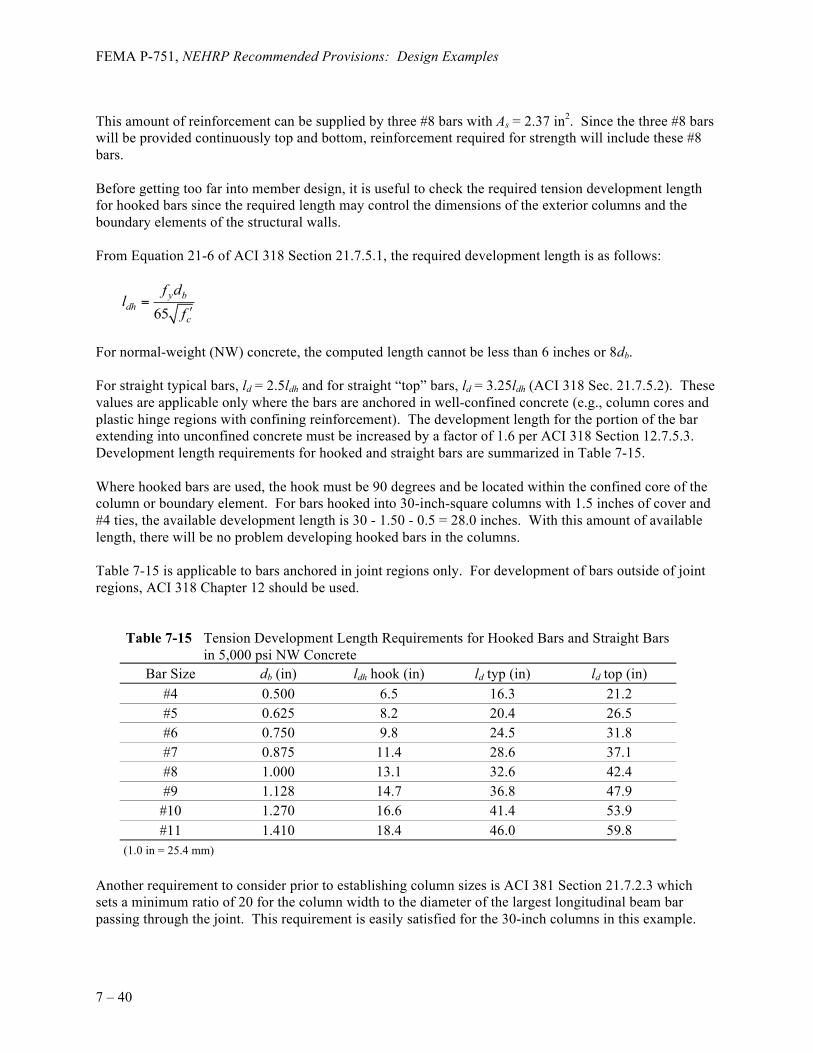
For normal-weight (NW) concrete, the computed length cannot be less than 6 inches or 8db. For straight typical bars, ld = 2.5ldh and for straight “top” bars, ld = 3.25ldh (ACI 318 Sec. 21.7.5.2). These values are applicable only where the bars are anchored in well-confined concrete (e.g., column cores and plastic hinge regions with confining reinforcement). The development length for the portion of the bar extending into unconfined concrete must be increased by a factor of 1.6 per ACI 318 Section 12.7.5.3. Development length requirements for hooked and straight bars are summarized in Table 7-15. Where hooked bars are used, the hook must be 90 degrees and be located within the confined core of the column or boundary element. For bars hooked into 30-inch-square columns with 1.5 inches of cover and #4 ties, the available development length is 30 - 1.50 - 0.5 = 28.0 inches. With this amount of available length, there will be no problem developing hooked bars in the columns. Table 7-15 is applicable to bars anchored in joint regions only. For development of bars outside of joint regions, ACI 318 Chapter 12 should be used.
Table 7-15 Tension Development Length Requirements for Hooked Bars and Straight Bars in 5,000 psi NW Concrete
Bar Size db (in) ldh hook (in) ld typ (in) ld top (in) #4 0.500 6.5 16.3 21.2 #5 0.625 8.2 20.4 26.5 #6 0.750 9.8 24.5 31.8 #7 0.875 11.4 28.6 37.1 #8 1.000 13.1 32.6 42.4 #9 1.128 14.7 36.8 47.9
#10 1.270 16.6 41.4 53.9 #11 1.410 18.4 46.0 59.8
(1.0 in = 25.4 mm) Another requirement to consider prior to establishing column sizes is ACI 381 Section 21.7.2.3 which sets a minimum ratio of 20 for the column width to the diameter of the largest longitudinal beam bar passing through the joint. This requirement is easily satisfied for the 30-inch columns in this example.
Chapter 7: Reinforced Concrete
7 – 41
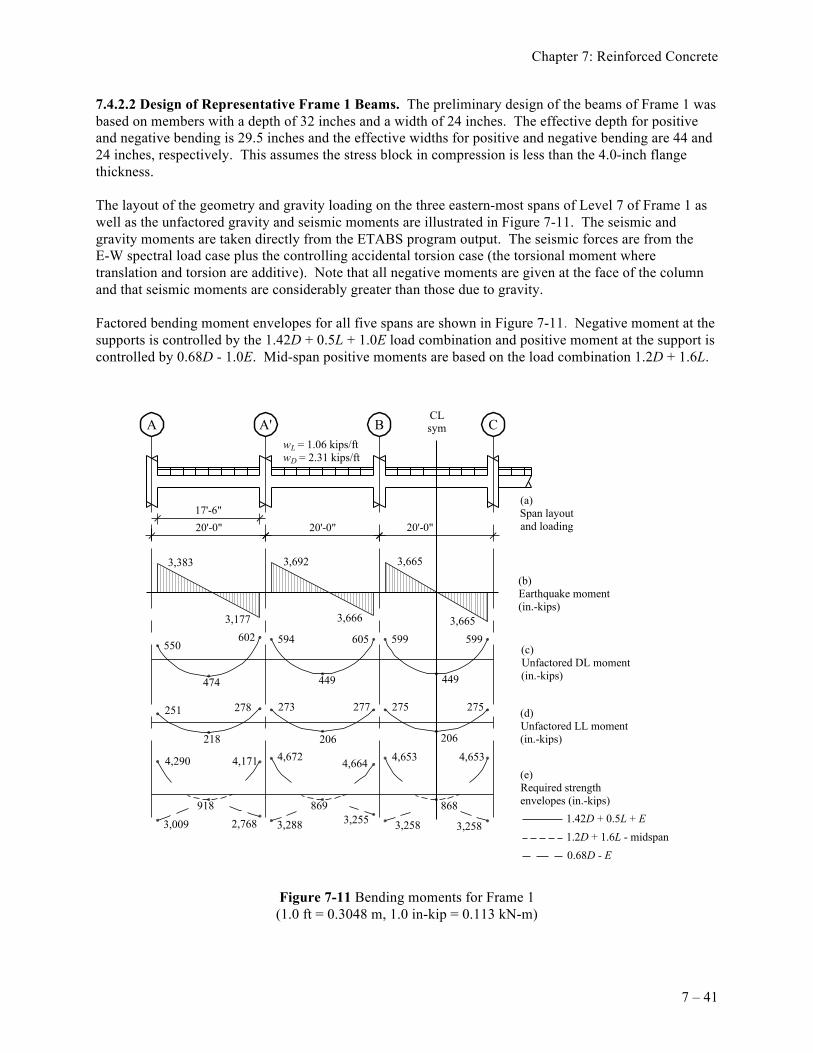
7.4.2.2 Design of Representative Frame 1 Beams. The preliminary design of the beams of Frame 1 was based on members with a depth of 32 inches and a width of 24 inches. The effective depth for positive and negative bending is 29.5 inches and the effective widths for positive and negative bending are 44 and 24 inches, respectively. This assumes the stress block in compression is less than the 4.0-inch flange thickness. The layout of the geometry and gravity loading on the three eastern-most spans of Level 7 of Frame 1 as well as the unfactored gravity and seismic moments are illustrated in Figure 7-11. The seismic and gravity moments are taken directly from the ETABS program output. The seismic forces are from the E-W spectral load case plus the controlling accidental torsion case (the torsional moment where translation and torsion are additive). Note that all negative moments are given at the face of the column and that seismic moments are considerably greater than those due to gravity. Factored bending moment envelopes for all five spans are shown in Figure 7-11. Negative moment at the supports is controlled by the 1.42D + 0.5L + 1.0E load combination and positive moment at the support is controlled by 0.68D - 1.0E. Mid-span positive moments are based on the load combination 1.2D + 1.6L.
Figure 7-11 Bending moments for Frame 1 (1.0 ft = 0.3048 m, 1.0 in-kip = 0.113 kN-m)
(a)Span layoutand loading
(b)Earthquake moment(in.-kips)
(c)Unfactored DL moment(in.-kips)
(d)Unfactored LL moment(in.-kips)
(e)Required strengthenvelopes (in.-kips)
17'-6"20'-0" 20'-0" 20'-0"
3,383 3,692 3,665
3,6663,177602
550 594 605 599 5993,665
449
275275277
449
273278
474
251
218
4,290 4,171 4,672206
4,664 4,653
206
4,653
868
3,2583,2583,255869
3,2882,768918
3,009
0.68D - E1.2D + 1.6L - midspan1.42D + 0.5L + E
A A' B CCLsym
w L = 1.06 kips/ft
w D = 2.31 kips/ft
FEMA P-751, NEHRP Recommended Provisions: Design Examples
7 – 42
7.4.2.2.1 Longitudinal Reinforcement. The design process for determining longitudinal reinforcement is illustrated as follows for Span A-A’. 1. Design for Negative Moment at the Face of the Exterior Support (Grid A): Mu = 1.42(-550) + 0.5(-251) + 1.0(-3,383) = -4,290 inch-kips
Try one #8 bar in addition to the three #8 bars required for minimum steel: As = 4(0.79) = 3.16 in2 fc' = 5,000 psi fy = 60 ksi Width b for negative moment = 24 inches d = 29.5 in. Depth of compression block, a = Asfy/0.85fc'b a = 3.16 (60)/[0.85 (5) 24] = 1.86 inches Design strength, φ Mn = φ Asfy(d - a/2)
φ Mn = 0.9(3.16)60(29.5 – 1.86/2) = 4,875 inch-kips > 4,290 inch-kips OK 2. Design for Positive Moment at Face of Exterior Support (Grid A): Mu = [-0.68(550)] + [1.0(3,383)] = 3,008 inch-kips
Try the three #8 bars required for minimum steel: As = [3(0.79)] = 2.37 in 2 Width b for positive moment = 44 inches d = 29.5 inches a = [2.37(60)]/[0.85(5)44] = 0.76 inch
φ Mn = 0.9(2.37) 60(29.5 – 0.76/2) = 3,727 inch-kips > 3,008 inch-kips OK 3. Positive Moment at Midspan: Mu = [1.2(474)] + [1.6(218)] = 918.1 inch-kips Minimum reinforcement (three #8 bars) controls by inspection. 4. Design for Negative Moment at the Face of the Interior Support (Grid A’): Mu = 1.42(-602) + 0.5(-278) + 1.0(-3,177) = -4,172 inch-kips
Try one #8 bars in addition to the three #8 bars required for minimum steel:
φ Mn = 4,875 inch-kips > 4,172 inch-kips OK 5. Design for Positive Moment at Face of Interior Support (Grid A’): Mu = [-0.68(602)] + [1.0(3,177)] = 2,767 inch-kips
Three #8 bars similar to the exterior support location are adequate by inspection.
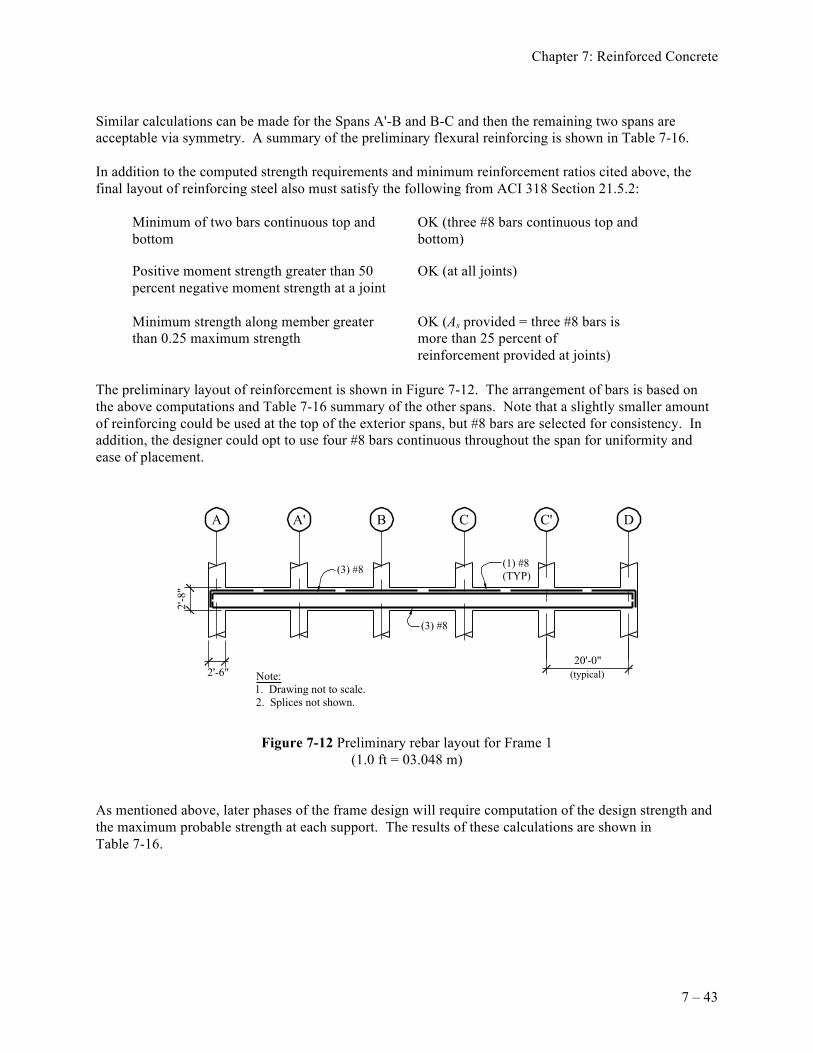
Chapter 7: Reinforced Concrete
7 – 43
Similar calculations can be made for the Spans A'-B and B-C and then the remaining two spans are acceptable via symmetry. A summary of the preliminary flexural reinforcing is shown in Table 7-16. In addition to the computed strength requirements and minimum reinforcement ratios cited above, the final layout of reinforcing steel also must satisfy the following from ACI 318 Section 21.5.2:
Minimum of two bars continuous top and bottom
OK (three #8 bars continuous top and bottom)
Positive moment strength greater than 50 percent negative moment strength at a joint
OK (at all joints)
Minimum strength along member greater than 0.25 maximum strength
OK (As provided = three #8 bars is more than 25 percent of reinforcement provided at joints)
The preliminary layout of reinforcement is shown in Figure 7-12. The arrangement of bars is based on the above computations and Table 7-16 summary of the other spans. Note that a slightly smaller amount of reinforcing could be used at the top of the exterior spans, but #8 bars are selected for consistency. In addition, the designer could opt to use four #8 bars continuous throughout the span for uniformity and ease of placement.
Figure 7-12 Preliminary rebar layout for Frame 1 (1.0 ft = 03.048 m)
As mentioned above, later phases of the frame design will require computation of the design strength and the maximum probable strength at each support. The results of these calculations are shown in Table 7-16.
Note:1. Drawing not to scale.2. Splices not shown.
(3) #8
(1) #8(TYP)
20'-0"
2'-8
"
2'-6" (typical)
A A' B C C' D
(3) #8
FEMA P-751, NEHRP Recommended Provisions: Design Examples
7 – 44
Table 7-16 Design and Maximum Probable Flexural Strength For Beams in Frame 1
Item Location*
A A' B C C' D
Negative Moment
Moment Demand (inch-kips) 4,290 4,672 4,664 4,664 4,672 4,290
Reinforcement four #8 four #8 four #8 four #8 four #8 four #8
Design Strength (inch-kips)
4,875 4,875 4,875 4,875 4,875 4,875
Probable Strength (inch-kips)
7,042 7,042 7,042 7,042 7,042 7,042
Positive Moment
Moment Demand (inch-kips) 3,009 3,288 3,255 3,255 3,289 3,009
Reinforcement three #8 three #8 three #8 three #8 three #8 three #8
Design Strength (inch-kips)
3,727 3,727 3,727 3,727 3,727 3,727
Probable Strength (inch-kips)
5,159 5,159 5,159 5,159 5,159 5,159
*Moment demand is taken as the larger of the beam moments on each side of the column. (1.0 in-kip = 0.113 kN-m) As an example of computation of probable strength, consider the case of four #8 top bars plus the portion of slab reinforcing within the effective beam flange width computed above, which is assumed to be 0.002(4 inches)(44-24)=0.16 square inches. (The slab reinforcing, which is not part of this example, is assumed to be 0.002 for minimum steel.) As = 4(0.79) + 0.16 = 3.32 in2 Width b for negative moment = 24 inches d = 29.5 inches Depth of compression block, a = As(1.25fy)/0.85fc'b a = 3.32(1.25)60/[0.85(4)24] = 2.44 inches Mpr = 1.0As(1.25fy)(d - a/2) Mpr = 1.0(3.32)1.25(60)(29.6 – 2.44/2) = 7,042 inch-kips For the case of three #8 bottom bars: As = 3(0.79) = 2.37 in2 Width b for positive moment = 44 inches d = 29.5 inches a = 2.37(1.25)60/[0.85(5)44] = 0.95 inch Mpr = 1.0(2.37)1.25(60)(29.5 – 0.95/2) = 5,159 inch-kips At this point in the design process, the layout of reinforcement has been considered preliminary because the quantity of reinforcement placed in the beams has a direct impact on the magnitude of the stresses developed in the beam-column joint. If the computed joint stresses are too high, the only remedies are increasing the concrete strength, increasing the column area, changing the reinforcement layout, or
Chapter 7: Reinforced Concrete
7 – 45
increasing the beam depth. The complete check of the beam-column joint is illustrated in Section 7.4.2.3 below, but preliminary calculations indicate that the joint is adequate, so the design can progress based on the reinforcing provided. Because the arrangement of steel is acceptable from a joint strength perspective, the cutoff locations of the various bars may be determined (see Figure 7-12 for a schematic of the arrangement of reinforcement). The three #8 bars (top and bottom) required for minimum reinforcement are supplied in one length that runs continuously across the two end spans and are spliced in the center span. An additional #8 top bar is placed at each column. To determine where added top bars should be cut off in each span, it is assumed that theoretical cutoff locations correspond to the point where the continuous top bars develop their design flexural strength. Cutoff locations are based on the members developing their design flexural capacities (fy = 60 ksi and φ = 0.9). Using calculations similar to those above, it has been determined that the design flexural strength supplied by a section with only three #8 bars is 3,686 inch-kips for negative moment. Sample cutoff calculations are given for Span B-C. To determine the cutoff location for negative moment, both the additive and counteractive load combinations must be checked to determine the maximum required cutoff length. In this case, the 1.42D + 0.5L ± QE load combination governs. Loading diagrams for determining cutoff locations are shown in Figure 7-13. For negative moment cutoff locations, refer to Figure 7-14, which is a free body diagram of the left end of the member in Figure 7-13. Since the goal is to develop a negative moment capacity of 3,686 inch-kips in the continuous #8 bars, summing moments about Point A in Figure 7-14 can be used to determine the location of this moment demand. The moment summation is as follows:
686,32.682318.0653,4
2
=−+ xx
In the above equation, 4,653 (inch-kips) is the negative moment demand at the face of column, 0.318 (kips/inch) is the factored gravity load, 68.2 kips is the end shear and 3,686 inch-kips is the design strength of the section with three #8 bars. Solving the quadratic equation results in x = 14.7 inches. ACI 318 Section 12.10.3 requires an additional length equal to the effective depth of the member or 12 bar diameters (whichever is larger). Consequently, the total length of the bar beyond the face of the support is 14.7 + 29.5 = 44.2 inches and a 3’-9” extension beyond the face of the column could be used at this location. Similar calculations should be made for the other beam ends.
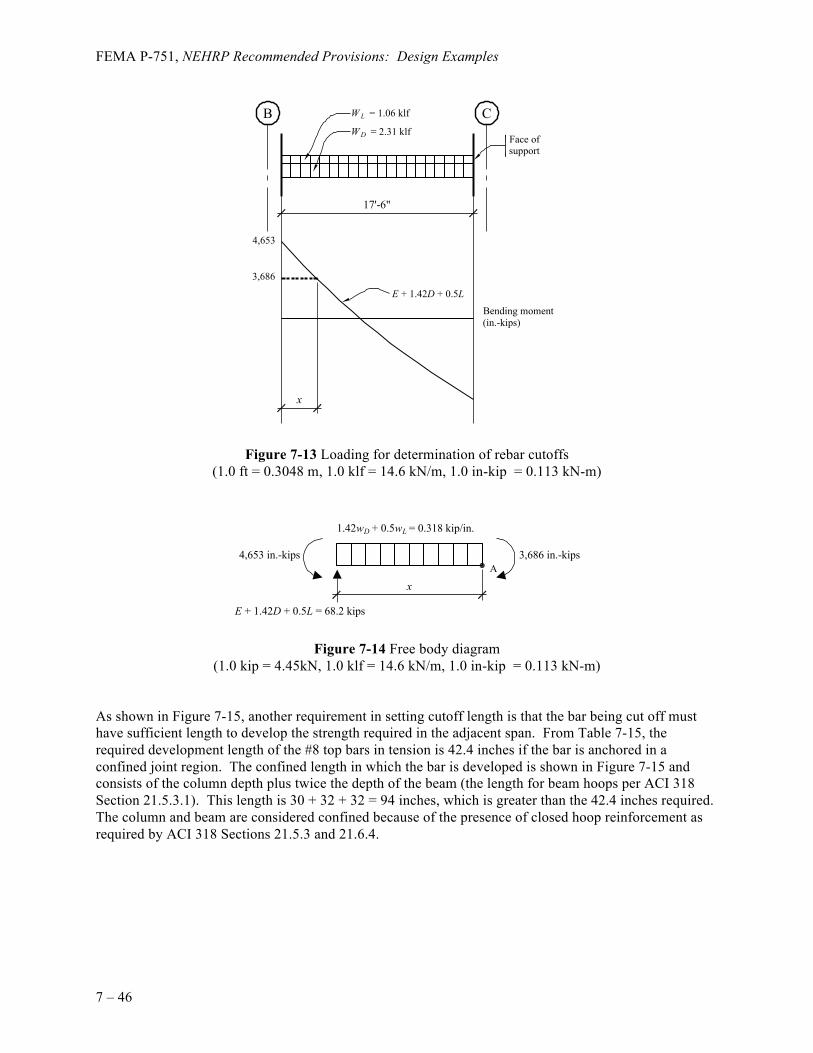
FEMA P-751, NEHRP Recommended Provisions: Design Examples
7 – 46
Figure 7-13 Loading for determination of rebar cutoffs (1.0 ft = 0.3048 m, 1.0 klf = 14.6 kN/m, 1.0 in-kip = 0.113 kN-m)
Figure 7-14 Free body diagram (1.0 kip = 4.45kN, 1.0 klf = 14.6 kN/m, 1.0 in-kip = 0.113 kN-m)
As shown in Figure 7-15, another requirement in setting cutoff length is that the bar being cut off must have sufficient length to develop the strength required in the adjacent span. From Table 7-15, the required development length of the #8 top bars in tension is 42.4 inches if the bar is anchored in a confined joint region. The confined length in which the bar is developed is shown in Figure 7-15 and consists of the column depth plus twice the depth of the beam (the length for beam hoops per ACI 318 Section 21.5.3.1). This length is 30 + 32 + 32 = 94 inches, which is greater than the 42.4 inches required. The column and beam are considered confined because of the presence of closed hoop reinforcement as required by ACI 318 Sections 21.5.3 and 21.6.4.
x
WL = 1.06 klf
WD = 2.31 klfFace ofsupport
17'-6"
4,653
3,686
Bending moment(in.-kips)
B C
E + 1.42D + 0.5L
4,653 in.-kips
xA
1.42w D + 0.5w
L = 0.318 kip/in.
E + 1.42D + 0.5L = 68.2 kips
3,686 in.-kips
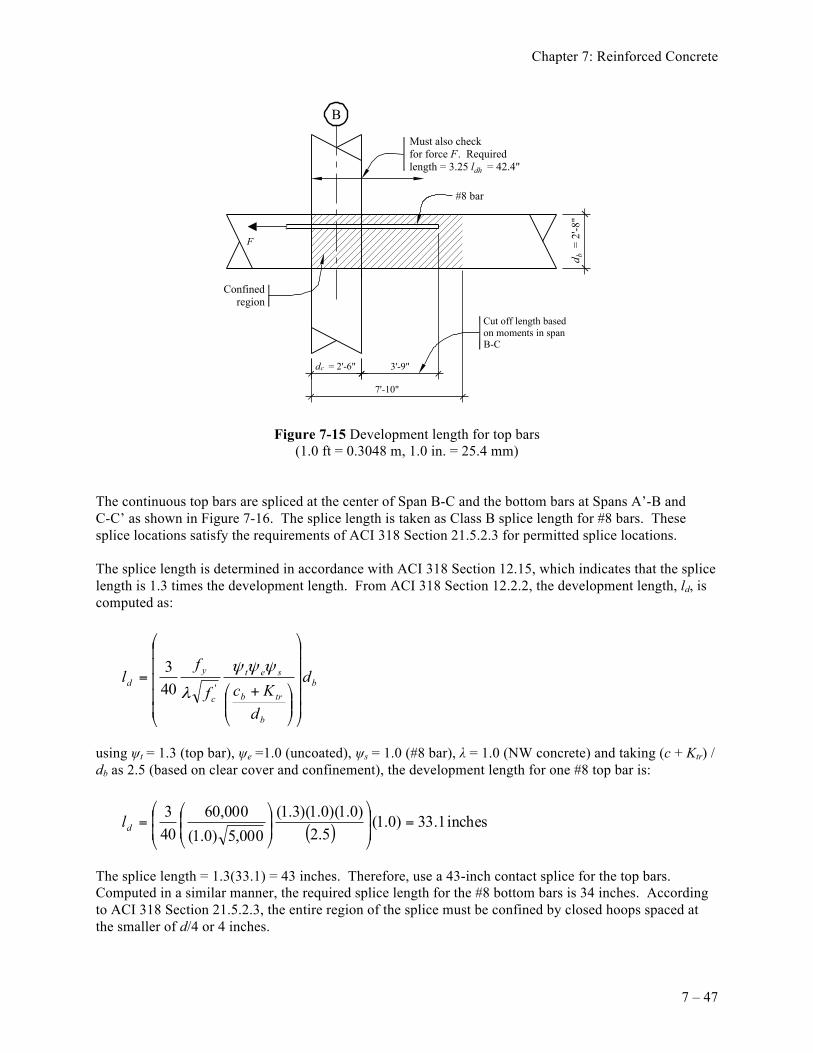
Chapter 7: Reinforced Concrete
7 – 47
Figure 7-15 Development length for top bars (1.0 ft = 0.3048 m, 1.0 in. = 25.4 mm)
The continuous top bars are spliced at the center of Span B-C and the bottom bars at Spans A’-B and C-C’ as shown in Figure 7-16. The splice length is taken as Class B splice length for #8 bars. These splice locations satisfy the requirements of ACI 318 Section 21.5.2.3 for permitted splice locations. The splice length is determined in accordance with ACI 318 Section 12.15, which indicates that the splice length is 1.3 times the development length. From ACI 318 Section 12.2.2, the development length, ld, is computed as:
b
b
trb
set
c
yd d
dKcf
fl
⎟⎟⎟⎟⎟
⎠
⎞
⎜⎜⎜⎜⎜
⎝
⎛
⎟⎟⎠
⎞⎜⎜⎝
⎛ +=
ψψψ
λ '403
using ψt = 1.3 (top bar), ψe =1.0 (uncoated), ψs = 1.0 (#8 bar), λ = 1.0 (NW concrete) and taking (c + Ktr) / db as 2.5 (based on clear cover and confinement), the development length for one #8 top bar is:
( )
inches 1.33)0.1(5.2
)0.1)(0.1)(3.1(000,5)0.1(
000,60403
=⎟⎟
⎠
⎞
⎜⎜
⎝
⎛⎟⎟⎠
⎞⎜⎜⎝
⎛=dl
The splice length = 1.3(33.1) = 43 inches. Therefore, use a 43-inch contact splice for the top bars. Computed in a similar manner, the required splice length for the #8 bottom bars is 34 inches. According to ACI 318 Section 21.5.2.3, the entire region of the splice must be confined by closed hoops spaced at the smaller of d/4 or 4 inches.
F
d b =
2'-8
"
dc = 2'-6"
7'-10"
3'-9"
Confinedregion
Must also checkfor force F. Requiredlength = 3.25 ldh = 42.4"
#8 bar
Cut off length basedon moments in spanB-C
B
~
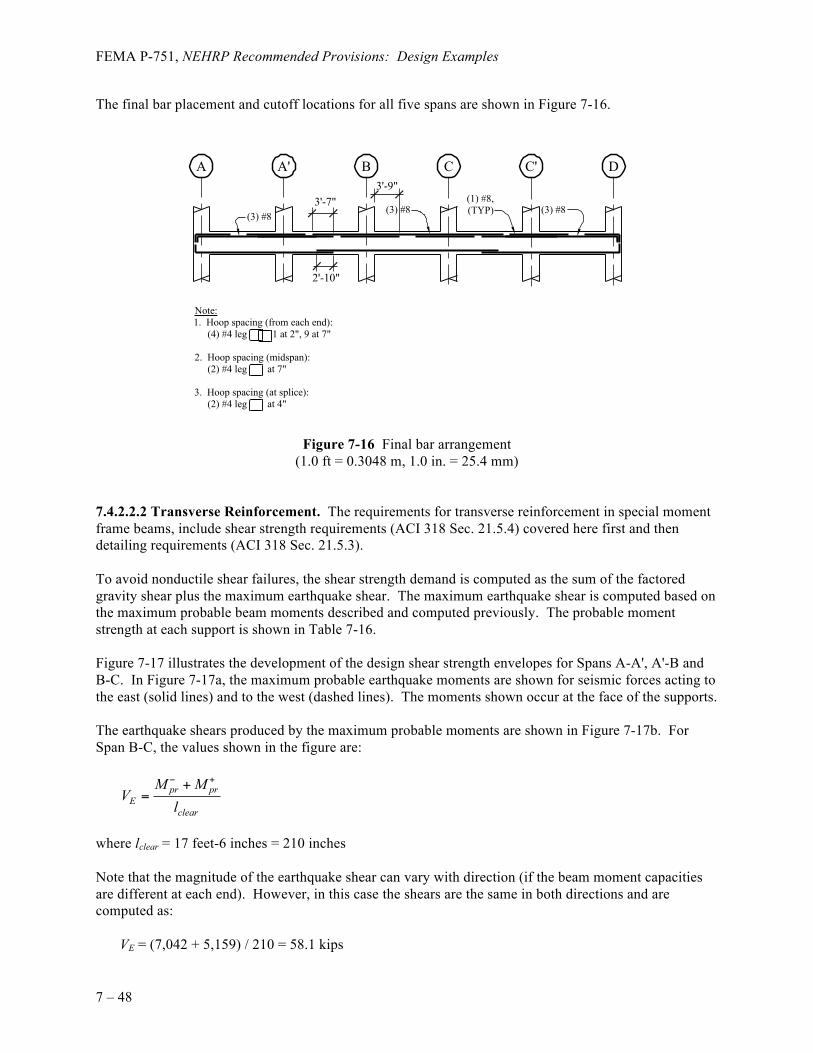
FEMA P-751, NEHRP Recommended Provisions: Design Examples
7 – 48
The final bar placement and cutoff locations for all five spans are shown in Figure 7-16.
Figure 7-16 Final bar arrangement (1.0 ft = 0.3048 m, 1.0 in. = 25.4 mm)
7.4.2.2.2 Transverse Reinforcement. The requirements for transverse reinforcement in special moment frame beams, include shear strength requirements (ACI 318 Sec. 21.5.4) covered here first and then detailing requirements (ACI 318 Sec. 21.5.3). To avoid nonductile shear failures, the shear strength demand is computed as the sum of the factored gravity shear plus the maximum earthquake shear. The maximum earthquake shear is computed based on the maximum probable beam moments described and computed previously. The probable moment strength at each support is shown in Table 7-16. Figure 7-17 illustrates the development of the design shear strength envelopes for Spans A-A', A'-B and B-C. In Figure 7-17a, the maximum probable earthquake moments are shown for seismic forces acting to the east (solid lines) and to the west (dashed lines). The moments shown occur at the face of the supports. The earthquake shears produced by the maximum probable moments are shown in Figure 7-17b. For Span B-C, the values shown in the figure are:
pr prE
clear
M MV
l
− ++=
where lclear = 17 feet-6 inches = 210 inches Note that the magnitude of the earthquake shear can vary with direction (if the beam moment capacities are different at each end). However, in this case the shears are the same in both directions and are computed as: VE = (7,042 + 5,159) / 210 = 58.1 kips
(3) #8
(1) #8,(TYP) (3) #8
3'-9"
2'-10"
Note:1. Hoop spacing (from each end): (4) #4 leg 1 at 2", 9 at 7"
2. Hoop spacing (midspan): (2) #4 leg at 7"
3. Hoop spacing (at splice): (2) #4 leg at 4"
A A' B C C' D
3'-7"(3) #8
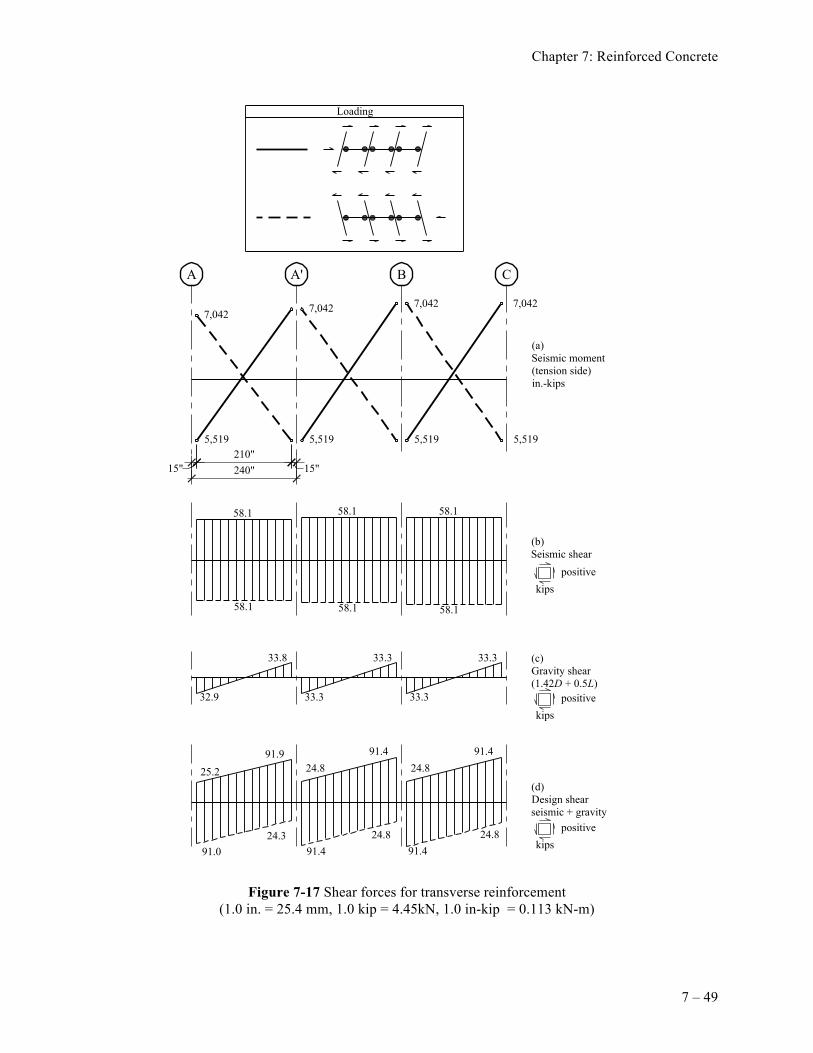
Chapter 7: Reinforced Concrete
7 – 49
Figure 7-17 Shear forces for transverse reinforcement (1.0 in. = 25.4 mm, 1.0 kip = 4.45kN, 1.0 in-kip = 0.113 kN-m)
(a)Seismic moment(tension side)in.-kips
(d)Design shearseismic + gravity
240"210"
15" 15"
(c)Gravity shear(1.42D + 0.5L)
(b)Seismic shear
A A' B C
Loading
7,042 7,042 7,042 7,042
5,5195,5195,5195,519
58.1
58.1
58.1
58.1
58.1
58.1
kipspositive
32.9
33.8
33.3
33.3
33.3
33.3
25.291.9
24.891.4
24.891.4
24.891.4
24.891.4
24.391.0 kips
positive
kipspositive
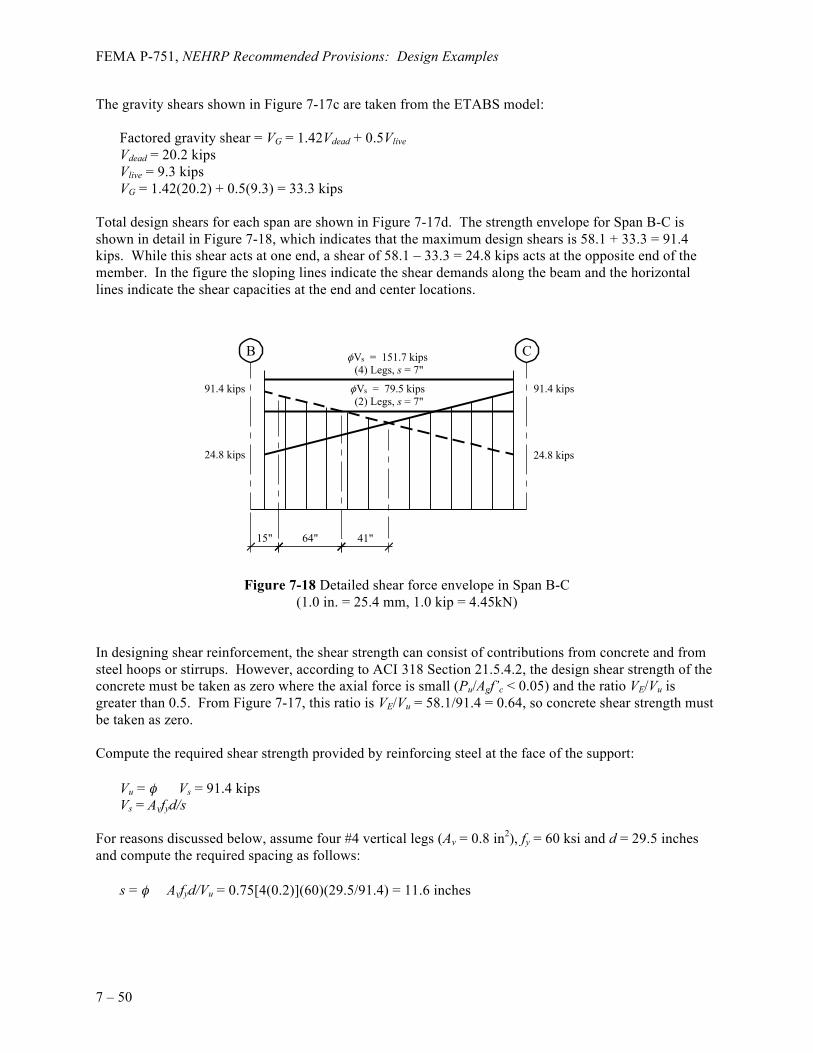
FEMA P-751, NEHRP Recommended Provisions: Design Examples
7 – 50
The gravity shears shown in Figure 7-17c are taken from the ETABS model: Factored gravity shear = VG = 1.42Vdead + 0.5Vlive Vdead = 20.2 kips Vlive = 9.3 kips VG = 1.42(20.2) + 0.5(9.3) = 33.3 kips Total design shears for each span are shown in Figure 7-17d. The strength envelope for Span B-C is shown in detail in Figure 7-18, which indicates that the maximum design shears is 58.1 + 33.3 = 91.4 kips. While this shear acts at one end, a shear of 58.1 – 33.3 = 24.8 kips acts at the opposite end of the member. In the figure the sloping lines indicate the shear demands along the beam and the horizontal lines indicate the shear capacities at the end and center locations.
Figure 7-18 Detailed shear force envelope in Span B-C (1.0 in. = 25.4 mm, 1.0 kip = 4.45kN)
In designing shear reinforcement, the shear strength can consist of contributions from concrete and from steel hoops or stirrups. However, according to ACI 318 Section 21.5.4.2, the design shear strength of the concrete must be taken as zero where the axial force is small (Pu/Agf’c < 0.05) and the ratio VE/Vu is greater than 0.5. From Figure 7-17, this ratio is VE/Vu = 58.1/91.4 = 0.64, so concrete shear strength must be taken as zero. Compute the required shear strength provided by reinforcing steel at the face of the support: Vu = φ Vs = 91.4 kips Vs = Avfyd/s For reasons discussed below, assume four #4 vertical legs (Av = 0.8 in2), fy = 60 ksi and d = 29.5 inches and compute the required spacing as follows: s = φ Avfyd/Vu = 0.75[4(0.2)](60)(29.5/91.4) = 11.6 inches
15" 64" 41"
φVs = 151.7 kips(4) Legs, s = 7"
91.4 kips
24.8 kips
91.4 kips
24.8 kips
B C
φVs = 79.5 kips(2) Legs, s = 7"
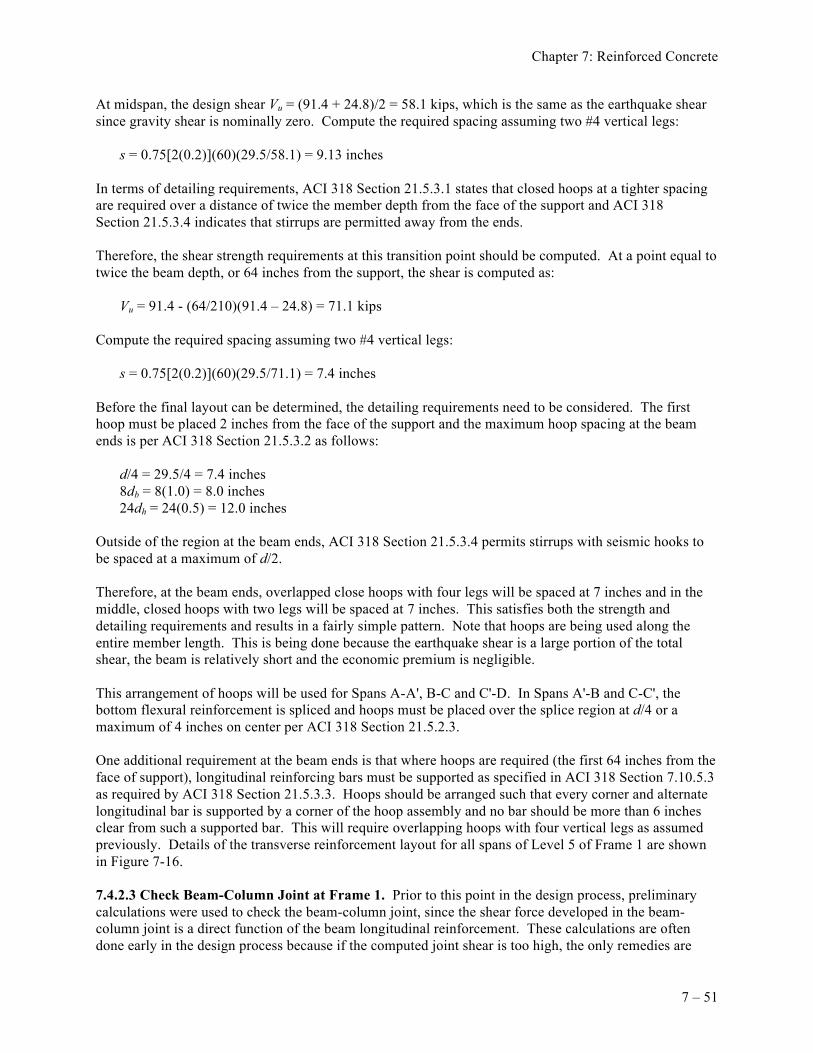
Chapter 7: Reinforced Concrete
7 – 51
At midspan, the design shear Vu = (91.4 + 24.8)/2 = 58.1 kips, which is the same as the earthquake shear since gravity shear is nominally zero. Compute the required spacing assuming two #4 vertical legs: s = 0.75[2(0.2)](60)(29.5/58.1) = 9.13 inches In terms of detailing requirements, ACI 318 Section 21.5.3.1 states that closed hoops at a tighter spacing are required over a distance of twice the member depth from the face of the support and ACI 318 Section 21.5.3.4 indicates that stirrups are permitted away from the ends. Therefore, the shear strength requirements at this transition point should be computed. At a point equal to twice the beam depth, or 64 inches from the support, the shear is computed as: Vu = 91.4 - (64/210)(91.4 – 24.8) = 71.1 kips Compute the required spacing assuming two #4 vertical legs: s = 0.75[2(0.2)](60)(29.5/71.1) = 7.4 inches Before the final layout can be determined, the detailing requirements need to be considered. The first hoop must be placed 2 inches from the face of the support and the maximum hoop spacing at the beam ends is per ACI 318 Section 21.5.3.2 as follows: d/4 = 29.5/4 = 7.4 inches 8db = 8(1.0) = 8.0 inches 24dh = 24(0.5) = 12.0 inches Outside of the region at the beam ends, ACI 318 Section 21.5.3.4 permits stirrups with seismic hooks to be spaced at a maximum of d/2. Therefore, at the beam ends, overlapped close hoops with four legs will be spaced at 7 inches and in the middle, closed hoops with two legs will be spaced at 7 inches. This satisfies both the strength and detailing requirements and results in a fairly simple pattern. Note that hoops are being used along the entire member length. This is being done because the earthquake shear is a large portion of the total shear, the beam is relatively short and the economic premium is negligible. This arrangement of hoops will be used for Spans A-A', B-C and C'-D. In Spans A'-B and C-C', the bottom flexural reinforcement is spliced and hoops must be placed over the splice region at d/4 or a maximum of 4 inches on center per ACI 318 Section 21.5.2.3. One additional requirement at the beam ends is that where hoops are required (the first 64 inches from the face of support), longitudinal reinforcing bars must be supported as specified in ACI 318 Section 7.10.5.3 as required by ACI 318 Section 21.5.3.3. Hoops should be arranged such that every corner and alternate longitudinal bar is supported by a corner of the hoop assembly and no bar should be more than 6 inches clear from such a supported bar. This will require overlapping hoops with four vertical legs as assumed previously. Details of the transverse reinforcement layout for all spans of Level 5 of Frame 1 are shown in Figure 7-16. 7.4.2.3 Check Beam-Column Joint at Frame 1. Prior to this point in the design process, preliminary calculations were used to check the beam-column joint, since the shear force developed in the beam-column joint is a direct function of the beam longitudinal reinforcement. These calculations are often done early in the design process because if the computed joint shear is too high, the only remedies are
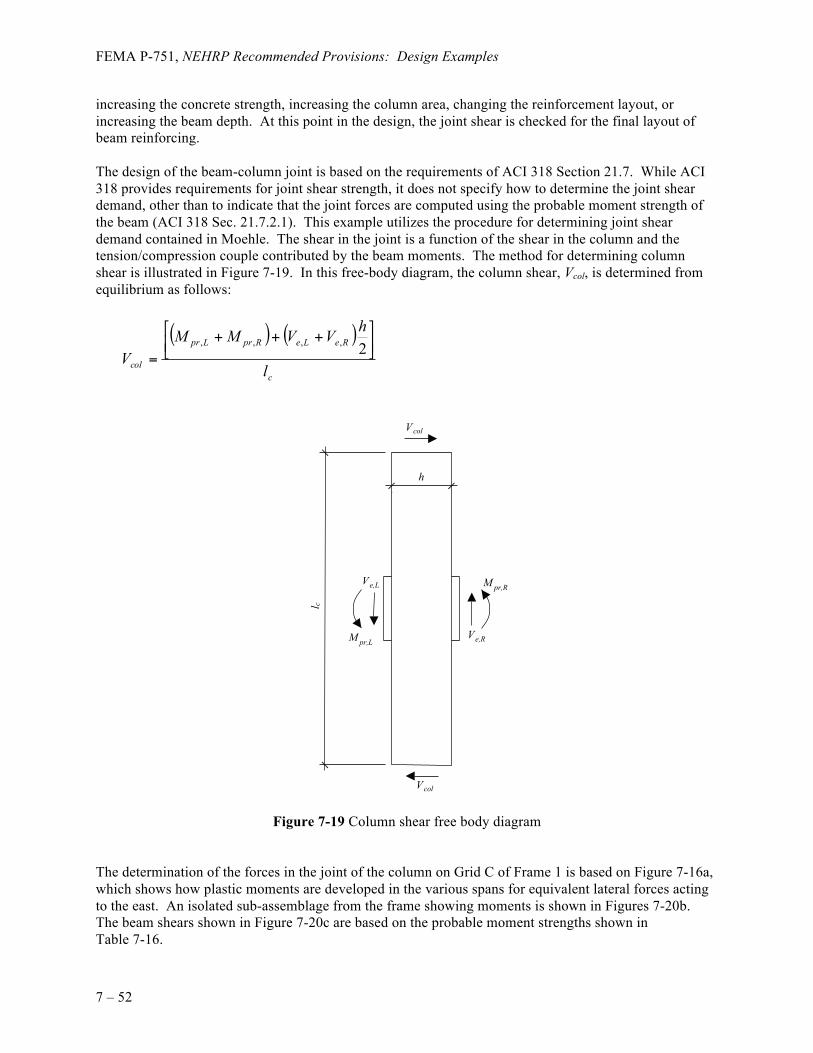
FEMA P-751, NEHRP Recommended Provisions: Design Examples
7 – 52
increasing the concrete strength, increasing the column area, changing the reinforcement layout, or increasing the beam depth. At this point in the design, the joint shear is checked for the final layout of beam reinforcing. The design of the beam-column joint is based on the requirements of ACI 318 Section 21.7. While ACI 318 provides requirements for joint shear strength, it does not specify how to determine the joint shear demand, other than to indicate that the joint forces are computed using the probable moment strength of the beam (ACI 318 Sec. 21.7.2.1). This example utilizes the procedure for determining joint shear demand contained in Moehle. The shear in the joint is a function of the shear in the column and the tension/compression couple contributed by the beam moments. The method for determining column shear is illustrated in Figure 7-19. In this free-body diagram, the column shear, Vcol, is determined from equilibrium as follows:
( ) ( )
c
ReLeRprLpr
col l
hVVMMV
⎥⎦
⎤⎢⎣
⎡ +++=
2,,,,
Figure 7-19 Column shear free body diagram The determination of the forces in the joint of the column on Grid C of Frame 1 is based on Figure 7-16a, which shows how plastic moments are developed in the various spans for equivalent lateral forces acting to the east. An isolated sub-assemblage from the frame showing moments is shown in Figures 7-20b. The beam shears shown in Figure 7-20c are based on the probable moment strengths shown in Table 7-16.
h
Vcol
l c
V e,R
M pr,R
V e,L
M pr,L
Vcol
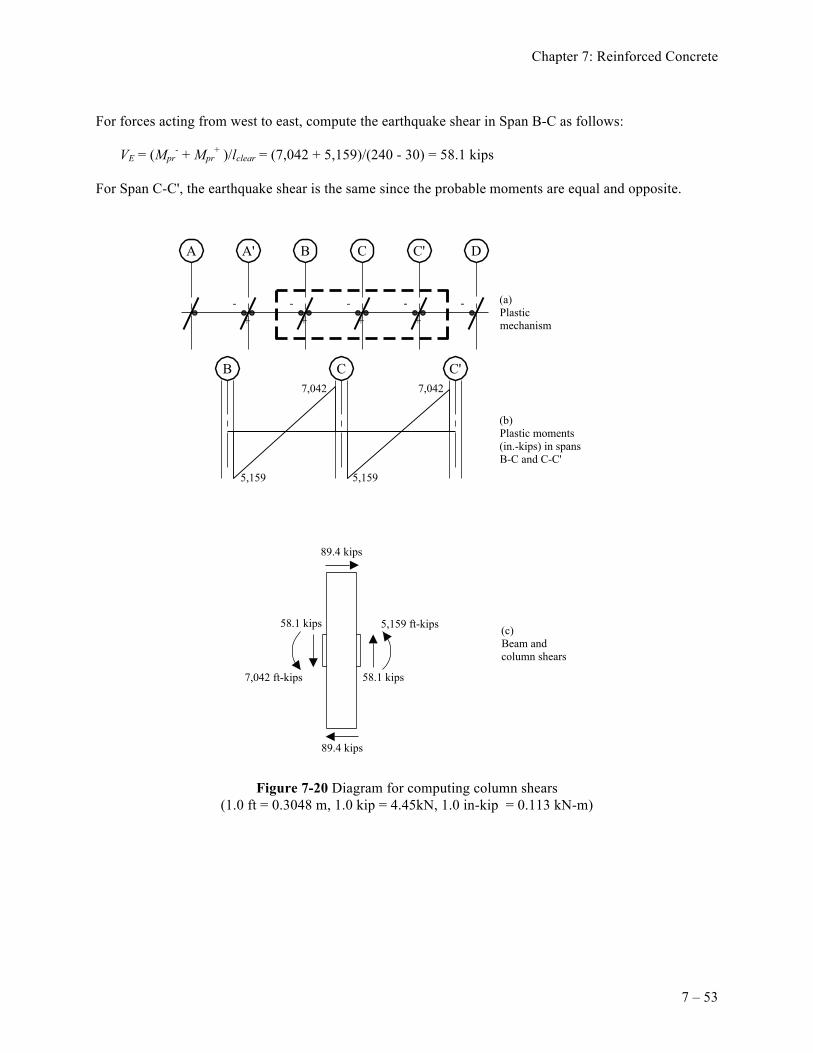
Chapter 7: Reinforced Concrete
7 – 53
For forces acting from west to east, compute the earthquake shear in Span B-C as follows: VE = (Mpr
- + Mpr+ )/lclear = (7,042 + 5,159)/(240 - 30) = 58.1 kips
For Span C-C', the earthquake shear is the same since the probable moments are equal and opposite.
Figure 7-20 Diagram for computing column shears (1.0 ft = 0.3048 m, 1.0 kip = 4.45kN, 1.0 in-kip = 0.113 kN-m)
(a)Plasticmechanism
(b)Plastic moments(in.-kips) in spansB-C and C-C'
(c)Beam andcolumn shears
89.4 kips
58.1 kips
7,042 ft-kips
89.4 kips
A A' B C C' D
B C C'
58.1 kips
5,159 ft-kips
7,042 7,042
5,1595,159
- - - - - + + + +
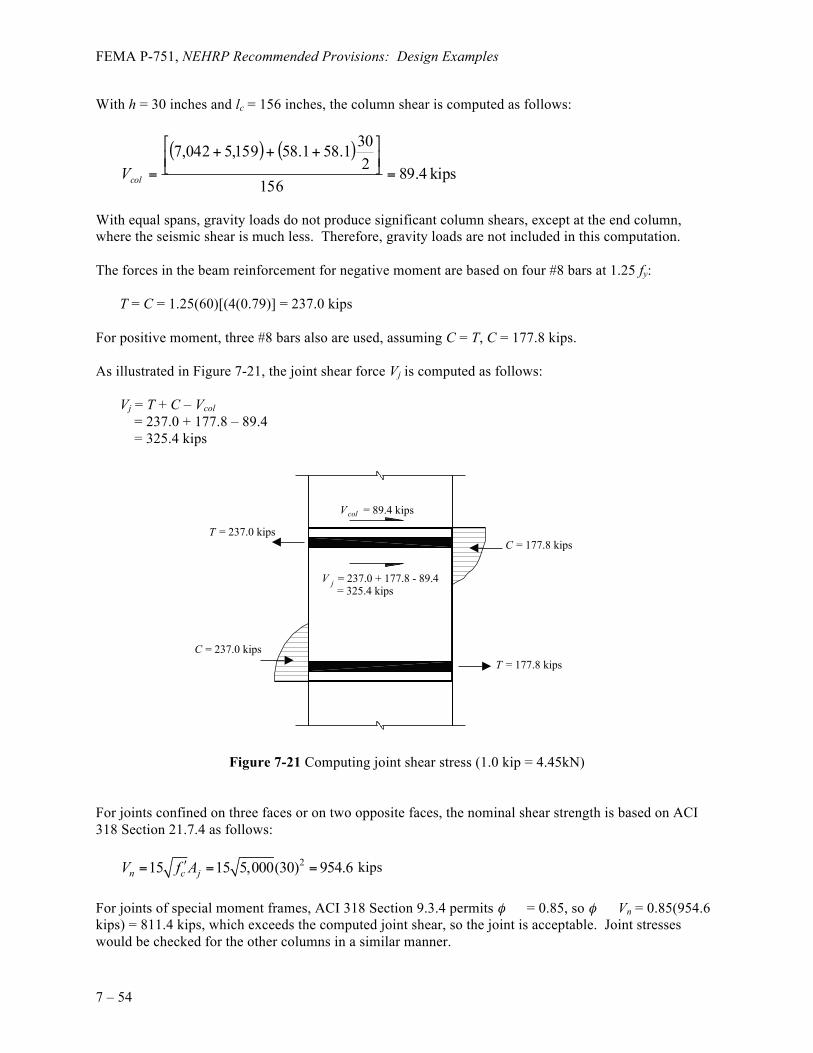
FEMA P-751, NEHRP Recommended Provisions: Design Examples
7 – 54
With h = 30 inches and lc = 156 inches, the column shear is computed as follows:
( ) ( )
kips 4.89156
2301.581.58159,5042,7
=⎥⎦
⎤⎢⎣
⎡ +++=colV
With equal spans, gravity loads do not produce significant column shears, except at the end column, where the seismic shear is much less. Therefore, gravity loads are not included in this computation. The forces in the beam reinforcement for negative moment are based on four #8 bars at 1.25 fy: T = C = 1.25(60)[(4(0.79)] = 237.0 kips For positive moment, three #8 bars also are used, assuming C = T, C = 177.8 kips. As illustrated in Figure 7-21, the joint shear force Vj is computed as follows: Vj = T + C – Vcol
= 237.0 + 177.8 – 89.4 = 325.4 kips
Figure 7-21 Computing joint shear stress (1.0 kip = 4.45kN) For joints confined on three faces or on two opposite faces, the nominal shear strength is based on ACI 318 Section 21.7.4 as follows: 215 15 5,000(30) 954.6n c jV f A′= = = kips For joints of special moment frames, ACI 318 Section 9.3.4 permits φ = 0.85, so φ Vn = 0.85(954.6 kips) = 811.4 kips, which exceeds the computed joint shear, so the joint is acceptable. Joint stresses would be checked for the other columns in a similar manner.
C = 177.8 kips
T = 177.8 kipsC = 237.0 kips
T = 237.0 kips
Vcol = 89.4 kips
V j = 237.0 + 177.8 - 89.4
= 325.4 kips
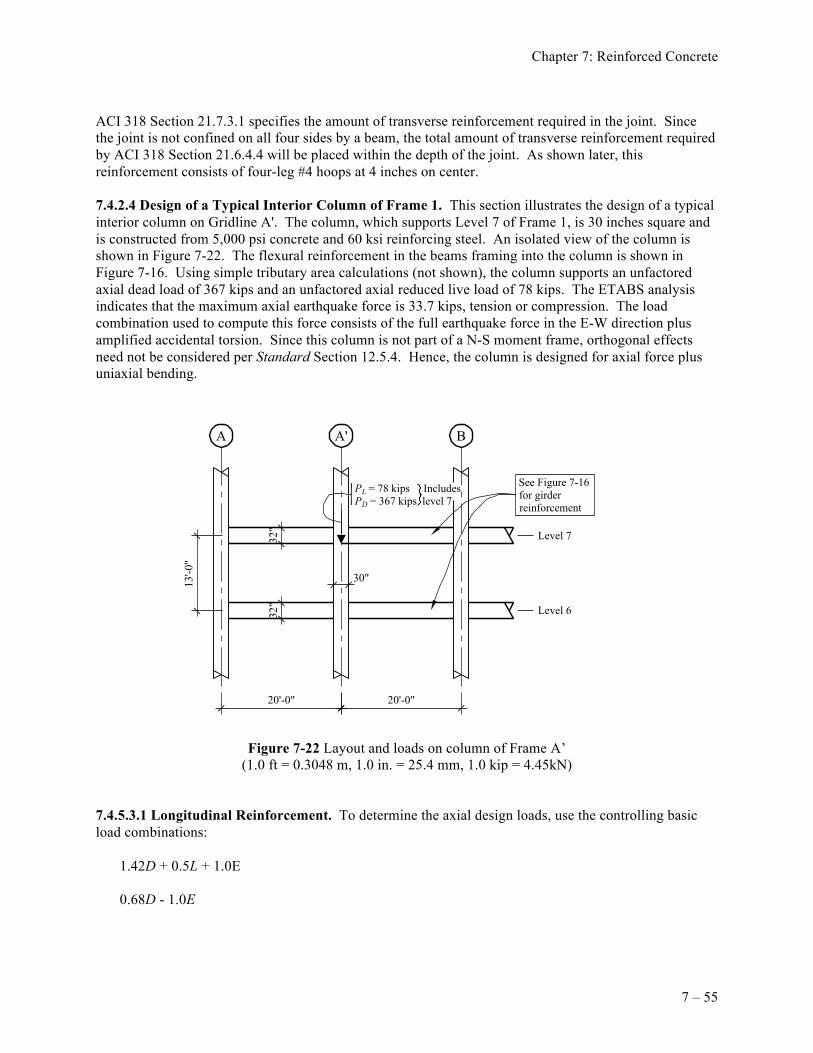
Chapter 7: Reinforced Concrete
7 – 55
ACI 318 Section 21.7.3.1 specifies the amount of transverse reinforcement required in the joint. Since the joint is not confined on all four sides by a beam, the total amount of transverse reinforcement required by ACI 318 Section 21.6.4.4 will be placed within the depth of the joint. As shown later, this reinforcement consists of four-leg #4 hoops at 4 inches on center. 7.4.2.4 Design of a Typical Interior Column of Frame 1. This section illustrates the design of a typical interior column on Gridline A'. The column, which supports Level 7 of Frame 1, is 30 inches square and is constructed from 5,000 psi concrete and 60 ksi reinforcing steel. An isolated view of the column is shown in Figure 7-22. The flexural reinforcement in the beams framing into the column is shown in Figure 7-16. Using simple tributary area calculations (not shown), the column supports an unfactored axial dead load of 367 kips and an unfactored axial reduced live load of 78 kips. The ETABS analysis indicates that the maximum axial earthquake force is 33.7 kips, tension or compression. The load combination used to compute this force consists of the full earthquake force in the E-W direction plus amplified accidental torsion. Since this column is not part of a N-S moment frame, orthogonal effects need not be considered per Standard Section 12.5.4. Hence, the column is designed for axial force plus uniaxial bending.
Figure 7-22 Layout and loads on column of Frame A’ (1.0 ft = 0.3048 m, 1.0 in. = 25.4 mm, 1.0 kip = 4.45kN)
7.4.5.3.1 Longitudinal Reinforcement. To determine the axial design loads, use the controlling basic load combinations:
1.42D + 0.5L + 1.0E 0.68D - 1.0E
See Figure 7-16for girderreinforcement
30"
Level 7
Level 6
20'-0"20'-0"
32"
32"
PL = 78 kips IncludesPD = 367 kips level 7
13'-0
"
A A' B
FEMA P-751, NEHRP Recommended Provisions: Design Examples
7 – 56
The combination that results in maximum compression is: Pu = 1.42(367.2) + 0.5(78.0) + 1.0(33.7) = 595 kips (compression) The combination for minimum compression (or tension) is: Pu = 0.68(367.2) - 1.0(33.7) = 216 kips (compression) The maximum axial compression force of 595 kips is greater than 0.1fc'Ag = 0.1(5)(302) = 450 kips, so the design is based on ACI 318 Section 21.6 for columns (see ACI 318 Sec. 21.6.1). According to ACI 318 Section 21.6.2, the sum of nominal column flexural strengths at the joint must be at least 6/5 of the sum of nominal flexural strength of the beams framing into the column. Beam moments at the face of the support are used for this computation. These capacities are provided in Table 7-16. Nominal (negative) moment strength at end A' of Span A-A' = 4,875/0.9 = 5,417 inch-kips Nominal (positive) moment strength at end A' of Span A' B = 3,727/0.9 = 4,141 inch-kips Sum of beam moment at the joint = 5,417 + 4,141 = 9,558 inch-kips Required sum of column design moments = 6/5 × 9,558 = 11,469 inch-kips. Individual column design moment = 11,469/2 = 5,735 inch-kips Knowing the factored axial load and the required design flexural strength, a column with adequate capacity must be selected. Figure 7-23 shows a P-M interaction curve for a 30- by 30-inch column with longitudinal reinforcing consisting of twelve #8 bars (1.05 percent steel). Computed using PCA Column, the curve is based on a φ factor of 1.0 as required for nominal strength. At axial forces of 595 kips and 216 kips, solid horizontal lines are drawn. The dots on the lines represent the required average nominal flexural strength (5,735 inch-kips) at each axial load level. These dots must lie to the left of the curve representing the nominal column strengths. Since the dots are within the capacity curve for both design and nominal moments strengths at both the minimum and maximum axial forces, this column design is clearly adequate.
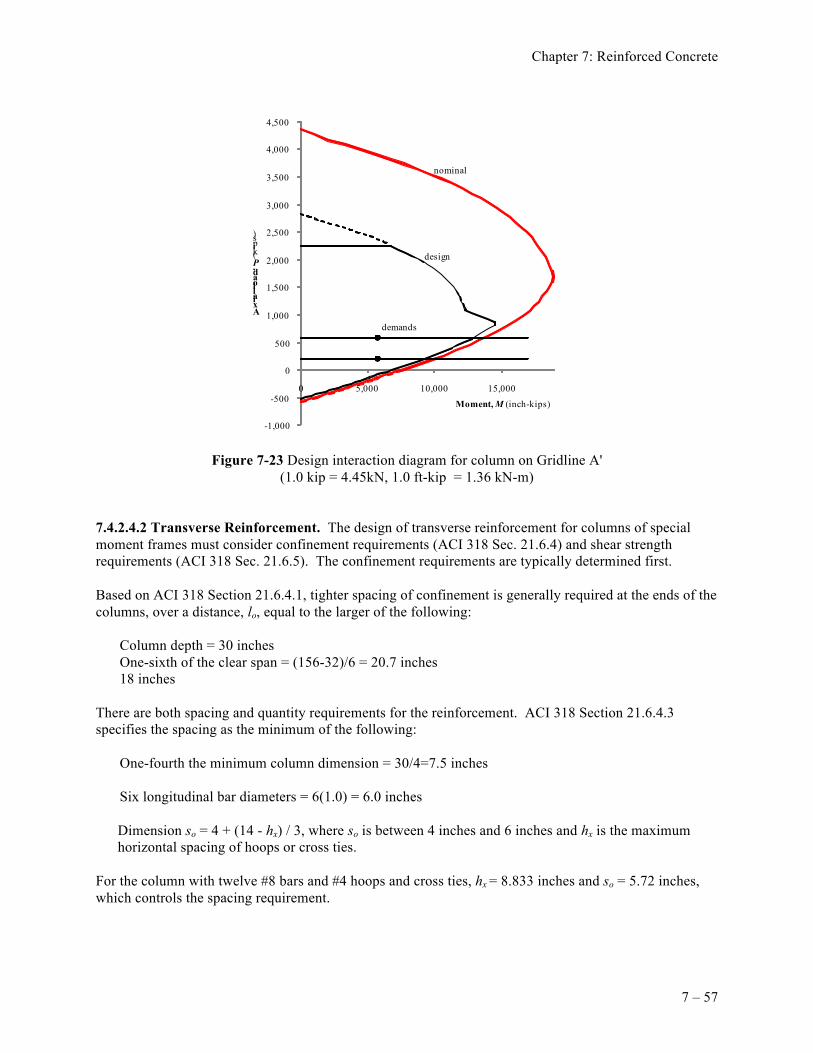
Chapter 7: Reinforced Concrete
7 – 57
Figure 7-23 Design interaction diagram for column on Gridline A' (1.0 kip = 4.45kN, 1.0 ft-kip = 1.36 kN-m)
7.4.2.4.2 Transverse Reinforcement. The design of transverse reinforcement for columns of special moment frames must consider confinement requirements (ACI 318 Sec. 21.6.4) and shear strength requirements (ACI 318 Sec. 21.6.5). The confinement requirements are typically determined first. Based on ACI 318 Section 21.6.4.1, tighter spacing of confinement is generally required at the ends of the columns, over a distance, lo, equal to the larger of the following: Column depth = 30 inches One-sixth of the clear span = (156-32)/6 = 20.7 inches 18 inches There are both spacing and quantity requirements for the reinforcement. ACI 318 Section 21.6.4.3 specifies the spacing as the minimum of the following: One-fourth the minimum column dimension = 30/4=7.5 inches Six longitudinal bar diameters = 6(1.0) = 6.0 inches Dimension so = 4 + (14 - hx) / 3, where so is between 4 inches and 6 inches and hx is the maximum
horizontal spacing of hoops or cross ties. For the column with twelve #8 bars and #4 hoops and cross ties, hx = 8.833 inches and so = 5.72 inches, which controls the spacing requirement.
nominal
demands
design
-1,000
-500
0
500
1,000
1,500
2,000
2,500
3,000
3,500
4,000
4,500
0 5,000 10,000 15,000
Axial load, P(kips)
Moment, M (inch-kips)
FEMA P-751, NEHRP Recommended Provisions: Design Examples
7 – 58
ACI 318 Section 21.6.4.4 gives the requirements for minimum transverse reinforcement in terms of cross sectional area. For rectangular sections with hoops, ACI 318 Equations 21-4 and 21-5 are applicable:
0.3 1gc csh
yt ch
Asb fAf A
⎛ ⎞′ ⎛ ⎞= −⎜ ⎟⎜ ⎟⎜ ⎟⎝ ⎠⎝ ⎠
0.09 c csh
yt
sb fAf
⎛ ⎞′= ⎜ ⎟⎜ ⎟
⎝ ⎠
The first of these equations controls when Ag/Ach > 1.3. For the 30- by 30-inch columns: Ach = (30 - 1.5 - 1.5)2 = 729 in2 Ag = 30 (30) = 900 in2 Ag/Ach = 900/729 = 1.24 Therefore, ACI 318 Equation 21-5 controls. Try hoops with four #4 legs: bc = 30 - 1.5 - 1.5 = 27.0 inches s = [4 (0.2)(60,000)]/[0.09 (27.0)(5,000)] = 3.95 inches This spacing controls the design, so hoops consisting of four #4 bars spaced at 4 inches will be considered acceptable. ACI 318 Section 21.6.4.5 specifies the maximum spacing of transverse reinforcement in the region beyond the lo zones. The maximum spacing is the smaller of 6.0 inches or 6db, which for #8 bars is also 6 inches. Hoops and crossties with the same details as those placed in the critical regions of the column will be used. 7.4.2.4.3 Check Column Shear Strength. The amount of transverse reinforcement computed in the previous section is the minimum required for confinement. The column also must be checked for shear strength in based on ACI 318 Sec. 21.6.5.1. According to that section, the column shear is based on the probable moment strength of the columns, but need not be more than what can be developed into the column by the beams framing into the joint. However, the design shear cannot be less than the factored shear determined from the analysis. The shears computed based on the probable moment strength of the column can be conservative since the actual column moments are limited by the moments that can be delivered by the beams. For this example, however, the shear from the column probable moments will be checked first and then a determination will be made if a more detailed limit state analysis should be used. As determined from PCA Column, the maximum probable moment of the column in the range of factored axial load is 14,940 in.-kips. With a clear height of 124 inches, the column shear can be determined as 2(14,940)/124 = 241 kips. This shear will be compared to the capacity provided by the 4-leg #4 hoops spaced at 6 inches on center. If this capacity is in excess of the demand, the columns will be acceptable for shear.
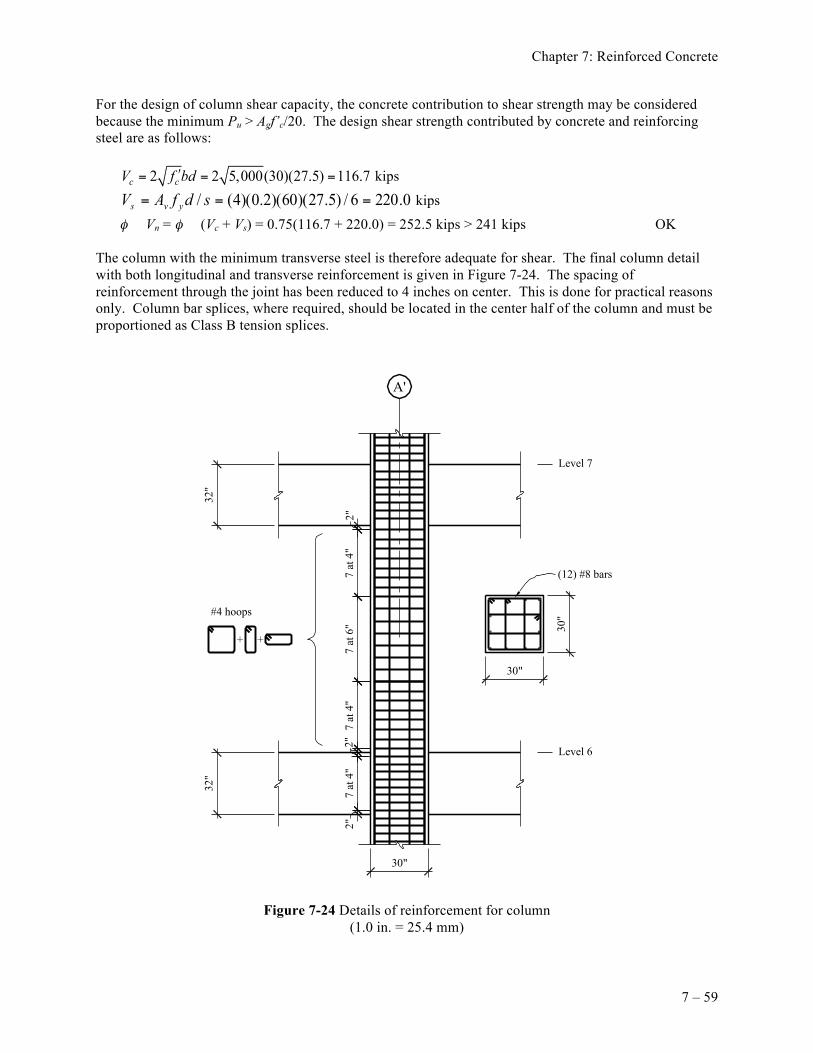
Chapter 7: Reinforced Concrete
7 – 59
For the design of column shear capacity, the concrete contribution to shear strength may be considered because the minimum Pu > Agf’c/20. The design shear strength contributed by concrete and reinforcing steel are as follows:
2 2 5,000(30)(27.5) 116.7c cV f bd′= = = kips
0.2206/)5.27)(60)(2.0)(4(/ === sdfAV yvs kips
φ Vn = φ (Vc + Vs) = 0.75(116.7 + 220.0) = 252.5 kips > 241 kips OK The column with the minimum transverse steel is therefore adequate for shear. The final column detail with both longitudinal and transverse reinforcement is given in Figure 7-24. The spacing of reinforcement through the joint has been reduced to 4 inches on center. This is done for practical reasons only. Column bar splices, where required, should be located in the center half of the column and must be proportioned as Class B tension splices.
Figure 7-24 Details of reinforcement for column (1.0 in. = 25.4 mm)
Level 7
Level 6
30"
32"
32"
30"
30"
(12) #8 bars
#4 hoops
+ +
2"7
at 4
"2"
7 at
4"
7 at
6"
7 at
4"
2"
A'
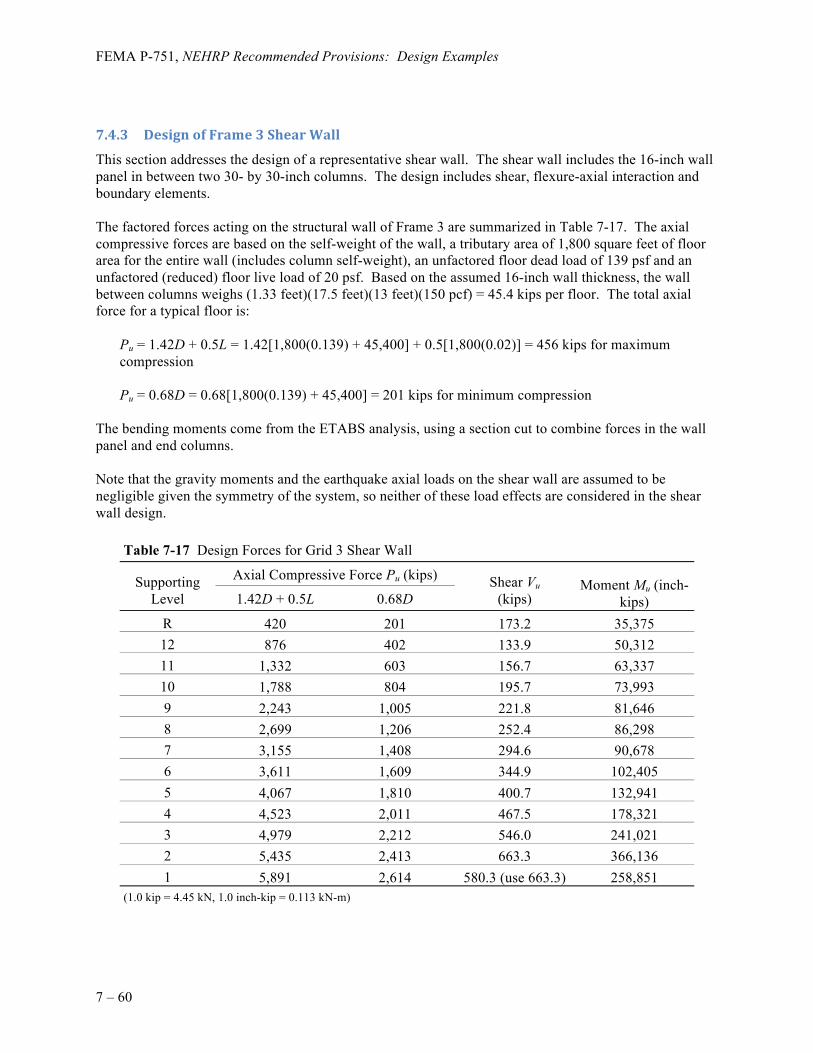
FEMA P-751, NEHRP Recommended Provisions: Design Examples
7 – 60
This section addresses the design of a representative shear wall. The shear wall includes the 16-inch wall panel in between two 30- by 30-inch columns. The design includes shear, flexure-axial interaction and boundary elements. The factored forces acting on the structural wall of Frame 3 are summarized in Table 7-17. The axial compressive forces are based on the self-weight of the wall, a tributary area of 1,800 square feet of floor area for the entire wall (includes column self-weight), an unfactored floor dead load of 139 psf and an unfactored (reduced) floor live load of 20 psf. Based on the assumed 16-inch wall thickness, the wall between columns weighs (1.33 feet)(17.5 feet)(13 feet)(150 pcf) = 45.4 kips per floor. The total axial force for a typical floor is: Pu = 1.42D + 0.5L = 1.42[1,800(0.139) + 45,400] + 0.5[1,800(0.02)] = 456 kips for maximum
compression Pu = 0.68D = 0.68[1,800(0.139) + 45,400] = 201 kips for minimum compression The bending moments come from the ETABS analysis, using a section cut to combine forces in the wall panel and end columns. Note that the gravity moments and the earthquake axial loads on the shear wall are assumed to be negligible given the symmetry of the system, so neither of these load effects are considered in the shear wall design.
Table 7-17 Design Forces for Grid 3 Shear Wall
Supporting Level
Axial Compressive Force Pu (kips) Shear Vu (kips)
Moment Mu (inch-kips) 1.42D + 0.5L 0.68D
R 420 201 173.2 35,375 12 876 402 133.9 50,312 11 1,332 603 156.7 63,337 10 1,788 804 195.7 73,993 9 2,243 1,005 221.8 81,646 8 2,699 1,206 252.4 86,298 7 3,155 1,408 294.6 90,678 6 3,611 1,609 344.9 102,405 5 4,067 1,810 400.7 132,941 4 4,523 2,011 467.5 178,321 3 4,979 2,212 546.0 241,021 2 5,435 2,413 663.3 366,136 1 5,891 2,614 580.3 (use 663.3) 258,851
(1.0 kip = 4.45 kN, 1.0 inch-kip = 0.113 kN-m)
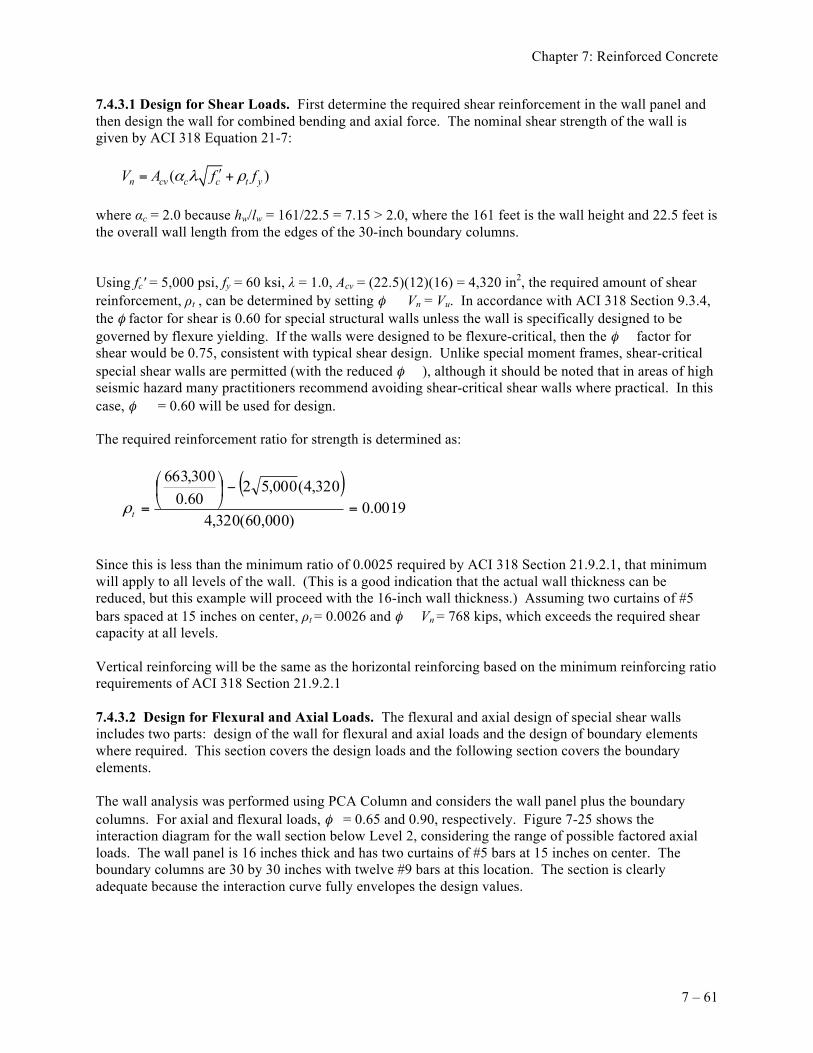
Chapter 7: Reinforced Concrete
7 – 61
7.4.3.1 Design for Shear Loads. First determine the required shear reinforcement in the wall panel and then design the wall for combined bending and axial force. The nominal shear strength of the wall is given by ACI 318 Equation 21-7: ( )n cv c c t yV A f fα λ ρ′= + where αc = 2.0 because hw/lw = 161/22.5 = 7.15 > 2.0, where the 161 feet is the wall height and 22.5 feet is the overall wall length from the edges of the 30-inch boundary columns. Using fc' = 5,000 psi, fy = 60 ksi, λ = 1.0, Acv = (22.5)(12)(16) = 4,320 in2, the required amount of shear reinforcement, ρt , can be determined by setting φ Vn = Vu. In accordance with ACI 318 Section 9.3.4, the φ factor for shear is 0.60 for special structural walls unless the wall is specifically designed to be governed by flexure yielding. If the walls were designed to be flexure-critical, then the φ factor for shear would be 0.75, consistent with typical shear design. Unlike special moment frames, shear-critical special shear walls are permitted (with the reduced φ ), although it should be noted that in areas of high seismic hazard many practitioners recommend avoiding shear-critical shear walls where practical. In this case, φ = 0.60 will be used for design. The required reinforcement ratio for strength is determined as:
( )
0019.0)000,60(320,4
320,4(000,5260.0300,663
=−⎟⎠
⎞⎜⎝
⎛
=tρ
Since this is less than the minimum ratio of 0.0025 required by ACI 318 Section 21.9.2.1, that minimum will apply to all levels of the wall. (This is a good indication that the actual wall thickness can be reduced, but this example will proceed with the 16-inch wall thickness.) Assuming two curtains of #5 bars spaced at 15 inches on center, ρt = 0.0026 and φ Vn = 768 kips, which exceeds the required shear capacity at all levels. Vertical reinforcing will be the same as the horizontal reinforcing based on the minimum reinforcing ratio requirements of ACI 318 Section 21.9.2.1 7.4.3.2 Design for Flexural and Axial Loads. The flexural and axial design of special shear walls includes two parts: design of the wall for flexural and axial loads and the design of boundary elements where required. This section covers the design loads and the following section covers the boundary elements. The wall analysis was performed using PCA Column and considers the wall panel plus the boundary columns. For axial and flexural loads, φ = 0.65 and 0.90, respectively. Figure 7-25 shows the interaction diagram for the wall section below Level 2, considering the range of possible factored axial loads. The wall panel is 16 inches thick and has two curtains of #5 bars at 15 inches on center. The boundary columns are 30 by 30 inches with twelve #9 bars at this location. The section is clearly adequate because the interaction curve fully envelopes the design values.
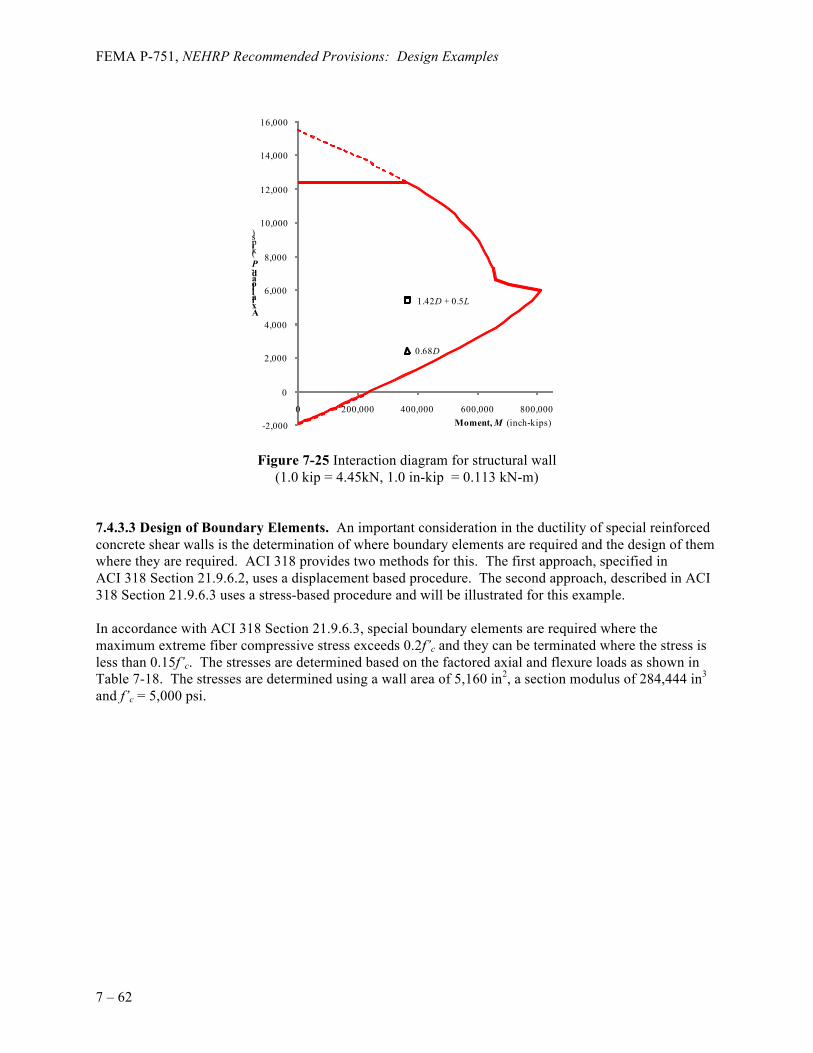
FEMA P-751, NEHRP Recommended Provisions: Design Examples
7 – 62
Figure 7-25 Interaction diagram for structural wall (1.0 kip = 4.45kN, 1.0 in-kip = 0.113 kN-m)
7.4.3.3 Design of Boundary Elements. An important consideration in the ductility of special reinforced concrete shear walls is the determination of where boundary elements are required and the design of them where they are required. ACI 318 provides two methods for this. The first approach, specified in ACI 318 Section 21.9.6.2, uses a displacement based procedure. The second approach, described in ACI 318 Section 21.9.6.3 uses a stress-based procedure and will be illustrated for this example. In accordance with ACI 318 Section 21.9.6.3, special boundary elements are required where the maximum extreme fiber compressive stress exceeds 0.2f’c and they can be terminated where the stress is less than 0.15f’c. The stresses are determined based on the factored axial and flexure loads as shown in Table 7-18. The stresses are determined using a wall area of 5,160 in2, a section modulus of 284,444 in3 and f’c = 5,000 psi.
-2,000
0
2,000
4,000
6,000
8,000
10,000
12,000
14,000
16,000
0 200,000 400,000 600,000 800,000
Axial load, P(kips)
Moment, M (inch-kips)
1.42D + 0.5L
0.68D
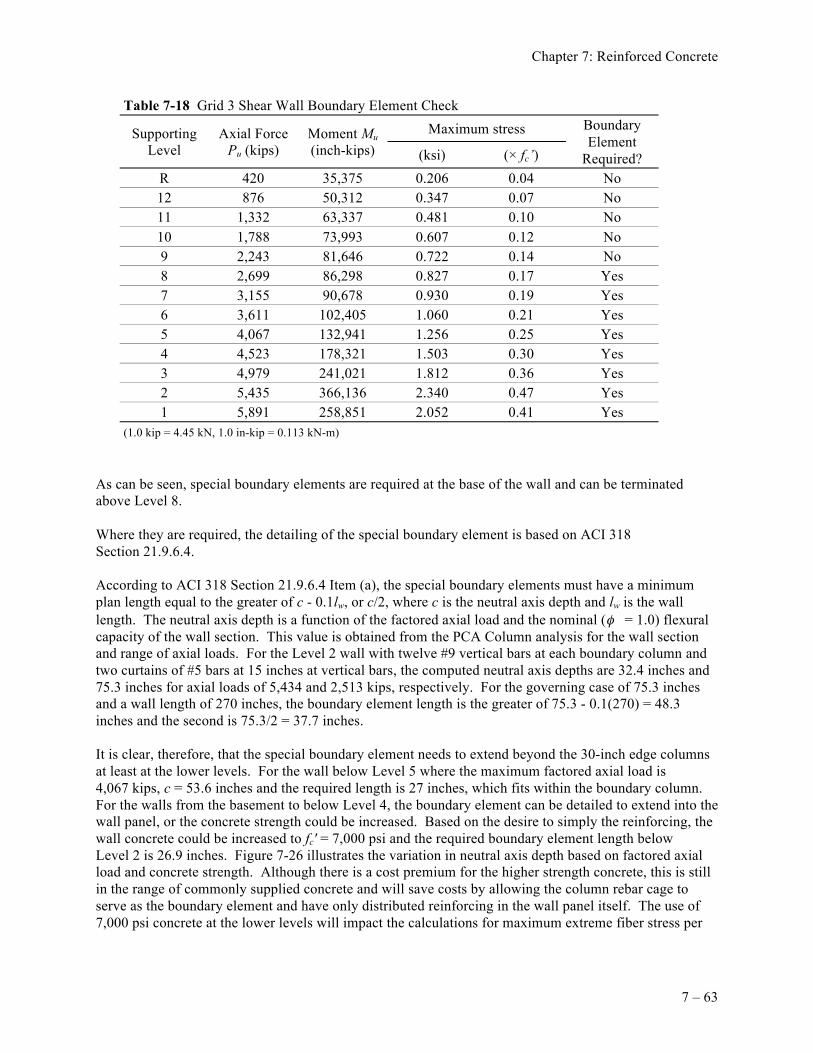
Chapter 7: Reinforced Concrete
7 – 63
Table 7-18 Grid 3 Shear Wall Boundary Element Check
Supporting Level
Axial Force Pu (kips)
Moment Mu (inch-kips)
Maximum stress Boundary Element
Required? (ksi) (× fc’) R 420 35,375 0.206 0.04 No 12 876 50,312 0.347 0.07 No 11 1,332 63,337 0.481 0.10 No 10 1,788 73,993 0.607 0.12 No 9 2,243 81,646 0.722 0.14 No 8 2,699 86,298 0.827 0.17 Yes 7 3,155 90,678 0.930 0.19 Yes 6 3,611 102,405 1.060 0.21 Yes 5 4,067 132,941 1.256 0.25 Yes 4 4,523 178,321 1.503 0.30 Yes 3 4,979 241,021 1.812 0.36 Yes 2 5,435 366,136 2.340 0.47 Yes 1 5,891 258,851 2.052 0.41 Yes
(1.0 kip = 4.45 kN, 1.0 in-kip = 0.113 kN-m) As can be seen, special boundary elements are required at the base of the wall and can be terminated above Level 8. Where they are required, the detailing of the special boundary element is based on ACI 318 Section 21.9.6.4. According to ACI 318 Section 21.9.6.4 Item (a), the special boundary elements must have a minimum plan length equal to the greater of c - 0.1lw, or c/2, where c is the neutral axis depth and lw is the wall length. The neutral axis depth is a function of the factored axial load and the nominal (φ = 1.0) flexural capacity of the wall section. This value is obtained from the PCA Column analysis for the wall section and range of axial loads. For the Level 2 wall with twelve #9 vertical bars at each boundary column and two curtains of #5 bars at 15 inches at vertical bars, the computed neutral axis depths are 32.4 inches and 75.3 inches for axial loads of 5,434 and 2,513 kips, respectively. For the governing case of 75.3 inches and a wall length of 270 inches, the boundary element length is the greater of 75.3 - 0.1(270) = 48.3 inches and the second is 75.3/2 = 37.7 inches. It is clear, therefore, that the special boundary element needs to extend beyond the 30-inch edge columns at least at the lower levels. For the wall below Level 5 where the maximum factored axial load is 4,067 kips, c = 53.6 inches and the required length is 27 inches, which fits within the boundary column. For the walls from the basement to below Level 4, the boundary element can be detailed to extend into the wall panel, or the concrete strength could be increased. Based on the desire to simply the reinforcing, the wall concrete could be increased to fc' = 7,000 psi and the required boundary element length below Level 2 is 26.9 inches. Figure 7-26 illustrates the variation in neutral axis depth based on factored axial load and concrete strength. Although there is a cost premium for the higher strength concrete, this is still in the range of commonly supplied concrete and will save costs by allowing the column rebar cage to serve as the boundary element and have only distributed reinforcing in the wall panel itself. The use of 7,000 psi concrete at the lower levels will impact the calculations for maximum extreme fiber stress per
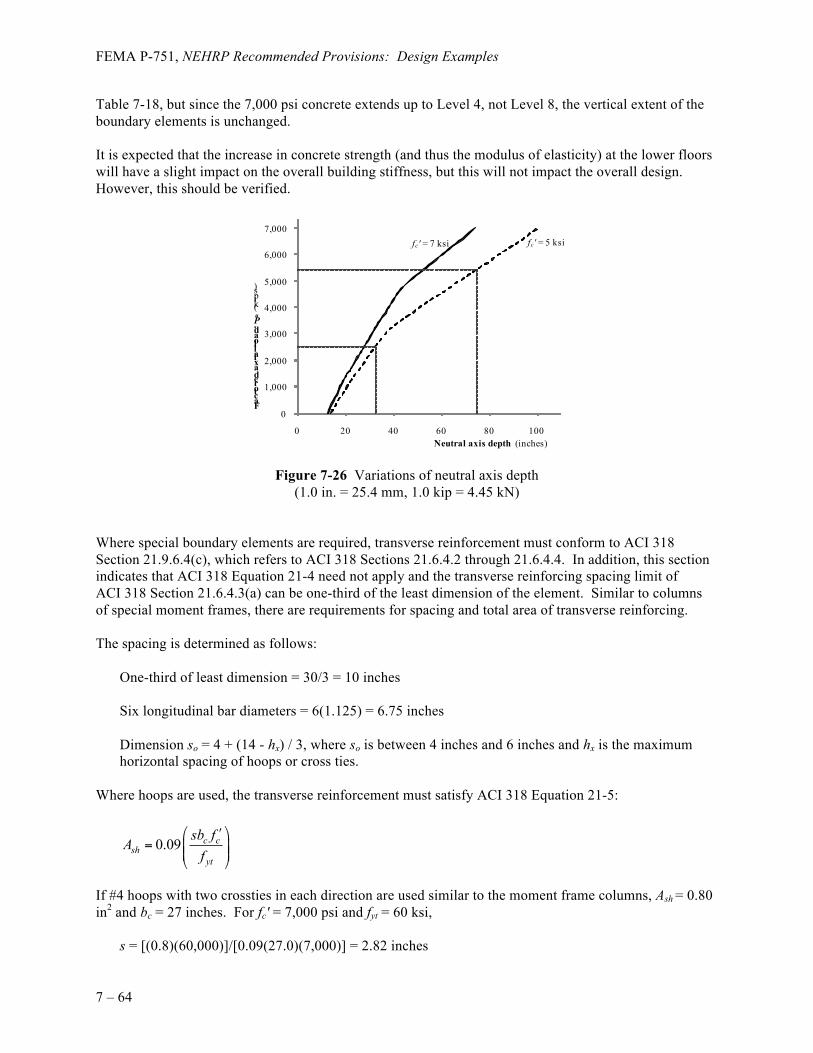
FEMA P-751, NEHRP Recommended Provisions: Design Examples
7 – 64
Table 7-18, but since the 7,000 psi concrete extends up to Level 4, not Level 8, the vertical extent of the boundary elements is unchanged. It is expected that the increase in concrete strength (and thus the modulus of elasticity) at the lower floors will have a slight impact on the overall building stiffness, but this will not impact the overall design. However, this should be verified.
Figure 7-26 Variations of neutral axis depth (1.0 in. = 25.4 mm, 1.0 kip = 4.45 kN)
Where special boundary elements are required, transverse reinforcement must conform to ACI 318 Section 21.9.6.4(c), which refers to ACI 318 Sections 21.6.4.2 through 21.6.4.4. In addition, this section indicates that ACI 318 Equation 21-4 need not apply and the transverse reinforcing spacing limit of ACI 318 Section 21.6.4.3(a) can be one-third of the least dimension of the element. Similar to columns of special moment frames, there are requirements for spacing and total area of transverse reinforcing. The spacing is determined as follows: One-third of least dimension = 30/3 = 10 inches Six longitudinal bar diameters = 6(1.125) = 6.75 inches Dimension so = 4 + (14 - hx) / 3, where so is between 4 inches and 6 inches and hx is the maximum
horizontal spacing of hoops or cross ties. Where hoops are used, the transverse reinforcement must satisfy ACI 318 Equation 21-5:
0.09 c csh
yt
sb fAf
⎛ ⎞′= ⎜ ⎟⎜ ⎟
⎝ ⎠
If #4 hoops with two crossties in each direction are used similar to the moment frame columns, Ash = 0.80 in2 and bc = 27 inches. For fc' = 7,000 psi and fyt = 60 ksi, s = [(0.8)(60,000)]/[0.09(27.0)(7,000)] = 2.82 inches
0
1,000
2,000
3,000
4,000
5,000
6,000
7,000
0 20 40 60 80 100
Factored axial load, Pu(kips)
Neutral axis depth (inches)
fc' = 7 ksi fc' = 5 ksi
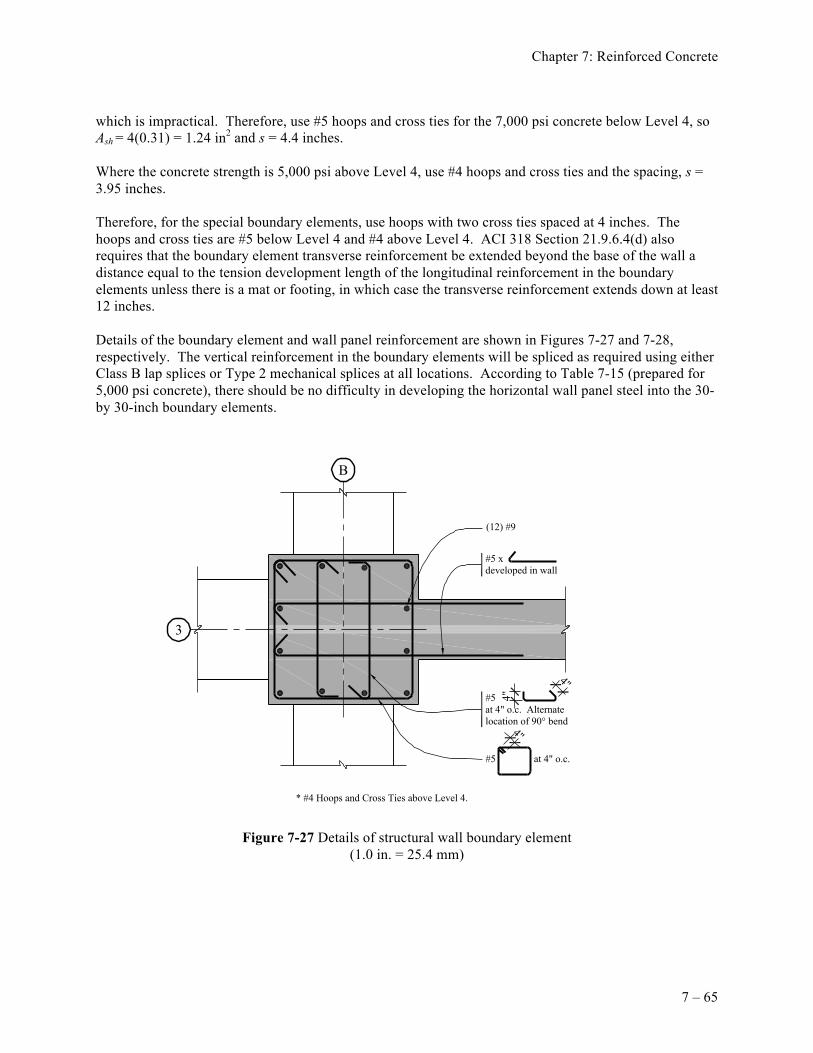
Chapter 7: Reinforced Concrete
7 – 65
which is impractical. Therefore, use #5 hoops and cross ties for the 7,000 psi concrete below Level 4, so Ash = 4(0.31) = 1.24 in2 and s = 4.4 inches. Where the concrete strength is 5,000 psi above Level 4, use #4 hoops and cross ties and the spacing, s = 3.95 inches. Therefore, for the special boundary elements, use hoops with two cross ties spaced at 4 inches. The hoops and cross ties are #5 below Level 4 and #4 above Level 4. ACI 318 Section 21.9.6.4(d) also requires that the boundary element transverse reinforcement be extended beyond the base of the wall a distance equal to the tension development length of the longitudinal reinforcement in the boundary elements unless there is a mat or footing, in which case the transverse reinforcement extends down at least 12 inches. Details of the boundary element and wall panel reinforcement are shown in Figures 7-27 and 7-28, respectively. The vertical reinforcement in the boundary elements will be spliced as required using either Class B lap splices or Type 2 mechanical splices at all locations. According to Table 7-15 (prepared for 5,000 psi concrete), there should be no difficulty in developing the horizontal wall panel steel into the 30- by 30-inch boundary elements.
Figure 7-27 Details of structural wall boundary element (1.0 in. = 25.4 mm)
(12) #9
#5at 4" o.c. Alternatelocation of 90° bend
4"
4"
#5 at 4" o.c.
4"
#5 xdeveloped in wall
B
3
* #4 Hoops and Cross Ties above Level 4.
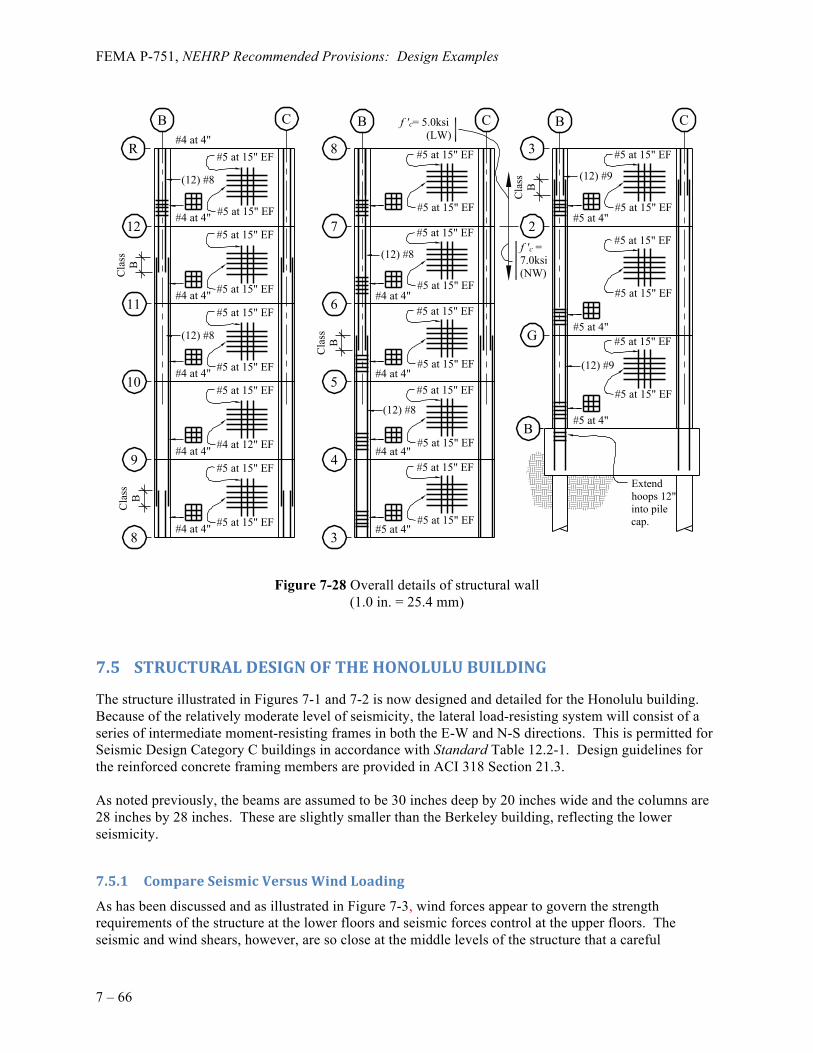
FEMA P-751, NEHRP Recommended Provisions: Design Examples
7 – 66
Figure 7-28 Overall details of structural wall (1.0 in. = 25.4 mm)
The structure illustrated in Figures 7-1 and 7-2 is now designed and detailed for the Honolulu building. Because of the relatively moderate level of seismicity, the lateral load-resisting system will consist of a series of intermediate moment-resisting frames in both the E-W and N-S directions. This is permitted for Seismic Design Category C buildings in accordance with Standard Table 12.2-1. Design guidelines for the reinforced concrete framing members are provided in ACI 318 Section 21.3. As noted previously, the beams are assumed to be 30 inches deep by 20 inches wide and the columns are 28 inches by 28 inches. These are slightly smaller than the Berkeley building, reflecting the lower seismicity.
As has been discussed and as illustrated in Figure 7-3, wind forces appear to govern the strength requirements of the structure at the lower floors and seismic forces control at the upper floors. The seismic and wind shears, however, are so close at the middle levels of the structure that a careful
#5 at 4"
(12) #9
Cla
ss B
Cla
ss B#5 at 4"
#5 at 4"
(12) #9
#4 at 4"
#4 at 4"
#4 at 4"
(12) #8
#5 at 4"
Cla
ss BC
lass B
(12) #8
#5 at 15" EF
#5 at 15" EF
(12) #8
#5 at 15" EF
#5 at 15" EF
#5 at 15" EF
#5 at 15" EF
#5 at 15" EF
#4 at 12" EF
#4 at 4"
#5 at 15" EF
#5 at 15" EF
f 'c =7.0ksi(NW)
f 'c= 5.0ksi(LW)
#4 at 4"
#4 at 4"
#4 at 4"
#4 at 4"
#4 at 4"
B C
R
12
11
10
9
8
B C B C
8
7
6
5
4
3
3
2
G
B
#5 at 15" EF
#5 at 15" EF
#5 at 15" EF
#5 at 15" EF
#5 at 15" EF
#5 at 15" EF
#5 at 15" EF
#5 at 15" EF
#5 at 15" EF
#5 at 15" EF
(12) #8
#5 at 15" EF
#5 at 15" EF
#5 at 15" EF
#5 at 15" EF
#5 at 15" EF
#5 at 15" EF
Extendhoops 12"into pilecap.
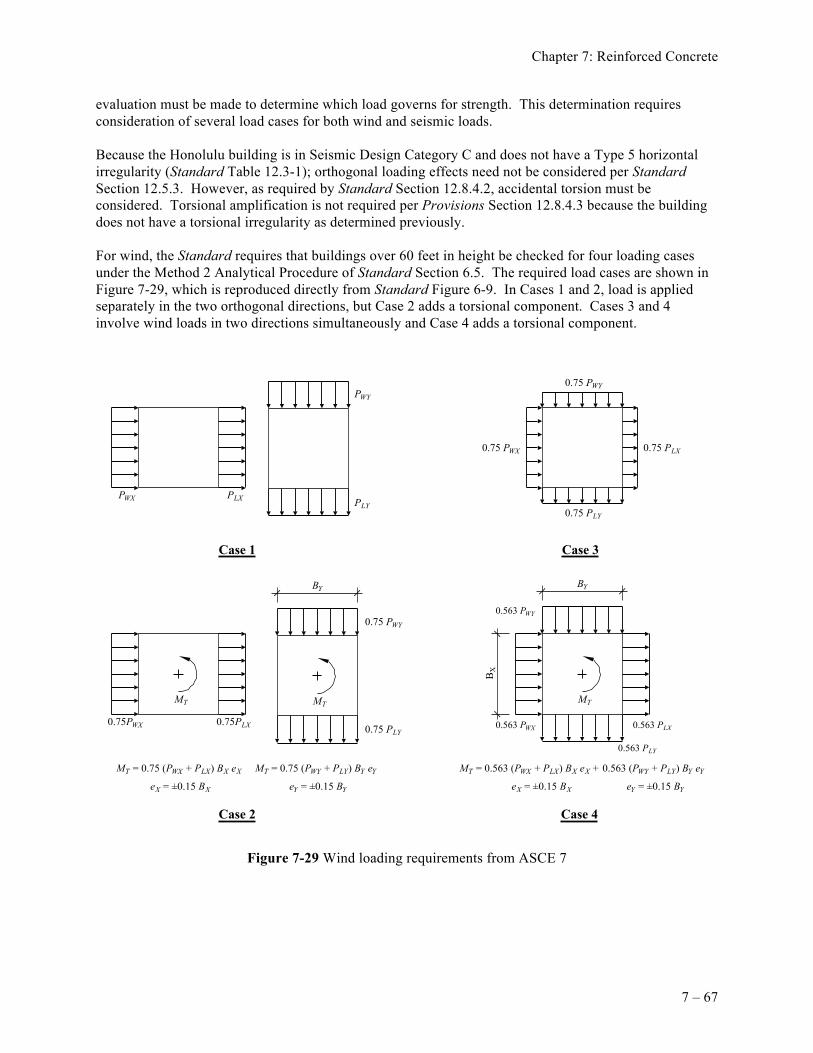
Chapter 7: Reinforced Concrete
7 – 67
evaluation must be made to determine which load governs for strength. This determination requires consideration of several load cases for both wind and seismic loads. Because the Honolulu building is in Seismic Design Category C and does not have a Type 5 horizontal irregularity (Standard Table 12.3-1); orthogonal loading effects need not be considered per Standard Section 12.5.3. However, as required by Standard Section 12.8.4.2, accidental torsion must be considered. Torsional amplification is not required per Provisions Section 12.8.4.3 because the building does not have a torsional irregularity as determined previously. For wind, the Standard requires that buildings over 60 feet in height be checked for four loading cases under the Method 2 Analytical Procedure of Standard Section 6.5. The required load cases are shown in Figure 7-29, which is reproduced directly from Standard Figure 6-9. In Cases 1 and 2, load is applied separately in the two orthogonal directions, but Case 2 adds a torsional component. Cases 3 and 4 involve wind loads in two directions simultaneously and Case 4 adds a torsional component.
Figure 7-29 Wind loading requirements from ASCE 7
PWX PLY
PWY
Case 1
0.75 PLX
Case 3
0.75 PLY
0.75 PWY
0.75 PWX
Case 2 Case 4
PLX
0.75PWX 0.75PLX
MT MT MT
0.75 PWY
0.75 PLY
0.563 PLY
0.563 PLX0.563 PWX
BX
BYBY
0.563 PWY
MT = 0.75 (PWX + PLX) BX eX MT = 0.75 (PWY + PLY) BY eY MT = 0.563 (PWX + PLX) BX eX + 0.563 (PWY + PLY) BY eY
eY = ±0.15 BYe X = ±0.15 B
XeY = ±0.15 BYe X = ±0.15 B
X
FEMA P-751, NEHRP Recommended Provisions: Design Examples
7 – 68
In this example, only loading in the E-W direction is considered. Hence, the following lateral load conditions are applied to the ETABS model: E-W seismic with accidental torsion Wind Case 1 applied in E-W direction only Wind Case 2 applied in E-W direction only Wind Case 3 Wind Case 4 All cases with torsion are applied in such a manner as to maximize the shears in the elements of Frame 1, for whose members the design is illustrated in the following section. A simple method for determining which load case is likely to govern is to compare the beam shears for each story. For the five load cases indicated above, the beam shears produced from seismic effects control at the sixth level, with the next largest forces coming from direct E-W wind Case 1. This is shown graphically in Figure 7-30, where the beam shears at the center bay of Frame 1 are plotted versus story height. Note that this comparison is based on 1.0 times seismic loads and 1.6 times wind loads consistent with the strength design load combinations. Wind controls load at the lower four stories and seismic controls for all other stories. This is somewhat different from that shown in Figure 7-3, wherein the total story shears are plotted and where wind controlled for the lower five stories. A basic difference between Figures 7-3 and 7-30 is that Figure 7-30 includes torsion effects.
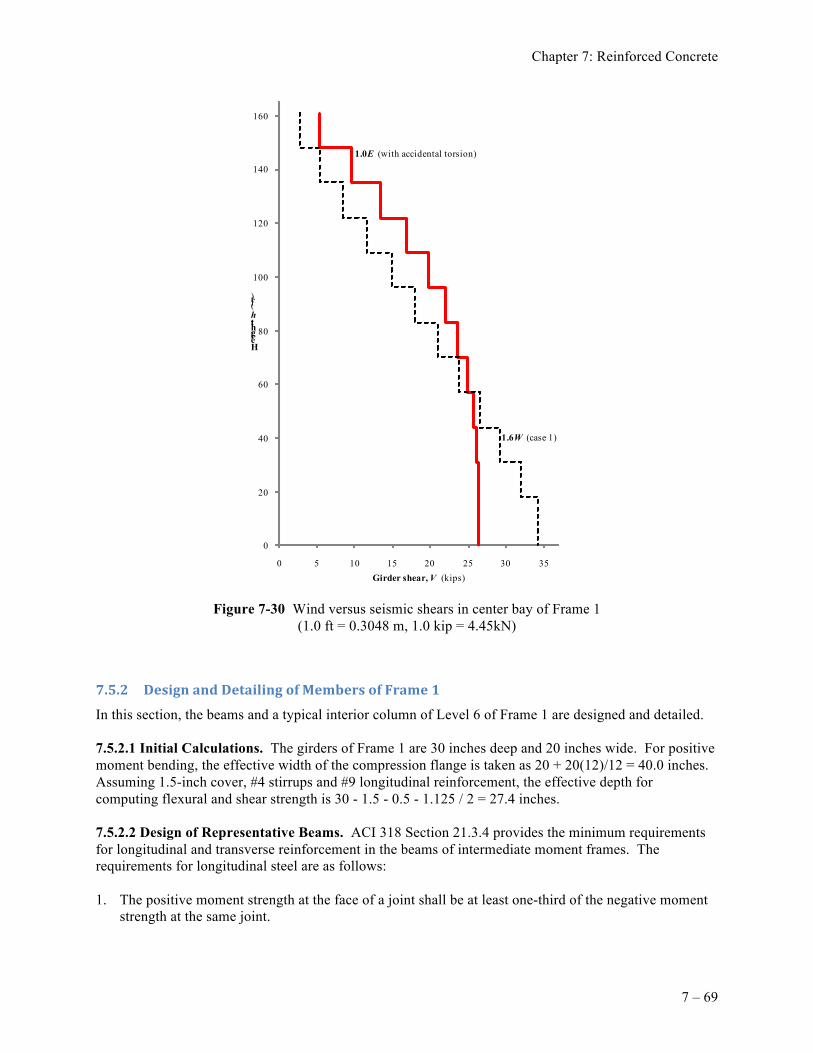
Chapter 7: Reinforced Concrete
7 – 69
Figure 7-30 Wind versus seismic shears in center bay of Frame 1 (1.0 ft = 0.3048 m, 1.0 kip = 4.45kN)
In this section, the beams and a typical interior column of Level 6 of Frame 1 are designed and detailed. 7.5.2.1 Initial Calculations. The girders of Frame 1 are 30 inches deep and 20 inches wide. For positive moment bending, the effective width of the compression flange is taken as 20 + 20(12)/12 = 40.0 inches. Assuming 1.5-inch cover, #4 stirrups and #9 longitudinal reinforcement, the effective depth for computing flexural and shear strength is 30 - 1.5 - 0.5 - 1.125 / 2 = 27.4 inches. 7.5.2.2 Design of Representative Beams. ACI 318 Section 21.3.4 provides the minimum requirements for longitudinal and transverse reinforcement in the beams of intermediate moment frames. The requirements for longitudinal steel are as follows: 1. The positive moment strength at the face of a joint shall be at least one-third of the negative moment
strength at the same joint.
0
20
40
60
80
100
120
140
160
0 5 10 15 20 25 30 35
Height, h(ft)
Girder shear, V (kips)
1.0E (with accidental torsion)
1.6W (case 1)
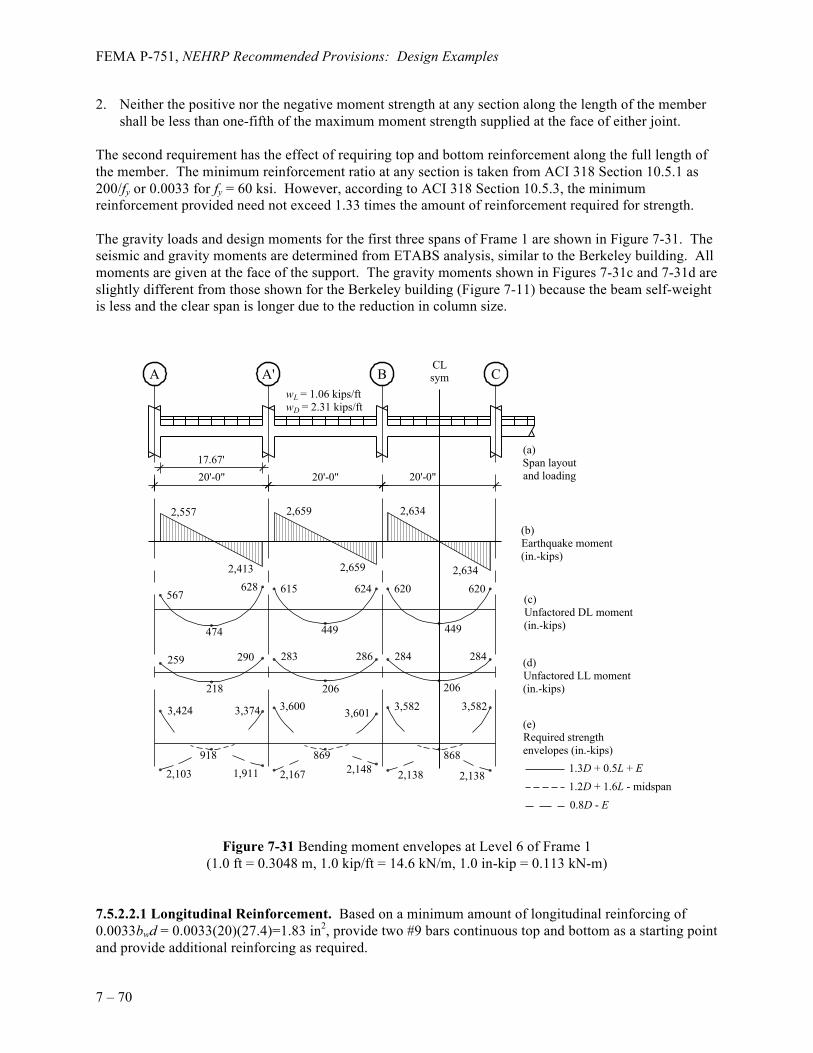
FEMA P-751, NEHRP Recommended Provisions: Design Examples
7 – 70
2. Neither the positive nor the negative moment strength at any section along the length of the member shall be less than one-fifth of the maximum moment strength supplied at the face of either joint.
The second requirement has the effect of requiring top and bottom reinforcement along the full length of the member. The minimum reinforcement ratio at any section is taken from ACI 318 Section 10.5.1 as 200/fy or 0.0033 for fy = 60 ksi. However, according to ACI 318 Section 10.5.3, the minimum reinforcement provided need not exceed 1.33 times the amount of reinforcement required for strength. The gravity loads and design moments for the first three spans of Frame 1 are shown in Figure 7-31. The seismic and gravity moments are determined from ETABS analysis, similar to the Berkeley building. All moments are given at the face of the support. The gravity moments shown in Figures 7-31c and 7-31d are slightly different from those shown for the Berkeley building (Figure 7-11) because the beam self-weight is less and the clear span is longer due to the reduction in column size.
Figure 7-31 Bending moment envelopes at Level 6 of Frame 1 (1.0 ft = 0.3048 m, 1.0 kip/ft = 14.6 kN/m, 1.0 in-kip = 0.113 kN-m)
7.5.2.2.1 Longitudinal Reinforcement. Based on a minimum amount of longitudinal reinforcing of 0.0033bwd = 0.0033(20)(27.4)=1.83 in2, provide two #9 bars continuous top and bottom as a starting point and provide additional reinforcing as required.
(a)Span layoutand loading
(b)Earthquake moment(in.-kips)
(c)Unfactored DL moment(in.-kips)
(d)Unfactored LL moment(in.-kips)
(e)Required strengthenvelopes (in.-kips)
17.67'20'-0" 20'-0" 20'-0"
2,557 2,659 2,634
2,6592,413628
567 615 624 620 6202,634
449
284284286
449
283290
474
259
218
3,424 3,374 3,600206
3,601 3,582
206
3,582
868
2,1382,1382,148869
2,1671,911918
2,103
0.8D - E1.2D + 1.6L - midspan1.3D + 0.5L + E
A A' B CCLsym
w L = 1.06 kips/ft
w D = 2.31 kips/ft
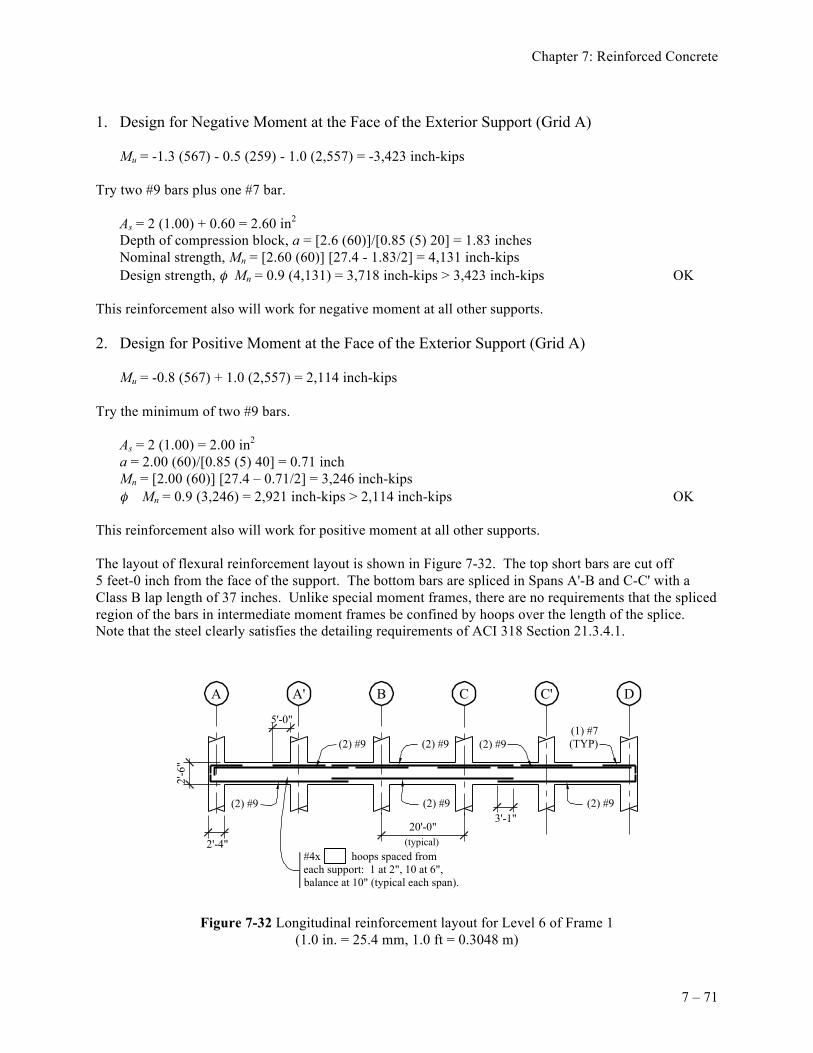
Chapter 7: Reinforced Concrete
7 – 71
1. Design for Negative Moment at the Face of the Exterior Support (Grid A) Mu = -1.3 (567) - 0.5 (259) - 1.0 (2,557) = -3,423 inch-kips Try two #9 bars plus one #7 bar. As = 2 (1.00) + 0.60 = 2.60 in2 Depth of compression block, a = [2.6 (60)]/[0.85 (5) 20] = 1.83 inches Nominal strength, Mn = [2.60 (60)] [27.4 - 1.83/2] = 4,131 inch-kips Design strength, φ Mn = 0.9 (4,131) = 3,718 inch-kips > 3,423 inch-kips OK This reinforcement also will work for negative moment at all other supports. 2. Design for Positive Moment at the Face of the Exterior Support (Grid A) Mu = -0.8 (567) + 1.0 (2,557) = 2,114 inch-kips Try the minimum of two #9 bars. As = 2 (1.00) = 2.00 in2 a = 2.00 (60)/[0.85 (5) 40] = 0.71 inch Mn = [2.00 (60)] [27.4 – 0.71/2] = 3,246 inch-kips φ Mn = 0.9 (3,246) = 2,921 inch-kips > 2,114 inch-kips OK This reinforcement also will work for positive moment at all other supports. The layout of flexural reinforcement layout is shown in Figure 7-32. The top short bars are cut off 5 feet-0 inch from the face of the support. The bottom bars are spliced in Spans A'-B and C-C' with a Class B lap length of 37 inches. Unlike special moment frames, there are no requirements that the spliced region of the bars in intermediate moment frames be confined by hoops over the length of the splice. Note that the steel clearly satisfies the detailing requirements of ACI 318 Section 21.3.4.1.
Figure 7-32 Longitudinal reinforcement layout for Level 6 of Frame 1 (1.0 in. = 25.4 mm, 1.0 ft = 0.3048 m)
(2) #9
20'-0"
2'-6
"
2'-4"
3'-1"
#4x hoops spaced fromeach support: 1 at 2", 10 at 6",balance at 10" (typical each span).
(2) #9 (2) #9(2) #9
(2) #9 (2) #9(1) #7(TYP)
5'-0"
(typical)
A A' B C C' D
FEMA P-751, NEHRP Recommended Provisions: Design Examples
7 – 72
7.5.2.2.2 Transverse Reinforcement. The requirements for transverse reinforcement in intermediate moment frames are somewhat different from those in special moment frames, both in terms of detailing and shear design. The shear strength requirements will be covered first, followed by the detailing requirements. In accordance with ACI 318 Section 21.3.3, the design earthquake shear for the design of intermediate moment frame beams must be larger than the smaller of the following:
a. The sum of the shears associated with the nominal moment strength at the ends of the members. Nominal moment strengths are computed with a flexural reinforcement tensile strength of 1.0fy and a flexural φ factor of 1.0.
b. Two times the factored earthquake shear force determined from the structural analysis.
In either case, the earthquake shears are combined with the factored gravity shears to determine the total design shear. Consider the end span between Grids A and A’. For determining earthquake shears per Item a above, the nominal strengths at the ends of the beam were computed earlier as 3,246 inch-kips for positive moment at Support A’ and 4,131 inch-kips for negative moment at Support A. Compute the design earthquake shear VE:
kips 8.34212
131,4246,3=
+=EV
where 212 inches is the clear span of the member. The shear is the same for earthquake forces acting in the other direction. For determining earthquake shears per Item b above, the shear is taken from the ETABS analysis as 23.4 kips. The design earthquake shear for this method is 2(23.4 kips) = 46.8 kips. Since the design shear using Item a is the smaller value, it is used for computing the design shear. The gravity load shears are taken from the ETABS model. Since the gravity shears at Grid A’ are similar but slightly larger than those at Grid A, Grid A’ will be used for the design. From the ETABS analysis, VD = 20.7 kips and VL = 9.5 kips. The factored design shear Vu = 1.3(20.7) + 0.5(9.5) + 1.0(46.8) = 66.5 kips. This shear force applies for earthquake forces coming from either direction as shown in the shear strength design envelope in Figure 7-33. The design shear force is resisted by a concrete component, Vc and a steel component, Vs. Note that the concrete component may be used regardless of the ratio of earthquake shear to total shear. The required design strength is: Vu ≤ φ Vc + φ Vs where φ = 0.75 for shear.
Chapter 7: Reinforced Concrete
7 – 73
kips 5.77000,1
)4.27)(20(000,52==cV
The shear to be resisted by reinforcing steel, assuming two #4 vertical legs (Av = 0.4) and fy = 60 ksi is:
kips 2.1175.0
)5.77(75.05.66=
−=
−=
φφ cu
sVVV
Using Vs = Av fyd/s:
inches 7.582.11
)4.27)(60)(4.0(==s
Minimum transverse steel requirements are given in ACI 318 Section 21.3.4.2. At the ends of the beam, hoops are required. The first hoop must be placed 2 inches from the face of the support and within a distance 2h from the face of the support, the spacing should be not greater than d/4, eight times the smallest longitudinal bar diameter, 24 times the hip bar diameter, or 12 inches. For the beam under consideration d/4 controls minimum transverse steel, with the maximum spacing being 27.4/4 = 6.8 inches, which is less than what is required for shear strength. In the remainder of the span, stirrups are permitted and must be placed at a maximum of d/2 (ACI 318 Sec. 21.3.4.3). Because the earthquake shear (at midspan where the gravity shear is essentially zero) is greater than 50 percent of the shear strength provided by concrete alone, the minimum requirements of ACI 318 Section 11.4.6.1 must be checked:
inches 8.20)20(000,575.0
)000,60(4.075.0 'max ===
wc
ytv
bf
fAs
This spacing does not control over the d/2 requirement. The layout of transverse reinforcement for the beam is shown in Figure 7-32. This spacing is used for all other spans as well.
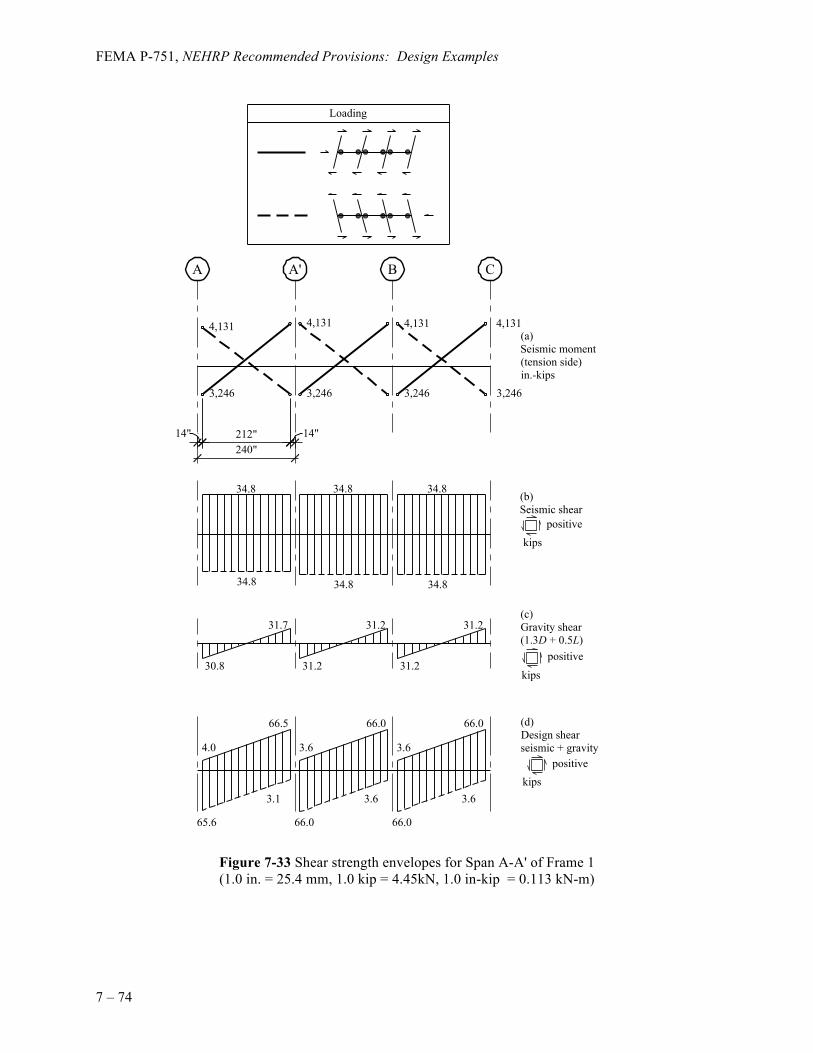
FEMA P-751, NEHRP Recommended Provisions: Design Examples
7 – 74
Figure 7-33 Shear strength envelopes for Span A-A' of Frame 1 (1.0 in. = 25.4 mm, 1.0 kip = 4.45kN, 1.0 in-kip = 0.113 kN-m)
(a)Seismic moment(tension side)in.-kips
(b)Seismic shear
(c)Gravity shear(1.3D + 0.5L)
(d)Design shearseismic + gravity
212"240"
A A' B C
4,131 4,131 4,131 4,131
3,2463,2463,2463,246
34.834.834.8
34.8 34.8 34.8
31.7
30.8 31.2
31.2
31.2
31.2
66.0
3.6
66.0
3.6
66.5
4.0
65.6
3.1
66.0
3.6
66.0
3.6
positivekips
positive
kips
positivekips
Loading
14" 14"
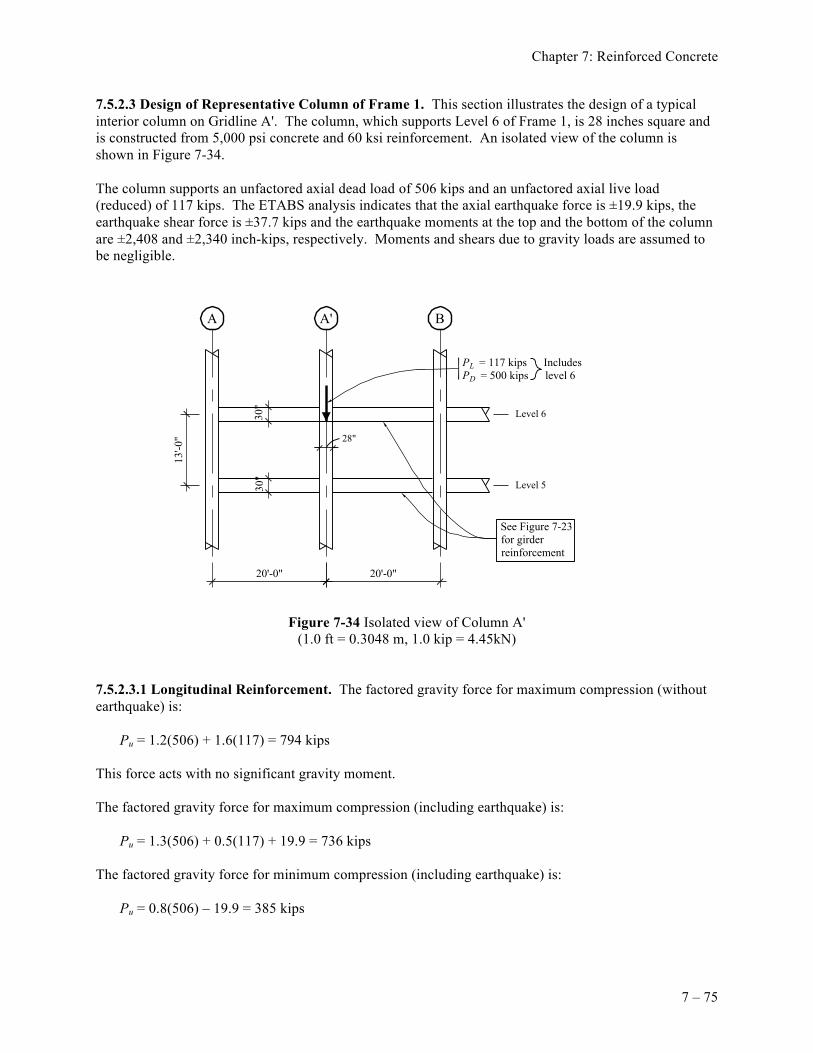
Chapter 7: Reinforced Concrete
7 – 75
7.5.2.3 Design of Representative Column of Frame 1. This section illustrates the design of a typical interior column on Gridline A'. The column, which supports Level 6 of Frame 1, is 28 inches square and is constructed from 5,000 psi concrete and 60 ksi reinforcement. An isolated view of the column is shown in Figure 7-34. The column supports an unfactored axial dead load of 506 kips and an unfactored axial live load (reduced) of 117 kips. The ETABS analysis indicates that the axial earthquake force is ±19.9 kips, the earthquake shear force is ±37.7 kips and the earthquake moments at the top and the bottom of the column are ±2,408 and ±2,340 inch-kips, respectively. Moments and shears due to gravity loads are assumed to be negligible.
Figure 7-34 Isolated view of Column A' (1.0 ft = 0.3048 m, 1.0 kip = 4.45kN)
7.5.2.3.1 Longitudinal Reinforcement. The factored gravity force for maximum compression (without earthquake) is: Pu = 1.2(506) + 1.6(117) = 794 kips This force acts with no significant gravity moment. The factored gravity force for maximum compression (including earthquake) is: Pu = 1.3(506) + 0.5(117) + 19.9 = 736 kips The factored gravity force for minimum compression (including earthquake) is: Pu = 0.8(506) – 19.9 = 385 kips
20'-0" 20'-0"
13'-0
"
30"
30"
28"
See Figure 7-23for girderreinforcement
PL = 117 kips IncludesPD = 500 kips level 6
A A' B
Level 6
Level 5
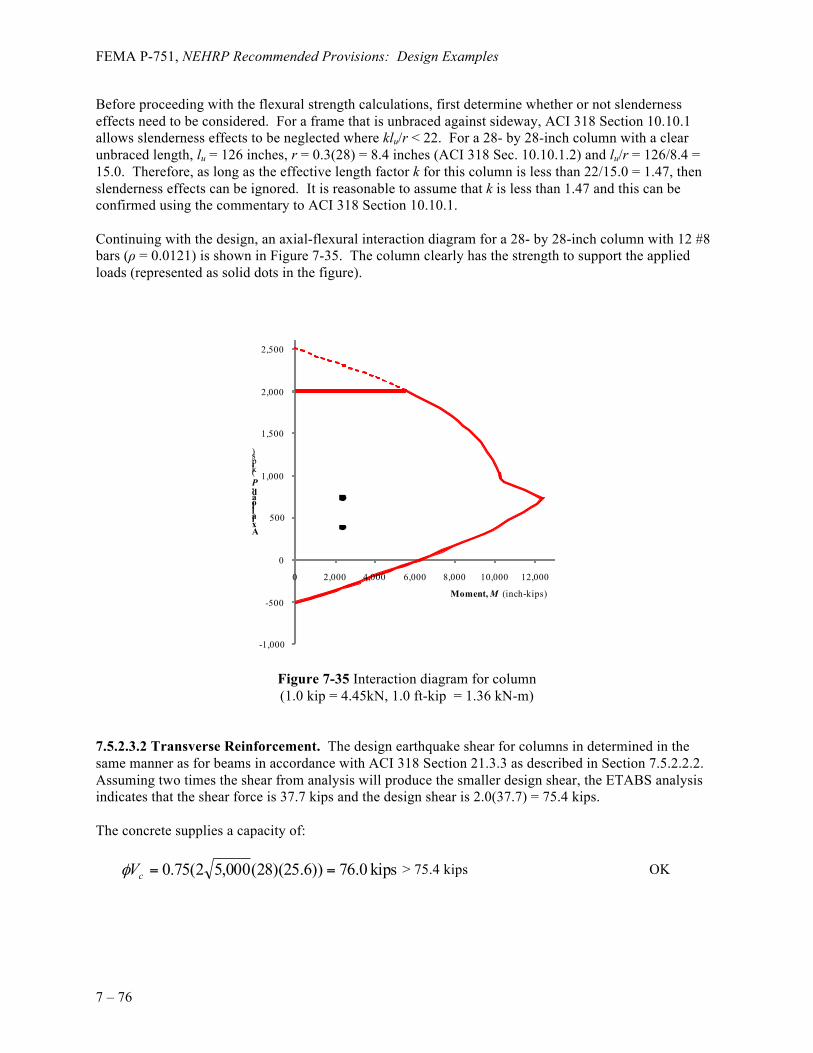
FEMA P-751, NEHRP Recommended Provisions: Design Examples
7 – 76
Before proceeding with the flexural strength calculations, first determine whether or not slenderness effects need to be considered. For a frame that is unbraced against sideway, ACI 318 Section 10.10.1 allows slenderness effects to be neglected where klu/r < 22. For a 28- by 28-inch column with a clear unbraced length, lu = 126 inches, r = 0.3(28) = 8.4 inches (ACI 318 Sec. 10.10.1.2) and lu/r = 126/8.4 = 15.0. Therefore, as long as the effective length factor k for this column is less than 22/15.0 = 1.47, then slenderness effects can be ignored. It is reasonable to assume that k is less than 1.47 and this can be confirmed using the commentary to ACI 318 Section 10.10.1. Continuing with the design, an axial-flexural interaction diagram for a 28- by 28-inch column with 12 #8 bars (ρ = 0.0121) is shown in Figure 7-35. The column clearly has the strength to support the applied loads (represented as solid dots in the figure).
Figure 7-35 Interaction diagram for column (1.0 kip = 4.45kN, 1.0 ft-kip = 1.36 kN-m)
7.5.2.3.2 Transverse Reinforcement. The design earthquake shear for columns in determined in the same manner as for beams in accordance with ACI 318 Section 21.3.3 as described in Section 7.5.2.2.2. Assuming two times the shear from analysis will produce the smaller design shear, the ETABS analysis indicates that the shear force is 37.7 kips and the design shear is 2.0(37.7) = 75.4 kips. The concrete supplies a capacity of: kips 0.76))6.25)(28(000,52(75.0 ==cVφ > 75.4 kips OK
-1,000
-500
0
500
1,000
1,500
2,000
2,500
0 2,000 4,000 6,000 8,000 10,000 12,000
Axial load, P(kips)
Moment, M (inch-kips)
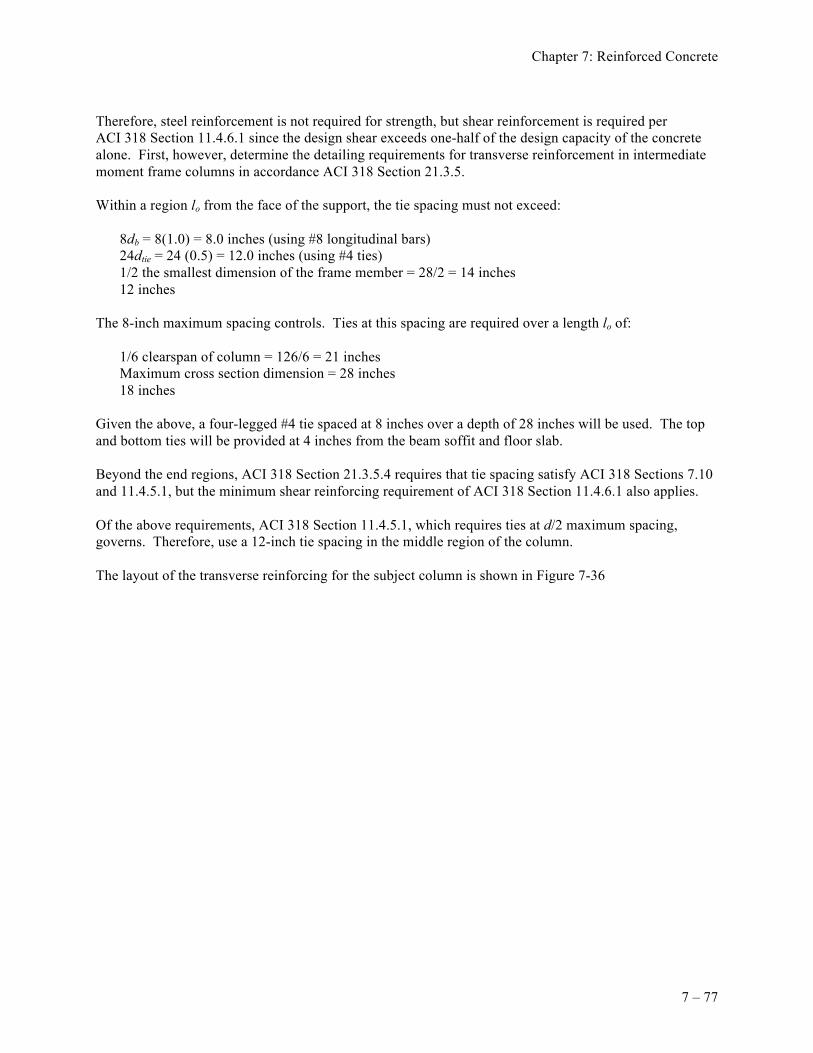
Chapter 7: Reinforced Concrete
7 – 77
Therefore, steel reinforcement is not required for strength, but shear reinforcement is required per ACI 318 Section 11.4.6.1 since the design shear exceeds one-half of the design capacity of the concrete alone. First, however, determine the detailing requirements for transverse reinforcement in intermediate moment frame columns in accordance ACI 318 Section 21.3.5. Within a region lo from the face of the support, the tie spacing must not exceed: 8db = 8(1.0) = 8.0 inches (using #8 longitudinal bars) 24dtie = 24 (0.5) = 12.0 inches (using #4 ties) 1/2 the smallest dimension of the frame member = 28/2 = 14 inches 12 inches The 8-inch maximum spacing controls. Ties at this spacing are required over a length lo of: 1/6 clearspan of column = 126/6 = 21 inches Maximum cross section dimension = 28 inches 18 inches Given the above, a four-legged #4 tie spaced at 8 inches over a depth of 28 inches will be used. The top and bottom ties will be provided at 4 inches from the beam soffit and floor slab. Beyond the end regions, ACI 318 Section 21.3.5.4 requires that tie spacing satisfy ACI 318 Sections 7.10 and 11.4.5.1, but the minimum shear reinforcing requirement of ACI 318 Section 11.4.6.1 also applies. Of the above requirements, ACI 318 Section 11.4.5.1, which requires ties at d/2 maximum spacing, governs. Therefore, use a 12-inch tie spacing in the middle region of the column. The layout of the transverse reinforcing for the subject column is shown in Figure 7-36
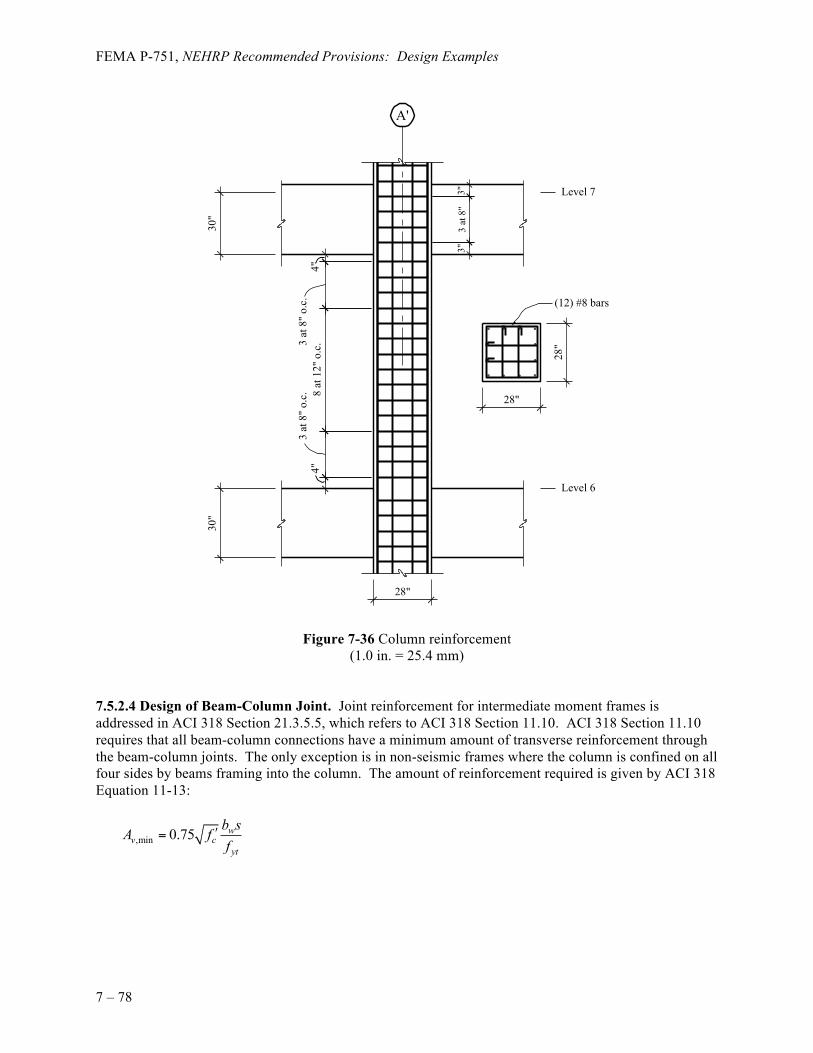
FEMA P-751, NEHRP Recommended Provisions: Design Examples
7 – 78
Figure 7-36 Column reinforcement (1.0 in. = 25.4 mm)
7.5.2.4 Design of Beam-Column Joint. Joint reinforcement for intermediate moment frames is addressed in ACI 318 Section 21.3.5.5, which refers to ACI 318 Section 11.10. ACI 318 Section 11.10 requires that all beam-column connections have a minimum amount of transverse reinforcement through the beam-column joints. The only exception is in non-seismic frames where the column is confined on all four sides by beams framing into the column. The amount of reinforcement required is given by ACI 318 Equation 11-13:
,min 0.75 wv c
yt
b sA ff
′=
Level 7
Level 6
28"
30"
30"
28"
28"
(12) #8 bars8
at 1
2" o
.c.
4"4"
3"3
at 8
"3"
3 at
8" o
.c.
3 at
8" o
.c.
A'
Chapter 7: Reinforced Concrete
7 – 79
This is the same equation used to proportion minimum transverse reinforcement in beams. Assuming Av is supplied by four #4 ties and fy = 60 ksi:
( )( )( )
==28000,575.0
000,602.04s 32.4 inches
This essentially permits no ties to be located in the joint. Since it is good practice to provide transverse reinforcing in moment frame joints, ties will be provided at the same 8-inch spacing as at the ends of the columns. The arrangement of ties within the beam-column joint is shown in Figure 7-36.