Embed Size (px)
Citation preview

Fertiliser usage and the mineral requirements of grazing livestock
By R G Hemingway and JJ Parkins CONTENTS ABSTRACT 4 1.INTRODUCTION 4 2. STAGE OF HERBAGE MATURITY AND CRUDE PROTEIN-ASSOCIATED EFFECTS 5 2.1. Seasonal changes in rotationally grazed herbage 6 2.2. Crude protein and phosphorus relationships 7 2.3. Direct effects of phosphorus fertilisers 8 2.4. Satisfying the phosphorus needs of lactating cows 9 3. EFFECTS OF POTASSIUM ON MAJOR MINERAL CONCENTRATIONS 13 3.1. Slurry effects 14 4. MAGNESIUM FERTILISATION 16 4.1. Calcined magnesite and magnesium limestone 16 4.2. Magnesium sulphate 17 4.3. Magnesium contents of silages and hay 18 5. CALCIUM CONTENT OF HERBAGE, SILAGES AND HAY 18 6. SODIUM FERTILISERS 19 7. FERTILISERS AND HYPOMAGNESAEMIA 19 7.1. Sodium fertiliser effects 22 7.2. Alternative magnesium strategies for cows at grass 24 8. TRACE ELEMENT CONTENTS 26 9. SUSTAINABILITY OF HIGH NITROGEN FERTILISER INPUTS FOR DAIRY COWS 28 10. REFERENCES 30 Keywords: NPK fertilisers, Herbage, Cattle, Major mineral requirements, Crude protein/phosphorus correlations, Hypomagnesaemia. ABSTRACT Nitrogen fertiliser consistently increases phosphorus, magnesium, potassium, sodium and calcium contents of growing herbage but towards maturity both crude protein and phosphorus contents decline in parallel. Fertiliser nitrogen has a larger positive effect than fertiliser phosphorus on herbage phosphorus contents. Any enforced reduction in nitrogen fertiliser use could have serious implications for the phosphorus intake of grazing cattle. Any proposed reduction in dietary phosphorus intake by high yielding dairy cows to below currently advised amounts requires
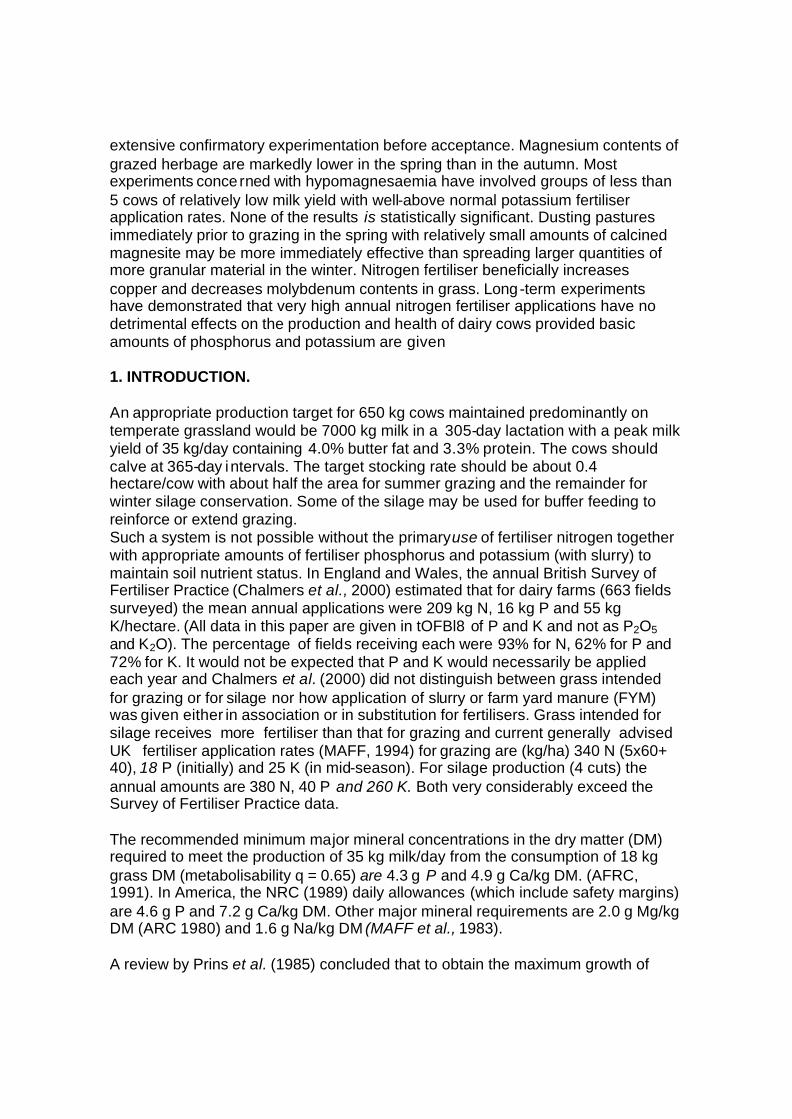
extensive confirmatory experimentation before acceptance. Magnesium contents of grazed herbage are markedly lower in the spring than in the autumn. Most experiments concerned with hypomagnesaemia have involved groups of less than 5 cows of relatively low milk yield with well-above normal potassium fertiliser application rates. None of the results is statistically significant. Dusting pastures immediately prior to grazing in the spring with relatively small amounts of calcined magnesite may be more immediately effective than spreading larger quantities of more granular material in the winter. Nitrogen fertiliser beneficially increases copper and decreases molybdenum contents in grass. Long-term experiments have demonstrated that very high annual nitrogen fertiliser applications have no detrimental effects on the production and health of dairy cows provided basic amounts of phosphorus and potassium are given 1. INTRODUCTION. An appropriate production target for 650 kg cows maintained predominantly on temperate grassland would be 7000 kg milk in a 305-day lactation with a peak milk yield of 35 kg/day containing 4.0% butter fat and 3.3% protein. The cows should calve at 365-day intervals. The target stocking rate should be about 0.4 hectare/cow with about half the area for summer grazing and the remainder for winter silage conservation. Some of the silage may be used for buffer feeding to reinforce or extend grazing. Such a system is not possible without the primary use of fertiliser nitrogen together with appropriate amounts of fertiliser phosphorus and potassium (with slurry) to maintain soil nutrient status. In England and Wales, the annual British Survey of Fertiliser Practice (Chalmers et al., 2000) estimated that for dairy farms (663 fields surveyed) the mean annual applications were 209 kg N, 16 kg P and 55 kg K/hectare. (All data in this paper are given in tOFBl8 of P and K and not as P2O5 and K2O). The percentage of fields receiving each were 93% for N, 62% for P and 72% for K. It would not be expected that P and K would necessarily be applied each year and Chalmers et al. (2000) did not distinguish between grass intended for grazing or for silage nor how application of slurry or farm yard manure (FYM) was given either in association or in substitution for fertilisers. Grass intended for silage receives more fertiliser than that for grazing and current generally advised UK fertiliser application rates (MAFF, 1994) for grazing are (kg/ha) 340 N (5x60+ 40), 18 P (initially) and 25 K (in mid-season). For silage production (4 cuts) the annual amounts are 380 N, 40 P and 260 K. Both very considerably exceed the Survey of Fertiliser Practice data. The recommended minimum major mineral concentrations in the dry matter (DM) required to meet the production of 35 kg milk/day from the consumption of 18 kg grass DM (metabolisability q = 0.65) are 4.3 g P and 4.9 g Ca/kg DM. (AFRC, 1991). In America, the NRC (1989) daily allowances (which include safety margins) are 4.6 g P and 7.2 g Ca/kg DM. Other major mineral requirements are 2.0 g Mg/kg DM (ARC 1980) and 1.6 g Na/kg DM (MAFF et al., 1983). A review by Prins et al. (1985) concluded that to obtain the maximum growth of

grazed herbage (typically consumed on a 21-day re-grazing cycle) with about 250 g crude protein (CP, = total N x 6.25) per kg DM requires P and K concentrations of 4.8 and 35.0 g/kg DM respectively. For grass silage with 150 g CP/kg DM the required optimum concentrations for growth are lower at 3.6 g P and 27.0 g K/kg DM. The literature for the past 50 years regarding the effects of N, P; K and Mg-containing fertilisers, lime and animal slurries on the major mineral composition of herbage has recently been summarised (Hemingway, 1999). This present communication details the principal practical conclusions in the light of current fertiliser practice and comments on the possible consequences for animal health which may be occasioned by potential environmental considerations and restrictions. Reference is also made on the effects of fertilisers on trace element contents of herbage in relation to the needs of ruminants. 2. STAGE OF HERBAGE MATURITY AND CRUDE PROTEIN ASSOCIATED EFFECTS. Large changes in the major mineral composition of herbage are associated with advancing maturity and differential nitrogen applications. Hunt (1973) applied three different rates of N (59, ll8 or 177 kg N/ha) to perennial ryegrass as single dressings in the spring and assessed changes in crude protein (CP) at intervals from 8-57 days of primary growth. Table 1 (overleaf) presents data for the 59 and 177 kg applications only as those for the ll8 kg rate were intermediate throughout. For CP, P, Ca, and Mg the higher rate always increased concentrations above that of the lower rate with the peak amounts being recorded after 12 days followed by steady declines particularly after 29 days. Potassium concentrations peaked later at 23 days. The higher rate of nitrogen application also increased Na levels throughout but these only reached their highest values after 45 days. Table 1: Mean concentrations (glkg DM) of crude protein (CP) and minerals in growing herbage as influenced by nitrogen fertiliser application rate (Hunt, 1973). N1: 57 kg N; N3: 177 kg Nlha.
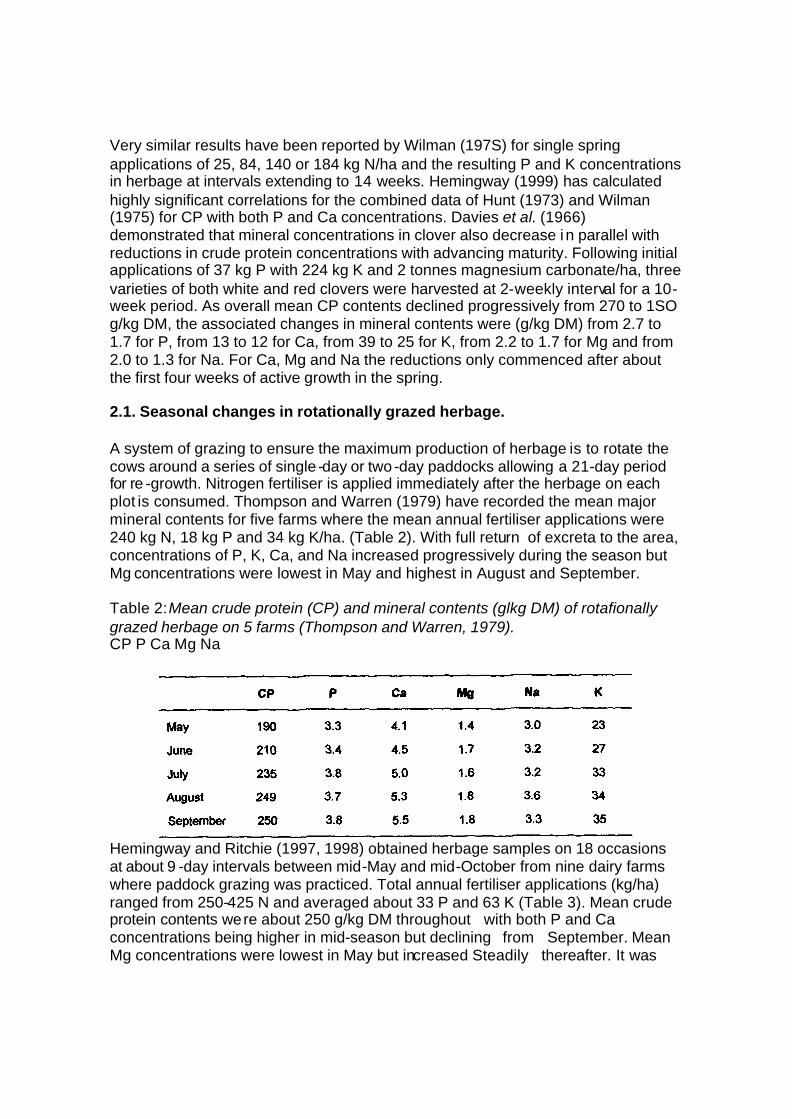
Very similar results have been reported by Wilman (197S) for single spring applications of 25, 84, 140 or 184 kg N/ha and the resulting P and K concentrations in herbage at intervals extending to 14 weeks. Hemingway (1999) has calculated highly significant correlations for the combined data of Hunt (1973) and Wilman (1975) for CP with both P and Ca concentrations. Davies et al. (1966) demonstrated that mineral concentrations in clover also decrease i n parallel with reductions in crude protein concentrations with advancing maturity. Following initial applications of 37 kg P with 224 kg K and 2 tonnes magnesium carbonate/ha, three varieties of both white and red clovers were harvested at 2-weekly interval for a 10-week period. As overall mean CP contents declined progressively from 270 to 1SO g/kg DM, the associated changes in mineral contents were (g/kg DM) from 2.7 to 1.7 for P, from 13 to 12 for Ca, from 39 to 25 for K, from 2.2 to 1.7 for Mg and from 2.0 to 1.3 for Na. For Ca, Mg and Na the reductions only commenced after about the first four weeks of active growth in the spring. 2.1. Seasonal changes in rotationally grazed herbage. A system of grazing to ensure the maximum production of herbage is to rotate the cows around a series of single -day or two-day paddocks allowing a 21-day period for re -growth. Nitrogen fertiliser is applied immediately after the herbage on each plot is consumed. Thompson and Warren (1979) have recorded the mean major mineral contents for five farms where the mean annual fertiliser applications were 240 kg N, 18 kg P and 34 kg K/ha. (Table 2). With full return of excreta to the area, concentrations of P, K, Ca, and Na increased progressively during the season but Mg concentrations were lowest in May and highest in August and September. Table 2: Mean crude protein (CP) and mineral contents (glkg DM) of rotafionally grazed herbage on 5 farms (Thompson and Warren, 1979). CP P Ca Mg Na
Hemingway and Ritchie (1997, 1998) obtained herbage samples on 18 occasions at about 9 -day intervals between mid-May and mid-October from nine dairy farms where paddock grazing was practiced. Total annual fertiliser applications (kg/ha) ranged from 250-425 N and averaged about 33 P and 63 K (Table 3). Mean crude protein contents were about 250 g/kg DM throughout with both P and Ca concentrations being higher in mid-season but declining from September. Mean Mg concentrations were lowest in May but increased Steadily thereafter. It was

notable that the values for all mineral elements obtained at the first sampling in early May (and reflecting the inclusion of some residual over-wintered material) were misleadingly higher than all subsequent early season values. Table 3: Mean concentrations of crude protein (CP) and minerals (elkg DM) in the rotationally grazed herbage for 9 farms (Hemingway and Ritchie, 1997).
2.2 Crude protein and phosphorus relationships It has long been appreciated that as herbage progressively matures, crude fibre increases with stem emergence and both crude protein and phosphorus decline at rates which are significantly (P < 0.01) correlated with each other. Smith and Comrie (1948) established this for 62 hays covering the ranges 60-100 g CP and 2.0-2.5 g P/kg DM. Hemingway et al. (1968) determined the concentration of phosphorus in 136 silages and 132 hays grown in Scotland. For silages the mean content was 2.5 ( S.dev. 0.27, range 1.0-4.1 g P/kg DM with only 14% having over 3.0 g/kg DM. The mean content for hays was 2.0 ( S.dev. 0.22, range 1.0-3.6 g P/kg DM. The mean crude protein contents were 97.3 for silages and 63.1 for hays (g P/kg DM). There was a combined significant (P < 0.01) between CP and P for all 268 samples, viz. P (g/kg DM) = 0.6+ 0.02 x CP (g/kg DM) indicating that low phosphorus roughages are also low in crude protein and, in all probability, are low energy feeds. Joint phosphorus and protein supplementation are required and this must be recognised in all situations where low phosphorus intake may be considered to be a problem. Givens and Moss (1990) found similarly good correlations for (a) 172 samples of primary herbage growth between April and June for materials with 80-200g CP and 2.D-3.S g P/kg DM and for (b) 107 clamp silages with a CP range from 100-180 g and a P range from 1.0-2.0 g/kg DM. In consequence, as herbage progressively lignifies it has reduced digestible energy,

protein and phosphorus. Ruminants re -circulate urea and soluble phosphorus in saliva thus providing primary nutrients for rumen micro- organisms. When given feeds containing below 40 g CP and 1.0 g P/kg DM over long periods, voluntary feed intake and digestibility are severely reduced especially when plasma phosphorus concentrations fall below 1.0 mmol/litre (Bass et al., 1981). Appetite may be restored within a day of commencing dietary phosphorus supplementation. Whilst unlikely to be of severe clinical importance in temperate grassland systems where other supplementary feeds higher in protein and phosphorus are given, in savannah areas where at the end of the dry season CP and P contents of range vegetation may contain as little as 30 g CP and 0.6 g P/kg DM both live weight loss and infertility are acute herd problems (Howard et al. 1962). It is perhaps phosphorus which is the limiting nutrient. For this reason, the author together with colleagues, co- operated with the late Dr Greidinger in the 1970s to develop the use of urea phosphate (170 g N, 190 g P) as a safe, dual nutrient feed supplement to be given with an energy source such as molasses (Hemingway, 1973a). 2.3. Direct effects of phosphorus fertilisers. Several investigators have determined the effect of phosphorus applications o n the P content of herbage which also received adequate nitrogen and potassium. The technique was to cut and remove herbage at the grazing or very early silage stage of growth at least four times during the summer season and with re-application of nitrogen after each cut. Holmes (1949) recorded a mean increase from 3.4 g P/kg DM ( unsupplemented) to 3.9 g P/kg DM when 66 kg P/ha was applied. Walker et al. (1952) found for the mean of 17 trials that the overall mean P content was increased from 2.3 to 2.5 g P/kg DM when either 34 or 68 kg P/ha were applied. Similarly, Hemingway (196la) applied 29 kg P/ha and found the mean P content increase (4 trials, 4 herbage cuts per annum) was from 2.1 (unsupplemented) to 2.3 g P/kg DM when 310 kg N and 150 kg K were also applied/ha. Adams (1973a, 1973b) found that 30 and 60 kg P fertiliser/ha increased herbage P concentrations from 3.5 (no fertiliser) to 3.7 and 3.8 g P/kg DM respectively. In all these circumstances there were no significant fertiliser P effects on herbage growth. In longer term studies involving several cuts of herbage over several years and were P was given annually together with adequate N and K, the effects on the P content of herbage have been equally small. Stewart and Holmes (1953) found over a period of three years that without P fertiliser the herbage content remained at 3.1 g P/kg DM but that applying 27 kg P/ha increased the level to 3.5 g P/kg DM. Similarly, Castle and Holmes (1960) found that with five cuts of herbage/annum over six years the P content of unsupplemented grass fell from 3.2 to 2.8 g P/kg DM. When 50 kg fertiliser P was given each year (with 585 kg N and 420 kg K/ha) herbage P concentrations remained at 3.8 g P/kg DM throughout. Reith et al. (1964) found that annual P applications of 11 or 22 kg P/ha over three years (with five cuts/annum) increased mean P contents from 3.5 (unsupplemented) to 3.8 g P/kg DM. It must be concluded that frequently-cut herbage contains only marginally increased P concentrations as a result of annual fertiliser P applications in this order relative to the larger previously described effects of application of nitrogen

fertiliser and stage of growth at cutting. Equally, withdrawal of fertiliser P in situations where regular cutting of herbage continues has limited annual depressive effects. Heddle and Crooks (1967) recorded reductions from 4.6 to 3.8 g P/kg DM after eight years and to 2.S g P/kg DM after 14 years when ample N and K fertilisers were given. However, when 21 kg fertiliser P/ha was applied each year over six years, mean annual P concentrations remained at 4.8 g P/kg DM. 2.4. Satisfying the phosphorus needs of lactating cows. There is concern especially in the Netherlands and Denmark that the current use of nitrogen and phosphorus fertilisers combined with their inputs from purchased feeds give rise to excreta which are detrimental to the environment. Legislation and restrictions are currently in place or are actively contemplated, but at the same time it must be recognised that over-high stocking rates for both pigs and cattle is the primary factor. Both nitrogen and phosphorus reductions in fertiliser use are inter-connected with respect to herbage mineral composition. When the full CP and P data summarised in Tables 2 and 3 for intensive grazing are combined, the resulting regression equation is P (g/kg DM) = 0.012 x CP (g/kg DM) + 0.5 with r = 0.96 and P < 0.01. If CP in herbage is 250 g/kg DM, the P content would be 3.5 g P/kg DM. Should N fertiliser application be reduced so that CP were 200 g/kg DM, the P content would fall to 2.9 g/kg DM. For 20 kg DM intake by lactating cows this represents a reduction of 12 g P/day which could have potentially serious consequences unless replaced with dietary mineral P supplementation. Similar considerations apply if the CP content of silage were to be reduced from say 150 to 120 g/kg DM. Minimum phosphorus requirements and allowances (which term implies a safety margin) as proposed by both ARC (in the UK) and NRC (in USA) are presented in Table 4 (overleaf). Recommendations currently adopted by France, Germany and the Netherlands are not materially different. Due to a lack of a range of critical experimentation conducted with cattle of present high milk yields and for adequately long periods, there is considerable uncertainty about their validity especially where mineral supplementation is used to compare contrasting total dietary P intakes initiated shortly after calving. The severe reduction proposed by ARC (1980) compared with ARC (1965) was accompanied with the statement ’there is no way at present of testing the general applicability .... other than from practical experience from their use’. In the UK, ARC (1980) was not acceptable by either the advisory services, the veterinary association or the feed trade association and was not adopted in farm practice. MAFF et al. (1983) recommended that instead ARC (1965) minimum requirements be termed ’allowances’ and continue in use. MAFF et al.(1983) additionally commented that ’ARC (1965) values had been used without serious criticism for 25 years and until definitive work is carried out or long-term trials completed, no recommendation can safely be made for long -term use [of the 1980 values]’. In contrast, in America NRC increased their recommended allowances (Table 4) from 3.4 g P/kg DM (1978) to 4.0 g P/kg DM (1989) with an additional increase to 4.4 g P/kg DM for cows in early

lactation. Table 4: Suggested minimum phosphorus requirements and dietary allowances for dairy cows (600 kg live weight, 35 kg milk l day.
AFRC (1991) made revised recommendations (Table 4) and introduced the concept that requirement was dependant upon diet metabolisability (q) which would modify endogenous P loss by the cow which in turn would be influenced by the re-circulation of P in saliva (which could often exceed P originating from the diet). AFRC (1991) however included the comments: ’Conceptual differences between average requirements and safe dietary allowances were identified’; ’Conclude from the dearth of information that realistic safety margins could not be calculated’; ’Instead, the skeleton should be relied upon to provide the necessary ’elasticity’ between supply and demand. There is a need to test fully the dietary recommendations in long term feeding trials especially using forage-based diets’. It may well be that in the critical early lactation period extending from parturition to beyond the time of insemination that some mineral loss from the skeleton is inevitable, but if it is both extensive and prolonged, thus could raise animal welfare issues and should not be adopted knowingly. Such critical experimentation is very limited and has only been undertaken for cows given indoor diets where silage and low P concentrates based on sugar beet and citrus pulps have been given without and when supplemented with mineral phosphates. Usually in these studies, water soluble materials such as ammonium, mono-calcium and sodium phosphates which are also soluble in the rumen, have been used rather than the much more normal dicalcium - or defluorinated phosphates which are not soluble (Witt and Owens, 1983; Parkins and Hemingway, 1998).

Table 5: Summary of experiments with contrasting dietary phosphorus concentrations (P g/kg DM) for dairy cows.
The relevant experimentation has been described in more detail by Hemingway (2000) and is summarised in Table 5. Withers and Peel (1999) also have described the effects over a 3-year period of giving differential phosphorus inputs to dairy cows as both fertiliser and feed P using groups each of 36 cows (Table 6). System 1 used grazing with grass silage plus brewer’s grains and NaOH -treated straw. In System 2, maize silage replaced half the grass silage. System 3 also consisted of grass and maize silages but with less brewer’s grains and more NaOH-treated straw. Purchased milk- production concentrate feeds aimed to provide 90 g P, 80 g P and 70 g P/day for Systems 1, 2 and 3 respectively and fe rtiliser P inputs were progressively less for each System. Importantly, Systems 1 and 2 allowed 0.54 ha/cow but stocking density was 20% less for System 3. The overall P concentrations for the combined feed DM intakes for the three systems were 4.7, 4.0 and 3.4 g/kg respectively (see also Table 4). Milk yields/cow/annum and milk P concentrations (g/litre) were comparable in all systems but were about 20% less for System 3 reflecting the reduced stocking density. The resulting P balances (fertiliser+ purchased feed P intakes - milk P output) were 24.6 kg/ha for System 1, 17.6 kg/ha for System 2 and 3.3 kg/ha for System 3 (Table 6). It will be noted that purchased feed P inputs were considerably greater than the amount of fertiliser P used even in System 1 which would match current practice for dairy herds. The authors commented that ’whilst no blood or bone P assessments were conducted, it is not known how long cows can be maintained on relatively low P diets without inducing health or fertility problems’. No reproductive data were quoted by Withers and Peel (1999) for this 3-year investigation although those would have been available from routine milk recording records. Results obtained from such

investigations cannot be analysed statistically as the treatments were not replicated. The inclusion of maize silage in two of the three diets and different CP inputs may have complicated the results obtained and the conclusions drawn. Table 6: Stocking rates, fertiliser and feed phosphorus inputs and milk phosphorus outputs for three dairy farm systems. (Withers and Peel, 1999).
It is concluded (from Table 6) that to advise reduced dietary P intakes requires more work over longer periods with practical diets to assess factors such as milk yields and composition, maintenance of plasma phosphorus and bone density, efficient reproduction etc. Proposals to lower phosphorus intakes for high-yielding dairy cows solely for environmental reasons must be widely endorsed by all concerned in such a manner as to accept responsibility for both animal production and welfare. Any proposed reduction in phosphorus intakes implies the need for expanded analytical assessment of all feeds to ensure that any lower intakes are not further reduced below any revised recommendation in practice. 3. EFFECTS OF POTASSIUM ON MAJOR MINERAL CONCENTRATIONS. Table 7 summarises the effects of annual applications of K and N fertilisers when given in five studies where the herbage was cut at the grazing stage and removed frequently over several successive years. The data are for the mean annual concentrations for the first and last years of each investigation. Generally, with K concentrations below 10-15 g/kg DM, growth is depressed within the first year and there are changes in the botanical composition with the elimination of all clover and the emergence of inferior grasses.

Table 7: Nitrogen and potassium fertiliser application rates (kg/ha/annum) and mean mineral concentrations (glkg DM) at the prst and last of several cuts of herbage each year.
For the overall mean concentrations, the effect of applying K was to maintain herbage K concentrations but almost equivalent annual amounts of K and N dressings are required. Application of K fertiliser depressed Ca, Mg and Na concentrations but to mean values which were substantially similar for each element in the first and last years of each study. Apart from K contents, individual Na concentrations were more varied than for other elements as has been noted previously for many farm crops and situations (Hemingway, 1995). For the data in Table 7 there were significant overall negative correlations between K and Na contents (r = 0.71, P <0.002) and K and Mg contents (r = 0.65, P <0.001) but not between K and Ca concentrations. 3.1. Slurry effects. Adams (1973a, 1973b) conducted 16 annual experiments where 0, 180 and 360 kg N, 0, 30 and 60 kg P and 0, 150 and 300 kg K/ha with or without 138 x 10~ litres slurry/ha were applied to grass. The slurries were of mixed animal origin (80% pig, 19% cow and 1% poultry) and of very varied composition. The most concentrated had 15 x more N, 29 x more P and 36 x more K than the most dilute. 1here were three cuts of silage with all treatments given as one- third of the annual totals in the spring and one-third after both the first and second cuts. Overall mean mineral concentrations resulting from all applications increased from cut 1 to cut 3 and were (g/kg DM) for P 3.6 to 4.0, for K 25.1 to 27.6, for Ca 5.0 to 6.2, for Mg 1.4 to 2.2 and for Na 3.4 to 4.3. Table 8 summarises the overall mean mineral concentrations for the three levels of N, P and K applications given with and without slurry.

Table 8: Overall unweighted mean mineral concentrations (glkg DM) for three cuts of grass silage resulting from digerent N, P and K fertiliser applications with and without slurry in 18 annual experiments. (Adams, 1973a,b).
Differential N applications increased Mg and Na contents and slurry increased overall P, K, Mg and Na contents by about 0.1, 3.8, 0.1 and 0.2 g/kg DM respectively. Potassium fertiliser progressively increased mean K contents and decreased those for Ca, Mg and Na. Slurry application further increased K concentrations but otherwise had little effect. Progressively increased P fertiliser applications to 60 kg/ha increased P contents marginally from 3.6 to 3.8 g P/kg DM. The overall effect of slurry where no fertiliser P was given was also to increase levels from 3.6 to 3.8 g P/kg DM. In a long-term trial extending over 16 consecutive years, Christie (1987) applied three rates of cow slurry (SO, 100 and 200 x 10’ litres/ha) in one-third quantities three times per annum to a ryegrass sward from which three cuts of silage were obtained each year. An additional treatment supplied 200 kg N, 32 kg P and 160 kg K/ha/annum and one area was unfertilised (Table 9). The overall mean effect of applying 21, 42 or 84 kg P/ha/annum was negligible but after 16 years the silage P concentrations ranged from 2.7 to 3.7 g/kg DM. In contrast, giving 136 to 544 kg K/ha/annum as slurry progressively increased silage K contents by amounts which were rather greater than when 160 kg fertiliser K was applied/ annum. After 16 years of slurry application silage Ca concentrations (g/kg DM) were 4.3 with 50 x l(P litres falling to 3.4 with 200 x llP litres relative to 5.2 with the fertiliser application. Magnesium contents (1.3 g/kg DM) were similar for by either fertiliser or slurry applications. The sodium content was 3.3 g/kg DM when no fertiliser was applied, 4.9 with fertiliser but was progressively reduced with increasing slurry

application to 2.8 and 1.5 g/kg silage DM. Continued slurry application changed the botanical species due to invasion of Agrostis stolonifera especially later in the season and this may have influenced the changes in mineral composition recorded. Table 9: Mean phosphorus and potassium concentrations (g/kg DM) in herbage resulting from applications of fertiliser and three rates of cow slurry applications (1lP litrelha) over a 16-year period. (Christie, 1987).
4.0 MAGNESIUM FERTIUSATION. 4.1. Calcined magnesite and magnesium limestone. Examples of comparisons between calcined magnesite and magnesium limestone on the Mg content of repeatedly cut herbage are given in Table 10. It must be concluded that concentrations even for unsupplemented grass are appreciably higher in the autumn than in the spring and that calcined magnesite is superior to magnesium limestone especially for the first spring grazing. Hemingway (1999) has reviewed other comparisons but they did not involve equal amounts of Mg application. Jones (1963) recorded that the Mg content of herbage was increased by magnesium limestone application by about 10% in year 1, by 25% in year 2, by 35% in year 3, by 42% in year 4 and by 40% in year 5 and thus was a useful long-term measure especially as calcitic limestone application tended to marginally reduce herbage Mg contents. Todd (1965) found that an application of 320 kg Mg/ha as calcined magnesite resulted in larger herbage Mg responses in both spring and autumn harvested herbage grown on light soils rather than on medium or heavy soils. In an attempt to improve magnesium intake by grass, Birch and Wolton (1961) at four sites applied 20, 40, 60 or 300 kg Mg as calcined magnesite during the autumn or winter. The resulting increases in grass Mg content in May were respectively nil, 0.1, 0.1 and 0.5 g/kg DM above the base level of 1.6 g Mg/kg DM for untreated grass.

Table 10: Mean magnesium concentrations (g/kg DM)in herbage cut several times each year as influenced by various applications of calcined magnesite (MgO) and magnesium limestone (MgL).
A major problem in assessing the merits of calcined magnesites applied to grass is that Draycott and Durrant (1972), Draycott et al. (1975) and Durrant and Draycott (1976) found that the response obtained in sugar beet was markedly influenced by both particle size and temperature of calcination of the original magnesite. Adam et al. (1996) and Hemingway et al. (1998) have also found important differences in ruminant bioavailability for calcined magnesites used as animal feed supplements. Allcroft (1960) indicated that from that date a particle size range from 1.5 to 3.0 mm diameter would be used and Draycott and Durrant (1972) recorded that as a fertiliser for sugar beet 66% of material would be >2mm diameter with the remainder being up to 6 mm. The present author found that prilled calcined magnesite (about 4 mm diameter) lay on the surface of grassland for several weeks in the spring without any signs of particle breakdown. 4.2. Magnesium sulphate. Various amounts in different hydrated forms have been applied to grassland either as crystals or in solution as sprays. Griffiths (1959) found that for herbage cut repeatedly at the grazing stage, an application of 38 kg Mg/ha increased mean Mg concentrations by about 0.4 g/kg DM. Annual applications for up to three years of 24 kg Mg/ha (Hemingway, 1961a, 1961b) íncreased Mg contents of frequently cut herbage by only 0.07 to 0.20 g Iyfg4g DM. In 19 experiments where kieserite was applied in autumn or winter at rates ranging from 12-36 kg Mg/ha, Birch and Wolton (1961) found increases in herbage Mg content of less than 0.2%. Jones (1963) applied 63 kg Mg/ha as magnesium sulphate each year for five years to herbage and found that the mean increase in magnesium concentration in the

DM recorded over the whole year declined from 20% in year 1 to 10% in year 2 and to only 5% in years 3, 4 and 5. Hooper (1967) applied much larger (and probably quite uneconomic levels) of 63, 125 and 250 kg Mg/ha in single applications as Epsom salts at six sites. The overall increased herbage Mg contents for herbage cut repeatedly over the whole grazing season were 0.3, 0.4 and 0.5 g/kg DM. McIntosh et al. (1973) also applied such larger amounts of magnesium sulphate totalling ll2 or 202 kg Mg/ha repeated each year for three years with four cuts of herbage being taken each year. Whilst overall mean Mg contents increased marginally from year to year, the seasonal effect was larger than that for the differing rates of application. Overall mean values were 1.2 g Mg/kg DM (untreated) and 1.4 for both rates of application in the spring with 2.1 g and 2.4 g Mg/kg DM (untreated) for both rates of application in the autumn. Hunt et al. (1964) applied all combinations of 0, 87 and 263 kg Mg/ha as kieserite and 0, 49, 98 and 147 kg K/ha as potassium chloride in either autumn or spring to herbage. During the critical early grazing period for magnesium from late April to mid May, the overall incremental effect of the kieserite application was to increase the Mg content from 1.4 to either 1.6 or 1.7 g Mg/kg DM irrespective of time of application. Potassium concentrations were rather higher (24.7 %) for the spring K application relative to 21.3% for the autumn K application and relative to 17.1% for the untreated grass. It must be concluded that substantial amounts of magnesium-containing materials must be applied to improve magnesium concentrations in grass. Even then, concentrations do not reach the desirable 2.0 g Mg/kg DM required (Kemp, 1960) for the early spring grazing of dairy cows, although that level is commonly found (and even in unfertilised grass) in the autumn. 4.3. Magnesium contents of silages and hays. Magnesium concentrations in silages and hays tend to be similar to that for late-season grazed herbage. For a large number of silages and hays grown in Scotland the mean contents were 1.3 (S.dev. 0.21, range 0.5-2.0) and with 18% having below 1.0 g Mg/kg DM for silages and 0.9 (S.dev. 0.19, range 0.05-1.9) with 74% having values below 1.0 g Mg/kg DM. In farm practice, dietary magnesium supplementation may frequently be required for lactating cows when given a silage-dominant diet. 5. CALCIUM CONTENTS OF HERBAGE, SILAGES AND HAYS. The mean calcium content of a large number of grass samples collected over many years is 5.9 (S.dev. 0.28) g/kg DM (MAFF, 1975) and clovers would contain about double that amount. The concentration is hardly affected by fertiliser N, P or K applications (Tables 1 and 7). For intensively grazed herbage, Thompson and Warren (1979) found mean concentration for five sites increased from about 4.2 to about 5.S g Ca/kg DM from May to September. Similarly, Hemingway ~ Ritchie (1997) found for nine farms practising single -day paddock grazing that the overall mean concentration for samples obtained on 18 occasions between mid-May and

mid-October was 6.3 (S.dev. 0.96) g/kg DM. The range of mean values was from 4.7 to 8.2 with the lower values being in the early season. The AFRC (1991) requirement for a cow giving 30 kg milk/day is 4 .5 g/kg of the whole diet dietary DM intake and accordingly calcium inadequacy for lactating cows at grazing is not considered to be a problem. Hemingway et al. (1968) found the mean calcium contents of a large number of silages and hays grown in Scotland were 6.2 (S.dev. 1.72) and 5.3 (S.dev 1.31) g/kg DM respectively. Concentrations below 4.0 g Ca/kg DM were found for 12% of the silages and for 44% of the hays and so calcium supplementation of milk production concentrate feeds, the ingredients of which may have only 1.0 -2.0 g Ca/kg DM should be provided. 6. SODIUM FERTILISERS. For repeatedly cut herbage at four sites using all combinations of no fertiliser, 312 kg N, 30 kg P, 130 kg K and 197 kg Na (as sodium chloride), Hemingway (1961a) found that mean Na concentrations were higher in the third and fourth cuts and overall were increased from 4.1 to 6.1 g Na/kg DM by the salt application. Salt decreased mean Mg contents from 1.5 to 1.3 g/kg DM but hardly affected K or Ca contents. In a subsequent experiment (Hemingway 1961b) used a factorial design to include annually no fertiliser, 197 kg Na (as salt), 310 kg N, 30 kg P and 130 kg K/ha. There were four cuts of herbage for three years. Mean sodium concentrations without and with salt were 2.2 and 6.0 Na ; without and with fertiliser N they were 2.1 and 8.2 Na (g/kg DM) and there was a marked N/Na positive interaction. Potassium fertiliser decreased Na contents of herbage from 5.2 to 3.2 g Na/kg DM and there were consistent negative N/K interactions. Salt application also decreased magnesium contents by about 0.2% and especially in the later cuts each year and in the third year. For grazed herbage, Phillips and Chiy (1995) investigated the effect of either nil or 32 kg Na/ha (as sodium nitrate) when superimposed on herbage given 444 kg N over the season with 14 kg P and 33 kg K/ha. The Na content of herbage was increased from 5.9 to 9.4 g/kg DM and the potassium concentration was reduced from 16.1 to 11.2 g/kg DM. In a later trial (Chiy et al. 1998) sodium chloride was applied at rates of nil, 33, 66, 99 and 132 kg Na/ha together with basal amounts of 85 kg N, 19 kg P and 70 kg K to herbage grazed by dairy cows. Sodium concentrations increased progressively from 2.7 to 4.9 g/kg DM and potassium contents tended to fall from 10.2 to 9.3 g/kg DM. There was no consistent effect on herbage Mg or Ca contents. 7. FERTILISERS AND HYPOMAGNESAEMIA. The earliest experiments in England (Bartlett et al. 1954, Bartlett et al. 1957) involved attempts to find fertiliser regimes which might lead to severe hypomagnesaemia so that the condition could be studied. Table 11 (overleaf) summarises the results of these and those of four other groups of investigators who adopted similar approaches in Ireland (Smythe et al. 1958), in Norway

(Hvidsten et al. 1959), in the Netherlands (Kemp, 1960) and in Scotland (Storry, 1961). All were concerned with the effects of sudden transfer of lactating cows from indoor feeding to differently fertilised grass plots and the data refer to herbage and blood samples obtained about 8-10 days after such transfer. There were generally only about four cows for each fertiliser treatment and initial milk yields were invariable below, and often well below, 20 litres/day. Table 11: Fertiliser N and K applications (kg/ha), the number of cows, mean herbage magnesium and potassium concentration (glkg DM) and the lowest mean plasma Mg concentration (mmol/litre) a few days after transfer of cows to spring grazing.
For the studies of Bartlett et al. (1954) potassium was applied as potassium sulphate and this so increased the amount of clover in the sward in year 1 that it was eliminated with a selective weed killer before year 2. Calcined magnesite (described as ’coarse, gritty’) was only applied in year 1 with year 2 being regarded
as a carryover effect. The cows were of various breeds and in late lactation giving only 7-14 litres of milk/day. During the course of the study there was frequent movement of cows from plot-to-plot to best-utilise herbage growth. Individual cows responded very variably to the different pastures. In year 1 there was no unfertilised plot. Four of the eight cows grazing the N-treated pasture developed signs of clinical tetany. In year 2 the Mg content of the herbage DM was reduced by the now two applications of potassium sulphate and one of the four cows developed clinical signs of tetany. Whilst N fertiliser maintained herbage Mg content, five of the seven cows had clinical signs and two of these died. In both years calcined magnesite, given at the very high rate in year 1 only, produced substantial increases in both herbage Mg and serum Mg concentrations. The authors considered that this very high rate of calcined magnesite application was necessary to keep the cows ’flushed’ with a high daily magnesium intake and was described as ’arbitrary’. Herbage Mg concentrations were hardly changed by the separate N and K fertiliser applications used in the later study of Bartlett et al. (1957) but both appeared to reduce serum Mg levels (Table 11). The large calcined magnesite application had been given two years earlier as described by Bartlett et al. (1954). Whilst it still markedly increased herbage Mg content the cows had the same serum Mg value as those grazing the area which received no fertiliser. The cows were again of mixed breeds but in early to mid-lactation with milk yields between 11 and 23 litres/day. None of the cows developed signs of clinical tetany and there were marked individual variations in serum magnesium changes were concerned. Unfortunately, neither of these two studies included determinations of herbage K contents. . Smyth et al. (1958) recorded significantly reduced serum Mg values when a high rate of N+K fertilisers was given but not when each element was applied alone, although the herbage Mg content was not reduced. Equally, Hvidsten et al. (1959) recorded lower serum Mg concentrations and single cases of clinical tetany in two of the three years when high N+K fertiliser application were given together. Both were associated with herbage K contents above 40 g/kg DM. The contrast, between 1.7 g Mg/kg DM for the 130 kg N + 170 kg K fertilisation in year 2 with that of 1.2 g Mg/kg DM for the ll3 kg N + 174 kg K application rate in year 3 is inexplicable. Kemp (1960) also found lower mean serum Mg concentrations and cases of clinical tetany when high amounts of fertiliser K were applied (irrespective of the amount of N fertiliser given). The number of cases of clinical tetany (4 of 4 cows) was higher when the herbage K was highest (35.9 g/kg DM) with the higher N application although both high K-fertilised plots had similar herbage Mg contents. As for Bartlett et al. (1954) clover in the high K pastures was reduced using selective weed killer. Sodium contents were also lower (0.8 g/kg DM) when high fertiliser applications were made than when less K was applied (1.4 g Na/kg DM). Significant correlations were found between serum magnesium concentrations and both herbage Mg contents (+ 0.47 ) and herbage K contents (- 0.37 ).

7.1. Sodium fertiliser effects. Storry (1961) concentrated on contrasting levels of potassium and sodium fertiliser inputs. There were four different fertiliser treatments involving combinations of ammonium sulphate or sodium nitrate with either potassium or sodium chlorides which produced herbage with the various mineral levels as described in Table 12. Herbage Mg contents were all in the range 1.6 -1.8 g/kg DM but there were wide differences in herbage K contents. Sodium concentrations (g/kg DM) were 0.6 for the N+K treatment, 4.2 for the N+Na treatment, 5.2 for the N+K treatment and 10.9 when N + High Na were applied. The mean initial milk yield of the 16 cows was 17 kg/day (range 10-24) and before transfer to grass their mean plasma Mg value was 1.2 mmol/litre. The mean plasma levels given in Table 12 are for the lowest individual concentrations recorded during the first 14 days of grazing. Table 12: Fertiliser applications (kg/ha), mean herbage crude protein (CP), Mg, K, Na and Ca concentrations (g/kg DM), the lowest mean plasma Mg concentrations (mmol/litre) after two weeks grazing and the mean reductions in plasma Na concentrations (m-equiv/litre) after one week grazing. (Storry, 1961).
There were large individual differences in the falls experienced by individual cows but no cases of tetany occurred although some values were as low as 0.24 mmol/litre. Plasma sodium concentrations for all groups of cows fell rapidly during the first week of grazing. Whilst the largest reduction was for the cows grazing herbage with the lowest sodium concentration, there was no association for all fertiliser treatments. Plasma calcium and potassium concentrations were within the normal range and were not affected by the differential fertiliser treatments. No firm conclusions could be drawn from the study for differences in plasma values due to fertiliser treatments although it was concluded that neither high herbage crude

protein concentrations (about 250 g CP/kg DM throughout) nor form of N fertiliser nor high K contents in the herbage were necessarily implicated in hypomagnesaemic tetany. Low individual herbage DM intakes could frequently account for low plasma magnesium values. Whilst the results in Tables 11 and 12 were obtained with restricted numbers of cows of low milk yield grazing herbage with exaggerated amounts of fertiliser and perhaps swards of different botanical composition to those of the present time, the pattern of results is supported by the findings of two surveys of the incidence of clinical hypomagnesaemic tetany occurring on farms (Table 13). Kemp and t’Hart (1957) recorded the mineral contents of 100 pastures where clinical tetany occurred and 170 where there were no problems in the Netherlands. When below 51 kg fertiliser N was given in the spring and pastures were K-inadequate, 0.6% of cows had clinical tetany but this increased to 3.7% of cows when the pastures were K-adequate. Butler et al. (1963) investigated the magnesium status and herbage mineral content on 64 farms in the South of Scotland (Table 13). Both findings tend to suggest that increased potassium and reduced sodium concentrations were as involved as lower magnesium intakes were implicated in clinical hypomagnesaemic tetany. Table 13: Farm surveys of mineral concentrations (glkg DM) in herbage where cows showed signs of clinical hypomagnesaemic tetany.
It is, however, important to appreciate that environmental factors such as cold, wet windy weather which tend to make cows seek shelter and thus reduce grazing time and herbage (and supplementary Mg-rich supplements offered to cows in the field) dry matter intakes. This is particularly a factor where cows experience hypomagnesaemia in the late autumn. Movement of livestock from one grazing area to another are frequently implicated with the onset of hypomagnesaemic tetany. In one major farming enterprise involving 35 dairy herds totalling 3000 lactating cows, Crichton (1968) described an incidence of 2212 cases of clinical tetany over

a 13 year period. Elimination of the practice of applying potassium fertiliser in the spring and increasing the use of fertiliser nitrogen significantly reduced the incidence of clinical tetany. There were progressive increases in herbage magnesium contents from 1.1 to 1.4 g/kg DM and sodium from 1.0 to 3.2 g/kg DM. At the same time potassium contents were reduced from 27.7 to 18.3 g/kg DM. The absorption of magnesium from fresh herbage is reduced from 35% to 20% as the potassium content increases from about 10 to 30 g K/kg DM indicating that higher dietary Mg intakes are necessary when grass is well- or over- supplied with fertiliser potassium (Suttle, 1987; Adediji and Suttle, 1998). The overall dietary Mg availability adopted by ARC (1980) was 29.5% (S.dev. 13.5) to calculate the dietary magnesium requirement of cows but, in practice, 17% is used to confer a safety factor. It must be correct policy to defer high K fertiliser (and slurry) applications for herbage to be grazed until after the spring. It is also important to appreciate the possible cumulative effects of such applications on the magnesium content, and perhaps the palatability, of autumn grazing. 7.2. Alternative magnesium supplementation strategies for cows at grass. In one notable (and perhaps exceptional) study, Birch and Wolton (1961) applied either nil, 28 or 560 kg Mg as calcined magnesite in January to herbage growing on a very sandy soil. There were six groups each of four Red Poll cows in a change-over design which allowed adequate statistical evaluation of the results. During the first three weeks grazing the mean herbage Mg contents were respectively 1.4, 1.8 and 2.6 g/kg DM. After the first 14 days the mean serum Mg concentrations for the cows grazing the untreated grass had fallen from 1.0 to 0.32 mmol/litre whilst those grazing the 28 kg Mg/ha herbage changed from 1.1 to 1.0 mmol/litre with a change from 0.96 to 1.0 mmol/litre for the higher calcined magnesite application. After a change-over of pastures when cows which had previously grazed Mg-supplemented herbage were transferred to untreated grazing, mean serum concentrations fell to 0.44 mmol Mg/litre and there were two clinical cases of tetany. In contrast, serum levels rose when previously unsupplemented cows were transferred to either of the calcined magnesite treated areas. The initial overall fertiliser application in the spring provided 50 kg N, 22 kg P and 76 kg K/ha and the resulting herbage mineral contents (g/kg DM) were 235 g CP, 42.2 K, 0.7 Na, 6.4 Ca and 5.3 g P and could be considered to reflect a high level of fertility and to be tetany-prone. The are relatively small magnesium responses in spring herbage when quite large amounts of calcined magnesite or ground magnesium limestone are applied (Table 10) and neither are there convincing increments when magnesium sulphate is used. Dairy farmers almost inevitably tend to rely on the use of feed supplements, usually given for convenience twice/day in the milking parlour. Calcined magnesite (60 g/day to provide 30 g Mg) is the accepted rate of addition although 30 g Mg is the full daily requirement for a cow giving 30 kg milk/day. Early workers described this as ’an arbitrary amount to ’flush’ the cow with magnesium’ and was described as ’coarse, gritty’. Calcined magnesites are of very variable dietary bioavailability

(Adam et al. 1996, Hemingway et al. 1998) but 60 g calcined magnesite/cow/day remains the normal, standard recommendation to give adequate protective cover, particularly as it is of low palatability. Magnesium phosphate is of superior palatability and bioavailability and its use was first proposed by Hemingway (1973b). In seven farm trials (Ritchie and Fishwick, 1977) where 53 g of a product containing 200 g Mg and 185 g P/kg was included in about 1.0 kg feed given to cows at grass, significant responses in plasma phosphorus and magnesium and control of clinical hypomagnesaemic tetany was obtained. Both magnesium and phosphorus concentrations are lower in spring grazing than at other times of the year (Tables 2 and 3) and this material could be of benefit in place of the more normal calcined magnesite and di-calcium phosphate especially as the herbage is not low in calcium at that time. For lactating ewes which were hypomagnesaemic (<0.4 mmol Mg/litre), Ritchie and Hemingway (1963a) found that a single daily oral intake of fully adequate amounts of calcined magnesite only increased plasma Mg concentrations for about ten hours before returning to their initial low level. In practice, lactating cows frequently experience clinical tetany in the very early morning when gathered from the field for milking. This is at the time of greatest length from the routine giving of calcined magnesite-containing feed at the evening milking. Another common time for tetany to occur is when the cows are similarly brought in for the late afternoon milking. It is for that reason that the amount of magnesium required to prevent hypomagnesaemia is probably of less importance than a regular intake throughout the 24 hours. This concept lay behind the development of weighted metallic magnesium alloys which reside in the rumen and give an adequate sustained-release for four weeks to prevent the onset of clinical tetany in both lactating cows and ewes when transferred to spring grass (Ritchie and Hemingway, 1968). Two such boluses release about 4 -5 g Mg /day by electrolytic solution for 28-35 days into the reticulum. Top dressing of pasture with calcined magnesite of sufficiently fine particle size just prior to spring grazing was employed by Todd and Morrison (1964) as a successful means to prevent both hypomagnesaemia and clinical tetany. Application of 31 kg calcined magnesite (16 kg Mg) per ha in a considerable number of diverse circumstances increased mean herbage Mg contents from 1.6 (range 1.4 to 1.9) to 3.1 (range 2.1 to 3.8) g/kg DM. The material adhered quite firmly to the naturally damp grass but, of course, was only useful for once-over grazing by cows. Similarly, Parkins and Fishwick (1998) demonstrated that a very fine (95% below 10pm diameter) suspension of magnesium hydroxide applied by means of a normal weed killer spray bar gave good adherence to grass even during subsequent rainfall. Application rates to provide as little as 5, 13 and 26 kg Mg/ha immediately increased herbage contents from 1.8 to 3.5, 5.3 and 5.0 g/kg DM and these were still increased from 2.1 to as high as 2.8, 4.7 and 4.7 g/kg DM after seven days (which included several periods of heavy rain). 8. TRACE ELEMENT CONTENTS.

Analyses of several large collections of samples of herbages, silages and hays (Table 14) indicate the generally inadequate concentrations relative to the dietary allowances proposed by MAFF et al. (1983). Each mean value has a relatively large standard deviation indicating the high proportion of materials for each element which are below these dietary allowances. However, there is very limited information regarding the influence of N, P and K fertiliser applications on trace element concentrations. Stewart and Holmes (1953) applied various amounts and combinations of NPK ranging up to 588 kg K, 61 kg P and 420 kg K /ha. The herbage was cut four times/annum. The only notable influence on trace element contents was that nitrogen application increased copper concentrations from the range 6-10 to 9-16 mg/kg DM. Effects on cobalt, zinc, manganese and molybdenum levels were negligible. Hemingway (1962) conducted a 2’ factorial trial involving applications of 79 kg N (for each of four cuts of herbage) with single spring applications of 21 kg P, 213 kg K, 25 kg Mg and 99 kg Na/ha/annum for each of three years. Nitrogen application consistently increased mean copper contents from 6.4 to 8.6 mg/kg DM and values were higher in late season cuts. Nitrogen also reduced mean molybdenum contents (a recognised inhibitor of copper absorption by ruminants at levels above about 3-5 mg/kg DM) from 1.8 to 0.8 mg/kg DM. Nitrogen fertiliser also increased mean manganese contents from about 30 to about 60 mg/kg DM perhaps because of the acidifying tendency of the sulphate of ammonia used, but had little effect on herbage iron contents. Other applied fertiliser nutrients did not influence content of any trace element.

Table 14: Mean (+ s. dev) trace element concentrations (mg/kg DM) in large numbers of samples of grass ,silage and hay in relation to MAFF et al. (1983) dietary allowances for cattle. (Hemingway et al., 1968); MAFF, (1975); SAC/SARI, 1982).
For intensively grazed herbage Thompson and Warren (1979) found mean crude protein, copper and manganese contents to increase progressively from May to September with copper contents rising from about 5.5 to about 7.5 and manganese from about 70 to about 100 mg/kg DM. Copper and crude protein contents (range 200-250 g/kg DM) were significantly correlated (r = 0.97; P = 0.004) but mean zinc contents (about 32 mg/kg DM) were not influenced by either season or crude protein contents. Similarly, for the mean values for nine intensively-grazed sites with samples taken every ten days throughout the season, Ritchie and Hemingway (1997) found mean copper contents (range 6.S-14.7 mg/kg DM) were significantly correlated (r = 0.69; P = 0.002) with mean crude protein contents (range 213-275 g/kg DM). In the UK copper and selenium are the two trace elements most likely to be inadequate in herbage and its conserved products. Nitrogen fertiliser seems consistently to increase copper and decrease molybdenum contents, but there are no comparable data for selenium. Cobalt inadequacy is largely confined to rather restricted geological areas with soils of low cobalt content and that is probably the situation for iodine. Manganese inadequacy in herbage is perhaps unlikely on

acidic grassland areas but it appears that the zinc status of herbage may often be marginal. 9. SUSTAINABILITY OF HIGH NITROGEN INPUT SYSTEMS. The extent of grassland production and hence stocking rates depend on adequate amounts of rainfall well-distributed over the growing season for both grazing and silage conservation. Thereafter, nitrogen is the primary nutrient for growth. Responses to applied nitrogen in yield are virtually linear up to 200-300 kg N/ha depending on site and management regimes. The yield increase is about 15-30 (more usually 20-25) kg dry matter/kg nitrogen fertiliser/ha. Thereafter responses are progressively less until the maximum yield is reached at about 500-850 kg applied N/ha. (Baker et al. 1991). The first cut of silage may remove S tonnes DM/ha and contain 13-17 kg P and 60-70 kg K/ha with about 10-12 kg P and 40-50 kg K for each subsequent cut of grass during the season (Baker et al. 1991). These are substantial total amounts and, whilst some is returned in slurry and dung, must be restored with appropriate fertiliser applications in order that full productivity responses may continue from nitrogen fertiliser applications in subsequent years. Long-term sustainability in terms of animal production, herbage composition and animal health have been investigated by De Groot et al. (1973) in the Netherlands and by Coombe and Hood (1980) in the UK (Table 15). The observations were made over eight and five years respectively and involved separate initially-matched sub-herds each with their designated areas for grazing and silage production. The contrasting rates of annual N fertiliser application given by De Groot et al. (1973) were 160 and 556 kg/ha with ’maintenance’ applications of 30 kg P and about 90 kg K. Coombe and Hood (1980) applied rather higher N applications (250 and 750 kg N/ha/annum) with 30 kg P and 57 kg K/ha/annum (applied mid-season) for the grazed areas and with 55 kg P and 188 kg K for the silage areas. In both experiments the higher N fertiliser applications markedly increased crude protein, nitrate -N and herbage magnesium contents. No signs of year- to-year differences in either protein or mineral concentrations were recorded by De Groot et al. (1973). These details were not recorded by Coombe a nd Hood (1980) and so were presumed not to be important. Neither of the publications showed any N fertiliser effect on mean calcium and phosphorus contents and both were considered to be in the appropriate range of desirable levels for lactating cows. De Groot et al. (1973) found herbage magnesium contents were lowest in May (1.7 for low N v 1.9 for high N) and highest in August (2.1 v 2.4 g/kg DM respectively) before returning to the May levels in October. Coombe and Hood (1980) found copper and manganese levels were higher with the increased amount of applied N fertiliser (6.1 v 5.1 mg Cu and 61 v 47 mg Mn/kg DM).

Table 15: Mean annual fertiliser N, P and K applications (kg/ha), mean crude protein (CP) and herbage mineral contents (glkg DM) and mean plasma Ca, P and Mg concentrations (mmol/litre) in long-term trials.
Both groups of authors considered that the elevated levels of nitrate-N in herbage were not detrimental to animal health and when considered in rela tion to the published literature. Mean plasma concentrations of calcium, phosphorus and magnesium were satisfactorily normal. The number of cases of milk fever and hypomagnesaemic tetany were considered to be low and were in relation to the number of animals and the duration of experimentation for both amounts of applied fertiliser N. No firm conclusions could be made regarding the low contrasting incidences of reproduction associated problems in the low and high N-fertilised areas. It is concluded that exceptionally high N-fertiliser application rates continued over several years accompanied by apparently adequate amounts of fertiliser P and K are not detrimental to animal health.

10. REFERENCES.
• Adam, C. L., Hemingway, R. G. and Ritchie, N. S. (1996). Influence of manufacturing conditions on the bioavailability of calcined magnesites measured in vivo and in vitro. Journal of Agricultural Science Cambridge 127: 377-385.
• Adams, S. N. (1973a). The responses of pastures in Northern Ireland to N, P and K fertilizers and to animal slurries. I. Effects on dry matter yield. Journal of Agricultural Science Cambridge 81: 411-417.
• Adams, S. N. (1973b). The responses of pastures in Northern Ireland to N. P and K fertilizers and to animal slurries. Il. Effects of mineral composition. Journal of Agricultural Science Cambridge 81: 419-428.
• Adediji, O. and Suttle, N. F. (1998). Influence of dietary potassium on the absorption of magnesium from herbage and dry diets by ruminants. Proceedings of the British Society of Animal Science. 219.
• AFRC. (1991). Agricultural and Food Research Council. Report No 6. A reappraisal of the calcium and phosphorus requirements of sheep and cattle. Nutrition Abstracts and Reviews. Series B 61: 573-612.
• ARC. (1965).Agricultural Research Council. The Nutrient Requirements of Farm Livestock. No 2. Ruminants. London. HMSO.
• ARC. (1980).Agricultural Research Council. The nutrient requirements of ruminant livestock. Commonwealth Agricultural Bureaux, Slough.
• Allcroft, R. (1960). Prevention of hypomagnesaemia. British Veterinary Association Conference on Hypomagnesaemia. 102-111.
• Baker, D., Doyle, C. and Lidgate, H. (1991). Grass Production. Milk from grass. 2nd Edition. (ed. Thomas, C., Reeve, A. and Fisher, G. E. J). British Grassland Society. 1-26.
• Bartlett, S., Brown, B. B., Foot, A. S. Head, M. J., Line, C., Rook, J. A. F., Rowland, S.J. and Zundel, G. (1957). Field investigations into hypomagnesaemia in dairy cattle with particular reference to changes in the concentration of blood constituents during the early grazing period. Journal of Agricultural Science Cambridge 49: 291-300.
• Bartlett, S., Brown, B. B., Foot, A. S., Rowland, S. J., Allcroft, R. and Parr, W. H. (1954). The influence of fertiliser treatment on the incidence of hypomagnesaemia in milking cows. British Veterinary Jounial 110: 3-19.
• Bass, J. M., Fishwick, G., Hemingway, R. G., Parkins, J. J. and Ritchie, N. S. (1981). The effects of supplementary phosphorus on the voluntary consumption and digestibility of a low phosphorus straw-based diet given to beef cows during pregnancy and early lactation. Jounial of Agricultural Science Cambridge 97: 365-372.
• Birch, J. A. and Wolton, K. M. (1961). The influence of magnesium application to pasture on the incidence of hypomagnesaemia. Veterinary Kecord 73: 1169-1173.
• Brodison, J. A., Goodall, E. A., Armstrong, J. D., Givens, D. I., Gordon, F. J., McCaughey, W.J. and Todd, J. R. (1989). Influence of dietary phosphorus on the performance of lactating dairy cattle. Journal of Agricultural Science
Cambridge 112: 303-311. • Brintrup, R., Mooren, T., Meyer, U., Spiekers, H and Pfeffer, E. (1993).
Effects of two levels of phosphorus intake on performance and faecal phosphorus excretion in dairy cows. Journal of Animal Physiology and Animal Nutrition 69: 29-36.
• Butler, E. J. and colleagues of the Veterinary Investigation and Agricultural Advisory Officers of the East and West of Scotland Agricultural Colleges. (1963). The mineral element content of spring pasture in relation to the occurrence of grass tetany and hypomagnesaemia in dairy cows. Journal of Agricultural Science Cambridge Qh 329-340.
• Call, J. W., Butcher, J. E., Shupe, J. L., Lamb, R. C., Boman, R. L. and Olson, A. E. (1987). Clinical effects of low dietary phosphorus concentrations in feed given to lactating dairy cows. American Journal of Veterinary Research 4S: 133-136.
• Castle, M. E. and Holmes, W. (1960). The intensive production of herbage for crop drying. VII. The effects of continued further massive applications of nitrogen with and without phosphate and potash on the yield of grassland herbage. Journal of Agricultural Science Cambridge 55: 251-260.
• Chalmers, A., Hounsome, B., Lang, B., Renwick, A. and Rush, C. (2000). The British Survey of Fertiliser Practice. Fertiliser use on farm crops for the year 1999. The BSFP Authority. ISBN 0 85310 085 3.
• Chiy, P. C., Al-Tulihan, A. A., Hassan, M. H. and Phillips, C. J. C. (1998). Effects of sodium and potassium fertilisers on the composition of herbage and its acceptability to dairy cows. Journal of the Science of Food and Agriculture 76: 289-297.
• Chiy, P. C. and Phillips, C. J. C. (1996). Effects of sodium fertiliser on the chemical composition of grass and clover leaves, stems and inflorescences. Journal of the Science of Food and Agriculture 72: 501-510.
• Christie, P. (1987). Some long-term effects of slurry on grassland. Journal of Agricultural Science Cambridge 108: 529-541.
• Coombe, N. B. and Hood, A. E. M. (1980). Fertiliser-nitrogen: effects on dairy cow health and performance. Fertiliser Research 1: 157-176.
• Crichton, C. (1968). Observations of mineral deficiencies in cattle. Journal of the British Grassland Society 23: 186-193.
• Davies, W. E., ap Griffiths, G. and Ellington, A. (1966). The assessment of herbage lugume varieties. 2. In vitro digestibility, water soluble carbohydrate, crude protein and mineral content of primary growth of clover and luceme. Journal of Agricultural Science Cambridge 66: 281-304.
• De Boer, G., Buchanan-Smith, J. G., Macleod, G. K. and Walton, J. S. (1981). Responses of dairy cows fed alfalfa silage supplemented with phosphorus, copper, zinc and manganese. Journal of Dmry Science 64: 2370-2377.
• De Groot, Th., Keuning, J. A. and Padmos, C. (1973). High rates of nitrogen on grassland and the health of dairy cattle. Stikstof 16: 4-40.
• Draycott, A. P. and Durrant, M. J. (1972). Comparisons of kieserite and calcined magnesite for sugar beet grown on sandy soils. Journal of

Agricultural Science Cambridge 79: 455-461. • Draycott, A. P., Durrant, M.J. and Bennett, S. N. (1975). Availability to
arable crops of magnesium from kieserite and two forms of calcined magnesite. Journal of Agricultural Science Cambridge 84: 475-480.
• Durrant, M. J. and Draycott, A. P. (1976). Improvements in calcined magnesite as magnesium fertilizer. Journal of Agricultural Science Cambridge 86: 543-552.
• Fishwick, G., Fraser, J., Hemingway, R. G., and Ritchie, N. S. (1977). The effects of dietary phosphorus inadequacy during pregnancy and lactation on the voluntary intake and digestibity of oat straw by beef cows and the performance of their calves. Journal of Agricultural Science Cambridge 88: 143-150.
• Givens, D. I. and Moss, A. R. (1990). U.K. tables of the nutritive value and chemical composition of feedingstuffs. Rowett Research Services, Aberdeen.
• Griffiths, T. W. (1959). Studies on the magnesium status of grassland herbage and its possible significance to animal health. A comparison of various forms of magnesium applied as a fertiliser dressing. Journal of the British Grassland Society 14: 199-205.
• Heddle, R. G. and Crooks, P. (1967). Long term effects of fertilizers on herbage production. Il. Chemical composition. Journal of Agricultural Science Cambridge 69: 433-441.
• Hemingway, R. G. (1961a). Effects of salt and other fertilisers on yield and mineral composition of forage crops. III. Herbage. Journal of the Science of Food and Agriculture 12: 398-406.
• Hemingway, R. G. (1961b). Magnesium, potassium, sodium and calcium contents of herbage as influenced by fertiliser treatments over a three-year period. Journal of the British Grassland Society 16: 106-116.
• Hemingway, R. G. (1962). Copper, molybdenum, manganese and iron contents of herbage as influenced by fertiliser treatments over a three-year period. Journal of the British Grassland Society 17: 182-187.
• Hemingway, R. G. (1973a). Some aspects of the use of non-protein nitrogen compounds in the nutrition of ruminants. New developments in mineral feed additives for animal use. Fertiliser and Development Council. Israel. 1-12.
• Hemingway, R. G. (1973b). Some aspects of the phosphorus and magnesium supplementation of ruminant diets. New developments in mineral feed additives for animal use. Fertiliser and Development Council. Israel. 35-45.
• Hemingway, R. G. (1995). Requirements for sodium by livestock and dietar y
• allowances. Sodium in Agriculture. Ed. Phillips C. J. C. and Chiy, P. C. Chalcombe Publications. 145-161. ISBN 0 948617 30 6.
• Hemingway, R. G. (1999). The effect of changing pattems of fertiliser applications on the major mineral composition of herbage in relation to the requirements of cattle: a 50-year review. Journal of Agricultural Science Cambridge 69: l-l8.

• Hemingway, R. G. (2000). The effect of reducing fertiliser nitrogen and phosphorus applications on the supplementary phosphorus requirements of ruminants. Feed Compounder 20, No 3: 43-45.
• Hemingway, R. G., MacPherson, A., Duthie, A. K. and Brown, N. A. (1968). The mineral composition of hay and silage grown in Scotland in relation to A.R.C. standards for the mineral requirements of dairy cattle. Journal of Agricultural Science Cambridge 71: 53-59.
• Hemingway, R. G., Parker, E. R., Parkins, J. J., Fishwick, G. and Ritchie, N. S. (1998). Bioavailability assessments of granular calcined magnesites derived from magnesite rocks and of magnesium hydroxide powder in sheep. Journal of Agricultural Science Cambridge 131: 229-235.
• Hemingway, R. G. and Ritchie, N S. (1997). Phosphorus, magnesium and copper inadequacies in grazed herbage for lactating cows. Proceedings of the British Society of Animal Science. 160
• Hemingway, R. G. and Ritchie, N. S. (1998). The effects of reduced fertiliser inputs on the supplementary phosphorus requirements of grazing cows. Feed Compounder 18: No 6. 28-29.
• Holmes, W. (1949). The intensive production of herbage for crop drying. Part Il. A study of the effect of massive dressings of nitrogenous fertilizers and the time of their application on the yield, chemical and botanical composition of two grass leys. Journal of Agricultural Science Cambridge 39: 128-136.
• Hooper, L. J. (1967). The uptake of magnesium by herbage and its relationship with soil analysis data. Soil potassium and magnesium. Technical Bulletin No 14. M.A.F.F. 160-170.
• Howard, D. A., Burdin, M. L. and Lampkin, G. H. (1962). Variation in the mineral and crude protein content of pastures at Muguga in the Kenya highlands. Journal of Agricultural Science Cambridge 59: 251-256.
• Hunt, I. V. (1973). Studies of response to fertiliser nitrogen. Part 4. Effects of fertiliser nitrogen on the chemical composition of primary growth of perennial ryegrass. Journal of the British Grassland Society 28: 171-180.
• Hunt, I. V., Alexander, R. H. and Rutherford, A. A. (1964). The effect of various manuring practices on the magnesium status of spring herbage. Journal of the British Grassland Society 19: 224-230.
• Hvidsten, H., Odelien, M., Baerug, R. and Tollersrud, S. (1959). The influence of fertiliser treatment of pastures on the mineral composition of the herbage and the incidence of hypomagnesaemia in dairy cows. Acta Agriculturae Skandinavica 9: 261-291.
• Jones, E. (1963). Studies in the magnesium content of mixed herbage and some individual grass and clover species. Journal of the British Grassland Society 18: 131-138.
• Kemp, A. (1960). Hypomagnesaemia in milking cows: the response of serum magnesium to alterations in herbage composition resulting from potash and nitrogen dressings to pasture. Netherlands Journal of Agricultural Science 8281-304.
• Kemp, A. and t’Hart, M. L. (1957). Grass tetany in grazing milking cows.

Netherlands Journal of Agricultural Science 5: 4-17. • Kincaid, R. L., Hillers, J. K. and Cronrath, J. D. (1981). Calcium and
phosphorus supplementation of rations for lactating cows. Journal of Dairy Science 64: 754-758.
• McConaghy, S., McAllister, J. S. V., Todd, J. R., Rankin, J. E. F. and Kerr, J. (1963). The effects of magnesium compounds and of fertilizers on the mineral composition of herbage and on the incidence of hypomagnesaemia in dairy cows. Journal of Agricultural Science Cambridge 60: 313-319.
• McIntosh, S., Crooks, P and Simpson, K. (1973). Sources of magnesium for grassland. Journal of Agricultural Science Cambridge 81: 507-511.
• MAFF, (1975). Ministry of Agriculture, Fisheries and Food. The important mineral elements in animal nutrition and their optumum concentration in forages. A.D.A.S. Advisory Paper No. 16. London. H.M.S.O.
• MAFF, (1994). Ministry of Agriculture, Fisheries and Food. Fertiliser requirements for agricultural and horticultural crops. Reference Book 209. London. H.M.S.O.
• MAFF et al., (1983).Mnistry of Agriculture, Fisheries and Food, Department of Agriculture for Scotland, Department of Agriculture for Northem Ireland, United Kingdom Agricultural Supply Trade Association, British Veterinary Association Mineral, trace element and vitamin allowances for ruminants. London. H.M.S.O.
• NRC, (1978). National Research Council. Nutrient Requirements of Dairy Cattle. National Academy of Sciences. Washington, D.C.
• NRC, (1989). National Research Council. Nutrient Requirements of Dairy Cattle. 6’” Revised Edition. National Academy of Sciences. Washington, D. C.
• Parkins, J. J. and Fishwick, G. (1998). Magnesium hydroxide as a novel herbage spring supplement for lactating cows and ewes. Proceedings of the British Society of Animal Science 213.
• Parkins, J. J. and Hemingway, R. G. (1998). Responses in dry matter intakes and plasma phosphorus concentrations in ewes given phosphorus sources of contrasting rumen solubility. Proceedings of the British Society of Animal Science. 214.
• Parr, W. H. and Allcroft, R. (1957). The application of magnesium compounds to pasture for the control of hypomagnesaemia in grazing cattle: A comparison between magnesium limestone and calcined magnesite. Veterinary Record 69: 1041-1047.
• Phillips, C. J. C. and Chiy, P. (1995). Sodium in ruminant nutrition, production, reproduction and health. Sodium in Agriculture. Chalcombe Publications. 107-145. ISBN 0 948617 30 6.
• Prins, W. H., Den Boer, D. J. and Van Burg, P. F. J. (1985). Grassland Manuring. Occasional Publication No 20. British Grassland Society. 28-45.
• Reith, J. W. S. and Inkson, R. H. E. in collaboration with Holmes, W., Maclusky, D. S., Reid, D., Heddle, R. G. and Copeman, G.J. F. (1964). The effects of fertilizers on herbage production. Part II. The effect of nitrogen, phosphorus and potassium on botanical and chemical composition. Journal

of Agricultural Science Cambridge 63: 209-216. • Ritchie, N. S. and Fishwick, G. (1977). Magnesium phosphate as a dietary
supplement for lactating cows at spring grass. Journal of Agricultural Science Cambridge 88: 71-73. Ritchie, N. S. and Hemingway, R. G. (1963a). Failure of lactating ewes with low plasma magnesium values to respond to large daily magnesium supplements. Journal of Agricultural Science Cambridge 60: 305.
• Ritchie, N. S. and Hemingway, R. G. (1963b). Effects of conventional magnesium supplementation, breed of ewe and continued potassium fertilizer applications on plasma magnesium and calcium levels in ewes. Jounial of Agricultural Science Cambridge 61: 411-419.
• Ritchie, N. S. and Hemingway, R. G.(1968). Magnesium alloy bullets for dairy cattle. Veterinary Record 82: 87-89.
• SAC / SARI. (1982). Scottish Agricultural Colleges, Scottish Agricultural Research Institutes. Trace element depciency in ruminants. 44.
• Smith, A. M. and Comrie, A. (1948). Composition of Lothians’ seed hay. Scottish Agriculture 28: 67-71.
• Smyth, P. J., Conway, A. and Walsh, M. J. (1958). The influence of different fertiliser treatments on the hypomagnesaemia proneness of a ryegrass sward. Veterinary Record 70: 846-849.
• Steevens, B. J., Bush, L. J., Stout, J. D. and Williams, E. I. (1971). Effects of varying amounts of calcium and phosphorus in rations for dairy cows. Journal of Dairy Science 54: 655-661.
• Stewart, A. B. and Holmes, W. (1953). Manuring of grassland. I. Some effects of heavy dressings of nitrogen on the mineral composition of grassland herbage. Journal of the Science of Food and Agriculture 4: 401-408.
• Storry, J. E. (1961). Changes in blood constituents which occur in dairy cattle transferred to spring pasture. Research in Veterinary Science 2: 272-284.
• Suttle, N. F. (1987). The absorption, retention and function of minor nutrients. The nutrition of herbivores. Ed Ternouth, J. H. and Hacker, J. B., Academic Press. 333-361.
• Todd, J. R. (1965). The influence of soil type on the effectiveness of single dressings of magnesia in raising pasture magnesium content and in controlling hypomagnesaemia. British Veterinary Journal 121: 271-280
• Todd, J. R. and Morrison, N. E. (1964). Control of hypomagnesaemic tetany by foliar application of calcined magnesite. Journal of the British Grassland Society 19: 179-182.
• Thompson, J. K. and Warren, R. W. (1979). Variations in the composition of pasture herbage. Grass and Forage Science 34: 83-88.
• Valk, H. and Sebek, (1999). Influence of long-term feeding of limited amounts of phosphorus on dry matter intake, milk production and body weight of dairy cows. Journal of Dairy Science 82: 2157-2163.
• Walker, T. W., Edwards, G. H. A., Cavell, A.J. and Rose, T. H. (1952). The use of fertilisers on herbage cut for conservation. Part II. Effects on the

mineral composition of herbage cut for silage, and correlation of responses to phosphate and potash with soil and crop analyses. Journal of the British Grassland Society 7: 135-150.
• Wilman, D. (1975.) Nitrogen and Italian ryegrass. 2. Growth up to 14 weeks: nitrogen, phosphorus and potassium content and yield. Journal of the British Grassland Society 30: 243-249.
• Withers, P. J. A. and Peel, S. (1999). Reducing the phosphorus surplus in dairy farm systems. Occasional Symposium No. 33. British Grassland Society. 57-62.
• Witt, K. E. and Owens, F. N. (1983). Phosphorus: ruminal availability and effects on digestion. Journal of Animal Science 56: 930-937.
RELATED PROCEEDINGS OF THE SOCIETY.
• 88 (1965) The Effect of Fertilisers on the Nutritive Value and Production Potential of Forages, W F Raymond and C R W Spedding.
• 105 (1968) Fertilisers and Animal Production, K L Blaxter. • 197 (1981) The Role of Fertilisers in Milk Production, W Thompson and T
Blair. • 198 (1981) The Role of Fertilisers in Meat Production, H K Baker. • 288 (1989) Fertilisers and Grass Quality, H Beringer. • 289 (1989) The Nutritive Value of Grass in Relation to Mineral Deficiencies
and Imbalances in the Ruminant, J Price.