Embed Size (px)
Citation preview
Enquiries on this publication to: Chris Silwood, Department for Environment, Food and Rural Affairs. Tel: ++ 44 (0)20 8026 2899, email: [email protected]. A National Statistics publication. National Statistics are produced to high professional standards. They undergo regular quality assurance reviews to ensure that they meet customer needs. They are produced free from any political interference. For general enquiries about National Statistics, contact the National Statistics Public Enquiry Service: tel. 0845 601 3034 email [email protected]. You can also find National Statistics on the internet at www.statistics.gov.uk.
Published 4 May 2017
Fertiliser usage on farms: Results from the Farm Business Survey, England 2015/16
In 2012/13, the Farm Business Survey (FBS) began to collect data on the quantities of nutrients from manufactured fertilisers that were applied from a subset of farms within the main survey. Questions were also included on the use of precision farming techniques, soil nutrient software, clover and legumes in grass swards1, green manures and areas subject to fertiliser restrictions. In 2015/16, coverage was widened to cover all farm types; data was not previously collected from horticulture farms and farms with no farmed area (e.g. some pig/poultry farms). This notice presents the results for 2015/16. The key findings are: General questions
Around a fifth of farm businesses carried out precision farming techniques i.e. soil mapping and use of satellite technology to guide fertiliser application (21%) in 2015/16. Usage was more likely on cereal and general cropping farms.
Just under a quarter of farms (23% in 2015/16) used soil nutrient software packages to help determine fertiliser applications. There has been little overall change since 2012/13. Usage was most common on cereal and general cropping farms and very large farms.
Just over half of those farms with grass included clover or legumes in their grass swards (58% in 2015/16). Compared to other farm types, sizes and regions, this practice was most common on dairy farms, on larger farms and on farms in the South West. The practice appears to be increasing on farms in the Midlands.
Very few farmers use green manures in their arable rotations (12% in 2015/16). General cropping, horticulture and organic farms were more likely to use green manures than other farm types.
For those farms using either clover and legumes or green manures around two thirds made adjustments to their fertiliser application rates.
Just over half of farms recorded that some of their land was subject to restricted fertiliser applications arising from agri-environment schemes. For 7% of farms the restrictions covered all of their utilised agricultural area (UAA).
1 Grass sward = land/soil with a layer of grass
2
Manufactured Fertiliser application rates
There has been little change in overall application rates since 2012/13.
The average amount of nitrogen applied per hectare of farmed area (excluding rough grazing) was 113 kg in 2015/16. Cereal farms had the highest application rates whilst grazing livestock farms had the lowest.
The average amount of phosphate applied per hectare of farmed area (excluding rough grazing) was 20 kg per hectare in 2015/16. Cereal farms had the highest application rates while grazing livestock farms had the lowest.
The average amount of potash applied per hectare of farmed area (excluding rough grazing) was 25 kg per hectare in 2015/16. General cropping farms had the highest application rates, while pigs and poultry farms had the lowest.
Detailed results
Historically, the Farm Business Survey (FBS) has focused on the collection of financial rather than physical data for agricultural inputs. Over recent years attention has turned to agriculture’s environmental footprint and the need to develop a more sustainable industry. Nutrients, particularly nitrogen, are the biggest determinant of yield and also have a major impact on crop/sward structure and the quality of the end product. Nutrient losses to ground and surface waters can cause pollution affecting biodiversity (through eutrophication) and the quality of drinking water. Gaseous losses as ammonia and oxides of nitrogen also cause air pollution, can contribute to the eutrophication of sensitive habitats and to climate change. Any measures taken to reduce nutrient losses should also result in better financial returns to the farmer. In order to better measure a farm’s environmental footprint one of the most important data gaps to address is the quantity of nitrogen (N), phosphate (P2O5) and potash (K2O) applied as fertiliser in their manufactured form. In 2012/13 these quantities were collected for the first time within the FBS. The data collected will:
provide important data needed to estimate the environmental footprint of farming
enable farms to benchmark their environmental performance as well as their financial performance
meet Farm Accountancy Data Network (FADN) requirements for data on fertiliser quantities.
The data used for this analysis is from a subset of farms that completed the fertiliser module in the 2015/16 FBS. Completion of the fertiliser module was voluntary. The Farm Business Survey covers those farms with at least 25 thousand euros of standard output. A sample of 1329 farms was achieved in 2015/16. Weights were derived for this sub sample in line with the method described in the survey methodology section (e.g. to preserve the population totals for robust farm types and farm size groups). This release provides the main results from the 2015/16 FBS. The results are presented together with confidence intervals and with comparisons to 2012/13, 2013/14 and 2014/15. It should be noted that results prior to 2015/16 were restricted to those farms with a farmed area2 and did not include horticulture farms. This change has had a minimal impact on the results. Where there is a difference the results are also shown on a comparable basis to
2 Farmed area = Utilised Agricultural Area + bare land rented in + forage area hired in - bare land let out -
forage area let out. Some specialist pig and poultry farms have no farmed area.
3
2014/15. The full breakdown of results, by farm type, farm size, region, farm tenure, farmer age, farm economic performance and Nitrate Vulnerable Zones (NVZs)3, can be found at: https://www.gov.uk/government/collections/farm-business-survey#documents Regression models were fitted to the key results to help determine the main factors driving response. In each case seven factors were considered - farm type, farm size, farm tenure, farmer’s age, region, farm economic performance and Nitrate Vulnerable Zones (NVZs). 1 Weather
This release provides the main results from the 2015/16 FBS which covered the 2015 harvest. Weather conditions can influence the crops grown and fertiliser usage on farm. This section describes the weather conditions that affected the 2015 harvest, for information about the 2012 to 2014 harvests see Appendix A. 2015/16 (2015 harvest)
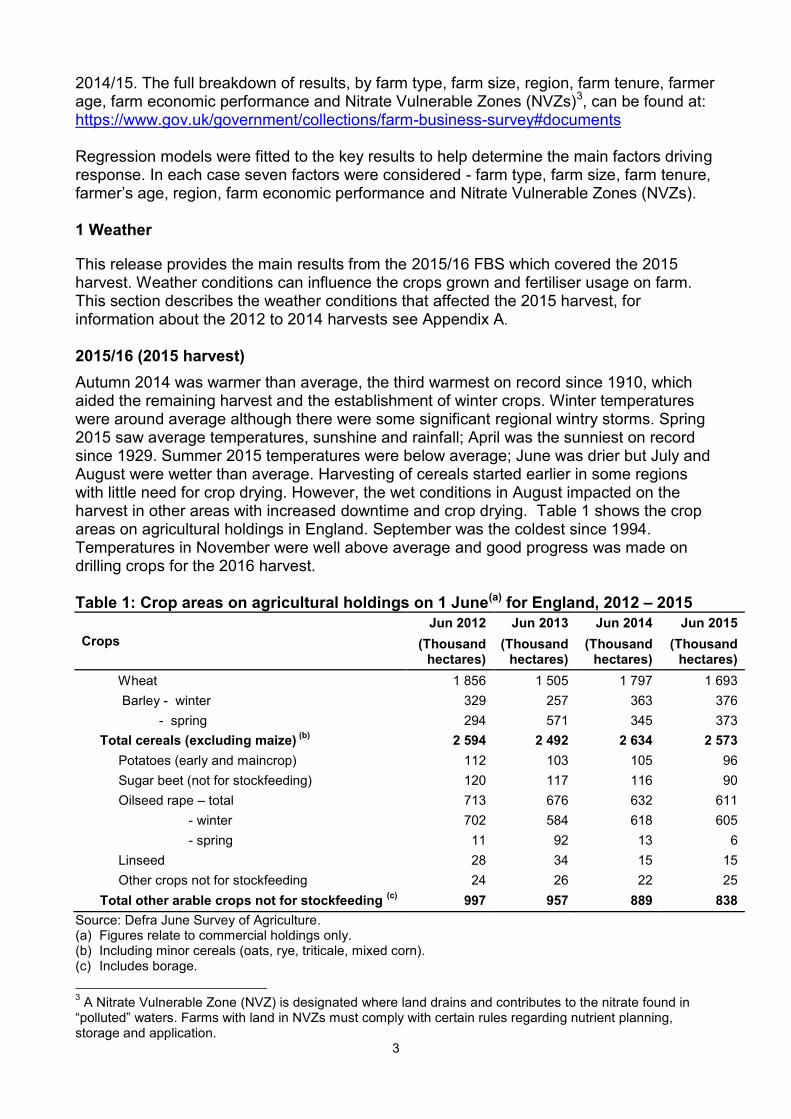
Autumn 2014 was warmer than average, the third warmest on record since 1910, which aided the remaining harvest and the establishment of winter crops. Winter temperatures were around average although there were some significant regional wintry storms. Spring 2015 saw average temperatures, sunshine and rainfall; April was the sunniest on record since 1929. Summer 2015 temperatures were below average; June was drier but July and August were wetter than average. Harvesting of cereals started earlier in some regions with little need for crop drying. However, the wet conditions in August impacted on the harvest in other areas with increased downtime and crop drying. Table 1 shows the crop areas on agricultural holdings in England. September was the coldest since 1994. Temperatures in November were well above average and good progress was made on drilling crops for the 2016 harvest. Table 1: Crop areas on agricultural holdings on 1 June(a) for England, 2012 – 2015
Crops
Jun 2012 Jun 2013 Jun 2014 Jun 2015
(Thousand hectares)
(Thousand hectares)
(Thousand hectares)
(Thousand hectares)
Wheat 1 856 1 505 1 797 1 693
Barley - winter 329 257 363 376
- spring 294 571 345 373
Total cereals (excluding maize) (b)
2 594 2 492 2 634 2 573
Potatoes (early and maincrop) 112 103 105 96
Sugar beet (not for stockfeeding) 120 117 116 90
Oilseed rape – total 713 676 632 611
- winter 702 584 618 605
- spring 11 92 13 6
Linseed 28 34 15 15
Other crops not for stockfeeding 24 26 22 25
Total other arable crops not for stockfeeding (c)
997 957 889 838
Source: Defra June Survey of Agriculture. (a) Figures relate to commercial holdings only. (b) Including minor cereals (oats, rye, triticale, mixed corn). (c) Includes borage.
3 A Nitrate Vulnerable Zone (NVZ) is designated where land drains and contributes to the nitrate found in
“polluted” waters. Farms with land in NVZs must comply with certain rules regarding nutrient planning, storage and application.
4
2 General questions
The survey included six general questions covering the use of precision farming techniques, soil nutrient software, clover and legumes in grass swards, green manures and fertiliser restrictions.
Key findings:
Around a fifth of farm businesses carried out precision farming techniques i.e. soil mapping and use of satellite technology to guide fertiliser application (21%) in 2015/16. Usage was more likely on cereal (44%) and general cropping farms (50%).
Just under a quarter of farms (23% in 2015/16) used soil nutrient software packages to help determine fertiliser applications. There has been little overall change since 2012/13. Usage was most common on cereal and general cropping farms and very large farms.
Just over half of those farms with grass included clover or legumes in their grass swards (58% in 2015/16). Compared to other farm types, sizes and regions, this practice was most common on dairy farms, on larger farms and on farms in the South West. The practice appears to be increasing on farms in the Midlands.
Very few farmers use green manures in their arable rotations (12% in 2015/16). General cropping, horticulture and organic farms were more likely to use green manures than other farm types.
For those farms using either clover and legumes or green manures around two thirds made adjustments to their fertiliser application rates.
Just over half of farms recorded that some of their land was subject to restricted fertiliser applications. For 7% of farms the restrictions covered all of their utilised agricultural area (UAA).
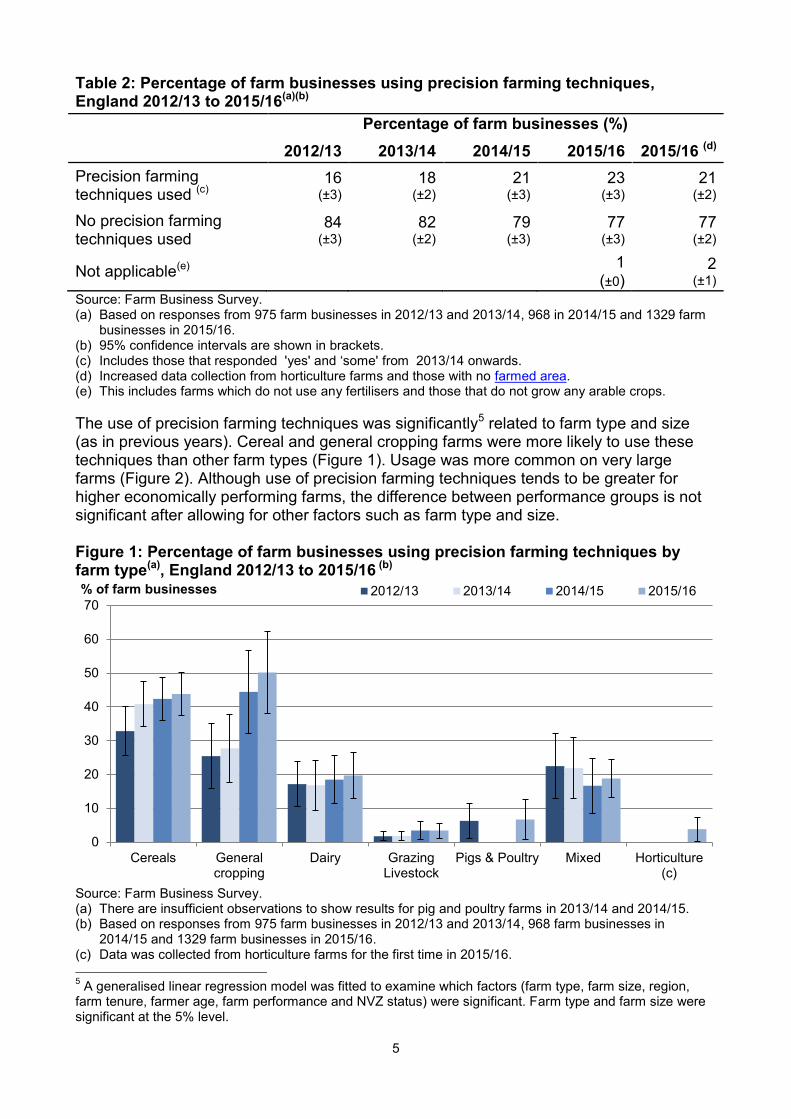
2.1 Precision farming techniques
Precision farming techniques can make processes such as fertiliser application more efficient. Growers must balance the cost of inputs with a demand for higher yields and the pressure of increased environmental awareness and compliance. Precision technology can help to improve the efficiency of farm operations, including cultivation and better targeted fertiliser and agrochemical applications. This can reduce input use (and cost) and improve soil structure. Farmers were specifically asked if they carried out precision farming techniques (i.e. soil mapping and the use of satellite technology to guide fertiliser applications). In 2015/16 21% of farms used these techniques (Table 2). The results are broadly comparable with findings from the 2012 Farm Practices Survey4 (FPS) which found that 25% of farms used either soil mapping or variable rate application techniques.
4 https://www.gov.uk/government/statistics/farm-practices-survey-october-2012-current-farming-issues
5
Table 2: Percentage of farm businesses using precision farming techniques, England 2012/13 to 2015/16(a)(b)
Percentage of farm businesses (%)
2012/13 2013/14 2014/15 2015/16 2015/16 (d)
Precision farming techniques used (c)
16 (±3)
18 (±2)
21 (±3)
23 (±3)
21 (±2)
No precision farming techniques used
84 (±3)
82 (±2)
79 (±3)
77 (±3)
77 (±2)
Not applicable(e) 1
(±0) 2
(±1)
Source: Farm Business Survey. (a) Based on responses from 975 farm businesses in 2012/13 and 2013/14, 968 in 2014/15 and 1329 farm
businesses in 2015/16. (b) 95% confidence intervals are shown in brackets. (c) Includes those that responded 'yes' and ‘some' from 2013/14 onwards. (d) Increased data collection from horticulture farms and those with no farmed area. (e) This includes farms which do not use any fertilisers and those that do not grow any arable crops.
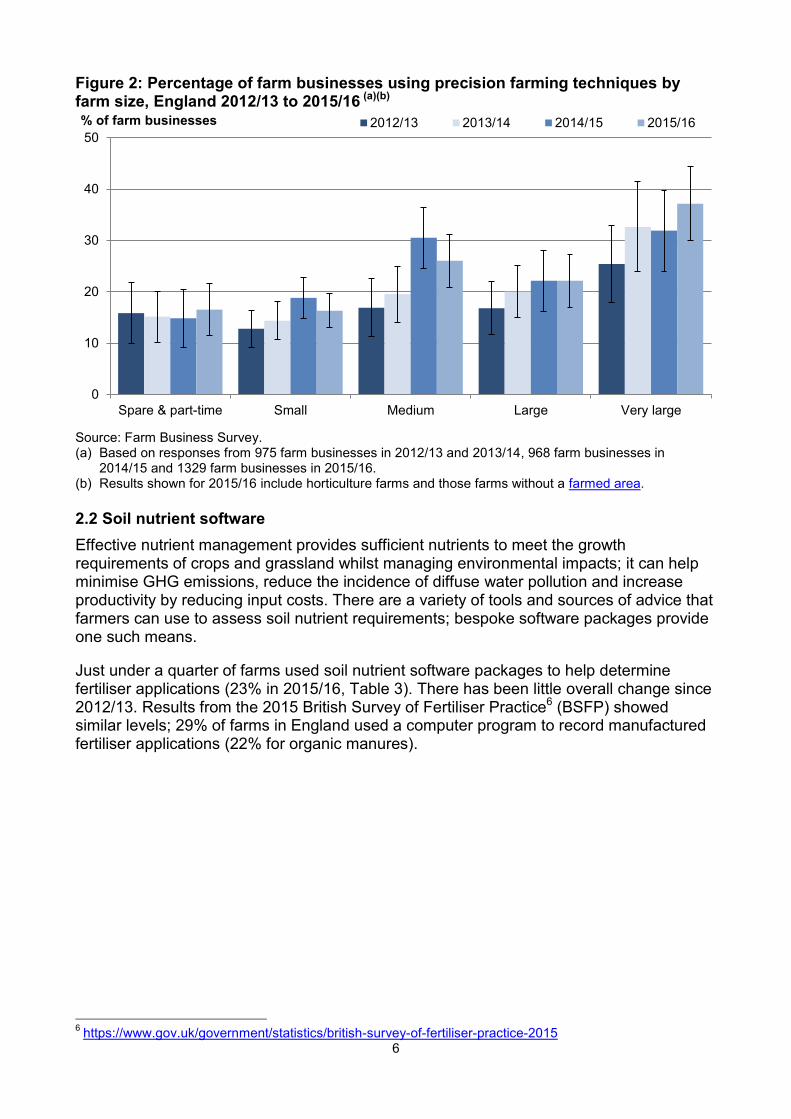
The use of precision farming techniques was significantly5 related to farm type and size (as in previous years). Cereal and general cropping farms were more likely to use these techniques than other farm types (Figure 1). Usage was more common on very large farms (Figure 2). Although use of precision farming techniques tends to be greater for higher economically performing farms, the difference between performance groups is not significant after allowing for other factors such as farm type and size. Figure 1: Percentage of farm businesses using precision farming techniques by farm type(a), England 2012/13 to 2015/16 (b)
Source: Farm Business Survey. (a) There are insufficient observations to show results for pig and poultry farms in 2013/14 and 2014/15. (b) Based on responses from 975 farm businesses in 2012/13 and 2013/14, 968 farm businesses in
2014/15 and 1329 farm businesses in 2015/16. (c) Data was collected from horticulture farms for the first time in 2015/16.
5 A generalised linear regression model was fitted to examine which factors (farm type, farm size, region,
farm tenure, farmer age, farm performance and NVZ status) were significant. Farm type and farm size were significant at the 5% level.
0
10
20
30
40
50
60
70
Cereals Generalcropping
Dairy GrazingLivestock
Pigs & Poultry Mixed Horticulture(c)
% of farm businesses 2012/13 2013/14 2014/15 2015/16
6
Figure 2: Percentage of farm businesses using precision farming techniques by farm size, England 2012/13 to 2015/16 (a)(b)
Source: Farm Business Survey. (a) Based on responses from 975 farm businesses in 2012/13 and 2013/14, 968 farm businesses in
2014/15 and 1329 farm businesses in 2015/16. (b) Results shown for 2015/16 include horticulture farms and those farms without a farmed area.
2.2 Soil nutrient software
Effective nutrient management provides sufficient nutrients to meet the growth requirements of crops and grassland whilst managing environmental impacts; it can help minimise GHG emissions, reduce the incidence of diffuse water pollution and increase productivity by reducing input costs. There are a variety of tools and sources of advice that farmers can use to assess soil nutrient requirements; bespoke software packages provide one such means.
Just under a quarter of farms used soil nutrient software packages to help determine fertiliser applications (23% in 2015/16, Table 3). There has been little overall change since 2012/13. Results from the 2015 British Survey of Fertiliser Practice6 (BSFP) showed similar levels; 29% of farms in England used a computer program to record manufactured fertiliser applications (22% for organic manures). 6 https://www.gov.uk/government/statistics/british-survey-of-fertiliser-practice-2015
0
10
20
30
40
50
Spare & part-time Small Medium Large Very large
% of farm businesses 2012/13 2013/14 2014/15 2015/16
7
Table 3: Percentage of farm businesses using soil nutrient software packages to help determine fertiliser applications, England 2012/13 to 2015/16 (a)(b)
Percentage of farm businesses (%)
2012/13 2013/14 2014/15 2015/16 2015/16 (c)
Soil nutrient software used 22
(±3) 23
(±3) 23 (±3)
24 (±3)
23 (±2)
No soil nutrient software used
78 (±3)
77 (±3)
77 (±3)
76 (±3)
76 (±3)
Not applicable(d) 0
(±0) 1
(±1)
Source: Farm Business Survey. (a) Based on responses from 975 farm businesses in 2012/13 and 2013/14, 968 farm businesses in
2014/15 and 1329 farm businesses in 2015/16. (b) 95% confidence intervals are shown in brackets. (c) Increased data collection from horticulture farms and those with no farmed area. (d) This includes farms which do not use any fertilisers and those that do not grow any arable crops.
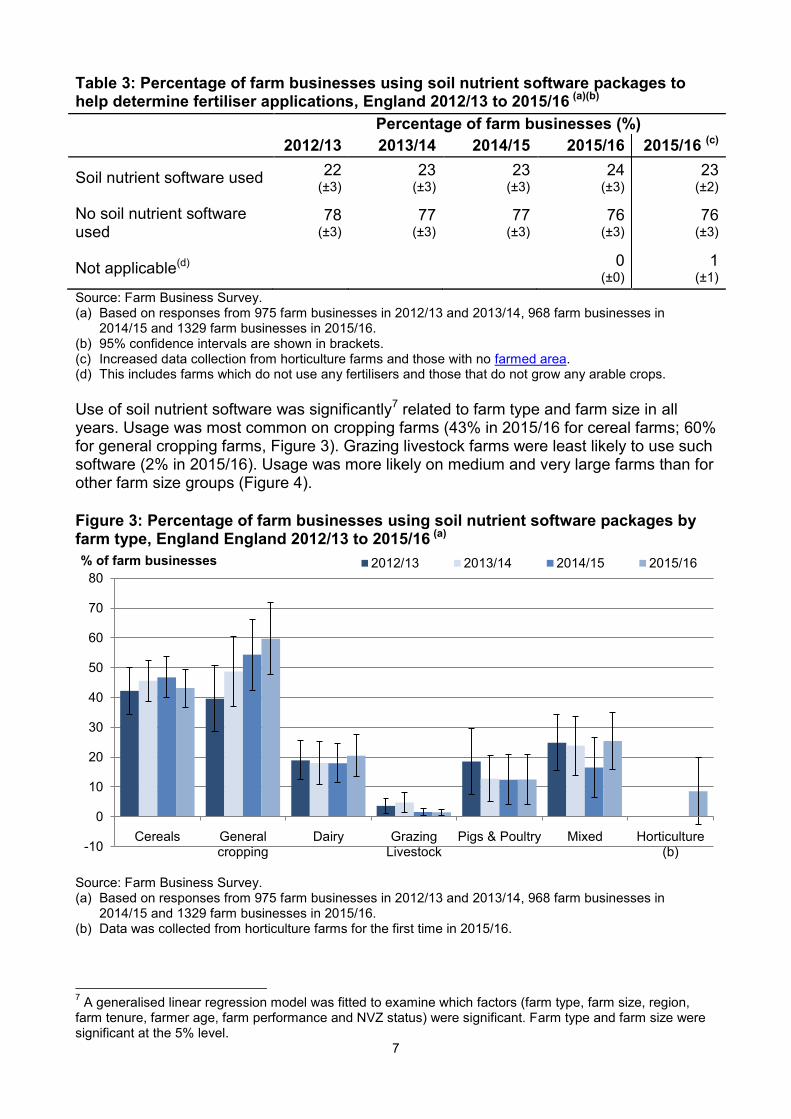
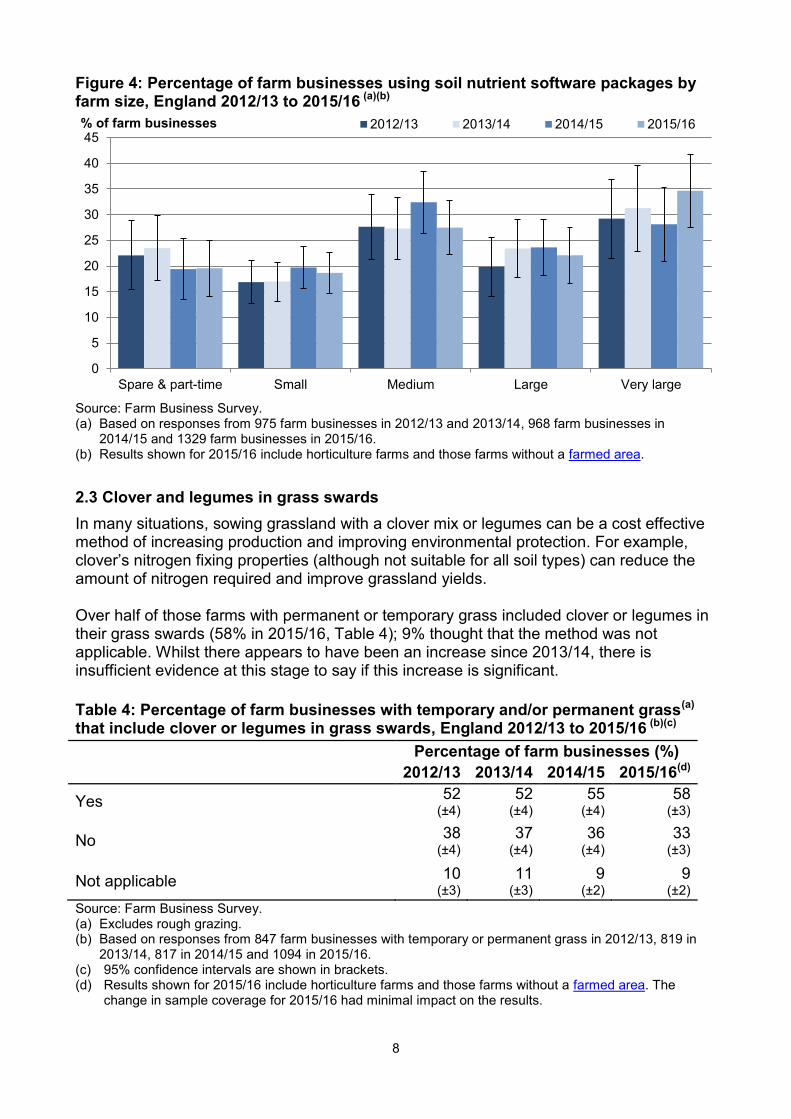
Use of soil nutrient software was significantly7 related to farm type and farm size in all years. Usage was most common on cropping farms (43% in 2015/16 for cereal farms; 60% for general cropping farms, Figure 3). Grazing livestock farms were least likely to use such software (2% in 2015/16). Usage was more likely on medium and very large farms than for other farm size groups (Figure 4).
Figure 3: Percentage of farm businesses using soil nutrient software packages by farm type, England England 2012/13 to 2015/16 (a)
Source: Farm Business Survey. (a) Based on responses from 975 farm businesses in 2012/13 and 2013/14, 968 farm businesses in
2014/15 and 1329 farm businesses in 2015/16. (b) Data was collected from horticulture farms for the first time in 2015/16.
7 A generalised linear regression model was fitted to examine which factors (farm type, farm size, region,
farm tenure, farmer age, farm performance and NVZ status) were significant. Farm type and farm size were significant at the 5% level.
-10
0
10
20
30
40
50
60
70
80
Cereals Generalcropping
Dairy GrazingLivestock
Pigs & Poultry Mixed Horticulture(b)
% of farm businesses 2012/13 2013/14 2014/15 2015/16
8
Figure 4: Percentage of farm businesses using soil nutrient software packages by farm size, England 2012/13 to 2015/16 (a)(b)
Source: Farm Business Survey. (a) Based on responses from 975 farm businesses in 2012/13 and 2013/14, 968 farm businesses in
2014/15 and 1329 farm businesses in 2015/16. (b) Results shown for 2015/16 include horticulture farms and those farms without a farmed area.
2.3 Clover and legumes in grass swards
In many situations, sowing grassland with a clover mix or legumes can be a cost effective method of increasing production and improving environmental protection. For example, clover’s nitrogen fixing properties (although not suitable for all soil types) can reduce the amount of nitrogen required and improve grassland yields. Over half of those farms with permanent or temporary grass included clover or legumes in their grass swards (58% in 2015/16, Table 4); 9% thought that the method was not applicable. Whilst there appears to have been an increase since 2013/14, there is insufficient evidence at this stage to say if this increase is significant.
Table 4: Percentage of farm businesses with temporary and/or permanent grass(a) that include clover or legumes in grass swards, England 2012/13 to 2015/16 (b)(c)
Percentage of farm businesses (%)
2012/13 2013/14 2014/15 2015/16(d)
Yes 52
(±4) 52
(±4) 55
(±4) 58
(±3)
No 38
(±4) 37
(±4) 36
(±4) 33
(±3)
Not applicable 10 (±3)
11 (±3)
9 (±2)
9 (±2)
Source: Farm Business Survey. (a) Excludes rough grazing. (b) Based on responses from 847 farm businesses with temporary or permanent grass in 2012/13, 819 in
2013/14, 817 in 2014/15 and 1094 in 2015/16. (c) 95% confidence intervals are shown in brackets. (d) Results shown for 2015/16 include horticulture farms and those farms without a farmed area. The
change in sample coverage for 2015/16 had minimal impact on the results.
0
5
10
15
20
25
30
35
40
45
Spare & part-time Small Medium Large Very large
% of farm businesses 2012/13 2013/14 2014/15 2015/16
9
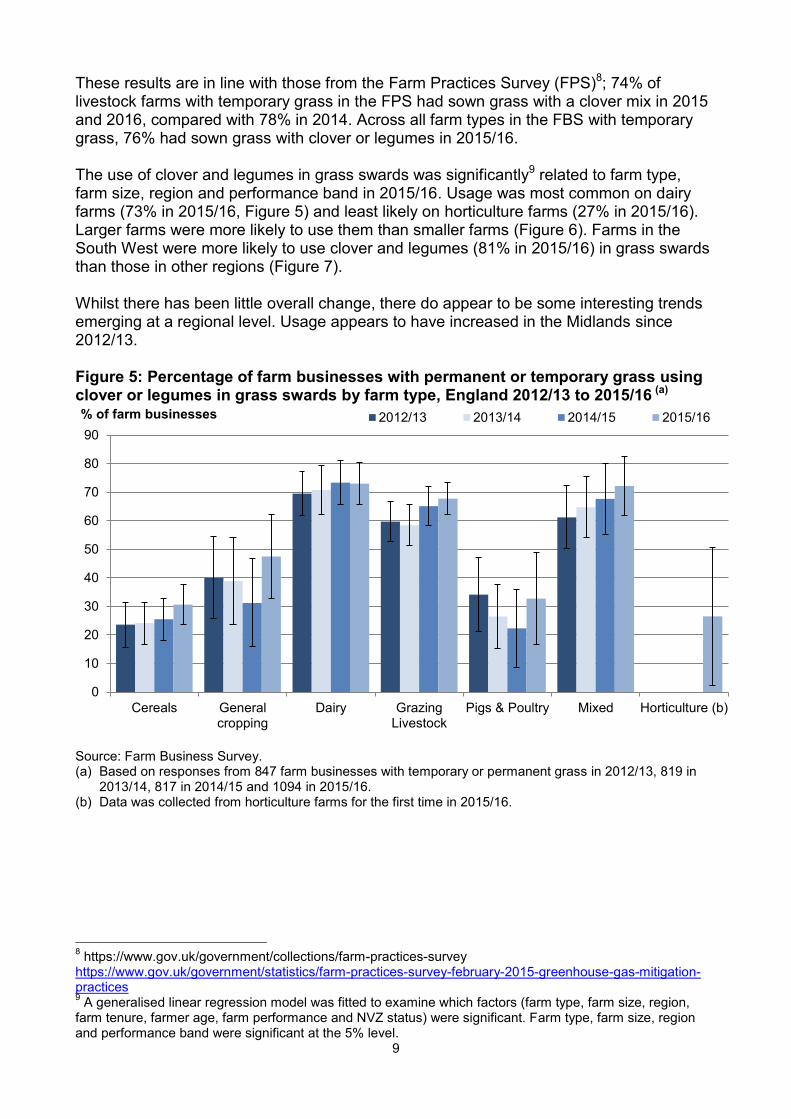
These results are in line with those from the Farm Practices Survey (FPS)8; 74% of livestock farms with temporary grass in the FPS had sown grass with a clover mix in 2015 and 2016, compared with 78% in 2014. Across all farm types in the FBS with temporary grass, 76% had sown grass with clover or legumes in 2015/16. The use of clover and legumes in grass swards was significantly9 related to farm type, farm size, region and performance band in 2015/16. Usage was most common on dairy farms (73% in 2015/16, Figure 5) and least likely on horticulture farms (27% in 2015/16). Larger farms were more likely to use them than smaller farms (Figure 6). Farms in the South West were more likely to use clover and legumes (81% in 2015/16) in grass swards than those in other regions (Figure 7). Whilst there has been little overall change, there do appear to be some interesting trends emerging at a regional level. Usage appears to have increased in the Midlands since 2012/13. Figure 5: Percentage of farm businesses with permanent or temporary grass using clover or legumes in grass swards by farm type, England 2012/13 to 2015/16 (a)
Source: Farm Business Survey. (a) Based on responses from 847 farm businesses with temporary or permanent grass in 2012/13, 819 in
2013/14, 817 in 2014/15 and 1094 in 2015/16. (b) Data was collected from horticulture farms for the first time in 2015/16.
8 https://www.gov.uk/government/collections/farm-practices-survey
https://www.gov.uk/government/statistics/farm-practices-survey-february-2015-greenhouse-gas-mitigation-practices 9 A generalised linear regression model was fitted to examine which factors (farm type, farm size, region,
farm tenure, farmer age, farm performance and NVZ status) were significant. Farm type, farm size, region and performance band were significant at the 5% level.
0
10
20
30
40
50
60
70
80
90
Cereals Generalcropping
Dairy GrazingLivestock
Pigs & Poultry Mixed Horticulture (b)
% of farm businesses 2012/13 2013/14 2014/15 2015/16

10
Figure 6: Percentage of farm businesses with permanent or temporary grass using clover or legumes in grass swards by farm size, England 2012/13 to 2015/16 (a)(b)
Source: Farm Business Survey. (a) Based on responses from 847 farm businesses with temporary or permanent grass in 2012/13, 819 in
2013/14, 817 in 2014/15 and 1094 in 2015/16. (b) Results shown for 2015/16 include horticulture farms and those farms without a farmed area.
Figure 7: Percentage of farm businesses with permanent or temporary grass using clover or legumes in grass swards by region, England 2012/13 to 2015/16 (a)(b)
Source: Farm Business Survey. (a) Based on responses from 847 farm businesses with temporary or permanent grass in 2012/13, 819 in
2013/14, 817 in 2014/15 and 1094 in 2015/16. (b) Results shown for 2015/16 include horticulture farms and those farms without a farmed area.
2.4 Green manures
Green manures are crops grown specifically for building and maintaining soil fertility and structure, although they may also have other functions such as weed control and preventing leaching of soluble nutrients. They are normally incorporated back into the soil, either directly, or after removal and composting. Few farmers use green manures in their arable rotations (12% in 2015/16, Table 5).
0
10
20
30
40
50
60
70
80
90
Spare & part-time Small Medium Large Very large
% of farm businesses 2012/13 2013/14 2014/15 2015/16
0
20
40
60
80
100
North East,Yorkshire &
Humber
North West EastMidlands
WestMidlands
East ofEngland
South East South West
% of farm businesses 2012/13 2013/14 2014/15 2015/16

11
Table 5: Percentage of farm businesses employing green manures in arable rotation(a), England 2012/13 to 2015/16 (a)(b)
Percentage of farm businesses (%)
2012/13 2013/14 2014/15 2015/16 2015/16(c)
Yes 10
(±3) 8
(±2) 8
(±2) 11
(±3) 12
(±2)
No 78
(±4) 80
(±3) 79
(±3) 77
(±4) 73
(±3)
Not applicable 12 (±3)
12 (±3)
12 (±3)
13 (±3)
16 (±3)
Source: Farm Business Survey. Restricted to those with a tillage area but excluding temporary grass. (a) Based on responses from 670 farm businesses in 2012/13, 688 in 2013/14, 684 in 2014/15 and 927 in
2015/16. (b) 95% confidence intervals are shown in brackets. (c) Increased data collection from horticulture farms and those with no farmed area.
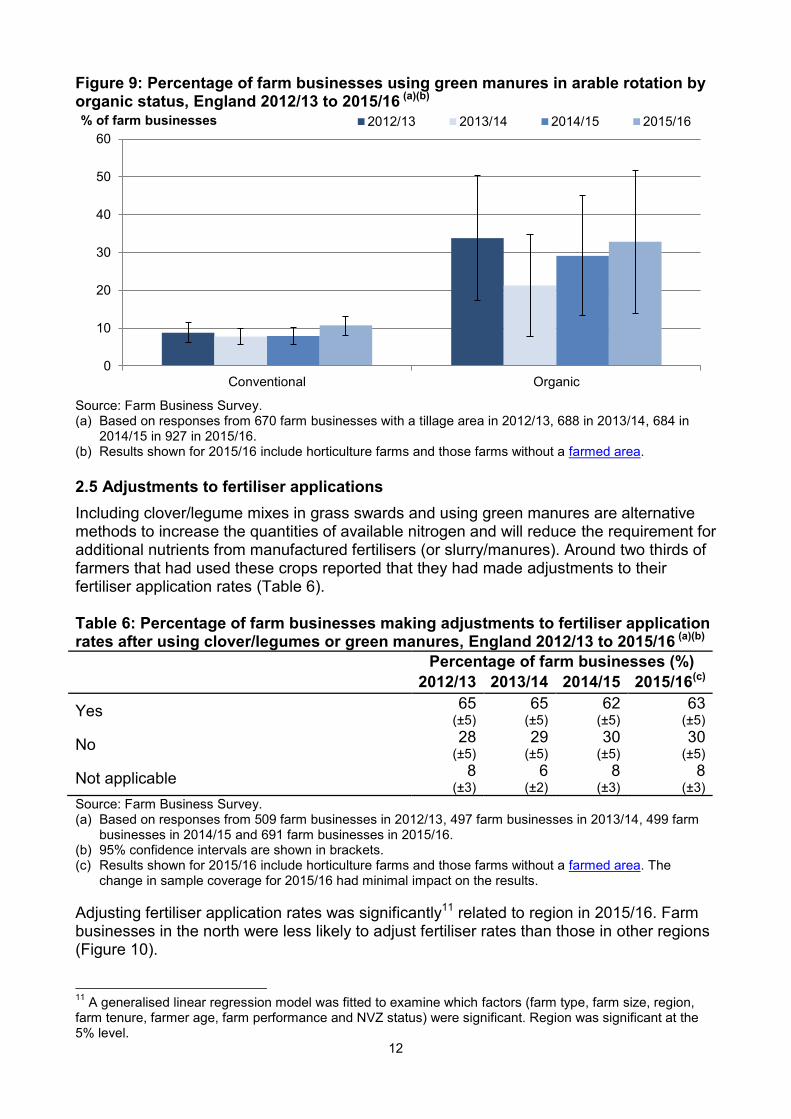
Use of green manures was significantly10 related to farm type, organic status and region in 2015/16. General cropping (23% in 2015/16) and horticulture farms (20% in 2015/16) were more likely to use green manures (Figure 8). Organic farms were more likely to use green manures than conventional farms (Figure 9). Use of green manures was more likely on very large farms and on farms in the East of England. Figure 8: Percentage of farm businesses using green manures in arable rotation by farm type, England 2012/13 to 2015/16 (a)(b)
Source: Farm Business Survey. (a) Based on responses from 670 farm businesses with a tillage area in 2012/13, 688 in 2013/14, 684 in
2014/15 and 927 in 2015/16. (b) There are insufficient observations to show results for pig and poultry farms and for dairy farms in
2013/14. (c) Data was collected from horticulture farms for the first time in 2015/16.
10
A generalised linear regression model was fitted to examine which factors (farm type, farm size, region, farm tenure, farmer age, farm performance, NVZ bands and organic status) were significant. Farm type, organic status and region were significant at the 5% level.
0
5
10
15
20
25
30
35
40
Cereals Generalcropping
Dairy GrazingLivestock
Mixed Horticulture (b)
% of farm businesses 2012/13 2013/14 2014/15 2015/16
12
Figure 9: Percentage of farm businesses using green manures in arable rotation by organic status, England 2012/13 to 2015/16 (a)(b)
Source: Farm Business Survey. (a) Based on responses from 670 farm businesses with a tillage area in 2012/13, 688 in 2013/14, 684 in
2014/15 in 927 in 2015/16. (b) Results shown for 2015/16 include horticulture farms and those farms without a farmed area.
2.5 Adjustments to fertiliser applications
Including clover/legume mixes in grass swards and using green manures are alternative methods to increase the quantities of available nitrogen and will reduce the requirement for additional nutrients from manufactured fertilisers (or slurry/manures). Around two thirds of farmers that had used these crops reported that they had made adjustments to their fertiliser application rates (Table 6). Table 6: Percentage of farm businesses making adjustments to fertiliser application rates after using clover/legumes or green manures, England 2012/13 to 2015/16 (a)(b)
Percentage of farm businesses (%)
2012/13 2013/14 2014/15 2015/16(c)
Yes 65
(±5) 65
(±5) 62
(±5) 63
(±5)
No 28
(±5) 29
(±5) 30
(±5) 30
(±5)
Not applicable 8 (±3)
6 (±2)
8 (±3)
8 (±3)
Source: Farm Business Survey. (a) Based on responses from 509 farm businesses in 2012/13, 497 farm businesses in 2013/14, 499 farm
businesses in 2014/15 and 691 farm businesses in 2015/16. (b) 95% confidence intervals are shown in brackets. (c) Results shown for 2015/16 include horticulture farms and those farms without a farmed area. The
change in sample coverage for 2015/16 had minimal impact on the results.
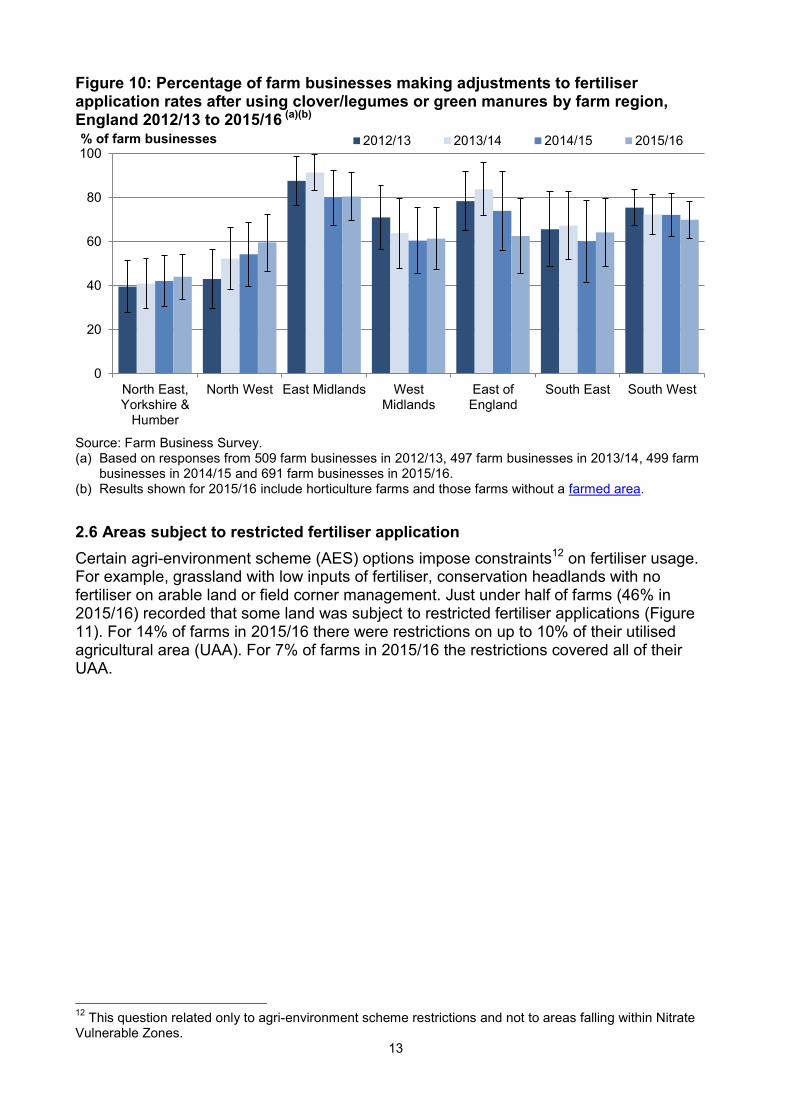
Adjusting fertiliser application rates was significantly11 related to region in 2015/16. Farm businesses in the north were less likely to adjust fertiliser rates than those in other regions (Figure 10). 11
A generalised linear regression model was fitted to examine which factors (farm type, farm size, region, farm tenure, farmer age, farm performance and NVZ status) were significant. Region was significant at the 5% level.
0
10
20
30
40
50
60
Conventional Organic
% of farm businesses 2012/13 2013/14 2014/15 2015/16
13
Figure 10: Percentage of farm businesses making adjustments to fertiliser application rates after using clover/legumes or green manures by farm region, England 2012/13 to 2015/16 (a)(b)
Source: Farm Business Survey. (a) Based on responses from 509 farm businesses in 2012/13, 497 farm businesses in 2013/14, 499 farm
businesses in 2014/15 and 691 farm businesses in 2015/16. (b) Results shown for 2015/16 include horticulture farms and those farms without a farmed area.
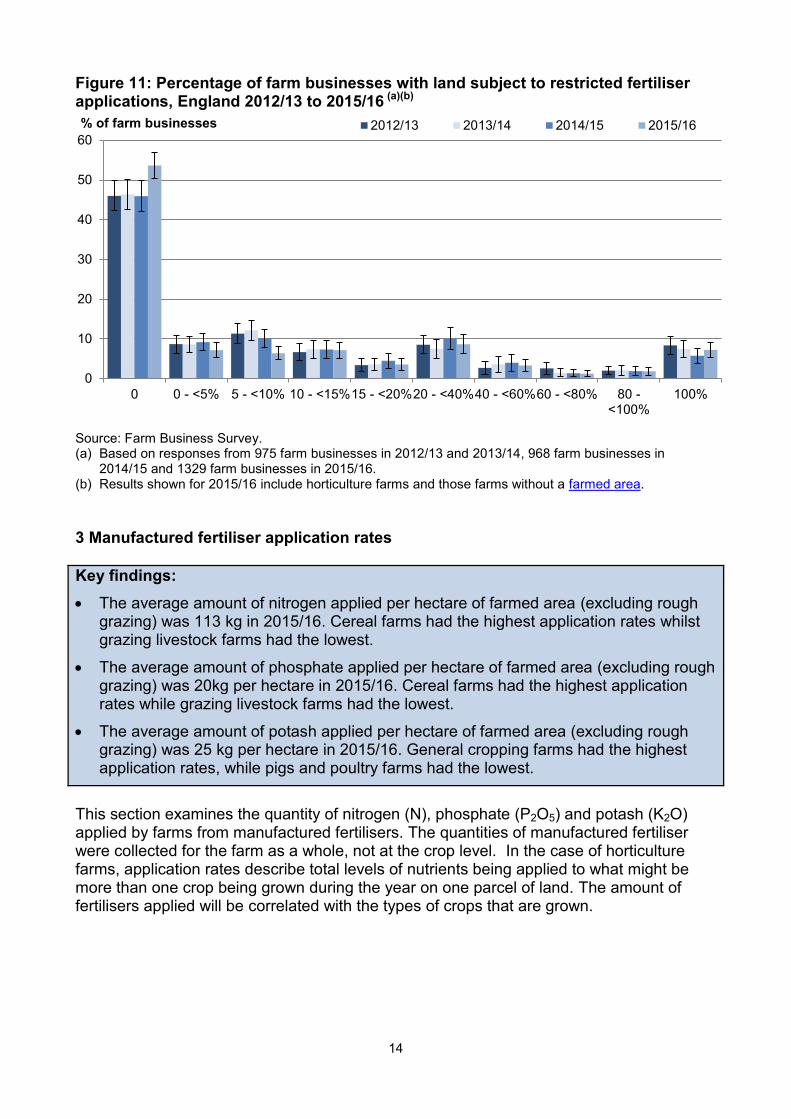
2.6 Areas subject to restricted fertiliser application
Certain agri-environment scheme (AES) options impose constraints12 on fertiliser usage. For example, grassland with low inputs of fertiliser, conservation headlands with no fertiliser on arable land or field corner management. Just under half of farms (46% in 2015/16) recorded that some land was subject to restricted fertiliser applications (Figure 11). For 14% of farms in 2015/16 there were restrictions on up to 10% of their utilised agricultural area (UAA). For 7% of farms in 2015/16 the restrictions covered all of their UAA.
12
This question related only to agri-environment scheme restrictions and not to areas falling within Nitrate Vulnerable Zones.
0
20
40
60
80
100
North East,Yorkshire &
Humber
North West East Midlands WestMidlands
East ofEngland
South East South West
% of farm businesses 2012/13 2013/14 2014/15 2015/16
14
Figure 11: Percentage of farm businesses with land subject to restricted fertiliser applications, England 2012/13 to 2015/16 (a)(b)
Source: Farm Business Survey. (a) Based on responses from 975 farm businesses in 2012/13 and 2013/14, 968 farm businesses in
2014/15 and 1329 farm businesses in 2015/16. (b) Results shown for 2015/16 include horticulture farms and those farms without a farmed area.
3 Manufactured fertiliser application rates
Key findings:
The average amount of nitrogen applied per hectare of farmed area (excluding rough grazing) was 113 kg in 2015/16. Cereal farms had the highest application rates whilst grazing livestock farms had the lowest.
The average amount of phosphate applied per hectare of farmed area (excluding rough grazing) was 20kg per hectare in 2015/16. Cereal farms had the highest application rates while grazing livestock farms had the lowest.
The average amount of potash applied per hectare of farmed area (excluding rough grazing) was 25 kg per hectare in 2015/16. General cropping farms had the highest application rates, while pigs and poultry farms had the lowest.
This section examines the quantity of nitrogen (N), phosphate (P2O5) and potash (K2O) applied by farms from manufactured fertilisers. The quantities of manufactured fertiliser were collected for the farm as a whole, not at the crop level. In the case of horticulture farms, application rates describe total levels of nutrients being applied to what might be more than one crop being grown during the year on one parcel of land. The amount of fertilisers applied will be correlated with the types of crops that are grown.
0
10
20
30
40
50
60
0 0 - <5% 5 - <10% 10 - <15%15 - <20%20 - <40%40 - <60%60 - <80% 80 -<100%
100%
% of farm businesses 2012/13 2013/14 2014/15 2015/16

15
3.1 Nitrogen (N)
The average amount of nitrogen applied per hectare of farmed area13 (excluding rough grazing) was 113 kg in 2015/16 (Table 7), unchanged from previous years. This is slightly higher and showing less year on year variation than the overall application rates for manufactured fertilisers for England from the British Survey of Fertiliser Practice (BSFP)14 [106 kg per hectare in 2015]. The BSFP collects detailed data on fertiliser application rates at crop level. Table 7: Overall nitrogen application rates per hectare of farmed area (excluding rough grazing), England 2012/13 to 2015/16 (a)(b)
Overall application rates
(kg per hectare)
2012/13 2013/14 2014/15 2015/16(c)
Nitrogen (N) 113 (±8)
113 (±6)
113 (±5)
113 (±5)
Source: Farm Business Survey. (a) Based on responses from 975 farm businesses in 2012/13 and 2013/14, 968 farm businesses in
2014/15 and 1329 farm businesses in 2015/16. (b) 95% confidence intervals are shown in brackets. (c) Increased data collection from horticulture farms and those with no farmed area. The change in sample
coverage for 2015/16 had minimal impact on the results.
Although the overall nitrogen application rates are similar for each year, there appear to be different factors influencing application rates. These differences could be due to the weather. For example, the very wet autumn of 2012 made drilling difficult and led to some partial and total crop failures through the winter. This resulted in a switch to spring sown crops which often require less fertiliser.
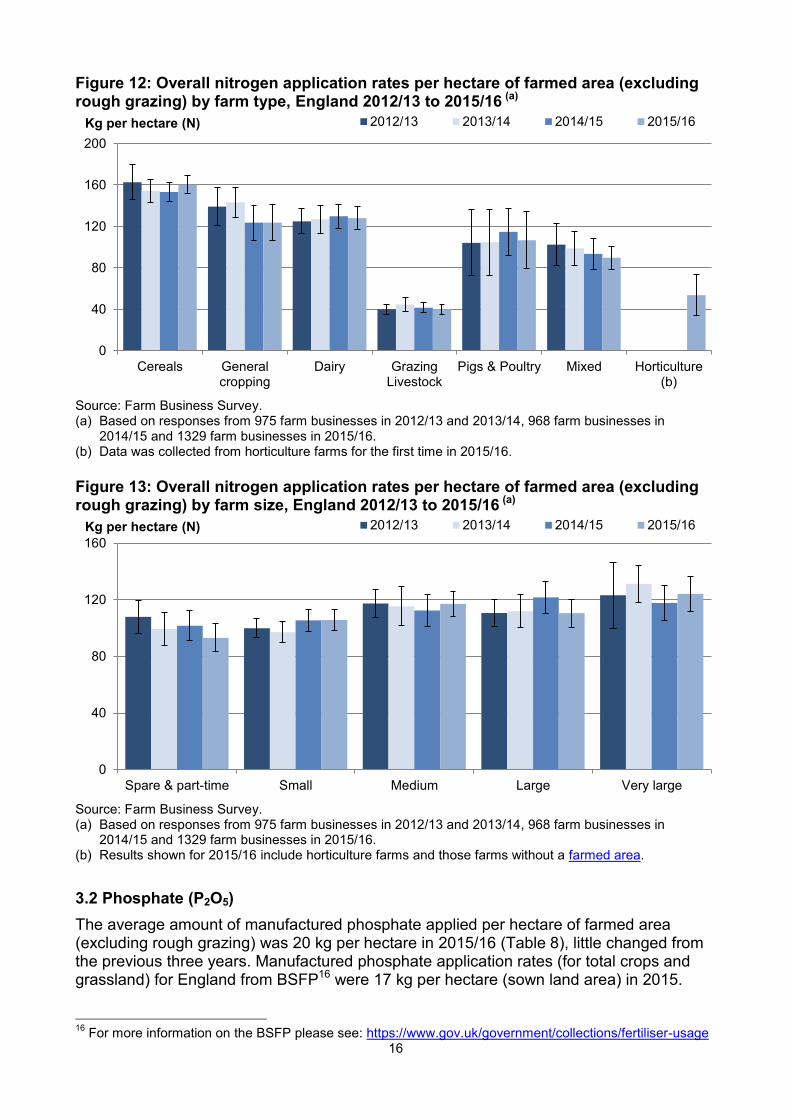
Application rates for nitrogen from the FBS were significantly15 related to farm type and size in 2015/16. Cereal farms (Figure 12) tended to have the highest application rates (160 kg/ha in 2015/16), whilst grazing livestock farms had the lowest (40 kg/ha in 2015/16). After allowing for these factors, larger farms tended to have higher application rates than smaller farms.
13
Farmed area = Utilised Agricultural Area + bare land rented in + forage area hired in - bare land let out -
forage area let out. Some specialist pig and poultry farms have no farmed area. 14
For more information on the BSFP please see: https://www.gov.uk/government/collections/fertiliser-usage 15
A generalised linear regression model was fitted to examine which factors (farm type, farm size, region, farm tenure, farmer age, farm performance and NVZ status) were significant. Farm type, size and tenure were significant at the 5% level.
16
Figure 12: Overall nitrogen application rates per hectare of farmed area (excluding rough grazing) by farm type, England 2012/13 to 2015/16 (a)
Source: Farm Business Survey. (a) Based on responses from 975 farm businesses in 2012/13 and 2013/14, 968 farm businesses in
2014/15 and 1329 farm businesses in 2015/16. (b) Data was collected from horticulture farms for the first time in 2015/16.
Figure 13: Overall nitrogen application rates per hectare of farmed area (excluding rough grazing) by farm size, England 2012/13 to 2015/16 (a)
Source: Farm Business Survey. (a) Based on responses from 975 farm businesses in 2012/13 and 2013/14, 968 farm businesses in
2014/15 and 1329 farm businesses in 2015/16. (b) Results shown for 2015/16 include horticulture farms and those farms without a farmed area.
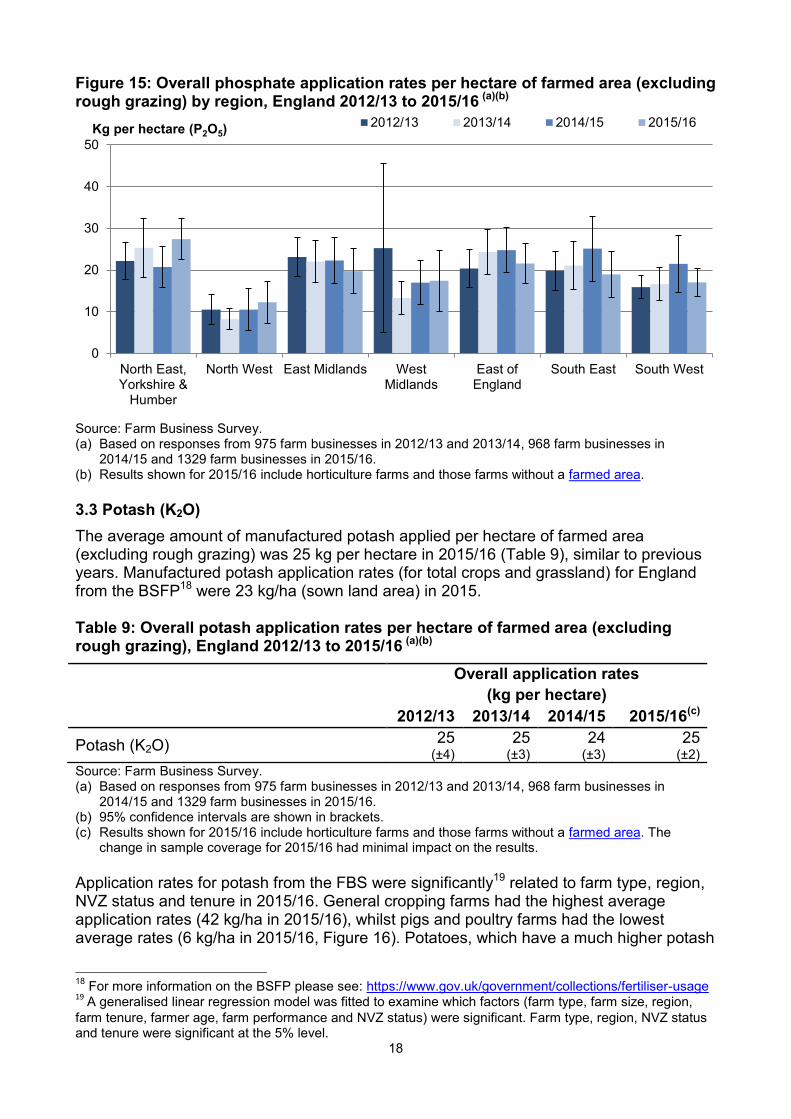
3.2 Phosphate (P2O5)
The average amount of manufactured phosphate applied per hectare of farmed area (excluding rough grazing) was 20 kg per hectare in 2015/16 (Table 8), little changed from the previous three years. Manufactured phosphate application rates (for total crops and grassland) for England from BSFP16 were 17 kg per hectare (sown land area) in 2015.
16
For more information on the BSFP please see: https://www.gov.uk/government/collections/fertiliser-usage
0
40
80
120
160
200
Cereals Generalcropping
Dairy GrazingLivestock
Pigs & Poultry Mixed Horticulture(b)
2012/13 2013/14 2014/15 2015/16Kg per hectare (N)
0
40
80
120
160
Spare & part-time Small Medium Large Very large
2012/13 2013/14 2014/15 2015/16Kg per hectare (N)
17
Table 8: Overall phosphate application rates per hectare of farmed area (excluding rough grazing), England 2012/13 to 2015/16 (a)(b)
Overall application rates
(kg per hectare)
2012/13 2013/14 2014/15 2015/16(c)
Phosphate (P2O5) 20
(±3) 20
(±2) 21
(±2) 20
(±2) Source: Farm Business Survey. (a) Based on responses from 975 farm businesses in 2012/13 and 2013/14, 968 farm businesses in
2014/15 and 1329 farm businesses in 2015/16. (b) 95% confidence intervals are shown in brackets. (c) Results shown for 2015/16 include horticulture farms and those farms without a farmed area. The
change in sample coverage for 2015/16 had minimal impact on the results.
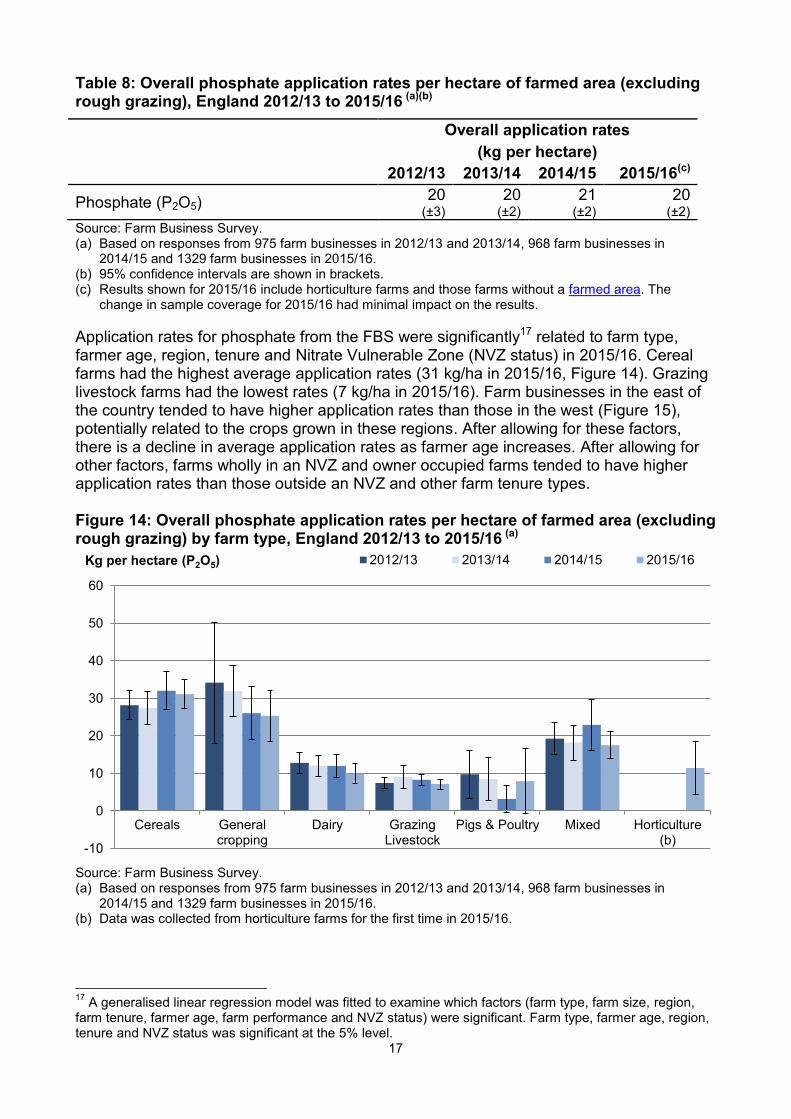
Application rates for phosphate from the FBS were significantly17 related to farm type, farmer age, region, tenure and Nitrate Vulnerable Zone (NVZ status) in 2015/16. Cereal farms had the highest average application rates (31 kg/ha in 2015/16, Figure 14). Grazing livestock farms had the lowest rates (7 kg/ha in 2015/16). Farm businesses in the east of the country tended to have higher application rates than those in the west (Figure 15), potentially related to the crops grown in these regions. After allowing for these factors, there is a decline in average application rates as farmer age increases. After allowing for other factors, farms wholly in an NVZ and owner occupied farms tended to have higher application rates than those outside an NVZ and other farm tenure types. Figure 14: Overall phosphate application rates per hectare of farmed area (excluding rough grazing) by farm type, England 2012/13 to 2015/16 (a)
Source: Farm Business Survey. (a) Based on responses from 975 farm businesses in 2012/13 and 2013/14, 968 farm businesses in
2014/15 and 1329 farm businesses in 2015/16. (b) Data was collected from horticulture farms for the first time in 2015/16.
17
A generalised linear regression model was fitted to examine which factors (farm type, farm size, region, farm tenure, farmer age, farm performance and NVZ status) were significant. Farm type, farmer age, region, tenure and NVZ status was significant at the 5% level.
-10
0
10
20
30
40
50
60
Cereals Generalcropping
Dairy GrazingLivestock
Pigs & Poultry Mixed Horticulture(b)
2012/13 2013/14 2014/15 2015/16Kg per hectare (P2O5)
18
Figure 15: Overall phosphate application rates per hectare of farmed area (excluding rough grazing) by region, England 2012/13 to 2015/16 (a)(b)
Source: Farm Business Survey. (a) Based on responses from 975 farm businesses in 2012/13 and 2013/14, 968 farm businesses in
2014/15 and 1329 farm businesses in 2015/16. (b) Results shown for 2015/16 include horticulture farms and those farms without a farmed area.
3.3 Potash (K2O)
The average amount of manufactured potash applied per hectare of farmed area (excluding rough grazing) was 25 kg per hectare in 2015/16 (Table 9), similar to previous years. Manufactured potash application rates (for total crops and grassland) for England from the BSFP18 were 23 kg/ha (sown land area) in 2015. Table 9: Overall potash application rates per hectare of farmed area (excluding rough grazing), England 2012/13 to 2015/16 (a)(b)
Overall application rates
(kg per hectare)
2012/13 2013/14 2014/15 2015/16(c)
Potash (K2O) 25
(±4) 25
(±3) 24
(±3) 25
(±2) Source: Farm Business Survey. (a) Based on responses from 975 farm businesses in 2012/13 and 2013/14, 968 farm businesses in
2014/15 and 1329 farm businesses in 2015/16. (b) 95% confidence intervals are shown in brackets. (c) Results shown for 2015/16 include horticulture farms and those farms without a farmed area. The
change in sample coverage for 2015/16 had minimal impact on the results.
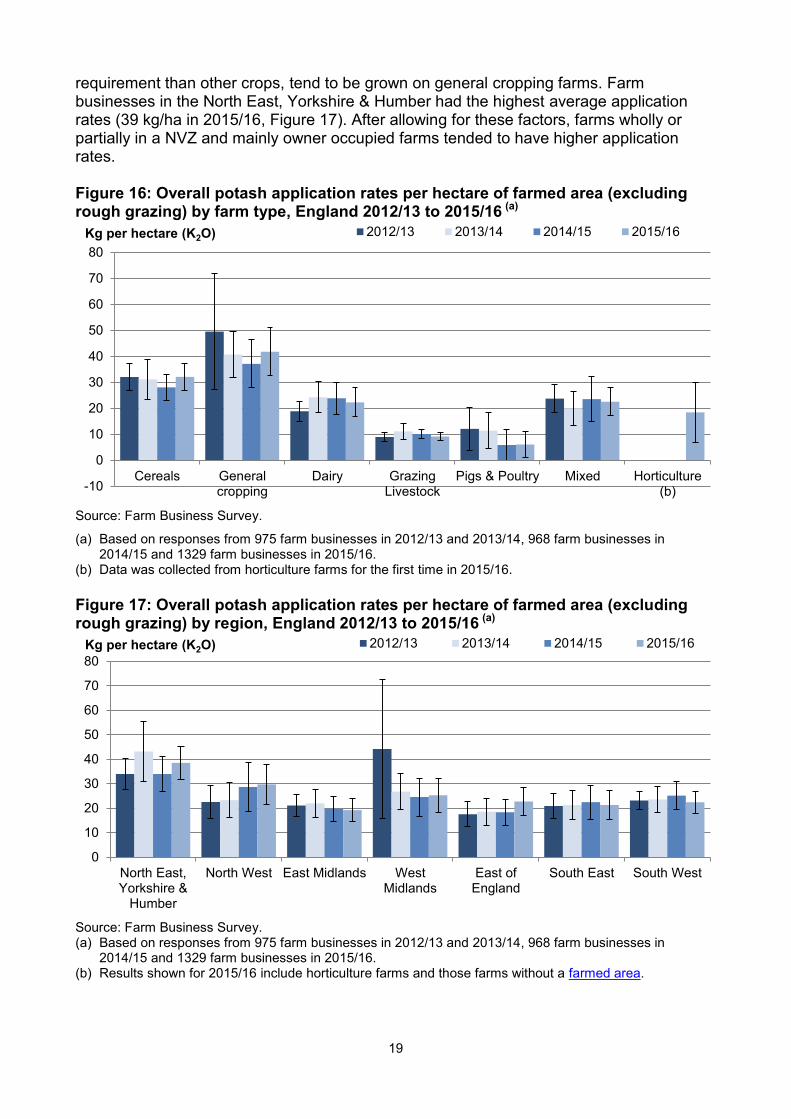
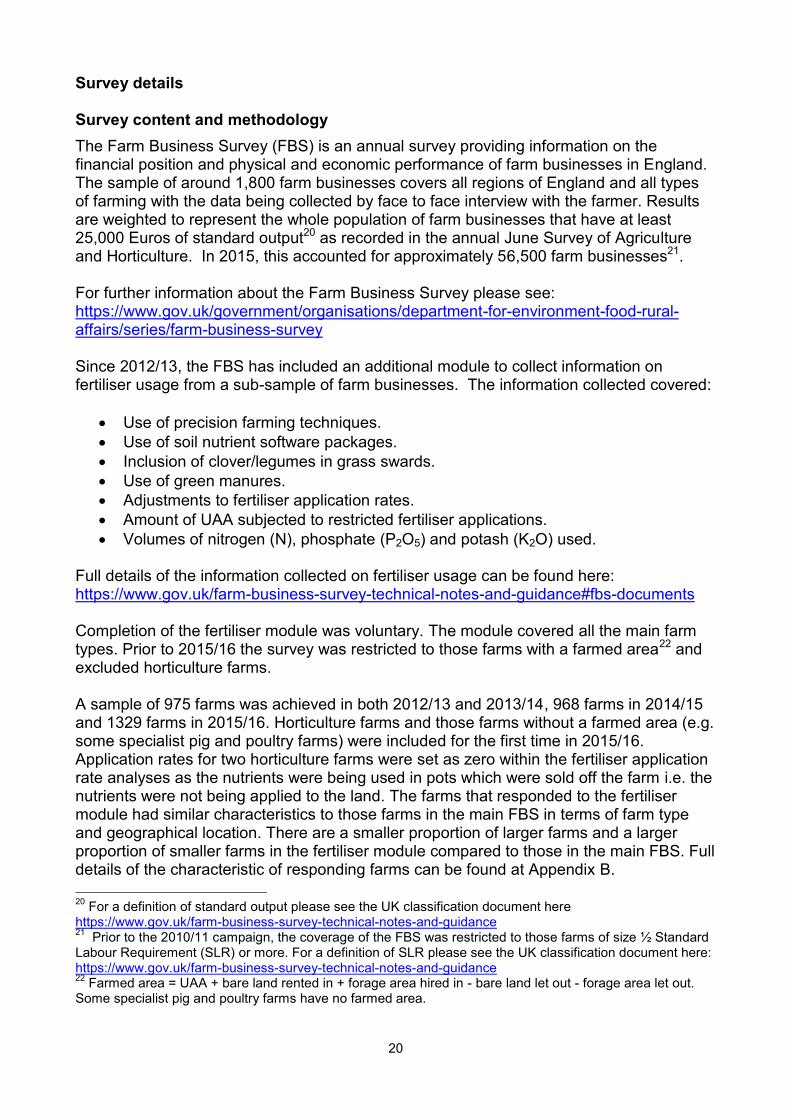
Application rates for potash from the FBS were significantly19 related to farm type, region, NVZ status and tenure in 2015/16. General cropping farms had the highest average application rates (42 kg/ha in 2015/16), whilst pigs and poultry farms had the lowest average rates (6 kg/ha in 2015/16, Figure 16). Potatoes, which have a much higher potash
18
For more information on the BSFP please see: https://www.gov.uk/government/collections/fertiliser-usage 19
A generalised linear regression model was fitted to examine which factors (farm type, farm size, region,
farm tenure, farmer age, farm performance and NVZ status) were significant. Farm type, region, NVZ status and tenure were significant at the 5% level.
0
10
20
30
40
50
North East,Yorkshire &
Humber
North West East Midlands WestMidlands
East ofEngland
South East South West
2012/13 2013/14 2014/15 2015/16Kg per hectare (P2O5)
19
requirement than other crops, tend to be grown on general cropping farms. Farm businesses in the North East, Yorkshire & Humber had the highest average application rates (39 kg/ha in 2015/16, Figure 17). After allowing for these factors, farms wholly or partially in a NVZ and mainly owner occupied farms tended to have higher application rates. Figure 16: Overall potash application rates per hectare of farmed area (excluding rough grazing) by farm type, England 2012/13 to 2015/16 (a)
Source: Farm Business Survey.
(a) Based on responses from 975 farm businesses in 2012/13 and 2013/14, 968 farm businesses in 2014/15 and 1329 farm businesses in 2015/16.
(b) Data was collected from horticulture farms for the first time in 2015/16.
Figure 17: Overall potash application rates per hectare of farmed area (excluding rough grazing) by region, England 2012/13 to 2015/16 (a)
Source: Farm Business Survey. (a) Based on responses from 975 farm businesses in 2012/13 and 2013/14, 968 farm businesses in
2014/15 and 1329 farm businesses in 2015/16. (b) Results shown for 2015/16 include horticulture farms and those farms without a farmed area.
-10
0
10
20
30
40
50
60
70
80
Cereals Generalcropping
Dairy GrazingLivestock
Pigs & Poultry Mixed Horticulture(b)
2012/13 2013/14 2014/15 2015/16Kg per hectare (K2O)
0
10
20
30
40
50
60
70
80
North East,Yorkshire &
Humber
North West East Midlands WestMidlands
East ofEngland
South East South West
2012/13 2013/14 2014/15 2015/16Kg per hectare (K2O)
20
Survey details Survey content and methodology
The Farm Business Survey (FBS) is an annual survey providing information on the financial position and physical and economic performance of farm businesses in England. The sample of around 1,800 farm businesses covers all regions of England and all types of farming with the data being collected by face to face interview with the farmer. Results are weighted to represent the whole population of farm businesses that have at least 25,000 Euros of standard output20 as recorded in the annual June Survey of Agriculture and Horticulture. In 2015, this accounted for approximately 56,500 farm businesses21. For further information about the Farm Business Survey please see: https://www.gov.uk/government/organisations/department-for-environment-food-rural-affairs/series/farm-business-survey Since 2012/13, the FBS has included an additional module to collect information on fertiliser usage from a sub-sample of farm businesses. The information collected covered:
Use of precision farming techniques.
Use of soil nutrient software packages.
Inclusion of clover/legumes in grass swards.
Use of green manures.
Adjustments to fertiliser application rates.
Amount of UAA subjected to restricted fertiliser applications.
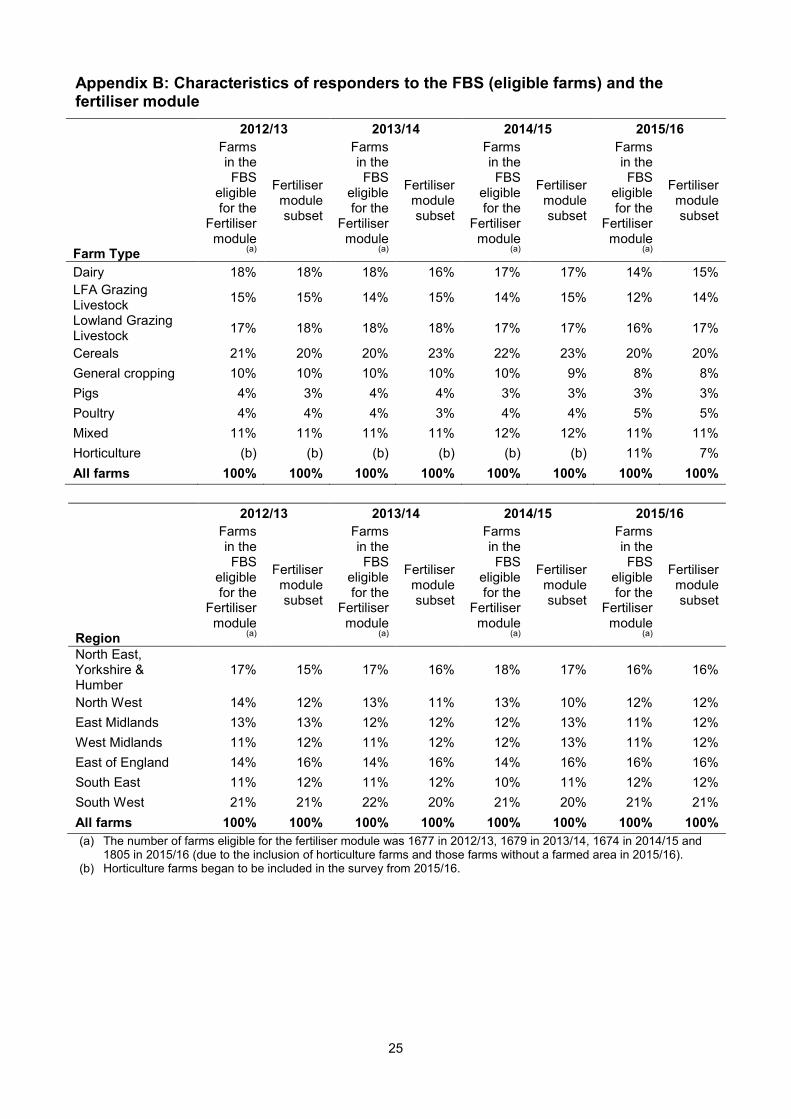
Volumes of nitrogen (N), phosphate (P2O5) and potash (K2O) used. Full details of the information collected on fertiliser usage can be found here: https://www.gov.uk/farm-business-survey-technical-notes-and-guidance#fbs-documents Completion of the fertiliser module was voluntary. The module covered all the main farm types. Prior to 2015/16 the survey was restricted to those farms with a farmed area22 and excluded horticulture farms. A sample of 975 farms was achieved in both 2012/13 and 2013/14, 968 farms in 2014/15 and 1329 farms in 2015/16. Horticulture farms and those farms without a farmed area (e.g. some specialist pig and poultry farms) were included for the first time in 2015/16. Application rates for two horticulture farms were set as zero within the fertiliser application rate analyses as the nutrients were being used in pots which were sold off the farm i.e. the nutrients were not being applied to the land. The farms that responded to the fertiliser module had similar characteristics to those farms in the main FBS in terms of farm type and geographical location. There are a smaller proportion of larger farms and a larger proportion of smaller farms in the fertiliser module compared to those in the main FBS. Full details of the characteristic of responding farms can be found at Appendix B.
20
For a definition of standard output please see the UK classification document here https://www.gov.uk/farm-business-survey-technical-notes-and-guidance 21
Prior to the 2010/11 campaign, the coverage of the FBS was restricted to those farms of size ½ Standard Labour Requirement (SLR) or more. For a definition of SLR please see the UK classification document here: https://www.gov.uk/farm-business-survey-technical-notes-and-guidance 22
Farmed area = UAA + bare land rented in + forage area hired in - bare land let out - forage area let out. Some specialist pig and poultry farms have no farmed area.
21
Data analysis
The results from the FBS relate to farms which have a standard output of at least 25,000 Euros. Initial weights are applied to the FBS records based on the inverse sampling fraction for each design stratum (farm type by farm size). These weights are then adjusted (calibration weighting23) so that they can produce unbiased estimators of a number of different target variables. The data used for this analysis is only for those farms which completed the fertiliser module in each year. A sample of 975 farms was achieved in both 2012/13 and 2013/14, 968 farms in 2014/15 and 1329 farms in 2015/16. The increase in 2015/16 reflects the inclusion of horticulture farms and those farms without a farmed area. Results have also been calculated on a comparable basis and are shown where a difference arises. In order to take account of non-response, the results have been reweighted using a method that preserves marginal totals for populations according to farm type and farm size24 groups. The farms in the fertiliser module represent around 56,500 farms in the population. Accuracy and reliability of the results
We show 95% confidence intervals against the results. These show the range of values that may apply to the figures. They mean that we are 95% confident that this range contains the true value. They are calculated as the standard errors (se) multiplied by 1.96 to give the 95% confidence interval (95% CI). The standard errors only give an indication of the sampling error. They do not reflect any other sources of survey errors, such as non-response bias. For the Farm Business Survey, the confidence limits shown are appropriate for comparing groups within the same year only; they should not be used for comparing with previous years since they do not allow for the fact that many of the same farms will have contributed to the Farm Business Survey in both years. We have also shown error bars on the figures in this notice. These error bars represent the 95% confidence intervals (as defined above). Where possible we have provided comparisons with other data sources, particularly the British Survey of Fertiliser Practice. Appendix C provides a comparison of overall application rates for nitrogen, phosphate and potash by farm type. Availability of results
This release contains headline results for each section. The full breakdown of results, by farm type, farm size, region, farm tenure, farmer age, farm economic performance and Nitrate Vulnerable Zones (NVZs), can be found at: https://www.gov.uk/government/collections/farm-business-survey#documents Defra statistical notices can be viewed on the Food and Farming Statistics pages on the Defra website at https://www.gov.uk/government/organisations/department-for-environment-food-rural-affairs/about/statistics. This site also shows details of future publications, with pre-announced dates.
23
Further information on calibration weighting can be found here:
https://www.gov.uk/farm-business-survey-technical-notes-and-guidance
22
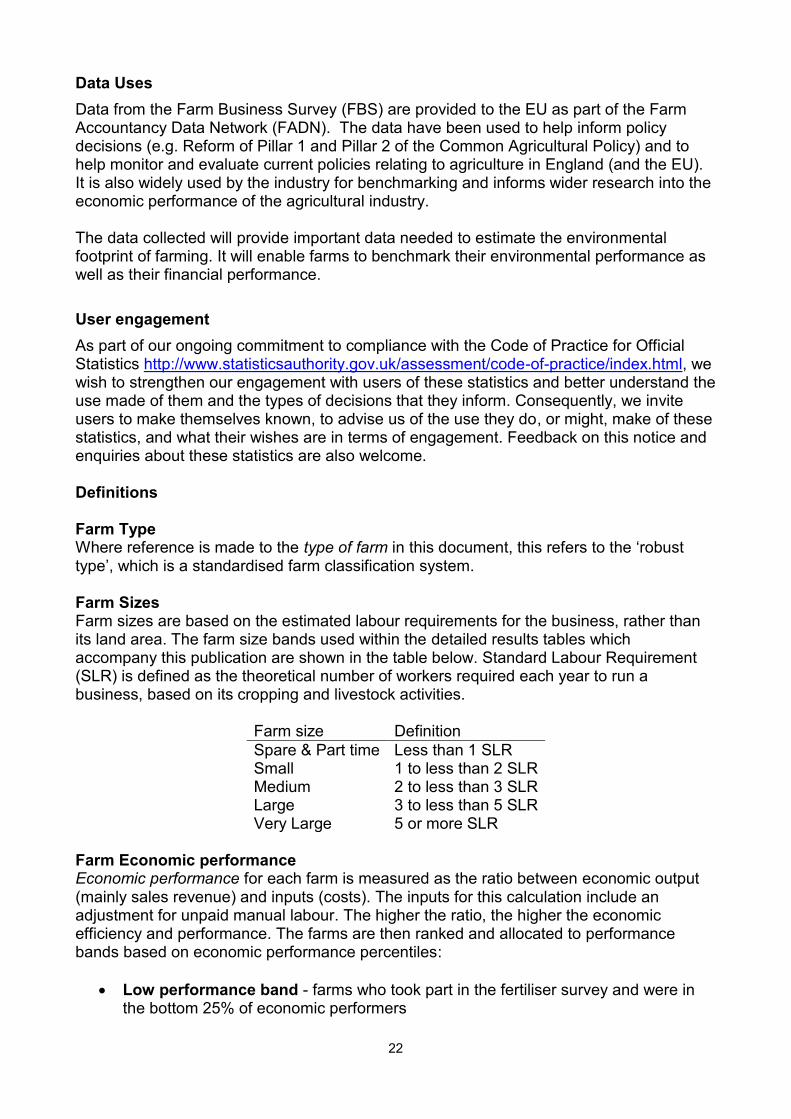
Data Uses
Data from the Farm Business Survey (FBS) are provided to the EU as part of the Farm Accountancy Data Network (FADN). The data have been used to help inform policy decisions (e.g. Reform of Pillar 1 and Pillar 2 of the Common Agricultural Policy) and to help monitor and evaluate current policies relating to agriculture in England (and the EU). It is also widely used by the industry for benchmarking and informs wider research into the economic performance of the agricultural industry. The data collected will provide important data needed to estimate the environmental footprint of farming. It will enable farms to benchmark their environmental performance as well as their financial performance.
User engagement
As part of our ongoing commitment to compliance with the Code of Practice for Official Statistics http://www.statisticsauthority.gov.uk/assessment/code-of-practice/index.html, we wish to strengthen our engagement with users of these statistics and better understand the use made of them and the types of decisions that they inform. Consequently, we invite users to make themselves known, to advise us of the use they do, or might, make of these statistics, and what their wishes are in terms of engagement. Feedback on this notice and enquiries about these statistics are also welcome. Definitions Farm Type Where reference is made to the type of farm in this document, this refers to the ‘robust type’, which is a standardised farm classification system. Farm Sizes Farm sizes are based on the estimated labour requirements for the business, rather than its land area. The farm size bands used within the detailed results tables which accompany this publication are shown in the table below. Standard Labour Requirement (SLR) is defined as the theoretical number of workers required each year to run a business, based on its cropping and livestock activities.
Farm size Definition
Spare & Part time Less than 1 SLR Small 1 to less than 2 SLR Medium 2 to less than 3 SLR Large 3 to less than 5 SLR Very Large 5 or more SLR
Farm Economic performance Economic performance for each farm is measured as the ratio between economic output (mainly sales revenue) and inputs (costs). The inputs for this calculation include an adjustment for unpaid manual labour. The higher the ratio, the higher the economic efficiency and performance. The farms are then ranked and allocated to performance bands based on economic performance percentiles:
Low performance band - farms who took part in the fertiliser survey and were in the bottom 25% of economic performers
23
Medium performance band - farms who took part in the fertiliser survey and were in the middle 50% of performers
High performance band - farms who took part in the fertiliser survey and were in the top 25% of performers.
Utilised Agricultural Area (UAA) Utilised Agricultural Area (UAA) is the crop area, including fodder, set-aside land, temporary and permanent grass and rough grazing in sole occupation (but not shared rough grazing) i.e. the agricultural area of the farm. It includes bare land and forage let out for less than one year. Farmed area Farmed area = Utilised Agricultural Area + bare land rented in + forage area hired in - bare land let out - forage area let out. Some specialist pig and poultry farms have no farmed area. Grass swards Land or soil which features a layer of grass. Nitrate Vulnerable Zones The European Commission (EC) nitrates directive requires areas of land that drain into waters polluted by nitrates to be designated as Nitrate Vulnerable Zones (NVZs)24. Farmers with land in NVZs must follow rules to tackle nitrate loss from agriculture. The regulations that apply in England and Wales were reviewed and updated in 2013, including NVZ boundaries.
24
A map of NVZs that apply from 2013 can be found at http://www.magic.gov.uk/StaticMaps/Nitrate%20Vulnerable%20Zones%20(England).pdf
24
Appendix A. Weather conditions in previous years of the FBS fertiliser module.
2014/15 (2014 harvest)
Autumn 2013 saw temperatures slightly above average. Favourable weather conditions enabled good establishment of winter crops for the 2014 harvest. The winter months, although featuring above average temperatures were exceptionally stormy and were the wettest since 1910, with major flooding occurring. The severe flooding in some regions resulted in sizeable areas of cereal crops being lost. Spring 2014 saw above average temperatures. The warm spring resulted in good grass growth with livestock being turned out earlier than usual in some regions. Summer 2014 was warmer than average, although August was the coldest since 1993. June and July were dry months for most of England, whilst August was wet.
2013/14 (2013 harvest)
Wet weather in the autumn of 2012 meant that some farmers struggled to drill crops, particularly on heavy land. The late 2012 harvest also delayed seed availability. The balance between winter and spring crops was atypical and will have had a major impact on fertiliser use as lower yielding spring crops generally require less fertiliser. Spring 2013 was the coldest recorded since 1962 and hampered the establishment of spring sown crops and the recovery of poorly established winter sown crops. The summer months saw an improvement in growing conditions and a subsequent recovery in yields compared to the previous year. 2012/13 (2012 harvest)
Favourable conditions in the autumn of 2011 meant that drilling for 2012 crops progressed well and crop establishment was generally good. The relatively mild and dry winter resulted in continued good winter crop establishment but in April the weather changed and was the wettest on record. This was followed by a wet and cool summer which had a significant effect on crop yields and the quality of harvest.
25
Appendix B: Characteristics of responders to the FBS (eligible farms) and the fertiliser module
Farm Type
2012/13 2013/14 2014/15 2015/16
Farms in the FBS
eligible for the
Fertiliser module
(a)
Fertiliser module subset
Farms in the FBS
eligible for the
Fertiliser module
(a)
Fertiliser module subset
Farms in the FBS
eligible for the
Fertiliser module
(a)
Fertiliser module subset
Farms in the FBS
eligible for the
Fertiliser module
(a)
Fertiliser module subset
Dairy 18% 18% 18% 16% 17% 17% 14% 15%
LFA Grazing Livestock
15% 15% 14% 15% 14% 15% 12% 14%
Lowland Grazing Livestock
17% 18% 18% 18% 17% 17% 16% 17%
Cereals 21% 20% 20% 23% 22% 23% 20% 20%
General cropping 10% 10% 10% 10% 10% 9% 8% 8%
Pigs 4% 3% 4% 4% 3% 3% 3% 3%
Poultry 4% 4% 4% 3% 4% 4% 5% 5%
Mixed 11% 11% 11% 11% 12% 12% 11% 11%
Horticulture (b) (b) (b) (b) (b) (b) 11% 7%
All farms 100% 100% 100% 100% 100% 100% 100% 100%
Region
2012/13 2013/14 2014/15 2015/16
Farms in the FBS
eligible for the
Fertiliser module
(a)
Fertiliser module subset
Farms in the FBS
eligible for the
Fertiliser module
(a)
Fertiliser module subset
Farms in the FBS
eligible for the
Fertiliser module
(a)
Fertiliser module subset
Farms in the FBS
eligible for the
Fertiliser module
(a)
Fertiliser module subset
North East, Yorkshire & Humber
17% 15% 17% 16% 18% 17% 16% 16%
North West 14% 12% 13% 11% 13% 10% 12% 12%
East Midlands 13% 13% 12% 12% 12% 13% 11% 12%
West Midlands 11% 12% 11% 12% 12% 13% 11% 12%
East of England 14% 16% 14% 16% 14% 16% 16% 16%
South East 11% 12% 11% 12% 10% 11% 12% 12%
South West 21% 21% 22% 20% 21% 20% 21% 21%
All farms 100% 100% 100% 100% 100% 100% 100% 100%
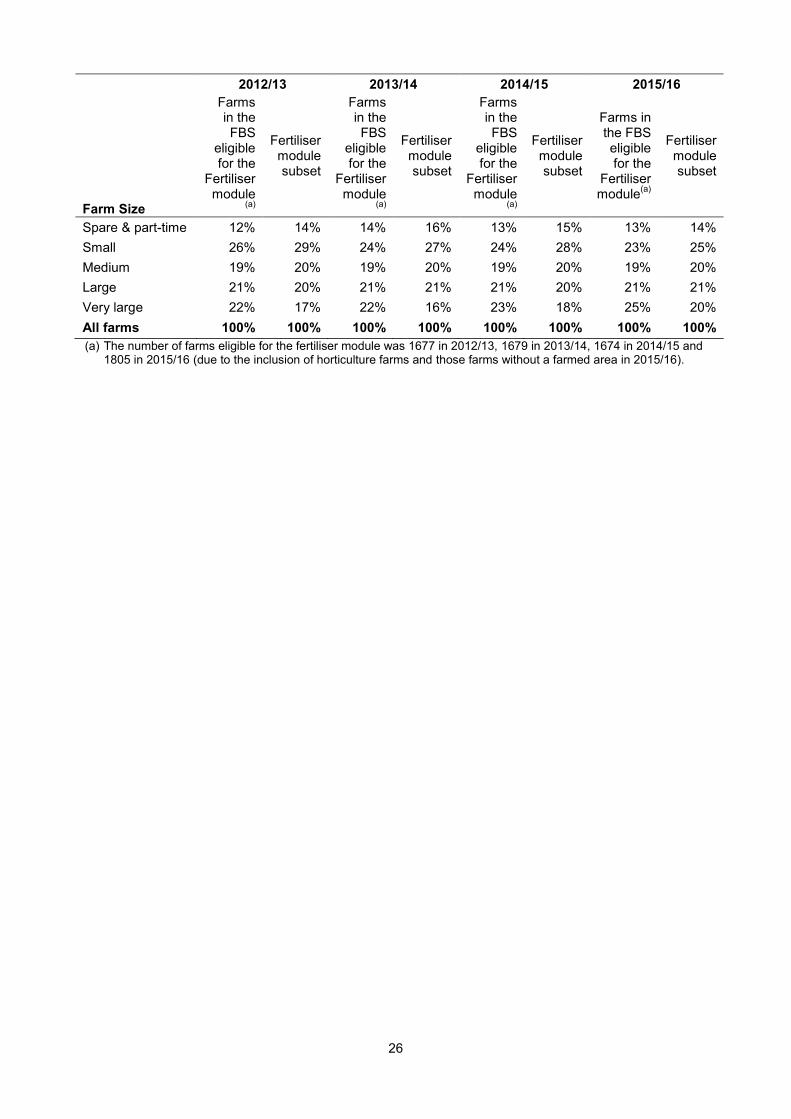
(a) The number of farms eligible for the fertiliser module was 1677 in 2012/13, 1679 in 2013/14, 1674 in 2014/15 and 1805 in 2015/16 (due to the inclusion of horticulture farms and those farms without a farmed area in 2015/16).
(b) Horticulture farms began to be included in the survey from 2015/16.
26
Farm Size
2012/13 2013/14 2014/15 2015/16
Farms in the FBS
eligible for the
Fertiliser module
(a)
Fertiliser module subset
Farms in the FBS
eligible for the
Fertiliser module
(a)
Fertiliser module subset
Farms in the FBS
eligible for the
Fertiliser module
(a)
Fertiliser module subset
Farms in the FBS eligible for the
Fertiliser module
(a)
Fertiliser module subset
Spare & part-time 12% 14% 14% 16% 13% 15% 13% 14%
Small 26% 29% 24% 27% 24% 28% 23% 25%
Medium 19% 20% 19% 20% 19% 20% 19% 20%
Large 21% 20% 21% 21% 21% 20% 21% 21%
Very large 22% 17% 22% 16% 23% 18% 25% 20%
All farms 100% 100% 100% 100% 100% 100% 100% 100%
(a) The number of farms eligible for the fertiliser module was 1677 in 2012/13, 1679 in 2013/14, 1674 in 2014/15 and 1805 in 2015/16 (due to the inclusion of horticulture farms and those farms without a farmed area in 2015/16).
27
Appendix C: Overall application rates for nitrogen, phosphate and potash by farm type in the British Survey of Fertiliser Practice, England 2012/13 to 2015/16
0
20
40
60
80
100
120
140
160
Cereals Generalcropping
Dairy GrazingLivestock
Pigs &Poultry
Mixed Horticulture All types
Kg per hectare (N) 2012 2013 2014 2015
0
5
10
15
20
25
30
Cereals Generalcropping
Dairy GrazingLivestock
Pigs &Poultry
Mixed Horticulture All types
Kg per hectare (P2O5) 2012 2013 2014 2015
0
10
20
30
40
50
60
Cereals Generalcropping
Dairy GrazingLivestock
Pigs &Poultry
Mixed Horticulture All types
Kg per hectare (K2O) 2012 2013 2014 2015

28
© Crown copyright 2017. You may re-use this information free of charge under the terms of the Open Government Licence v.3. To view this licence visit www.nationalarchives.gov.uk/doc/open-government-licence/version/3/