Embed Size (px)
Citation preview
Stakeholder Feedback
Document
Future Energy Scenarios: January 2017
Welcome to the Future Energy Scenarios Stakeholder Feedback Document for
2017
This publication is part of our annual scenario development process. It summarises how we
have engaged with our stakeholders over the past year, key themes from this engagement,
how we develop our scenarios and our initial thoughts on the new suite of Future Energy
Scenarios (FES) for 2017. This year we have also included an annex containing a review of
the actions we said we would undertake in the 2016 Stakeholder Feedback Document and
the associated progress and outcomes. You will also find an overview of the team that
produces the FES.
This document is the latest of our suite of ‘Future of Energy’ publications which demonstrate
our commitment to transparency and meeting the needs of our stakeholders. This suite
includes: Electricity Ten Year Statement (ETYS), Gas Ten Year Statement (GTYS), System
Operability Framework (SOF), Network Options Assessment (NOA), Gas Future Operability
Planning (GFOP) along with our Winter Outlook Report (WOR) and Summer Outlook Report
(SOR).
Our Licence Requirement
National Grid’s Electricity Transmission Licence Standard Condition (C11) requires the
submission of our proposed future energy scenarios and associated stakeholder
engagement to Ofgem by the end of January each year. This document is our submission.
Foreword
Marcus Stewart, Head of Energy Insights
“I am excited to be leading the team that develops the FES and be a part of our
‘Future of Energy’ publications. Once again we’ve had some fantastic engagement
with our stakeholders which has delivered real intelligence and insight for us to
consider as we build FES 2017. In addition to this feedback we utilise a wide range of
different information sources and apply our judgement to help build a picture of the
future pathways for energy. There are so many uncertainties regarding the future of
energy for Great Britain and as you will have seen in the past year lots has changed
on both an economic and political front too.
You had a lot of positive things to say about FES 2016 with a wealth of ideas for FES
2017. I would like to take this opportunity to thank you for giving us your time and
energy during this engagement. We continue to seek improvements in our
engagement, modelling and outcomes to ensure we maintain great relationships with
our current stakeholders and target new stakeholders to enhance the richness of the
scenarios. We plan to do even more of this as we move forward in to 2017.
I hope you find this publication useful and we look forward to sharing the outcome of
our FES 2017 work with you later this year.”
Executive Summary
Enhancing our scenarios for FES 2017 Each year we review our scenarios to ensure they remain credible and fit for the various purposes that
we and our stakeholders use them for. This year we’ve seen big changes economically, politically and
within the energy sector. We take account of these changes, review the feedback we receive from our
stakeholders and apply our own analysis and expertise to shape the scenarios for 2017.
As in previous years, all of our scenarios will consider energy demand and supply with a whole system
view. To reflect recent trends in the electricity market, two of our four core scenarios for 2017 will have
high levels of distributed generation growth (compared to one last year), with the other two scenarios
featuring more moderate growth rates of distributed generation to reflect uncertainty over embedded
benefits.
In addition, we will use a wider range of economic growth forecasts for FES 2017 to account for the
uncertainty created by Brexit.
Building on our work in FES 2016 on different sensitivities on the Gone Green scenario and subsequent
stakeholder feedback, we will develop a broader range of sensitivities for FES 2017 to explore potential
outliers around the four main scenarios.
The name Gone Green will be retired to reflect that the scenario has changed in focus from renewable
generation to low carbon since it was introduced in 2011. The new name, ‘Two Degrees’, signifies that
this will continue to be our core scenario that meets the 2050 carbon reduction targets. We will also retire
the name ‘No Progression’ and replace it with ‘Steady State’ to better reflect the content of this scenario
and the stakeholder feedback we have received.
Making clear what has changed and why We take account of the latest data, trends and changes in the energy industry and evolve our scenarios
year on year. Our stakeholders have told us that it is crucial they understand what has changed since
the last FES publication, and why. Therefore, in addition to updating the scenarios to ensure they
continue to represent credible future pathways, we will make clear in our FES publications what the key
changes are.
Delivering our views and opinion Through the FES process we gather a wide range of information, including stakeholder feedback,
economic and industry data and discussions with subject matter experts. We review all of this
information, undertake our own analysis and use our judgement to create robust and well-informed views
about the energy future. Stakeholders have told us they would like to see more of our views in 2017. We
will introduce a series of thought pieces to provide our views and opinions on hot topics and key changes
within the energy industry. You will hear more on this throughout the year.
Widening our engagement Stakeholder feedback is a key part of the FES development process and we use it to feed into our own
analysis and test our approach and assumptions. We continually improve our approach to stakeholder
engagement to meet the needs of our customers and stakeholders. This year we held our first
stakeholder workshop in Wales, ran webinars for those unable to make the launch conference and
enhanced our summary FES in 5 document. During 2017 we will share our emerging analysis with
stakeholders to get earlier feedback and tap into the information and intelligence they hold as we
develop our analysis.
Contents Foreword Why do we create scenarios? Contents
Section one: Why do we create scenarios? Pages 1-5
Section two: Our engagement Pages 6-11
Section three: Our proposed scenarios for FES 2017 Pages 12-15
Section four: Stakeholder feedback and FES 2017 Pages 16-22
Section five: Next steps and future improvements Pages 23-24
Section six: Continuing the conversation Page 25
Section seven: Annex: Pages 27-40
Meet the Energy Insights Team Pages 27-29
Organisations engaged, breakdown Pages 30-34
FES 2016: You said, we did Pages 35-40
1
Why do we create scenarios?
We continue to be in a period of great uncertainty over the future of energy for Great Britain.
The political, economic, technological and consumer landscapes are changing at an
unprecedented rate. Against this backdrop it is impossible to forecast a single pathway for
our energy future over the long term. In response to this we use the approach of scenario
development to explore plausible and credible futures.
By providing a suite of credible pathways, we seek to help understand uncertainty and
provide our views to inform the energy market. Our stakeholders have told us that they like
this approach and that they use our scenarios for a range of purposes. We continually
evolve our approach to reflect the changing energy landscape and use of the scenarios. This
allows us to better prepare not only our business, but also our stakeholders for the different
outcomes, and to put in place best value solutions.
How do we develop our scenarios?
The production of our scenarios is an annual development process with several key stages,
which include our engagement, data and intelligence gathering , followed by high level
scenario creation and detailed modelling. At each stage in the development process we
apply our expertise and judgement to ensure we deliver plausible and credible scenarios.
Feedback from our stakeholders, such as industry experts within their fields, is a key part of
the development of FES, but we also undertake our own intelligence work and add our
expertise to the process. This ensures our scenarios are well-informed, up-to-date and
provide a robust basis for our own planning activities as well as for our stakeholders.
Within this document we will discuss in more detail the development of our scenarios and a
forward look at our proposed scenarios for 2017.
How do we use the scenarios?
We use our scenarios as a foundation for a range of modelling activities. FES is the starting
point for our regulated long term investment and operability planning as well as a reference
point for further analysis projects (see Figure 1 below). As each process has its own specific
requirements, further detailed analysis is undertaken building on from the FES. Below we
summarise where the FES is used within our business.
Se
ctio
n o
ne
2
Why do we create scenarios?
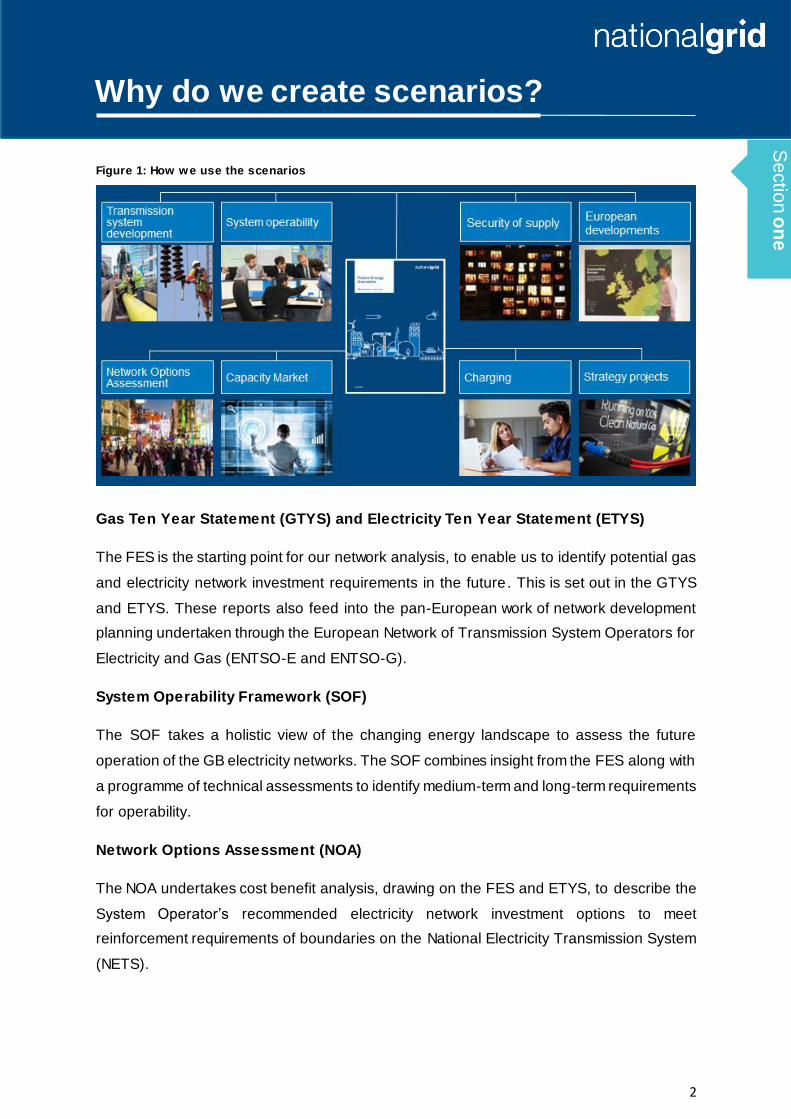
Figure 1: How we use the scenarios
Gas Ten Year Statement (GTYS) and Electricity Ten Year Statement (ETYS)
The FES is the starting point for our network analysis, to enable us to identify potential gas
and electricity network investment requirements in the future. This is set out in the GTYS
and ETYS. These reports also feed into the pan-European work of network development
planning undertaken through the European Network of Transmission System Operators for
Electricity and Gas (ENTSO-E and ENTSO-G).
System Operability Framework (SOF)
The SOF takes a holistic view of the changing energy landscape to assess the future
operation of the GB electricity networks. The SOF combines insight from the FES along with
a programme of technical assessments to identify medium-term and long-term requirements
for operability.
Network Options Assessment (NOA)
The NOA undertakes cost benefit analysis, drawing on the FES and ETYS, to describe the
System Operator’s recommended electricity network investment options to meet
reinforcement requirements of boundaries on the National Electricity Transmission System
(NETS).
Se
ctio
n o
ne
3
Why do we create scenarios?
Gas Future Operability Planning (GFOP)
The FES feeds through to the recently launched GFOP, which describes how changing
requirements may affect the future capability of the National Transmission System (NTS) out
to 2050, and the challenges that these may pose to the NTS operation and our processes.
Winter and Summer Outlook Reports
Our Winter and Summer Outlook reports present our view of security of supply for the
electricity and gas systems for the coming season. These reports are informed by the FES
and they feed into the pan-European security of supply planning undertaken through
ENTSO-E and ENTSO-G.
Electricity Capacity Report
National Grid, as the Electricity Market Reform (EMR) Delivery Body, produces the
“Electricity Capacity Report” that includes recommendations for the capacity that is to be
procured through Capacity Market auctions for one and four year ahead delivery. The FES is
the starting point for that analysis.
Charging and Strategic Projects
The FES scenarios are also used to underpin an increasing number of strategy projects,
such as our Future of Gas (FOG) programme. In addition they inform our future charging
forecasts for Transmission Network Use of System (TNUoS) tariffs.
Se
ctio
n o
ne
4
Why do we create scenarios?
How are they used by our stakeholders?
We strive to deliver value to our stakeholders and make sure FES continues to meet their
needs. In order to do so, we regularly engage with our stakeholders to understand how and
for what purposes they use the FES.
Our stakeholders have told us they use the FES in a variety of ways from a foundation to
build their own analysis and scenarios, to investment decisions, market view, reference
point, future planning and benchmarking through to academic material.
At our workshops held in October, we asked our stakeholders to provide more details on
how they use FES. A view of their feedback is provided below.
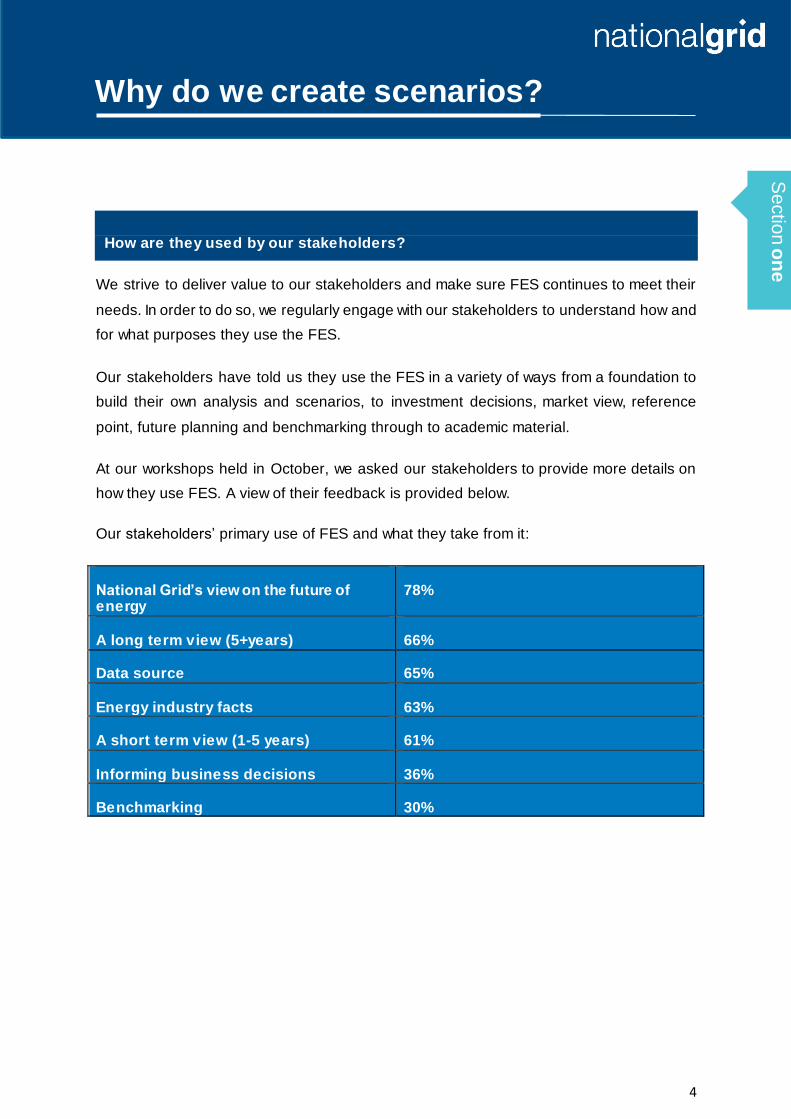
Our stakeholders’ primary use of FES and what they take from it:
National Grid’s view on the future of energy
78%
A long term view (5+years) 66%
Data source 65%
Energy industry facts 63%
A short term view (1-5 years) 61%
Informing business decisions 36%
Benchmarking 30%
Se
ctio
n o
ne
5
Why do we create scenarios?
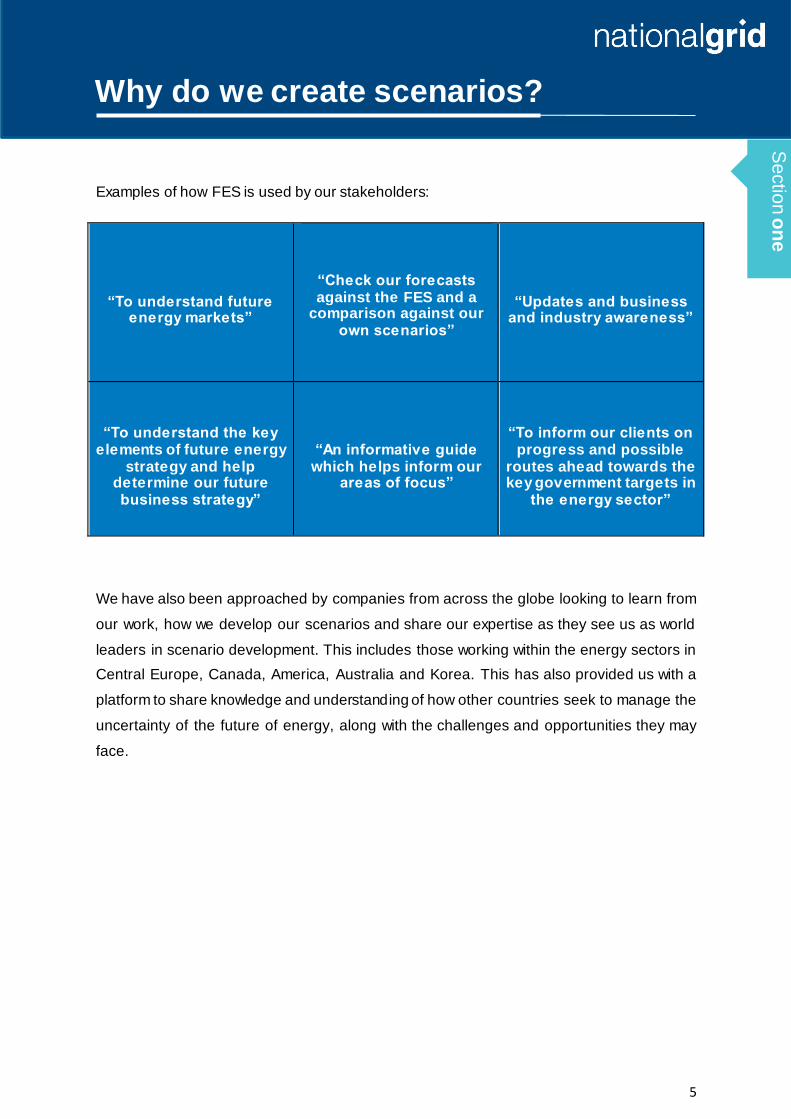
Examples of how FES is used by our stakeholders:
“To understand future energy markets”
“Check our forecasts against the FES and a
comparison against our own scenarios”
“Updates and business and industry awareness”
“To understand the key elements of future energy
strategy and help determine our future business strategy”
“An informative guide which helps inform our
areas of focus”
“To inform our clients on progress and possible
routes ahead towards the key government targets in
the energy sector”
We have also been approached by companies from across the globe looking to learn from
our work, how we develop our scenarios and share our expertise as they see us as world
leaders in scenario development. This includes those working within the energy sectors in
Central Europe, Canada, America, Australia and Korea. This has also provided us with a
platform to share knowledge and understanding of how other countries seek to manage the
uncertainty of the future of energy, along with the challenges and opportunities they may
face.
Se
ctio
n o
ne
6
Our engagement
The role of stakeholders and FES
Our stakeholders are impacted by our work and GB’s energy future and it is therefore
essential that they have the opportunity to understand and debate the scenarios in detail. In
addition, we engage with experts from across the industry on specific areas in order to
enhance and validate the inputs into our future scenarios.
Our scenarios take into consideration a number of factors and data, including historical
trends, forecasts and views from across our stakeholder community. By involving our
stakeholders within this process, understanding their views and building this into our own
analysis, we are able to produce a set of credible future energy scenarios, allowing us to use
the insight gained to drive the evolution of the FES.
“Engaging with stakeholders allows us to check our modelling against
others in the industry, and confirm that our assumptions are
reasonable. One example of this is shale gas where we have been told
by multiple stakeholders that we are using the best source of data
available.”
Chris Parsons, Gas Modelling Analyst, Future Energy Scenarios
How do we engage with our stakeholders?
We interact with a diverse range of stakeholders from across the energy industry and
beyond and seek to adapt the way we engage accordingly. We consider the most effective
ways to gather this information through both qualitative and quantitative means. For
example, we use surveys to obtain quantitative feedback, and hold open discussion
sessions to receive qualitative feedback.
Se
ctio
n tw
o
7
Our engagement
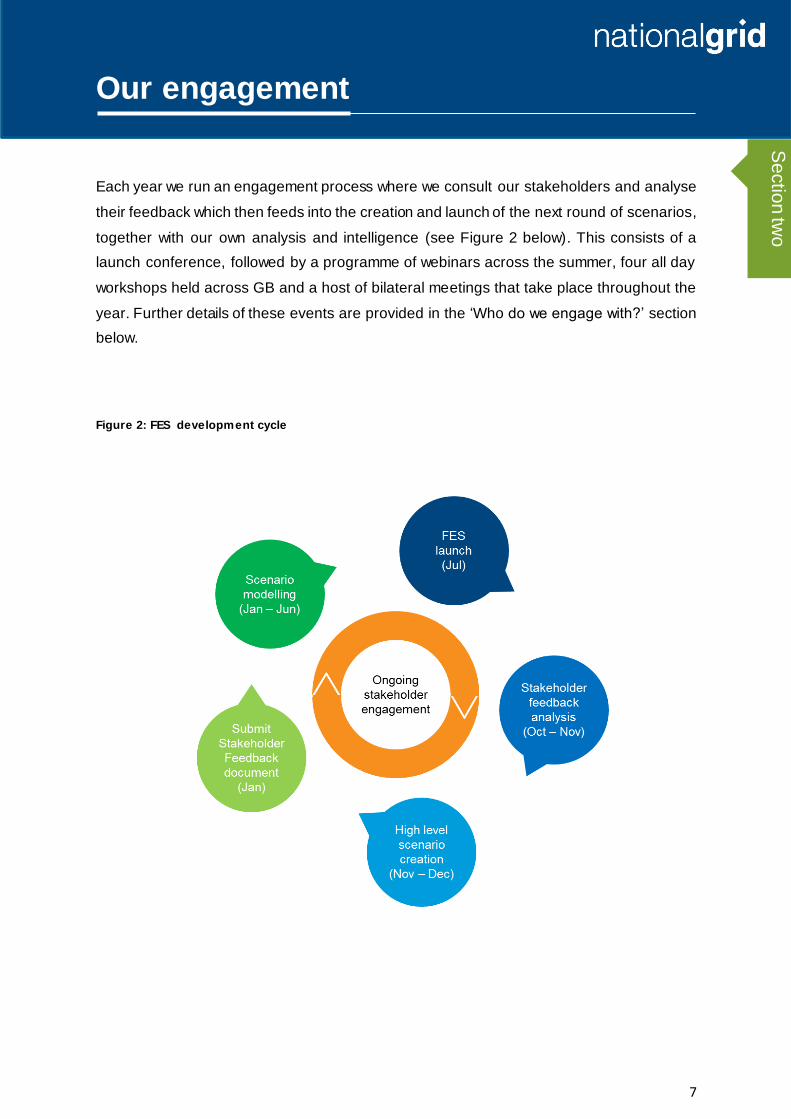
Each year we run an engagement process where we consult our stakeholders and analyse
their feedback which then feeds into the creation and launch of the next round of scenarios,
together with our own analysis and intelligence (see Figure 2 below). This consists of a
launch conference, followed by a programme of webinars across the summer, four all day
workshops held across GB and a host of bilateral meetings that take place throughout the
year. Further details of these events are provided in the ‘Who do we engage with?’ section
below.
Figure 2: FES development cycle
Se
ctio
n tw
o
8
Our engagement
There are principally five ways we use stakeholder information in our scenarios;
Consensus: We engage with stakeholders to obtain their feedback and seek to achieve
broad consensus on the core FES elements such as the 2x2 scenario matrix, the ‘prosperity’
and ‘green ambition’ axes, the key themes and assumptions.
Subject matter experts/industry bodies: We engage with leading industry experts to gather
intelligence and feedback in more detail on particular topics, including emerging
development projects, forecasts and projections from manufacturers on energy trends and
innovation such as electric vehicles and boiler efficiencies. We also engage stakeholders
within the academic sector.
Project specific: We speak to developers and operators of specific energy projects, gaining
intelligence about their commissioning or closure plans.
Industry data: We draw on a wide range of data to inform our analysis, including official
statistics, economic forecasts as well as specialist industry information such as data on
rapidly developing technologies and pricing.
Consultancy: We engage with specialist consultancies to source market intelligence and add
expertise in specific areas (e.g. district heating, small modular reactors and electricity
interconnector flows) and benchmark our analysis.
Se
ctio
n tw
o
9
Our engagement
Who do we engage with?
Our events and engagement are open to all who are impacted by or who have an interest in
the FES and the future of energy. Through focused enhancements to our stakeholder
engagement activities we consulted 391 organisations this year, increasing our engagement
from 362 organisations last year.
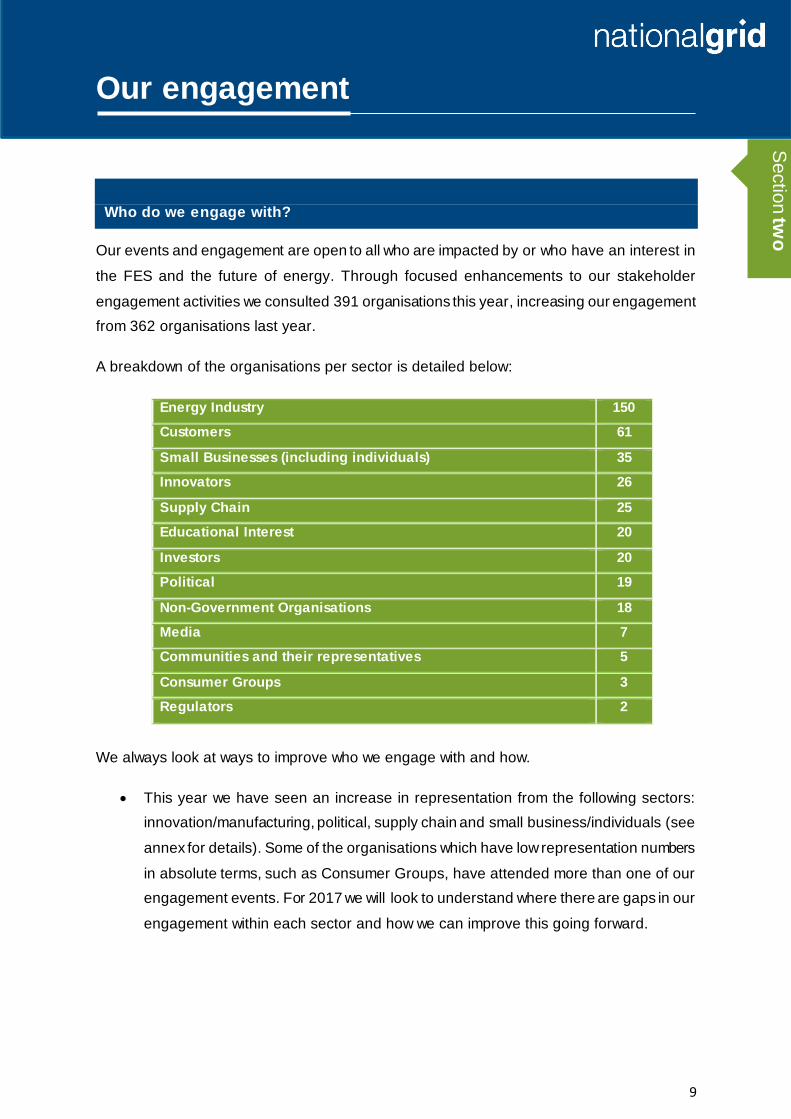
A breakdown of the organisations per sector is detailed below:
Energy Industry 150
Customers 61
Small Businesses (including individuals) 35
Innovators 26
Supply Chain 25
Educational Interest 20
Investors 20
Political 19
Non-Government Organisations 18
Media 7
Communities and their representatives 5
Consumer Groups 3
Regulators 2
We always look at ways to improve who we engage with and how.
This year we have seen an increase in representation from the following sectors:
innovation/manufacturing, political, supply chain and small business/individuals (see
annex for details). Some of the organisations which have low representation numbers
in absolute terms, such as Consumer Groups, have attended more than one of our
engagement events. For 2017 we will look to understand where there are gaps in our
engagement within each sector and how we can improve this going forward.
Se
ctio
n tw
o
10
Our engagement
We have listened to our stakeholders and, following feedback on workshop locations,
we reviewed these to include Cardiff this year in addition to Warwick, Edinburgh and
London. Our workshop in Cardiff was a positive addition to our engagement
programme which was welcomed by our stakeholders. We will use these locations
again for the FES 2017 workshops in October.
This year we held a specific workshop looking at the 2050 climate change targets
with attendees from across the relevant sectors of the industry and academia. We
explored stakeholders thoughts further on related topics and will feed this through to
our environmental targets analysis and modelling for FES 2017.
We increased our webinars after the FES launch to allow those unable to attend the
launch event an opportunity to learn about the latest FES and ask any questions they
may have.
We enhanced our “FES in 5” document as a result of the feedback we received from
our stakeholders on the previous version. This has been very well received and we
will continue with a summary for FES 2017.
The number of organisations who attended our events and which sectors they
represented is set out in the annex.
Se
ctio
n tw
o
11
Our engagement
How will we further enhance our engagement for 2017?
Stakeholders told us they were happy with the existing methods of engagement but
suggested some enhancements to this. Based on this feedback, below are some of the key
changes we will be looking to make for 2017.
More agile engagement – engaging with our stakeholders when key changes or
updates are made and involving them within this process, for example, by
contributing and presenting our perspectives at relevant industry events and testing
our assumptions and analysis.
More of our views and opinion – stakeholders advised they wanted to hear more of
our opinion on hot topics and key changes. Therefore, at our October Workshops we
trialled a new method of doing so – our proposed thought pieces which would be
timely articles providing our views and thoughts. You’ll hear more about these
throughout this year and referenced in this document.
More regular communications – stakeholders asked for us to communicate outside
of our existing engagement cycle and specifically for a mail out of key updates or
changes including our views and opinion on key industry topics. We will therefore be
launching a regular communication email in 2017 which will include the latest
updates on our work, our thought pieces, upcoming events and spotlights on our
team’s work.
Flexible engagement – stakeholders told us for smaller companies it can be difficult
to resource attendance at our events. In 2017 we will be looking to come to existing
forums already attended by those smaller companies and explore the greater use of
webinars and video conference as an alternative method of engagement.
Se
ctio
n tw
o
12
Our proposed scenarios for 2017
In this section we describe our proposed high level scenarios for FES 2017 which will
provide the basis for the detailed modelling and analysis that feeds into the Future Energy
Scenarios we publish in July 2017.
The scenario framework
We use the scenario framework to set out a structured approach which provides a single
reference document to group all the inputs and assumptions that we use to build our
scenarios (see Figure 3 below). There has been strong support from our stakeholders over
the past year to keep this approach.
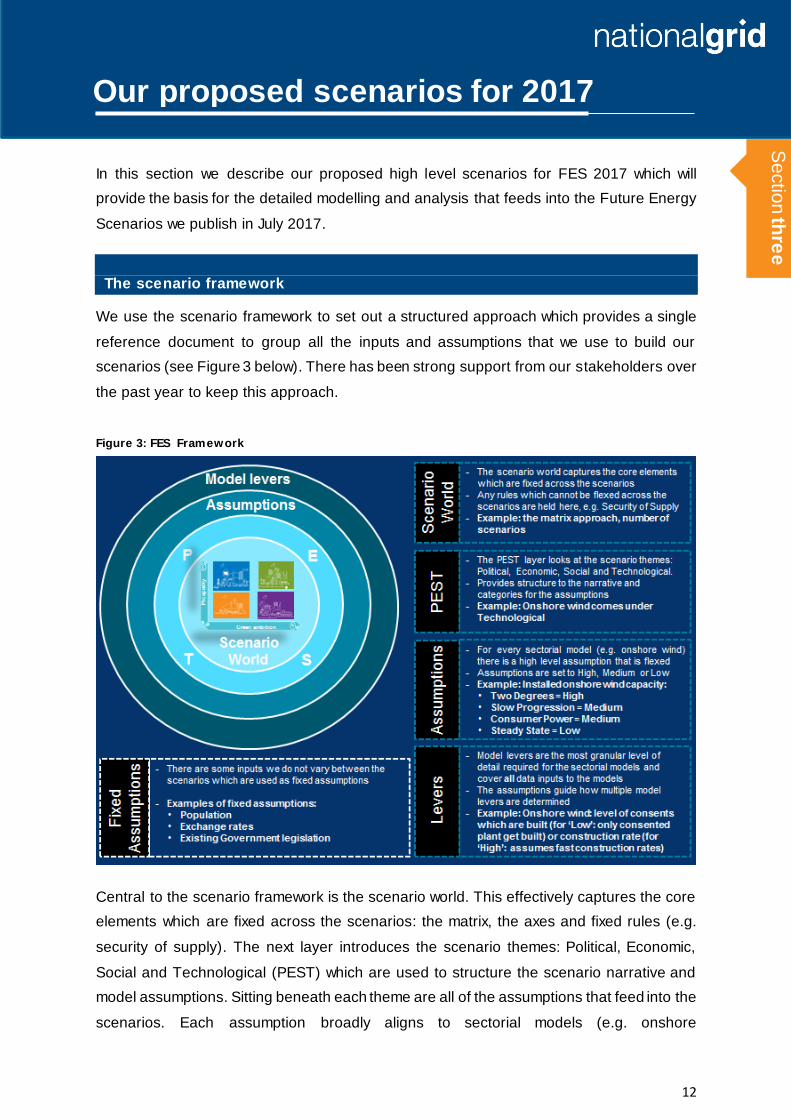
Figure 3: FES Framework
Central to the scenario framework is the scenario world. This effectively captures the core
elements which are fixed across the scenarios: the matrix, the axes and fixed rules (e.g.
security of supply). The next layer introduces the scenario themes: Political, Economic,
Social and Technological (PEST) which are used to structure the scenario narrative and
model assumptions. Sitting beneath each theme are all of the assumptions that feed into the
scenarios. Each assumption broadly aligns to sectorial models (e.g. onshore
Se
ctio
n th
ree
13
Our proposed scenarios for 2017
wind) and will be set at high, medium or low for each of the four scenarios. The final layer of
the framework is the specific model levers which are the detailed granular inputs into the
analysis – these cover all inputs to all the models used to produce the FES.
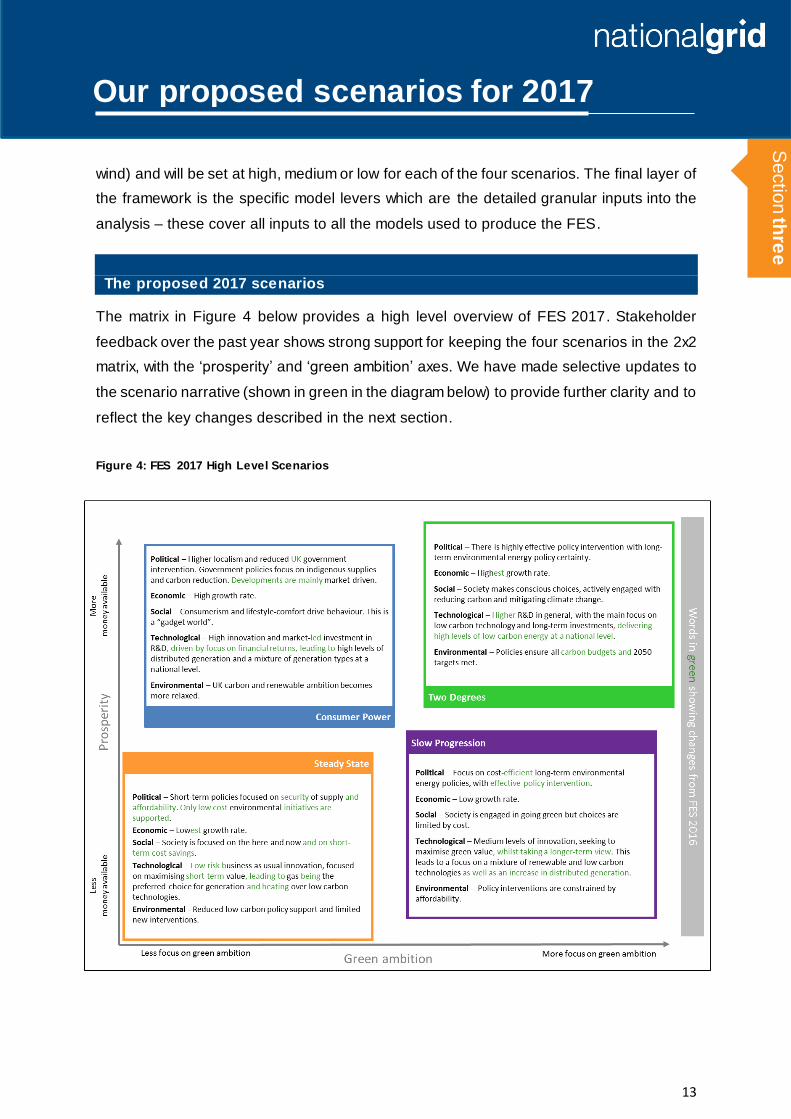
The proposed 2017 scenarios
The matrix in Figure 4 below provides a high level overview of FES 2017. Stakeholder
feedback over the past year shows strong support for keeping the four scenarios in the 2x2
matrix, with the ‘prosperity’ and ‘green ambition’ axes. We have made selective updates to
the scenario narrative (shown in green in the diagram below) to provide further clarity and to
reflect the key changes described in the next section.
Figure 4: FES 2017 High Level Scenarios
Se
ctio
n th
ree
14
Our proposed scenarios for 2017
Key changes for FES 2017
As we’ve mentioned, we continually look to review our scenarios and ensure they are
credible and fit for purpose. Our research, intelligence and stakeholder feedback over the
past year has led to the following key changes to date. Our work is ongoing and we will
update you on further changes that may arise.
Key changes so far for FES 2017:
Reflecting trends in distributed generation: As in previous years, all of our scenarios
will consider energy demand and supply with a whole system view. To reflect recent
trends in the electricity market, two of our four core scenarios for 2017 will have high
levels of distributed generation growth (compared to one last year), with the other two
scenarios featuring more moderate growth rates of distributed generation to reflect
uncertainty over embedded benefits. This has also been supported by stakeholder
views.
We will continue to monitor the potential for changes to the charging and regulatory
frameworks and subsidy arrangements to understand how this may affect the future
growth of distributed generation. We will feed this into our analysis as we develop FES
2017.
Impact of Brexit: Our analysis and stakeholder feedback has shown uncertainty around
the impact of Brexit. We will capture this by using a wider range of economic growth
forecasts for FES 2017, i.e. two high growth and two low growth forecasts (instead of
only one high and one low forecast in 2016). We will also include a section in FES 2017
to set out in more detail how we have considered Brexit in our scenario development.
Repositioning the scenarios on the axes: We have repositioned the scenarios on the
axes in the scenario matrix (see Figure 4 above). This reflects how we have distributed
the wider range of economic growth forecasts across the four scenarios (i.e. Two
Degrees being more prosperous than Consumer Power and Slow Progression being
more prosperous than Steady State). The repositioning also reflects differences between
the scenarios in the level of green ambition.
Se
ctio
n th
ree

15
Our proposed scenarios for 2017
Retiring the names ‘Gone Green’ and ‘No Progression’: These names have been
retired to more accurately reflect the scenarios.
The name Gone Green has remained the same since the scenario was first
introduced in 2011, but the scenario itself has evolved significantly over the years.
There has been a shift from a focus on renewable technologies to low carbon
technologies, and in FES 2016 the scenario no longer met the 2020 renewables
target (whilst still meeting the 2050 carbon reduction target). The name Gone Green
is replaced by ‘Two Degrees’ and the scenario will continue to be our core scenario
that meets the 2050 carbon reduction target (none of the other core scenarios will
meet this target without further intervention). The name Two Degrees signifies that
the scenario is consistent with the UK carbon budgets and the 2050 target which is
the UK’s contribution to the Paris Agreement of seeking to hold the increase in the
global average temperature to well below 2 °C above pre -industrial levels.
Our stakeholders have told us they don’t think the name No Progression accurately
reflects the scenario. The name could suggest ‘no change’, despite there being some
business as usual progress and innovation. The new name, ‘Steady State’, better
reflects the scenario which continues to represent a world where current levels of
progress and innovation are reflected out to 2050.
Development of wider sensitivities: The four core scenarios will continue to
provide our view, informed by analysis and stakeholder feedback, of plausible and
credible energy futures. In addition to this, we propose to develop a broader range of
sensitivities around the four main scenarios that represent other possible futures.
These sensitivities could consider, for example, the impact of potentially ground
breaking technological developments or potential major developments in UK or
international policy. The sensitivities will not provide a full suite of analysis at the level
of the core scenarios, but they will be used to ‘flex’ the scenario range. We are in the
process of considering what sensitivities we’ll apply and we’ll share further details
with our stakeholders in due course.
Se
ctio
n th
ree
16
Stakeholder feedback and FES 2017
To build our scenarios we collect a significant amount of data. The information we receive
from our stakeholders is one of the elements in helping the development of our FES. We
explore each comment and apply our own judgement and expertise to consider it against the
themes we are hearing from across our stakeholder engagement. This is supported with our
own analysis, facts, projections and historical data.
In carrying out our modelling, we look at the different sectors that impact supply and demand
for both electricity and gas. For example, heat, power and transport, as well as the global
commodity market, technology, build rates, generator economics and the supply chain.
We have a number of models for different sectors, which we use to develop trends for each
of the elements. For example, we model how electric vehicle growth and industrial and
commercial business activities impact electricity demand, along with other drivers of
demand. We use the outputs from these models to build a holistic energy future for each
scenario.
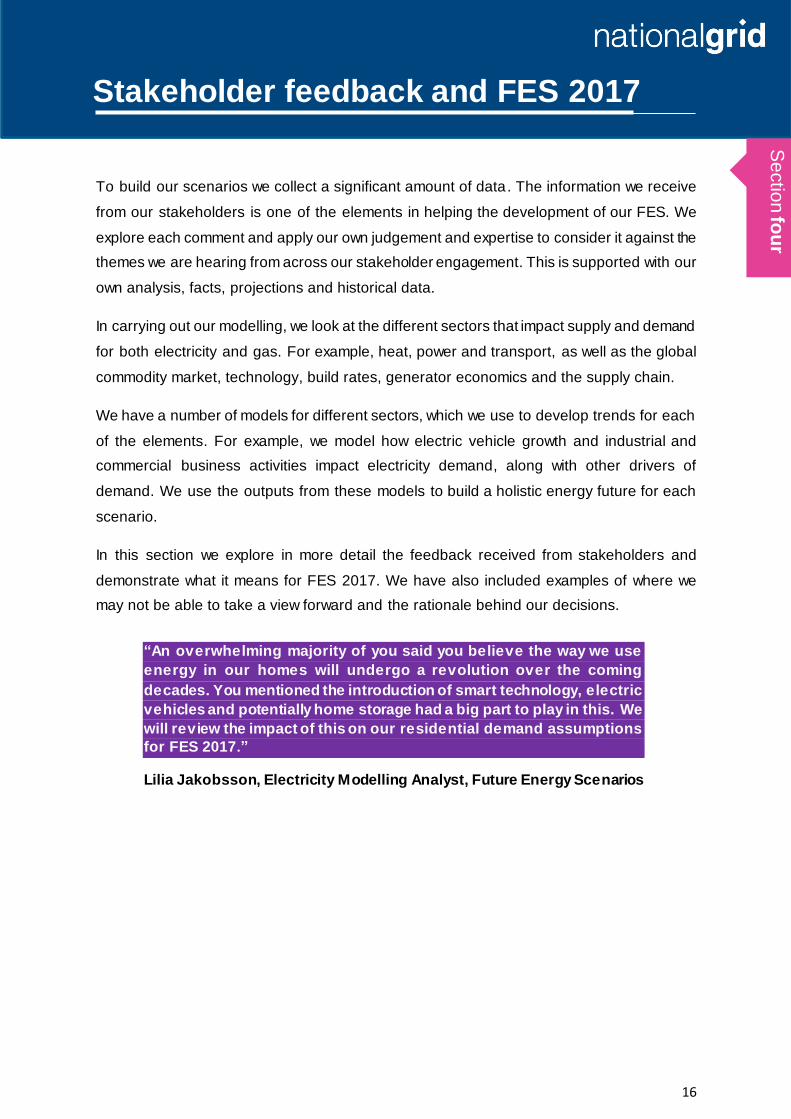
In this section we explore in more detail the feedback received from stakeholders and
demonstrate what it means for FES 2017. We have also included examples of where we
may not be able to take a view forward and the rationale behind our decisions.
“An overwhelming majority of you said you believe the way we use
energy in our homes will undergo a revolution over the coming
decades. You mentioned the introduction of smart technology, electric
vehicles and potentially home storage had a big part to play in this. We
will review the impact of this on our residential demand assumptions
for FES 2017.”
Lilia Jakobsson, Electricity Modelling Analyst, Future Energy Scenarios
Se
ctio
n fo
ur
17
Stakeholder feedback and FES 2017
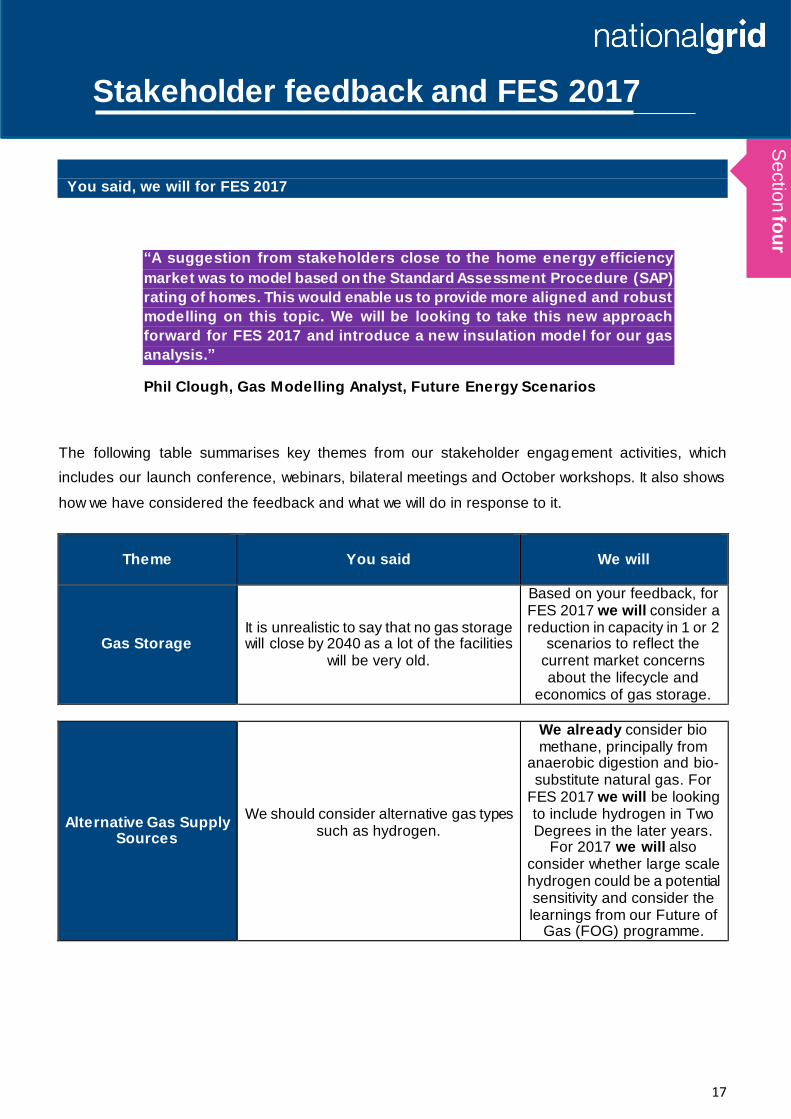
You said, we will for FES 2017
“A suggestion from stakeholders close to the home energy efficiency
market was to model based on the Standard Assessment Procedure (SAP)
rating of homes. This would enable us to provide more aligned and robust
modelling on this topic. We will be looking to take this new approach
forward for FES 2017 and introduce a new insulation model for our gas
analysis.”
Phil Clough, Gas Modelling Analyst, Future Energy Scenarios
The following table summarises key themes from our stakeholder engagement activities, which
includes our launch conference, webinars, bilateral meetings and October workshops. It also shows
how we have considered the feedback and what we will do in response to it.
Theme
You said
We will
Gas Storage It is unrealistic to say that no gas storage will close by 2040 as a lot of the facilities
will be very old.
Based on your feedback, for FES 2017 we will consider a reduction in capacity in 1 or 2
scenarios to reflect the current market concerns about the lifecycle and
economics of gas storage.
Alternative Gas Supply Sources
We should consider alternative gas types such as hydrogen.
We already consider bio methane, principally from
anaerobic digestion and bio-substitute natural gas. For
FES 2017 we will be looking to include hydrogen in Two Degrees in the later years.
For 2017 we will also consider whether large scale hydrogen could be a potential sensitivity and consider the learnings from our Future of
Gas (FOG) programme.
Se
ctio
n fo
ur
18
Stakeholder feedback and FES 2017
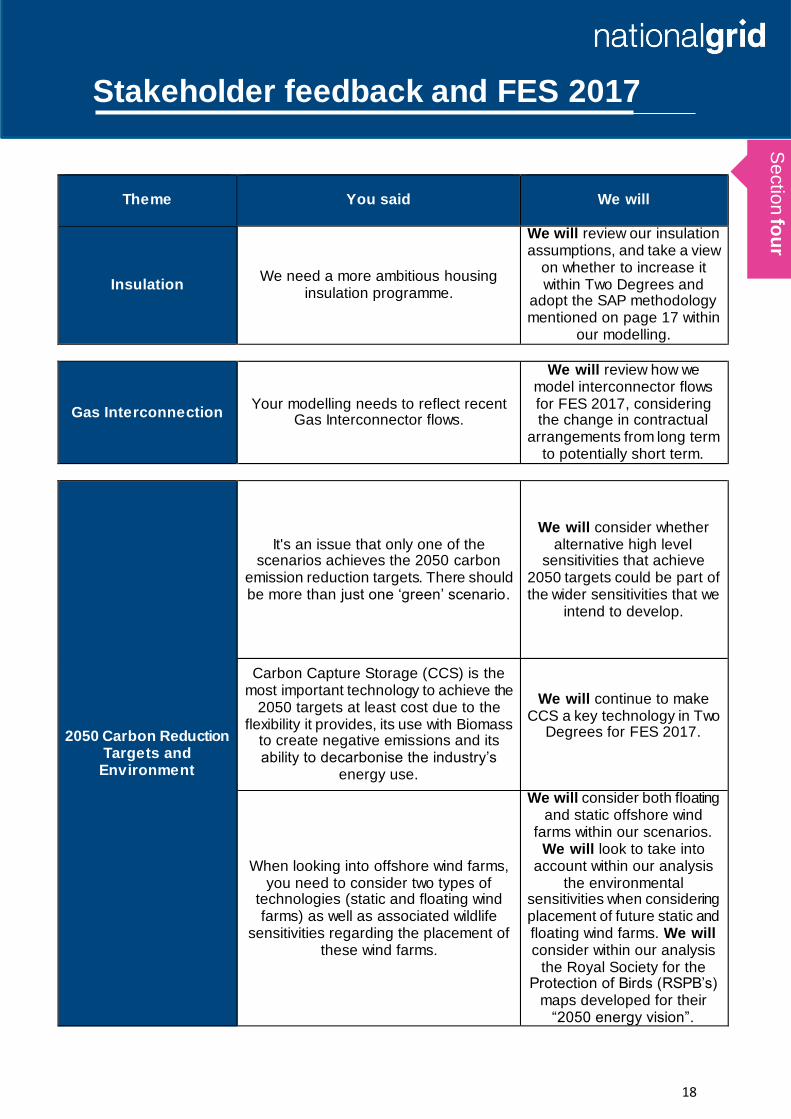
Theme
You said
We will
Insulation We need a more ambitious housing
insulation programme.
We will review our insulation assumptions, and take a view
on whether to increase it within Two Degrees and
adopt the SAP methodology mentioned on page 17 within
our modelling.
Gas Interconnection Your modelling needs to reflect recent
Gas Interconnector flows.
We will review how we model interconnector flows for FES 2017, considering the change in contractual
arrangements from long term to potentially short term.
2050 Carbon Reduction Targets and
Environment
It's an issue that only one of the scenarios achieves the 2050 carbon
emission reduction targets. There should be more than just one ‘green’ scenario.
We will consider whether alternative high level
sensitivities that achieve 2050 targets could be part of the wider sensitivities that we
intend to develop.
Carbon Capture Storage (CCS) is the most important technology to achieve the
2050 targets at least cost due to the flexibility it provides, its use with Biomass
to create negative emissions and its ability to decarbonise the industry’s
energy use.
We will continue to make CCS a key technology in Two
Degrees for FES 2017.
When looking into offshore wind farms, you need to consider two types of
technologies (static and floating wind farms) as well as associated wildlife
sensitivities regarding the placement of these wind farms.
We will consider both floating and static offshore wind
farms within our scenarios. We will look to take into
account within our analysis the environmental
sensitivities when considering placement of future static and floating wind farms. We will consider within our analysis
the Royal Society for the Protection of Birds (RSPB’s)
maps developed for their “2050 energy vision”.
Se
ctio
n fo
ur
19
Stakeholder feedback and FES 2017
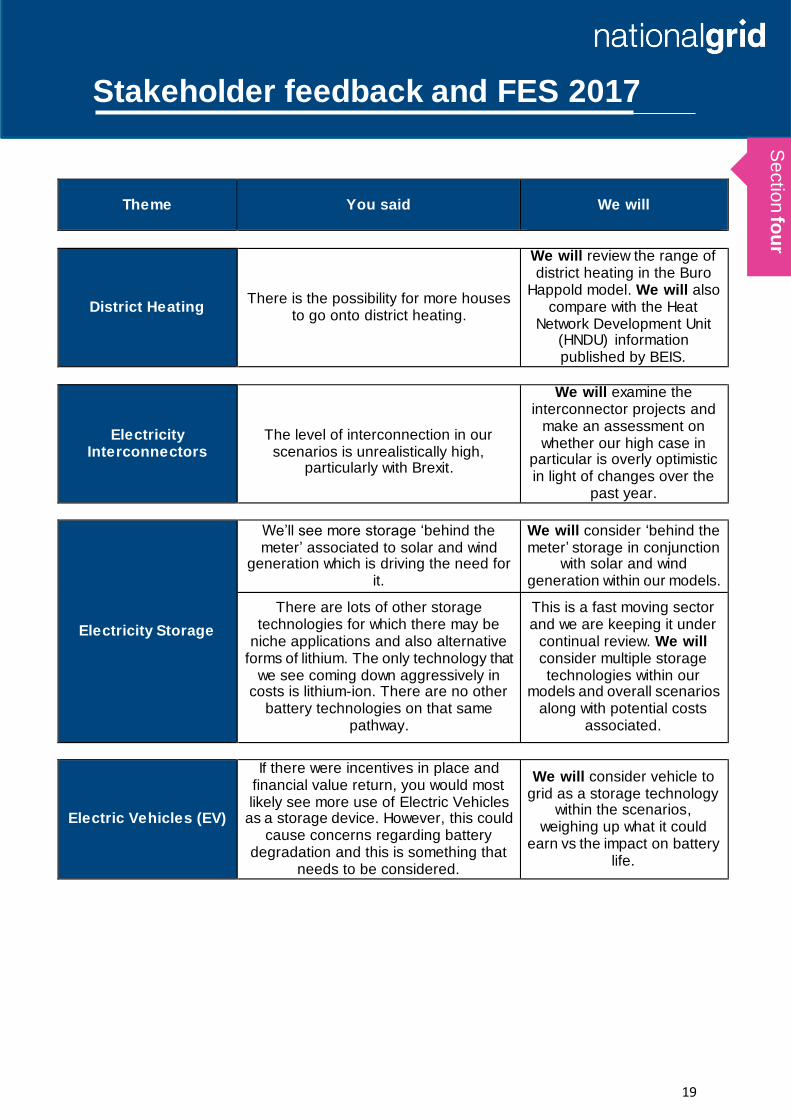
Theme
You said
We will
District Heating There is the possibility for more houses
to go onto district heating.
We will review the range of district heating in the Buro
Happold model. We will also compare with the Heat
Network Development Unit (HNDU) information published by BEIS.
Electricity Interconnectors
The level of interconnection in our
scenarios is unrealistically high, particularly with Brexit.
We will examine the interconnector projects and
make an assessment on whether our high case in
particular is overly optimistic in light of changes over the
past year.
Electricity Storage
We’ll see more storage ‘behind the meter’ associated to solar and wind
generation which is driving the need for it.
We will consider ‘behind the meter’ storage in conjunction
with solar and wind generation within our models.
There are lots of other storage technologies for which there may be
niche applications and also alternative forms of lithium. The only technology that
we see coming down aggressively in costs is lithium-ion. There are no other
battery technologies on that same pathway.
This is a fast moving sector and we are keeping it under
continual review. We will consider multiple storage technologies within our
models and overall scenarios along with potential costs
associated.
Electric Vehicles (EV)
If there were incentives in place and financial value return, you would most likely see more use of Electric Vehicles
as a storage device. However, this could cause concerns regarding battery
degradation and this is something that needs to be considered.
We will consider vehicle to grid as a storage technology
within the scenarios, weighing up what it could
earn vs the impact on battery life.
Se
ctio
n fo
ur
20
Stakeholder feedback and FES 2017
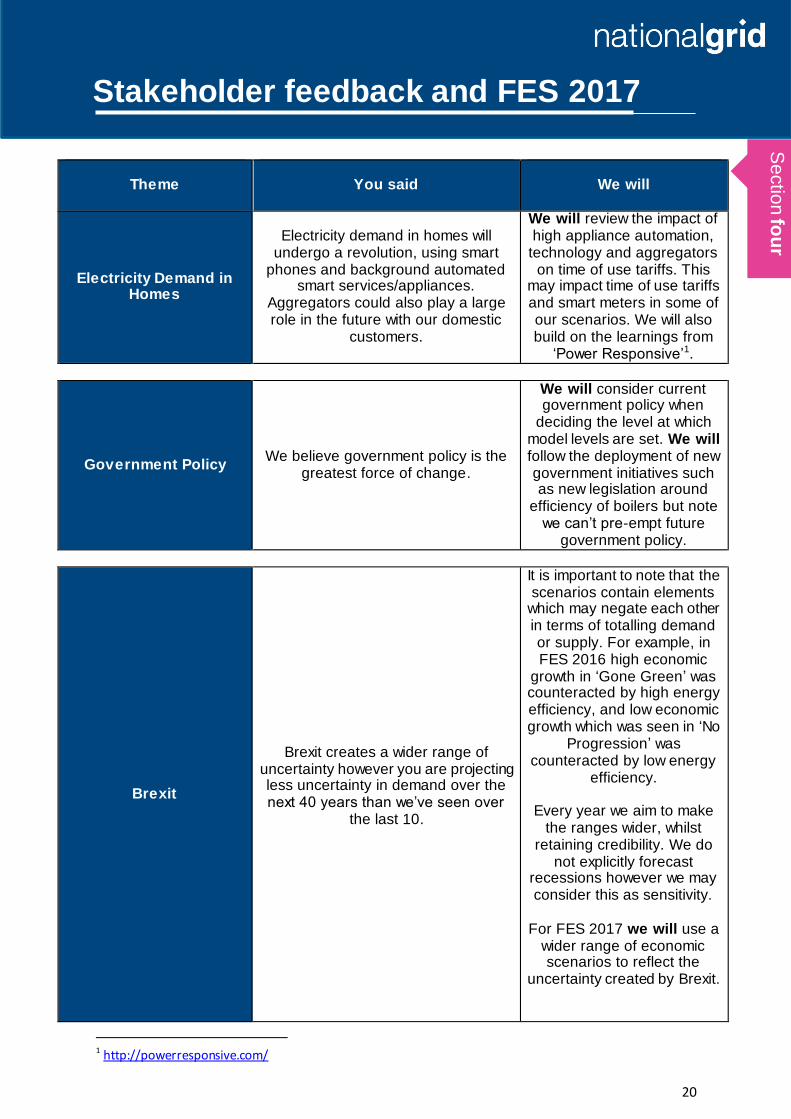
Theme
You said
We will
Electricity Demand in Homes
Electricity demand in homes will undergo a revolution, using smart
phones and background automated smart services/appliances.
Aggregators could also play a large role in the future with our domestic
customers.
We will review the impact of high appliance automation,
technology and aggregators on time of use tariffs. This
may impact time of use tariffs and smart meters in some of our scenarios. We will also build on the learnings from
‘Power Responsive’1.
Government Policy We believe government policy is the
greatest force of change.
We will consider current government policy when
deciding the level at which model levels are set. We will follow the deployment of new government initiatives such as new legislation around
efficiency of boilers but note we can’t pre-empt future
government policy.
Brexit
Brexit creates a wider range of uncertainty however you are projecting less uncertainty in demand over the next 40 years than we’ve seen over
the last 10.
It is important to note that the scenarios contain elements
which may negate each other in terms of totalling demand or supply. For example, in FES 2016 high economic
growth in ‘Gone Green’ was counteracted by high energy efficiency, and low economic growth which was seen in ‘No
Progression’ was counteracted by low energy
efficiency.
Every year we aim to make the ranges wider, whilst
retaining credibility. We do not explicitly forecast
recessions however we may consider this as sensitivity.
For FES 2017 we will use a
wider range of economic scenarios to reflect the
uncertainty created by Brexit.
1 http://powerresponsive.com/
Se
ctio
n fo
ur
21
Stakeholder feedback and FES 2017
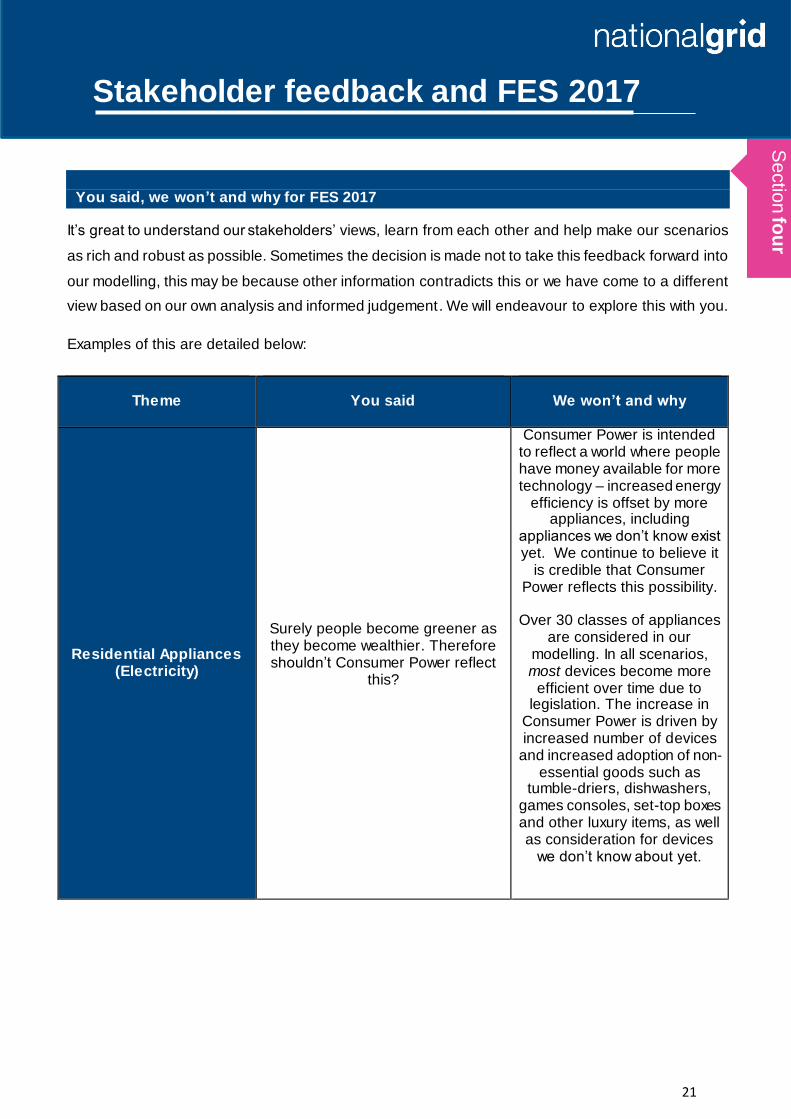
You said, we won’t and why for FES 2017
It’s great to understand our stakeholders’ views, learn from each other and help make our scenarios
as rich and robust as possible. Sometimes the decision is made not to take this feedback forward into
our modelling, this may be because other information contradicts this or we have come to a different
view based on our own analysis and informed judgement. We will endeavour to explore this with you.
Examples of this are detailed below:
Theme
You said
We won’t and why
Residential Appliances (Electricity)
Surely people become greener as they become wealthier. Therefore shouldn’t Consumer Power reflect
this?
Consumer Power is intended to reflect a world where people have money available for more technology – increased energy
efficiency is offset by more appliances, including
appliances we don’t know exist yet. We continue to believe it
is credible that Consumer Power reflects this possibility.
Over 30 classes of appliances
are considered in our modelling. In all scenarios, most devices become more
efficient over time due to legislation. The increase in
Consumer Power is driven by increased number of devices
and increased adoption of non-essential goods such as
tumble-driers, dishwashers, games consoles, set-top boxes and other luxury items, as well as consideration for devices
we don’t know about yet.
Se
ctio
n fo
ur
22
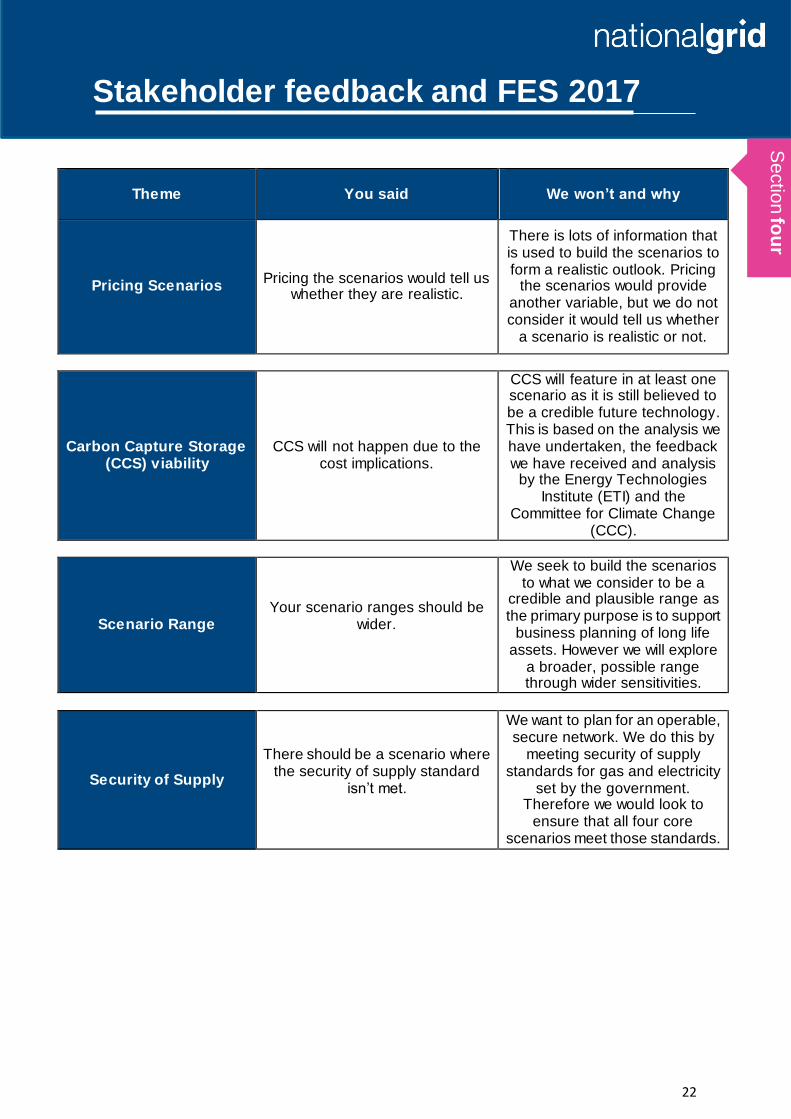
Stakeholder feedback and FES 2017
Theme
You said
We won’t and why
Pricing Scenarios Pricing the scenarios would tell us
whether they are realistic.
There is lots of information that is used to build the scenarios to form a realistic outlook. Pricing
the scenarios would provide another variable, but we do not consider it would tell us whether
a scenario is realistic or not.
Carbon Capture Storage (CCS) viability
CCS will not happen due to the cost implications.
CCS will feature in at least one scenario as it is still believed to be a credible future technology. This is based on the analysis we have undertaken, the feedback we have received and analysis
by the Energy Technologies Institute (ETI) and the
Committee for Climate Change (CCC).
Scenario Range Your scenario ranges should be
wider.
We seek to build the scenarios to what we consider to be a
credible and plausible range as the primary purpose is to support
business planning of long life assets. However we will explore
a broader, possible range through wider sensitivities.
Security of Supply
There should be a scenario where the security of supply standard
isn’t met.
We want to plan for an operable, secure network. We do this by
meeting security of supply standards for gas and electricity
set by the government. Therefore we would look to
ensure that all four core scenarios meet those standards.
Se
ctio
n fo
ur
23
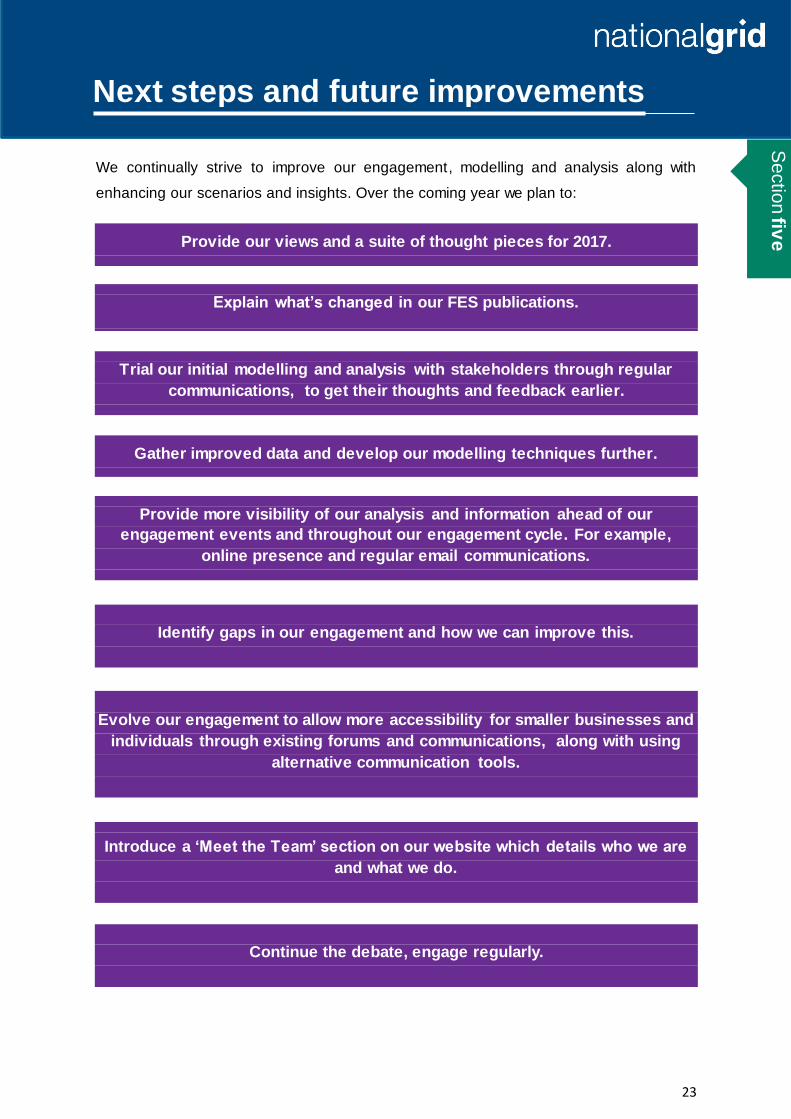
Next steps and future improvements
We continually strive to improve our engagement, modelling and analysis along with
enhancing our scenarios and insights. Over the coming year we plan to:
Provide our views and a suite of thought pieces for 2017.
Explain what’s changed in our FES publications.
Trial our initial modelling and analysis with stakeholders through regular
communications, to get their thoughts and feedback earlier.
Gather improved data and develop our modelling techniques further.
Provide more visibility of our analysis and information ahead of our
engagement events and throughout our engagement cycle. For example,
online presence and regular email communications.
Identify gaps in our engagement and how we can improve this.
Evolve our engagement to allow more accessibility for smaller businesses and
individuals through existing forums and communications, along with using
alternative communication tools.
Introduce a ‘Meet the Team’ section on our website which details who we are
and what we do.
Continue the debate, engage regularly.
Se
ctio
n fiv
e
24
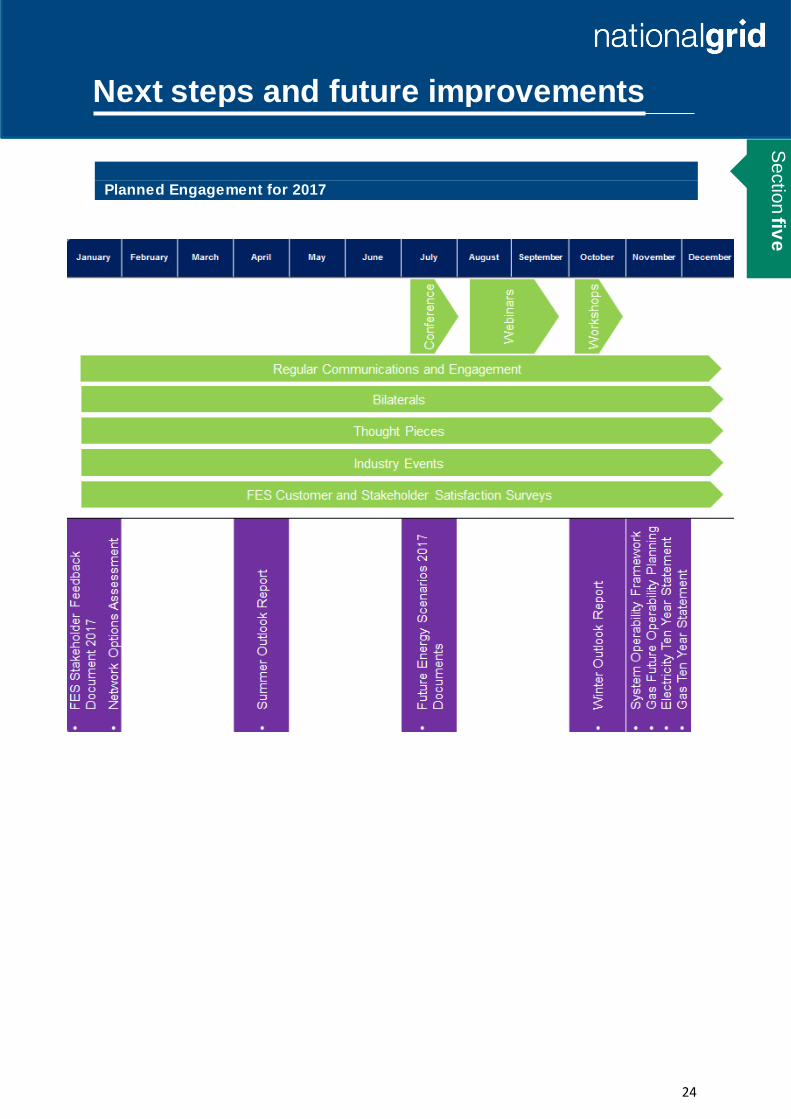
Next steps and future improvements
Planned Engagement for 2017
Se
ctio
n fiv
e
25
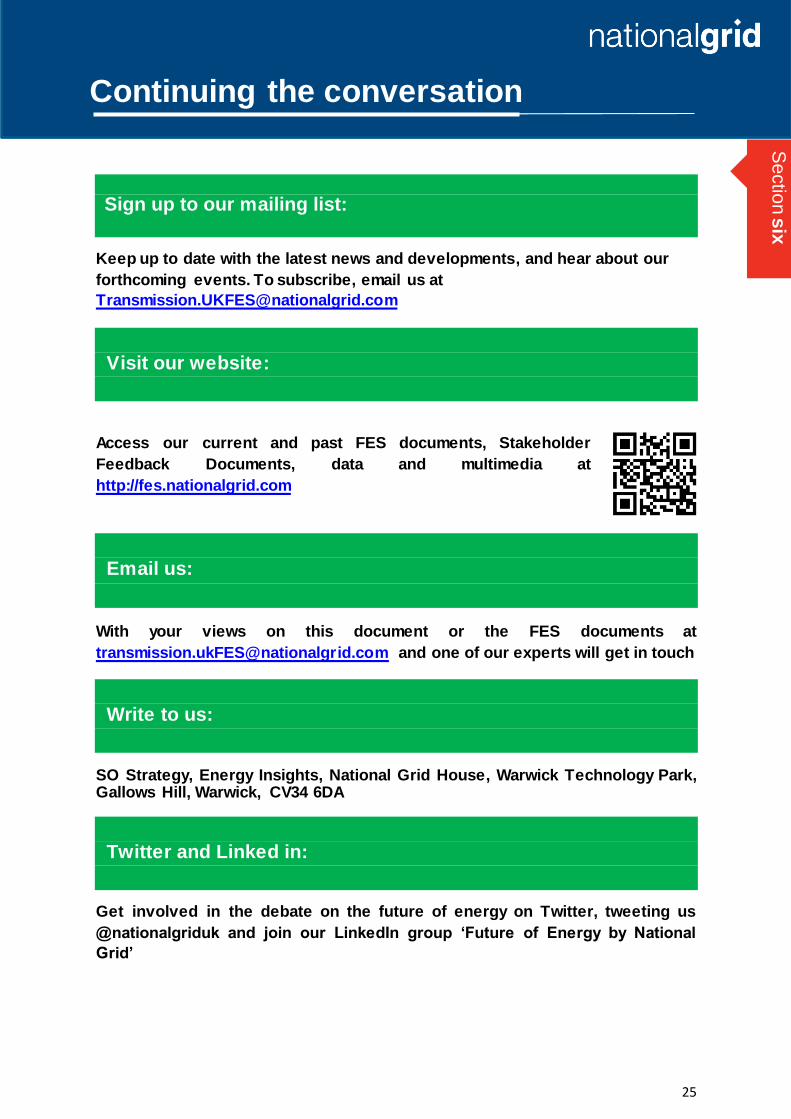
Continuing the conversation
Sign up to our mailing list:
Keep up to date with the latest news and developments, and hear about our
forthcoming events. To subscribe, email us at
Visit our website:
Access our current and past FES documents, Stakeholder
Feedback Documents, data and multimedia at
http://fes.nationalgrid.com
Email us:
With your views on this document or the FES documents at
[email protected] and one of our experts will get in touch
Write to us:
SO Strategy, Energy Insights, National Grid House, Warwick Technology Park, Gallows Hill, Warwick, CV34 6DA
Twitter and Linked in:
Get involved in the debate on the future of energy on Twitter, tweeting us
@nationalgriduk and join our LinkedIn group ‘Future of Energy by National
Grid’
Se
ctio
n s
ix

26
Meet the Energy Insights Team
What
Annex
27
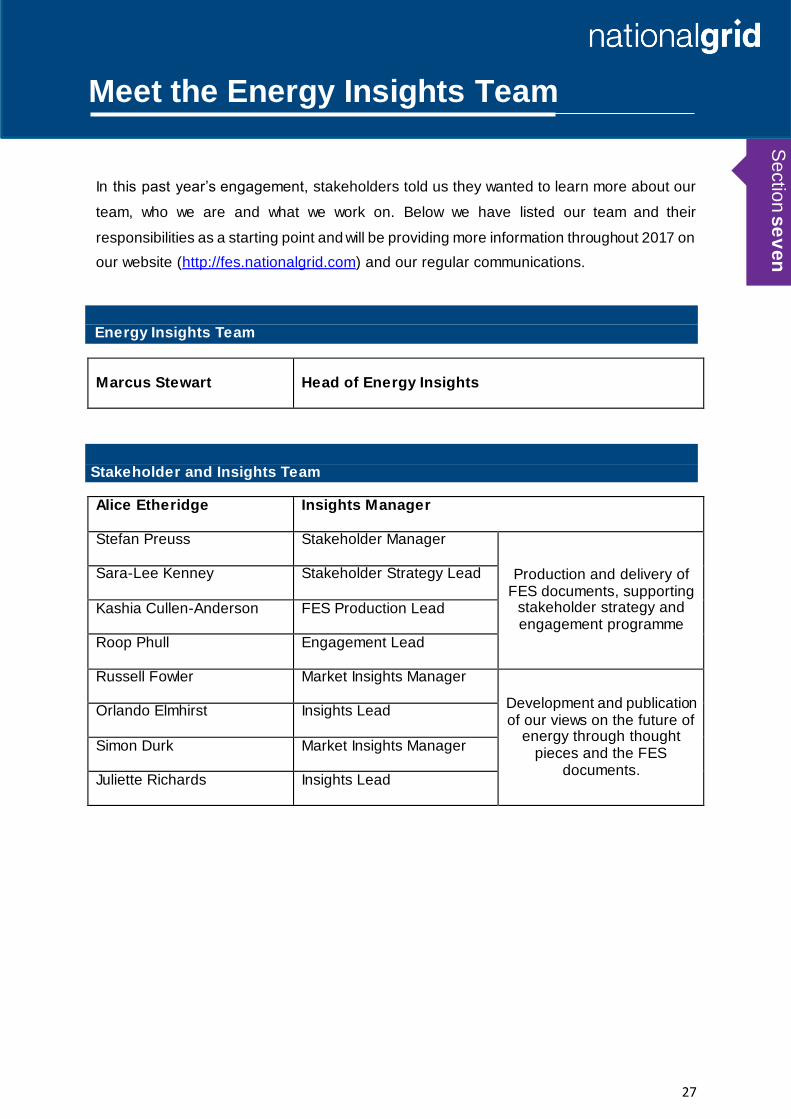
Meet the Energy Insights Team
In this past year’s engagement, stakeholders told us they wanted to learn more about our
team, who we are and what we work on. Below we have listed our team and their
responsibilities as a starting point and will be providing more information throughout 2017 on
our website (http://fes.nationalgrid.com) and our regular communications.
Energy Insights Team
Marcus Stewart
Head of Energy Insights
Stakeholder and Insights Team
Alice Etheridge
Insights Manager
Stefan Preuss
Stakeholder Manager
Production and delivery of FES documents, supporting
stakeholder strategy and engagement programme
Sara-Lee Kenney
Stakeholder Strategy Lead
Kashia Cullen-Anderson
FES Production Lead
Roop Phull
Engagement Lead
Russell Fowler Market Insights Manager
Development and publication of our views on the future of
energy through thought pieces and the FES
documents.
Orlando Elmhirst Insights Lead
Simon Durk Market Insights Manager
Juliette Richards Insights Lead
Sectio
n s
ev
en
28
Meet the Energy Insights Team
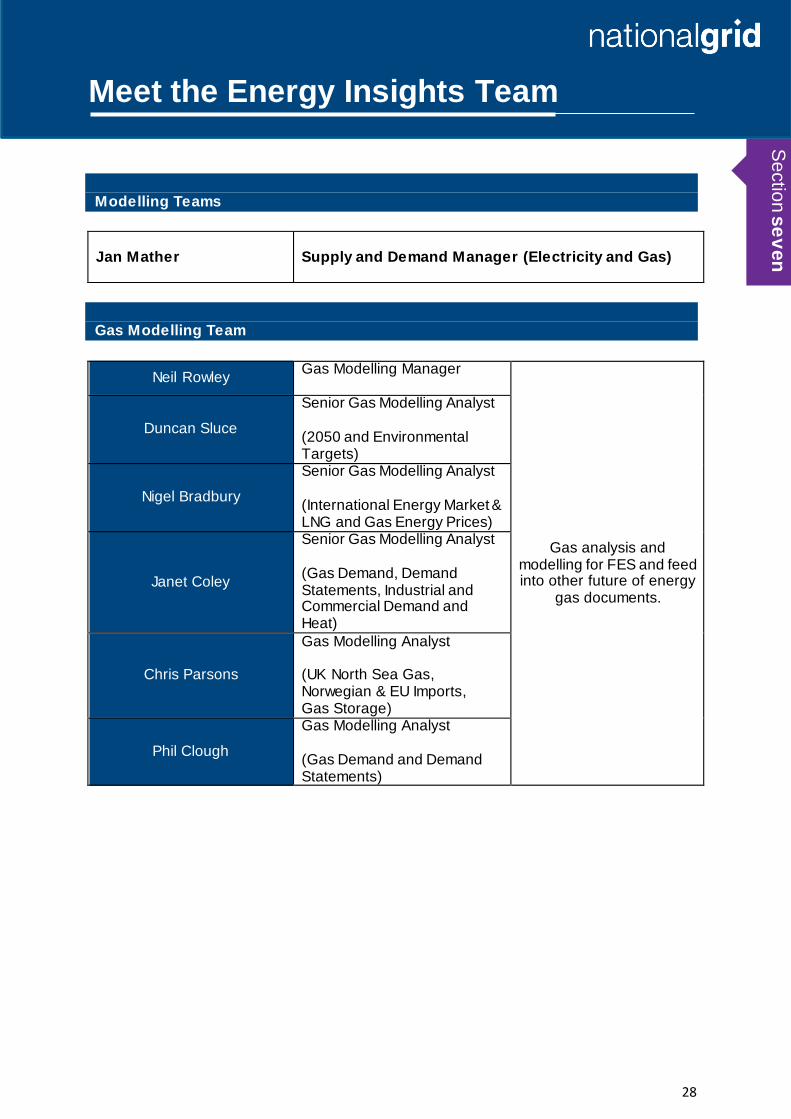
Modelling Teams
Jan Mather
Supply and Demand Manager (Electricity and Gas)
Gas Modelling Team
Neil Rowley Gas Modelling Manager
Gas analysis and modelling for FES and feed into other future of energy
gas documents.
Duncan Sluce
Senior Gas Modelling Analyst (2050 and Environmental Targets)
Nigel Bradbury
Senior Gas Modelling Analyst (International Energy Market & LNG and Gas Energy Prices)
Janet Coley
Senior Gas Modelling Analyst (Gas Demand, Demand Statements, Industrial and Commercial Demand and Heat)
Chris Parsons
Gas Modelling Analyst (UK North Sea Gas, Norwegian & EU Imports, Gas Storage)
Phil Clough
Gas Modelling Analyst (Gas Demand and Demand Statements)
Sectio
n s
ev
en
29
Meet the Energy Insights Team
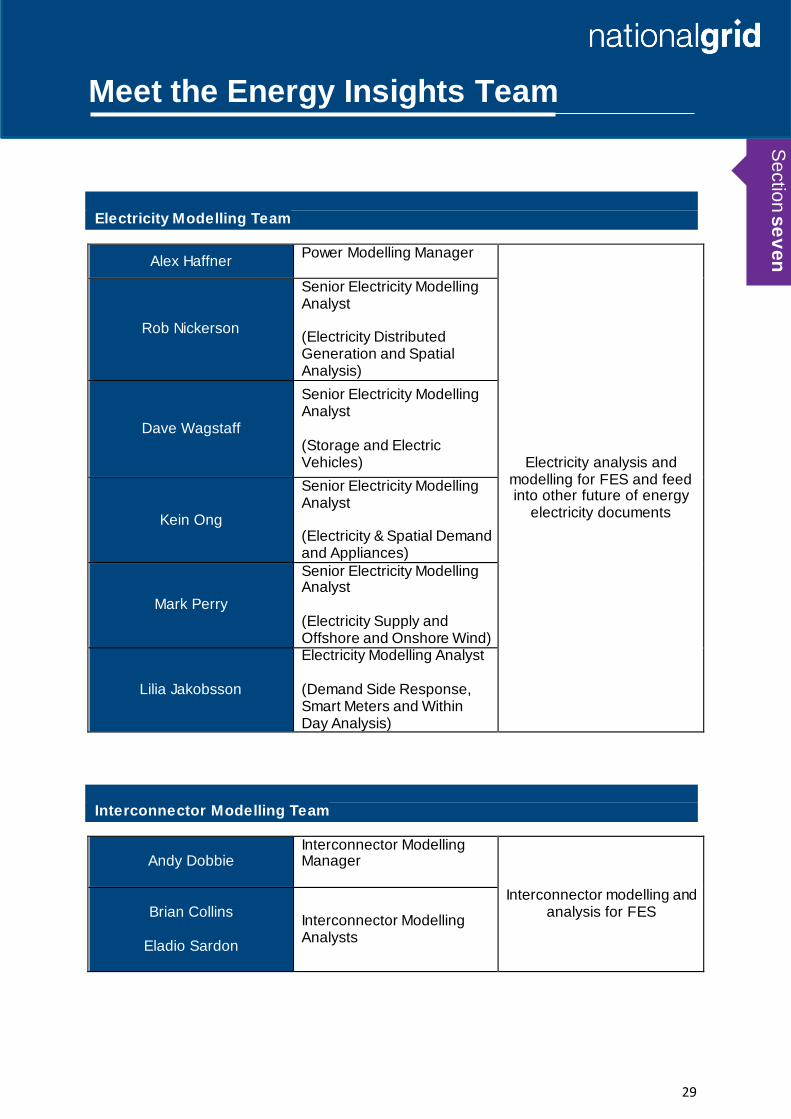
Electricity Modelling Team
Alex Haffner Power Modelling Manager
Electricity analysis and modelling for FES and feed into other future of energy
electricity documents
Rob Nickerson
Senior Electricity Modelling Analyst (Electricity Distributed Generation and Spatial Analysis)
Dave Wagstaff
Senior Electricity Modelling Analyst (Storage and Electric Vehicles)
Kein Ong
Senior Electricity Modelling Analyst (Electricity & Spatial Demand and Appliances)
Mark Perry
Senior Electricity Modelling Analyst (Electricity Supply and Offshore and Onshore Wind)
Lilia Jakobsson
Electricity Modelling Analyst (Demand Side Response, Smart Meters and Within Day Analysis)
Interconnector Modelling Team
Andy Dobbie Interconnector Modelling Manager
Interconnector modelling and analysis for FES Brian Collins
Eladio Sardon
Interconnector Modelling Analysts
Sectio
n s
ev
en
30
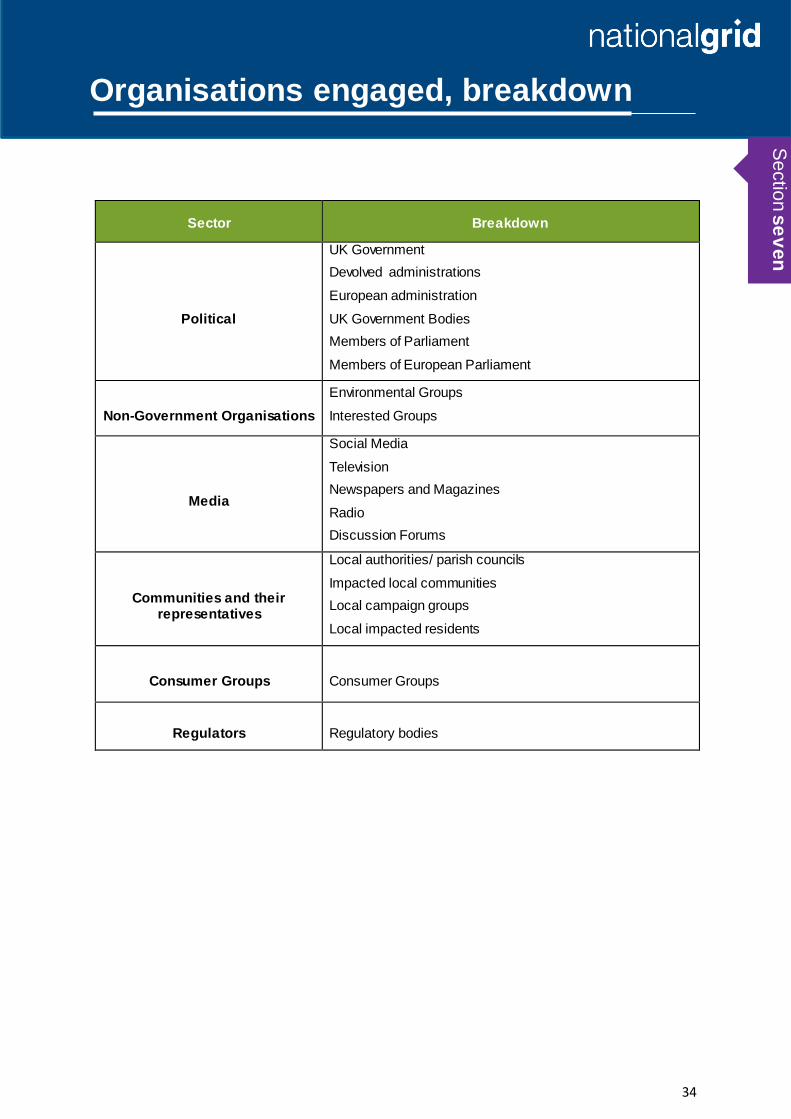
Organisations engaged, breakdown
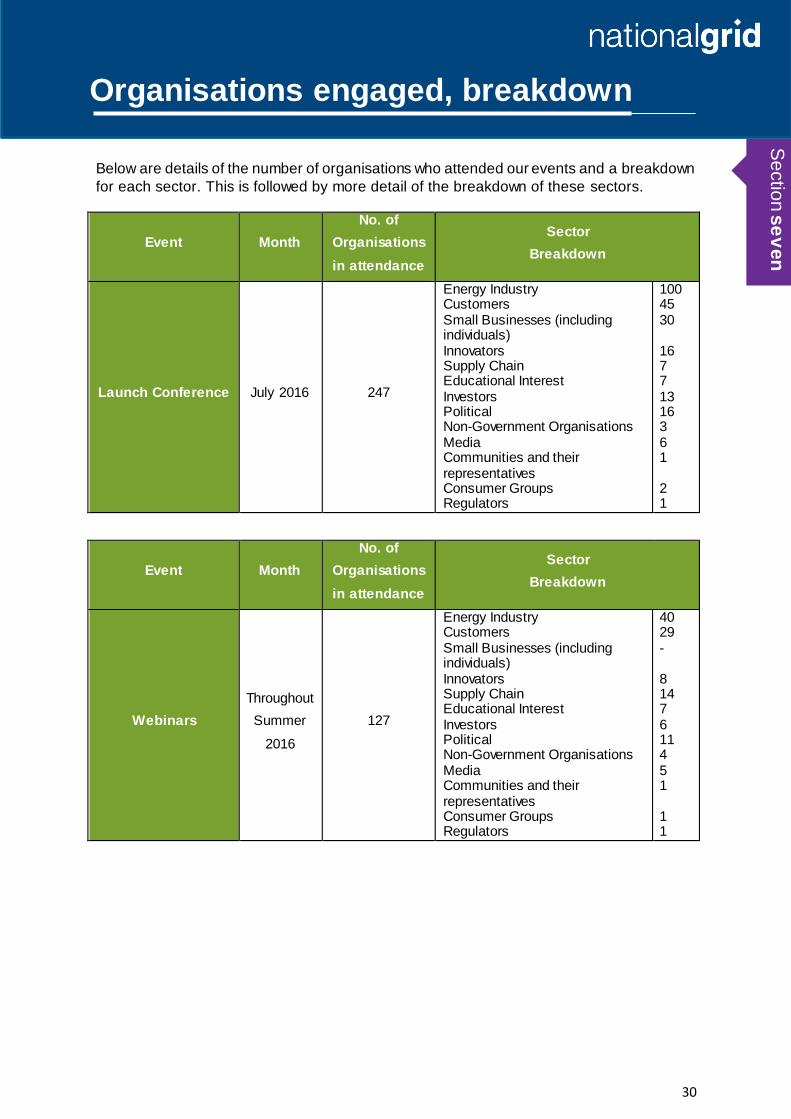
Below are details of the number of organisations who attended our events and a breakdown
for each sector. This is followed by more detail of the breakdown of these sectors.
Event Month
No. of
Organisations
in attendance
Sector
Breakdown
Launch Conference July 2016 247
Energy Industry Customers Small Businesses (including individuals) Innovators Supply Chain Educational Interest Investors Political Non-Government Organisations Media Communities and their representatives Consumer Groups Regulators
100 45 30 16 7 7 13 16 3 6 1 2 1
Event Month
No. of
Organisations
in attendance
Sector
Breakdown
Webinars
Throughout
Summer
2016
127
Energy Industry Customers Small Businesses (including individuals) Innovators Supply Chain Educational Interest Investors Political Non-Government Organisations Media Communities and their representatives Consumer Groups Regulators
40 29 - 8 14 7 6 11 4 5 1 1 1
Sectio
n s
ev
en
31
Organisations engaged, breakdown
Event Month
No. of
Organisations
in attendance
Sector
Breakdown
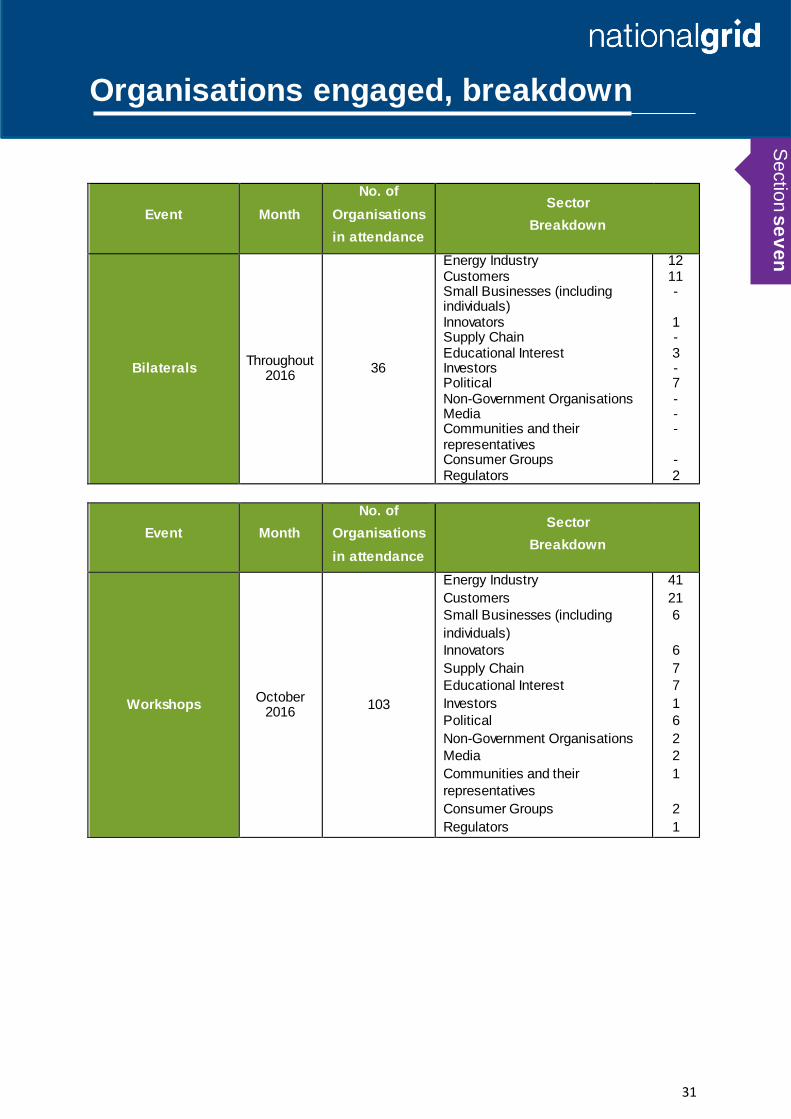
Bilaterals Throughout
2016 36
Energy Industry Customers Small Businesses (including individuals) Innovators Supply Chain Educational Interest Investors Political Non-Government Organisations Media Communities and their representatives Consumer Groups Regulators
12 11 - 1 - 3 - 7 - - - - 2
Event Month
No. of
Organisations
in attendance
Sector
Breakdown
Workshops October
2016 103
Energy Industry
Customers
Small Businesses (including
individuals)
Innovators
Supply Chain
Educational Interest
Investors
Political
Non-Government Organisations
Media
Communities and their
representatives
Consumer Groups
Regulators
41
21
6
6
7
7
1
6
2
2
1
2
1
Se
ctio
n s
ev
en
32
Organisations engaged, breakdown
Event Month
No. of
Organisations
in attendance
Sector
Breakdown
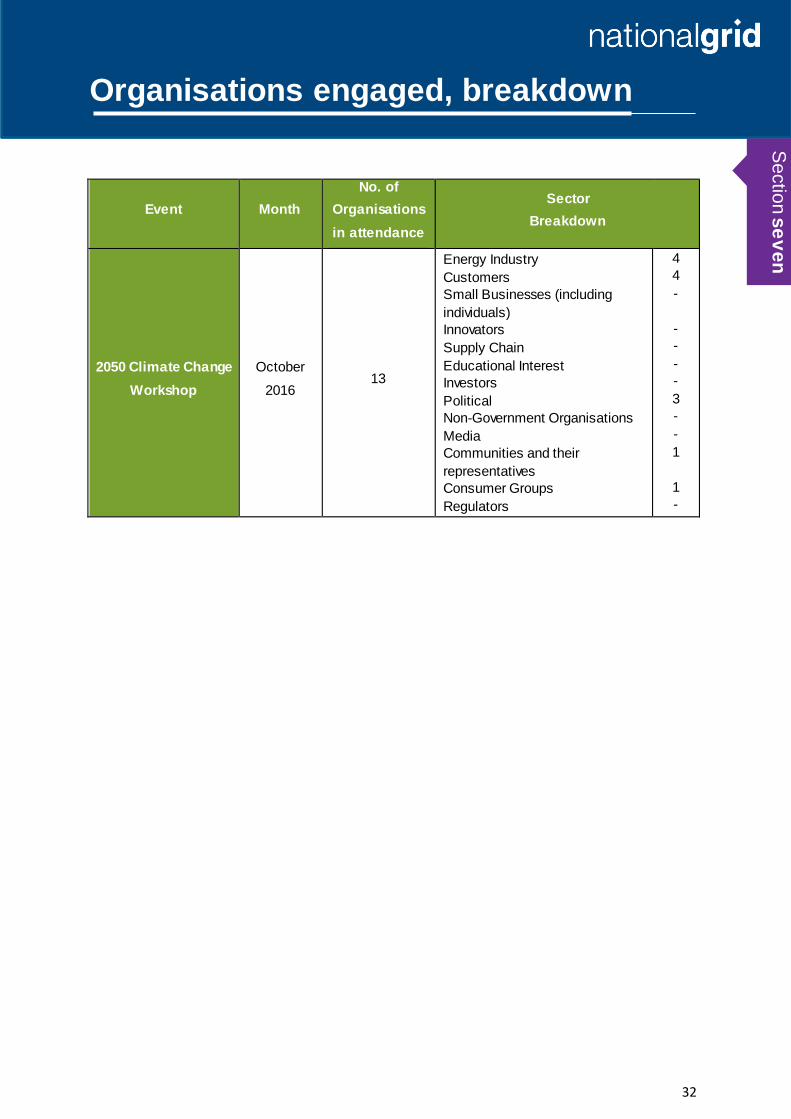
2050 Climate Change
Workshop
October
2016 13
Energy Industry
Customers
Small Businesses (including
individuals)
Innovators
Supply Chain
Educational Interest
Investors
Political
Non-Government Organisations
Media
Communities and their
representatives
Consumer Groups
Regulators
4
4
-
-
-
-
-
3
-
-
1
1
-
Sectio
n s
ev
en
33
Organisations engaged, breakdown
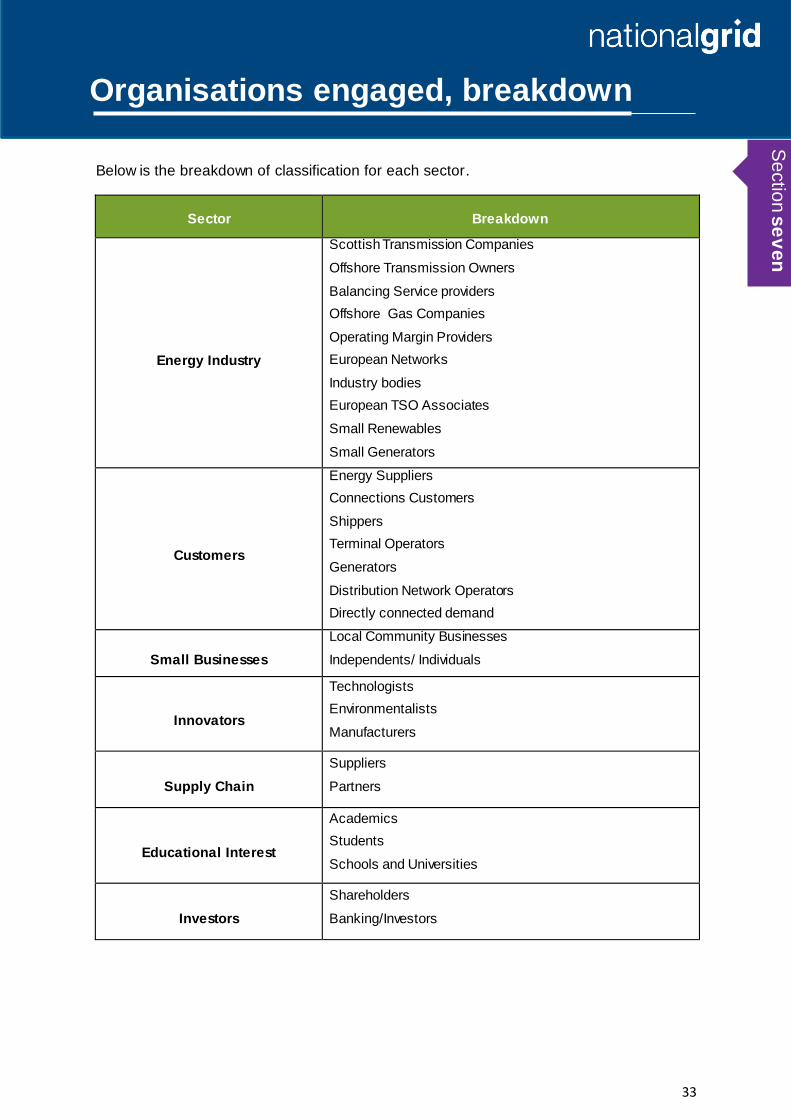
Below is the breakdown of classification for each sector.
Sector Breakdown
Energy Industry
Scottish Transmission Companies
Offshore Transmission Owners
Balancing Service providers
Offshore Gas Companies
Operating Margin Providers
European Networks
Industry bodies
European TSO Associates
Small Renewables
Small Generators
Customers
Energy Suppliers
Connections Customers
Shippers
Terminal Operators
Generators
Distribution Network Operators
Directly connected demand
Small Businesses
Local Community Businesses
Independents/ Individuals
Innovators
Technologists
Environmentalists
Manufacturers
Supply Chain
Suppliers
Partners
Educational Interest
Academics
Students
Schools and Universities
Investors
Shareholders
Banking/Investors
Sectio
n s
ev
en
34
Organisations engaged, breakdown
Sector Breakdown
Political
UK Government
Devolved administrations
European administration
UK Government Bodies
Members of Parliament
Members of European Parliament
Non-Government Organisations
Environmental Groups
Interested Groups
Media
Social Media
Television
Newspapers and Magazines
Radio
Discussion Forums
Communities and their representatives
Local authorities/ parish councils
Impacted local communities
Local campaign groups
Local impacted residents
Consumer Groups Consumer Groups
Regulators Regulatory bodies
Sectio
n s
ev
en
35
FES 2016: You said, we did
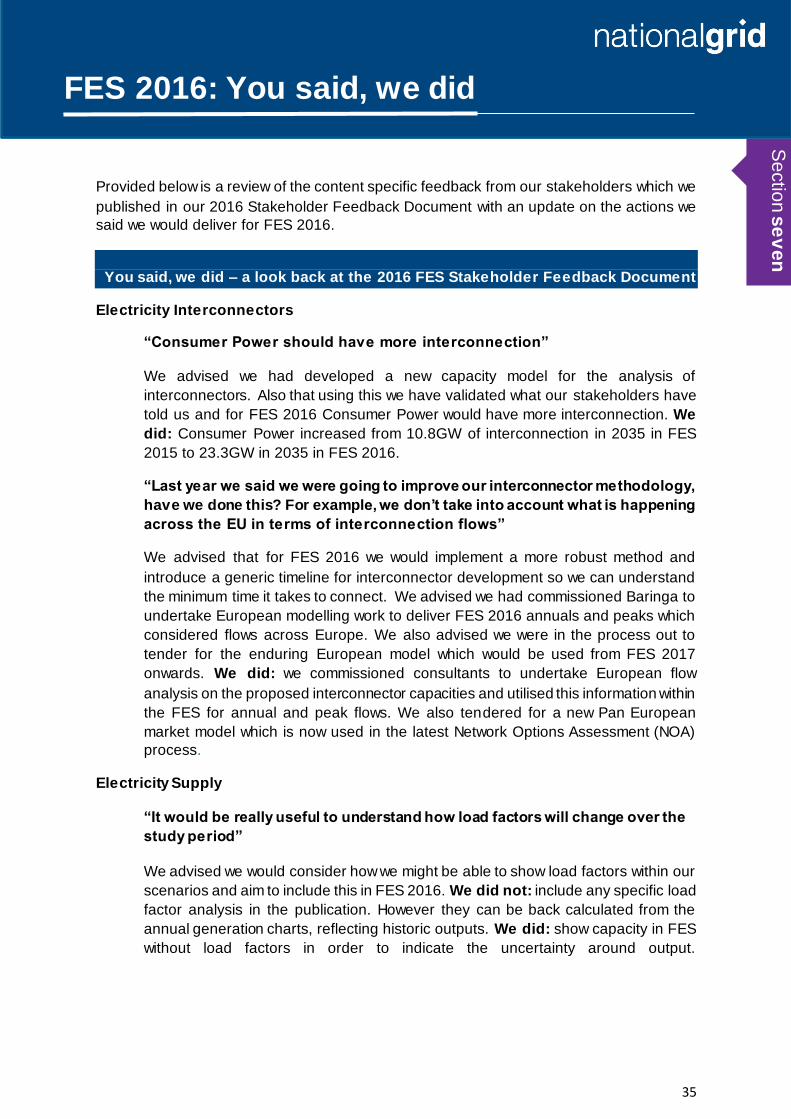
Provided below is a review of the content specific feedback from our stakeholders which we
published in our 2016 Stakeholder Feedback Document with an update on the actions we
said we would deliver for FES 2016.
You said, we did – a look back at the 2016 FES Stakeholder Feedback Document
Electricity Interconnectors
“Consumer Power should have more interconnection”
We advised we had developed a new capacity model for the analysis of
interconnectors. Also that using this we have validated what our stakeholders have
told us and for FES 2016 Consumer Power would have more interconnection. We
did: Consumer Power increased from 10.8GW of interconnection in 2035 in FES
2015 to 23.3GW in 2035 in FES 2016.
“Last year we said we were going to improve our interconnector methodology,
have we done this? For example, we don’t take into account what is happening
across the EU in terms of interconnection flows”
We advised that for FES 2016 we would implement a more robust method and
introduce a generic timeline for interconnector development so we can understand
the minimum time it takes to connect. We advised we had commissioned Baringa to
undertake European modelling work to deliver FES 2016 annuals and peaks which
considered flows across Europe. We also advised we were in the process out to
tender for the enduring European model which would be used from FES 2017
onwards. We did: we commissioned consultants to undertake European flow
analysis on the proposed interconnector capacities and utilised this information within
the FES for annual and peak flows. We also tendered for a new Pan European
market model which is now used in the latest Network Options Assessment (NOA)
process.
Electricity Supply
“It would be really useful to understand how load factors will change over the
study period”
We advised we would consider how we might be able to show load factors within our
scenarios and aim to include this in FES 2016. We did not: include any specific load
factor analysis in the publication. However they can be back calculated from the
annual generation charts, reflecting historic outputs. We did: show capacity in FES
without load factors in order to indicate the uncertainty around output.
Sectio
n s
ev
en
36
FES 2016: You said, we did
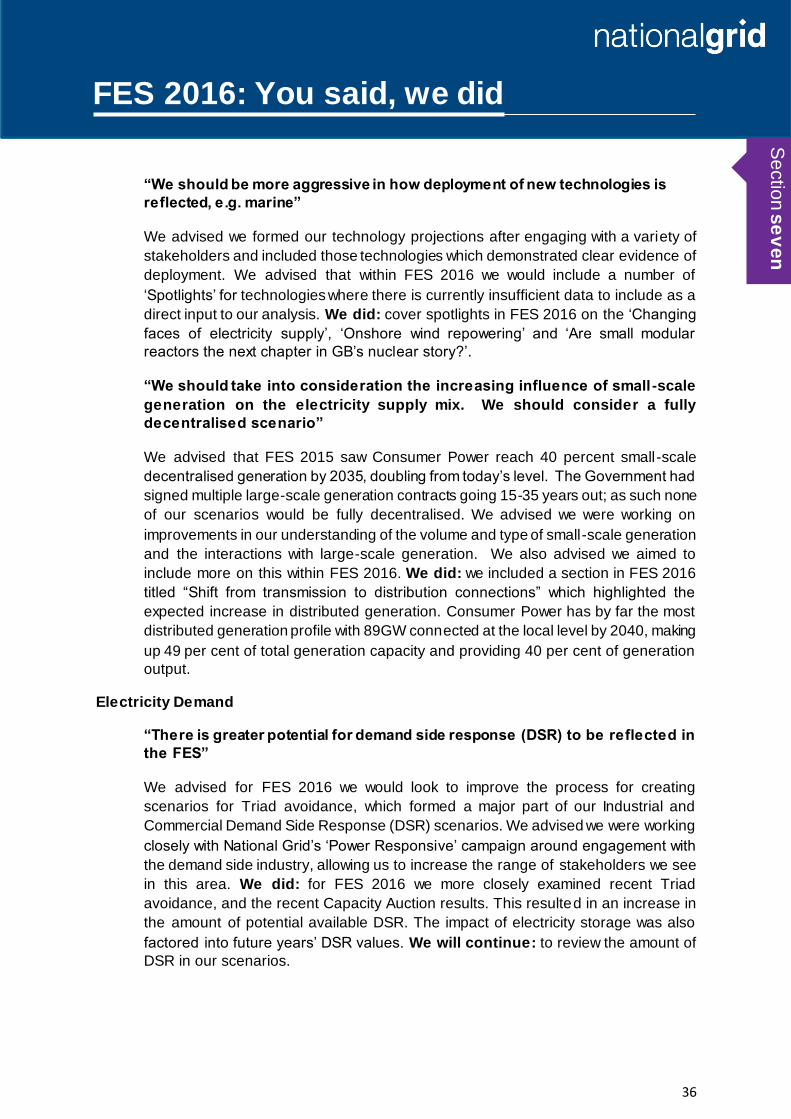
“We should be more aggressive in how deployment of new technologies is
reflected, e.g. marine”
We advised we formed our technology projections after engaging with a variety of
stakeholders and included those technologies which demonstrated clear evidence of
deployment. We advised that within FES 2016 we would include a number of
‘Spotlights’ for technologies where there is currently insufficient data to include as a
direct input to our analysis. We did: cover spotlights in FES 2016 on the ‘Changing
faces of electricity supply’, ‘Onshore wind repowering’ and ‘Are small modular
reactors the next chapter in GB’s nuclear story?’.
“We should take into consideration the increasing influence of small -scale
generation on the electricity supply mix. We should consider a fully
decentralised scenario”
We advised that FES 2015 saw Consumer Power reach 40 percent small-scale
decentralised generation by 2035, doubling from today’s level. The Government had
signed multiple large-scale generation contracts going 15-35 years out; as such none
of our scenarios would be fully decentralised. We advised we were working on
improvements in our understanding of the volume and type of small-scale generation
and the interactions with large-scale generation. We also advised we aimed to
include more on this within FES 2016. We did: we included a section in FES 2016
titled “Shift from transmission to distribution connections” which highlighted the
expected increase in distributed generation. Consumer Power has by far the most
distributed generation profile with 89GW connected at the local level by 2040, making
up 49 per cent of total generation capacity and providing 40 per cent of generation
output.
Electricity Demand
“There is greater potential for demand side response (DSR) to be reflected in
the FES”
We advised for FES 2016 we would look to improve the process for creating
scenarios for Triad avoidance, which formed a major part of our Industrial and
Commercial Demand Side Response (DSR) scenarios. We advised we were working
closely with National Grid’s ‘Power Responsive’ campaign around engagement with
the demand side industry, allowing us to increase the range of stakeholders we see
in this area. We did: for FES 2016 we more closely examined recent Triad
avoidance, and the recent Capacity Auction results. This resulted in an increase in
the amount of potential available DSR. The impact of electricity storage was also
factored into future years’ DSR values. We will continue: to review the amount of
DSR in our scenarios.
Sectio
n s
ev
en

37
FES 2016: You said, we did
“You told us that our residential demand scenarios were too high. Some of you
said that we had not properly taken into account pending EU energy efficiency
legislation which will have a measurable effect on future demand”
We advised we would gather more data on EU energy efficiency legislation and
reflect it in the scenarios which feature greater energy efficiency. We advised for the
less energy efficient scenarios, we continued to believe it was credible for residential
demand to increase if conditions changed, if a new technology was adopted or if
technology is used to enhance quality of life rather than save energy. We did: we
consulted experts who provided guidance and data. This work was built into the
residential appliance models. Gone Green assumed the EU 2030 energy efficiency
targets are met on time, in order to meet the UK’s longer term decarbonisation goals.
Slow Progression assumed the targets are met in 2040. Consumer Power and No
Progression did not specifically target the EU energy efficiency goals, to reflect less
green ambition. We will: keep this approach for FES 2017.
“For residential air conditioning, over 40% of those who attended the webinar
felt our projections were too high in Consumer Power, whereas for the other
scenarios the feeling was our projections were about right”
We advised we will revise our projections for residential air conditioning in Consumer
Power. We did: for Consumer Power we considered the likelihood of different parts
of the country adopting air conditioning, taking into account demographics and urban
setting and penetration was revised to 60% by 2050. Gone Green remained the
same to reflect increased wealth. Slow Progression and No Progression were revised
down to existing penetration levels (~1% of homes) to 2050 to reflect lower wealth
levels. We will: review this approach for FES 2017.
“How about using different population and housing growth scenarios?”
We advised we use a single forecast for population and housing growth across our
scenarios. This allows easy comparison between the scenarios and the impact of
scenario components to be highlighted more effectively e.g. energy efficiency,
technology adoption and heating demand.
“All smart meters should be in by the end of 2020”
We advised in our Gone Green scenario the rollout programme is completed in 2020.
We believe it is prudent that our other scenarios model futures where differing rollout
scenarios are experienced.
Sectio
n s
ev
en
38
FES 2016: You said, we did
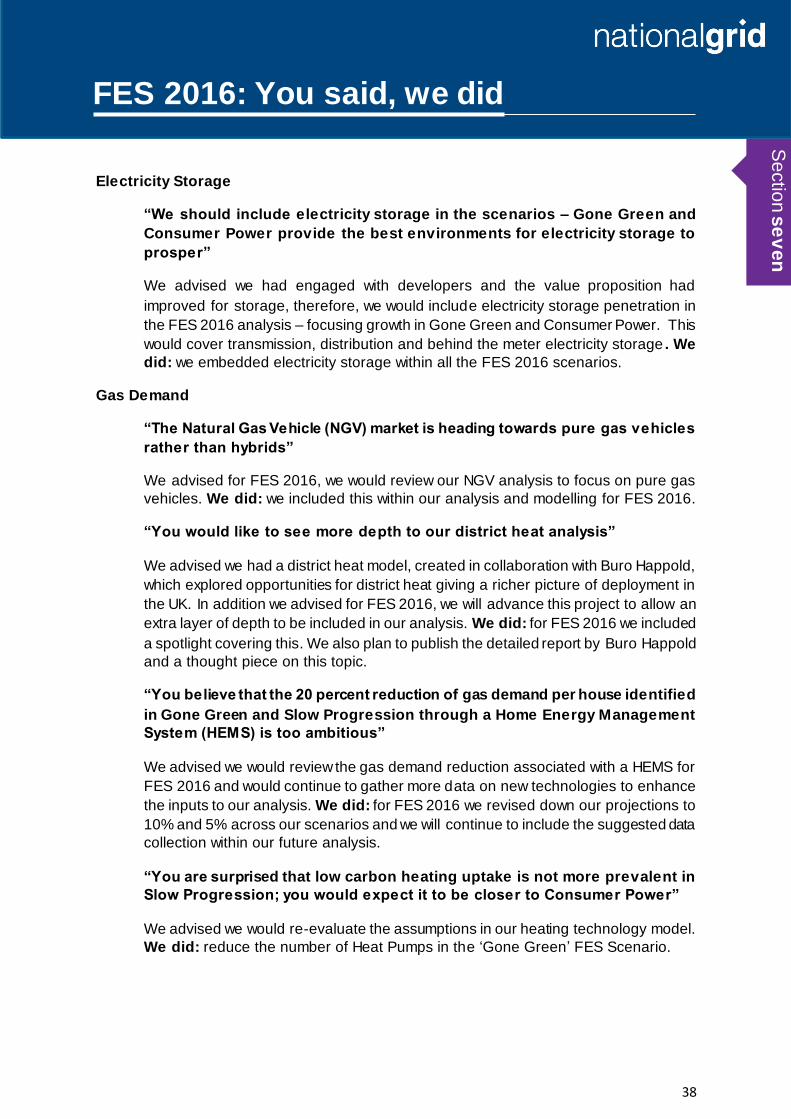
Electricity Storage
“We should include electricity storage in the scenarios – Gone Green and
Consumer Power provide the best environments for electricity storage to
prosper”
We advised we had engaged with developers and the value proposition had
improved for storage, therefore, we would include electricity storage penetration in
the FES 2016 analysis – focusing growth in Gone Green and Consumer Power. This
would cover transmission, distribution and behind the meter electricity storage . We
did: we embedded electricity storage within all the FES 2016 scenarios.
Gas Demand
“The Natural Gas Vehicle (NGV) market is heading towards pure gas vehicles
rather than hybrids”
We advised for FES 2016, we would review our NGV analysis to focus on pure gas
vehicles. We did: we included this within our analysis and modelling for FES 2016.
“You would like to see more depth to our district heat analysis”
We advised we had a district heat model, created in collaboration with Buro Happold,
which explored opportunities for district heat giving a richer picture of deployment in
the UK. In addition we advised for FES 2016, we will advance this project to allow an
extra layer of depth to be included in our analysis. We did: for FES 2016 we included
a spotlight covering this. We also plan to publish the detailed report by Buro Happold
and a thought piece on this topic.
“You believe that the 20 percent reduction of gas demand per house identified
in Gone Green and Slow Progression through a Home Energy Management
System (HEMS) is too ambitious”
We advised we would review the gas demand reduction associated with a HEMS for
FES 2016 and would continue to gather more data on new technologies to enhance
the inputs to our analysis. We did: for FES 2016 we revised down our projections to
10% and 5% across our scenarios and we will continue to include the suggested data
collection within our future analysis.
“You are surprised that low carbon heating uptake is not more prevalent in
Slow Progression; you would expect it to be closer to Consumer Power”
We advised we would re-evaluate the assumptions in our heating technology model.
We did: reduce the number of Heat Pumps in the ‘Gone Green’ FES Scenario.
Sectio
n s
ev
en
39
FES 2016: You said, we did
Gas Supply
“Locally produced shale gas should be greener in terms of overall lifecycle
carbon emissions than liquefying gas in the Middle East, shipping it several
thousand miles to the UK and re -gasifying it”
We advised we do not reflect lifecycle carbon emissions as an input to our analysis
as current carbon accounting does not include emissions incurred from activities
outside the UK. In addition we advised for FES 2016, we will look to explore this
further in a ‘Spotlight’. We didn’t: include as a specific spotlight for FES 2016 as a
report produced by DECC was published ahead of then. Instead we explained within
FES 2016 (page 116) our thoughts and a footnote to the report from DECC.
“It is unrealistic to say that no infrastructure will close; by 2035 some of the
facilities will be quite old”
We acknowledged this can be seen as a limitation in our analysis, however we did
not assume a facility will close when the owner of the facility has not made such a
decision public. In addition we advised for FES 2016 we would consider whether an
objective means of reducing capacity, possibly based on age of facility, can be
developed. This was considered for FES 2016 and for the coming year we plan to
produce a thought piece to explore this further.
“We should consider alternative sources of gas supply such as bio-synthetic
natural gas (SNG) or hydrogen from electricity to gas schemes”
We advised that we already considered bio methane, principally from anaerobic
digestion, but have not so far considered bio-SNG, gas from waste or hydrogen from
electricity to gas schemes. These are all potential sources that are more likely to
connect to the distribution networks than the transmission network and we are in
dialogue with the gas distribution networks to understand the maturity of these
technologies. We advised we would investigate this further in a ‘Spotlight’ for FES
2016. We did: model the development of bio-SNG within the FES 2016 ‘Gone Green’
scenario.
“The balance between LNG and continental gas is ‘unknowable’ and we should
not demonstrate any sort of split as this would imply an unwarranted level of
confidence”
We advised that Market intelligence at the time, both from our stakeholders and
commercial sources, is that LNG availability is likely to be high for at least the next 5
years. Also that there may have been some scope for increasing the LNG minimum
level slightly and reducing, but not removing, the ‘generic import’ category. We
advised will continue to engage with our stakeholders on this and review for FES
2016. We did: this is ongoing and will be used for future FES modelling as well.
Sectio
n s
ev
en
40
FES 2016: You said, we did
2050 Environmental Targets
“We should include further analysis on aviation and shipping as they will
dominate emissions in 2050”
We advised for FES 2016 we would enhance our 2050 analysis regarding shipping
and aviation emissions. We did: review the emissions within shipping and aviation
and incorporated within our analysis.
Sectio
n s
ev
en
41
October 2016 Workshops
Feedback
Disclaimer
For the purpose of this statement, National Grid Gas plc and National Grid Electricity Transmission plc will together be referred to as National Grid. The information contained within the Future Energy Scenarios Stakeholder Feedback document (“the Document”) is disclosed voluntarily and without charge to you in order to facilitate and encourage discussion of the scenarios used by National Grid in its electricity and gas planning processes.
The Document does not replace the Gas Ten Year Statement (GTYS) or the Electricity Ten Year Statement (ETYS) (or any other document published by National Grid containing substantially the same information as those documents) published in accordance with the relevant l icence conditions.
While National Grid have not sought to mislead any party as to the content of the Document and, whilst the content represents National Grid’s best views as of 27 January 2017, readers should not place any reliance on the content of the Document. The Document (including, without limitation, information as regards capacity planning, future investment and the resulting capacity) must be considered as illustrative only and no warranty can be or is made as to the accuracy and completeness of such Document, nor shall anything within the Document constitute an offer capable of acceptance or form the basis of any contract. Other than in the event of fraudulent misstatement or fraudulent misrepresentation, National Grid does not accept any responsi bility for any use which is made of the information contained within this Document.
Copyright National Grid 2017, all rights reserved. No part of the Document may be reproduced in any material form (including photocopying and storing in any medium or electronic means and whether or not transiently or incidentally) without the written permission of National Grid except in accordance with the provisions of the Copyright, Designs and Patents Act 1988.