Embed Size (px)
Citation preview
1
This project has received funding from the European Union’s Seventh Framework Programmefor research, technological development and demonstration under grant agreement no 266800
FESSUDFINANCIALISATION, ECONOMY, SOCIETY AND SUSTAINABLE
DEVELOPMENT
Studies in Financial Systems
No 26
Financialisation and the Financial and Economic
Crises: The Case of South Africa
Susan Newman
ISSN 2052-8027
2
This project has received funding from the European Union’s Seventh Framework Programmefor research, technological development and demonstration under grant agreement no 266800
Financialisation and the Financial and Economic Crises: The
Case of South Africa
Author: Susan Newman
Authors affiliation: University of West England, Bristol and University of
Witwatersrand, Johannesburg.
Abstract: This paper provides an overview of some of the long-run changes in the
relationship between the financial and non-financial aggregate sectors of the South
African economy. In particular the paper considers the impact of financialisation on
capital investment, consumption, inequality and the capital account. The growth
trajectory of the apartheid and post-apartheid periods are considered. It is argued
that the nature and form of financialisation that has taken placed in South Africa is
conditioned by the nature of industrial and financial developments before 1994.
Key words: distribution of income, inequality, finance-dominated capitalism,
financialisation, industrial development, South Africa
Contact details: [email protected]
Acknowledgements: This paper is part of the results of the project Financialisation,
Economy, Society and Sustainable Development (FESSUD). It has received funding
from the European Union Seventh Framework Programme (FP7/2007-2013) under

3
This project has received funding from the European Union’s Seventh Framework Programmefor research, technological development and demonstration under grant agreement no 266800
grant agreement n° 266800. This work draws in part from previous research
conducted jointly with Samantha Ashman. The Author would like to acknowledge the
research assistance provided by Uyabongeka Walaza and Gerald Mfongeh and the
valuable comments made by Gilad Isaacs on an earlier version of the draft.
Website: www.fessud.eu
4
This project has received funding from the European Union’s Seventh Framework Programmefor research, technological development and demonstration under grant agreement no 266800
Contents0. Introduction ........................................................................................................................6
I. Long-run development in the era of financialisation since the early 1980s and theeconomic and financial crises ...................................................................................................7
II. Long-run effects of financialisation on the economy through different channels........... 18
II.1 Financialisation and distribution............................................................................... 18
Functional income distribution in South Africa................................................................ 19
Distribution of income across households....................................................................... 23
II.2 Financialisation and investment in capital stock...................................................... 33
Non-financial corporations and financialisation.................................................................. 34
II.3 Financialisation and consumption ............................................................................ 45
Financial balances of the private household sector......................................................... 47
II.4 Financialisation and the current account ................................................................. 64
III. Financialisation and the economic and financial crisis as the crisis of finance-dominatedcapitalism................................................................................................................................. 69
IV. Summary and conclusions ............................................................................................... 72
References ........................................................................................................................... 75
5
This project has received funding from the European Union’s Seventh Framework Programmefor research, technological development and demonstration under grant agreement no 266800
Data Sources
BFA McGregors Database
Quantec, South Africa
South Africa Standardised Industry Database (SASSID)
South Africa Reserve Bank Quarterly Bulletin (SARB Quarterly Bulletin)
National Credit Regulator (NCR)
National Income Dynamics Survey (NIDS)
World Bank Development Indicators
6
This project has received funding from the European Union’s Seventh Framework Programmefor research, technological development and demonstration under grant agreement no 266800
IntroductionThis paper outlines some broad changes in the relationship between the financial
and real sectors of the South African economy in order that experiences in South
Africa can be compared with other country case studies covered in work-package 3.
Of the 15 case studies covered in the work-package, South Africa is one of three
outside of Europe (the others being the US and Japan), it is the only case study of a
country from the Global South and the only ‘developing ‘ economy. In this way, the
evolution of the relationship between the financial and the real sectors of the
economy may not obviously follow one of the four ideal types of economic
development identified by FESSUD in the lead up to the crisis.
At the same time, South Africa is not typical of African or other developing
economies. In per capita income terms, South Africa fits into the category of a
middle income country, although this masks the extreme levels of inequality and
incidences of poverty that have emerged out of the legacy of apartheid and the form
of economic development that has occurred since political liberation in 1994. South
Africa is one of the most unequal societies in the world, rivalled only by Brazil. Also,
owing to the particular nature of industrial and economic development under
apartheid, South Africa has a financial sector that is extremely large in relation to
the size of the economy and of the level of development and sophistication to rival
the financial sectors of advanced economies (see table 1), at the same time, around
42 per cent of the population is without access to formal financial services1.
This paper presents some key financialisation indicators across the areas of
financialisation and distribution, financialisation and consumption, financiaisation
and investment in the capital stock, and financialisation and the current account to
aid comparison across country case studies. In addition, specificities of the South
African growth trajectory and experience of financialisation have been teased out.
While a global process, the form that financialisation has taken in South Africa and
1 The figure if 42% was calculated using the Finscope 2013 figure for financial inclusion (30.7 million)and Statistic South Africa’s mid-term estimate for population size in 2013 of 53.2 million.
7
This project has received funding from the European Union’s Seventh Framework Programmefor research, technological development and demonstration under grant agreement no 266800
its implications on distribution and unemployment is conditioned upon the specific
nature of industrialisation and economic development that extends further back in
time then the era of financialisation often identified as beginning around 1980.
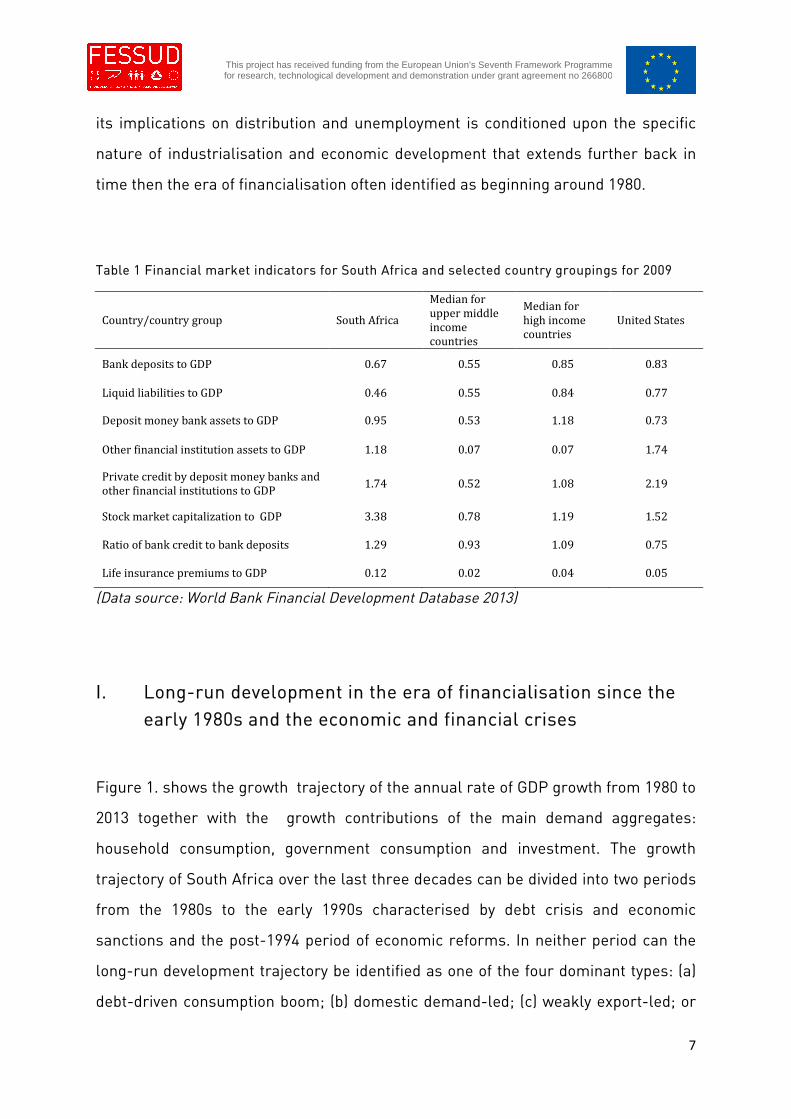
Table 1 Financial market indicators for South Africa and selected country groupings for 2009
Country/country group South Africa
Median forupper middleincomecountries
Median forhigh incomecountries
United States
Bank deposits to GDP 0.67 0.55 0.85 0.83
Liquid liabilities to GDP 0.46 0.55 0.84 0.77
Deposit money bank assets to GDP 0.95 0.53 1.18 0.73
Other financial institution assets to GDP 1.18 0.07 0.07 1.74
Private credit by deposit money banks andother financial institutions to GDP
1.74 0.52 1.08 2.19
Stock market capitalization to GDP 3.38 0.78 1.19 1.52
Ratio of bank credit to bank deposits 1.29 0.93 1.09 0.75
Life insurance premiums to GDP 0.12 0.02 0.04 0.05
(Data source: World Bank Financial Development Database 2013)
I. Long-run development in the era of financialisation since theearly 1980s and the economic and financial crises
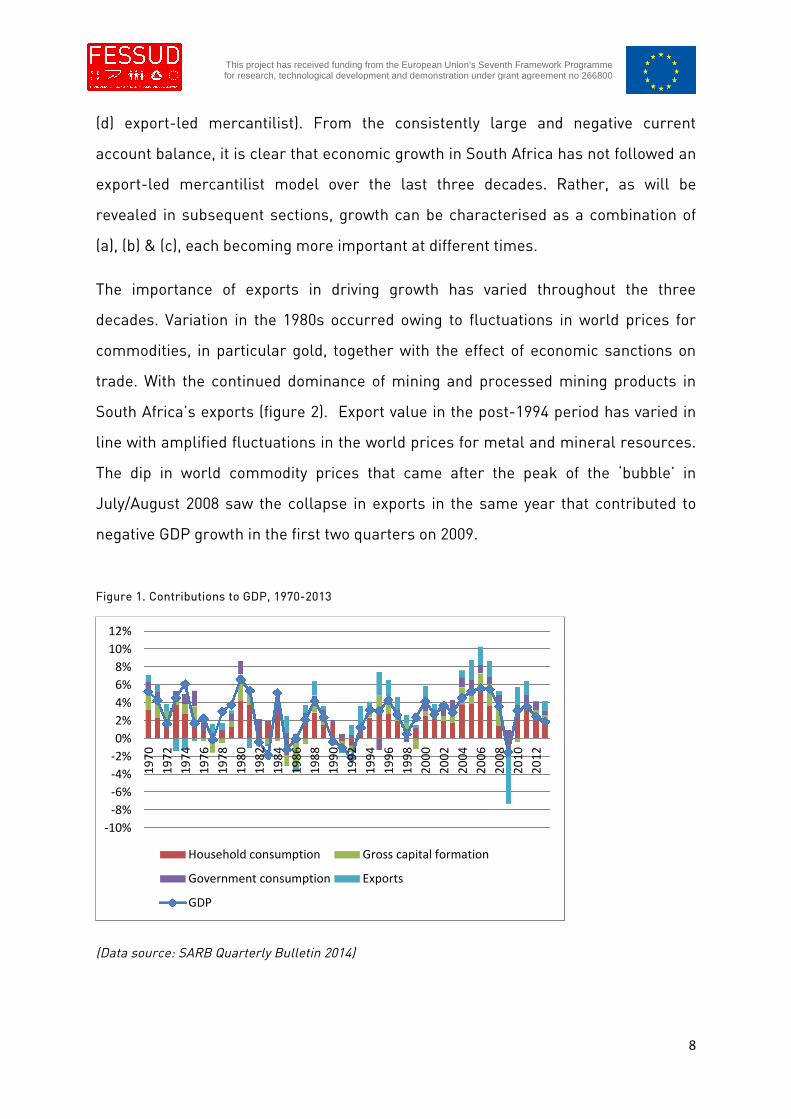
Figure 1. shows the growth trajectory of the annual rate of GDP growth from 1980 to
2013 together with the growth contributions of the main demand aggregates:
household consumption, government consumption and investment. The growth
trajectory of South Africa over the last three decades can be divided into two periods
from the 1980s to the early 1990s characterised by debt crisis and economic
sanctions and the post-1994 period of economic reforms. In neither period can the
long-run development trajectory be identified as one of the four dominant types: (a)
debt-driven consumption boom; (b) domestic demand-led; (c) weakly export-led; or
8
This project has received funding from the European Union’s Seventh Framework Programmefor research, technological development and demonstration under grant agreement no 266800
(d) export-led mercantilist). From the consistently large and negative current
account balance, it is clear that economic growth in South Africa has not followed an
export-led mercantilist model over the last three decades. Rather, as will be
revealed in subsequent sections, growth can be characterised as a combination of
(a), (b) & (c), each becoming more important at different times.
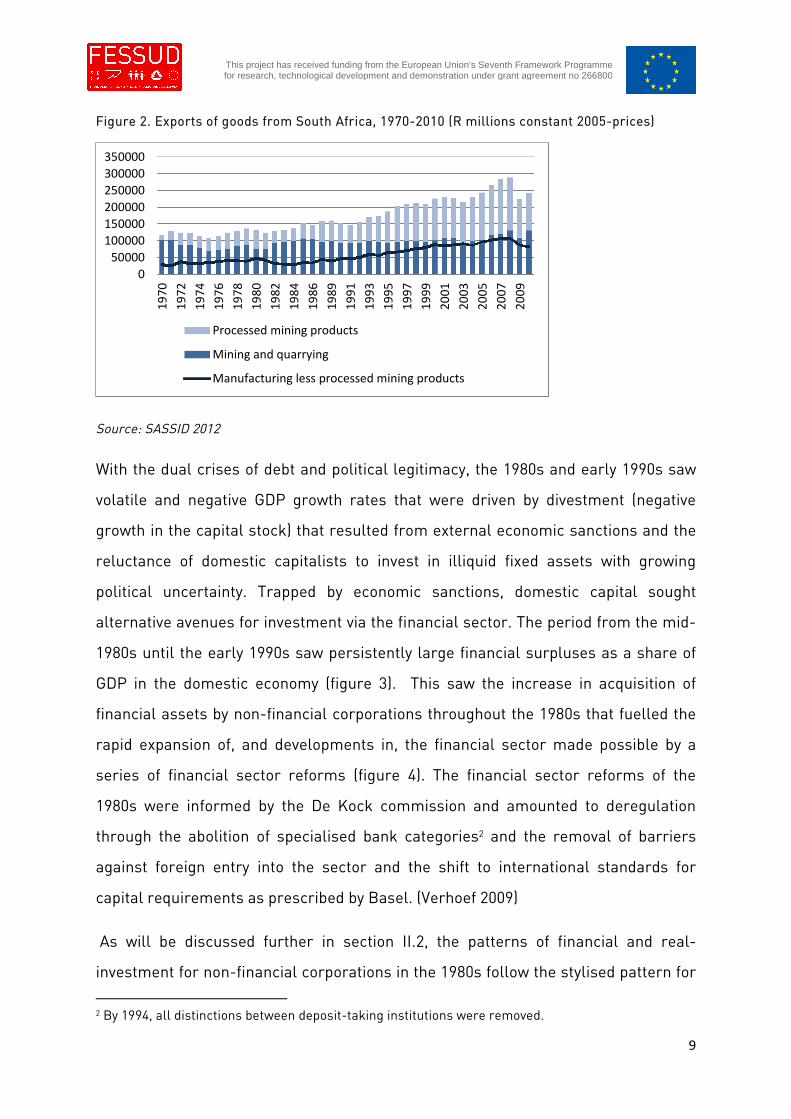
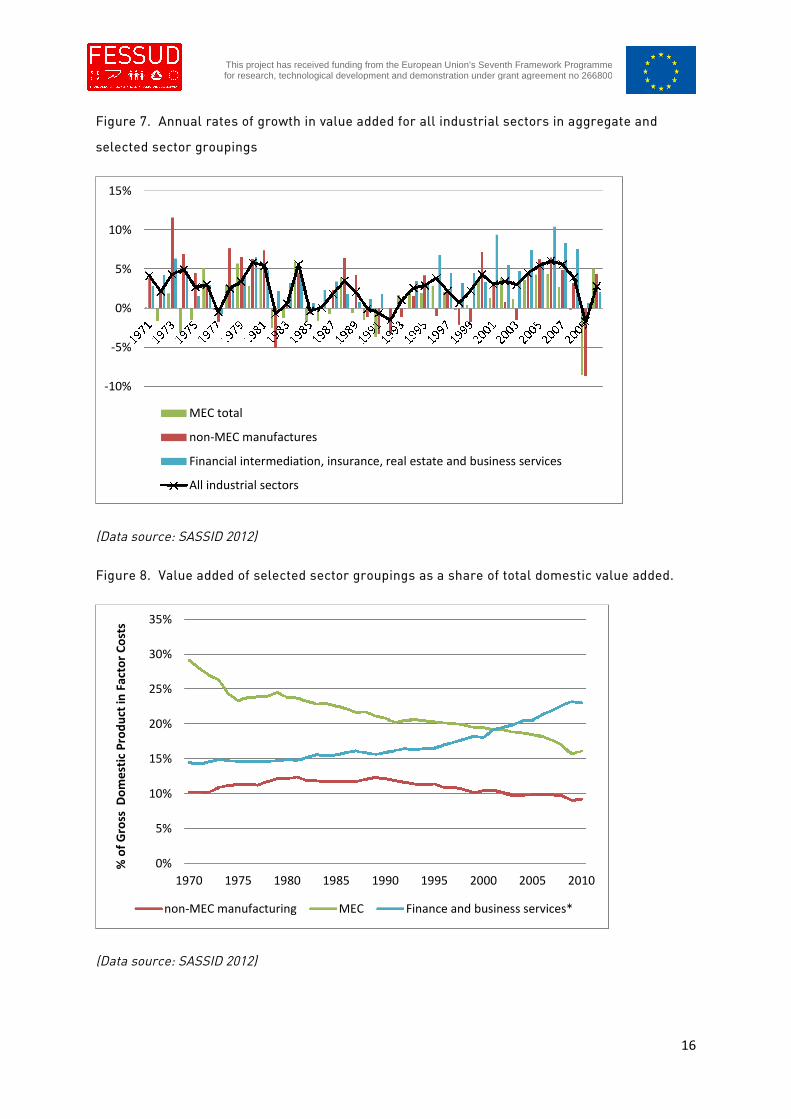
The importance of exports in driving growth has varied throughout the three
decades. Variation in the 1980s occurred owing to fluctuations in world prices for
commodities, in particular gold, together with the effect of economic sanctions on
trade. With the continued dominance of mining and processed mining products in
South Africa’s exports (figure 2). Export value in the post-1994 period has varied in
line with amplified fluctuations in the world prices for metal and mineral resources.
The dip in world commodity prices that came after the peak of the ‘bubble’ in
July/August 2008 saw the collapse in exports in the same year that contributed to
negative GDP growth in the first two quarters on 2009.
Figure 1. Contributions to GDP, 1970-2013
(Data source: SARB Quarterly Bulletin 2014)
-10%
-8%
-6%
-4%
-2%
0%
2%
4%
6%
8%
10%
12%
19
70
19
72
19
74
19
76
19
78
19
80
19
82
19
84
19
86
19
88
19
90
19
92
19
94
19
96
19
98
20
00
20
02
20
04
20
06
20
08
20
10
20
12
Household consumption Gross capital formation
Government consumption Exports
GDP
9
This project has received funding from the European Union’s Seventh Framework Programmefor research, technological development and demonstration under grant agreement no 266800
Figure 2. Exports of goods from South Africa, 1970-2010 (R millions constant 2005-prices)
Source: SASSID 2012
With the dual crises of debt and political legitimacy, the 1980s and early 1990s saw
volatile and negative GDP growth rates that were driven by divestment (negative
growth in the capital stock) that resulted from external economic sanctions and the
reluctance of domestic capitalists to invest in illiquid fixed assets with growing
political uncertainty. Trapped by economic sanctions, domestic capital sought
alternative avenues for investment via the financial sector. The period from the mid-
1980s until the early 1990s saw persistently large financial surpluses as a share of
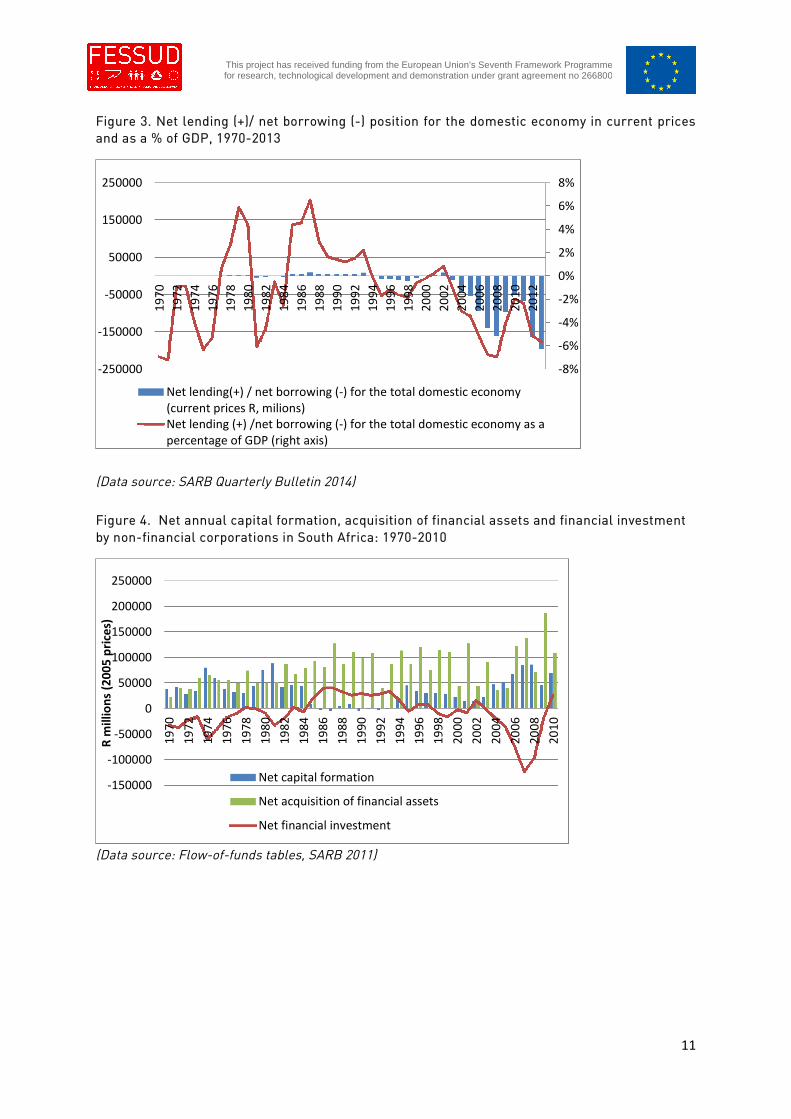
GDP in the domestic economy (figure 3). This saw the increase in acquisition of
financial assets by non-financial corporations throughout the 1980s that fuelled the
rapid expansion of, and developments in, the financial sector made possible by a
series of financial sector reforms (figure 4). The financial sector reforms of the
1980s were informed by the De Kock commission and amounted to deregulation
through the abolition of specialised bank categories2 and the removal of barriers
against foreign entry into the sector and the shift to international standards for
capital requirements as prescribed by Basel. (Verhoef 2009)
As will be discussed further in section II.2, the patterns of financial and real-
investment for non-financial corporations in the 1980s follow the stylised pattern for
2 By 1994, all distinctions between deposit-taking institutions were removed.
0
50000
100000
150000
200000
250000
300000
3500001
97
0
19
72
19
74
19
76
19
78
19
80
19
82
19
84
19
86
19
89
19
91
19
93
19
95
19
97
19
99
20
01
20
03
20
05
20
07
20
09
Processed mining products
Mining and quarrying
Manufacturing less processed mining products
10
This project has received funding from the European Union’s Seventh Framework Programmefor research, technological development and demonstration under grant agreement no 266800
financialised corporations in the US over the same period (Orhangazi 2008).
However, as discussed above, this pattern was born from domestic political economy
conditions and not financialised accumulation, although it did lay the conditions for
the form and pace of financialisation in the South African economy from the early
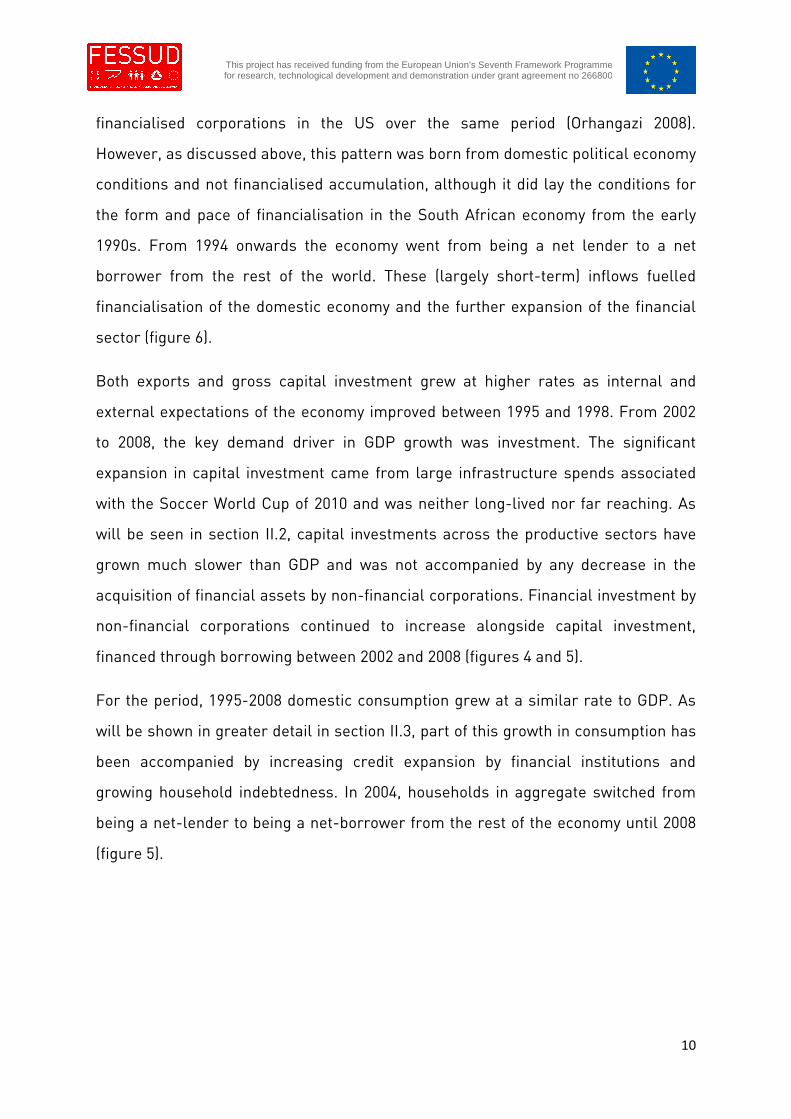
1990s. From 1994 onwards the economy went from being a net lender to a net
borrower from the rest of the world. These (largely short-term) inflows fuelled
financialisation of the domestic economy and the further expansion of the financial
sector (figure 6).
Both exports and gross capital investment grew at higher rates as internal and
external expectations of the economy improved between 1995 and 1998. From 2002
to 2008, the key demand driver in GDP growth was investment. The significant
expansion in capital investment came from large infrastructure spends associated
with the Soccer World Cup of 2010 and was neither long-lived nor far reaching. As
will be seen in section II.2, capital investments across the productive sectors have
grown much slower than GDP and was not accompanied by any decrease in the
acquisition of financial assets by non-financial corporations. Financial investment by
non-financial corporations continued to increase alongside capital investment,
financed through borrowing between 2002 and 2008 (figures 4 and 5).
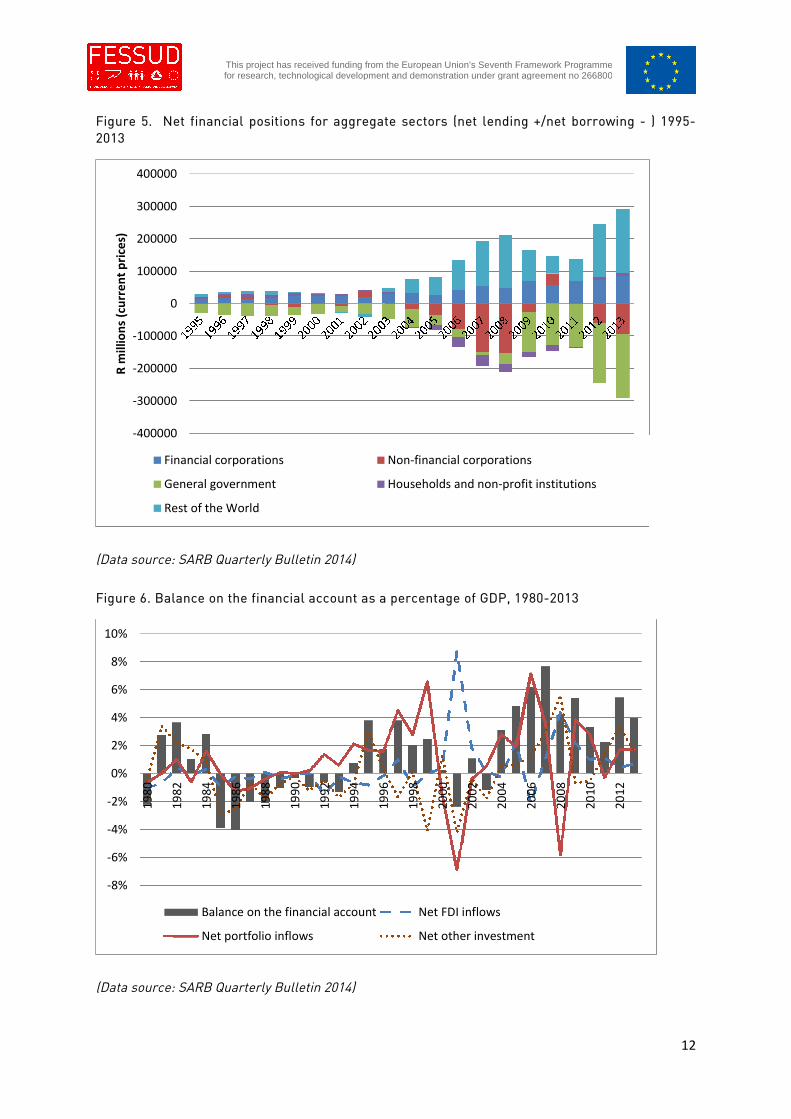
For the period, 1995-2008 domestic consumption grew at a similar rate to GDP. As
will be shown in greater detail in section II.3, part of this growth in consumption has
been accompanied by increasing credit expansion by financial institutions and
growing household indebtedness. In 2004, households in aggregate switched from
being a net-lender to being a net-borrower from the rest of the economy until 2008
(figure 5).
11
This project has received funding from the European Union’s Seventh Framework Programmefor research, technological development and demonstration under grant agreement no 266800
Figure 3. Net lending (+)/ net borrowing (-) position for the domestic economy in current pricesand as a % of GDP, 1970-2013
(Data source: SARB Quarterly Bulletin 2014)
Figure 4. Net annual capital formation, acquisition of financial assets and financial investmentby non-financial corporations in South Africa: 1970-2010
(Data source: Flow-of-funds tables, SARB 2011)
-8%
-6%
-4%
-2%
0%
2%
4%
6%
8%
-250000
-150000
-50000
50000
150000
250000
19
70
19
72
19
74
19
76
19
78
19
80
19
82
19
84
19
86
19
88
19
90
19
92
19
94
19
96
19
98
20
00
20
02
20
04
20
06
20
08
20
10
20
12
Net lending(+) / net borrowing (-) for the total domestic economy(current prices R, milions)Net lending (+) /net borrowing (-) for the total domestic economy as apercentage of GDP (right axis)
-150000
-100000
-50000
0
50000
100000
150000
200000
250000
19
70
19
72
19
74
19
76
19
78
19
80
19
82
19
84
19
86
19
88
19
90
19
92
19
94
19
96
19
98
20
00
20
02
20
04
20
06
20
08
20
10
Rm
illio
ns
(20
05
pri
ces)
Net capital formation
Net acquisition of financial assets
Net financial investment
12
This project has received funding from the European Union’s Seventh Framework Programmefor research, technological development and demonstration under grant agreement no 266800
Figure 5. Net financial positions for aggregate sectors (net lending +/net borrowing - ) 1995-2013
(Data source: SARB Quarterly Bulletin 2014)
Figure 6. Balance on the financial account as a percentage of GDP, 1980-2013
(Data source: SARB Quarterly Bulletin 2014)
-400000
-300000
-200000
-100000
0
100000
200000
300000
400000
Rm
illio
ns
(cu
rre
nt
pri
ces)
Financial corporations Non-financial corporations
General government Households and non-profit institutions
Rest of the World
-8%
-6%
-4%
-2%
0%
2%
4%
6%
8%
10%
19
80
19
82
19
84
19
86
19
88
19
90
19
92
19
94
19
96
19
98
20
00
20
02
20
04
20
06
20
08
20
10
20
12
Balance on the financial account Net FDI inflows
Net portfolio inflows Net other investment
13
This project has received funding from the European Union’s Seventh Framework Programmefor research, technological development and demonstration under grant agreement no 266800
As already mentioned the form and pace of the financialisation of the South African
economy has been conditioned upon developments in the financial sector under
apartheid. Moreover, the effect of financialisation on inequality has largely occurred
via its effect on employment has its roots in the industrial structure which is heavily
skewed towards capital intensive industries connected to extractive industries. The
growth trajectory of the South African economy under apartheid was shaped by
significant state intervention in industrial and financial development. It is the
particular industrial and economic structure that was built during this period that
laid the foundations for the rapid financialisation and deindustrialisation of the
economy from the early 1990s.
Heavy state intervention in industry between the 1950s and 1980 was focussed on the
promotion and development of large scale, capital intensive, sectors linked to
extractive industries. From this emerged, what Fine and Rustomjee (1997) referred
to as the Minerals and Energy Complex (MEC) core, a set of industries identified by
very strong input-output linkages with each other and weak linkages that serve as
the core site of capital accumulation3,4. These are:
Coal mining
Gold and Uranium mining
Other mining
Petroleum, chemicals, rubber and plastic
Non-metallic minerals
3 In addition to the strong material interdependencies of the MEC core sectors, these sectors
exhibited highly concentrated ownership.
4 70% of productive inputs into the MEC sectors come from the MEC core itself and 56% of
intermediate output from MEC sectors goes back into the MEC core as inputs. By contrast, only 25%
of intermediate inputs into non-MEC manufacturing sectors are sourced from the MEC and only 10%
of intermediate output from non-MEC sectors is fed into MEC sectors as inputs.
14
This project has received funding from the European Union’s Seventh Framework Programmefor research, technological development and demonstration under grant agreement no 266800
Basic iron and steel
Basic non-ferrous metals
Metal products excluding machinery
Machinery and equipment
Electricity, gas and steam
Transport and storage
It is worth noting that the coherence and cohesion of the MEC has persisted
throughout the four decades since 1970. The strength of direct forward and
backward linkages between MEC-subsectors has remained remarkably stable since
1970. This cohesion and coherence has resulted, not only in determining the
dynamics of its own expansion and development through dynamic increasing returns
to scale that come about through the growth pull effects on linked sectors, but also
in conditioning the nature of industrial development outside of the MEC-core.
Because of its lack of integration with economic activities more broadly5, expansion
of the MEC-core has occurred in relative isolation from, and at the expense of, non-
MEC sectors, in particular labour intensive manufacturing of consumer goods. A
major corollary of this has been an industrial structure skewed in favour of capital
intensive, heavy, industries with limited labour absorption that have made up
between 50 and 62 per cent of total manufacturing output since the 1970s.
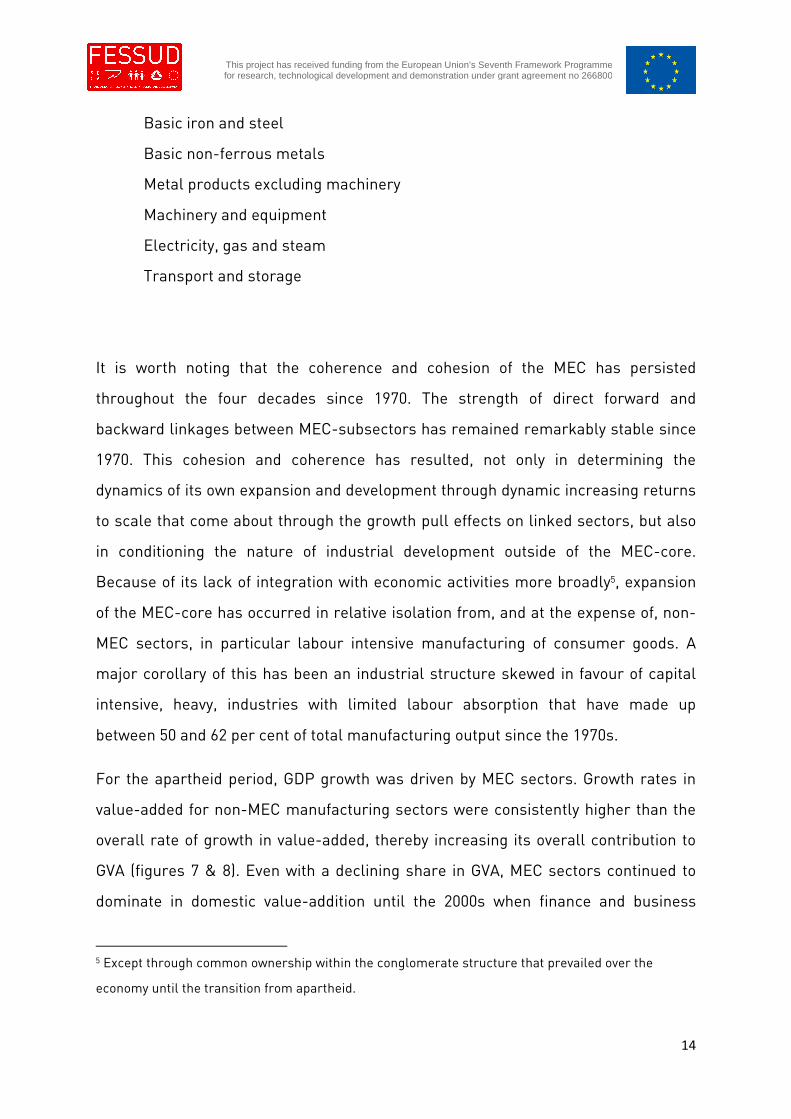
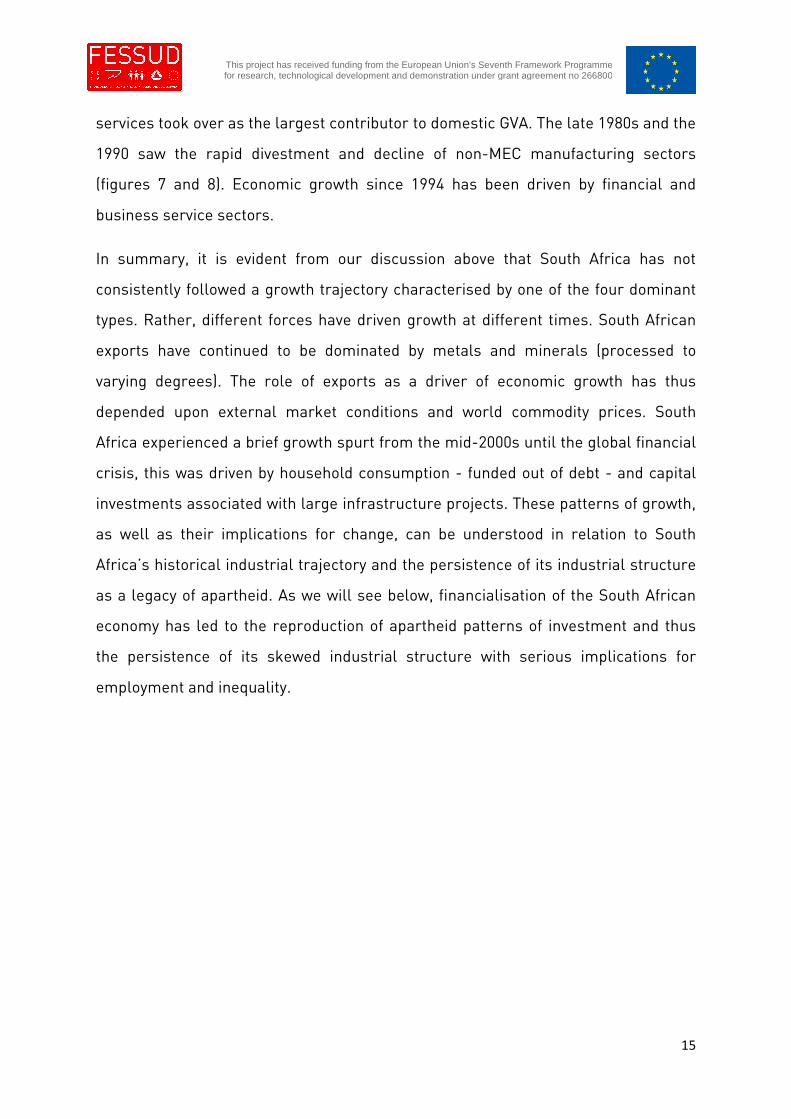
For the apartheid period, GDP growth was driven by MEC sectors. Growth rates in
value-added for non-MEC manufacturing sectors were consistently higher than the
overall rate of growth in value-added, thereby increasing its overall contribution to
GVA (figures 7 & 8). Even with a declining share in GVA, MEC sectors continued to
dominate in domestic value-addition until the 2000s when finance and business
5 Except through common ownership within the conglomerate structure that prevailed over the
economy until the transition from apartheid.
15
This project has received funding from the European Union’s Seventh Framework Programmefor research, technological development and demonstration under grant agreement no 266800
services took over as the largest contributor to domestic GVA. The late 1980s and the
1990 saw the rapid divestment and decline of non-MEC manufacturing sectors
(figures 7 and 8). Economic growth since 1994 has been driven by financial and
business service sectors.
In summary, it is evident from our discussion above that South Africa has not
consistently followed a growth trajectory characterised by one of the four dominant
types. Rather, different forces have driven growth at different times. South African
exports have continued to be dominated by metals and minerals (processed to
varying degrees). The role of exports as a driver of economic growth has thus
depended upon external market conditions and world commodity prices. South
Africa experienced a brief growth spurt from the mid-2000s until the global financial
crisis, this was driven by household consumption - funded out of debt - and capital
investments associated with large infrastructure projects. These patterns of growth,
as well as their implications for change, can be understood in relation to South
Africa’s historical industrial trajectory and the persistence of its industrial structure
as a legacy of apartheid. As we will see below, financialisation of the South African
economy has led to the reproduction of apartheid patterns of investment and thus
the persistence of its skewed industrial structure with serious implications for
employment and inequality.
16
This project has received funding from the European Union’s Seventh Framework Programmefor research, technological development and demonstration under grant agreement no 266800
Figure 7. Annual rates of growth in value added for all industrial sectors in aggregate and
selected sector groupings
(Data source: SASSID 2012)
Figure 8. Value added of selected sector groupings as a share of total domestic value added.
(Data source: SASSID 2012)
-10%
-5%
0%
5%
10%
15%
MEC total
non-MEC manufactures
Financial intermediation, insurance, real estate and business services
All industrial sectors
0%
5%
10%
15%
20%
25%
30%
35%
1970 1975 1980 1985 1990 1995 2000 2005 2010
%o
fG
ross
Do
me
stic
Pro
du
ctin
Fact
or
Co
sts
non-MEC manufacturing MEC Finance and business services*
17
This project has received funding from the European Union’s Seventh Framework Programmefor research, technological development and demonstration under grant agreement no 266800
Figure 9. Annual export value, 1970-2010
(Data source: SASSID 2012)
0
100000
200000
300000
400000
500000
600000
19
70
19
72
19
74
19
76
19
78
19
80
19
82
19
84
19
86
19
89
19
91
19
93
19
95
19
97
19
99
20
01
20
03
20
05
20
07
20
09
Rm
illio
pm
s2
00
5-p
rice
s
Total exports of goods and services MEC exports
18
This project has received funding from the European Union’s Seventh Framework Programmefor research, technological development and demonstration under grant agreement no 266800
II. Long-run effects of financialisation on the economy through
different channels
II.1 Financialisation and distribution
South Africa jostles with Brazil for the position as the world’s most unequal society.
The apartheid system was founded upon the sharp divisions between racial groups
and drove the worsening division between rich and poor. Paradoxically, the end of
apartheid saw the worsening of inequality, an increasing gap between rich and poor,
with a reconfiguration of the racial profile. The emergence of black elites has
widened the gap between rich and poor within the racial group, while the poorest
section of society continue to be black Africans. According to a recently published
Oxfam (2014) report , the richest two people in South Africa have the same wealth as
the bottom 50 per cent of the population. This section gives a broad overview of the
dynamics of distribution in South Africa as it is related to the dynamics of
financialisation.
19
This project has received funding from the European Union’s Seventh Framework Programmefor research, technological development and demonstration under grant agreement no 266800
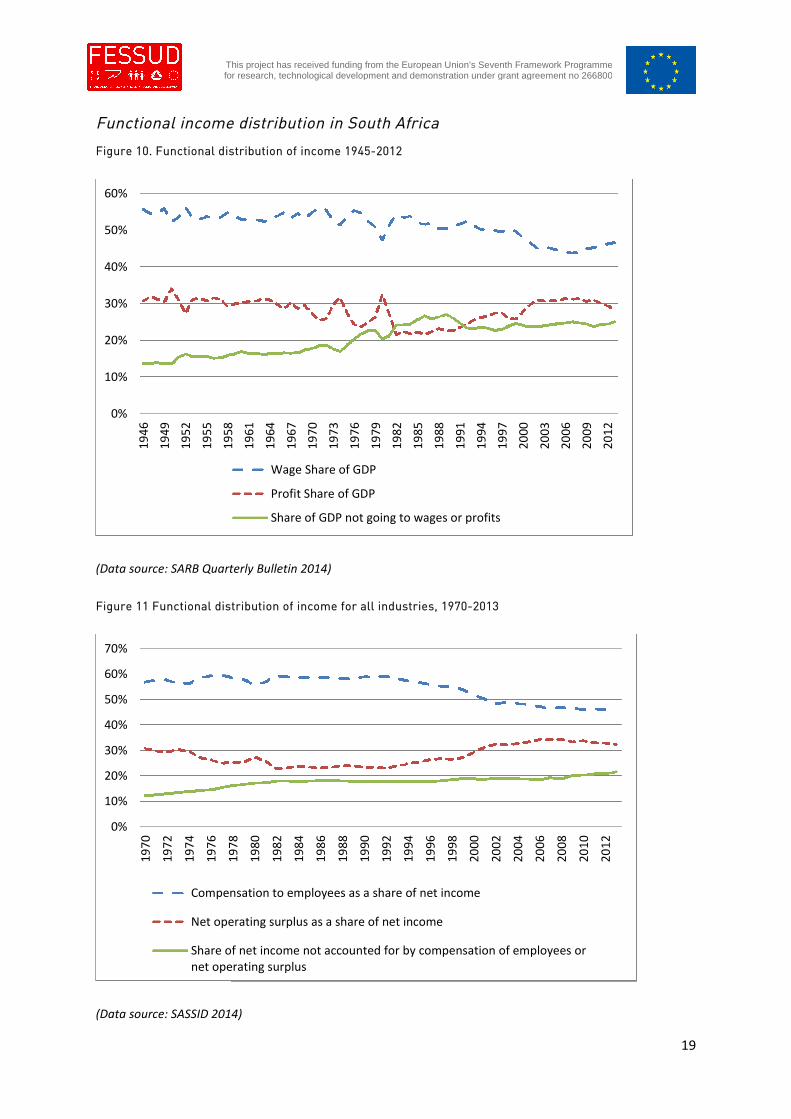
Functional income distribution in South Africa
Figure 10. Functional distribution of income 1945-2012
(Data source: SARB Quarterly Bulletin 2014)
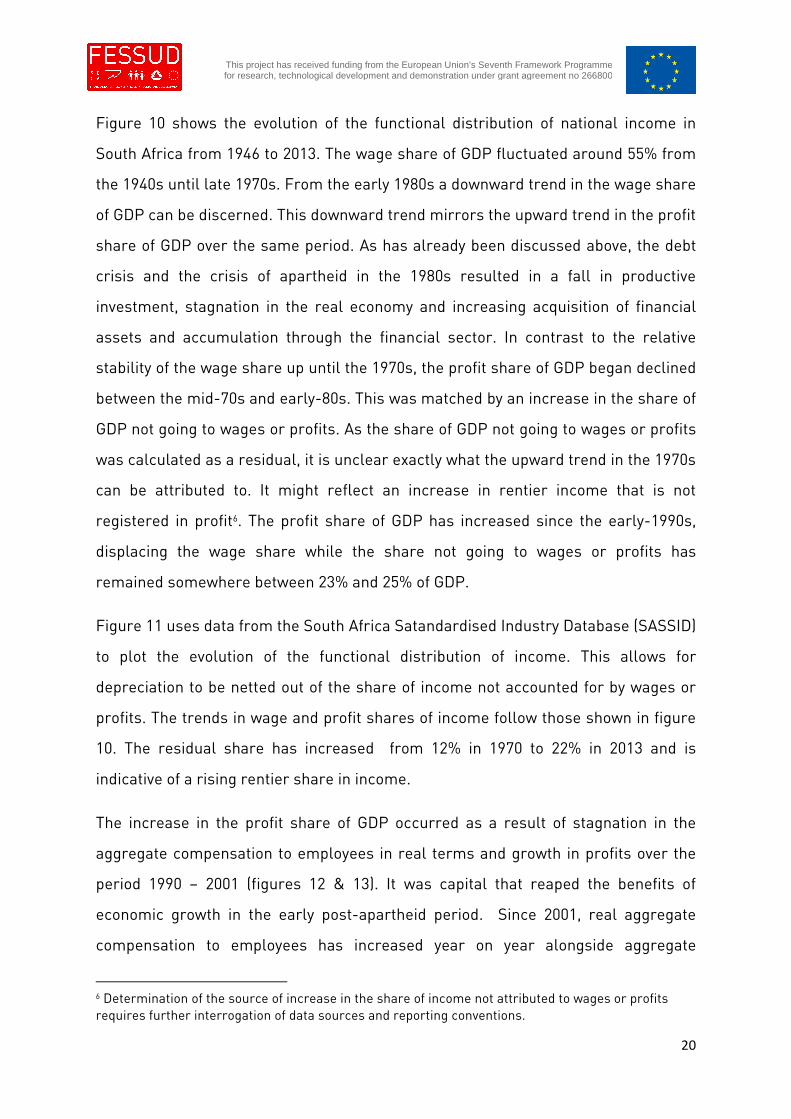
Figure 11 Functional distribution of income for all industries, 1970-2013
(Data source: SASSID 2014)
0%
10%
20%
30%
40%
50%
60%
19
46
19
49
19
52
19
55
19
58
19
61
19
64
19
67
19
70
19
73
19
76
19
79
19
82
19
85
19
88
19
91
19
94
19
97
20
00
20
03
20
06
20
09
20
12
Wage Share of GDP
Profit Share of GDP
Share of GDP not going to wages or profits
0%
10%
20%
30%
40%
50%
60%
70%
19
70
19
72
19
74
19
76
19
78
19
80
19
82
19
84
19
86
19
88
19
90
19
92
19
94
19
96
19
98
20
00
20
02
20
04
20
06
20
08
20
10
20
12
Compensation to employees as a share of net income
Net operating surplus as a share of net income
Share of net income not accounted for by compensation of employees ornet operating surplus
20
This project has received funding from the European Union’s Seventh Framework Programmefor research, technological development and demonstration under grant agreement no 266800
Figure 10 shows the evolution of the functional distribution of national income in
South Africa from 1946 to 2013. The wage share of GDP fluctuated around 55% from
the 1940s until late 1970s. From the early 1980s a downward trend in the wage share
of GDP can be discerned. This downward trend mirrors the upward trend in the profit
share of GDP over the same period. As has already been discussed above, the debt
crisis and the crisis of apartheid in the 1980s resulted in a fall in productive
investment, stagnation in the real economy and increasing acquisition of financial
assets and accumulation through the financial sector. In contrast to the relative
stability of the wage share up until the 1970s, the profit share of GDP began declined
between the mid-70s and early-80s. This was matched by an increase in the share of
GDP not going to wages or profits. As the share of GDP not going to wages or profits
was calculated as a residual, it is unclear exactly what the upward trend in the 1970s
can be attributed to. It might reflect an increase in rentier income that is not
registered in profit6. The profit share of GDP has increased since the early-1990s,
displacing the wage share while the share not going to wages or profits has
remained somewhere between 23% and 25% of GDP.
Figure 11 uses data from the South Africa Satandardised Industry Database (SASSID)
to plot the evolution of the functional distribution of income. This allows for
depreciation to be netted out of the share of income not accounted for by wages or
profits. The trends in wage and profit shares of income follow those shown in figure
10. The residual share has increased from 12% in 1970 to 22% in 2013 and is
indicative of a rising rentier share in income.
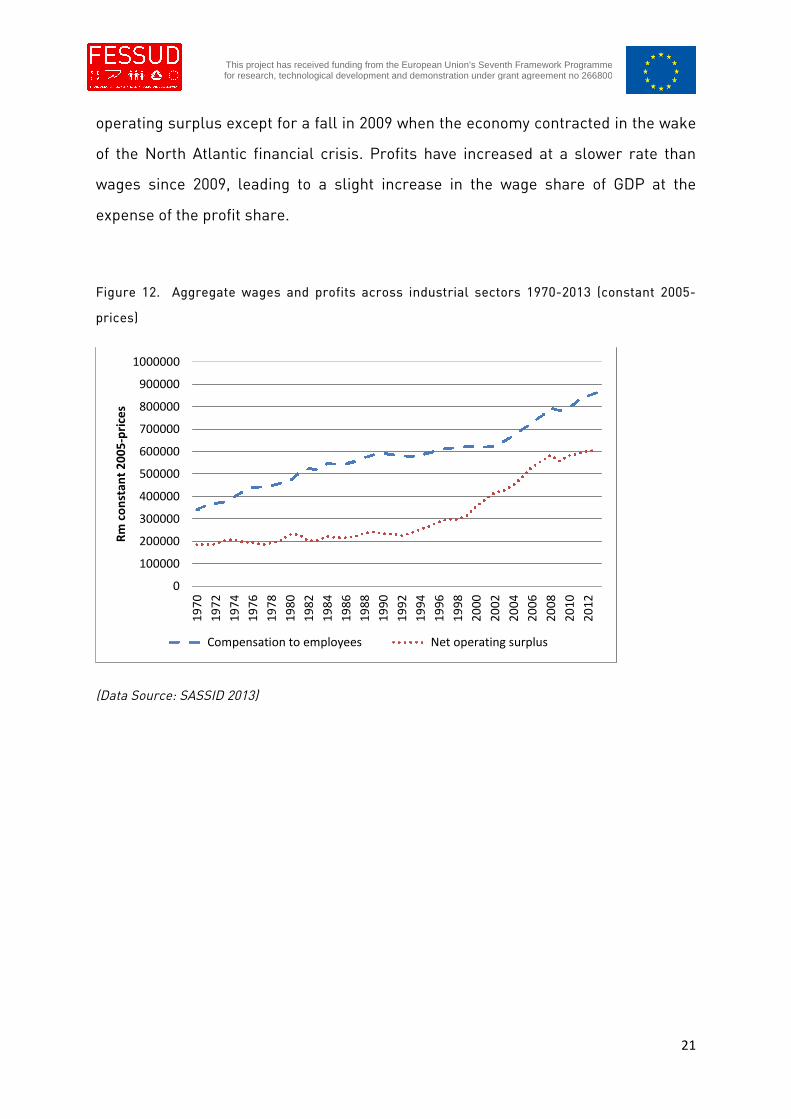
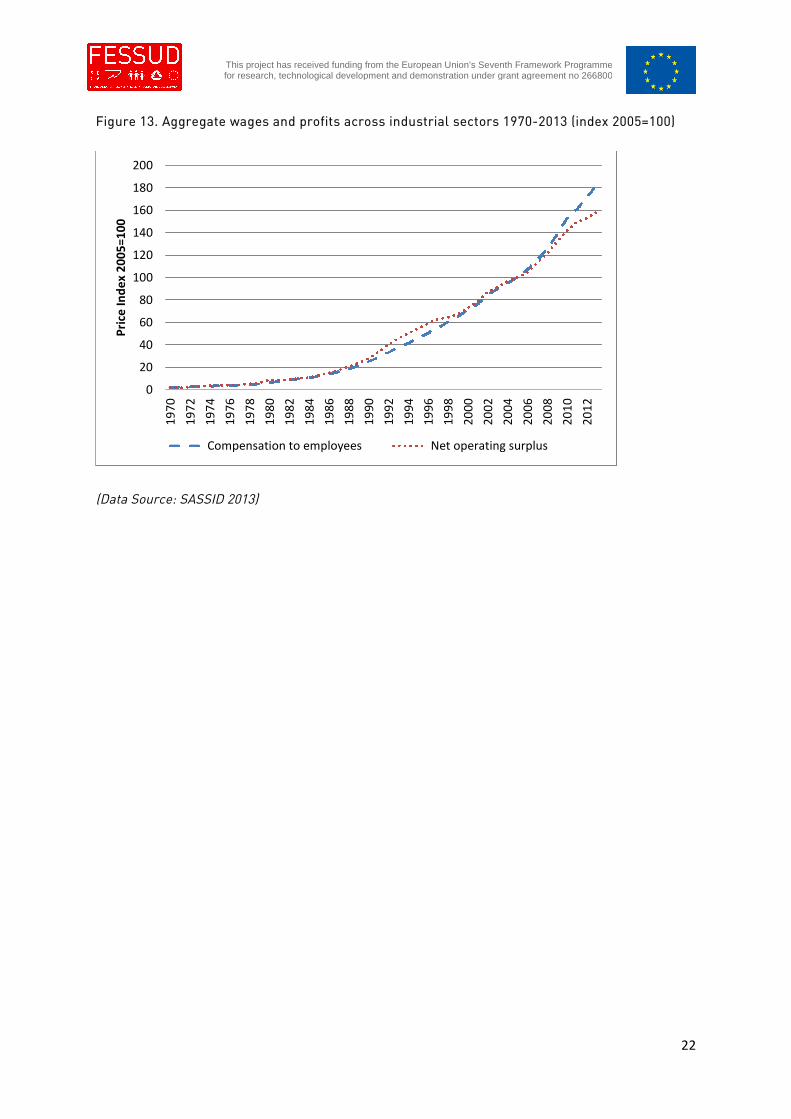
The increase in the profit share of GDP occurred as a result of stagnation in the
aggregate compensation to employees in real terms and growth in profits over the
period 1990 – 2001 (figures 12 & 13). It was capital that reaped the benefits of
economic growth in the early post-apartheid period. Since 2001, real aggregate
compensation to employees has increased year on year alongside aggregate
6 Determination of the source of increase in the share of income not attributed to wages or profitsrequires further interrogation of data sources and reporting conventions.
21
This project has received funding from the European Union’s Seventh Framework Programmefor research, technological development and demonstration under grant agreement no 266800
operating surplus except for a fall in 2009 when the economy contracted in the wake
of the North Atlantic financial crisis. Profits have increased at a slower rate than
wages since 2009, leading to a slight increase in the wage share of GDP at the
expense of the profit share.
Figure 12. Aggregate wages and profits across industrial sectors 1970-2013 (constant 2005-
prices)
(Data Source: SASSID 2013)
0
100000
200000
300000
400000
500000
600000
700000
800000
900000
1000000
19
70
19
72
19
74
19
76
19
78
19
80
19
82
19
84
19
86
19
88
19
90
19
92
19
94
19
96
19
98
20
00
20
02
20
04
20
06
20
08
20
10
20
12
Rm
con
stan
t2
00
5-p
rice
s
Compensation to employees Net operating surplus
22
This project has received funding from the European Union’s Seventh Framework Programmefor research, technological development and demonstration under grant agreement no 266800
Figure 13. Aggregate wages and profits across industrial sectors 1970-2013 (index 2005=100)
(Data Source: SASSID 2013)
0
20
40
60
80
100
120
140
160
180
2001
97
0
19
72
19
74
19
76
19
78
19
80
19
82
19
84
19
86
19
88
19
90
19
92
19
94
19
96
19
98
20
00
20
02
20
04
20
06
20
08
20
10
20
12
Pri
ceIn
de
x2
00
5=1
00
Compensation to employees Net operating surplus
23
This project has received funding from the European Union’s Seventh Framework Programmefor research, technological development and demonstration under grant agreement no 266800
Distribution of income across households
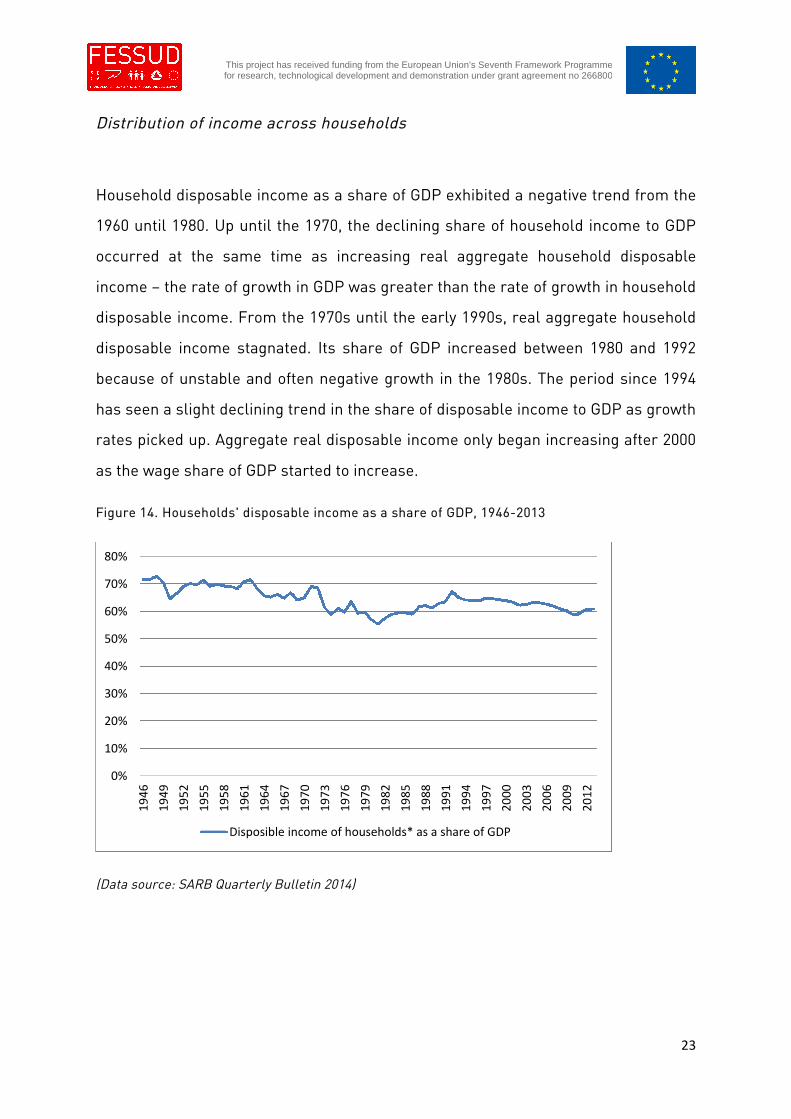
Household disposable income as a share of GDP exhibited a negative trend from the
1960 until 1980. Up until the 1970, the declining share of household income to GDP
occurred at the same time as increasing real aggregate household disposable
income – the rate of growth in GDP was greater than the rate of growth in household
disposable income. From the 1970s until the early 1990s, real aggregate household
disposable income stagnated. Its share of GDP increased between 1980 and 1992
because of unstable and often negative growth in the 1980s. The period since 1994
has seen a slight declining trend in the share of disposable income to GDP as growth
rates picked up. Aggregate real disposable income only began increasing after 2000
as the wage share of GDP started to increase.
Figure 14. Households' disposable income as a share of GDP, 1946-2013
(Data source: SARB Quarterly Bulletin 2014)
0%
10%
20%
30%
40%
50%
60%
70%
80%
19
46
19
49
19
52
19
55
19
58
19
61
19
64
19
67
19
70
19
73
19
76
19
79
19
82
19
85
19
88
19
91
19
94
19
97
20
00
20
03
20
06
20
09
20
12
Disposible income of households* as a share of GDP
24
This project has received funding from the European Union’s Seventh Framework Programmefor research, technological development and demonstration under grant agreement no 266800
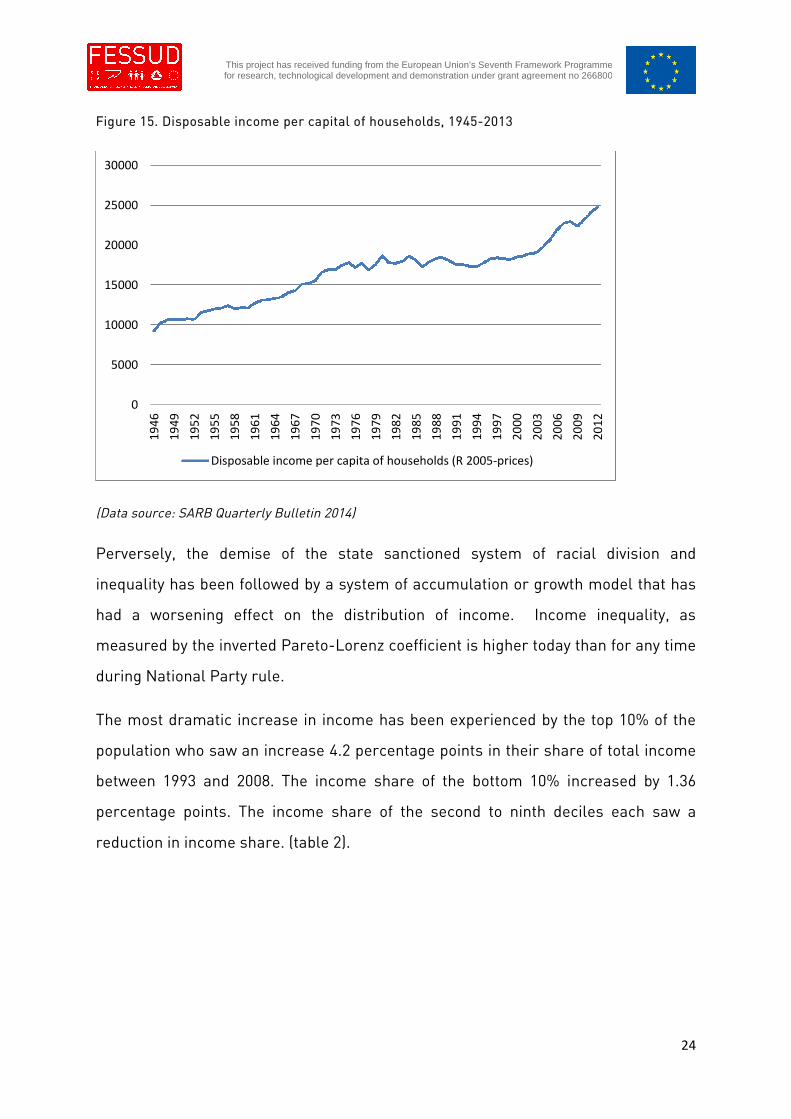
Figure 15. Disposable income per capital of households, 1945-2013
(Data source: SARB Quarterly Bulletin 2014)
Perversely, the demise of the state sanctioned system of racial division and
inequality has been followed by a system of accumulation or growth model that has
had a worsening effect on the distribution of income. Income inequality, as
measured by the inverted Pareto-Lorenz coefficient is higher today than for any time
during National Party rule.
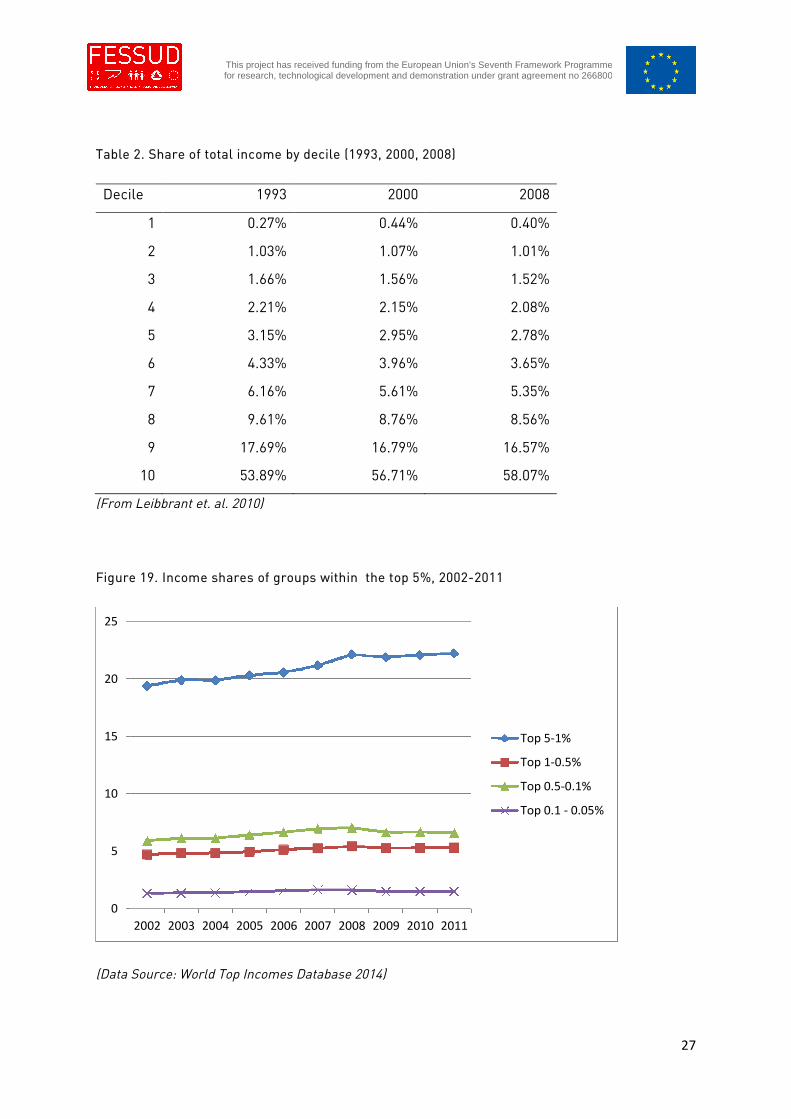
The most dramatic increase in income has been experienced by the top 10% of the
population who saw an increase 4.2 percentage points in their share of total income
between 1993 and 2008. The income share of the bottom 10% increased by 1.36
percentage points. The income share of the second to ninth deciles each saw a
reduction in income share. (table 2).
0
5000
10000
15000
20000
25000
300001
94
6
19
49
19
52
19
55
19
58
19
61
19
64
19
67
19
70
19
73
19
76
19
79
19
82
19
85
19
88
19
91
19
94
19
97
20
00
20
03
20
06
20
09
20
12
Disposable income per capita of households (R 2005-prices)
25
This project has received funding from the European Union’s Seventh Framework Programmefor research, technological development and demonstration under grant agreement no 266800
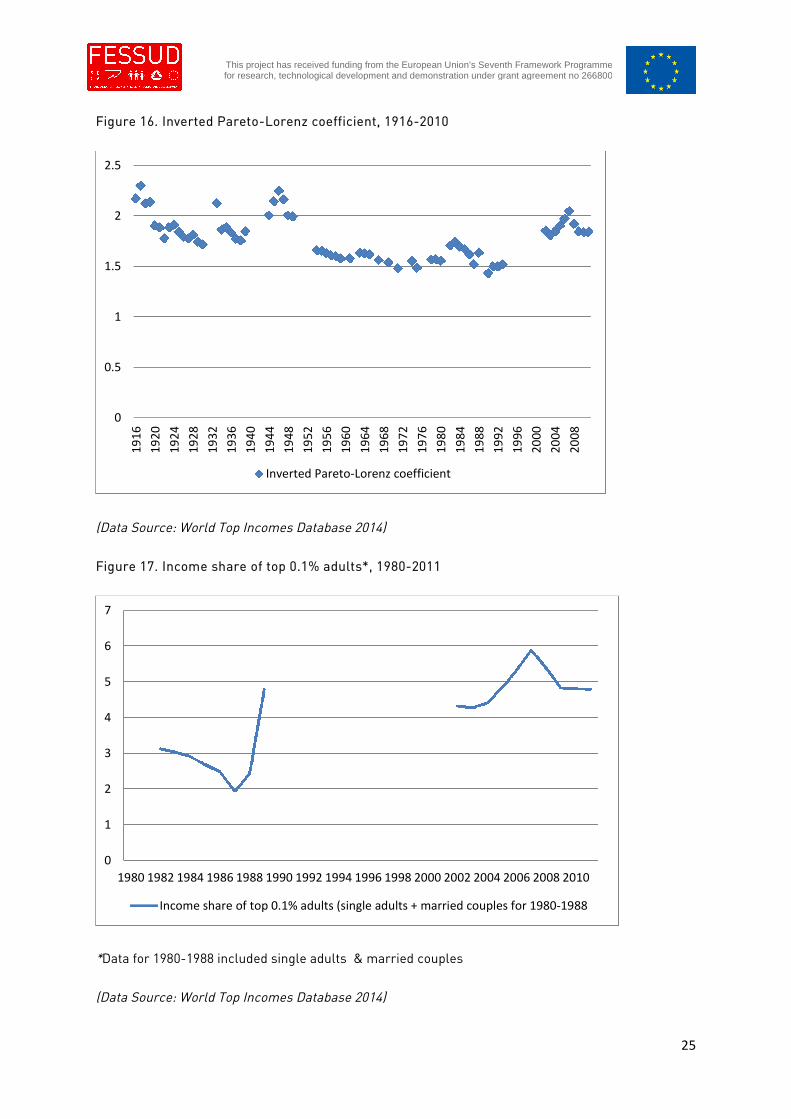
Figure 16. Inverted Pareto-Lorenz coefficient, 1916-2010
(Data Source: World Top Incomes Database 2014)
Figure 17. Income share of top 0.1% adults*, 1980-2011
*Data for 1980-1988 included single adults & married couples
(Data Source: World Top Incomes Database 2014)
0
0.5
1
1.5
2
2.5
19
16
19
20
19
24
19
28
19
32
19
36
19
40
19
44
19
48
19
52
19
56
19
60
19
64
19
68
19
72
19
76
19
80
19
84
19
88
19
92
19
96
20
00
20
04
20
08
Inverted Pareto-Lorenz coefficient
0
1
2
3
4
5
6
7
1980 1982 1984 1986 1988 1990 1992 1994 1996 1998 2000 2002 2004 2006 2008 2010
Income share of top 0.1% adults (single adults + married couples for 1980-1988
26
This project has received funding from the European Union’s Seventh Framework Programmefor research, technological development and demonstration under grant agreement no 266800
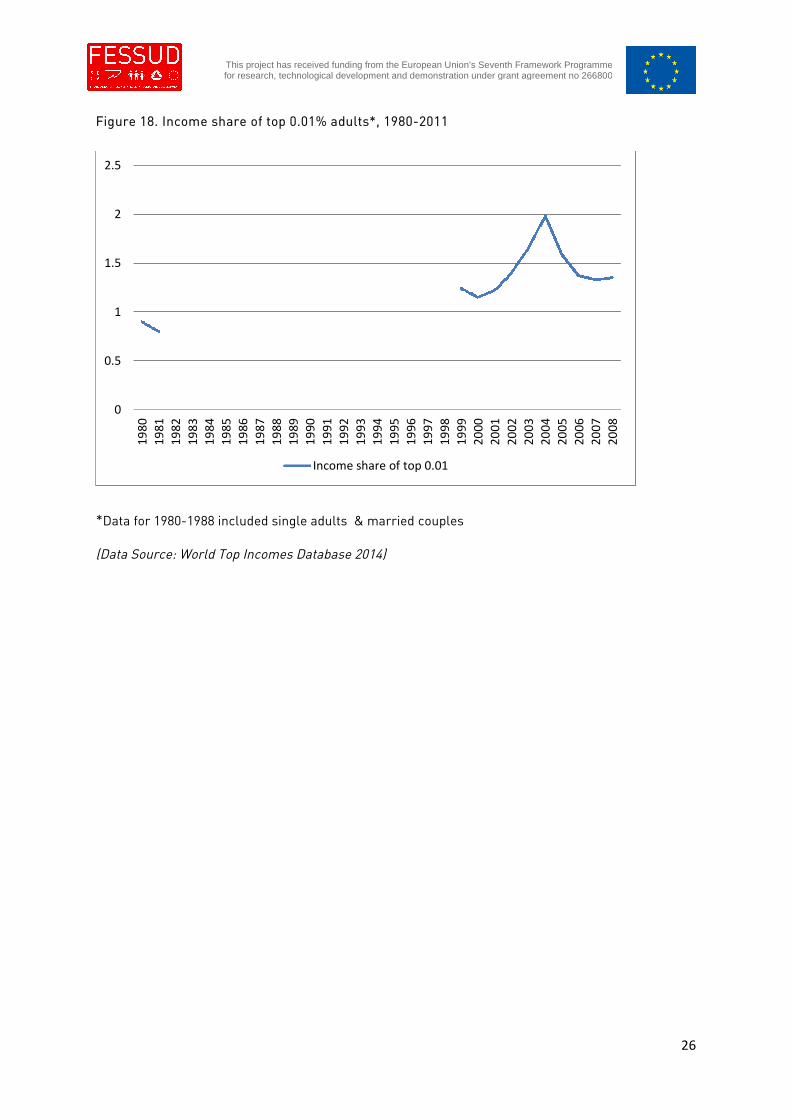
Figure 18. Income share of top 0.01% adults*, 1980-2011
*Data for 1980-1988 included single adults & married couples
(Data Source: World Top Incomes Database 2014)
0
0.5
1
1.5
2
2.5
19
80
19
81
19
82
19
83
19
84
19
85
19
86
19
87
19
88
19
89
19
90
19
91
19
92
19
93
19
94
19
95
19
96
19
97
19
98
19
99
20
00
20
01
20
02
20
03
20
04
20
05
20
06
20
07
20
08
Income share of top 0.01
27
This project has received funding from the European Union’s Seventh Framework Programmefor research, technological development and demonstration under grant agreement no 266800
Table 2. Share of total income by decile (1993, 2000, 2008)
Decile 1993 2000 2008
1 0.27% 0.44% 0.40%
2 1.03% 1.07% 1.01%
3 1.66% 1.56% 1.52%
4 2.21% 2.15% 2.08%
5 3.15% 2.95% 2.78%
6 4.33% 3.96% 3.65%
7 6.16% 5.61% 5.35%
8 9.61% 8.76% 8.56%
9 17.69% 16.79% 16.57%
10 53.89% 56.71% 58.07%
(From Leibbrant et. al. 2010)
Figure 19. Income shares of groups within the top 5%, 2002-2011
(Data Source: World Top Incomes Database 2014)
0
5
10
15
20
25
2002 2003 2004 2005 2006 2007 2008 2009 2010 2011
Top 5-1%
Top 1-0.5%
Top 0.5-0.1%
Top 0.1 - 0.05%
28
This project has received funding from the European Union’s Seventh Framework Programmefor research, technological development and demonstration under grant agreement no 266800
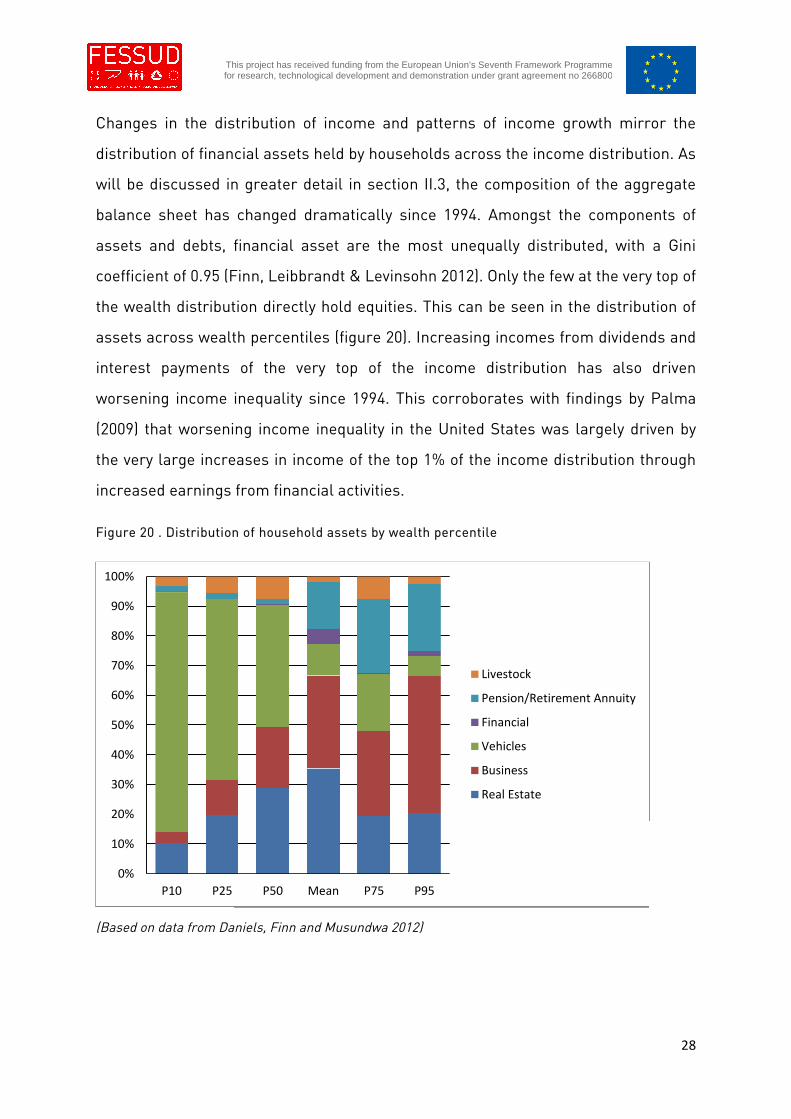
Changes in the distribution of income and patterns of income growth mirror the
distribution of financial assets held by households across the income distribution. As
will be discussed in greater detail in section II.3, the composition of the aggregate
balance sheet has changed dramatically since 1994. Amongst the components of
assets and debts, financial asset are the most unequally distributed, with a Gini
coefficient of 0.95 (Finn, Leibbrandt & Levinsohn 2012). Only the few at the very top of
the wealth distribution directly hold equities. This can be seen in the distribution of
assets across wealth percentiles (figure 20). Increasing incomes from dividends and
interest payments of the very top of the income distribution has also driven
worsening income inequality since 1994. This corroborates with findings by Palma
(2009) that worsening income inequality in the United States was largely driven by
the very large increases in income of the top 1% of the income distribution through
increased earnings from financial activities.
Figure 20 . Distribution of household assets by wealth percentile
(Based on data from Daniels, Finn and Musundwa 2012)
0%
10%
20%
30%
40%
50%
60%
70%
80%
90%
100%
P10 P25 P50 Mean P75 P95
Livestock
Pension/Retirement Annuity
Financial
Vehicles
Business
Real Estate
29
This project has received funding from the European Union’s Seventh Framework Programmefor research, technological development and demonstration under grant agreement no 266800
At the bottom end of the income distribution, it has been persistently high levels of
unemployment that has been an important driver of inequality. According to Finn et
al. (2012), 38% of inequality is accounted for by unemployment. Systemically, rising
unemployment can be attributed to falling levels of real investment (discussed in the
next section) and the process of ‘deindustrialisation’, with labour intensive consumer
goods sectors such as textiles and clothing suffered particularly from trade
liberalisation. While the loss of jobs in mining and manufacturing appear to have
been made up in the expanding services sectors there are important qualifications to
be made about the quality of employment in these sectors for low skilled workers. A
component of the increase in employment in business services relate to the shift
from in house to outsourced cleaning, security and other ancillary business services
and not reflective of an absolute rise in employment. (Mohamed and Roberts 2007)
Where there has been a rise in employment in services, these have been in
extremely low wage activities and average remuneration has fallen as employment
has increased (ibid.). Moreover, 40 per cent of workers are trapped in the informal
sector where there is no minimum wage and workers’ rights are ignored (Oxfam
2014). According to Leibbrant et al. (2012) 62 % of inequality is accounted for by
differences in wages. The same study showed that not only did the poorest see a
decrease in their share of income but real wages for these groups also declined.
While social grants have played an important role in decreasing poverty, it has had
no effect on inequality. (ibid.) According to a recent World Bank (2014) report on
fiscal policy and redistribution in South Africa, progressive taxation and social
spending the gini coefficient on income from 0.77 to 0.59.
In relation to financialisation, employment has been closely related to corporate
restructuring that includes the processes of downsize and distribute associated with
the shareholder value movement. In addition, and in relation, to raising shareholder
value, non-financial corporations have restructured in order to maximise available
funds for financial investment. Restructuring has involved higher degrees of
30
This project has received funding from the European Union’s Seventh Framework Programmefor research, technological development and demonstration under grant agreement no 266800
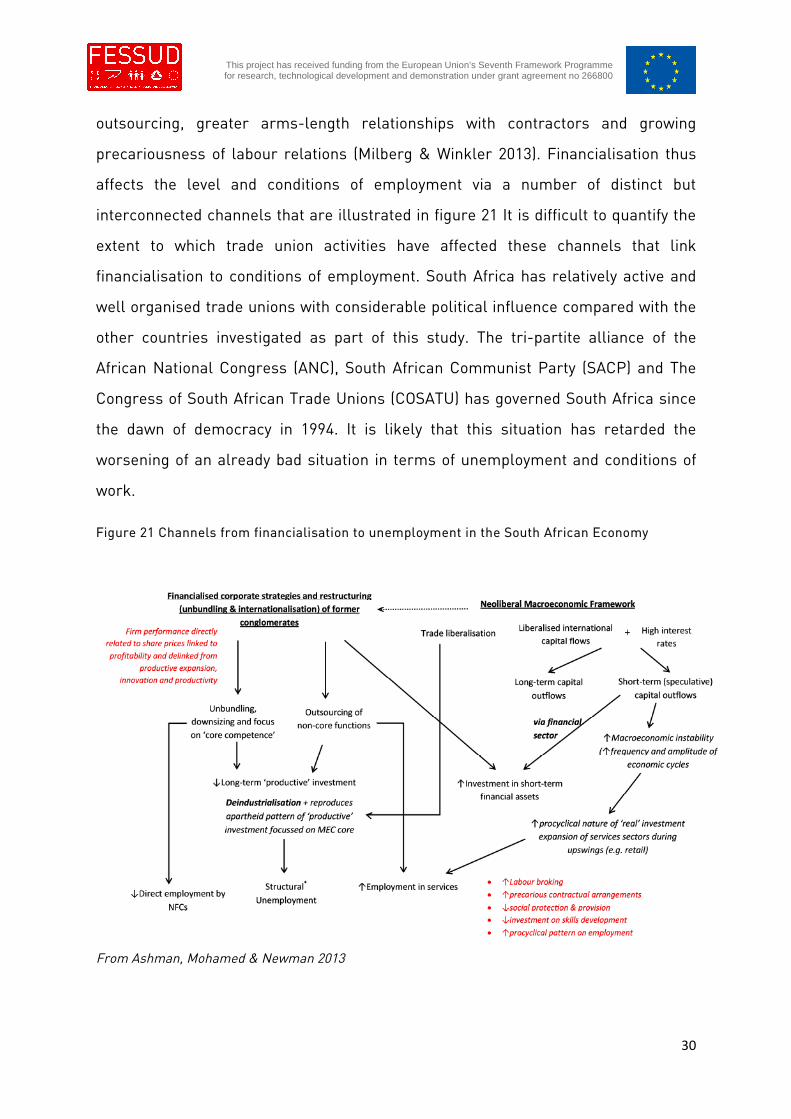
outsourcing, greater arms-length relationships with contractors and growing
precariousness of labour relations (Milberg & Winkler 2013). Financialisation thus
affects the level and conditions of employment via a number of distinct but
interconnected channels that are illustrated in figure 21 It is difficult to quantify the
extent to which trade union activities have affected these channels that link
financialisation to conditions of employment. South Africa has relatively active and
well organised trade unions with considerable political influence compared with the
other countries investigated as part of this study. The tri-partite alliance of the
African National Congress (ANC), South African Communist Party (SACP) and The
Congress of South African Trade Unions (COSATU) has governed South Africa since
the dawn of democracy in 1994. It is likely that this situation has retarded the
worsening of an already bad situation in terms of unemployment and conditions of
work.
Figure 21 Channels from financialisation to unemployment in the South African Economy
From Ashman, Mohamed & Newman 2013
31
This project has received funding from the European Union’s Seventh Framework Programmefor research, technological development and demonstration under grant agreement no 266800
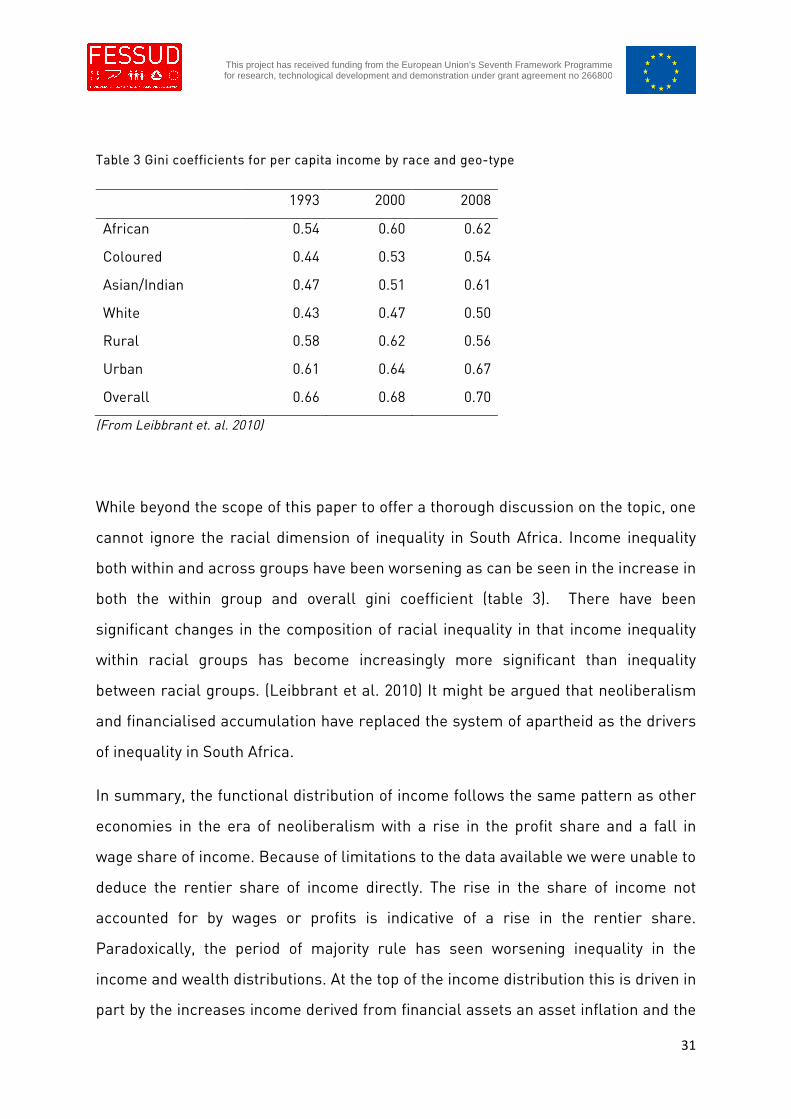
Table 3 Gini coefficients for per capita income by race and geo-type
1993 2000 2008
African 0.54 0.60 0.62
Coloured 0.44 0.53 0.54
Asian/Indian 0.47 0.51 0.61
White 0.43 0.47 0.50
Rural 0.58 0.62 0.56
Urban 0.61 0.64 0.67
Overall 0.66 0.68 0.70
(From Leibbrant et. al. 2010)
While beyond the scope of this paper to offer a thorough discussion on the topic, one
cannot ignore the racial dimension of inequality in South Africa. Income inequality
both within and across groups have been worsening as can be seen in the increase in
both the within group and overall gini coefficient (table 3). There have been
significant changes in the composition of racial inequality in that income inequality
within racial groups has become increasingly more significant than inequality
between racial groups. (Leibbrant et al. 2010) It might be argued that neoliberalism
and financialised accumulation have replaced the system of apartheid as the drivers
of inequality in South Africa.
In summary, the functional distribution of income follows the same pattern as other
economies in the era of neoliberalism with a rise in the profit share and a fall in
wage share of income. Because of limitations to the data available we were unable to
deduce the rentier share of income directly. The rise in the share of income not
accounted for by wages or profits is indicative of a rise in the rentier share.
Paradoxically, the period of majority rule has seen worsening inequality in the
income and wealth distributions. At the top of the income distribution this is driven in
part by the increases income derived from financial assets an asset inflation and the
32
This project has received funding from the European Union’s Seventh Framework Programmefor research, technological development and demonstration under grant agreement no 266800
highly unequal distribution of financial assets across income groups. Unemployment
is a major factor for income inequality and this has its roots in the structure of the
economy and de-industrialisation associated with financialisation. Wage inequality is
the main driver of inequality in South Africa. Again, its association with
financialisation comes from corporate restructuring associated with financialisation,
namely downsizing and outsourcing of non-key functions and increasingly
precarious employment standards and high levels of informality that place
downward pressures on wages for low-skilled jobs. Fiscal and redistributive policies
have had some, but limited, impact on the reduction of inequality and absolute
poverty.
33
This project has received funding from the European Union’s Seventh Framework Programmefor research, technological development and demonstration under grant agreement no 266800
II.2 Financialisation and investment in capital stock
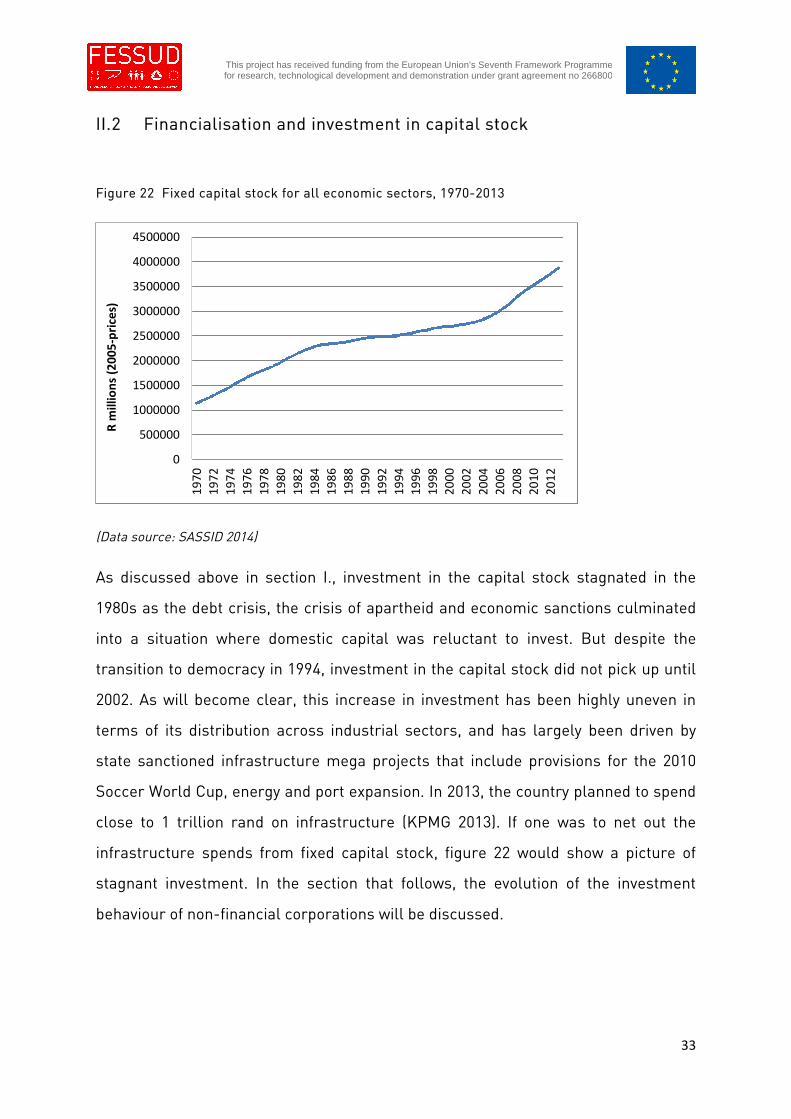
Figure 22 Fixed capital stock for all economic sectors, 1970-2013
(Data source: SASSID 2014)
As discussed above in section I., investment in the capital stock stagnated in the
1980s as the debt crisis, the crisis of apartheid and economic sanctions culminated
into a situation where domestic capital was reluctant to invest. But despite the
transition to democracy in 1994, investment in the capital stock did not pick up until
2002. As will become clear, this increase in investment has been highly uneven in
terms of its distribution across industrial sectors, and has largely been driven by
state sanctioned infrastructure mega projects that include provisions for the 2010
Soccer World Cup, energy and port expansion. In 2013, the country planned to spend
close to 1 trillion rand on infrastructure (KPMG 2013). If one was to net out the
infrastructure spends from fixed capital stock, figure 22 would show a picture of
stagnant investment. In the section that follows, the evolution of the investment
behaviour of non-financial corporations will be discussed.
0
500000
1000000
1500000
2000000
2500000
3000000
3500000
4000000
4500000
19
70
19
72
19
74
19
76
19
78
19
80
19
82
19
84
19
86
19
88
19
90
19
92
19
94
19
96
19
98
20
00
20
02
20
04
20
06
20
08
20
10
20
12
Rm
illio
ns
(20
05
-pri
ces)
34
This project has received funding from the European Union’s Seventh Framework Programmefor research, technological development and demonstration under grant agreement no 266800
Non-financial corporations and financialisation
Traditionally, under a ‘productionist’ model, firms reinvested significant portions of
the surplus obtained from production to increase the capital stock and thus the
productive base of the firm. The ‘productionist’ model saw firms as the core site of
capital accumulation. By contrast, the process of financialisation, or a ‘financialised’
business model sees an increase firms’ financial operations and motives. The
financialised firm has a very different relationship with the financial sector, itself
transformed from simple intermediary between households’ savings and firms’
investment into regulator of firm and household behaviour. (Froud et al. 2002) One
dimension of this is the tying together of firm performance with performance of its
stocks and shares on capital markets associated with the shareholder value
movement.
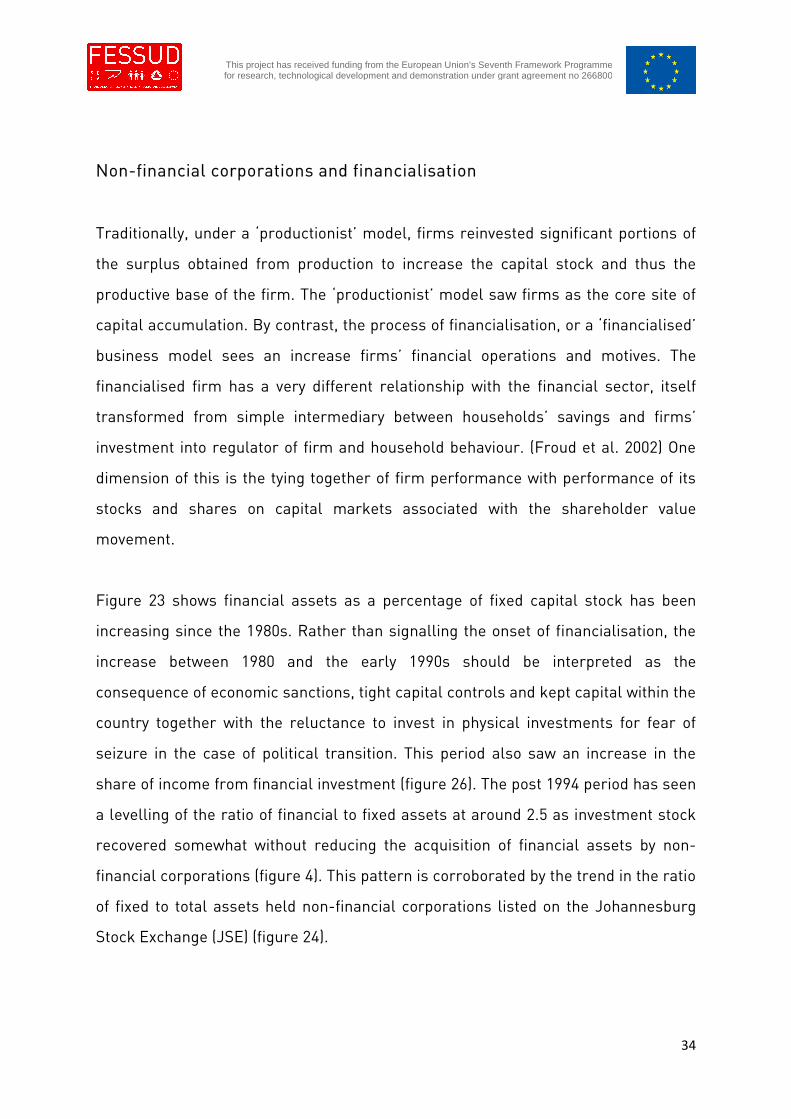
Figure 23 shows financial assets as a percentage of fixed capital stock has been
increasing since the 1980s. Rather than signalling the onset of financialisation, the
increase between 1980 and the early 1990s should be interpreted as the
consequence of economic sanctions, tight capital controls and kept capital within the
country together with the reluctance to invest in physical investments for fear of
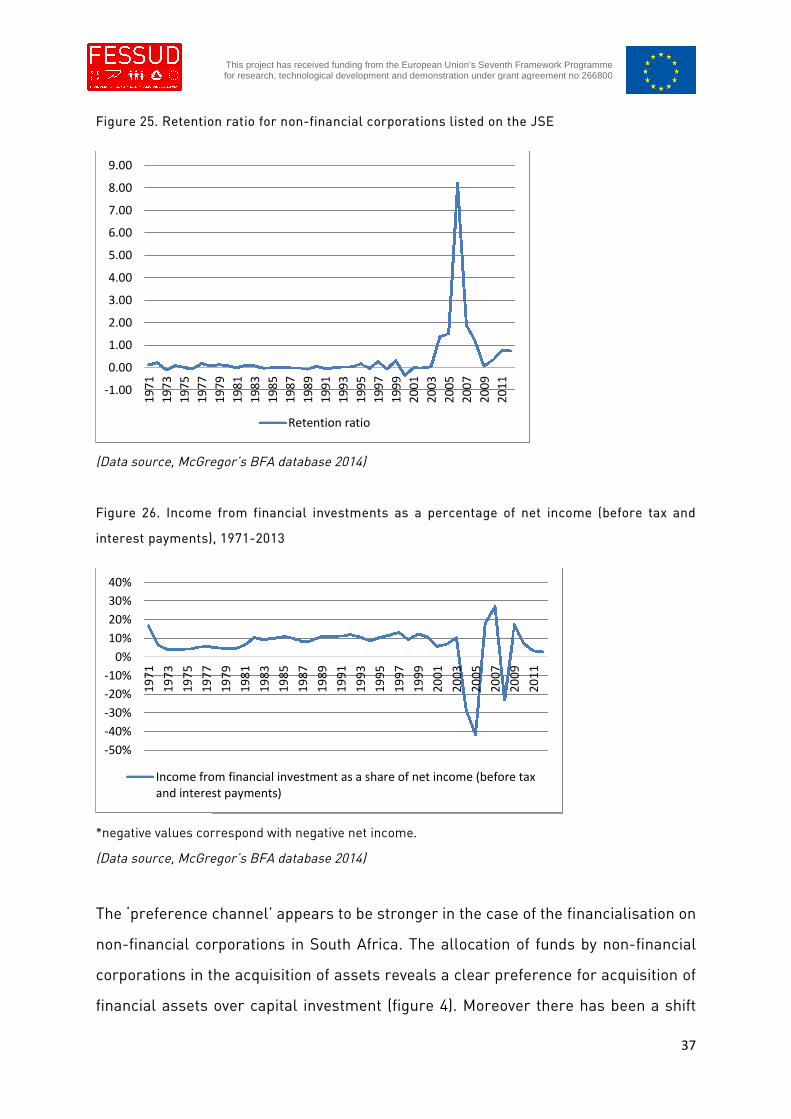
seizure in the case of political transition. This period also saw an increase in the
share of income from financial investment (figure 26). The post 1994 period has seen
a levelling of the ratio of financial to fixed assets at around 2.5 as investment stock
recovered somewhat without reducing the acquisition of financial assets by non-
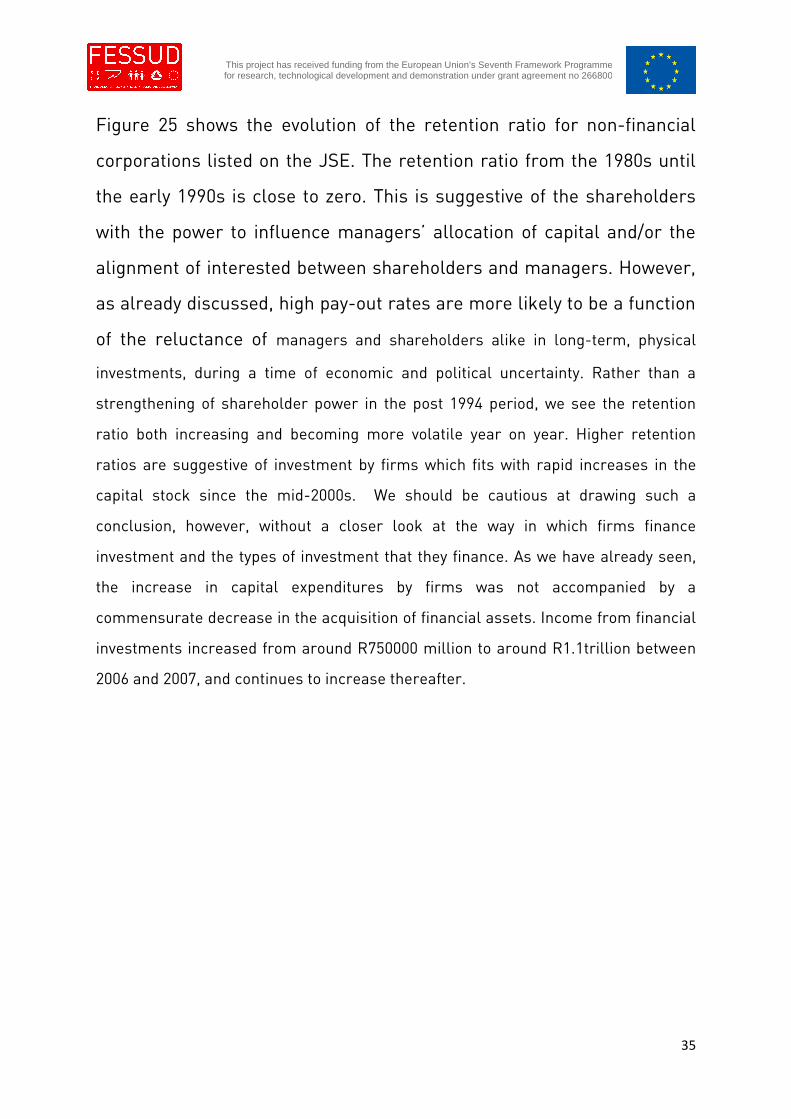
financial corporations (figure 4). This pattern is corroborated by the trend in the ratio
of fixed to total assets held non-financial corporations listed on the Johannesburg
Stock Exchange (JSE) (figure 24).
35
This project has received funding from the European Union’s Seventh Framework Programmefor research, technological development and demonstration under grant agreement no 266800
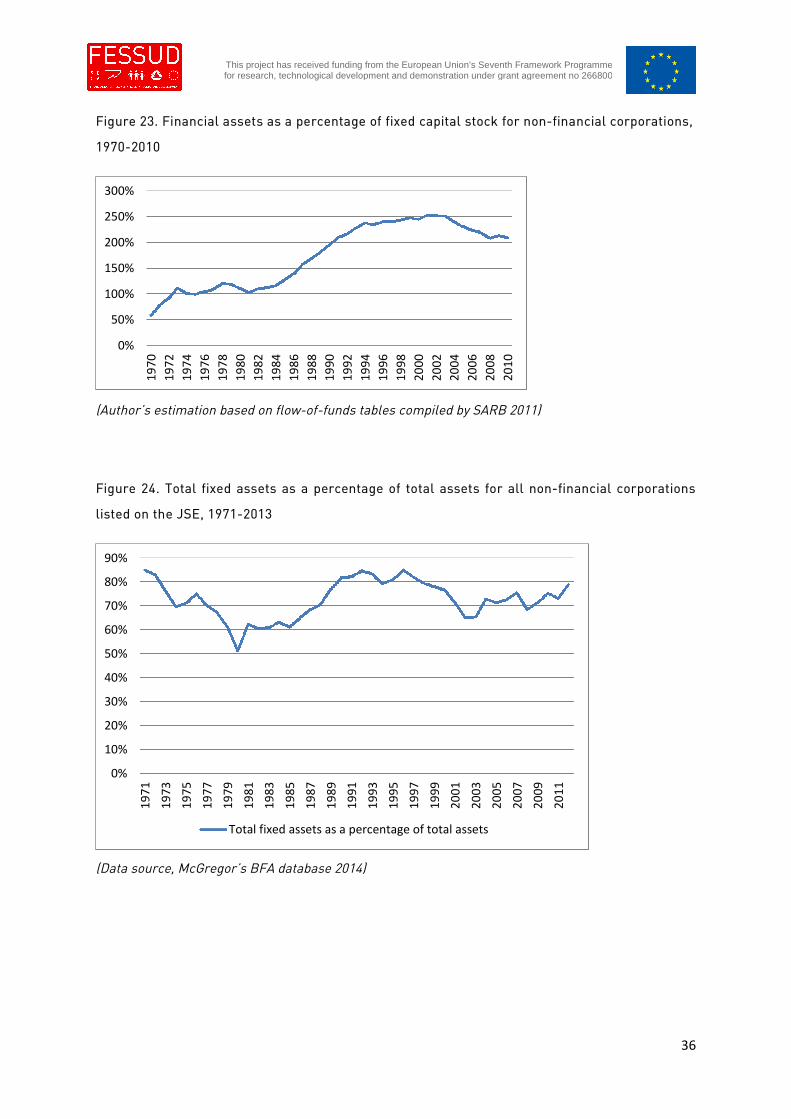
Figure 25 shows the evolution of the retention ratio for non-financial
corporations listed on the JSE. The retention ratio from the 1980s until
the early 1990s is close to zero. This is suggestive of the shareholders
with the power to influence managers’ allocation of capital and/or the
alignment of interested between shareholders and managers. However,
as already discussed, high pay-out rates are more likely to be a function
of the reluctance of managers and shareholders alike in long-term, physical
investments, during a time of economic and political uncertainty. Rather than a
strengthening of shareholder power in the post 1994 period, we see the retention
ratio both increasing and becoming more volatile year on year. Higher retention
ratios are suggestive of investment by firms which fits with rapid increases in the
capital stock since the mid-2000s. We should be cautious at drawing such a
conclusion, however, without a closer look at the way in which firms finance
investment and the types of investment that they finance. As we have already seen,
the increase in capital expenditures by firms was not accompanied by a
commensurate decrease in the acquisition of financial assets. Income from financial
investments increased from around R750000 million to around R1.1trillion between
2006 and 2007, and continues to increase thereafter.
36
This project has received funding from the European Union’s Seventh Framework Programmefor research, technological development and demonstration under grant agreement no 266800
Figure 23. Financial assets as a percentage of fixed capital stock for non-financial corporations,
1970-2010
(Author’s estimation based on flow-of-funds tables compiled by SARB 2011)
Figure 24. Total fixed assets as a percentage of total assets for all non-financial corporations
listed on the JSE, 1971-2013
(Data source, McGregor’s BFA database 2014)
0%
50%
100%
150%
200%
250%
300%
19
70
19
72
19
74
19
76
19
78
19
80
19
82
19
84
19
86
19
88
19
90
19
92
19
94
19
96
19
98
20
00
20
02
20
04
20
06
20
08
20
10
0%
10%
20%
30%
40%
50%
60%
70%
80%
90%
19
71
19
73
19
75
19
77
19
79
19
81
19
83
19
85
19
87
19
89
19
91
19
93
19
95
19
97
19
99
20
01
20
03
20
05
20
07
20
09
20
11
Total fixed assets as a percentage of total assets
37
This project has received funding from the European Union’s Seventh Framework Programmefor research, technological development and demonstration under grant agreement no 266800
Figure 25. Retention ratio for non-financial corporations listed on the JSE
(Data source, McGregor’s BFA database 2014)
Figure 26. Income from financial investments as a percentage of net income (before tax and
interest payments), 1971-2013
*negative values correspond with negative net income.
(Data source, McGregor’s BFA database 2014)
The ‘preference channel’ appears to be stronger in the case of the financialisation on
non-financial corporations in South Africa. The allocation of funds by non-financial
corporations in the acquisition of assets reveals a clear preference for acquisition of
financial assets over capital investment (figure 4). Moreover there has been a shift
-1.00
0.00
1.00
2.00
3.00
4.00
5.00
6.00
7.00
8.00
9.00
19
71
19
73
19
75
19
77
19
79
19
81
19
83
19
85
19
87
19
89
19
91
19
93
19
95
19
97
19
99
20
01
20
03
20
05
20
07
20
09
20
11
Retention ratio
-50%
-40%
-30%
-20%
-10%
0%
10%
20%
30%
40%
19
71
19
73
19
75
19
77
19
79
19
81
19
83
19
85
19
87
19
89
19
91
19
93
19
95
19
97
19
99
20
01
20
03
20
05
20
07
20
09
20
11
Income from financial investment as a share of net income (before taxand interest payments)
38
This project has received funding from the European Union’s Seventh Framework Programmefor research, technological development and demonstration under grant agreement no 266800
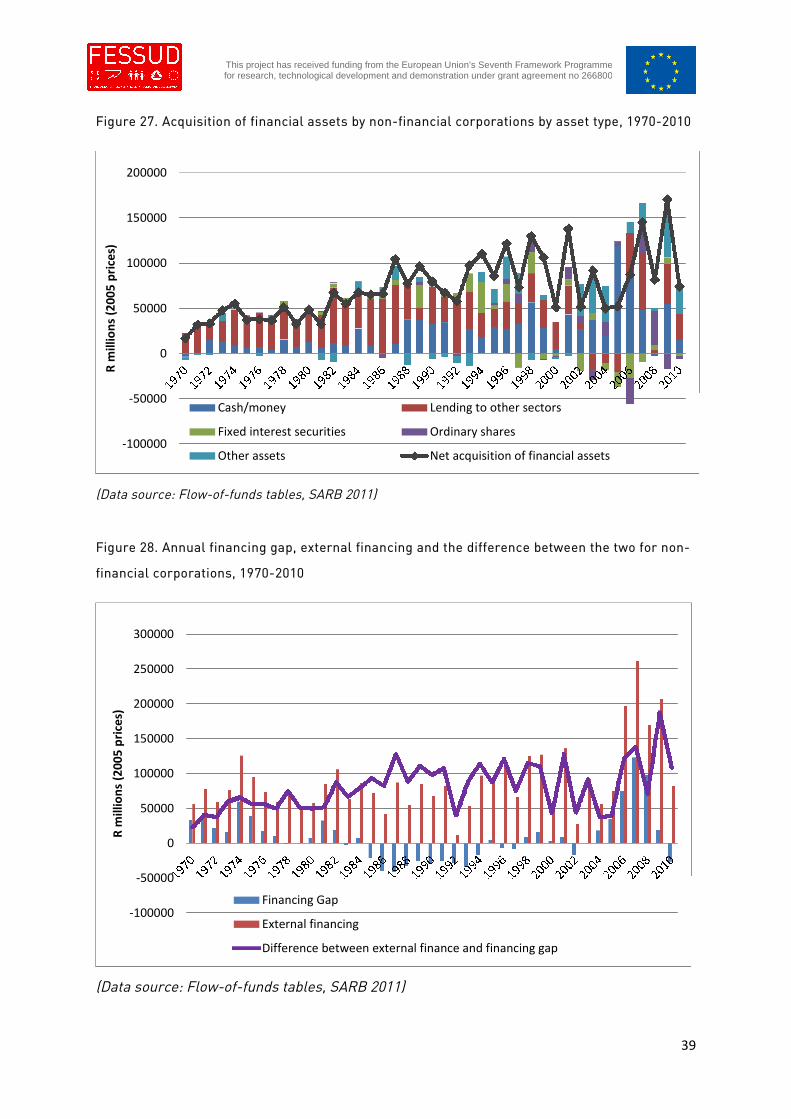
towards more liquid financial assets that yield relatively short-term returns (figure
27). From 1970 until the early 1990s, lending to other sectors constituted the largest
share of financial assets acquired each year. The period since 1994 has seen not only
an increase in the overall value of financial assets acquired each year, but also a
change in composition. The composition of financial assets acquired by non-financial
corporations has become more diversified, liquid and varying from year to year.
Another important feature of firms use of funds in the post 1994 period has been the
holding of increasingly large cash balances. On average cash/money made up 19% of
annual financial acquisitions in the period 1970-1987 compared to an annual mean of
48% from 1988-2010.In a detailed study of JSE listed firms, Karwowski (forthcoming)
found that overcapitalisation was the norm for mining and basic materials
producers. Karowski showed that in the context of South Africa, firms hold
substantial assets in cash and cash equivalent form and use financial markets to:
finance highly speculative activity; substitute waning operational profits for financial
income in the case of mature companies; and in order for emerging companies to
amass large volumes of liquidity to counter operational losses as they establish their
productive operations. Moreover, high interest rates in South Africa means that even
short-term deposits in monetary institutions can earn a return of 2-3% monthly7
7 See for example Standardbank’s AccessSave account
39
This project has received funding from the European Union’s Seventh Framework Programmefor research, technological development and demonstration under grant agreement no 266800
Figure 27. Acquisition of financial assets by non-financial corporations by asset type, 1970-2010
(Data source: Flow-of-funds tables, SARB 2011)
Figure 28. Annual financing gap, external financing and the difference between the two for non-
financial corporations, 1970-2010
(Data source: Flow-of-funds tables, SARB 2011)
-100000
-50000
0
50000
100000
150000
200000
Rm
illio
ns
(20
05
pri
ces)
Cash/money Lending to other sectors
Fixed interest securities Ordinary shares
Other assets Net acquisition of financial assets
-100000
-50000
0
50000
100000
150000
200000
250000
300000
Rm
illio
ns
(20
05
pri
ces)
Financing Gap
External financing
Difference between external finance and financing gap
40
This project has received funding from the European Union’s Seventh Framework Programmefor research, technological development and demonstration under grant agreement no 266800
The period since 1994 has also seen non-financial corporations moving from their
positions of net lenders to net borrowers for all years except for 1996, 1997 and 2002
suggesting that increased acquisition of financial assets has been financed through
the expansion of credit. We find further evidence that increased external borrowing
by non-financial corporations to finance the acquisition of financial assets when we
examine the evolution of the financing gap8 for non-financial corporations and their
external financing9 (figure 28). The difference between the financing gap and
external financing has fluctuated around a relatively stable mean from the mid-
1980s until the mid-2000s when this difference began to follow a positive trend until
2010. Between 2004 and 2008, bank credit dominated the liabilities side of the non-
financial sector balance sheet, coinciding with an increase in the difference between
the financing gap and external financing for non-financial corporations (figure 28).
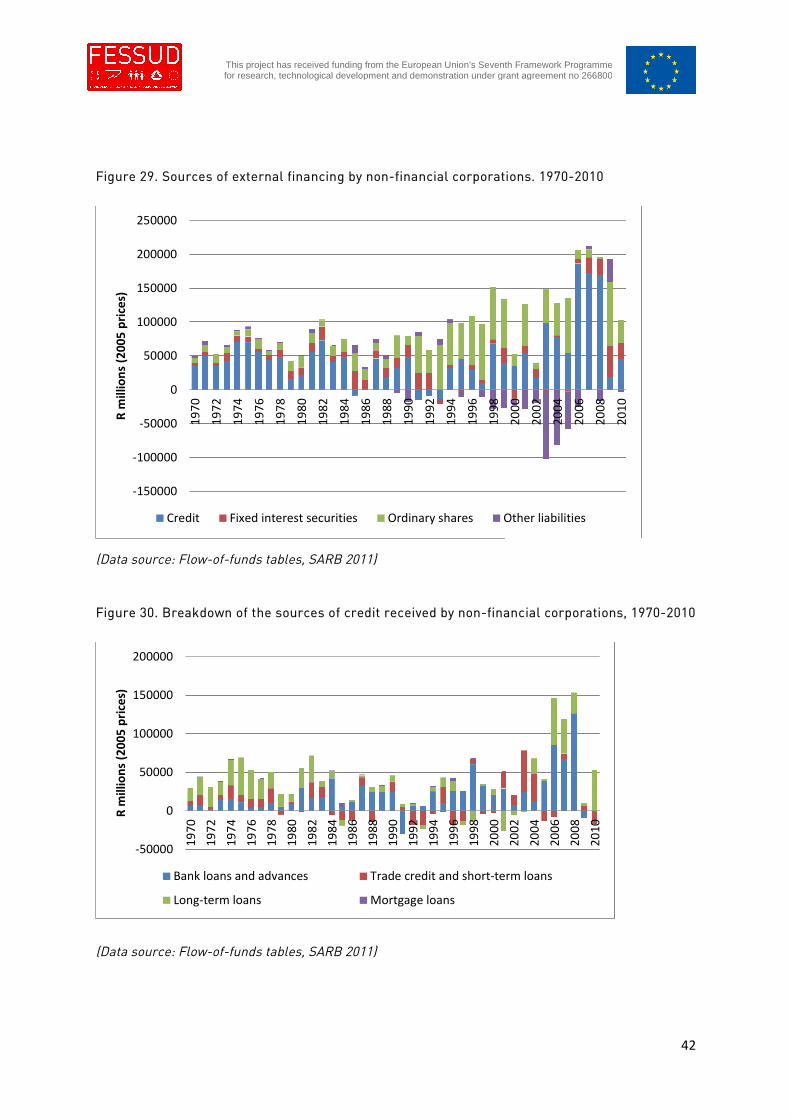
Moreover, there has been a shift in the composition of financial liabilities held by
non-financial corporations with an expansion of ordinary shares and other short-
term liabilities from 1994 (figure 29). Owing to maturity mismatch between assets
and liabilities, the short-term nature of liabilities is not conducive to long-term
productive investments which drive capital accumulation. Consequently, we have
seen the financing of the acquisition of (largely short-term) financial assets rather
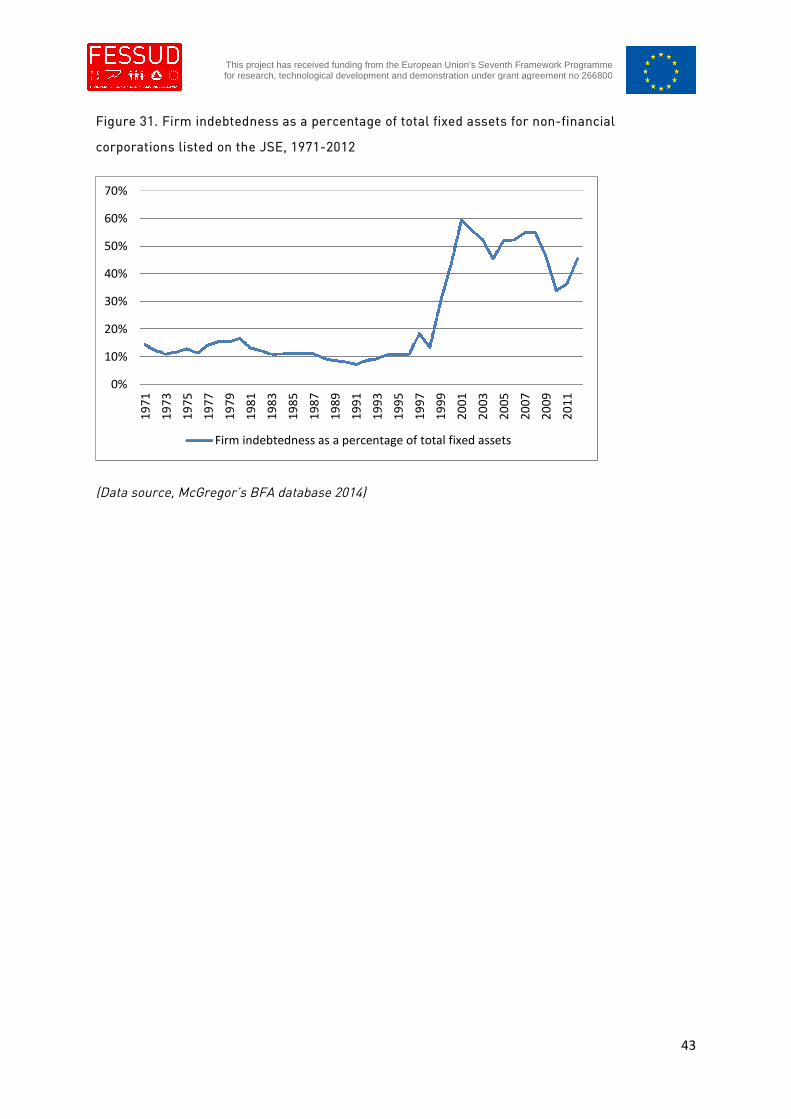
than fixed capital. The growing indebtedness of firms is also evident from the trend
in the ratio of debt to fixed assets for JSE listed non-financial corporations (figure
31).
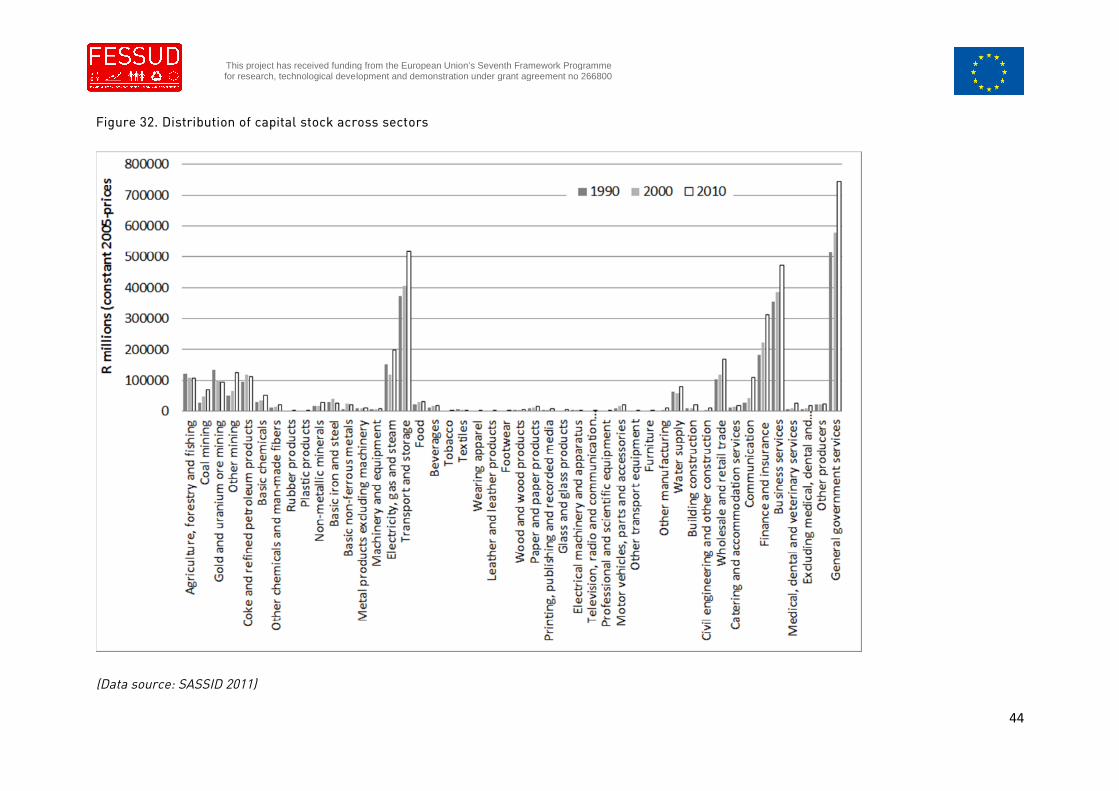
The financialisation of non-financial corporations in South Africa has had the effect,
not only of keeping overall levels of private investment in fixed capital low, but also
to reproduce the old apartheid pattern of investment concentrated upon MEC
sectors (figure 32). Investment in non-MEC manufacturing has been uneven. Except
8 The financing gap is equal to net borrowing which is the difference between net savings and netcapital formation.9 External financing is equal to the net incurrence of financial liabilities.
41
This project has received funding from the European Union’s Seventh Framework Programmefor research, technological development and demonstration under grant agreement no 266800
for motor vehicles and parts10 and food and beverages, capital stock in
manufacturing sectors has been largely stagnant or in decline. As already discussed,
this pattern of investment has serious implications for the nature of employment and
unemployment.
In summary, Non-financial coporations in South Africa have been acquiring high
levels of financial assets in lieu of productive investment since the 1980s, prior to the
period of financialisation, as a result of political and economic uncertainty. Since
1994, fixed investment has recovered somewhat but with no commensurate
reduction in financial investment. Non-financial corporations in South Africa use
banks and capital markets to increase their financial and speculative positions.
Evidence presented suggests that the share-holder preference channel is relatively
weak. There is an evident preference by firms for financial investments generating
short-term returns.
10 Motor vehicles and parts has benefited through state directed investment as part of the MotorIndustry Development Program and the subsequent Automotive Production and DevelopmentProgram.
42
This project has received funding from the European Union’s Seventh Framework Programmefor research, technological development and demonstration under grant agreement no 266800
Figure 29. Sources of external financing by non-financial corporations. 1970-2010
(Data source: Flow-of-funds tables, SARB 2011)
Figure 30. Breakdown of the sources of credit received by non-financial corporations, 1970-2010
(Data source: Flow-of-funds tables, SARB 2011)
-150000
-100000
-50000
0
50000
100000
150000
200000
250000
19
70
19
72
19
74
19
76
19
78
19
80
19
82
19
84
19
86
19
88
19
90
19
92
19
94
19
96
19
98
20
00
20
02
20
04
20
06
20
08
20
10
Rm
illio
ns
(20
05
pri
ces)
Credit Fixed interest securities Ordinary shares Other liabilities
-50000
0
50000
100000
150000
200000
19
70
19
72
19
74
19
76
19
78
19
80
19
82
19
84
19
86
19
88
19
90
19
92
19
94
19
96
19
98
20
00
20
02
20
04
20
06
20
08
20
10
Rm
illio
ns
(20
05
pri
ces)
Bank loans and advances Trade credit and short-term loans
Long-term loans Mortgage loans
43
This project has received funding from the European Union’s Seventh Framework Programmefor research, technological development and demonstration under grant agreement no 266800
Figure 31. Firm indebtedness as a percentage of total fixed assets for non-financial
corporations listed on the JSE, 1971-2012
(Data source, McGregor’s BFA database 2014)
0%
10%
20%
30%
40%
50%
60%
70%
19
71
19
73
19
75
19
77
19
79
19
81
19
83
19
85
19
87
19
89
19
91
19
93
19
95
19
97
19
99
20
01
20
03
20
05
20
07
20
09
20
11
Firm indebtedness as a percentage of total fixed assets
44
This project has received funding from the European Union’s Seventh Framework Programmefor research, technological development and demonstration under grant agreement no 266800
Figure 32. Distribution of capital stock across sectors
(Data source: SASSID 2011)
45
This project has received funding from the European Union’s Seventh Framework Programmefor research, technological development and demonstration under grant agreement no 266800
II.3 Financialisation and consumption
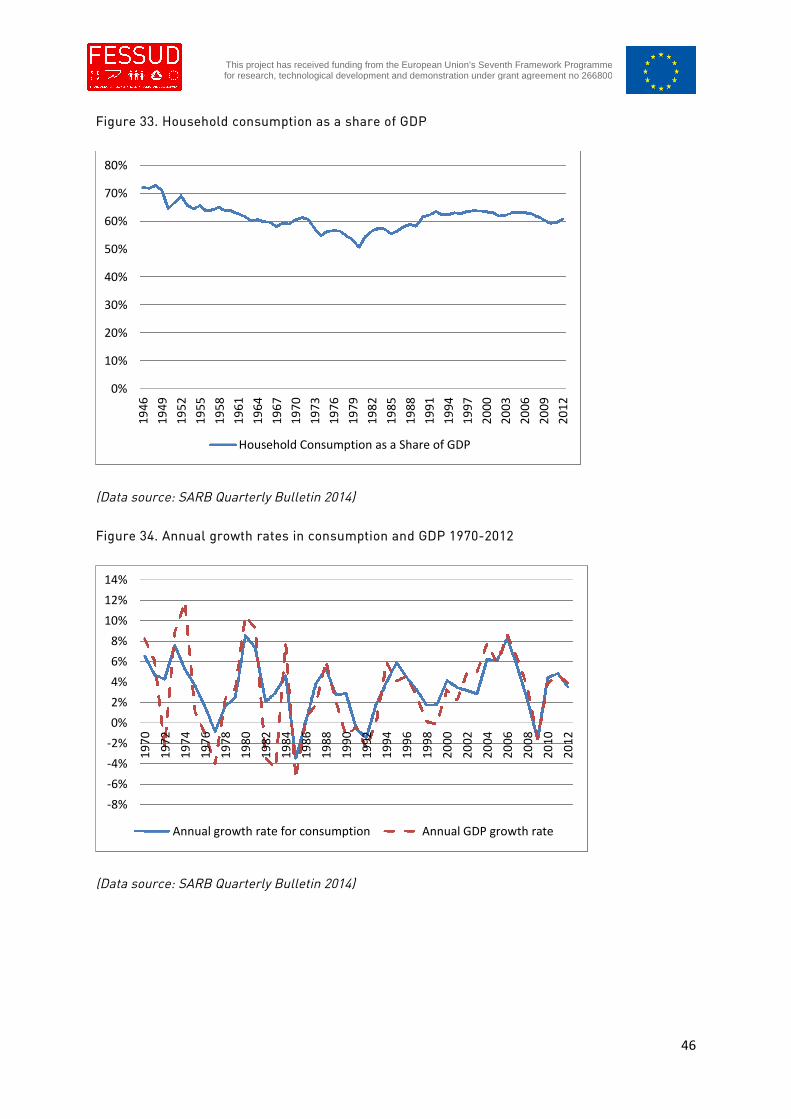
Figure 33 shows the trajectory of household consumption as a share of GDP from
1946 to 2012. Consumption as a share of GDP fell throughout the apartheid period
until 1980 when the trend turned positive until the early 1990s when consumption as
a percentage of GDP stabilises at around 64 per cent. As already mentioned above,
the 1980s until the early 1990s was a particularly tumultuous period in South Africa’s
recent history, marked by political, social and economic upheavals. The period was
peppered by recessions driven by contractions in investment and exports. From the
1990s growth rates in both GDP and consumption recover with GDP and
consumption growing at similar annual rates. The dip in 2009 reveals that
consumption was affected negatively by the recession that arose out of the global
financial crisis. As in the evolution of the ratio of consumption to GDP in the United
States that increased from the 1990s as consumption increased in importance as a
driver of GDP growth (Stockhammer 2010), the process of debt driven consumption
in South Africa did result in an increasing role of consumption in GDP growth,
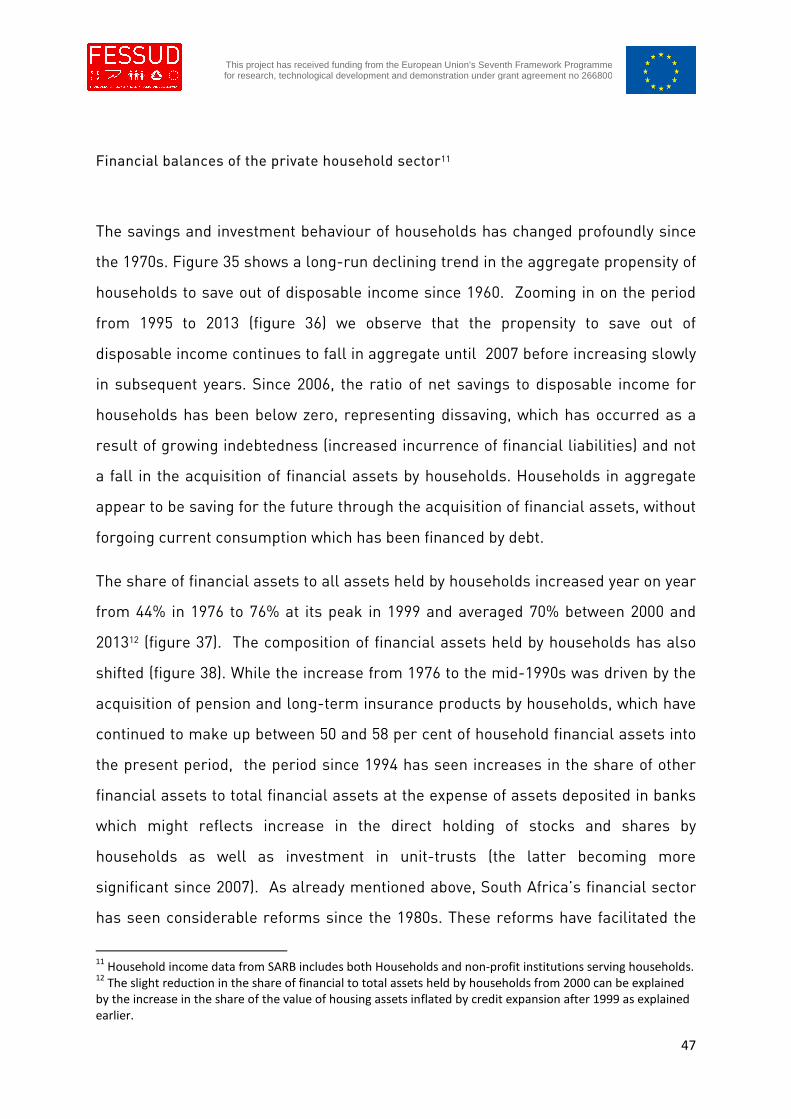
especially after the mid-2002s (figure 34). The growth contribution to GDP of
domestic consumption was on average of 3.1 per cent between 2000 and 2007
compared with 1.4 per cent between 1990 and 1999 and 1.8 per cent in the decade
before that. Between 2000 and 2007, domestic consumption was the strongest driver
of growth year on year (see figure 1). As shall be discussed in the next section, high
incidences of poverty and high levels of inequality has led to a similar distribution in
access to financial markets and instruments. Debt driven consumption in South
Africa is concentrated in the relatively wealthy sections of society and have
facilitated the increased acquisition of financial assets by some households without
an associated fall in consumption.
46
This project has received funding from the European Union’s Seventh Framework Programmefor research, technological development and demonstration under grant agreement no 266800
Figure 33. Household consumption as a share of GDP
(Data source: SARB Quarterly Bulletin 2014)
Figure 34. Annual growth rates in consumption and GDP 1970-2012
(Data source: SARB Quarterly Bulletin 2014)
0%
10%
20%
30%
40%
50%
60%
70%
80%
19
46
19
49
19
52
19
55
19
58
19
61
19
64
19
67
19
70
19
73
19
76
19
79
19
82
19
85
19
88
19
91
19
94
19
97
20
00
20
03
20
06
20
09
20
12
Household Consumption as a Share of GDP
-8%
-6%
-4%
-2%
0%
2%
4%
6%
8%
10%
12%
14%
19
70
19
72
19
74
19
76
19
78
19
80
19
82
19
84
19
86
19
88
19
90
19
92
19
94
19
96
19
98
20
00
20
02
20
04
20
06
20
08
20
10
20
12
Annual growth rate for consumption Annual GDP growth rate
47
This project has received funding from the European Union’s Seventh Framework Programmefor research, technological development and demonstration under grant agreement no 266800
Financial balances of the private household sector11
The savings and investment behaviour of households has changed profoundly since
the 1970s. Figure 35 shows a long-run declining trend in the aggregate propensity of
households to save out of disposable income since 1960. Zooming in on the period
from 1995 to 2013 (figure 36) we observe that the propensity to save out of
disposable income continues to fall in aggregate until 2007 before increasing slowly
in subsequent years. Since 2006, the ratio of net savings to disposable income for
households has been below zero, representing dissaving, which has occurred as a
result of growing indebtedness (increased incurrence of financial liabilities) and not
a fall in the acquisition of financial assets by households. Households in aggregate
appear to be saving for the future through the acquisition of financial assets, without
forgoing current consumption which has been financed by debt.
The share of financial assets to all assets held by households increased year on year
from 44% in 1976 to 76% at its peak in 1999 and averaged 70% between 2000 and
201312 (figure 37). The composition of financial assets held by households has also
shifted (figure 38). While the increase from 1976 to the mid-1990s was driven by the
acquisition of pension and long-term insurance products by households, which have
continued to make up between 50 and 58 per cent of household financial assets into
the present period, the period since 1994 has seen increases in the share of other
financial assets to total financial assets at the expense of assets deposited in banks
which might reflects increase in the direct holding of stocks and shares by
households as well as investment in unit-trusts (the latter becoming more
significant since 2007). As already mentioned above, South Africa’s financial sector
has seen considerable reforms since the 1980s. These reforms have facilitated the
11Household income data from SARB includes both Households and non-profit institutions serving households.
12The slight reduction in the share of financial to total assets held by households from 2000 can be explained
by the increase in the share of the value of housing assets inflated by credit expansion after 1999 as explainedearlier.
48
This project has received funding from the European Union’s Seventh Framework Programmefor research, technological development and demonstration under grant agreement no 266800
expansion of flows between capital markets and households in particular. In the
early 1980s, government prescribed asset ratios for pension funds and pensions
invested with insurance companies were relaxed. Further, restrictions for official
pension funds to invest only in public fixed interest securities were lifted in 1990.
This made it possible for these companies to expand investments in equities as can
be seen in figures 39 and 40. More recently, in 2007, restrictions against selling
investment products fell away resulting in the growth in number of private
investment funds and savings products, namely unit trusts, as well as the entry into
savings by established insurance companies. (Ashman, Mohamed & Newman 2013)
While quantitative credit controls were removed in the early 1980s, the expansion of
credit really took off in the early 1990s when substantial portfolio inflows, attracted
by high interest rates resulting from neoliberal macroeconomic policy reforms,
expanded the supply of funds for credit extension (figure 41)13. Put simply, the
features of the financial sector provided both the supply of finance, through
expanded credit, as well as the supply of financial instruments and assets, to which
current and future savings of both households and firms can be diverted. (Ashman,
Mohamed & Newman 2013)
Annual credit extension to households has roughly followed the ebb and flow of total
credit extension that has been increasing since the early 1990s. Since 2002, in the
wake of the dot-com crash, annual credit extension to households increased as a
percentage of GDP, levelling out at around 40 per cent of GDP since 2009.
Households receive around 50% of total credit extended to the private sector each
year (figure 41). The bulk of credit received by households has been mortgages.
Mortgage lending has been increasing as a share of GDP since the early 1990s. From
2003, the expansion of mortgage lending as a share of GDP accelerated, following
the trend of foreign portfolio inflows received by the banking sector (figure 42). The
expansion of mortgage lending has fuelled rapid increased in house prices in South
13The role that portfolio inflows play in the overall balance of payments under the prevailing macroeconomic
framework will be discussed further in section II.4.
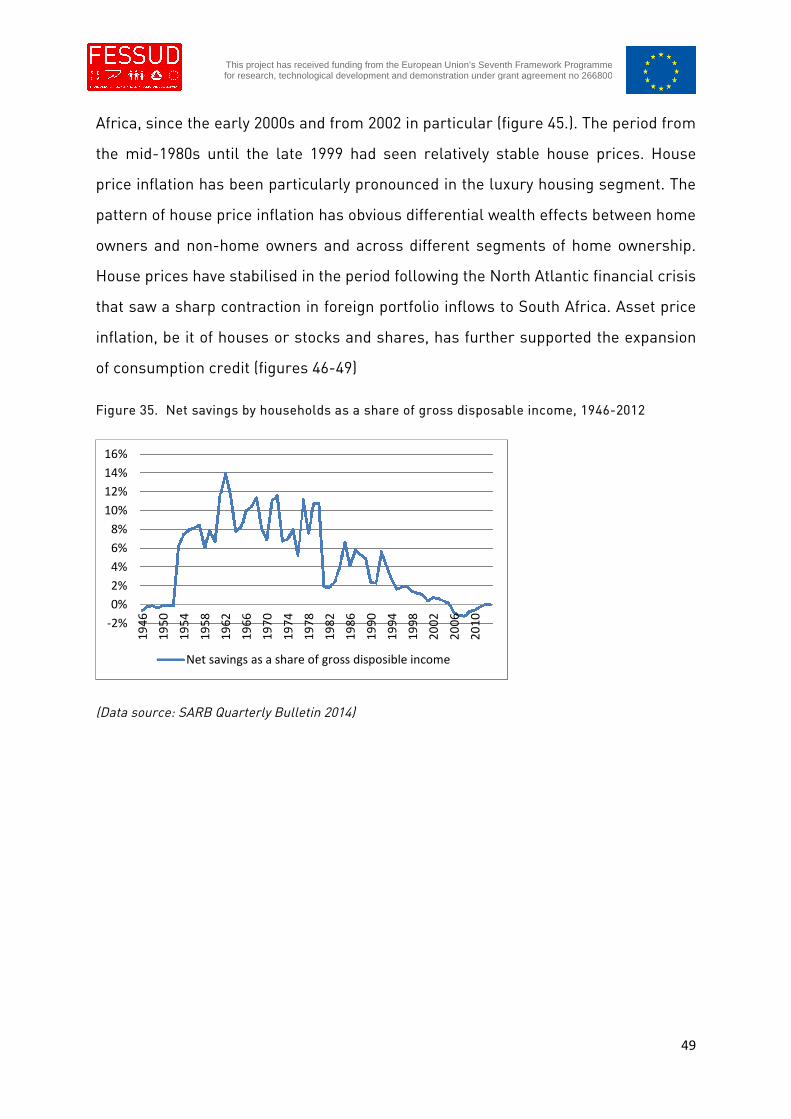
49
This project has received funding from the European Union’s Seventh Framework Programmefor research, technological development and demonstration under grant agreement no 266800
Africa, since the early 2000s and from 2002 in particular (figure 45.). The period from
the mid-1980s until the late 1999 had seen relatively stable house prices. House
price inflation has been particularly pronounced in the luxury housing segment. The
pattern of house price inflation has obvious differential wealth effects between home
owners and non-home owners and across different segments of home ownership.
House prices have stabilised in the period following the North Atlantic financial crisis
that saw a sharp contraction in foreign portfolio inflows to South Africa. Asset price
inflation, be it of houses or stocks and shares, has further supported the expansion
of consumption credit (figures 46-49)
Figure 35. Net savings by households as a share of gross disposable income, 1946-2012
(Data source: SARB Quarterly Bulletin 2014)
-2%
0%
2%
4%
6%
8%
10%
12%
14%
16%
19
46
19
50
19
54
19
58
19
62
19
66
19
70
19
74
19
78
19
82
19
86
19
90
19
94
19
98
20
02
20
06
20
10
Net savings as a share of gross disposible income
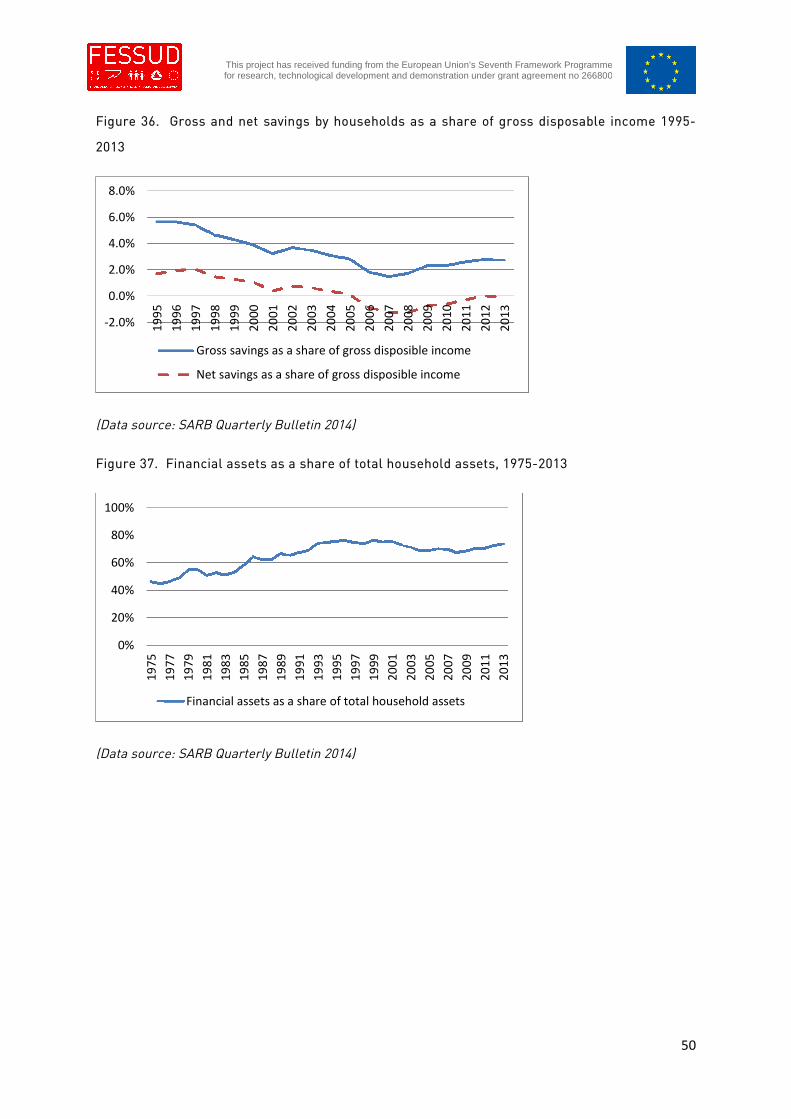
50
This project has received funding from the European Union’s Seventh Framework Programmefor research, technological development and demonstration under grant agreement no 266800
Figure 36. Gross and net savings by households as a share of gross disposable income 1995-
2013
(Data source: SARB Quarterly Bulletin 2014)
Figure 37. Financial assets as a share of total household assets, 1975-2013
(Data source: SARB Quarterly Bulletin 2014)
-2.0%
0.0%
2.0%
4.0%
6.0%
8.0%
19
95
19
96
19
97
19
98
19
99
20
00
20
01
20
02
20
03
20
04
20
05
20
06
20
07
20
08
20
09
20
10
20
11
20
12
20
13
Gross savings as a share of gross disposible income
Net savings as a share of gross disposible income
0%
20%
40%
60%
80%
100%
19
75
19
77
19
79
19
81
19
83
19
85
19
87
19
89
19
91
19
93
19
95
19
97
19
99
20
01
20
03
20
05
20
07
20
09
20
11
20
13
Financial assets as a share of total household assets
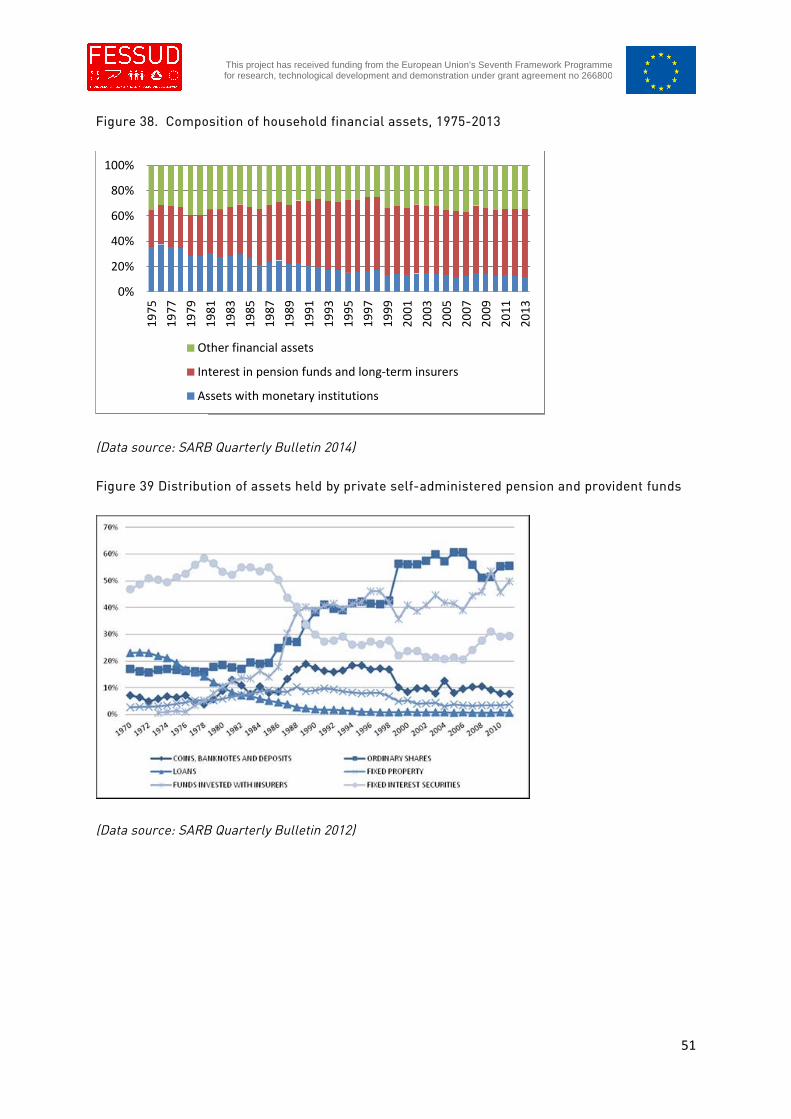
51
This project has received funding from the European Union’s Seventh Framework Programmefor research, technological development and demonstration under grant agreement no 266800
Figure 38. Composition of household financial assets, 1975-2013
(Data source: SARB Quarterly Bulletin 2014)
Figure 39 Distribution of assets held by private self-administered pension and provident funds
(Data source: SARB Quarterly Bulletin 2012)
0%
20%
40%
60%
80%
100%1
97
5
19
77
19
79
19
81
19
83
19
85
19
87
19
89
19
91
19
93
19
95
19
97
19
99
20
01
20
03
20
05
20
07
20
09
20
11
20
13
Other financial assets
Interest in pension funds and long-term insurers
Assets with monetary institutions
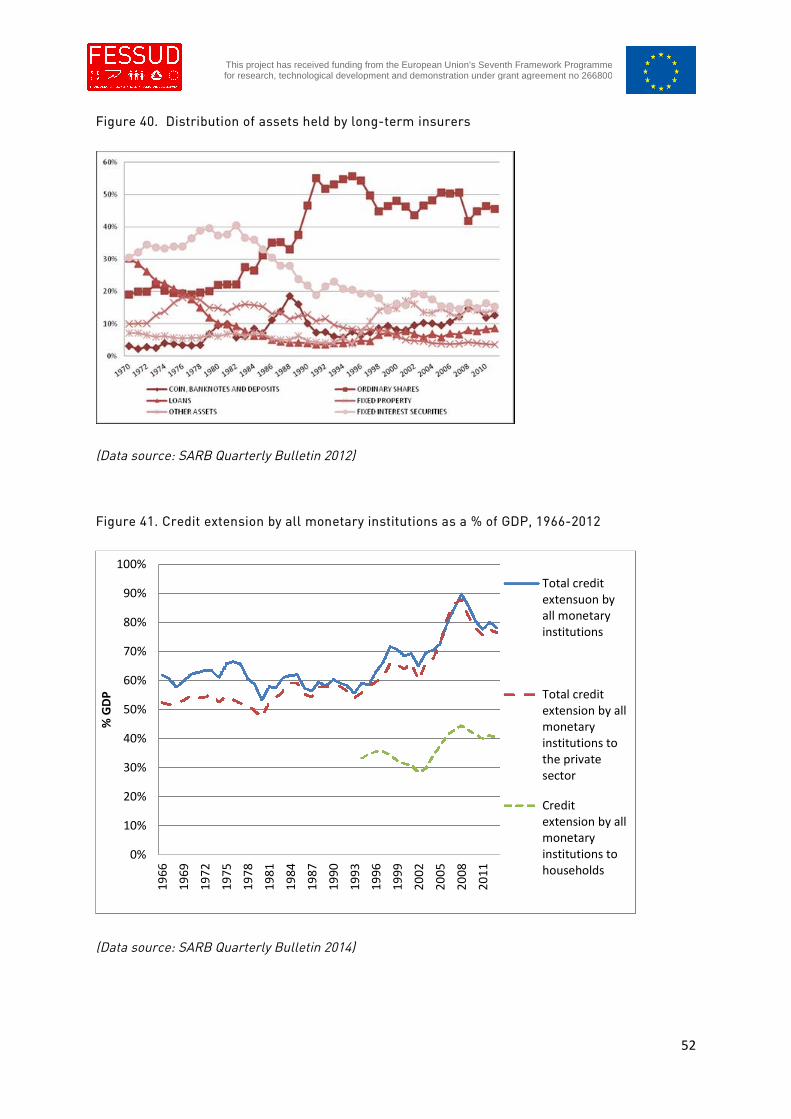
52
This project has received funding from the European Union’s Seventh Framework Programmefor research, technological development and demonstration under grant agreement no 266800
Figure 40. Distribution of assets held by long-term insurers
(Data source: SARB Quarterly Bulletin 2012)
Figure 41. Credit extension by all monetary institutions as a % of GDP, 1966-2012
(Data source: SARB Quarterly Bulletin 2014)
0%
10%
20%
30%
40%
50%
60%
70%
80%
90%
100%
19
66
19
69
19
72
19
75
19
78
19
81
19
84
19
87
19
90
19
93
19
96
19
99
20
02
20
05
20
08
20
11
%G
DP
Total creditextensuon byall monetaryinstitutions
Total creditextension by allmonetaryinstitutions tothe privatesector
Creditextension by allmonetaryinstitutions tohouseholds
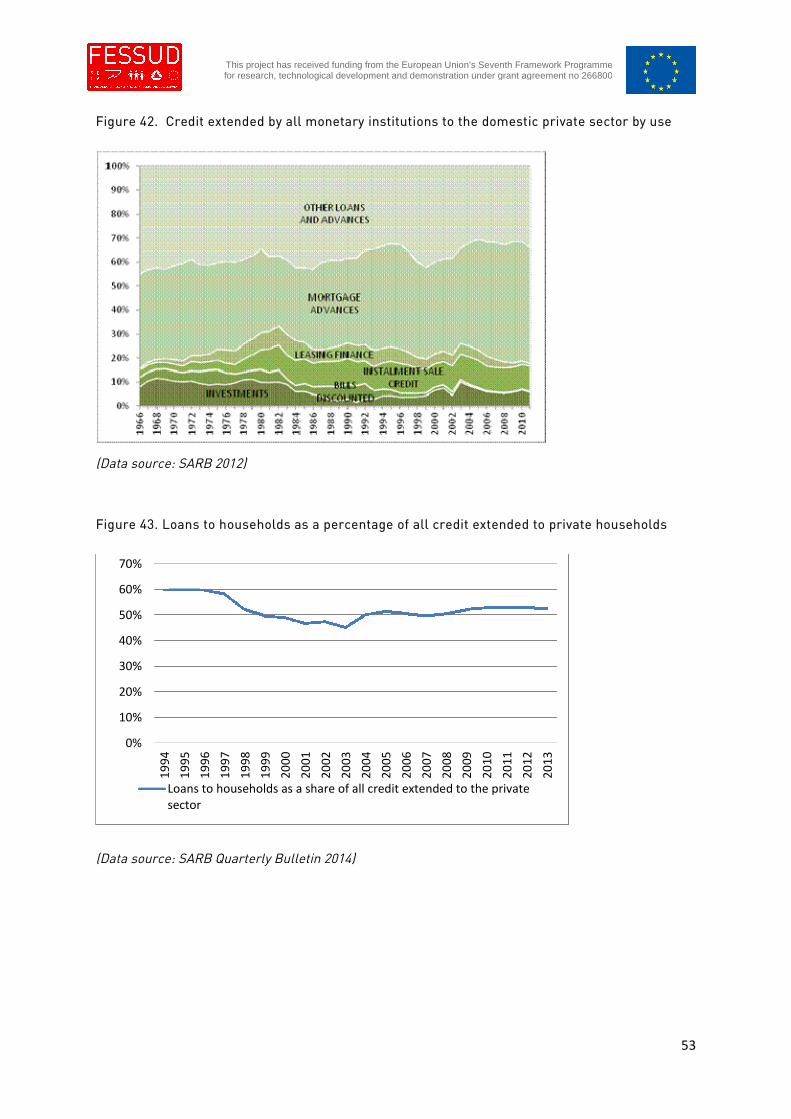
53
This project has received funding from the European Union’s Seventh Framework Programmefor research, technological development and demonstration under grant agreement no 266800
Figure 42. Credit extended by all monetary institutions to the domestic private sector by use
(Data source: SARB 2012)
Figure 43. Loans to households as a percentage of all credit extended to private households
(Data source: SARB Quarterly Bulletin 2014)
0%
10%
20%
30%
40%
50%
60%
70%
19
94
19
95
19
96
19
97
19
98
19
99
20
00
20
01
20
02
20
03
20
04
20
05
20
06
20
07
20
08
20
09
20
10
20
11
20
12
20
13
Loans to households as a share of all credit extended to the privatesector
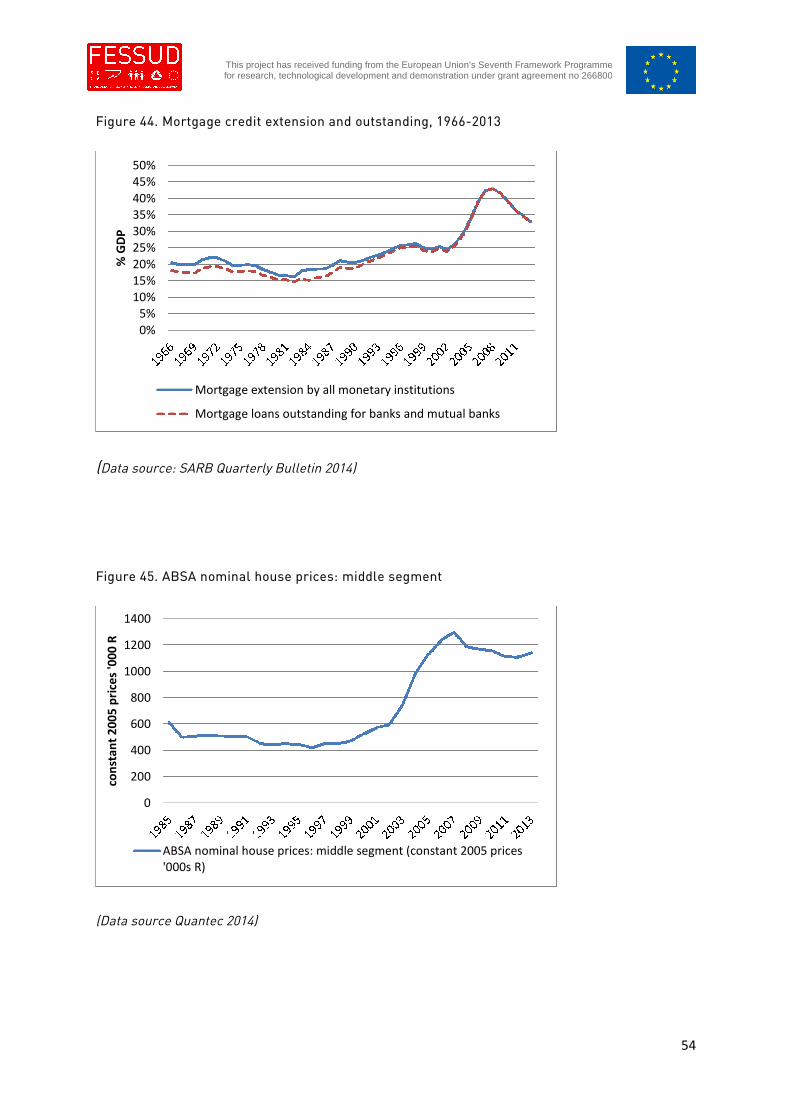
54
This project has received funding from the European Union’s Seventh Framework Programmefor research, technological development and demonstration under grant agreement no 266800
Figure 44. Mortgage credit extension and outstanding, 1966-2013
(Data source: SARB Quarterly Bulletin 2014)
Figure 45. ABSA nominal house prices: middle segment
(Data source Quantec 2014)
0%
5%10%15%20%
25%30%35%40%
45%50%
%G
DP
Mortgage extension by all monetary institutions
Mortgage loans outstanding for banks and mutual banks
0
200
400
600
800
1000
1200
1400
con
stan
t2
00
5p
rice
s'0
00
R
ABSA nominal house prices: middle segment (constant 2005 prices'000s R)
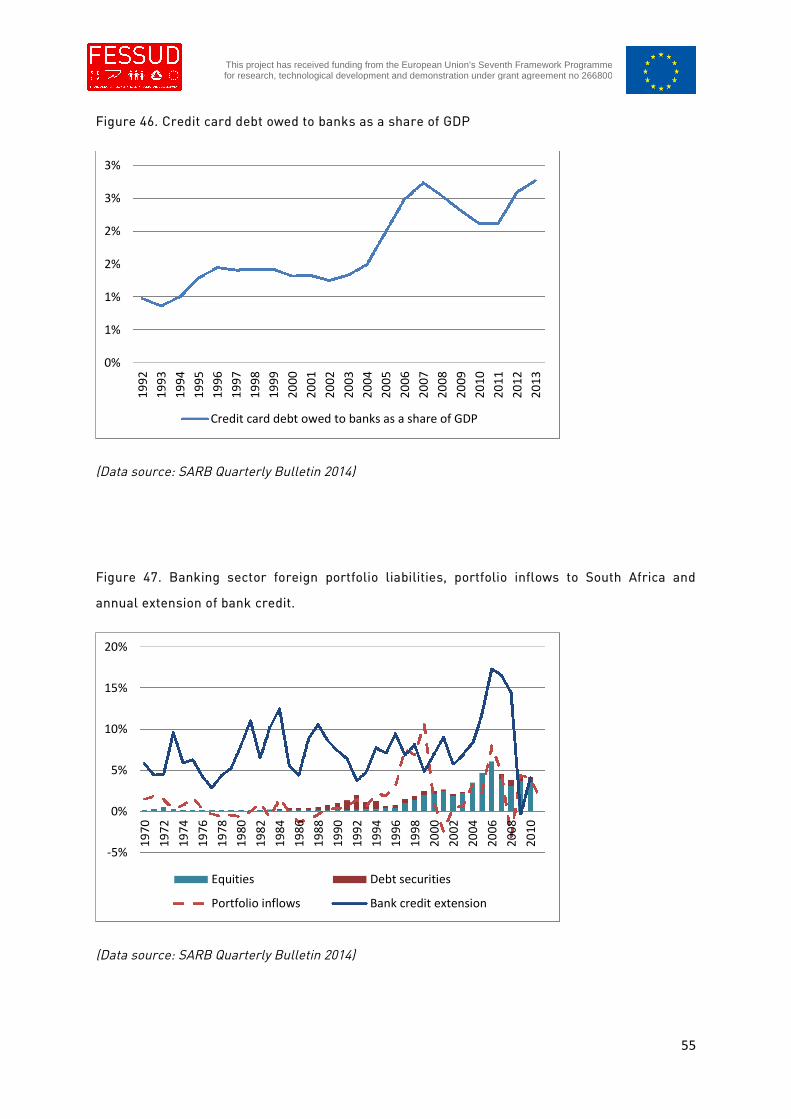
55
This project has received funding from the European Union’s Seventh Framework Programmefor research, technological development and demonstration under grant agreement no 266800
Figure 46. Credit card debt owed to banks as a share of GDP
(Data source: SARB Quarterly Bulletin 2014)
Figure 47. Banking sector foreign portfolio liabilities, portfolio inflows to South Africa and
annual extension of bank credit.
(Data source: SARB Quarterly Bulletin 2014)
0%
1%
1%
2%
2%
3%
3%
19
92
19
93
19
94
19
95
19
96
19
97
19
98
19
99
20
00
20
01
20
02
20
03
20
04
20
05
20
06
20
07
20
08
20
09
20
10
20
11
20
12
20
13
Credit card debt owed to banks as a share of GDP
-5%
0%
5%
10%
15%
20%
19
70
19
72
19
74
19
76
19
78
19
80
19
82
19
84
19
86
19
88
19
90
19
92
19
94
19
96
19
98
20
00
20
02
20
04
20
06
20
08
20
10
Equities Debt securities
Portfolio inflows Bank credit extension
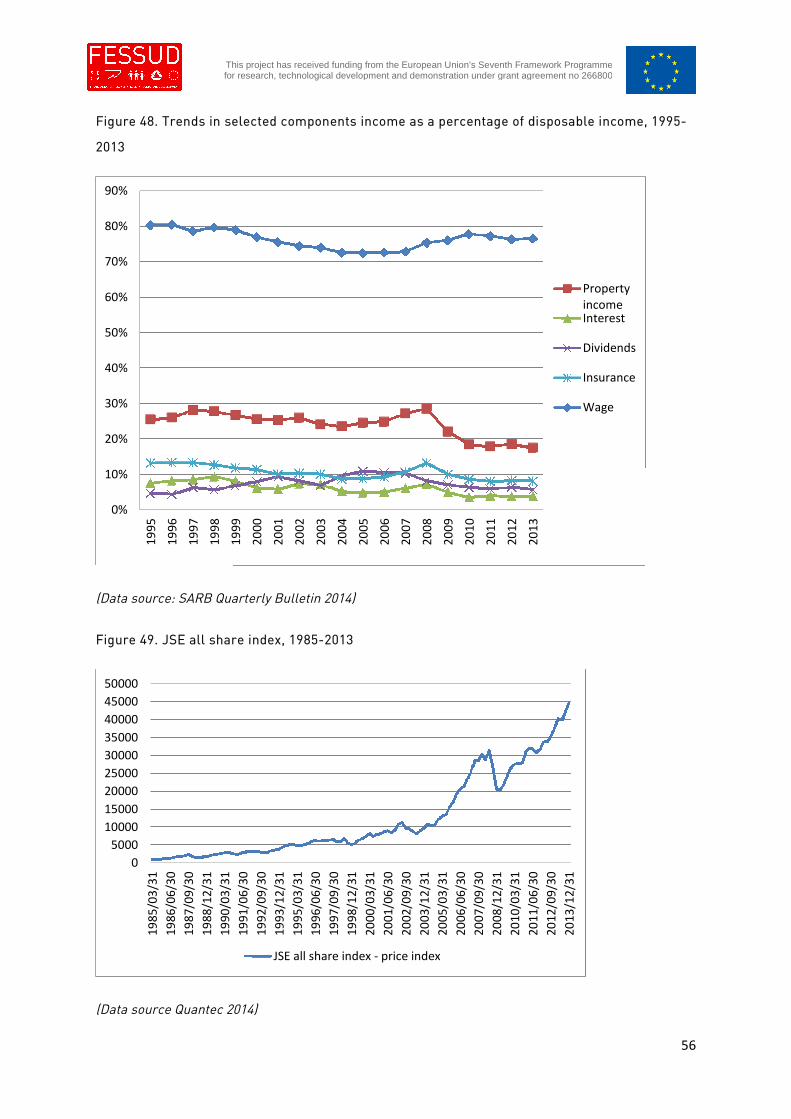
56
This project has received funding from the European Union’s Seventh Framework Programmefor research, technological development and demonstration under grant agreement no 266800
Figure 48. Trends in selected components income as a percentage of disposable income, 1995-
2013
(Data source: SARB Quarterly Bulletin 2014)
Figure 49. JSE all share index, 1985-2013
(Data source Quantec 2014)
0%
10%
20%
30%
40%
50%
60%
70%
80%
90%
19
95
19
96
19
97
19
98
19
99
20
00
20
01
20
02
20
03
20
04
20
05
20
06
20
07
20
08
20
09
20
10
20
11
20
12
20
13
PropertyincomeInterest
Dividends
Insurance
Wage
0
5000
10000
15000
20000
25000
30000
35000
40000
45000
50000
19
85
/03
/31
19
86
/06
/30
19
87
/09
/30
19
88
/12
/31
19
90
/03
/31
19
91
/06
/30
19
92
/09
/30
19
93
/12
/31
19
95
/03
/31
19
96
/06
/30
19
97
/09
/30
19
98
/12
/31
20
00
/03
/31
20
01
/06
/30
20
02
/09
/30
20
03
/12
/31
20
05
/03
/31
20
06
/06
/30
20
07
/09
/30
20
08
/12
/31
20
10
/03
/31
20
11
/06
/30
20
12
/09
/30
20
13
/12
/31
JSE all share index - price index
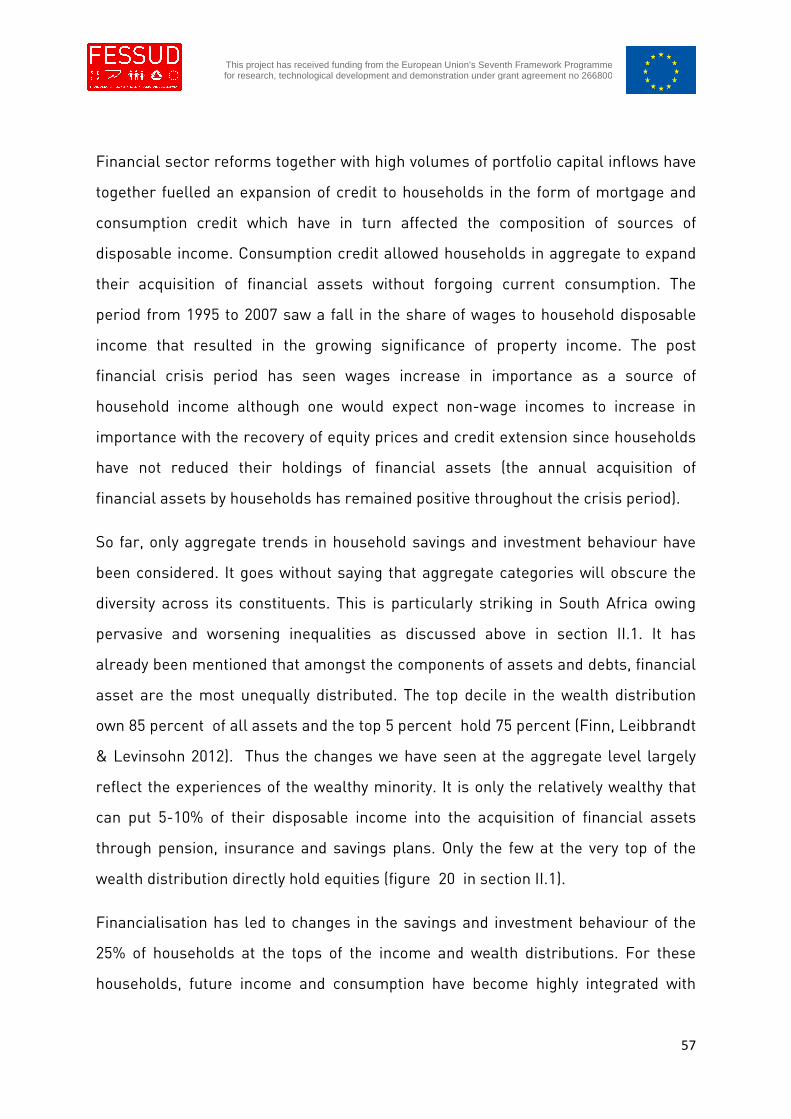
57
This project has received funding from the European Union’s Seventh Framework Programmefor research, technological development and demonstration under grant agreement no 266800
Financial sector reforms together with high volumes of portfolio capital inflows have
together fuelled an expansion of credit to households in the form of mortgage and
consumption credit which have in turn affected the composition of sources of
disposable income. Consumption credit allowed households in aggregate to expand
their acquisition of financial assets without forgoing current consumption. The
period from 1995 to 2007 saw a fall in the share of wages to household disposable
income that resulted in the growing significance of property income. The post
financial crisis period has seen wages increase in importance as a source of
household income although one would expect non-wage incomes to increase in
importance with the recovery of equity prices and credit extension since households
have not reduced their holdings of financial assets (the annual acquisition of
financial assets by households has remained positive throughout the crisis period).
So far, only aggregate trends in household savings and investment behaviour have
been considered. It goes without saying that aggregate categories will obscure the
diversity across its constituents. This is particularly striking in South Africa owing
pervasive and worsening inequalities as discussed above in section II.1. It has
already been mentioned that amongst the components of assets and debts, financial
asset are the most unequally distributed. The top decile in the wealth distribution
own 85 percent of all assets and the top 5 percent hold 75 percent (Finn, Leibbrandt
& Levinsohn 2012). Thus the changes we have seen at the aggregate level largely
reflect the experiences of the wealthy minority. It is only the relatively wealthy that
can put 5-10% of their disposable income into the acquisition of financial assets
through pension, insurance and savings plans. Only the few at the very top of the
wealth distribution directly hold equities (figure 20 in section II.1).
Financialisation has led to changes in the savings and investment behaviour of the
25% of households at the tops of the income and wealth distributions. For these
households, future income and consumption have become highly integrated with
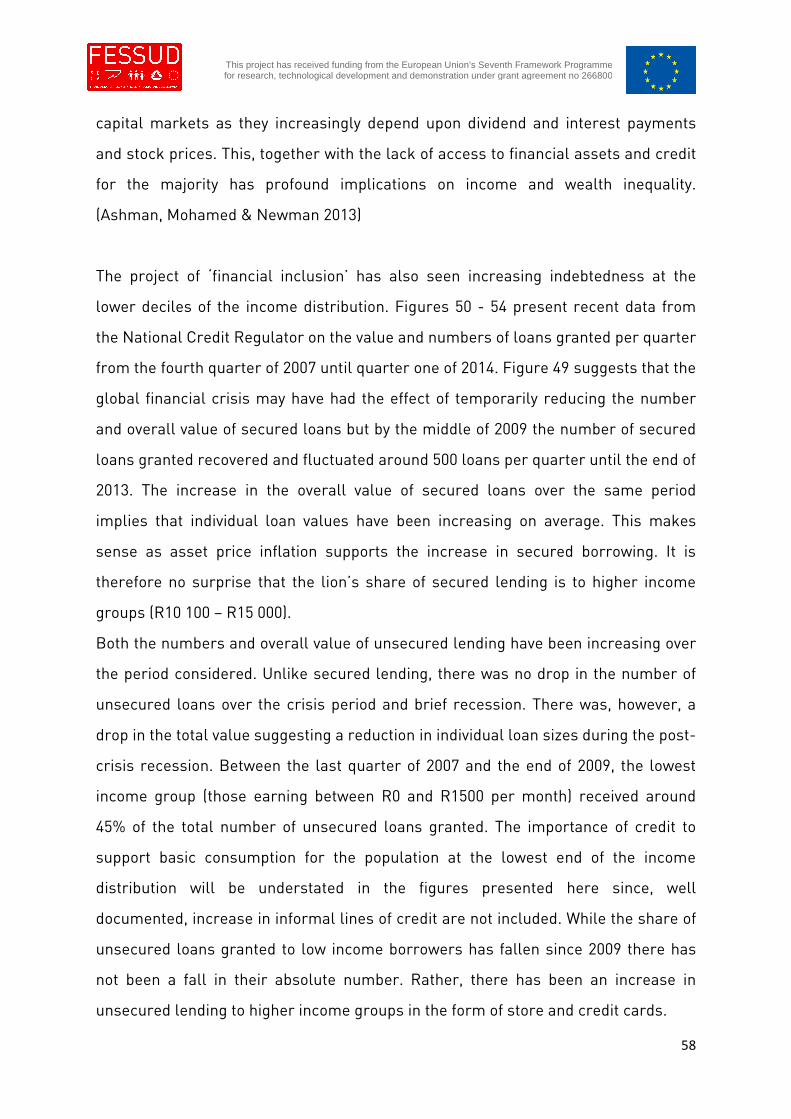
58
This project has received funding from the European Union’s Seventh Framework Programmefor research, technological development and demonstration under grant agreement no 266800
capital markets as they increasingly depend upon dividend and interest payments
and stock prices. This, together with the lack of access to financial assets and credit
for the majority has profound implications on income and wealth inequality.
(Ashman, Mohamed & Newman 2013)
The project of ‘financial inclusion’ has also seen increasing indebtedness at the
lower deciles of the income distribution. Figures 50 - 54 present recent data from
the National Credit Regulator on the value and numbers of loans granted per quarter
from the fourth quarter of 2007 until quarter one of 2014. Figure 49 suggests that the
global financial crisis may have had the effect of temporarily reducing the number
and overall value of secured loans but by the middle of 2009 the number of secured
loans granted recovered and fluctuated around 500 loans per quarter until the end of
2013. The increase in the overall value of secured loans over the same period
implies that individual loan values have been increasing on average. This makes
sense as asset price inflation supports the increase in secured borrowing. It is
therefore no surprise that the lion’s share of secured lending is to higher income
groups (R10 100 – R15 000).
Both the numbers and overall value of unsecured lending have been increasing over
the period considered. Unlike secured lending, there was no drop in the number of
unsecured loans over the crisis period and brief recession. There was, however, a
drop in the total value suggesting a reduction in individual loan sizes during the post-
crisis recession. Between the last quarter of 2007 and the end of 2009, the lowest
income group (those earning between R0 and R1500 per month) received around
45% of the total number of unsecured loans granted. The importance of credit to
support basic consumption for the population at the lowest end of the income
distribution will be understated in the figures presented here since, well
documented, increase in informal lines of credit are not included. While the share of
unsecured loans granted to low income borrowers has fallen since 2009 there has
not been a fall in their absolute number. Rather, there has been an increase in
unsecured lending to higher income groups in the form of store and credit cards.
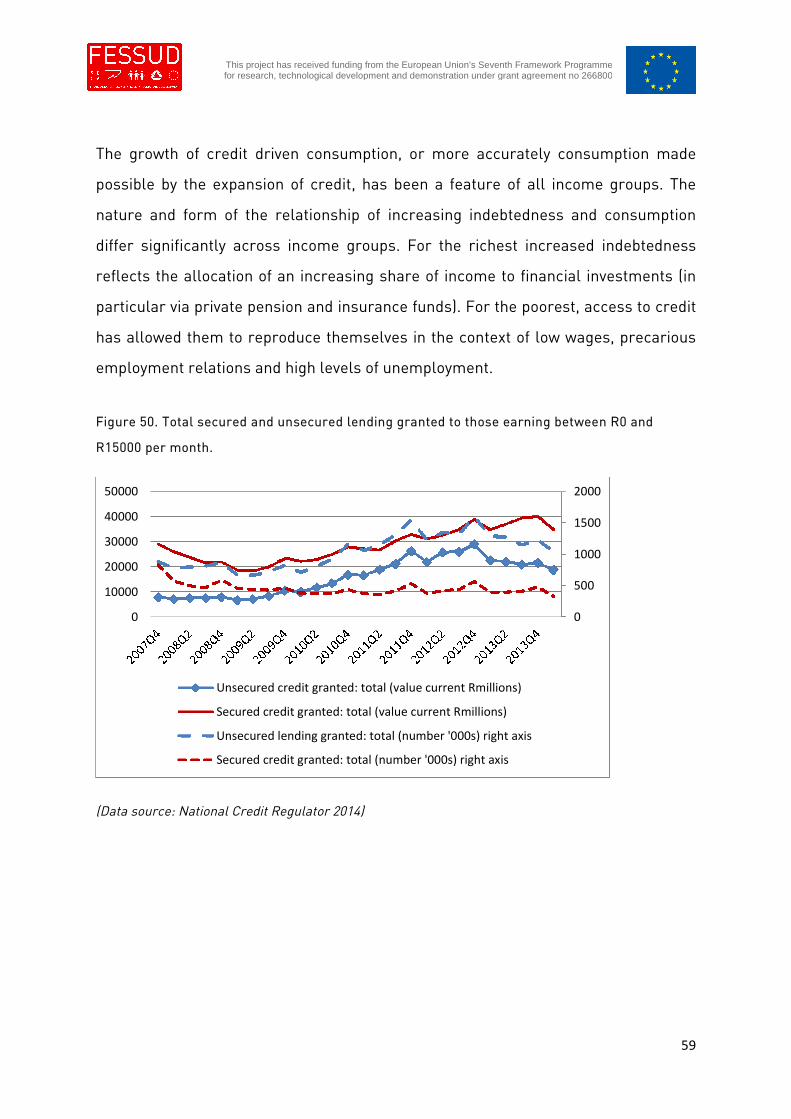
59
This project has received funding from the European Union’s Seventh Framework Programmefor research, technological development and demonstration under grant agreement no 266800
The growth of credit driven consumption, or more accurately consumption made
possible by the expansion of credit, has been a feature of all income groups. The
nature and form of the relationship of increasing indebtedness and consumption
differ significantly across income groups. For the richest increased indebtedness
reflects the allocation of an increasing share of income to financial investments (in
particular via private pension and insurance funds). For the poorest, access to credit
has allowed them to reproduce themselves in the context of low wages, precarious
employment relations and high levels of unemployment.
Figure 50. Total secured and unsecured lending granted to those earning between R0 and
R15000 per month.
(Data source: National Credit Regulator 2014)
0
500
1000
1500
2000
0
10000
20000
30000
40000
50000
Unsecured credit granted: total (value current Rmillions)
Secured credit granted: total (value current Rmillions)
Unsecured lending granted: total (number '000s) right axis
Secured credit granted: total (number '000s) right axis
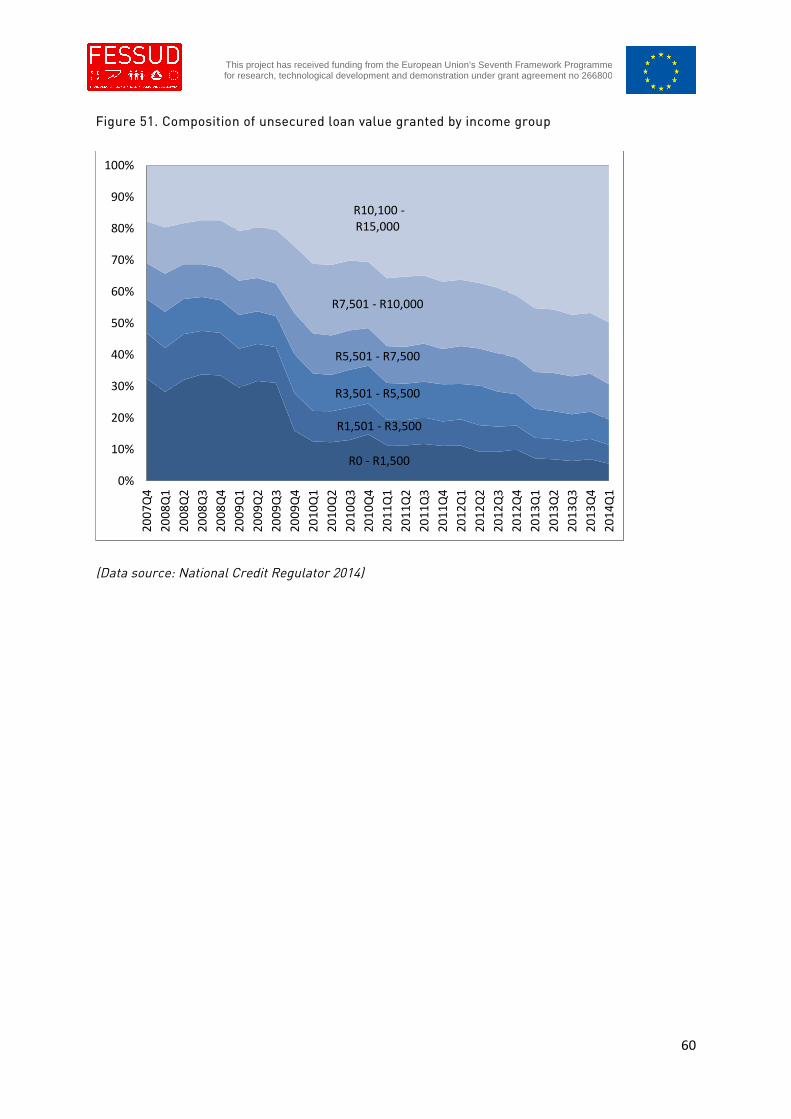
60
This project has received funding from the European Union’s Seventh Framework Programmefor research, technological development and demonstration under grant agreement no 266800
Figure 51. Composition of unsecured loan value granted by income group
(Data source: National Credit Regulator 2014)
R0 - R1,500
R1,501 - R3,500
R3,501 - R5,500
R5,501 - R7,500
R7,501 - R10,000
R10,100 -R15,000
0%
10%
20%
30%
40%
50%
60%
70%
80%
90%
100%
20
07
Q4
20
08
Q1
20
08
Q2
20
08
Q3
20
08
Q4
20
09
Q1
20
09
Q2
20
09
Q3
20
09
Q4
20
10
Q1
20
10
Q2
20
10
Q3
20
10
Q4
20
11
Q1
20
11
Q2
20
11
Q3
20
11
Q4
20
12
Q1
20
12
Q2
20
12
Q3
20
12
Q4
20
13
Q1
20
13
Q2
20
13
Q3
20
13
Q4
20
14
Q1
61
This project has received funding from the European Union’s Seventh Framework Programmefor research, technological development and demonstration under grant agreement no 266800
Figure 52. Composition of unsecured loan number granted by income group
(Data source: National Credit Regulator 2014)
R0 - R1,500
R1,501 - R3,500
R3,501 - R5,500
R5,501 - R7,500
R7,501 - R10,000
R10,100 -R15,000
0%
10%
20%
30%
40%
50%
60%
70%
80%
90%
100%
20
07
Q4
20
08
Q1
20
08
Q2
20
08
Q3
20
08
Q4
20
09
Q1
20
09
Q2
20
09
Q3
20
09
Q4
20
10
Q1
20
10
Q2
20
10
Q3
20
10
Q4
20
11
Q1
20
11
Q2
20
11
Q3
20
11
Q4
20
12
Q1
20
12
Q2
20
12
Q3
20
12
Q4
20
13
Q1
20
13
Q2
20
13
Q3
20
13
Q4
20
14
Q1
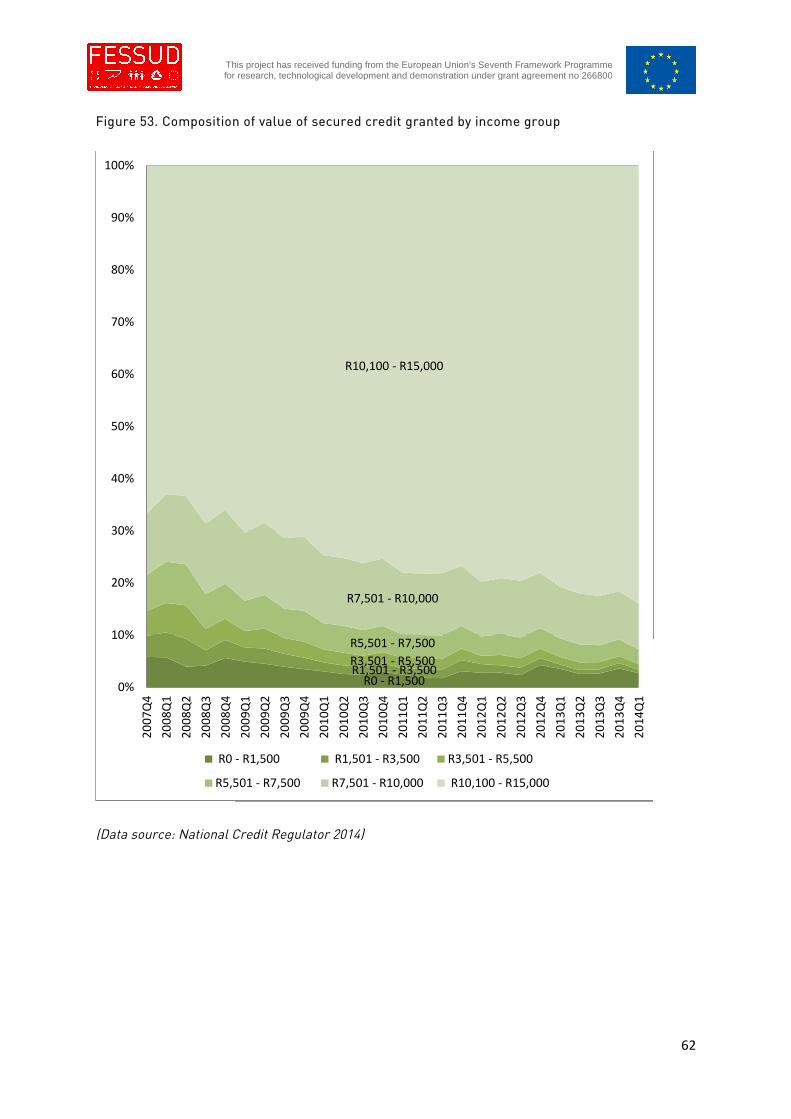
62
This project has received funding from the European Union’s Seventh Framework Programmefor research, technological development and demonstration under grant agreement no 266800
Figure 53. Composition of value of secured credit granted by income group
(Data source: National Credit Regulator 2014)
R0 - R1,500R1,501 - R3,500R3,501 - R5,500
R5,501 - R7,500
R7,501 - R10,000
R10,100 - R15,000
0%
10%
20%
30%
40%
50%
60%
70%
80%
90%
100%
20
07
Q4
20
08
Q1
20
08
Q2
20
08
Q3
20
08
Q4
20
09
Q1
20
09
Q2
20
09
Q3
20
09
Q4
20
10
Q1
20
10
Q2
20
10
Q3
20
10
Q4
20
11
Q1
20
11
Q2
20
11
Q3
20
11
Q4
20
12
Q1
20
12
Q2
20
12
Q3
20
12
Q4
20
13
Q1
20
13
Q2
20
13
Q3
20
13
Q4
20
14
Q1
R0 - R1,500 R1,501 - R3,500 R3,501 - R5,500
R5,501 - R7,500 R7,501 - R10,000 R10,100 - R15,000
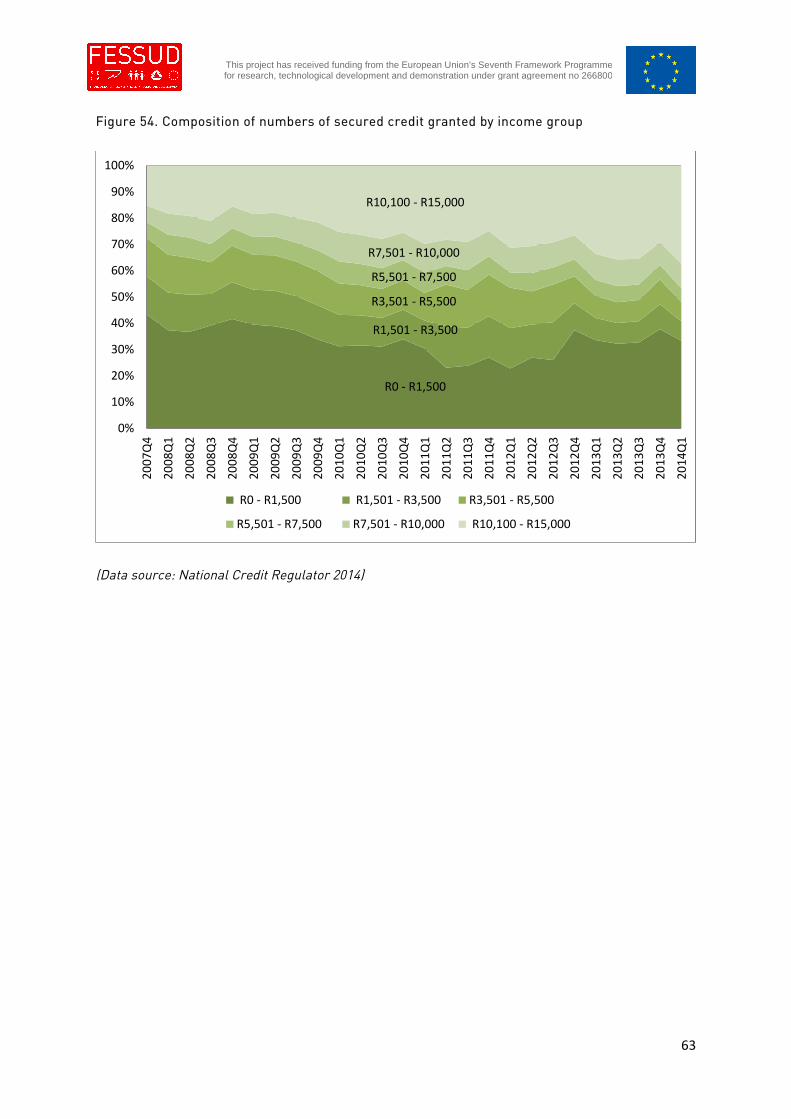
63
This project has received funding from the European Union’s Seventh Framework Programmefor research, technological development and demonstration under grant agreement no 266800
Figure 54. Composition of numbers of secured credit granted by income group
(Data source: National Credit Regulator 2014)
R0 - R1,500
R1,501 - R3,500
R3,501 - R5,500
R5,501 - R7,500
R7,501 - R10,000
R10,100 - R15,000
0%
10%
20%
30%
40%
50%
60%
70%
80%
90%
100%
20
07
Q4
20
08
Q1
20
08
Q2
20
08
Q3
20
08
Q4
20
09
Q1
20
09
Q2
20
09
Q3
20
09
Q4
20
10
Q1
20
10
Q2
20
10
Q3
20
10
Q4
20
11
Q1
20
11
Q2
20
11
Q3
20
11
Q4
20
12
Q1
20
12
Q2
20
12
Q3
20
12
Q4
20
13
Q1
20
13
Q2
20
13
Q3
20
13
Q4
20
14
Q1
R0 - R1,500 R1,501 - R3,500 R3,501 - R5,500
R5,501 - R7,500 R7,501 - R10,000 R10,100 - R15,000
64
This project has received funding from the European Union’s Seventh Framework Programmefor research, technological development and demonstration under grant agreement no 266800
II.4 Financialisation and the current account
Figure 54 shows the evolution of the balance on the current and capital account.
South Africa ran a current account surplus from 1985 until 1993. During this period
there was a sustained outflow of capital seeking a safe haven from the political and
economic instability and uncertainty that pervaded South Africa. During this time, it
was necessary to ensure a surplus on the current account to fund the outflow.
Imports were decreased and exports encouraged. Moreover, foreign reserves were
also deployed to meet the challenge of this sustained outflow. In addition to official
outflows of capital, capital flight has been a constant feature in South Africa’s capital
flows. Mohamed and Finnoff (2005) estimated that capital flight as percentage of
GDP increased from an average of 5.4 per cent a year between 1980 and 1993 to 9.2
per cent between 1994 and 2000. Ashman et al. (2011) calculated that there was a
further increase in capital flight as percentage of GDP to 12 per cent on average
between 2001 and 2007. The initial years since 1994 saw positive growth rates in both
exports and imports, the latter growing more rapidly. Net exports peeked in 2001,
following a contraction in imports in 1999 and little growth in 2000. Since then, net
exports has been in decline, becoming negative from 2004. Imports have continued
to be greater than exports since 2004.
As in the case of many economies (both advanced capitalist and emerging), the
relaxing of capital account regulation in South Africa in 1994 has permitted and
financed persistent and growing current account deficits. High interest rates in
South Africa have attracted substantial short-term inflows as part of an increasing
trend in carry-trade from advanced economies where interest rates have been low
(figure 58). Exchange controls have been further relaxed in the period 2009-2012
which meant that the contraction in portfolio inflows in the wake of the global
financial crisis was brief compared with the effects of the dot-com crash (Table 3).
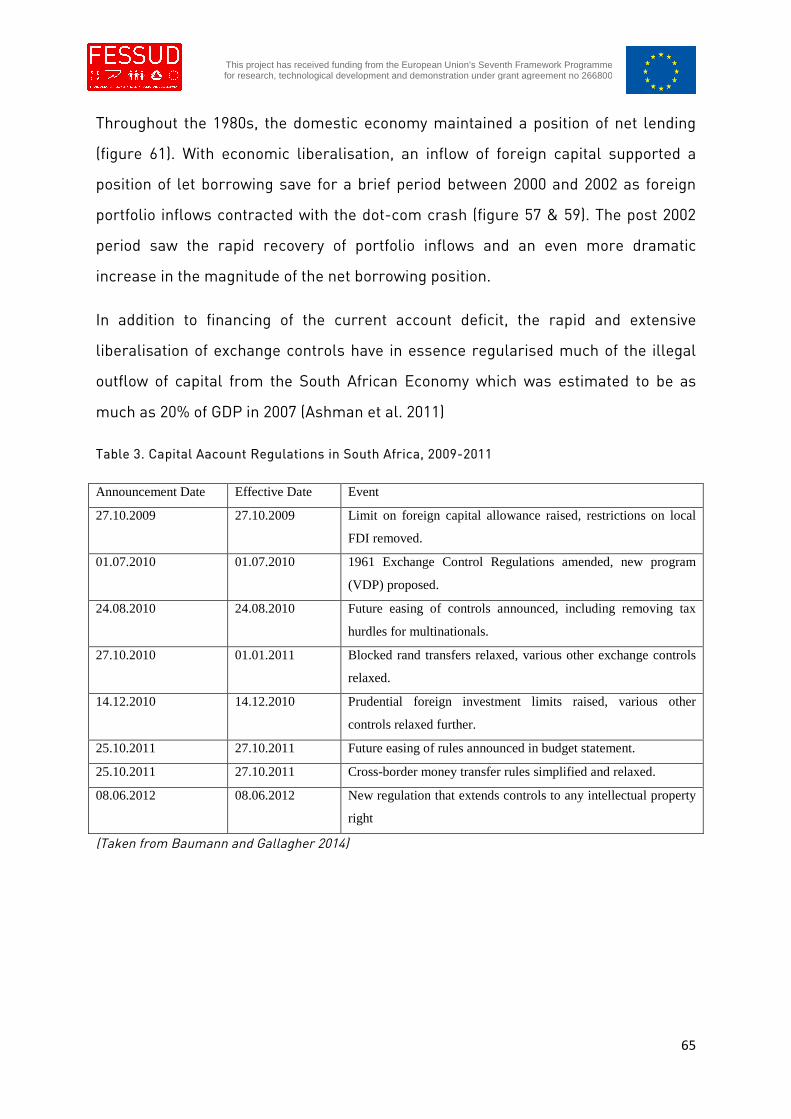
65
This project has received funding from the European Union’s Seventh Framework Programmefor research, technological development and demonstration under grant agreement no 266800
Throughout the 1980s, the domestic economy maintained a position of net lending
(figure 61). With economic liberalisation, an inflow of foreign capital supported a
position of let borrowing save for a brief period between 2000 and 2002 as foreign
portfolio inflows contracted with the dot-com crash (figure 57 & 59). The post 2002
period saw the rapid recovery of portfolio inflows and an even more dramatic
increase in the magnitude of the net borrowing position.
In addition to financing of the current account deficit, the rapid and extensive
liberalisation of exchange controls have in essence regularised much of the illegal
outflow of capital from the South African Economy which was estimated to be as
much as 20% of GDP in 2007 (Ashman et al. 2011)
Table 3. Capital Aacount Regulations in South Africa, 2009-2011
Announcement Date Effective Date Event
27.10.2009 27.10.2009 Limit on foreign capital allowance raised, restrictions on local
FDI removed.
01.07.2010 01.07.2010 1961 Exchange Control Regulations amended, new program
(VDP) proposed.
24.08.2010 24.08.2010 Future easing of controls announced, including removing tax
hurdles for multinationals.
27.10.2010 01.01.2011 Blocked rand transfers relaxed, various other exchange controls
relaxed.
14.12.2010 14.12.2010 Prudential foreign investment limits raised, various other
controls relaxed further.
25.10.2011 27.10.2011 Future easing of rules announced in budget statement.
25.10.2011 27.10.2011 Cross-border money transfer rules simplified and relaxed.
08.06.2012 08.06.2012 New regulation that extends controls to any intellectual property
right
(Taken from Baumann and Gallagher 2014)
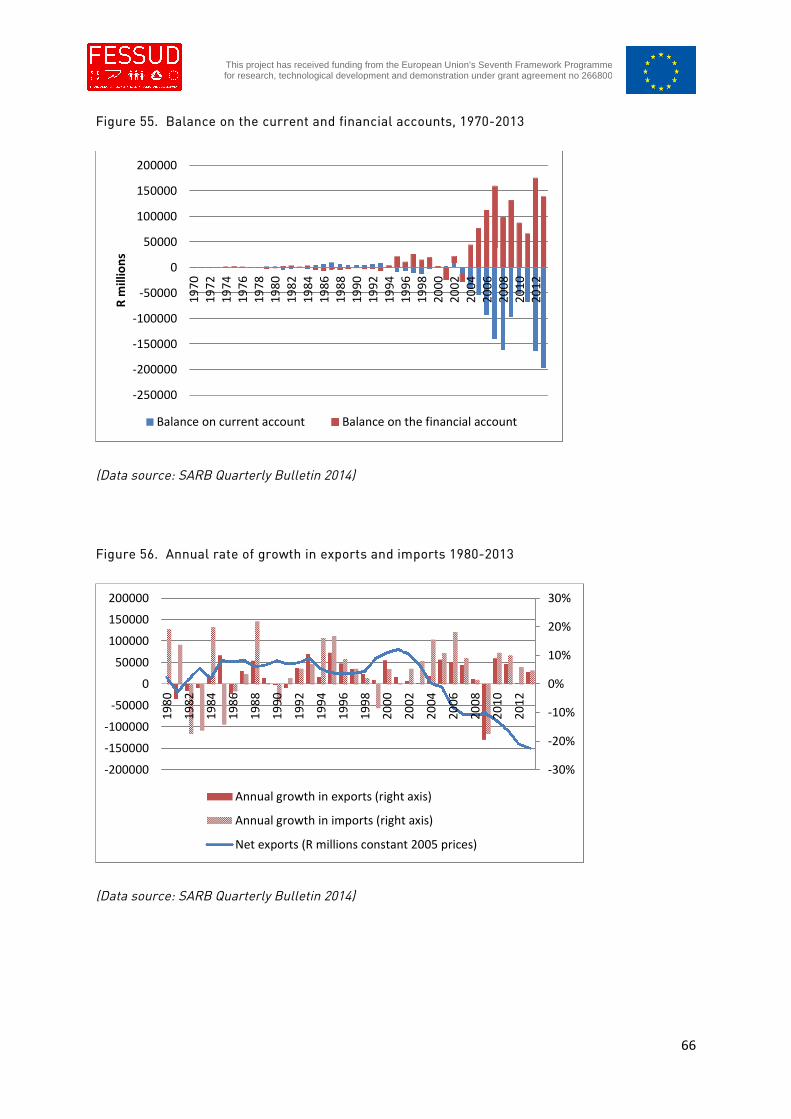
66
This project has received funding from the European Union’s Seventh Framework Programmefor research, technological development and demonstration under grant agreement no 266800
Figure 55. Balance on the current and financial accounts, 1970-2013
(Data source: SARB Quarterly Bulletin 2014)
Figure 56. Annual rate of growth in exports and imports 1980-2013
(Data source: SARB Quarterly Bulletin 2014)
-250000
-200000
-150000
-100000
-50000
0
50000
100000
150000
200000
19
70
19
72
19
74
19
76
19
78
19
80
19
82
19
84
19
86
19
88
19
90
19
92
19
94
19
96
19
98
20
00
20
02
20
04
20
06
20
08
20
10
20
12
Rm
illio
ns
Balance on current account Balance on the financial account
-30%
-20%
-10%
0%
10%
20%
30%
-200000
-150000
-100000
-50000
0
50000
100000
150000
200000
19
80
19
82
19
84
19
86
19
88
19
90
19
92
19
94
19
96
19
98
20
00
20
02
20
04
20
06
20
08
20
10
20
12
Annual growth in exports (right axis)
Annual growth in imports (right axis)
Net exports (R millions constant 2005 prices)
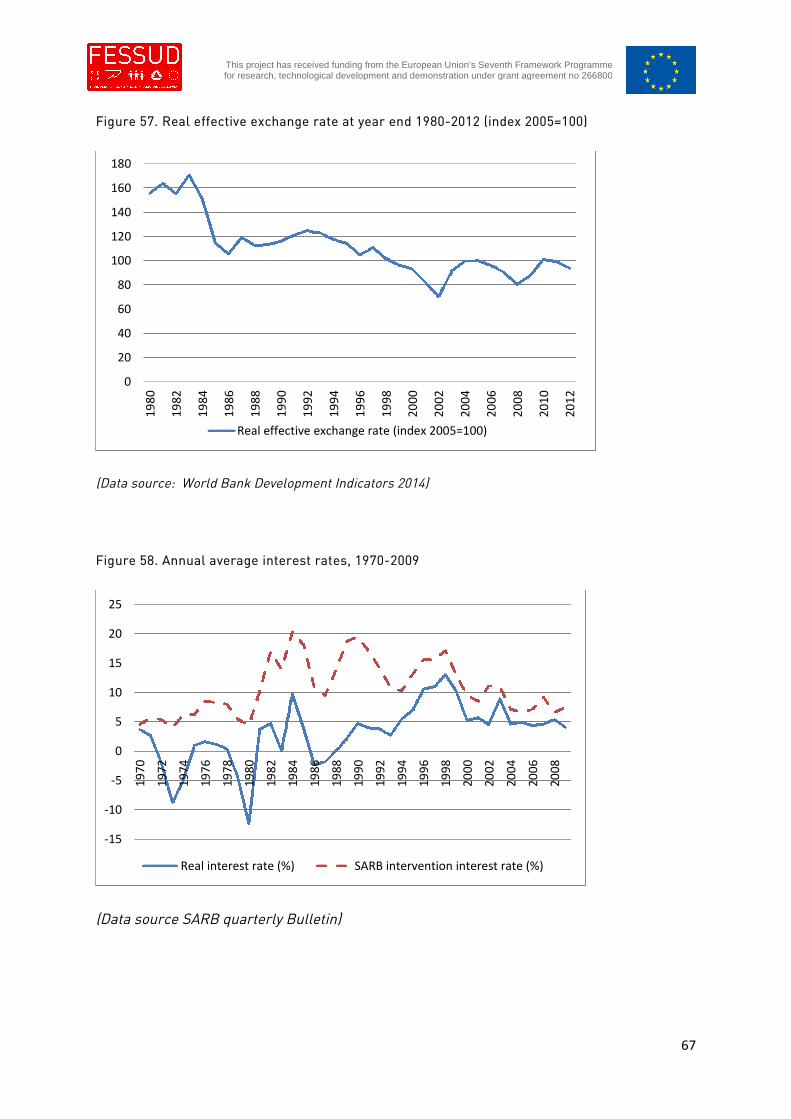
67
This project has received funding from the European Union’s Seventh Framework Programmefor research, technological development and demonstration under grant agreement no 266800
Figure 57. Real effective exchange rate at year end 1980-2012 (index 2005=100)
(Data source: World Bank Development Indicators 2014)
Figure 58. Annual average interest rates, 1970-2009
(Data source SARB quarterly Bulletin)
0
20
40
60
80
100
120
140
160
1801
98
0
19
82
19
84
19
86
19
88
19
90
19
92
19
94
19
96
19
98
20
00
20
02
20
04
20
06
20
08
20
10
20
12
Real effective exchange rate (index 2005=100)
-15
-10
-5
0
5
10
15
20
25
19
70
19
72
19
74
19
76
19
78
19
80
19
82
19
84
19
86
19
88
19
90
19
92
19
94
19
96
19
98
20
00
20
02
20
04
20
06
20
08
Real interest rate (%) SARB intervention interest rate (%)
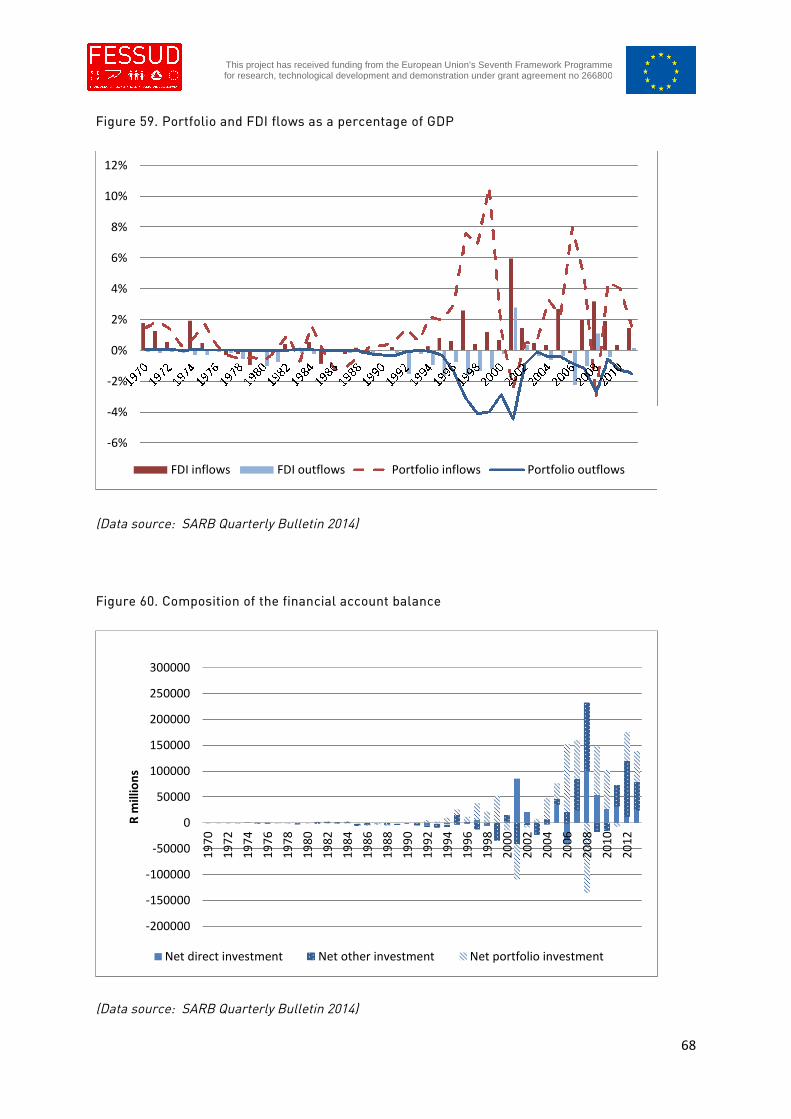
68
This project has received funding from the European Union’s Seventh Framework Programmefor research, technological development and demonstration under grant agreement no 266800
Figure 59. Portfolio and FDI flows as a percentage of GDP
(Data source: SARB Quarterly Bulletin 2014)
Figure 60. Composition of the financial account balance
(Data source: SARB Quarterly Bulletin 2014)
-6%
-4%
-2%
0%
2%
4%
6%
8%
10%
12%
FDI inflows FDI outflows Portfolio inflows Portfolio outflows
-200000
-150000
-100000
-50000
0
50000
100000
150000
200000
250000
300000
19
70
19
72
19
74
19
76
19
78
19
80
19
82
19
84
19
86
19
88
19
90
19
92
19
94
19
96
19
98
20
00
20
02
20
04
20
06
20
08
20
10
20
12
Rm
illio
ns
Net direct investment Net other investment Net portfolio investment
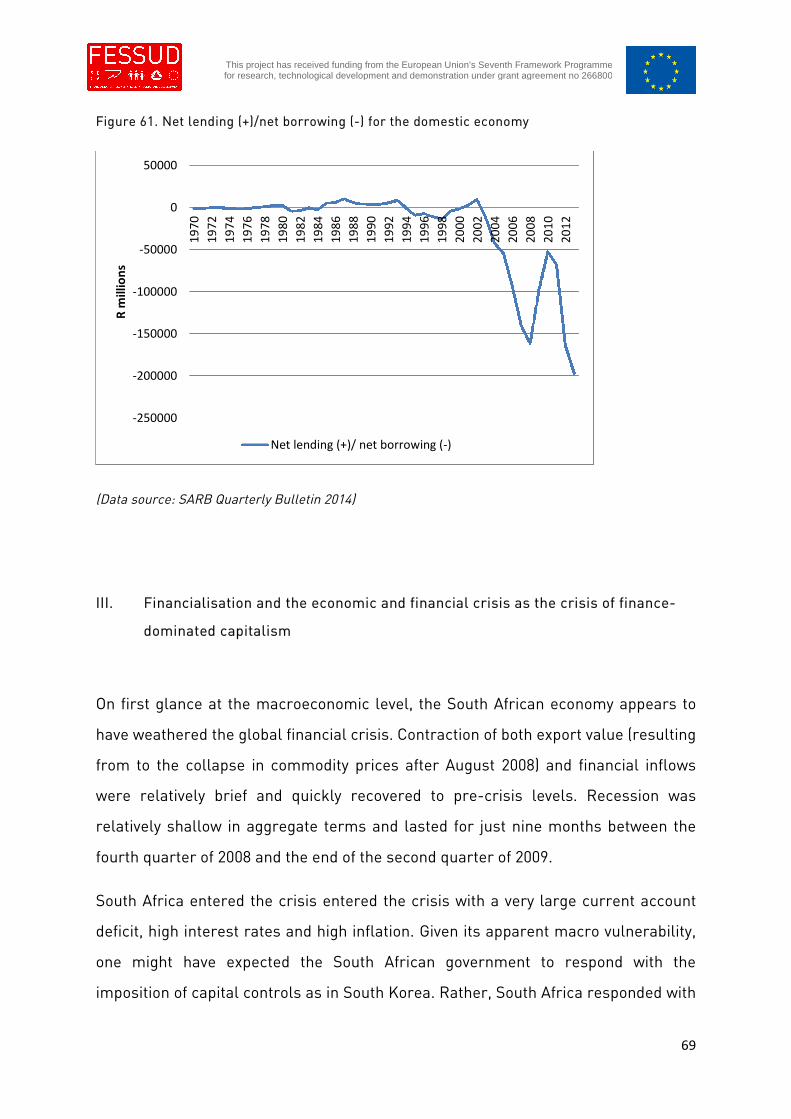
69
This project has received funding from the European Union’s Seventh Framework Programmefor research, technological development and demonstration under grant agreement no 266800
Figure 61. Net lending (+)/net borrowing (-) for the domestic economy
(Data source: SARB Quarterly Bulletin 2014)
III. Financialisation and the economic and financial crisis as the crisis of finance-
dominated capitalism
On first glance at the macroeconomic level, the South African economy appears to
have weathered the global financial crisis. Contraction of both export value (resulting
from to the collapse in commodity prices after August 2008) and financial inflows
were relatively brief and quickly recovered to pre-crisis levels. Recession was
relatively shallow in aggregate terms and lasted for just nine months between the
fourth quarter of 2008 and the end of the second quarter of 2009.
South Africa entered the crisis entered the crisis with a very large current account
deficit, high interest rates and high inflation. Given its apparent macro vulnerability,
one might have expected the South African government to respond with the
imposition of capital controls as in South Korea. Rather, South Africa responded with
-250000
-200000
-150000
-100000
-50000
0
50000
19
70
19
72
19
74
19
76
19
78
19
80
19
82
19
84
19
86
19
88
19
90
19
92
19
94
19
96
19
98
20
00
20
02
20
04
20
06
20
08
20
10
20
12
Rm
illio
ns
Net lending (+)/ net borrowing (-)
70
This project has received funding from the European Union’s Seventh Framework Programmefor research, technological development and demonstration under grant agreement no 266800
the further opening up of the current account. (Baumann & Gallagher 2013) This
response is entirely consistent with the neoliberal framework that has informed
South African macroeconomic policy since 1994.
Macroeconomic policy since the democratic rule has been shaped by the neoliberal
macro framework of the ironically named Growth Employment and Redistribution
(GEAR) program. GEAR has been likened to a home spun structural adjustment
program, focussing on the reduction of government deficit, central bank
independence and inflation targeting and liberalisation of the current and capital
accounts. The effect of GEAR and regulatory reforms, capital account liberalisation
in particular, since has been the overwhelming support of the largely unproductive
financial sector to the detriment of the real economy. It was the prevailing macro-
conditions and nature of financialisation that shaped South Africa’s experience of the
global financial crisis.
That the South African economy has emerged from the global financial crisis
relatively unscathed has been attributed to its ‘sound’ macroeconomic policies that
included honouring pre-crisis commitments for capital spends related to large
infrastructure projects that helped to prop up overall investment levels in spite of a
contraction in private sector investment. The further opening up of the capital
account and continued high interest rates (that now reflected a higher risk premium)
acted to accelerate the recovery of short-term portfolio inflows into the financial
sector and in turn the allowed for the expansion of credit. Such an explanation,
however obscures the uneven impact of the crisis across the economy.
Financialisation in South Africa has created certain vulnerabilities and not others.
As seen above, the financialisation of the South African economy has both involved
and created further contradictions and conflict between the financial sector and the
real economy with the former winning out in its influence over the pace and form of
accumulation and implications for social provision and greater divisions between
income groups.
71
This project has received funding from the European Union’s Seventh Framework Programmefor research, technological development and demonstration under grant agreement no 266800
Unlike the financialised economies of the global north, the financial sector hardly
took a hit. The banks survived without the need for bailouts and JSE saw some
contraction but was largely resilient. Employment in FIRE sectors dipped slightly
between 2008 and 2010 but has recovered since. The South African economy has
relatively little exposure to US toxic assets. Liberalisation resulted in capital flight
and short-term inflows rather than the expansion in investment by domestic actors
on US markets thus limiting the exposure of the South African financial sector to
toxic US assets. There has been little securitisation of banking sector assets, in
2007, only 3% of mortgages were securitised. As already discussed, financialisation
has been fuelled by capital inflows. The reliance on short-term capital inflows saw
South Africa enacting further liberalisation in response to the crisis in contrast to the
majority of emerging market economies. This has had a negative effect on exchange
rate volatility and hence export performance of non-mining sectors.
By contrast, manufacturing took a much harder hit and has failed to recover. As
already discussed above, financialisation contributed to the long-run decline in
manufacturing in South Africa. Manufacturing output in the first quarter of 2009
declined by 12.8 per cent (compared with a 6.8 per cent decline in GDP overall).
Other sectors that saw similar contractions included retail and wholesale trade.
484000 workers lost their jobs in the third quarter of 2009, 150000 of these were
from manufacturing. Employment in manufacturing has not recovered since (figure
62).
To summarise, the relatively low levels of securitisation and limited exposure to
toxic US assets meant that contagion effects from international financial markets
were few. The main transmission mechanisms have been through a contraction of
export value from falling commodity prices and a contraction in portfolio inflows that
led to a credit squeeze that had a disproportionately negative effect on
manufacturing industries that have on the whole failed to recover. The financial
sector benefited from further capital account liberalisation that financed a rapid
recovery in credit extension that has led to a recovery in consumption and therefore
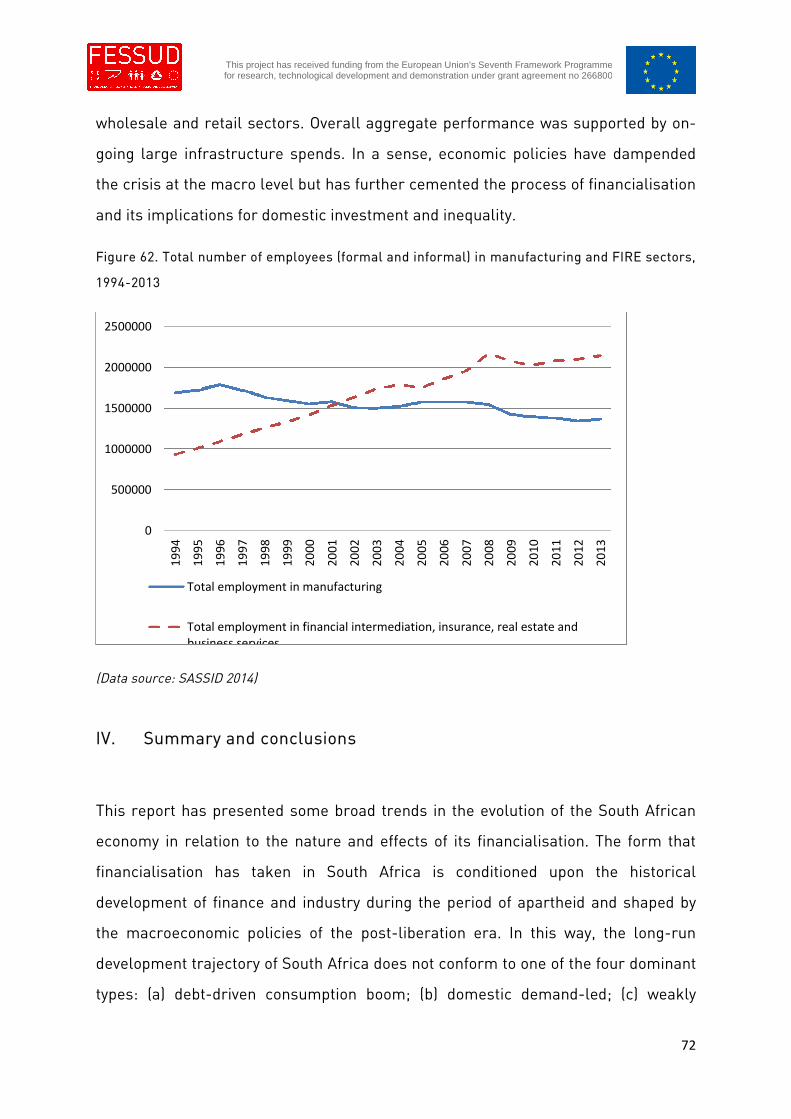
72
This project has received funding from the European Union’s Seventh Framework Programmefor research, technological development and demonstration under grant agreement no 266800
wholesale and retail sectors. Overall aggregate performance was supported by on-
going large infrastructure spends. In a sense, economic policies have dampended
the crisis at the macro level but has further cemented the process of financialisation
and its implications for domestic investment and inequality.
Figure 62. Total number of employees (formal and informal) in manufacturing and FIRE sectors,
1994-2013
(Data source: SASSID 2014)
IV. Summary and conclusions
This report has presented some broad trends in the evolution of the South African
economy in relation to the nature and effects of its financialisation. The form that
financialisation has taken in South Africa is conditioned upon the historical
development of finance and industry during the period of apartheid and shaped by
the macroeconomic policies of the post-liberation era. In this way, the long-run
development trajectory of South Africa does not conform to one of the four dominant
types: (a) debt-driven consumption boom; (b) domestic demand-led; (c) weakly
0
500000
1000000
1500000
2000000
2500000
19
94
19
95
19
96
19
97
19
98
19
99
20
00
20
01
20
02
20
03
20
04
20
05
20
06
20
07
20
08
20
09
20
10
20
11
20
12
20
13
Total employment in manufacturing
Total employment in financial intermediation, insurance, real estate andbusiness services
73
This project has received funding from the European Union’s Seventh Framework Programmefor research, technological development and demonstration under grant agreement no 266800
export-led; or (d) export-led mercantilist). Rather, South Africa’s growth trajectory is
characterised by a combination of these processes that different in relative
importance at different times. Growth in the 1960s and 70s were largely driven by
domestic investment and consumption. The crisis of the 1980s saw considerable
divestment and an overall reduction in investment. The 1990s saw and increase in
the importance of exports as a key driver of growth and the period since 2000 has
seen consumption lead growth driven by debt and an increasing significance in gross
capital formation attached to large infrastructural investment programmes,
Paradoxically, the period of majority rule has seen worsening inequality in the
income and wealth distributions. At the top of the income distribution this is driven in
part by the increases income derived from financial assets an asset inflation and the
highly unequal distribution of financial assets across income groups. Unemployment
is a major factor for income inequality and this has its roots in the structure of the
economy and de-industrialisation associated with financialisation. Wage inequality is
the main driver of inequality in South Africa. Again, its association with
financialisation comes from corporate restructuring associated with financialisation,
namely downsizing and outsourcing of non-key functions and increasingly
precarious employment standards and high levels of informality that place
downward pressures on wages for low-skilled jobs.
Non-financial coporations in South Africa have been acquiring high levels of financial
assets in lieu of productive investment since the 1980s, prior to the period of
financialisation, as a result of political and economic uncertainty. Since 1994, fixed
investment has recovered somewhat but with no commensurate reduction in
financial envestment. Non-financial corporations in South Africa use banks and
capital markets to increase their financial and speculative positions. Evidence
presented suggests that the share-holder preference channel is relatively weak.
There is an evident preference by firms for financial investments generating short-
term returns.
74
This project has received funding from the European Union’s Seventh Framework Programmefor research, technological development and demonstration under grant agreement no 266800
The relationship between financialisation and consumption varies across income
groups. In aggregate, consumption as a share of GDP has been relatively stable,
fluctuating between 60 and 65 per cent. At the same time, as a share household
disposable income has been declining dramatically. At the top of the income
distribution these trends can be explained by the substitution of savings for
increased financial investment in the provision for future unexpected expenditures
and old age and the use of credit to finance current consumption. There has been
increasing levels of indebtedness at all levels of the income distribution. At the
upper deciles of the income distribution this is related to mortgage and consumption
loans. The poor have also increased their reliance on credit for consumption but this
has been driven by high levels of unemployment, precarious employment relations
and unstable incomes.
South Africa has been running a persistently large current account deficit since the
late 1990 which has been financed by massive capital inflows attracted by high
domestic interest rates. Capital account liberalisation in South Africa has resulted in
capital flight and the expansion of short-term portfolio inflows that have financed
short-term credit expansion by the banking sector.
The global financial crisis had the initial effect of a contraction in export value, but
more importantly a sharp contraction in portfolio inflows and hence a squeeze on
credit that had the immediate impact of contraction in manufacturing and wholesale
and retail trade sectors. While further relaxing of capital controls saw rapid recovery
in financial flows, manufacturing has not recovered. This has had the effect of
shifting the distribution of employment for low and medium skilled workers towards
lower paid service sectors. South Africa did not suffer contagion effects owing to its
relatively low exposure to toxic US assets and low levels of securitisation.
75
This project has received funding from the European Union’s Seventh Framework Programmefor research, technological development and demonstration under grant agreement no 266800
References
Ashman, S., Mohamed, S. & Newman, S. (2013) “The financialisation of the South
African economy and its impact on economic growth and employment”, paper
prepared for UNDESA Project: Strengthening National Capacities to Design
and Implement Development Strategies for Inclusive, Equitable Growth and
Sustainable Development Project.
Ashman, Samantha, Ben Fine, and Susan Newman (2011) “Amnesty International?
The Nature, Scale and Impact of Capital Flight from South Africa”, Journal of
Southern African Studies, 37 (1), pp. 7-25.
Baumann, B. and Gallagher, K. (2013) “Post-Crisis Capital Account Regulation in
South Korea and South Africa”, PERI Working Paper Series, no. 320
Daniels, R. C., Finn, A. & S. Musundwa (2012) “Wealth in the National Income
Dynamics Study Wave 2”, NIDS Discussion Paper, 2012/6
Fine, Ben and Zavareh Rustomjee (1996), The Political Economy of South Africa:
From Minerals-Energy Complex to Industrialization, Westview Press,
Boulder, CO.
Finn, A, Leibbrandt, M. and J. Levinsohn (2012) “Income Mobility in South Africa:
Evidence from the First Two Waves of the Income Dynamics Study”, NIDS
Discussion Paper, 2012/5
Froud, J., Johal, S., & Williams, K. (2002) “Financialisation and the coupon pool”,
Capital & Class, 26(3), 119-151.
Karwowski, Ewa (forthcoming) “The finance-mining nexus in South Africa: How
mining companies use the South African equity market”, Journal of Southern
African Studies.
KPMG, Insight: The global infrastructure magazine, no. 4, KPMG:UK
76
This project has received funding from the European Union’s Seventh Framework Programmefor research, technological development and demonstration under grant agreement no 266800
Leibbrandt, M., Finn, A. & I. Woolard (2012) “Describing and decomposing post-
apartheid income inequality in South Africa”, Development Southern Africa,
29(1), pp.19-34.
Leibbrant, M., Woolard, I., Finn, A. & Argent, J. (2010), ‘Trends in South African
Income Distribution and Poverty since the Fall of Apartheid’, OECD Social,
Employment and Migration Working Papers, no. 101, OECD Publishing
Milberg, W., & Winkler, D. (2013) Outsourcing economics: global value chains in
capitalist development, Cambridge University Press.
Mohamed, S. and Finnoff, K. (2005) “Capital Flight from South Africa, 1980–2000”, in
G.A. Epstein (ed.), Capital Flight and Capital Controls in Developing Countries,
Edward Elgar. pp. 85– 115
Mohamed, S. and Roberts, S. (2007), “Questions of growth, questions of
development”. New Agenda: South African Journal of Social and Economic Issues,
No. 28, pp 37–46.
Oxfam (2014) ‘Even it up: time to end extreme inequality’, Oxfam GB
Orhangazi, Ö. (2008) “Financialisation and capital accumulation in the non-financial
corporate sector: A theoretical and empirical investigation on the US
economy:1973-2003”, Cambridge Journal of Economics, 32: 371-390
Palma, J.Gabriel (2009) “The revenge of the market on rentiers. Why neo-liberal
reports of the end of history turned out premature”, Cambridge Journal of
Economics, 33, pp.829-869.
Stockhammer, E. (2010) “Financialization and the global economy”, Political
Economy Research Institute Working Paper, 242.
Verhoef, G. (2009) “Concentration and competition: the changing landscape of the
banking sector in South Africa 1970-2007”, South African Journal of Economic
History, 24(2): 157-97.
77
This project has received funding from the European Union’s Seventh Framework Programmefor research, technological development and demonstration under grant agreement no 266800
World Bank (2014) “South Africa Economic Update: Fiscal Policy and Redistribution
in an Unequal Society”, Working Papers, no. 92167
78
This project has received funding from the European Union’s Seventh Framework Programmefor research, technological development and demonstration under grant agreement no 266800
Financialisation, Economy, Society and Sustainable Development (FESSUD) is a 10 million
euro project largely funded by a near 8 million euro grant from the European Commission
under Framework Programme 7 (contract number : 266800). The University of Leeds is the
lead co-ordinator for the research project with a budget of over 2 million euros.
THE ABSTRACT OF THE PROJECT IS:
The research programme will integrate diverse levels, methods and disciplinary traditions
with the aim of developing a comprehensive policy agenda for changing the role of the
financial system to help achieve a future which is sustainable in environmental, social and
economic terms. The programme involves an integrated and balanced consortium involving
partners from 14 countries that has unsurpassed experience of deploying diverse
perspectives both within economics and across disciplines inclusive of economics. The
programme is distinctively pluralistic, and aims to forge alliances across the social
sciences, so as to understand how finance can better serve economic, social and
environmental needs. The central issues addressed are the ways in which the growth and
performance of economies in the last 30 years have been dependent on the characteristics
of the processes of financialisation; how has financialisation impacted on the achievement of
specific economic, social, and environmental objectives?; the nature of the relationship
between financialisation and the sustainability of the financial system, economic
development and the environment?; the lessons to be drawn from the crisis about the
nature and impacts of financialisation? ; what are the requisites of a financial system able to
support a process of sustainable development, broadly conceived?’
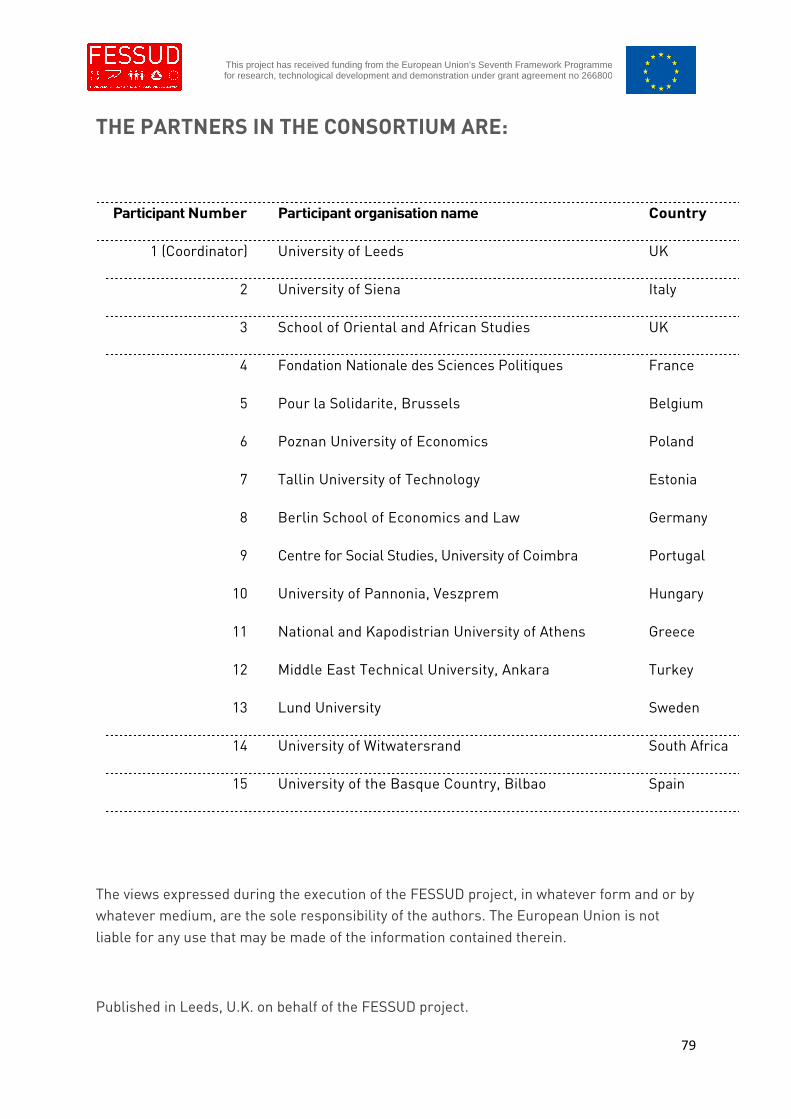
79
This project has received funding from the European Union’s Seventh Framework Programmefor research, technological development and demonstration under grant agreement no 266800
THE PARTNERS IN THE CONSORTIUM ARE:
Participant Number Participant organisation name Country
1 (Coordinator) University of Leeds UK
2 University of Siena Italy
3 School of Oriental and African Studies UK
4 Fondation Nationale des Sciences Politiques France
5 Pour la Solidarite, Brussels Belgium
6 Poznan University of Economics Poland
7 Tallin University of Technology Estonia
8 Berlin School of Economics and Law Germany
9 Centre for Social Studies, University of Coimbra Portugal
10 University of Pannonia, Veszprem Hungary
11 National and Kapodistrian University of Athens Greece
12 Middle East Technical University, Ankara Turkey
13 Lund University Sweden
14 University of Witwatersrand South Africa
15 University of the Basque Country, Bilbao Spain
The views expressed during the execution of the FESSUD project, in whatever form and or bywhatever medium, are the sole responsibility of the authors. The European Union is notliable for any use that may be made of the information contained therein.
Published in Leeds, U.K. on behalf of the FESSUD project.