Embed Size (px)
Citation preview

17/2007 17/2007
TOM
I JUK
KOLA
FGFR
1 Regulated G
ene-Expression, Cell Proliferation and D
ifferentiation in the Developing M
idbrain and Hindbrain
FGFR1 Regulated Gene-Expression, Cell Proliferation and Differentiation in the
Developing Midbrain and Hindbrain
Dissertationes bioscientiarum molecularium Universitatis Helsingiensis in Viikki
TOMI JUKKOLA
Institute of Biotechnology and Department of Biological and Environmental Sciences
Division of GeneticsFaculty of Biosciences
and Helsinki Graduate School of Biotechnology and Molecular Biology
University of Helsinki
Helsinki 2007 ISSN 1795-7079 ISBN 978-952-10-4034-4
Recent Publications in this Series:
32/2006 Monica YabalMembrane Insertion of C-tail Anchored Proteins33/2006 Raimo MikkolaFood and Indoor Air Isolated Bacillus Non-Protein and Mechanisms of Effects on Eukaryotic Cells34/2006 Mikael NikuFates of Blood. Studies on Stem Cell Differentiation Potential and B Lymphocyte Generation in Chimeric Cattle35/2006 Minni KoivunenMolecular Details of Phage φ6 RNA-Dependent RNA Synthesis36/2006 Kai FredrikssonStructure and Dynamics of Coil-like Molecules by Residual Dipolar Couplings1/2007 Irina TsitkoCharacterization of Actinobacteria Degrading and Tolerating Organic Pollutants2/2007 Pekka ÖstmanMicrochip Atmospheric Pressure Ionization-Mass Spectrometry3/2007 Anni HienolaN-Syndecan And HB-GAM in Neural Migration and Differentiation: Modulation of Growth Factor Activity in Brain4/2007 Ville O. PaavilainenStructural Basis of Cytoskeletal Regulation by Twinfi lin5/2007 Harri JäälinojaElectron Cryo-Microscopy Studies of Bacteriophage φ8 and Archaeal Virus SH16/2007 Eini PoussuMu in vitro DNA Transposition Applications in Protein Engineering7/2007 Chun-Mei LiType III Secretion System of Phytopathogenic Bacterium Pseudomonas syringae: From Gene to Function8/2007 Saara NuutinenThe Effects of Nicotine on the Regulation of Neuronal alpha7 Nicotinic Acetylcholine Receptors and Intracellular Signalling Pathways9/2007 Jaakko AaltonenFrom Polymorph Screening to Dissolution Testing: Solid Phase Analysis during Pharmaceutical Development and Manufacturing10/2007 Jenni AntikainenSurface Proteins of Lactobacillus crispatus: Adhesive Properties and Cell Wall Anchoring11/2007 Jing LiNovel Molecular Mechanisms of Arabidopsis Disease Resistance12/2007 Piia SaloThin-Layer Chromatography with Ultraviolet and Mass Spectrometric Detection: From Preparative-Layer to Miniaturized Ultra-Thin-Layer Technique13/2007 Mikko SairanenNeurotrophins and Neuronal Plasticity in the Action of Antidepressants and Morphine14/2007 Camilla RibackaRedox-linked Proton Transfer by Cytochrome C Oxidase15/2007 Päivi RamuOuter Membrane Protease/adhesin PgtE of S. enterica: Role in Salmonella-Host Interaction16/2007 Joni AlvesaloDrug Discovery Screening and the Application of Genomics and Proteomics in the Drug Development Process for Chlamydia pneumoniae

Dissertationes bioscientiarum molecularium Universitatis Helsingiensis in Viikki
17/2007
FGFR1 regulated gene-expression,cell proliferation and differentiation in the developing
midbrain and hindbrain
Tomi Jukkola
Institute of Biotechnology and Department of Biological and Environmental Sciences
Division of Genetics Faculty of Biosciences and
Helsinki Graduate School of Biotechnology and Molecular BiologyUniversity of Helsinki
Finland
Academic dissertation
To be presented, with the permission of the Faculty of Biosciences of the University of Helsinki, for public criticism, in the auditorium 1041 at the Viikki Biocenter 2,
Viikinkaari 5, on August 17th 2007, at 12 o’clock noon.

Supervised by Docent Juha PartanenInstitute of BiotechnologyUniversity of HelsinkiFinland
Reviewed by Professor Eero CastrénNeuroscience CenterUniversity of HelsinkiFinland
Professor Seppo VainioOulu BiocenterUniversity of OuluFinland
Opponent Ph.D. Mark LewandoskiNational Cancer InstituteFrederick Cancer Research & Development CenterU.S.
Custos Professor Jim SchröderDepartment of Biological and Environmental Sciences University of HelsinkiFinland
ISSN 1795-7079ISBN 978-952-10-4034-4 (paperback)ISBN 978-952-10-4035-1 (PDF, http://ethesis.helsinki.fi )Edita, Helsinki2007

If we knew what we were doing we wouldn’t call it science.
Albert Einstein
TABLE OF CONTENTS
ABBREVIATIONSList of original publicationsI. Jukkola T*, Lahti L* Naserke T, Wurst W, Partanen J. FGF regulated gene-
expression and neuronal differentiation in the developing midbrain-hindbrain region. Developmental Biology. 2006 Sep 1; 297(1): 141-57.
II. Jukkola T*, Sinjushina N*, Partanen J. Drapc1 expression during mouse embryonic development. Gene Expression Patterns. 2004 Oct; 4(6): 755-62.
III. Trokovic R*, Jukkola T*, Saarimäki J, Peltopuro P, Naserke T, Weisenhorn DM, Trokovic N, Wurst W, Partanen J. Fgfr1-dependent boundary cells between developing mid- and hindbrain. Developmental Biology. 2005 Feb 15; 278(2): 428-39.
IV. Kala K, Jukkola T, Pata I, Partanen J. Analysis of the midbrain-hindbrain boundary cell fate using a boundary cell-specifi c Cre-mouse line. Manuscript submitted to Genesis.
SUMMARYREVIEW OF THE LITERATURE ............................................................................. 11. The early brain development ..................................................................................... 1 1.1. Neural induction and neurulation .......................................................................1 1.2. Molecular events of neural induction and neurulation ....................................... 12. Mechanisms of brain patterning ................................................................................. 2 2.1. Anterioposterior patterning ................................................................................ 2 2.2. Isthmic organizer ................................................................................................ 2 2.2.1. Induction and localization of isthmic organizer ....................................... 5 2.3. Neuronal development and regionalization of the midbrain .............................. 9 2.4. Neuronal development and regionalization of the hindbrain ........................... 11 2.4.1. Segmentation and compartmentalization in hindbrain ........................... 123. Intercellular communication in the midbrain-R1 region .......................................... 14 3.1. FGF signaling in the midbrain-R1 development .............................................. 14 3.1.1. The FGF and FGFR molecules ............................................................... 14 3.1.2. Expression patterns of FGFs and FGFRs in the mouse midbrain-R1 .......................................................................................... 15 3.1.3. FGFRs in the mouse midbrain-R1 development .................................... 16 3.1.4. FGFR signal transduction ....................................................................... 17 3.2. WNT signaling in the midbrain-R1 development ............................................. 214. Cell proliferation in the developing brain .................................................................23 4.1. Interkinetic nuclear migration .......................................................................... 23 4.2. Cell cycle regulators ......................................................................................... 25 4.2.1. Cyclins, Cdks and their inhibitors .......................................................... 25 4.2.2. Cyclins and Cdks in neuronal development ........................................... 26 4.2.3. Cdk inhibitors in neuronal development ................................................ 27 4.3. Mechanisms controlling the cell polarity and asymmetric cleavage ................ 28 4.4. Cellular proliferation and regulation in the rhombomeric boundaries ............ 28AIMS OF THE STUDY .............................................................................................. 30
MATERIALS AND METHODS ................................................................................ 31RESULTS AND DISCUSSION .................................................................................. 341. Microarray analysis of Fgfr1 CKO mutants (I-III) .................................................. 342. Identifi cation of FGF regulated genes at the midbrain-R1 region (I, III and unpublished) ............................................................................................ 43 2.1. Down-regulated genes (I and unpublished) ..................................................... 43 2.1.1. Down-regulation of FGF-FGFR signaling components at E10.5 (I, III) ................................................................................................................ 43 2.1.2. Cnpy1 as a novel regulator of FGF signaling at the midbrain-R1 region (I and unpublished) ............................................................................... 45 2.1.3. Down-regulated genes expressed as a narrow stripe near the MHB (I and unpublished) .......................................................................................... 46 2.1.4. Other down-regulated genes in the Fgfr1 CKO mutants (I) ................... 48 2.2. Up-regulated genes show loss of expression gradients in Fgfr1 CKO mutant embryos (I).............................................................................................483. Neuronal progenitor cell populations are affected in Fgfr1 CKO mutant embryos (I) ............................................................................................................... 49 3.1. Neuronal progenitor cell populations are affected in Fgfr1 CKO mutant embryos (I) ........................................................................................................ 49 3.2. Midbrain dopaminergic neuron progenitor pool spreads in Fgfr1 CKO mutants (I) ........................................................................................................ 50 3.3. The most rostral serotonergic neuron precursors are lost in Fgfr1 CKO mutant embryos (I)............................................................................................ 504. Identifi cation of a putative target gene of WNT-β-catenin pathway (II) .................. 525. A slowly proliferating narrow population of cells exists at the boundary between the midbrain and R1 (III,IV). ..................................................................... 54 5.1. Initial changes in gene expression occur close to the midbrain- hindbrain boundary in Fgfr1 mutants (III)....................................................... 54 5.1.1. Initial gene expression changes of FGF-FGFR signaling components at E9.5 (III) .................................................................................. 54 5.2. Other FGFRs may mediate FGF signaling at a distance from the midbrain-hindbrain boundary (III) .................................................................. 55 5.3. Isthmic constriction fails to develop in the Fgfr1 CKO mutant embryos (III) . 55 5.4. Expression of cell cycle regulators at the midbrain-R1 region (I, III, IV) ....... 55 5.5. Cell proliferation at the border between midbrain and R1 (II,IV) ................... 56 5.5.1. The location of p21 expressing cells at the border between midbrain and R1 (II,IV) .................................................................................... 56 5.5.2. Slowly proliferating cell population at the midbrain-R1 boundary (III,IV) .............................................................................................. 57 5.5.3. The contribution of the boundary cell population to the midbrain-R1 development (IV) ......................................................................... 58CONCLUSIONS ......................................................................................................... 60ACKNOWLEDGEMENTS ....................................................................................... 62REFERENCES ............................................................................................................ 63
ABBREVIATIONS
5-HT 5-hydroxytryptophan (serotonin)ANR anterior neural ridgeAP anterioposteriorAPC adenomatosis polysis coli proteinBMP bone morphogenetic factorbp base pair(s)BrdU 5-bromo-2-deoxyuridineCb cerebellumCNPY1 canopy1 CNS central nervous systemCp choroid plexusCre Cre recombinasecRNA synthetic complementary RNA to mRNA produced from a DNA
template DA dopaminergic DAPI 4´,6-diamino-2-phenylindoleDi diencephalonDNA deoxyribose nucleic acidDRAPC1 adenomatosis polyposis coli down-regulated 1, APCDD1 proteinDV dorsoventralE embryonic day EN engrailed homeobox transcription factorERM (or ETV5) member of the PEA3 group of ETS domain containing TFsEST expressed sequence tagFGF fi broblast growth factorFGFR fi broblast growth factor receptorFLRT family of glycosylated proteins containing a fi bronectin III
domain and leucine rich repeats (LRR) domainFST follistatin proteinFZ frizzleds which are members of the seven transmembrane
domain cell surface receptors GBX2 gastrulation brain homeobox 2 transcription factorGRG4 (or TLE4) groucho-related gene, transducin-like enhancer of split 4HH Hamburger Hamilton stageHOX a particular subgroup of homeobox transcription factorshpf hours post fertilizationHS heparan sulphateIc inferior colliculusIg immunoglobulinIGFBP Insulin-like growth factor binding proteinIsO isthmic organizer

kDa kilo Dalton (molecular weight)KO knockout LC locus coeruleusMAPK mitogen activated protein kinaseMb midbrainMHB midbrain–hindbrain boundaryMKP3 MAPK phosphatase-3mRNA messenger ribonucleic acidMRP multi-drug resistance proteinOTX orthodenticle homolog (Drosophila)p21 (or Cdkn1a) 21 kDa cyclin dependent kinase inhibiting protein PAX paired domain containg homeobox transcription factorPCR polymerase chain reactionPH3 phosphohistone H3PI3K phosphatidylinositol 3’ kinaseR (e.g. R1) rhombomere (e.g. rhombomere 1)RA retinoic acidRNA ribonucleic acidRrF retrorubral fi eld SA serotonergicSc superior colliculusSEF similar expression to FgfsSFRP secreted frizzled-related proteinSHH sonic hedgehog proteinsiRNA small interfering RNA used to decrease transcriptionSNc substantia nigra pars compactaSOX SRY-related HMG-box transcription factorSPRYs sprouty family of proteinsTe telencephalonTeg tegmentumTF(s) transcription factor(s)TH tyrosine hydroxylaseTRH thyrotrophin releasing hormoneTUJ neuron specifi c beta III TubulinTUNEL terminal deoxynucleotidyl transferase mediated nick labelingTyr tyrosine residuev vermis of the cerebellumVTA ventral tegmental areaVZ ventricular zoneWNT(1) wingless-related MMTV integration site 1 ZLI zona limitans intrathalamica
LIST OF ORIGINAL PUBLICATIONS
This thesis is based on the following three articles and one manuscript as well as unpublished data. In the text they are referred to by their roman numerals.
I. Jukkola T*, Lahti L* Naserke T, Wurst W, Partanen J. FGF regulated gene-expression and neuronal differentiation in the developing midbrain-hindbrain region. Developmental Biology. 2006 Sep 1; 297(1): 141-57.
II. Jukkola T*, Sinjushina N*, Partanen J. Drapc1 expression during mouse embryonic development. Gene Expression Patterns. 2004 Oct; 4(6): 755-62.
III. Trokovic R*, Jukkola T*, Saarimäki J, Peltopuro P, Naserke T, Weisenhorn DM, Trokovic N, Wurst W, Partanen J. Fgfr1-dependent boundary cells between developing mid- and hindbrain. Developmental Biology. 2005 Feb 15; 278(2): 428-39.
IV. Kala K, Jukkola T, Pata I, Partanen J. Analysis of the midbrain-hindbrain boundary cell fate using a boundary cell-specifi c Cre-mouse line. Manuscript submitted to Genesis.
*equal contribution
SUMMARY
The neuroectodermal tissue close to the midbrain-hindbrain boundary (MHB) is an im-portant secondary organizer in the developing neural tube. This so-called isthmic or-ganizer (IsO) regulates cellular survival, patterning and proliferation in the midbrain (Mb) and rhombomere 1 (R1) of the hindbrain. Signaling molecules of the IsO, such as fi broblast growth factor 8 (FGF8) and WNT1 are expressed in distinct bands of cells around the MHB. It has been previously shown that FGF-receptor 1 (FGFR1) is required for the normal development of this brain region in the mouse embryo. In the present study, we have compared the gene expression profi les of wild-type and Fgfr1 mutant embryos. We show that the loss of Fgfr1 results in the downregulation of several genes expressed close to the MHB and in the disappearance of gene expression gradients in the midbrain and R1. Our microarray screen identifi ed several previously uncharacterized genes which may participate in the development of midbrain–R1 region. Our results also show altered neurogenesis in the midbrain and R1 of the Fgfr1 mutants. Interest-ingly, the neuronal progenitors in midbrain and R1 show different responses to the loss of signaling through FGFR1. As Wnt1 expression at the MHB region requires the FGF signaling pathway, WNT target genes, including Drapc1, were also identifi ed in our screen. The microarray data analysis also suggested that the cells next to the midbrain-hindbrain boundary express distinct cell cycle regulators. We showed that the cells close to the border appeared to have unique features. These cells proliferate less rapidly than the surrounding cells. Unlike the cells further away from the boundary, these cells ex-press Fgfr1 but not the other FGF receptors. The slowly proliferating boundary cells are necessary for development of the characteristic isthmic constriction. They may also contribute to compartmentalization of this brain region.


1
1. The early brain development
1.1. Neural induction and neurulation
The complex development of central nervous system (CNS) begins already prior to the gastrulation. The CNS begins as a flattened layer of neuroepithelial cells on the dorsal surface of the embryo. They are induced by the signals from the surrounding ectoderm and mesenchyme. The molecular interactions create a sheet of cells that are forming the neural plate. With the onset of neurulation, the embryo also begins to elongate along its anterioposterior (AP) axis. At the anterior end of the primitive streak of the gastrulating mouse embryo (approximately at embryonic (E) day 7.5) lays an important structure, the node. The inductive and organizing activity of an early node was fi rst reported in amphibians by Spemann and Mangold (reviewed in Hamburger, 1988). In these experiments the dorsal blastoporal lip from a newt gastrula stage embryo was transplanted into another embryo, which induced the formation of a secondary embryo with a normal body pattern. The inductive properties of the transplanted tissue indicated that the node (or Spemann’s organizer in amphibians) not only instructed cells in adjacent tissues to acquire new fates, but also provided information about the development of AP axis. Similar transplantation experiments have shown that the Hensen’s node in chick and the node in mouse also act as axis-inducing organizers. In addition to the node, inductive signals from the perineural ectoderm as well as from the ventral endoderm and axial mesoderm are thought to infl uence the development of the AP and dorsoventral (DV) polarity (Stern, 2001).
REVIEW OF THE LITERATURE
During neurulation the lateral edges of the plate, or neural folds, become prominent and begin to bend toward each other to form a tube. As the neural folds of the plate close, the dorsal midline of the embryo begins to sink somewhat below the surface, and in making contact, the central depression in the plate becomes more distinctive. As they become adjacent, the neural folds fuse, producing a hollow neural tube and a continuous dorsal epithelium. After separation from the overlying epithelium, the neural tube thickens differentially as various regions begin to form different subregions of the brain and spinal cord.
1.2. Molecular events of neural induction and neurulation
Recent research has identified specific molecules that bring about neural induction. The complex set of molecular interactions commits ectodermal cells over the notochord to becoming neural tissue, being the fi rst step in the formation of the nervous system. In amphibians, three secreted molecules, noggin (Nog), follistatin (Fst), and chordin (Chrd), are among the inductive proteins. It was fi rst thought that these molecules directly protect the ectoderm from epidermalizing signals and protect the mesoderm from ventralizing signals, allowing the development of a patterned neural plate (Harland and Gerhart, 1997). However, subsequent research on amphibians has shown that these inductors act by blocking the action of an inhibitors, such as bone morphogenetic protein 4 (BMP4), in the dorsal ectoderm (reviewed in Lee and Jessell, 1999). Subsequently, in the absence of BMP4 activity, dorsal ectoderm forms neural tissue as a default state. In
Review of the Literature

2
amphibians, neural specifi cation requires the continuous activity of various BMP antagonists from blastula through gastrula stages. Due to redundancy of different BMP antagonists only the inactivation of three of them (Nog, Fst, and Chrd) has been shown to result to a disruption of dorsal development (Khokha et al., 2005). In birds and mammals, the inactivation of BMPs is also likely important in neural induction, but the role of noggin, follistatin and chordin as inhibitors of BMPs is less clear. For example, mice that lack Fst (Matzuk et al., 1995) or Nog (McMahon et al., 1998) function do not show obvious defects in neural induction although later neural defects are observed in Nog -/- mice. In addition, in mouse, Bmp4 mutant embryos do not exhibit an apparent expansion in neural tissue, as might have been anticipated from experiments of BMP4 inactivation in amphibians (Winnier et al., 1995).
In addition to BMP antagonists, other mechanisms have been demonstrated to decrease the BMP signaling in neural induction. For example, in the chick, early FGF expression downregulates Bmp expression in the prospective neural plate (Wilson et al., 2000). FGF8 signaling is also able to initiate the events of neural induction whereas addition of noggin or chordin to the chick epiblast can alter the position of the neural folds but cannot induce ectopic neural tissues (Streit et al., 2000).
2. Mechanisms of brain patterning
2.1. Anterioposterior patterning
An important second step is initial regionalization of the CNS into broad anterioposterior regions. Numerous
experiments have shown that tissue explants of the early primitive node can induce a nervous system with both anterior (head) and posterior (trunk) components, whereas explants of older node tissue only induce trunk characteristics (reviewed in Harland and Gerhart, 1997). Earlier experiments also showed that certain inductors cause the formation of more anterior, and others more posterior, neural structures. For example, in the presence of retinoic acid (RA), WNTs, or FGFs, the induced neural structures are posteriorized, and more caudal structures form (Kudoh et al., 2002; Storey et al., 1998). In mammals, the anterior hypoblast (or anterior visceral endoderm (AVE) in mouse) expresses genes characteristic of the prechordal plate and probably initiates head formation (Stern, 2001). Shortly following the neural induction, additional signals from the notochord and AVE result in the expression of the transcription factor Otx2 in the head region (forebrain/midbrain) and Gbx2 in the trunk region (hindbrain/spinal cord). Both the signaling molecules and transcription factors are important for the anterior structures. To produce a head region, it is necessary to block signals from the RA/WNT/FGF signaling pathways as well as the BMP4 signal.
2.2. Isthmic organizer
The proper development of the CNS requires a fine-tuned pattern of cell identities along the AP-axis. Further specifi cation and compartmentalization of the different neuronal domains is guided by so called secondary signaling centers (Fig. 1A). The isthmic organizer (IsO) is such a center which is formed between midbrain (Mb) and the most anterior part of the hindbrain, rhombomere 1 (R1).
Review of the Literature

3
Figure 1. The role of signaling molecules and transcription factors in the development of midbrain-R1 region. (A) Side view of an E10.5 mouse embryo. (B) Dorsal view of an E10.5 embryo. (C) Midsagittal view of an E12.5 mouse embryo. (D) Midsagittal view of an E18.5 brain. Two secreted factors, FGF8 and WNT1, are required for the development of midbrain-R1 region (A,B). In addition to FGF8 and WNT1, Shh expression in the ventral midline regulates dorsoventral patterning and the expression of Fgf8 at midbrain-R1 region during early development (E8.5-E12)., Otx2 and Gbx2 are transcription factors which act antagonistically to set up the position of the IsO (B). The expression of the En1/En2 transcription factors are required for the maintenance of the FGF8. Also, transcription factors Pax2, Pax5 and Pax8 are expressed in the overlapping patterns, but only Pax2 is required for the induction of the Fgf8 in the IsO (Ye et al., 1998). In addition to the AP and DV patterning, the IsO signals regulate the development of neuronal population such as dopaminergic (DA) neurons in the midbrain and serotonergic (SA) neurons in the R1. Initially, bone morphogenetic proteins (BMPs) expressed in the roof plate and signals from the IsO are regulating the induction of the locus coeruleus (LC) progenitors. The development of III and IV cranial ganglia are also dependent on the IsO signaling. The IsO activity is also required for the ordered specifi cation of inferior and superior colliculi in the dorsal midbrain (mesencephalic structures) as well as for the development of cerebellum in the dorsal R1 (metencephalic structure) (C,D). III, third cranial ganglion (or oculomotor nerve); IV, fourth cranial ganglia (or trochlear nerve); Cb, cerebellum; cp, choroid plexus; Di, diencephalon; Ic, inferior colliculus; mb, midbrain; r1, rhomobomere1; Sc, superior colliculus; Te, telencephalon; Teg, tegmentum; vHb, ventral hindbrain. Adapted from Wurst and Bally-Cuif (2001) and Ang (2006).
Review of the Literature

4
axial position (Echevarria et al., 2003; Liu and Joyner, 2001a; Lumsden and Krumlauf, 1996; Wurst and Bally-Cuif, 2001). Transplantation of tissue grafts originating from the IsO into the caudal forebrain or hindbrain lead to the induction of ectopic midbrain or cerebellar structures, respectively (Martinez et al., 1991). Thus, the IsO seems to posses the organizing properties which are guiding the development of adjacent brain regions (see Figs. 1 and 2).
The molecular specifi cation of isthmic cell fates appears to depend on signaling molecules that control the pattern and identity of adjacent cell types. Members of the fi broblast growth factor (FGF) family of secreted proteins have a prominent role in AP patterning of the midbrain and R1. Additional signals involving members of the WNT, sonic hedgehog (SHH) and bone morphogenetic protein (BMP) families also contribute to the correct patterning of midbrain-R1 region (see Fig. 1A,B). These planar signals emanated from the IsO are required for the development of the midbrain and cerebellum (Fig. 1C,D).
Apart from the IsO, secondary organizers have been identifi ed at other border regions in the vertebrate neural tube (Echevarria et al., 2003; Lumsden and Krumlauf, 1996; Wurst and Bally-Cuif, 2001). For example, the border between prethalamus and thalamus called zona limitans intrathalamica (ZLI) is an important signaling center for diencephalic AP patterning (Fig. 1A). Several signaling molecules, including SHH, WNTs and FGFs, have been shown to mediate the organizer activity of ZLI (Kiecker and Lumsden, 2005; Vieira et al., 2005). In the telencephalon, at least SHH and FGF signaling from the anterior neural ridge (ANR) region are needed for the correct patterning of anterior fates such as lens and olfactory placodes (Bailey et al., 2006; Ekker et al., 1995; Ohkubo et al., 2002). It seems that Fgf8 expression in the ANR has a similar role to Fgf8 expression in the IsO where it is required for AP patterning of the adjacent tissues (Fig. 2; see below).
Figure 2. Inductive properties of the IsO: Tissue from the midbrain-R1 region and FGF8 soaked beads can induce ectopic midbrain and cerebellum development. Transplantation of Mb-R1 tissues to different positions induces Engrailed (En) expression gradients and affects the AP patterning as indicated. Similar induction of En2 and ectopic structure is observed with FGF8 beads. Di, diencephalon; Mb, midbrain; R1, rhombomere 1; Te, telencephalon. Adapted from Liu and Joyner (2001a).
Review of the Literature

5
2.2.1. Induction and localization of isthmic organizer
The molecules needed for positioning of the IsO are the two homeobox transcription factors, Otx2 and Gbx2 which are expressed at E7.5 (0 somite stage) within the anterior and posterior neuroectoderm, respectively (Fig. 3 and 4; Ang et al., 1994). This juxtaposition is maintained through mutual antagonism, resulting in a sharp midbrain/R1 border by E9.5 with Otx2 transcripts found in the forebrain and midbrain, and Gbx2 expression maintained in rhombomeres 1 to 3 (Fig. 3; Li and Joyner, 2001). In mouse mutants for Otx2 or Gbx2 genes, cells fail to maintain the positional identities (Acampora et al., 1997; Li and Joyner, 2001; Li et al., 2002; Martinez-Barbera et al., 2001). Otx2 -/- mouse embryos die early during embryogenesis and the prospective anterior brain regions are lost (Acampora et al., 1997). Gbx2 function also appears to be necessary during the early development of neural plate. Although defects are milder than in Otx2 mutant embryos, in the absence of Gbx2 function derivatives of rhombomeres 1-3 fail to form (Wassarman et al., 1997). In addition, conditional inactivation of Gbx2 after E9.0 has demonstrated the necessity of its continued expression for the correct establishment of the isthmus and normal cerebellar midline development (Li et al., 2002). Initially (at E7.5), Otx2 and Gbx2 expression defines two distinct domains, and later these correspond with the compartment boundaries formed at the border between midbrain and R1 (Trokovic et al., 2003; Zervas et al., 2004).
Both Otx2 and Gbx2 are showed to exert a dose-dependent activity on Fgf8 expression. A rostral or caudal shift of Fgf8 expression domain is seen both in
loss-of-function (Acampora et al., 1997; Puelles et al., 2003; Suda et al., 1997) or gain-of-function (Broccoli et al., 1999; Katahira et al., 2000) manipulations of Otx2 activity, respectively. OTX2 is necessary for maintenance of midbrain identity through a continued repression on the posteriorizing determinants (Fig. 3). In this context, Gbx2 appears to be the major molecular determinant in maintaining the rhombomeric identity by establishing its anterior border. On the contrary, Gbx2 inactivation or overexpression shifts Fgf8 expression caudally or rostrally, respectively (Katahira et al., 2000; Millet et al., 1999; Wassarman et al., 1997). In addition, mice homozygous for a Gbx2 hypomorphic allele shows caudal shift in expression of Fgf8 and Fgf17 domains (Waters and Lewandoski, 2006). Otx2 (and Otx1) has also been shown to antagonize and defi ne the Shh expression domain to ventral midbrain. The co-repressor for the antagonism on Shh expression is thought to be GRG4 (Puelles et al., 2003; Puelles et al., 2004).
Induction of engrailed transcription factor genes En1 and En2 and paired box transcription factor genes Pax2 and Pax5 is regulated by the general AP patterning process (Liu and Joyner, 2001a; Olander et al., 2006). From early-somite stages, En1, En2, Pax2 and Pax5 become expressed across the Otx2/Gbx2 border in a graded fashion (see Fig. 1B and Fig. 3; Liu and Joyner, 2001b). The expression of En1 and Pax2 is earlier, whereas that of En2 and Pax5 is later than Fgf8 expression in the midbrain-R1 region (Fig. 4; Crossley and Martin, 1995). However, neither FGF8 nor WNT1 activities are required for the initial induction of Pax2/5 and En1/2 expression (Olander et al., 2006). Later in development, however, FGF8, WNT1, EN1/2 and PAX2/5 molecules
Review of the Literature
6
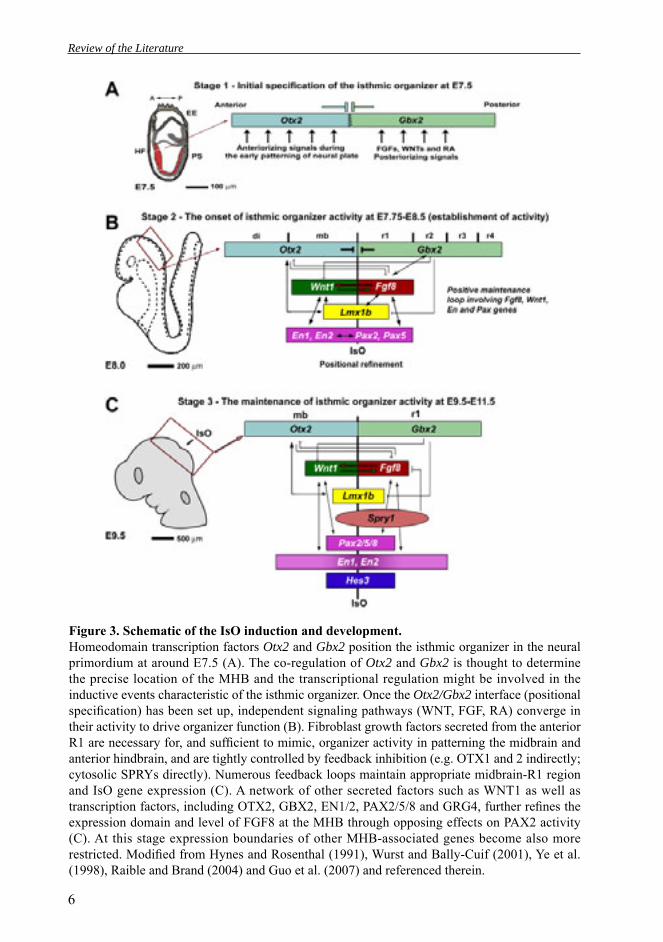
Figure 3. Schematic of the IsO induction and development. Homeodomain transcription factors Otx2 and Gbx2 position the isthmic organizer in the neural primordium at around E7.5 (A). The co-regulation of Otx2 and Gbx2 is thought to determine the precise location of the MHB and the transcriptional regulation might be involved in the inductive events characteristic of the isthmic organizer. Once the Otx2/Gbx2 interface (positional specifi cation) has been set up, independent signaling pathways (WNT, FGF, RA) converge in their activity to drive organizer function (B). Fibroblast growth factors secreted from the anterior R1 are necessary for, and suffi cient to mimic, organizer activity in patterning the midbrain and anterior hindbrain, and are tightly controlled by feedback inhibition (e.g. OTX1 and 2 indirectly; cytosolic SPRYs directly). Numerous feedback loops maintain appropriate midbrain-R1 region and IsO gene expression (C). A network of other secreted factors such as WNT1 as well as transcription factors, including OTX2, GBX2, EN1/2, PAX2/5/8 and GRG4, further refi nes the expression domain and level of FGF8 at the MHB through opposing effects on PAX2 activity (C). At this stage expression boundaries of other MHB-associated genes become also more restricted. Modifi ed from Hynes and Rosenthal (1991), Wurst and Bally-Cuif (2001), Ye et al. (1998), Raible and Brand (2004) and Guo et al. (2007) and referenced therein.
Review of the Literature

7
form a positive regulatory network which maintains the isthmic specific gene-expression and is necessary for the maintenance of midbrain-R1 identity (Wurst and Bally-Cuif, 2001). The mouse En1 and En2 homeobox transcription factors are expressed in a domain encompassing the posterior midbrain and anterior hindbrain (Davidson et al., 1988; Davis and Joyner, 1988). Studies in Xenopus laevis have indicated that induction of AP neural patterning might involve signals from the dorsal mesoderm to the overlying ectoderm (Ruiz i Altaba and Jessell, 1993). Work in several species suggests that signals from the anterior mesendoderm or notochord might regulate the expression of Engrailed genes in the neural plate (Ang and Rossant, 1993; Darnell and Schoenwolf, 1997; Hemmati-Brivanlou et al., 1990; Shamim et al., 1999). However, in mouse or in zebrafi sh which lack the notochord, AP patterning is normal (Ang et al., 1994; Klingensmith et
al., 1999; Shih and Fraser, 1996; Weinstein et al., 1994).
Expression patterns of Engrailed genes in R1 coincide with parts of the neural tube that generate dorsal and ventral structures, such as the cerebellum and pons. In the midbrain, En1 and En2 activity is regulating the development of superior and inferior colliculi and ventral midbrain nuclei (see below). En1 mutants, which die on the day of birth (E18.5), lack the cerebellum and inferior colliculus (Wurst et al., 1994). By contrast, En2 mutants are viable and fertile and have minor defects in cerebellar foliation (Millen et al., 1994). In the chicken, overexpression of En1 and En2 in midbrain showed that engrailed proteins regulate the anterior-posterior polarity of the optic tectum, the homolog of the mammalian superior colliculus (Friedman and O’Leary, 1996; Itasaki and Nakamura, 1996; Logan et al., 1996). In addition, mouse knockout analysis has shown that En1 and En2 are required
Figure 4. The onset of MHB-associated genes during the IsO development. Modifi ed from Hynes and Rosenthal (1991), Wurst and Bally-Cuif (2001) and Raible and Brand (2004) and referenced therein.
Review of the Literature

8
for the maintenance of the midbrain dopaminergic (DA) neuronal population in later stages of embryonic development (Alberi et al., 2004; Simon et al., 2001; Simon et al., 2004; Simon et al., 2005).
Another level of molecular control needed for the IsO activity relies on the secreted signaling proteins. Like in many other CNS regions, the specification of neural types in midbrain-R1 region is controlled by secreted signals derived from local signaling centers (Echevarria et al., 2003; Lumsden and Krumlauf, 1996; Wurst and Bally-Cuif, 2001). FGF8/17/18 and WNT1 are signaling molecules required for the IsO activity (Figs. 1 and 3). First Fgf8 and Wnt1 are expressed broadly in the future midbrain-R1 region but later expressions boundaries get juxtaposed (Broccoli et al., 1999). The onset of Fgf8 expression in mouse is around 3-5 somite stage and is largely limited to the Gbx2 positive side of the midbrain-R1 region (Fig. 4; Crossley and Martin, 1995). At E9.0, Fgf8 expression is restricted to a narrow band at the most anterior part of the R1 whereas the Wnt1-positive cells are located in the midbrain (Wurst and Bally-Cuif, 2001). After the initiation of Fgf8 expression, GBX activity is maintaining the Fgf8 expression in the R1, whereas OTX2 and GBX2/FGF8 regulate each other negatively, leading to refinement of the sharp expression boundaries (see Fig. 3; Broccoli et al., 1999; Wassarman et al., 1997; Millet et al 1999). Initially, Wnt1 expression is detected broadly in the prospective midbrain territory, but its expression boundaries are also later refi ned (Figs. 3 and 4). At E10, Wnt1 expression is detected as a narrow band that surrounds the most posterior midbrain, just anterior to the Fgf8 expression domain. Dorsally, Wnt1 expression is also restricted to a narrow stripe of cells located in the roof
plate (tectum). Strong Wnt1 expression domain is located also in the most ventral midbrain (tegmentum). In contrast to dynamic Fgf8 and Wnt1 expression, the expression of En1, En2, Pax2 and Pax5 remains relatively broad on both sides of the Otx2/Gbx2 border between E7.5 and E12.5.
In chicken FGF8 protein has been shown to have same midbrain/cerebellum inducing properties than the isthmic tissue grafts (see Fig. 2; Crossley et al., 1996). So far these inducing properties have been demonstrated only for FGF8. Interestingly, only the FGF8b splice format induces ectopic expression in the mouse forebrain of genes normally expressed in the isthmus (Olsen et al., 2006). MHB specific inactivation of Fgf8 results to extensive apoptosis in the midbrain-R1 region at E8.5 (Chi et al., 2003). Similarly in Wnt1 mutant embryos cells in the midbrain-R1 region die apoptotically around the same stage (McMahon and Bradley, 1990; McMahon et al., 1992; Thomas and Capecchi, 1990). In concert with FGF signaling, SHH is thought to regulate the dorsoventral patterning of the midbrain-R1 region (Placzek, 1995; Ye et al., 1998). SHH is expressed ventrally in the fl oor plate throughout the midbrain-R1 boundary region (see Fig. 1A).
Although there is vast information about the complex genetic interactions controlling the localization of isthmic organizer, the exact factors responsible for its induction are currently unknown. In addition to the early regionalization of the neuroectoderm, it has been suggested that a transient expression of FGF4 in the anterior notochord is needed for the induction of midbrain-R1 specific gene expression (Shamim et al., 1999). The induction of Fgf8 expression at the IsO might be due to secreted FGF8 from
Review of the Literature

9
the adjacent cardiac mesendodermal cells (Crossley et al., 1996). In addition, other signals from the mesendoderm are required for the induction of the IsO-associated transcription factors such as En1 and En2 (Ang and Rossant, 1993). Recently, the data from the transplantation experiments in chick embryos suggest that convergent WNT and FGF signaling at the gastrula stage is required to generate the cellular properties characteristics for the IsO (Olander et al., 2006; see Fig. 3).
2.3. Neuronal development and regionalization of the midbrain
The dorsal part of the midbrain is formed by two paired rounded structures, the superior and inferior colliculi. The superior colliculus receives input from the retina and the visual cortex and participates in a variety of visual reflexes, particularly the tracking of objects in the contralateral visual field. The inferior colliculus, formed in the caudal midbrain receives both crossed and uncrossed auditory fi bres and projects upon the medial geniculate body, the auditory relay nucleus of the thalamus.
The midbrain contains the nuclear complex of the oculomotor nerve (also called III cranial nerve) as well as the trochlear nucleus (also called IV cranial nerve); these cranial nerves innervate muscles that move the eye and control the shape of the lens and the diameter of the pupil. The ventral midbrain region form also two distinct nuclei known as the substantia nigra pars compacta (SNc) and the ventral tegmental area (VTA) as well as the retrorubral fi eld (RrF), which are the most prominent sources of dopaminergic (DA) neurons in the CNS (German and Manaye, 1993). Indeed, midbrain neurons that use dopamine as a neurotransmitter constitute about 75% of all DA neurons in the adult brain (Wallen and Perlmann, 2003). The location of postmitotic DA neurons in the brain is usually determined by the immunohistological localization of the enzyme tyrosine hydroxylase (TH), which is the rate-limiting enzyme of dopamine synthesis. Historically, the DA neurons in the midbrain of the mouse are placed in three cell groups according to TH immunostaining: nucleus A8 cells in the RrF, nucleus A9 cells in the SNc and nucleus A10 cells in the VTA (Fig. 5).
Figure 5. Midbrain dopaminergic (DA) cell populations during mouse brain development. Signals affecting the early development of DA precursors and patterning of the midbrain-R1 region at E9.5 (A) and the location of TH+ neurons corresponding to A8-A11 groups at E14.5 (B). Di, diencephalon; Ic, inferior colliculi; IsO, isthmic organizer; Mb, midbrain; Sc, superior colliculi; p, prosomere; r, rhombomere; Te, telencephalon. Adapted from reviews by Simon et al. (2003) and Ang (2006).
Review of the Literature
10
Cells of the SNc contain the black pigment melanin; these synthesize dopamine and project to cells of the dorsolateral striatum and caudate putamen constituting the nigro-striatal pathway. By contrast, neurons of the VTA and RrF project to the ventral striatum forming a part of the mesolimbic system and establish also additional connections to the prefrontal cortex (mesocortical system). DA neurons of the SNc are involved in the coordination of movements, whereas the VTA and RrF neurons are controlling e.g. mood and rewarding through the mesolimbic and mesocortical systems.
Degeneration of the SNc neurons and their connections to the striatum and frontal cortex is implicated in several CNS disorders, including Parkinson’s disease (Hirsch et al., 1997; Hynes and Rosenthal, 1999). Conversely, over-stimulation of VTA neurons has been linked to schizophrenia and drug addiction (Chao and Nestler, 2004; Sesack and Carr, 2002).
The development of the superior and inferior colliculi and midbrain DA neurons is regulated by the IsO (Andersson et al., 2006a; Brodski et al., 2003; Prakash et al., 2006; Trokovic et al., 2003). The DA progenitors are located rostrally to (or within) the IsO as early as E9.0 in mouse, and they differentiate in this region at a time between E9.0-E14.0 (Hynes and Rosenthal, 1999). The first postmitotic DA neurons can be detected in the ventral midbrain at approximately E10.5 in mouse. The induction of the DA precursors is regulated by both SHH from the fl oor plate and FGF8 from the IsO (Ye et al., 1998) (see Fig. 5). Addition of SHH and FGF8 on embryonic rat neural tube explants induced DA neuron development in ectopic locations, and blocking of the two signals with antibodies prevented it. Furthermore, in Shh knockouts and conditional Smo (a
receptor for SHH signaling) knockouts the amount of midbrain DA progenitors are considerably reduced (Blaess et al., 2006). The induction and maintenance of DA neurons requires also other factors such as TGF-βs (Farkas et al., 2003). Conversely, TGF-α is specifi cally needed only for the development of DA neurons of the SNc. The inactivation of TGF-α in mice leads to 50% reduction of SNc neurons (Blum, 1998).
A speci f ic marker gene for DA progenitors in the midbrain is retinaldehyde dehydrogenase (also known as Aldh1, Aldh1a1 or Raldh1), which catalyzes the oxidation of retinaldehyde into retinoic acid. However, the role of Raldh1 in midbrain DA progenitors is not clear (Prakash and Wurst, 2006). The role of WNT signaling in the midbrain DA development has also been established recently. Prakash et al. (2006) showed that Wnt1 is required for the early development of DA neurons through maintenance of Otx2 transcription factor in the midbrain. Recent studies have shown that several other transcription factors are expressed both in DA progenitors and later in immature and mature neurons. Midbrain DA progenitors are expressing a complex set of transcription factors including Otx2, Lmx1a, Lmx1b, En1, En2, Msx1, Msx2, Neurogenin 2 (Ngn2) and Mash1 (Andersson et al., 2006a; Andersson et al., 2006b; Kele et al., 2006; Puelles et al., 2003; Puelles et al., 2004; Simon et al., 2001). These transcription factors as well as Nurr1 and Pitx3 are also important in the later development of DA neurons (Smidt et al., 2004; Smits et al., 2003; Wallen et al., 1999; Zetterstrom et al., 1997). For example, in En1/2 double mutants, which lack the IsO activity, and thus downregulate Fgf8 by E9.0 stage, DA neurons are initially generated (Alberi et al., 2004; Simon et al., 2001; Simon et al.,
Review of the Literature

11
2003; Simon et al., 2004; Simon et al., 2005). This suggests that they are induced by the earlier, broader Fgf8 expression spanning the midbrain-R1 region (at E8.5). Alternatively, FGF8 from the IsO may not be needed for the induction, but rather for the maintenance and correct patterning of surrounding neuronal populations. On the other hand, Nurr1 and Pitx3 are needed for the maintenance and survival of DA neurons not for the induction of precursors (Saucedo-Cardenas et al., 1998; Smidt et al., 2004).
As mentioned above, Otx2 plays an important role in controlling specifi cation, maintenance and regionalization of the vertebrate brain. Recently, its role in further development of midbrain neuronal fates has been addressed by generating conditional mutants inactivating Otx2 by Cre recombinase expressed under the control of the En1 gene (Kimmel et al., 2000). In these conditional mutants, the transcriptional repressor Nkx2.2 was ventrally expanded, which in turn leads to the loss of Wnt1 expression (Prakash et al., 2006; Puelles et al., 2004). Importantly, the normal generation of midbrain DA neurons in these conditional Otx2 mutants was not affected as long as Nkx2-2 was also ablated from the ventral midbrain, suggesting that OTX2 function in midbrain DA neuron induction is to repress Nkx2-2 (Prakash et al., 2006). Thus, Otx2 is required to control identity and fate of ventral progenitors generating dopaminergic neurons in the midbrain through repression of Nkx2-2.
2.4. Neuronal development and regionalization of the hindbrain
Dur ing embryon ic deve lopment cerebellum arises from dorsal R1, adjacent to the fourth ventricle. By contrast, the basal region of R1 will contribute to the
development of pons. The cerebellum is essential for fine motor control of movement and the body position, and its dysfunction disrupts balance and impairs control of speech, limb and eye movements. The cerebellum consists of a medial vermis and two laterally located hemispheres. Anatomically, the cerebellum is dived into anterior, posterior and fl occulonodular lobes. The developing cerebellum consists mainly of three types of neuronal cells: granule cells in the external germinal layer, Purkinje cells, and neurons of the deep nuclei. The pons functions to relay signals from the cortex to assist in the control of movement where as the medulla is joined to the spinal cord and controls unconscious, yet essential, body functions such as breathing, swallowing, blood circulation and muscle tone. Both in mammals and fi sh, embryological manipulations and gene ablation studies have provided evidence that normal cerebellar development depends on formation and function of the isthmic organizer.
In addition to isthmic signals, such as WNT1 and FGF8, BMP signals from the dorsal R1 and Math1 expression in the rhombic lip characterize the different cell types that form the complex neuronal subtypes in cerebellum. Mice lacking Math1 expression show a complete loss of the cerebellar granule-cell layer and hindbrain mossy-fiber afferent nuclei indicating improper precursor cell differentiation and migration (Ben-Arie et al., 1997). Recent data indicate that BMP signaling pathway regulating Lmx1a transcription factors is required for the development of R1 roof plate and its derivatives (Chizhikov et al., 2006). Thus, in addition to the IsO, the roof plate seems to control both patterning and cellular proliferation in the cerebellar primordium.
Review of the Literature

12
The locus coeruleus (LC) is a nucleus in the brain stem responsible for physiological responses to stress and panic. The LC progenitor cells are born in the rostral rhombic lip (Lin et al., 2001), from where they migrate ventrally within the developing neural tube, and take residency near the fourth ventricle. The mature LC is localized in the lateral walls of the fourth ventricle in R1. This nucleus is the main noradrenergic centre of the brain and the main source of noradrenergic innervations in the CNS. The early development of noradrenergic neurons of the LC requires the establishment of IsO and is regulated by a BMP induced signaling cascade that specifies LC progenitors. Initially, BMP signaling pathway activates Mash1 transcription factor in LC progenitors of the adjacent rhombic lip (Guo et al., 1999). Subsequently, Mash1 activates the homeobox genes Phox2a and Phox2b. In the absence of Mash1 (Hirsch et al., 1998), Phox2a (Morin et al., 1997), or Phox2b (Pattyn et al., 2000), the LC neurons do not form. Phox2a and Phox2b also regulate the expression of tyrosine hydroxylase (TH) and dopamine-ß-hydroxylase (DßH), two key enzymes of noradrenergic biosynthesis required for the LC neuronal activity.
The IsO also regulates differentiation of serotonergic neurons (SA) neurons in the anterior hindbrain. These neurons are characterized by the expression of serotonin transmitter (also known as 5-hydroxytryptamine, 5-HT). The serotonergic system plays a key role in modulating behaviors, such as appetite and anxiety and has been implicated in many human disorders of mood and mind. Mammalian SA neurons have been classically grouped into nine cell populations (B1-B9) which are defi ned by immunohistochemical staining with anti-5-HT. The more rostral SA groups (B5-B9 also called the rostral SA domain) are
located in the anterior hindbrain whereas groups B1-B4 are located more caudally (reviewed in Hynes and Rosenthal, 1999). The rostral domain (B5-B9) provides innervation mainly to forebrain targets. The regional restriction of 5-HT neuron induction and later specifi cation is believed to result from early signaling events that pattern the MHB region and the more anterior hindbrain. In addition to isthmic FGF8 signals and SHH from the fl oor plate, FGF4 is needed for SA neuron induction in in vitro cultured R1 explants (Ye et al., 1998), but its role in vivo has not been demonstrated. The homeobox transcription factor Pet1 has been used as a specifi c marker of developing and adult SA neurons and it is expressed shortly before 5-HT appears in the mouse hindbrain at E11.0. Recently, the differentiation of SA neurons in vertebrates has come under wide examination and has been shown to involve also other homeobox transcription factors. Gain-of-function approaches have implicated that homeobox TFs Pet1 (also known Fev), Lmx1b and Mash1 (also known Ascl1) are required for the specifi cation of all SA neurons whereas Nkx2.2 and zinc finger TF Gata3 are needed for the appearance of caudal SA neurons (Ding et al., 2003; Hendricks et al., 2003; Pattyn et al., 2004).
2.4.1. Segmentation and compartmentalization in hindbrain
In mouse, the best studied system for compartmental iza t ion is the early embryonic hindbrain which is characterized by developmental segments called rhombomeres. Rhombomere (R)1 and R2 (metencephalon) give rise to the cerebellum and pons. Boundaries between the rhombomeres coincide with the anterior boundaries of expression of homeobox-containing regulatory genes. Thus, each of
Review of the Literature

13
the eight mouse rhombomeres (R1-8) can be characterized by a specifi c combination of Hox gene expression. However, R1 is devoid of Hox gene expression. In addition, rhombomeres can be identifi ed by the pattern of nerves that emerge from them. Importantly, proliferating cells between the rhombomeres do not mix, as shown by clonal analysis using injected intracellular dye (Fraser et al., 1990), thus proposing that they are compartments. In addition, the compartment boundaries show specific kinetics of cell cycle progression (see section 4.4. below).
The patterns of Hox gene expression imprint a positional code on the cells and contribute to the individual identities of the neural precursors (Guthrie et al., 1991; Guthrie et al., 1992). Segmentation of the vertebrate hindbrain into rhombomeres is essential for the AP patterning of cranial motor nuclei and their associated nerves. For example, a pair of cranial projections originate in s ingle rhombomeric compartment cooperate to form the functional branchiomotor nerve (Lumsden and Keynes, 1989). Segmentation refl ects also to the time course of differentiation, where odd-numbered rhombomeres show a delayed maturation compared to the even-numbered rhombomeres. In addition to Hox genes, the vitamin A derivative, retinoic acid (RA), is an early embryonic signal that specifies rhombomeres. RA signaling has an essential role in specifying rhombomere identity by acting upstream of Hox and other transcription factors, particularly in the posterior hindbrain (reviewed by Gavalas and Krumlauf, 2000; Glover et al., 2006; Maden, 2006). These TFs include, for example, Pax2, Meis1, Krox20 and Hoxb1.
Signaling by FGF8 is also crucial in patterning the R1 and establishing the anterior limit of Hox gene expression (Irving and Mason, 2000). There is clear
evidence that FGF8 can substitute for IsO activity in inducing R1 character when expressed in hindbrain tissue. The suggestion is that FGF8 is used in restricting the anterior limit of Hox expression by regulating anterior hindbrain character (i.e. R1). Thus both RA and FGF signaling are regulating the Hox expression in the hindbrain. The experiments in frog and fi sh suggest that FGF and RA signaling work independently to pattern distinct regions along the AP axis and that the Cdx homeobox genes (vertebrate caudal homologs) are responsible for transducing these signals (Isaacs et al., 1998; Shimizu et al., 2006). CDX proteins directly regulate the expression of the posterior Hox genes through direct binding to the cis-regulatory elements of these genes. Therefore the RA and FGF pathways may be integrated at the transcriptional level to control the Hox expression via Cdx genes.
Identities of rhombomeres and their boundaries are also proposed to arise by locally controlled proliferation coupled to cell adhesion changes (Wizenmann and Lumsden, 1997), which results to selective cell mixing. The in vitro affi nity experiments by Wizenmann and Lumsden (1997) suggest that distinct cell affinity properties restrict cell mixing between adjacent rhombomeres. Differential expression of cell adhesion molecules is known to be an effective mechanism for cell sorting. Rhombomere-boundary formation through cell sorting is thought to emerge by repulsive Eph-ephrin signaling. For example, repulsive interactions between Eph receptor tyrosine kinase, EphA4, and cells expressing its ephrinB ligands guide the cell sorting that underlies rhombomere-boundary formation (Holder and Klein, 1999; Mellitzer et al., 1999). Moreover, EphA4 expression is showed to promote the intra rhombomeric cell adhesion in parallel with
Review of the Literature

14
the EphA4-dependent repulsion between rhombomeres (Cooke et al., 2005).
Apart from Eph-ephrin signaling little is known about the importance of other cell adhesion molecules to the hindbrain segmentation. However, for example the cadherin/catenin system might act as a reciprocal regulator of proliferation and/or cell-cell adhesion in R1 (Trokovic et al., 2003) as well as in other rhombomeres where disruption of Ca2+-dependent adhesion abol ishes rhombomere-specific cell segregation (Wizenmann and Lumsden, 1997). Thus, differential expression of two cadherin molecules is important for restricting cell movement between adjacent rhombomeres.
3. Intercellular communication in the midbrain-R1 region
3.1. FGF signaling in the midbrain-R1 development
3.1.1. The FGF and FGFR molecules
During embryonic development, FGFs have diverse roles in regulating cell proliferation, migration and differentiation. Most of the FGFs have a classical amino-terminal signal sequence and are, therefore, efficiently secreted via the endoplasmic reticulum-Golgi secretory pathway. FGF9/16/20 lack an obvious amino-terminal signal peptide, but are nevertheless secreted. Mouse FGFs 11–14 are thought to remain intracellular, and secretion of these FGFs has not yet been reported (Ornitz and Itoh, 2001). Secreted FGFs are molecules which bind their cognate receptors leading to signal transduction in the receiving cells. The
FGF receptors (FGFR1-4) belong to the receptor tyrosine kinase family. The extracellular domain of FGFR molecules contains (i) a signal peptide, (ii) three (I-III) immunoglobulin-like (Ig) domains, (iii) an acidic residues of amino acids between Ig-like domains I and II. and (iv) a heparin/heparin sulfate proteoglycans (HS) binding domain (Fig. 6A,B). The Ig-like domains are needed for the FGF ligand binding. In addition, affi nity for heparin/HS is essential for effective activation of FGFRs (Ornitz, 2000). FGFRs also contain a single transmembrane domain and a split intracellular tyrosine kinase domain. Upon ligand binding, the receptor dimerizes and undergoes a conformational change which leads to trans-autophosphorylation of FGFR monomers as wel l as phosphorylation of the FGFR associated molecule FRS2 (Fig. 6A,B).
The use of an alternative exon encoding the carboxyl terminal half of Ig domain III is the major determinant of FGF ligand specifi city and FGFR1-3 are present in both IIIb and IIIc isoforms (Fig. 6A,B; Chellaiah et al., 1999; Wang et al., 1995). There are 22 Fgfs in the mouse genome (Zhang et al., 2006) which of Fgf8, Fgf15, Fgf17 and Fgf18 are specifically expressed in the midbrain-R1 region during embryogenesis. FGF8, 17 and 18 are subfamily members which exclusively bind FGFR IIIc splice forms and FGFR4 in vitro (Fig. 6D; Zhang et al., 2006). By contrast, FGF15 subfamily shows relatively weak and unspecific activity for any FGFR1-3c isoform and FGFR4. As mice with Fgfr1IIIb inactivation are phenotypically normal, it has been proposed that the majority of the FGFR1 signaling is carried out by IIIc isoforms (Partanen et al., 1998).
Review of the Literature
15
3.1.2. Expression patterns of FGFs and FGFRs in the mouse midbrain-R1
The onset of Fgf8 expression at the midbrain-R1 region is at E8.5 (4-somite stage), slightly later than the Otx2/Gbx2 expression boundary is established (Wurst and Bally-Cuif, 2001). Until at least E12.5 Fgf8 expression domain is detected as a narrow band in the most anterior R1 (Fig. 7). The onset and expression of other Fgfs at the midbrain-R1 region is also well reported. Fgf17 and 18, belonging to the Fgf8 subfamily, are expressed at the midbrain-R1 region already at E8.5 (Xu et al., 2000). Compared to the Fgf8, however, their expression domain is narrower. By E10.5, the level of Fgf17 and Fgf18 expressions is quite similar to Fgf8, but their expression is detected also in the most posterior midbrain (see summarized expression in Fig. 7). Between E10.5 and E12.5 expression of Fgf17 and 18 is detected in the midbrain-
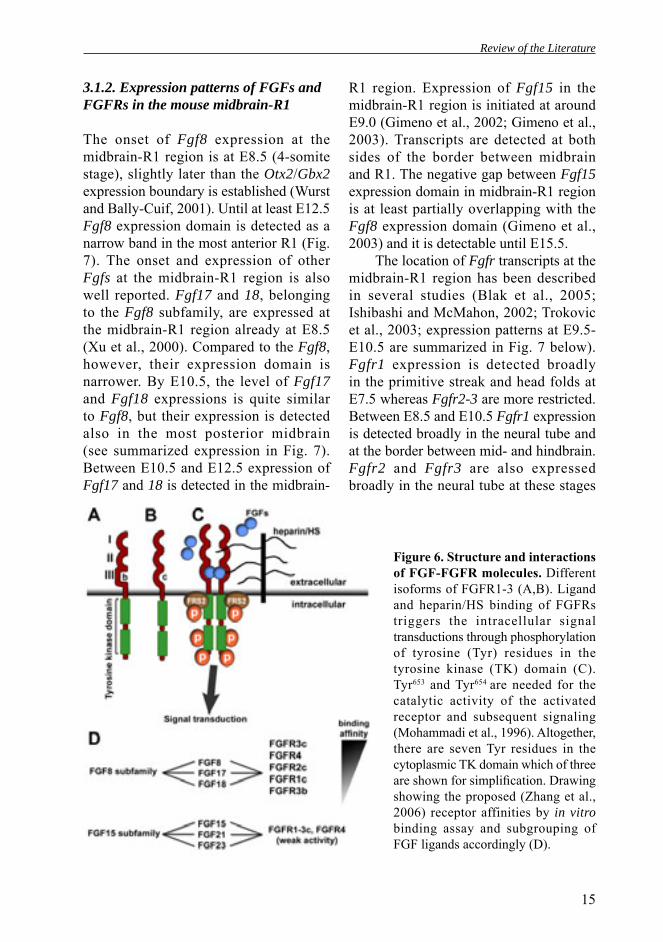
Figure 6. Structure and interactions of FGF-FGFR molecules. Different isoforms of FGFR1-3 (A,B). Ligand and heparin/HS binding of FGFRs triggers the intracellular signal transductions through phosphorylation of tyrosine (Tyr) residues in the tyrosine kinase (TK) domain (C). Tyr653 and Tyr654 are needed for the catalytic activity of the activated receptor and subsequent signaling (Mohammadi et al., 1996). Altogether, there are seven Tyr residues in the cytoplasmic TK domain which of three are shown for simplifi cation. Drawing showing the proposed (Zhang et al., 2006) receptor affinities by in vitro binding assay and subgrouping of FGF ligands accordingly (D).
R1 region. Expression of Fgf15 in the midbrain-R1 region is initiated at around E9.0 (Gimeno et al., 2002; Gimeno et al., 2003). Transcripts are detected at both sides of the border between midbrain and R1. The negative gap between Fgf15 expression domain in midbrain-R1 region is at least partially overlapping with the Fgf8 expression domain (Gimeno et al., 2003) and it is detectable until E15.5.
The location of Fgfr transcripts at the midbrain-R1 region has been described in several studies (Blak et al., 2005; Ishibashi and McMahon, 2002; Trokovic et al., 2003; expression patterns at E9.5-E10.5 are summarized in Fig. 7 below). Fgfr1 expression is detected broadly in the primitive streak and head folds at E7.5 whereas Fgfr2-3 are more restricted. Between E8.5 and E10.5 Fgfr1 expression is detected broadly in the neural tube and at the border between mid- and hindbrain. Fgfr2 and Fgfr3 are also expressed broadly in the neural tube at these stages
Review of the Literature

16
Figure 7. Summarized gene expression patterns of Fgfs and Fgfrs at E9.5-E11.5.
but a gap in expression at the midbrain-R1 region is detected (Blak et al., 2005; Fig. 7). Interestingly, from at E9.5 onwards Fgfr2 expression in the ventral midbrain is extending posteriorly close to the midbrain-R1 border but do not overlap with the Fgf8 expression (Blak et al., 2005). Fgfr4 expression has not detected at the midbrain-R1 region between E8.5 and E12.5 (Blak et al., 2005).
Although earlier in vitro binding assays (Zhang et al., 2006) have proposed only a weak affinity of FGF8 to FGFR1c (Fig. 6D), the interaction of these molecules during midbrain-R1 development was recently studied using surface plasmon resonance (SPR) assays (Olsen et al., 2006). The SPR analysis showed that the FGF8b splice form is capable to bind to FGFR1c isoform, which is consistent with genetic analyses proposing that FGF8 signals through FGFR1 during midbrain-R1 development (Chi et al., 2003; Trokovic et al., 2003).
3.1.3. FGFRs in the mouse midbrain-R1 development
The inactivation of Fgfr1 or Fgfr2 results in very early lethal phenotypes due to a failure in gastrulation (Arman et al., 1998; Deng et al., 1994). By contrast, Fgfr3 KO mice are viable, but exhibit skeletal and inner ear defects leading to a bone overgrowth and deafness (Colvin et al., 1996; Deng et al., 1996). Because other receptors can compensate for the loss of FGFR3, the role of FGFR3 in neurogenesis was recently studied using the gain-of-function approach (Inglis-Broadgate et al., 2005). In these constitutively active Fgfr3 knockout mice, the regulation of proliferation and apoptosis of cortical progenitors was defective which led to the increased brain size.
Conditional knockout studies of Fgfr1 using En1-Cre and Wnt1-Cre mice have shown its importance in the development of the midbrain-R1 region (Trokovic et al.,
Review of the Literature

17
2003). Conditional inactivation of Fgfr1 in the midbrain-R1 region using an En1-Cre mouse (Kimmel et al., 2000) results in a deletion of the inferior colliculi and vermis of the cerebellum in the dorsal midbrain-R1 region. By contrast, TH-positive neurons were found to be present in newborn and adult conditional Fgfr1 mutants, both in the midbrain DA neurons and in the locus coeruleus (LC) of the R1. In addition, ventral structures such as pontine nuclei as well as mesopontine nuclei were unaffected in conditional Fgfr1 mutants. Although TH-positive cells were present in the LC domain more detailed analysis revealed that the LC appeared to be disorganized in newborn Fgfr1 MHB-specifi c mutants. Conditional Fgfr1 MHB-specific mutants survived until adulthood, but they showed impaired motor coordination. The phenotype of the conditional Fgfr1 mutants is clearly less severe than the phenotype of the conditional Fgf8 mutants produced with the same En1-Cre mouse line (Chi et al., 2003). Inactivation of Fgf8 in the MHB led to the extensive cell death in the midbrain-R1 region between E8.5 and E10.0. Consequently, the ectopic apoptosis of MHB cellular progenitors caused the deletion of the entire midbrain, isthmus and cerebellum at E17.5.
The conditional allele of Fgfr2 was also recently generated and the effect of FGFR2 or FGFR3 deficiency on the development of midbrain-R1 region was subsequently studied. Interestingly, the analysis of midbrain-R1 specific Fgfr2 mutant mice and conventional Fgfr3 mutant mice showed that both receptors alone are dispensable for the formation of a normal phenotype and maintenance of the midbrain-R1 region (Blak et al., 2007). Thus, further analyses of FGFR1-3 double and triple mutants are needed to
clarify the exact role of FGFR signaling in the midbrain-R1 development.
3.1.4. FGFR signal transduction
The phosphorylation events in FGFR tyrosine kinase domain initiate various downstream cascades, such as RAS-mitogen activated protein kinase (RAS-MAPK), phosphatidylinositol 3’ kinase (PI3K/Akt) or phospholipase C gamma 1 (PLCγ1/PKC) pathways (Mohammadi et al., 1991; Mohammadi et al., 1996; Ong et al., 2001). These different pathways are dependent of docking or adaptor proteins with distinct Src-homology 2 (SH2) domains (Ryan et al., 1998). Consequently, the recruitment of different types of SH2 domain proteins triggers a specifi c network of complex signal transduction cascades.
Upon act ivat ion of a FGFR, phosphorylation of tyrosine residues promotes binding of the FRS2 and recruits the GRB2 and SOS adaptor proteins to the complex (Fig. 8). As a result, SOS catalyzes the conversion of RAS from an inactive GDP bound to an active GTP bound form. RAS then triggers the MAPK cascade by recruiting the RAF to the membrane and activates it. The kinase activity of RAS phosphorylates and activates the dual-specifi city kinase MEK, which in turn, phosphorylates the ERK. Phosphorylated forms of ERK molecules (pERK1 and 2) can then enter the nucleus where it activates transcription factors, including members of the ETS family of transcription factors.
RAS-MAPK pathway is activated by various ligand-receptor systems, including RTKs and G-protein-coupled receptors. Thus, it is striking that FGF signaling seems to be responsible for nearly all ERK1/2 activity in early frog and fish embryos (Christen and Slack, 1999; Tsang
Review of the Literature

18
Figure 8. FGF-FGFR signal transduction pathway. See text for details. Modifi ed from Jukkola et al. (2006).
and Dawid, 2004). In addition, expression of activated pERK has been observed in distinct domains in the mouse neural tube, predominantly in the midbrain-R1 region overlapping with the Fgf8/Fgf17/Fgf18 expression domains (Corson et al., 2003).
PI3K/Akt pathway also plays roles in FGF induced cell proliferation and cell survival. It has been shown that FGF8 induced activation of the PI3K/Akt pathway results to expression of Mkp3 which has a negative feedback action on the RAS-MAPK pathway (Echevarria et al., 2005; Kawakami et al., 2003). During mouse limb development downregulation of Mkp3 by small interfering RNA
(siRNA) induced apoptosis in the mesenchyme (Kawakami et al., 2003). In the mouse IsO explants the regulation of Mkp3 expression by FGF seems to be induced by PI3K/Akt pathway (Echevarria et al., 2005). These studies suggest that MKP3 has a role in mediating the anti-apoptotic signaling through FGF8 induced PI3K/Akt pathway.
The PLCγ1/PKC pathway involves binding of to phosphorylated tyrosine 766 residue of FGFR1 (Peters et al., 1992). Upon binding and activation through phosphorylation, PLCγ hydrolyzes phosphatidylinositol-4,5-diphosphate to form two second messengers, inositol-
Review of the Literature

19
1,4,5-triphosphate and diacylglycerol. Diacylglycerol is an activator of protein kinase C (PKC), whereas inositol-1,4,5-triphosphate stimulates the release of intracellular Ca2+. In mouse, FGFR1 alleles with a single point mutation at residue 766 replacing tyrosine with phenylalanine (Y766Fl) has been generated (Partanen et al., 1998; Peters et al., 1992). It was shown that this mutant receptor failed to bind PLCγ and the hydrolyzation of phosphatidylinositol as well as Ca2+ mobilization was abolished after FGF stimulation (Peters et al., 1992). However, mice homozygous for the Y766Fl allele were viable and fertile and did not show obvious brain or craniofacial defects (Partanen et al., 1998). Analysis of these mouse mutants showed that PLCγ1/PKC pathway through FGFR1 activation is not required for normal pre- or postnatal development or viability.
A set of genes known to be induced in regions of active Fgf8 signaling and thought to either transduce or modulate the FGF signaling pathway is termed as Fgf8 synexpression group. Among the Fgf8 synexpression group members are the transcription factors Pea3 and Erm, and the inhibitors Mkp3, Sef, Spry1 and Spry2 (Fig. 8; see below). In addition to being potential transcriptional targets of FGF signaling, PEA3 and ERM function as transcriptional effectors within cells to transduce FGFR-dependent signals. By contrast, MKP3, SEF and SPRYs act within cells as negative feedback inhibitors, modulating and restricting the levels and extent of FGF-FGFR signaling.
In RAS-MAPK signaling cascade, members of the ETS family are the key link between the FGF-FGFR signaling and transcriptional regulation. PEA3 (also known ETV4, Ets variant gene 4) and ERM (also known ETV5, Ets variant gene
5) are thought to be downstream targets of FGF-FGFR signaling (Liu et al., 2003b; Raible and Brand, 2001; Tsang and Dawid, 2004). The action of these transcription factors is hypothesized to promote the FGF signaling (e.g. Fgf8 expression) by activating as a positive feedback loop (Tsang and Dawid, 2004). The interactions of ETS transcription factors with the key transcriptional factors such as AP1, SRF and PAX family members further diversify the output of FGF signal transduction, although specific interactions between PEA3 subfamily (PEA3, ERM, ER81) and other key TFs has not been reported (reviewed by Sharrocks, 2001). Members of the PEA3 subfamily have been linked with the specification of neuronal cells (Arber et al., 2000; Roehl and Nusslein-Volhard, 2001). Pea3 or Er81 knockout mice displayed no overt brain phenotypes. In Pea3 -/- mice, however, a male sexual dysfunction was observed, which probably arises owing to neuronal defects (Laing et al., 2000). By contrast, inactivation of Er81 leads to an improper connection between a subset of sensory and motor neurons (Arber et al., 2000). One explanation for these relatively mild phenotypes is that there is redundancy between the members of the PEA3 subfamily. In the midbrain-R1 region, Erm expression is already detected at E8.5 whereas the onset of Pea3 expression is around E9.0 (Chotteau-Lelievre et al., 2001). Between E9.5 and E12.5, Erm and Pea3 expression is seen across the border between midbrain and R1. During development, Er81 expression has not been reported in the midbrain-R1 region.
Members of the Sprouty (SPRY1-4), MAPK phosphatase (MKP) and SEF families are negative modulators of FGF signaling (Fig. 8). SPRY is thought to inhibit FGF signaling by sequestering
Review of the Literature

20
GRB2 and preventing its binding to FRS2 (Hanafusa et al., 2002; Minowada et al., 1999), whereas another inhibitory mechanism involves direct interaction of SPRY2 with RAF (Yusoff et al., 2002). Only Spry1 and Spry2 are expressed at the midbrain-hindbrain region between E8.5 and E10.5 (Minowada et al., 1999). The similarity of these expression domains to Fgf8 expression in various regions suggested that they are coordinately regulated. Moreover, overexpression (FGF beads or Spry retrovirus infections) and gene inactivation studies in mouse, chick and zebrafish confirmed that vertebrate SPRYs are functionally conserved and act as FGF-induced feedback inhibitors (Furthauer et al., 2001; Mailleux et al., 2001; Minowada et al., 1999).
More recently, another negative feedback modulator of FGF-FGFR signaling, named MAPK phosphatase-3 (also known MKP3 or DUSP6) has been described in vertebrate limb buds (Eblaghie et al., 2003; Kawakami et al., 2003). MKP3 specifi cally dephosphorylates and inactivates ERK1/2. In the midbrain-R1 region, Mkp3 is expressed already at E8.5 in a region overlapping with Fgf8 expression domain (Echevarria et al., 2005). Later (E9.5-E10.5), when Fgf8 expression is defi ned to the most anterior R1, expression of Mkp3 is seen at both sides of the border between midbrain and R1. By siRNA knockdown analysis, Echevarria et al. (2005) showed that in the midbrain-R1 region the negative feedback mechanism of FGFR signaling is modulated by Mkp3 activity. In addition, they proposed that the expression Mkp3 in the midbrain-R1 region is induced by PI3K pathway.
SEF (similar expression to Fgfs; or Il17rd) and FLRT3 are conserved in vertebrates and both encode single-pass
transmembrane proteins. The intracellular domain of SEF is required for the interaction with FGFR1 and FGFR2 and subsequent inhibition of FRS2 (Tsang et al., 2002). Studies in zebrafish, mouse and human have shown that SEF inhibits FGF-induced activation of RAS-MAPK pathway, and mouse SEF also inhibits FGF-induced activation of protein kinase B (pkB/Akt), a key protein in the PI3K pathway (Kovalenko et al., 2003; Yang et al., 2003). There are at least two alternatively spliced isoforms of SEF in humans which are not reported in mice. SEF-a is an isoform that can interact with the receptors whereas another isoform, SEF-b, lacks the signal peptide and therefore it is cytoplasmic and suppresses RAS-MAPK pathway downstream of MEK (Preger et al., 2004). Between E8.5 and E12.5 Sef expression at the midbrain-R1 regions overlaps with the Fgf8, although its expression domain is broader (Lin et al., 2002).
FLRT3 together with FLRT1 and FLRT2, compose a novel gene family which were fi rst isolated in a screen for extracellular matrix proteins expressed in muscle cells (Lacy et al., 1999). The three genes encode a highly conserved family of glycosylated proteins (FLRTs) containing a fi bronectin III domain and leucine rich repeats (LRR) domain. Extracellular LRR repeats are commonly involved in protein-protein interactions. In particular, LRRs are common motifs in the extracellular region of transmembrane proteins and also in secreted proteins that are involved in ligand–receptor interactions or in cell adhesion. The former was supported by in vitro protein-protein interaction studies, both in Xenopus laevis (Bottcher et al., 2004) and in mouse (Haines et al., 2006), suggesting that members of the FLRT family can directly interact
Review of the Literature

21
with the different FGFRs. In addition, overexpression studies with Xenopus Flrt3 have suggested that FLRTs may promote FGFR signaling in vertebrates (Bottcher et al., 2004). In Xenopus, the role of FLRT3 in promoting FGFR signaling was further hypothesized by the overlapping Flrt3 and Fgf8 expression patterns, particularly in the midbrain-R1 region (Bottcher et al., 2004). Recent data suggest, that FLRTs may also mediate homophilic cell adhesion and cell sorting (Haines et al., 2006; Karaulanov et al., 2006). Thus, FLRTs may represent yet another family of cell-surface proteins that link cellular adhesion and signaling through transmembrane receptor.
CANOPY1 (CNPY1) is the latest member of the Fgf8 synexpression group. It was found in a screen for zebrafish genes expressed at the isthmus in response to signaling between the midbrain and the isthmus (Hirate and Okamoto, 2006). Cnpy1 was specifi cally expressed in the zebrafi sh midbrain-R1 region. Sequence analysis revealed that Cnpy1 is one of four structurally related proteins (CNPY1-4) conserved from mouse to human. Among Canopy family proteins, only Cnpy1 is specifically expressed in the midbrain-R1 region of zebrafish embryos. Human CNPY1 is localized in the endoplasmic reticulum and it may interact with the extracellular domain of the FGFR1. CNPY1 has structural similarity to saposins, proteins that bind sphingolipids, and it was speculated that CNPY1 could infl uence association of the receptor with lipid rafts. It was also shown that implantation of FGF8b-soaked beads in the midbrain of zebrafish embryos increased expression of Cnpy1 (Hirate and Okamoto, 2006). In addition, experiments in which expression of CNPY1 protein was blocked with antisense morpholino oligonucleotides showed that Cnpy1 was
essential for normal development of the zebrafi sh tectum and cerebellum.
C o n s t a n t p r o l i f e r a t i o n o f neuroepithelial cells in the midbrain-R1 region causes progressive growth of caudal midbrain and rostral hindbrain areas, respectively. However, the expression of Wnt1 and Fgf8 is constantly restricted to a band of only a few cell-diameters wide (e.g. app. 10 cell-layers of Fgf8 expressing cells in E10.5) at both sides of the border between midbrain and R1. Interestingly, the expression of MAPK pathway inhibitors such as Mkp3 as well as FGFR signal transduction activators such as Cnpy1 is detected in a broader midbrain-R1 region compared to Fgf8. It is thought that the extracellular spreading of FGF8 in a tissue is due to a diffusion-based mechanism controlled by an active endocytosis of the target cells (Scholpp and Brand, 2004). In these analyses, spreading of FGF8 protein labeled in vitro with Cy3 fl uorophore from a local source was monitored to determine how the molecule spreads through a target tissue. Reducing the rate of endocytosis led to an extracellular accumulation of FGF8 and resulted in broader domains of FGF-target gene expression, suggesting an increased spreading of FGF8. Thus, different levels of endocytosis allow different extent of spreading of FGF8 protein through the target tissue, leading to differential target gene response. However, the endogenous graded activity of FGF8 or other FGF proteins has not been directly visualized around the IsO.
3.2. WNT signaling in the midbrain-R1 development
In addition to FGF-FGFR signaling WNT signaling has an important role in early embryonic patterning through the
Review of the Literature
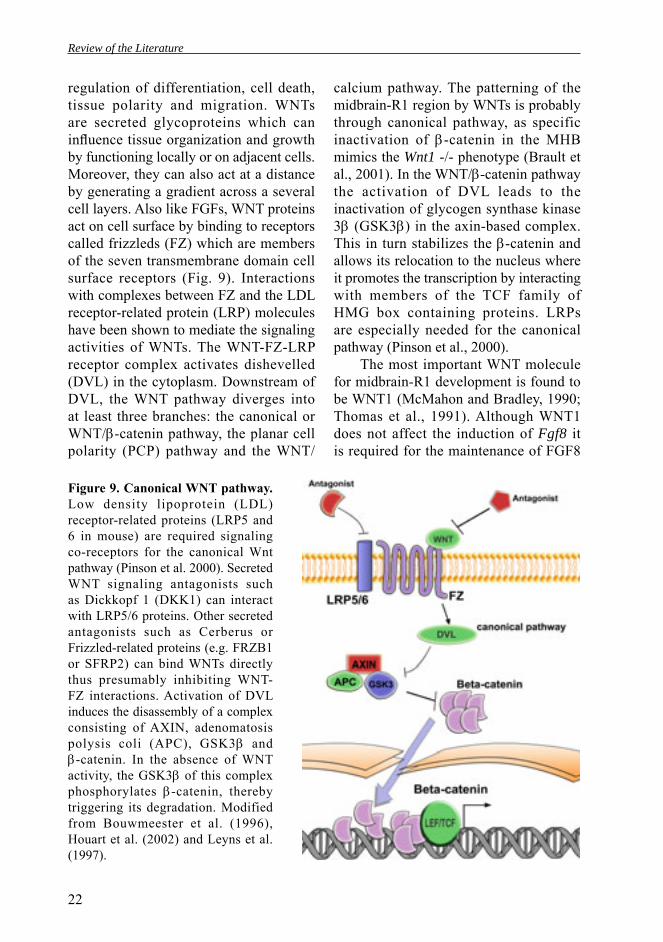
22
regulation of differentiation, cell death, tissue polarity and migration. WNTs are secreted glycoproteins which can infl uence tissue organization and growth by functioning locally or on adjacent cells. Moreover, they can also act at a distance by generating a gradient across a several cell layers. Also like FGFs, WNT proteins act on cell surface by binding to receptors called frizzleds (FZ) which are members of the seven transmembrane domain cell surface receptors (Fig. 9). Interactions with complexes between FZ and the LDL receptor-related protein (LRP) molecules have been shown to mediate the signaling activities of WNTs. The WNT-FZ-LRP receptor complex activates dishevelled (DVL) in the cytoplasm. Downstream of DVL, the WNT pathway diverges into at least three branches: the canonical or WNT/β-catenin pathway, the planar cell polarity (PCP) pathway and the WNT/
calcium pathway. The patterning of the midbrain-R1 region by WNTs is probably through canonical pathway, as specific inactivation of β-catenin in the MHB mimics the Wnt1 -/- phenotype (Brault et al., 2001). In the WNT/β-catenin pathway the activation of DVL leads to the inactivation of glycogen synthase kinase 3β (GSK3β) in the axin-based complex. This in turn stabilizes the β-catenin and allows its relocation to the nucleus where it promotes the transcription by interacting with members of the TCF family of HMG box containing proteins. LRPs are especially needed for the canonical pathway (Pinson et al., 2000).
The most important WNT molecule for midbrain-R1 development is found to be WNT1 (McMahon and Bradley, 1990; Thomas et al., 1991). Although WNT1 does not affect the induction of Fgf8 it is required for the maintenance of FGF8
Figure 9. Canonical WNT pathway. Low density lipoprotein (LDL) receptor-related proteins (LRP5 and 6 in mouse) are required signaling co-receptors for the canonical Wnt pathway (Pinson et al. 2000). Secreted WNT signaling antagonists such as Dickkopf 1 (DKK1) can interact with LRP5/6 proteins. Other secreted antagonists such as Cerberus or Frizzled-related proteins (e.g. FRZB1 or SFRP2) can bind WNTs directly thus presumably inhibiting WNT-FZ interactions. Activation of DVL induces the disassembly of a complex consisting of AXIN, adenomatosis polysis coli (APC), GSK3β and β-catenin. In the absence of WNT activity, the GSK3β of this complex phosphorylates β-catenin, thereby triggering its degradation. Modified from Bouwmeester et al. (1996), Houart et al. (2002) and Leyns et al. (1997).
Review of the Literature

23
expression, possibly through EN1. At E8.0 (0 somite stage), after the onset of Otx2 and Gbx2 expression Wnt1 is detected in a broad domain. Initially, Wnt1 expression overlaps partially with the Gbx2 domain, but becomes restricted to the Otx2-positive domain in the midbrain at 6 somite stage (Bally-Cuif et al., 1995). Subsequently, Wnt1 expression is restricted to a narrow band and its expression at the midbrain-R1 region is maintained at least until E14.5.
A number of β-catenin-TCF target genes have been identified in diverse biological systems and it is becoming clear that the majority of WNT target genes are tissue specific (Ciani and Salinas, 2005). Similarly to FGF-FGFR signal transduction, numerous WNT target genes appear to be positive and negative regulators of the pathway. These include positive regulators, such as FZ receptors, LRPs, and TCF/LEF and negative regulators, such as AXIN2 and SFRPs, which all are activated by the β-catenin-TCF transcription machineries. The best candidates for general downstream targets of β-catenin-TCF are AXIN2 and SP5 which are expressed in various tissues in vertebrates (Jho et al., 2002; Weidinger et al., 2005). In frog, En2 is a direct target of WNTs at the midbrain-R1 boundary region, but this has not been demonstrated in mouse (McGrew et al., 1999).
The role of other WNTs in the development of midbrain-R1 region has not been established in the mouse. In zebrafi sh, knockdown studies have shown that Wnt1 and Wnt10b provide partially redundant functions in the development of midbrain-R1 region (Buckles et al., 2004; Lekven et al., 2003). There are also indications that zebrafi sh Wnt8 is required for the early positioning of the IsO (Rhinn et al., 2005).
4. Cell proliferation in the developing brain
In order to generate appropriate number of neurons and glia in the correct spatial and temporal patterns, it is critical to regulate the number of progenitor cells. In addition the timing of cell differentiation (i.e. the exit from the cell cycle) is crucial for the size, shape and histogenesis of many tissues, including the brain.
The initial proliferation of neural progenitors in developing CNS is limited to the ventricular zone (VZ) that lines the lumen of the neural tube. The majority of neural progenitors give rise to postmitotic neurons by asymmetric divisions that migrate into more apical zones to form marginal layers. Although mitotic nuclei dynamically change their vertical location within the VZ coincidentally with the progression of the cell cycle, neural progenitors maintain a pseudo-stratifi ed columnar epithelium by linking with each other by adherens junctions.
4.1. Interkinetic nuclear migration
The adult brain is composed of neurons and glia, defi ned by cellular morphology, cell density and the formation of distinct neurites. During development, different types of cells are generated in the pseudostratifi ed epithelium that forms the ventricular zone (VZ), a layer of dividing progenitor cells at the ventricular surfaces of the developing neural tube (Bayer et al., 1991; Sauer 1935 in Developmental Neurobiology, Jacobson & Rao Eds. 2005). As progenitor cells progress through the cell cycle their nuclei undergo dynamic intracellular migration, called interkinetic nuclear migration (Sauer 1935). During this process (Fig. 10), nuclei move away from the apical surface
Review of the Literature
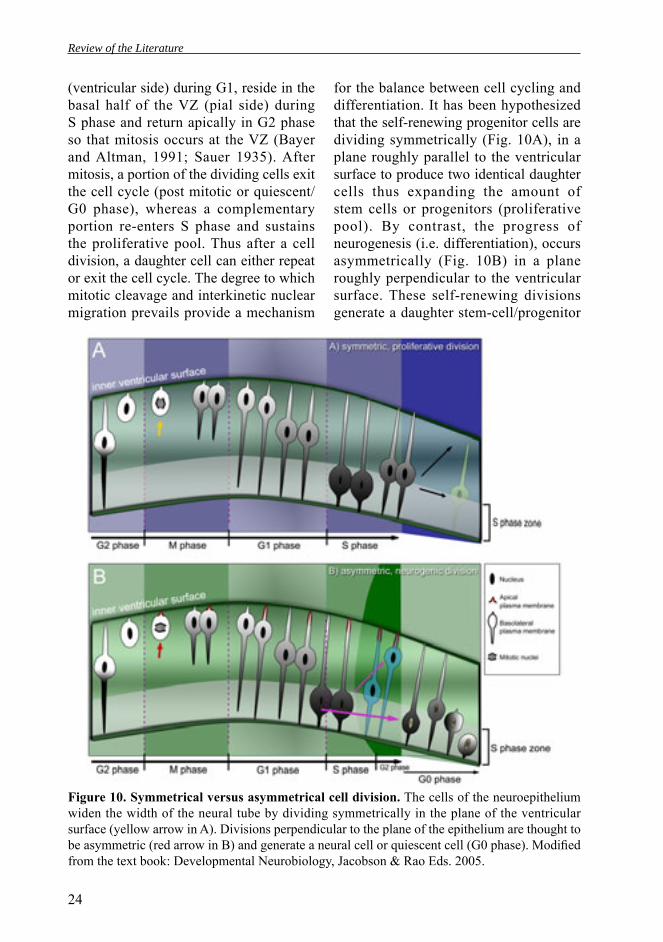
24
(ventricular side) during G1, reside in the basal half of the VZ (pial side) during S phase and return apically in G2 phase so that mitosis occurs at the VZ (Bayer and Altman, 1991; Sauer 1935). After mitosis, a portion of the dividing cells exit the cell cycle (post mitotic or quiescent/G0 phase), whereas a complementary portion re-enters S phase and sustains the proliferative pool. Thus after a cell division, a daughter cell can either repeat or exit the cell cycle. The degree to which mitotic cleavage and interkinetic nuclear migration prevails provide a mechanism
for the balance between cell cycling and differentiation. It has been hypothesized that the self-renewing progenitor cells are dividing symmetrically (Fig. 10A), in a plane roughly parallel to the ventricular surface to produce two identical daughter cells thus expanding the amount of stem cells or progenitors (proliferative pool). By contrast, the progress of neurogenesis (i.e. differentiation), occurs asymmetrically (Fig. 10B) in a plane roughly perpendicular to the ventricular surface. These self-renewing divisions generate a daughter stem-cell/progenitor
Figure 10. Symmetrical versus asymmetrical cell division. The cells of the neuroepithelium widen the width of the neural tube by dividing symmetrically in the plane of the ventricular surface (yellow arrow in A). Divisions perpendicular to the plane of the epithelium are thought to be asymmetric (red arrow in B) and generate a neural cell or quiescent cell (G0 phase). Modifi ed from the text book: Developmental Neurobiology, Jacobson & Rao Eds. 2005.
Review of the Literature

25
and a more differentiated cell type such as a non-stem-cell progenitor or a neuron (Gotz and Huttner, 2005). As neuronal production proceeds during the development, asymmetrical division starts to predominate (after E12.5 in mouse). However, toward the end of the neurogenesis, non-stem-cell progenitors revert back to symmetrical divisions which start to predominate, but produce two identical terminally differentiated neurons (green cell in Fig 10A).
4.2. Cell cycle regulators
4.2.1. Cyclins, Cdks and their inhibitors
The genes that control the number of cell divisions in the vertebrate CNS are beginning to be understood. Cyclins are a group of proteins that show ‘cyclic’ changes in their expression levels that correlate with specific phases of the cell cycle (Fig. 11A). Cyclins bind their catalytic partners, cyclin-dependent kinases (CDKs), and it is now clear that
CDKs, either directly or indirectly control the major cell-cycle transitions and phases in all eukaryotic organisms. Different cyclin/CDK interactions are required at different phases of the cell cycle. The association of cyclins with CDKs results to phosphorylation of retinoblastoma susceptibi l i ty protein (pRb) and progression to the next phase of the cell cycle through transcriptional activation of target genes (Deng et al., 1995; Shtutman et al., 1999). In mammalian cells, there are two classes of CDKs that function at the G1/S phase transition (Sherr, 1994). CDK4 and its close relative CDK6 are driven by three D-type cyclins (CyclinD1-D3). By contrast, CyclinE activates specifi cally CDK2. CyclinE accumulates very close to the G1/S phase transition and has a role in phosphorylating pRb (Ciemerych and Sicinski, 2005). CyclinE expression is more periodic than that of D-type cyclins (Roberts and Sherr, 2003). CyclinA also activates CDK2 that plays role in the S phase progression. B-type cyclins (CyclinB1-B3 in mouse) as well as
Figure 11. The phases of cell cycle and cell cycle gene expression. (A) The diagram shows the period in the cell cycle when each of the cyclins is expressed. Cdks are expressed more or less throughout the cell cycle, but their activation (phosphorylation) is phase specifi c. A cell proliferation marker protein, KI67, distributes to the chromosome periphery during mitosis and nucleolar heterochromatin in the interphase. (B) Regulation of CyclinD-CDK4/6 complex. The association of CyclinDs with CDKs depends, for example, on the Cip/Kip family of CKIs. It is also negatively regulated by INK4 inhibitors. Once assembled CyclinD-CDK4/6 complexes are subjected to inhibition by Cip/kip inhibitors such as p21 and p27. Adapted from Roberts (1999).
Review of the Literature

26
CyclinA together with their kinase partner CDK1 (also called CDC2), represent the important controllers of the G2/M phase progression (Ciemerych and Sicinski, 2005).
CyclinD1 (also called CYCD1 or CCND1 in MGI) together with associated kinases (CDK4 and CDK6) phosphorylate the substrate proteins (e.g. retinoblastoma protein, Rb) that lead to release of E2F transcription factor. For example pRB phosphorylation by CyclinD1/CDK4 complex is necessary for progression from the G1 phase to S phase (DNA synthesis). In contrast to other cyclins, which are induced periodically during cell cycle progression, the expression of D-type cyclins is controlled largely by the extracellular environment (reviewed in Roberts, 1999).
R e g u l a t i o n o f c y c l i n / C D K s complexes occurs at multiple levels, including assembly of cyclin and CDK subunits, phosphorylation and dephosphorylation events and association of cyclin/CDK complexes by inhibitory proteins (Fig. 11B). These regulators include CAKS (CDK activating kinases) and phosphatases, such as Drosophila and vertebrate orthologues string and CDC25, respectively (Kakizuka et al., 1992). In mouse, the activity of one of three CDC25 tyrosine phosphatases on CDK1 results in full activation of CyclinB-CDK1 complex and cell’s entry into mitosis (Galaktionov and Beach, 1991). In addition, there are number of CDK inhibitors (cyclin- dependent kinases inhibitors, CKIs), which bind to CDKs and block their catalytic activity (Sherr and Roberts, 1999). They are grouped to two classes called the Cip/Kip family and the INK4 family. The Cip/Kip family is composed of three members p21, p27 and p57 which can bind to and inhibit all known CDKs (Deng et al., 1995; Kukoski et al., 2003; Shtutman et
al., 1999). The INK4 family is composed of four members: p15, p16, p18 and p19 and they specifically inhibit the CDK4/CDK6 activity (Sherr and Roberts, 1999).
4.2.2. Cyclins and Cdks in neuronal development
During mouse development D-type cyclins are expressed in a tissue-specific, but greatly overlapping manner (Ciemerych et al., 2002; Wianny et al., 1998). At E8.5, CyclinD1 is expressed broadly in the midbrain-R1 region whereas CyclinD2 expression is absent from rhombomeres 1 and 2. Later between E9.5 and E11.5 CyclinD1 and CyclinD2 expression is detected strongly at the midbrain-hindbrain region in an overlapping pattern. Mice lacking the individual cyclins (CyclinD1, D2 or D3) have been generated and the observed defects in neurogenesis were relatively mild. In summary, CyclinD1 defi cient mice showed reduced body size and neurological abnormalities caused by an unknown mechanism (Fantl et al., 1995; Sicinski et al., 1995). By contrast, CyclinD2 KOs exhibited cerebellar defects which were showed to be due to a decreased proliferation of granule cell precursors (Huard et al., 1999). In addition, the adult CyclinD2 knockout mice lack newly born neurons in the dentate gyrus of the hippocampus and in the olfactory bulb (Kowalczyk et al., 2004). Neurological defects were not reported in CyclinD3 knockouts (Sicinska et al., 2003). Mice lacking the combinations of the D-type cyclins (double and triple KOs) represented the sum of the phenotypes observed in the individual CyclinD mutants (Kozar et al., 2004). Thus, these analyses suggested that the proliferation of several neuronal cell types could take place in a CyclinD-independent fashion (Kozar et al., 2004).
Review of the Literature

27
The role of other type of cyclins such as CyclinA or CyclinB in neuronal development has not been reported. These cyclins together with their kinase partner CDK1, represents the major regulators of the G2/M phase progression. Both CyclinA2 and CyclinB1 knockout mice showed an early embryonic lethality (Brandeis et al., 1998; Murphy et al., 1997) whereas CyclinA1 or CyclinB2 mutants were viable, but no overt CNS phenotypes were observed (Brandeis et al., 1998; Liu et al., 1998). The expression of A- and B-type of cyclins during the early brain development has not been reported.
In conventional mutant mice defi cient for the Rb protein, progenitor proliferation in the CNS is profoundly deregulated, resulting in excess dividing cells localized to normally post-mitotic regions (Clarke et al., 1992). These mice lacking Rb die around E15.5 due to a severe anemia. More recently, Wu et al. (2003) found that the failure of the placental development caused the early lethality. To circumvent the placental abnormalities they produced rescued Rb-defi cient mice with a wild-type placentas using tetraploid complementation technique. Interestingly, no developmental defects in the CNS were observed in these rescued mice (de Bruin et al., 2003; Wu et al., 2003).
4.2.3. Cdk inhibitors in neuronal development
Critical negative regulators of the cyclin/CDKs p21 are p27 are expressed in the developing and adult nervous system in the differentiating neurons shortly after they have withdrawn from the mitotic cycle (Parker et al., 1995). The development of neurons in the CNS requires that progenitor cells leave the cell cycle and activate specifi c programs of differentiation and migration. Genetic studies have identifi ed
some of the molecules controlling these cellular events, but how the different aspects of neurogenesis are integrated into a coherent developmental program remains unclear. One possible mechanism implicates multifunctional proteins that regulate both cell cycle exit and cell differentiation. The expression of p21 during mouse development correlates with terminally differentiating cells such as olfactory neurons (Deng et al., 1995; Parker et al., 1995). However, the fact that p21 knockout mice appears to have normal brain development, indicates that any essential role for p21 in terminal differentiation must be redundant (Deng et al., 1995). In the other hand, p27 deletion in mice causes a phenotype opposite of that of the CyclinD1/D2 double knockout, which shows reduced body size and hypoplastic cerebella. In p27 KO animals, the gene inactivation causes an overproduction of neuronal cells (Kiyokawa et al., 1996; Nguyen et al., 2006). p27 has recently been shown to function beyond cell cycle regulation and promote both neuronal migration and differentiation of newborn cortical neurons, through distinct and separable mechanisms. A report by Nguyen et al. (2006) shows that cytoplasmic p27 protein promotes neuronal migration by direct blocking of the small GTPase RhoA and its downstream pathway. Morover, p27 can act as a Neurogenin 2 (NGN2) stabilizer and promotes neuronal differentiation.
Little is known about the regulation of cell cycle inhibitors by transcription factors. In vitro overexpression of basic HLH genes such as NeuroD in the P19 or HeLa cell lines can induce p27 or p21, respectively (Farah et al., 2000; Mutoh et al., 1998). The p21 promoter sequence contains multiple bHLH activator-binding sites (E-boxes) which have been shown to be functional in the up regulation
Review of the Literature

28
of p21 (Prabhu et al., 1997). Elevated p21 expression and ectopic mitosis are observed also in the enteric epithelium of NeuroD-knockout mice (Mutoh et al., 1998). In addition, the basic helix-loop-helix genes Hes1 which is an essential effector for Notch signaling can repress expression of the p21 in vitro (Castella et al., 2000; Kabos et al., 2002).
4.3. Mechanisms controlling the cell polarity and asymmetric cleavage
The mechanisms that regulate the interkinetic nuclear migration and the transition from predominantly symmetrical to predominantly asymmetrical divisions are poorly understood. Apico-basal polarity is an essential characteristic for interkinetic nuclear migration. Recently, the role of small GTPase CDC42 in the maintenance of apico-basal polarity and self-renewal was showed in the cerebral cortex (Cappello et al., 2006). Conditional inactivation of Cdc42 at different developmental stages demonstrated that Cdc42 is needed for the apically directed interkinetic nuclear migration. In addition to polarity, other cellular mechanisms such as cell cycle length, orientation of mitosis and basement membrane composition are thought to regulate the decisions between progenitor cell proliferation and differentiation. Clonal analysis on oligodendrocyte progenitor cells suggested that an intrinsic clock operates within each cell to assist control when the cell stops dividing and differentiates (Temple and Raff, 1986). Thus, a similar “cellular” clock, which can be infl uenced by extrinsic signals, may act to control the balance between the cell cycle progression and differentiation also in neural progenitors. For example, at the start of cortical neurogenesis Pax6 inactivation resulted in the increased cell cycle length and the
premature expression of neural-specific markers, such as TUJ1 (Estivill-Torrus et al., 2002). Reduction of the cell cycle length by decreasing G1 phase increases the likelihood of cell cycle re-entry and might expand the pool of neuronal progenitor cells. For example, the transition of neuroepithelial to radial glial cells and their progression from proliferative to differentiating divisions during embryonic development is associated with an increase in the length of their cell cycle (Cappello et al., 2006). Remarkably, this increase in cell-cycle length is predominantly due to a lengthening of the G1 phase.
In addition to the apico-basal polarity, a plane parallel to the plane of neuroepithelium defi nes planar polarity, which plays a role in the development of pattern across a fi eld of cells. The planar polarity and signals may also contribute to cell cycle progress in adjacent brain compartments (Guthrie et al., 1991).
4.4. Cellular proliferation and regulation in the rhombomeric boundaries
It is suggested that the highest level of proliferation is detected at rhombomeres whereas the inter rhombomeric boundaries show reduced rates of proliferation/cell cycle progression (Guthrie et al., 1991). Guthrie et al. (1991) showed that at rhombomere boundaries DNA synthesis (S-phase) occurs closer to the ventricular surface compared to cell within rhombomeres where S-phase cells were detected more basally. The molecular mechanisms and regulators responsible for these changes in nuclear migration patterns in the rhombomeric boundaries are currently unknown. Later in development, the proliferative cells of ventricular zone are restricting the cell mixing between rhombomeres after evident hindbrain
Review of the Literature

29
segmentation disappears (Wingate and Lumsden, 1996).
Cadherins mediate cell adhesion and play a fundamental role in normal development. In the neuroepithelium, they participate in the maintenance of proper cell-cell contacts. Cadherins are associated with the actin cytoskeleton through β- and α-catenins to maintain adherens junctions between cells (Nelson and Nusse, 2004). The canonical WNT pathway acts also at the level of transcription, wherein the WNT signal stabilizes and increases β-catenin in the cytoplasm and nuclei. β-catenin regulates the expression of numerous target genes, including CyclinD1 that progresses through the G1-to-S-phase cell-cycle transition (Shtutman et al., 1999). Because cadherins sequester β-catenin into the adhesion complex on the cell surface, it is thought to have dual regulatory roles there, acting positively on cell adhesiveness and negatively on the WNT canonical pathway, which can reduce the progression of the cell cycle (Nelson and Nusse, 2004).
In rhombomeres, CyclinD1 and CyclinD2 show distinct segments specifi c expression patterns, which are temporally regulated along the AP axis (Wianny et al., 1998). The rhombomere specific expression of CyclinD1/2 could be the one mechanism to regulate the length of the G1 phase in rhombomeres. Interestingly, restricted expression of CyclinD1 and CyclinD2 are detected before the formation of inter-rhombomeric boundaries (3-5 somite stage).
Several Wnt genes are expressed in developing hindbrain. For example, Wnt1 and Wnt3a are expressed in the zebrafi sh hindbrain. In addition, the zebrafi sh Wnt genes (Wnt1, Wnt3a, Wnt8b, and Wnt10b) show elevated expression at rhombomere boundaries (Riley et al . , 2004). Consequently, partial inactivation of WNT
signaling by knockdown of zebrafi sh Wnt1 or Tcf3b results to deregulation of boundary regions (Riley et al., 2004) and ectopic expression of boundary cell markers, Rfng (radical fringe) and Foxb1.2, in non-boundary regions of the hindbrain (Amoyel et al., 2005). In the latter, authors showed that the Wnt1-positive cells expressed in the rhombomeric boundary and roof plate contributed to upregulation of proneural and Delta gene expression. As Delta cell-autonomously blocks Notch activation, this pathway mediates lateral inhibition that prevents spreading of the Wnt1 boundary expression domain. Thus, boundary cells play a key role in the regulation of cell differentiation in the zebrafi sh hindbrain (Amoyel et al., 2005). These data suggest that WNT and Notch-Delta signaling regulate neurogenesis in non-boundary regions, which in turn blocks ectopic boundary marker expression. Similar feedback mechanisms operate in the Drosophila wing disc and vertebrate limb bud, suggesting adaptation of a conserved signaling module that spatially organizes cells in complex organ systems. In the mouse, however, only the midbrain and cerebellum is deleted in mice mutant for Wnt1 (McMahon and Bradley, 1990; Thomas et al., 1991) suggesting redundancy between WNT signals.
These results obtained from the rhombomeric boundaries contribute to our understanding of how the cell cycle control can be linked to the patterning programs to infl uence the balance between proliferation and neuronal differentiation in discrete progenitor domains. An analogous situation to rhombomeric boundaries occurs in the IsO in which a signaling center expressing Fgf8 and Wnt1 in the adjacent brain regions. Thus, the cellular mechanisms characteristic for the rhombomeric cell cycle regulation might be similar in the IsO.
Review of the Literature
30
AIMS OF THE STUDY
The aim of this study was to characterize the molecular and cellular mechanisms responsible for the midbrain and rhombomere 1 patterning defects observed in the conditional Fgfr1 mutant mice.
The aims were:
I. To identify FGFR1 and/or IsO target genes (I).II. To characterize expression of one of these, Drapc1 (II).III. To study the FGF-regulated neurogenesis in the midbrain-R1 region (I). IV. The aim was also to study the cell cycle regulation at the midbrain-hindbrain
boundary (III, IV).
Aims of the Study
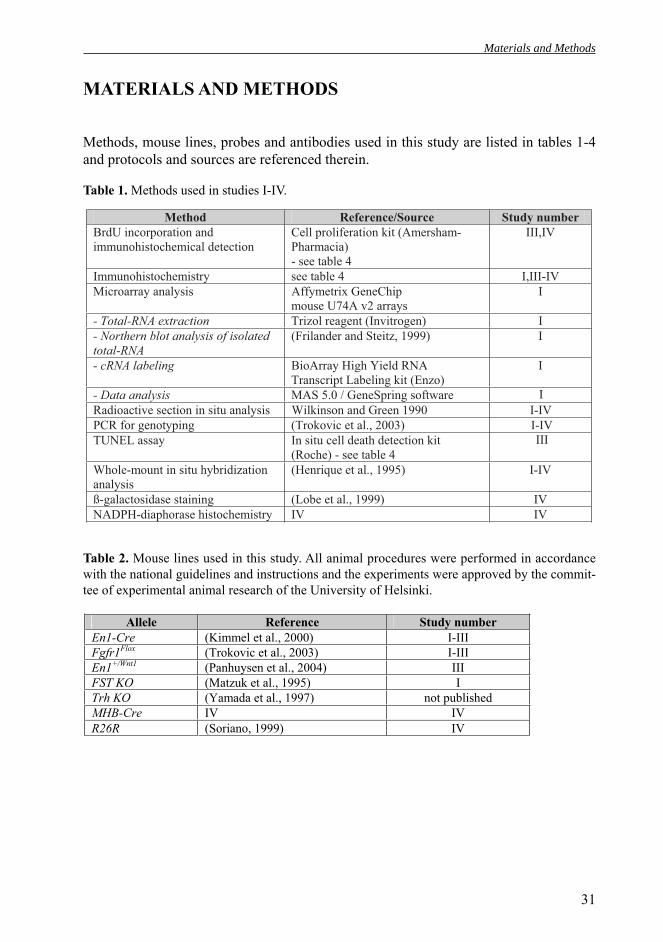
31
Method Reference/Source Study numberBrdU incorporation andimmunohistochemical detection
Cell proliferation kit (Amersham-Pharmacia)- see table 4
III,IV
VI-III,I4elbateesyrtsimehcotsihonummIMicroarray analysis Affymetrix GeneChip
mouse U74A v2 arraysI
- Total-RNA extraction Trizol reagent (Invitrogen) I- Northern blot analysis of isolatedtotal-RNA
(Frilander and Steitz, 1999) I
- cRNA labeling BioArray High Yield RNATranscript Labeling kit (Enzo)
I
- Data analysis MAS 5.0 / GeneSpring softwareRadioactive section in situ analysis Wilkinson and Green 1990 I-IVPCR for genotyping (Trokovic et al., 2003) I-IVTUNEL assay In situ cell death detection kit
(Roche) - see table 4Whole-mount in situ hybridizationanalysis
(Henrique et al., 1995) I-IV
ß-galactosidase staining VI)9991,.lateeboL(VIVIyrtsimehcotsihesarohpaid-HPDAN
I
III
MATERIALS AND METHODS
Methods, mouse lines, probes and antibodies used in this study are listed in tables 1-4 and protocols and sources are referenced therein.
Table 2. Mouse lines used in this study. All animal procedures were performed in accordance with the national guidelines and instructions and the experiments were approved by the commit-tee of experimental animal research of the University of Helsinki.
Table 1. Methods used in studies I-IV.
Allele Reference Study number En1-Cre (Kimmel et al., 2000) I-III Fgfr1Flox (Trokovic et al., 2003) I-III En1+/Wnt1 (Panhuysen et al., 2004) III FST KO (Matzuk et al., 1995) I Trh KO (Yamada et al., 1997) not published MHB-Cre IV IV R26R (Soriano, 1999) IV
Materials and Methods

32
Table 3. Probes used for in situ hybridization.
Probe Annotation / Reference Study number A) Mouse
Aldh1 (Hermanson et al., 2003) I CyclinD1 IMAGE 3155470 III Fgfr1 (Trokovic et al., 2003) III Fgfr2 (Trokovic et al., 2003) III Fgfr3 (Trokovic et al., 2003) III Gata3 (Lillevali et al., 2004) I Hes3 clone UI-R-BO1-ajt-e-02-0-UI.r1 I Lmx1b a gift from H. Simon I Mash1 IMAGE 6415061 I Ngn2 IMAGE 2922473 I Nurr1 (Wallen et al., 1999) I Otx2 (Acampora et al., 1997) I,III,IV Pb-cadherin (Trokovic et al., 2003) III, IV Phox2a IMAGE 534970 I Pet1 clone UI-M-BH3-avj-b-02-0-
UI.s1 I
Pitx3 IMAGE 482871 I p21 A gift from Bert Vogelstein III,IV Sert (Slc6a4) A gift from Wolfgang Wurst I VaChT (Trokovic et al., 2003) I Wnt1 (Trokovic et al., 2003) I
Other probes and their references are listed in the results section (Tables 5 and 6). B) Chicken ESTs* Drapc1 (or Pogo1) ChEST ID: C0000369 unpublished ChEST ID: C0003888 “ ChEST ID: C0001388 “
C) Zebrafish Cnpy1 IMAGE 7068815 I
*Chicken cDNAs ordered from ARK-Genomics (Boardman et al. 2002).
Materials and Methods
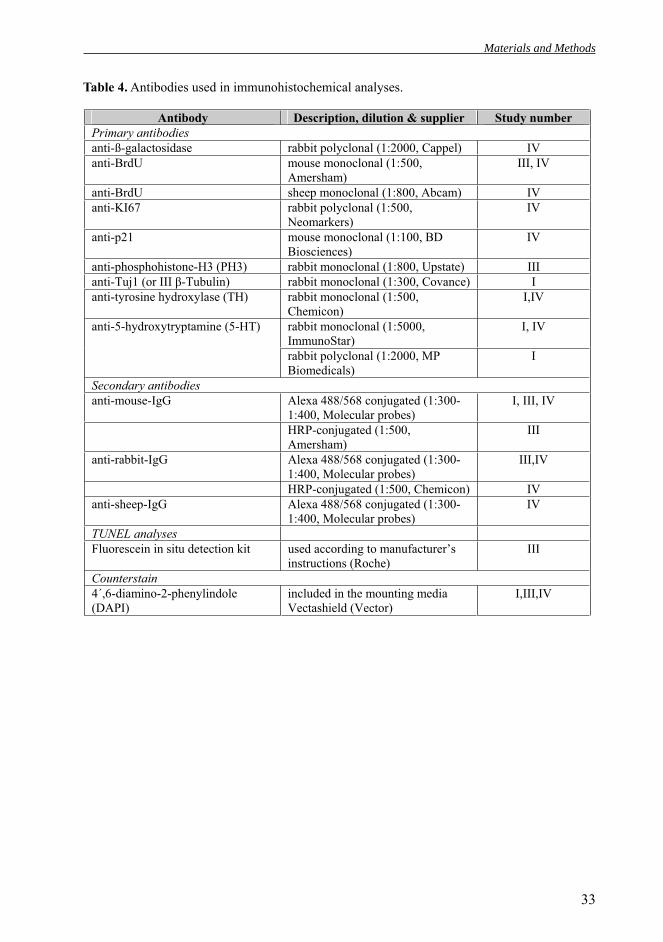
33
Table 4. Antibodies used in immunohistochemical analyses.
Antibody Description, dilution & supplier Study number Primary antibodiesanti-ß-galactosidase rabbit polyclonal (1:2000, Cappel) IV anti-BrdU mouse monoclonal (1:500,
Amersham) III, IV
anti-BrdU sheep monoclonal (1:800, Abcam) IV anti-KI67 rabbit polyclonal (1:500,
Neomarkers) IV
anti-p21 mouse monoclonal (1:100, BD Biosciences)
IV
anti-phosphohistone-H3 (PH3) rabbit monoclonal (1:800, Upstate) III anti-Tuj1 (or III -Tubulin) rabbit monoclonal (1:300, Covance) I anti-tyrosine hydroxylase (TH) rabbit monoclonal (1:500,
Chemicon) I,IV
rabbit monoclonal (1:5000, ImmunoStar)
I, IV anti-5-hydroxytryptamine (5-HT)
rabbit polyclonal (1:2000, MP Biomedicals)
I
Secondary antibodiesanti-mouse-IgG Alexa 488/568 conjugated (1:300-
1:400, Molecular probes) I, III, IV
HRP-conjugated (1:500, Amersham)
III
anti-rabbit-IgG Alexa 488/568 conjugated (1:300-1:400, Molecular probes)
III,IV
HRP-conjugated (1:500, Chemicon) IV anti-sheep-IgG Alexa 488/568 conjugated (1:300-
1:400, Molecular probes) IV
TUNEL analyses Fluorescein in situ detection kit used according to manufacturer’s
instructions (Roche) III
Counterstain4´,6-diamino-2-phenylindole (DAPI)
included in the mounting media Vectashield (Vector)
I,III,IV
Materials and Methods

34
RESULTS AND DISCUSSION
1. Microarray analysis of Fgfr1 CKO mutants (I-III)
To get better understanding of the Fgfr1 regulated and/or isthmic organizer specifi c genes, we used microarray-based strategies for identifi cation of genes whose expression is affected in the conditional Fgfr1 mutants. For these studies, total RNA from dissected midbrain-R1 tissues of E10.5 wild-type and En1-Cre/+; Fgfr1Flox/
Flox (Trokovic et al., 2003, referred as Fgfr1 CKO mutants hereafter) embryos was isolated. The dissected region contained the posterior midbrain as well as the most anterior part of the rhombomere 1 (R1) of the hindbrain (Fig. 12). The hybridizations were carried out on Affymetrix GeneChip arrays (mouse U74A version 2 arrays).
Figure 12. Experimental design for microarray analysis of midbrain-R1 region. Reproduced from Jukkola et al. (2006).
Among the genes, which were found to be down-regulated in the mutants, there were many whose expression was previously found to be down-regulated in Fgfr1 CKO mutants using the candidate gene approach (Table 5). Among the down-regulated transcripts, there were also products of many genes, which previously were not known to be expressed at the midbrain-R1 region or which represent previously poorly characterized transcripts (e.g. expressed sequence tags, ESTs; see Table 7). Many of the down-regulated genes are components or regulators of the signaling cascades downstream of receptor tyrosine kinases (Table 7 and Fig. 13).
Results and Discussion

35
Gene / EST Afymetrix probe set
ID
Fold change
Validation by in situhybridisation*
Probe(s) for in situhybridisation
Fgf17 98730_at 0.06 Fig. 1B in I (Xu et al., 2000) Spry1 163956_at 0.24 Fig. 1C in I (Zhang et al., 2001) En1 96523_at 0.29 Fig. 2A in I (Davis and Joyner,
1988)Fgf8 97742_s_at 0.30 Fig. 1B in I (Crossley and Martin,
1995)Spry2 116938_at 0.30 Fig. 1C in I (Zhang et al., 2001) Trh 102665_at 0.31 Fig. 2E in I IMAGE 559851
IMAGE 559851 IMAGE 651225
Cnpy1 138472_at 0.35 Fig. 2C in I AI853839 (3’) IMAGE:6390940 (5')
Fgf18 95316_at 0.35 Fig. 1B in I (Xu et al., 2000) Fgfr1 97509_f_at 0.38 Expresion
downregulated (Trokovic et al., 2003)
Tnfrsf19 (Trade) 160670_at 0.39 Fig. 2K in I (Pispa et al., 2003) Sef 133830_at 0.41 Fig. 1C in I IMAGE 1178421 Erm (Etv5) 163173_at 0.41 Fig. 1D in I IMAGE 3674281 Mkp3 (Dusp6) 93285_at 0.42 Fig. 1C in I IMAGE 874051
IMAGE 1138569 Nfia 130461_at 0.48 In WT embryos: Broad
expression in the midbrain-R1 region and
in the neural tube
IMAGE 1053853
Mrp4 (Abcc4) 111137_at 0.50 Fig. 2F in I IMAGE 1153158 IMAGE 3325098 IMAGE 367701
Pax5 95890_r_at 0.50 Fig. 2D in I IMAGE 3333164 EST6 163120_at 0.51 In WT embryos: No
specific expression detected
IMAGE 534449 IMAGE 5363361
Pcx 171076_i_at 0.51 In WT embryos: No specific expression
detected
IMAGE 5044506 IMAGE 5053475
En2 98338_at 0.52 Fig. 2B in I (Liu and Joyner, 2001) Sfrp2 93503_at 0.52 Fig. 2L in I IMAGE 4487469 Fgf15 97721_at 0.54 Fig. 1B in I (McWhirter et al., 1997)Atp1a1 93797_g_at 0.54 In WT embryos: No
specific expression detected
UI-M-BH2.3-aqc-d-05-0-UI (BMAP)
4921506J03Rik 99163_at 0.54 In WT embryos: No specific expression
detected
IMAGE 5721414 IMAGE 5290667
Igfbp5 100566_at 0.54 Fig. 2J in I IMAGE 318625 Nfib 160859_s_at 0.54 In WT embryos:
Expressed in the ventral midbrain-R1
region
IMAGE 617412 IMAGE 4038233 IMAGE 4237079
RhoA (Arha2) 101112_g_at 0.55 In WT embryos: Broad expression in the
midbrain-R1 region and in the CNS
IMAGE 4190318 IMAGE 4234611
Sox3 92264_at 0.56 Fig. 2I in I IMAGE 368804 Drapc1 96132_at 0.59 Fig. 2M in I IMAGE 1764103
IMAGE 374528 IMAGE 5038498 (Jukkola et al., 2004)
Flrt3 110370_at 0.60 Fig. 1C in I IMAGE 5702881 Epcs3 (Ftsj3) 95756_at 0.60 -
Ccnd2 97504_at 0.60 Fig. 2H in I IMAGE 367058 Fabp7 98967_at 0.62 In WT embryos:
Expressed in the IMAGE 436894 IMAGE 334095
Table 5. Genes down regulated in Fgfr1 CKO mutants at E10.5.
Results and Discussion

36
Table 5 continuing
* Published in I or if not stated refers to unpublished data.
The microarray screen revealed also genes, whose expression was up-regulated in the Fgfr1 CKO mutants (Table 6). Among these were many factors that have been associated with neuronal differentiation (see Table 8). In addition,
the loss of isthmic signals can be expected to result in premature differentiation. Therefore, it was hypothesized that the up-regulated gene list may include novel components of the neuronal differentiation pathway at the midbrain-R1 region.
Results and Discussion
Gene / EST Afymetrix probe set
ID
Fold change
Validation by in situhybridisation*
Probe(s) for in situhybridisation
ventral midbrain
Eef1a1 94766_at 0.63 -
Pip92 (Ier2) 99109_at 0.63 Expressed strongly in the ventral neural tube
and in the MHB boundary region which
is lost in mutants
IMAGE 3376243
Pea3 (Etv4) 92979_at 0.64 Fig. 1D in I (Lin et al., 1998) Kik1 (Hsd17b12) 94276_at 0.65 In WT embryos: no
expression detected IMAGE 6394399 IMAGE 747788
Snx5 117186_at 0.65 In WT embryos: no expression detected
IMAGE 3492262 IMAGE 6812794
Tcf7 97994_at 0.65 Fig. 2N in I A gift from Irma Thesleff
Bnip3l 96255_at 0.66 In WT embryos: : no expression detected
IMAGE 1513890
Gstm5 100629_at 0.67 In WT embryos: : no expression detected
IMAGE 671545
Prkrir 99975_at 0.67 -
Ccnb1 160159_at 0.69 Expressed broadly in the CNS. Absent from the MHB border region and downregulated in
the mutants
IMAGE 3971364 IMAGE 3973833 IMAGE 4014448
Spred2 161070_at 0.69 In WT embryos: no specific exprresion
detected
IMAGE 4988566
Nrp 95016_at 0.69 -
Rraga 94257_at 0.70 In WT embryos: expressed broadly in
the CNS and limb buds
IMAGE 5401569
1200007D18Rik 160184_at 0.71 In WT embryos: no specific exprresion
detected
IMAGE 3494155
Pea15 100548_at 0.71 Expressed weakly in the ventral midbrain-R1 region which is lost in
mutants
IMAGE 406749
CN04(6430527G18Rik)
162901_i_at 0.71 In WT embryos: no specific exprresion detected at MHB
IMAGE 1245431
Sox21 167903_at 0.72 -
D7Wsu128e 103861_s_at 0.74 -
Jmj 94341_at 0.74 Fig. 2G in I IMAGE 6406875

37
Table 6. Genes upregulated in Fgfr1 CKO mutants at E10.5.
Gene / EST Afymetrix probe set
ID
Fold change
Validation by in situhybridisation*
Probe for in situhybridisation
Fst 98817_at 4.00 Fig. 3M, N in I (Wang et al., 2004)
EST 166028_s_at 2.22 -
Tal-2 129118_at 2.00 In WT embryos: expressed in the tectum
(Mori et al. 1999) Mab21l1 165815_r_at 1.89 Fig. 3F in I IMAGE 4526962
Ednrb 163124_s_at 1.87 Fig. 3I in I IMAGE 4971909
Math1 168404_at 1.84 Fig. 3D in I IMAGE 4218223
EST 113895_at 1.77 -
Rgma 108717_at 1.66 Fig. 3C in I IMAGE 1001290
EST 139205_at 1.66 Fig. 3K in I IMAGE 2655939
Vtn 98549_at 1.65 Fig. 3A in I IMAGE 5366291
Uncx4.1 92499_at 1.60 Fig. 3H in I IMAGE 5716567
Ngfr (p75) 108762_at 1.57 Fig. 3G in I (Qun et al., 1999)
EST 137358_at 1.55 Fig. 3L in I IMAGE 3329477
Maf 115390_at 1.52 -
EST 167322_at 1.52 -
Ckb 137242_f_at 1.49 Supp. Fig. 7J in I IMAGE 6395794
Pltp 100927_at 1.46 Broad expression in the neural tube
IMAGE 4979759
Nhlh2 166814_f_at 1.44 -
EST 166871_at 1.44 Fig. 3J in I IMAGE 3823589
Wfdc1 166414_at 1.43 Fig. 3B in I IMAGE 1497229
Tcpn1 108515_at 1.41 - IMAGE 653006
Dach1 114999_at 1.41 Fig. 3E in I IMAGE 6826750
* Published in I
Microarray data were categorized using gene ontology (GO) annotation. GO provides a controlled vocabulary organized in a hierarchical way that can be applied to describe gene products from mouse regarding: molecular function, biological process, and cellular component. The GO assignment relies on information from the AMIGO server http://www.geneontology.org/index.shtml. The GO classifications of downregulated and upregulated genes in the Fgfr1 CKO mutants at E10.5 are shown in tables 7 and 8, respectively. A summary of only the most specific GO annotations withdrawn from the AMIGO
are listed in the tables 7 and 8. Fig. 13 shows that the representation of GO classes between up- and downregulated genes was quite different. The set of up-regulated genes was enriched with genes involved in intercellular signalling (e.g. secreted proteins) and neuronal transcription factors but lacks genes involved in signal transduction (intracellular), whereas genes involved in responses to external stimulus (growth factors; MAPK pathway), cell adhesion, and cell proliferation were overrepresented among down-regulated genes.
Results and Discussion

38
Table 7. Functional classifi cation of downregulated genes.Gene
Symbol Gene Title GO Biological Process
DescriptionGO Molecular Function
Description
GO Cellular ComponentDescription
Foldchange
Fgf17 fibroblast growth factor 17
signal transduction cell-cell signaling nervous system developpment
fibroblast growth factor receptor binding growth factor activity
extracellular space 0.06
Spry1 sprouty homolog 1 (Drosophila)
ureteric bud development induction of an organ regulation of signal transduction negative regulation of MAPK activity
protein binding cytoplasm membrane 0.24
En1 engrailed 1 regulation of transcription, DNA-dependent potassium ion transport dorsal/ventral pattern formation neuron differentiation midbrain-hindbrain boundary development
DNA binding transcription factor activity voltage-gated potassium channel activity sequence-specific DNA binding
nucleus voltage-gated potassium channel complex
0.29
Fgf8 fibroblast growth factor 8
regulation of progression through cell cycle MAPKKK cascade signal transduction positive regulation of cell proliferation negative regulation of apoptosis generation of neurons
fibroblast growth factor receptor binding growth factor activity
extracellular space 0.3
Spry2 sprouty homolog 2 (Drosophila)
cell-cell signaling development regulation of signal transduction MAPK activity cell fate commitment
protein binding microtubule membrane 0.3
Trh thyrotropin releasing hormone
signal transduction cell-cell signaling hormone-mediated signaling
hormone activity neuropeptide hormone activity protein binding thyrotropin-releasing hormone activity
extracellular space soluble fraction
0.31
Cnpy1 Canopy 1 homolog (Zebrafish) (expressed sequence AI853839)
fibroblast growth factor receptor signalling pathway midbrain-hindbrain orgainizer development
--- endoplasmic reticulum 0.35
Fgf18 fibroblast growth factor 18
signal transduction cell-cell signaling positive regulation of cell proliferation
fibroblast growth factor receptor binding growth factor activity
extracellular space nucleolus
0.35
Fgfr1 fibroblast growth factor receptor 1
MAPKKK cascade protein amino acid phosphorylation signal transduction brain development regulation of cell proliferation cell growth negative regulation of apoptosis
protein kinase activity protein serine/threonine kinase activity protein-tyrosine kinase activity receptor activity heparin binding
extracellular space membrane fraction integral to plasma membrane
0.38
Tnfrsf19 tumor necrosis factor receptor superfamily, member 19
induction of apoptosis JNK cascade
receptor activity tumor necrosis factor receptor activity protein binding
extracellular space integral to membrane
0.39
Sef Simlar expression to Fgfs
dorsal/ventral pattern specification negative regulation of FGF receptor signalling pathway
transmembrane receptor activity
integral to membrane 0.41
Erm(or Etv5)
ets variant gene 5 ets variant gene 5 pseudogene
regulation of transcription, DNA-dependent organ morphogenesis positive regulation of transcription
DNA binding transcription factor activity transcriptional activator activity
nucleus 0.41
Mkp3 (or Dusp6)
dual specificity phosphatase 6
protein amino acid dephosphorylation protein amino acid dephosphorylation
phosphoprotein MAP kinase phosphatase activity,tyrosine/serine/threonine phosphatase activity protein binding hydrolase activity
--- 0.42
Nfia nuclear factor I/A DNA replication regulation of transcription, DNA-dependent electron transport
DNA binding transcription factor activity iron ion binding electron carrier activity
intracellular nucleus 0.48
Mrp4 (or Abcc4)
ATP-binding cassette, sub-family C (CFTR/MRP), member 4
ion transport multidrug transport
nucleotide binding chloride channel activity ATP binding multidrug efflux pump activity ATPase activity
integral to membrane 0.5
Results and Discussion
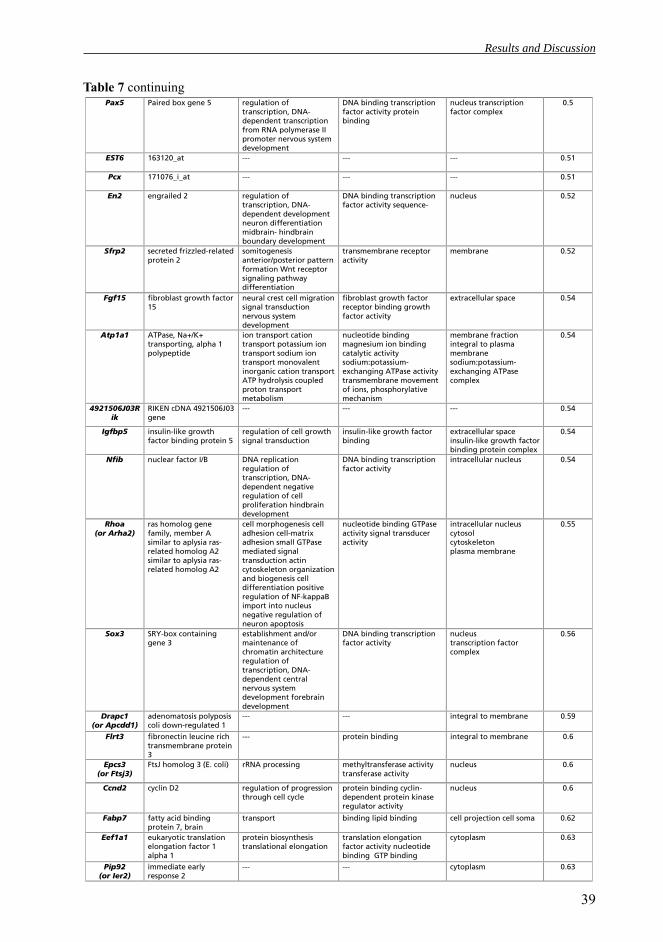
39
Pax5 Paired box gene 5 regulation of transcription, DNA-dependent transcription from RNA polymerase II promoter nervous system development
DNA binding transcription factor activity protein binding
nucleus transcription factor complex
0.5
EST6 163120_at --- --- --- 0.51
Pcx 171076_i_at --- --- --- 0.51
En2 engrailed 2 regulation of transcription, DNA-dependent development neuron differentiation midbrain- hindbrain boundary development
DNA binding transcription factor activity sequence-
nucleus 0.52
Sfrp2 secreted frizzled-related protein 2
somitogenesis anterior/posterior pattern formation Wnt receptor signaling pathway differentiation
transmembrane receptor activity
membrane 0.52
Fgf15 fibroblast growth factor 15
neural crest cell migration signal transduction nervous system development
fibroblast growth factor receptor binding growth factor activity
extracellular space 0.54
Atp1a1 ATPase, Na+/K+ transporting, alpha 1 polypeptide
ion transport cation transport potassium ion transport sodium ion transport monovalent inorganic cation transport ATP hydrolysis coupled proton transport metabolism
nucleotide binding magnesium ion binding catalytic activity sodium:potassium-exchanging ATPase activity transmembrane movement of ions, phosphorylative mechanism
membrane fraction integral to plasma membrane sodium:potassium-exchanging ATPase complex
0.54
4921506J03Rik
RIKEN cDNA 4921506J03 gene
--- --- --- 0.54
Igfbp5 insulin-like growth factor binding protein 5
regulation of cell growth signal transduction
insulin-like growth factor binding
extracellular space insulin-like growth factor binding protein complex
0.54
Nfib nuclear factor I/B DNA replication regulation of transcription, DNA-dependent negative regulation of cell proliferation hindbrain development
DNA binding transcription factor activity
intracellular nucleus 0.54
Rhoa(or Arha2)
ras homolog gene family, member A similar to aplysia ras-related homolog A2 similar to aplysia ras-related homolog A2
cell morphogenesis cell adhesion cell-matrix adhesion small GTPase mediated signal transduction actin cytoskeleton organization and biogenesis cell differentiation positive regulation of NF-kappaB import into nucleus negative regulation of neuron apoptosis
nucleotide binding GTPase activity signal transducer activity
intracellular nucleus cytosol cytoskeleton plasma membrane
0.55
Sox3 SRY-box containing gene 3
establishment and/or maintenance of chromatin architecture regulation of transcription, DNA-dependent central nervous system development forebrain development
DNA binding transcription factor activity
nucleus transcription factor complex
0.56
Drapc1(or Apcdd1)
adenomatosis polyposis coli down-regulated 1
--- --- integral to membrane 0.59
Flrt3 fibronectin leucine rich transmembrane protein 3
--- protein binding integral to membrane 0.6
Epcs3 (or Ftsj3)
FtsJ homolog 3 (E. coli) rRNA processing methyltransferase activity transferase activity
nucleus 0.6
Ccnd2 cyclin D2 regulation of progression through cell cycle
protein binding cyclin-dependent protein kinase regulator activity
nucleus 0.6
Fabp7 fatty acid binding protein 7, brain
transport binding lipid binding cell projection cell soma 0.62
Eef1a1 eukaryotic translation elongation factor 1 alpha 1
protein biosynthesis translational elongation
translation elongation factor activity nucleotide binding GTP binding
cytoplasm 0.63
Pip92 (or Ier2)
immediate early response 2
--- --- cytoplasm 0.63
Table 7 continuing
Results and Discussion
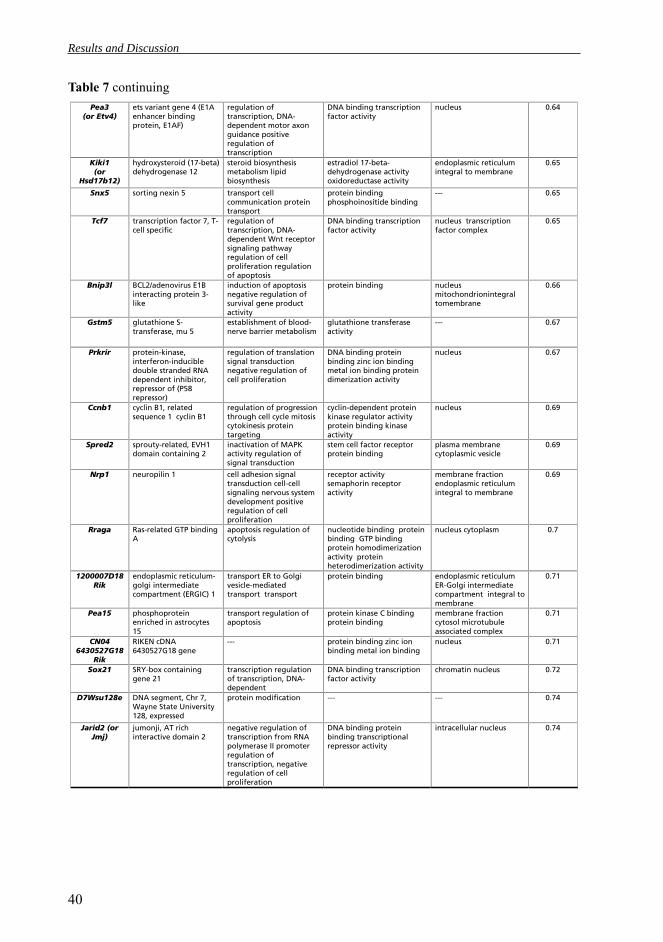
40
Table 7 continuingPea3
(or Etv4) ets variant gene 4 (E1A enhancer binding protein, E1AF)
regulation of transcription, DNA-dependent motor axon guidance positive regulation of transcription
DNA binding transcription factor activity
nucleus 0.64
Kiki1 (or
Hsd17b12)
hydroxysteroid (17-beta) dehydrogenase 12
steroid biosynthesis metabolism lipid biosynthesis
estradiol 17-beta-dehydrogenase activity oxidoreductase activity
endoplasmic reticulum integral to membrane
0.65
Snx5 sorting nexin 5 transport cell communication protein transport
protein binding phosphoinositide binding
--- 0.65
Tcf7 transcription factor 7, T-cell specific
regulation of transcription, DNA-dependent Wnt receptor signaling pathway regulation of cell proliferation regulation of apoptosis
DNA binding transcription factor activity
nucleus transcription factor complex
0.65
Bnip3l BCL2/adenovirus E1B interacting protein 3-like
induction of apoptosis negative regulation of survival gene product activity
protein binding nucleus mitochondrionintegral tomembrane
0.66
Gstm5 glutathione S-transferase, mu 5
establishment of blood-nerve barrier metabolism
glutathione transferase activity
--- 0.67
Prkrir protein-kinase, interferon-inducible double stranded RNA dependent inhibitor, repressor of (P58 repressor)
regulation of translation signal transduction negative regulation of cell proliferation
DNA binding protein binding zinc ion binding metal ion binding protein dimerization activity
nucleus 0.67
Ccnb1 cyclin B1, related sequence 1 cyclin B1
regulation of progression through cell cycle mitosis cytokinesis protein targeting
cyclin-dependent protein kinase regulator activity protein binding kinase activity
nucleus 0.69
Spred2 sprouty-related, EVH1 domain containing 2
inactivation of MAPK activity regulation of signal transduction
stem cell factor receptor protein binding
plasma membrane cytoplasmic vesicle
0.69
Nrp1 neuropilin 1 cell adhesion signal transduction cell-cell signaling nervous system development positive regulation of cell proliferation
receptor activity semaphorin receptor activity
membrane fraction endoplasmic reticulum integral to membrane
0.69
Rraga Ras-related GTP binding A
apoptosis regulation of cytolysis
nucleotide binding protein binding GTP binding protein homodimerization activity protein heterodimerization activity
nucleus cytoplasm 0.7
1200007D18Rik
endoplasmic reticulum-golgi intermediate compartment (ERGIC) 1
transport ER to Golgi vesicle-mediated transport transport
protein binding endoplasmic reticulum ER-Golgi intermediate compartment integral to membrane
0.71
Pea15 phosphoprotein enriched in astrocytes 15
transport regulation of apoptosis
protein kinase C binding protein binding
membrane fraction cytosol microtubule associated complex
0.71
CN046430527G18
Rik
RIKEN cDNA 6430527G18 gene
--- protein binding zinc ion binding metal ion binding
nucleus 0.71
Sox21 SRY-box containing gene 21
transcription regulation of transcription, DNA-dependent
DNA binding transcription factor activity
chromatin nucleus 0.72
D7Wsu128e DNA segment, Chr 7, Wayne State University 128, expressed
protein modification --- --- 0.74
Jarid2 (or Jmj)
jumonji, AT rich interactive domain 2
negative regulation of transcription from RNA polymerase II promoter regulation of transcription, negative regulation of cell proliferation
DNA binding protein binding transcriptional repressor activity
intracellular nucleus 0.74
Results and Discussion

41
Table 8. Functional classifi cation of upregulated genes.
Gene Symbol Gene Title GO Biological Process Description
GO Molecular Function
Description
GO Cellular ComponentDescription
Foldchange
Fst follistatin BMP signaling pathway pattern specification negative regulation of cell differentiation
protein binding activin inhibitor activity
extracellular region extracellular space
4
2610034M16Rik
RIKEN cDNA 2610034M16 gene
protein targeting protein binding --- 2.22
Tal-2 T-cell acute lymphocytic leukemia
regulation of transcription, DNA-dependent
DNA binding transcriptionregulator activity
nucleus 2
Mab21l1 mab-21-like 1 (C. elegans)
positive regulation of cell proliferation protein localization
protein kinase binding protein kinase A binding
Golgi trans face cytosol plasma membrane
1.89
Ednrb endothelin receptor type B
neural crest cell migration G-protein coupled receptor protein signaling pathway nervous system development
rhodopsin-like receptor activity G-protein coupled receptor activity
extracellular space plasma membrane
1.87
Math1 (or Atoh1)
atonal homolog 1 (Drosophila)
regulation of transcription, DNA-dependent transcription from RNA polymerase II promoter brain development cell differentiation neuron differentiation
DNA binding transcription factor activity protein binding transcription regulator activity chromatin DNA binding
nucleus 1.84
EST A730008L19 --- --- --- 1.77
Rgma RGM domain family, member A
neural tube closure GPI anchor binding cell surface membrane 1.66
C130071C03Rik
RIKEN cDNA C130071C03 gene
--- --- --- 1.66
Vtn vitronectin cell adhesion cell-matrix adhesion
heparin binding protein binding
extracellular space proteinaceous extracellular matrix
1.65
Uncx4.1 Unc4.1 homeobox (C. elegans)
regulation of transcription, DNA-dependent
transcription factor activity sequence-specific DNA binding
nucleus transcription factor complex
1.6
Ngfr(or p75)
nerve growth factor receptor (TNFR superfamily, member 16)
apoptosis induction of apoptosis signal transduction axon guidance central nervous system development cell differentiation
catalytic activity receptor activity protein binding nerve growth factor binding protein binding
extracellular space plasma membrane integral to membrane
1.57
D930028M14Rik
RIKEN cDNA D930028M14 gene
--- --- --- 1.55
Maf avian musculoaponeurotic fibrosarcoma (v-maf) AS42 oncogene homolog
regulation of progression through cell cycle regulation of transcription, DNA-dependent transcription from RNA polymerase II promoter
DNA binding transcription factor activity RNA polymerase II transcription factor activity
chromatin nucleus cytoplasm
1.52
Lcor ligand dependent nuclear receptor corepressor
regulation of transcription, DNA-dependent transcription from RNA polymerase II promoter
DNA binding RNA polymerase II transcription factor activity
nucleus 1.52
Ckb creatine kinase, brain
--- creatine kinase activity kinase activity
cytoplasm mitochondrion
1.49
Pltp phospholipid transfer protein
lipid metabolism lipid transport
lipid binding extracellular space 1.46
Results and Discussion

42
Gene Symbol Gene Title GO Biological Process Description
GO Molecular Function
Description
GO Cellular ComponentDescription
Foldchange
Nhlh2 nescient helix loop helix 2
regulation of transcription, DNA-dependent central nervous system development cell differentiation
DNA binding transcriptionregulator activity
nucleus 1.44
Fgfbp3 fibroblast growth factor binding protein 3
--- --- --- 1.44
Wfdc1 WAP four-disulfide core domain 1
--- endopeptidase inhibitor activity
extracellular space 1.43
Tpcn1 two pore channel 1 ion transport ion channel activity sugar binding
integral to membrane 1.41
Dach1 dachshund 1 (Drosophila)
regulation of transcription, DNA-dependent
DNA binding transcription factor activity protein binding
nucleus transcription factor complex
1.41
Table 8 continuing
Figure 13. A summary of molecular functions (GO) of differentally expressed genes. (A) downregulated genes; (B) upregulated genes.
Results and Discussion

43
To validate our microarray results, this analysis was followed by a whole-mount mRNA in situ hybridization analysis. First, we concentrated on expression analysis of a down-regulated gene list showed in Table 5. Initially this list produced by the micro-array analysis consists of sets of DNA probes, each chosen to record expression of specifi c genes. In Affymetrix GeneChip methodology, the set of probes relating to a gene is referred to as a probeset, and the sequence which is best associated with the transcribed region being interrogated by the probeset is referred to as its represent-ative sequence (Liu et al., 2003a). The se-quence annotations referring to the infor-mation about the representative sequence for a probeset are presented in the Affyme-trix NetAffx service (http://www.affyme-trix.com). This tool was utilized to locate the probes within the mouse genome and the corresponding cDNAs were ordered from the IMAGE consortium. These plas-mids were then used to produce the in situ hybridization probes for consequent vali-dation experiments.
2. Identifi cation of FGF regulated genes at the midbrain-R1 region (I, III and unpublished)
In addition to the components of the FGF-FGFR signal transduction pathway (see section 2.1.1.) our microarray screen identified several other genes being differentially expressed in the Fgfr1 mutant embryos (see sections 2.1.2. and 2.1.3.). Comparison of the midbrain-R1 tissues from E10.5 wild-type and Fgfr1 mutant embryos identifi ed 51 down-regulated and 20 up-regulated genes, respectively (see Tables 5 and 6). The downregulated list included genes involved in the patterning of midbrain and R1, MHB-specifi c genes, cell-cycle regulators, and components
of various signal transduction cascades (Table 7 and Fig. 13).
2.1. Down-regulated genes (I, III and unpublished)
2.1.1. Down-regulation of FGF-FGFR signaling components at E10.5 (I,III)
The down-regulated genes identified by microarray screen included several known members of the FGF signal transduction pathway (Table 5). These included FGF ligands, signal regulators and nuclear effectors. At E9.5 the expression of Fgf8/17/18 was not down-regulated in the Fgfr1 mutant embryos. However, comparison of expression levels by microarray analysis showed that Fgf8/15/17/18 were down-regulated in E10.5 Fgfr1 mutant mice (Table 5). This was confirmed by in situ hybridization analysis. Expression of Fgf17 was completely abolished from the midbrain-R1 region whereas Fgf8 and Fgf18 expression was maintained in the most ventral region. This suggests, that other FGF receptors (FGFR2 and 3) are mediating isthmic FGF signals in the Fgfr1 mutants (see below). Consistent with this, the most evident downregulation of Fgf15 was observed in the lateral midbrain, whereas the ventral Fgf15 expression domain was unchanged or even upregulated.
Sef (similar expression to Fgfs) is a receptor molecule that is associated with the FGF/Ras-MAPK signaling. At E10.5 wild-type embryos, Sef expression was detected in the midbrain-R1 region and extended posterior to the isthmus. In the mutant E10.5 embryos, a down-regulation of Sef was seen in the most dorsal part of the midbrain-R1 region. Similarly to Pea3 and Erm at E9.5, Sef expression was also downregulated close to the border between midbrain and R1. At E10.5, expression of
Results and Discussion

44
Erm and Pea3 was clearly down-regulated at the midbrain-R1 region in the Fgfr1 mutant embryos compared to the wild-type embryos. However, in the Fgfr1 mutants, some expression of Erm and Pea3 was still detected in the ventral midbrain-R1 region.
Sprouty (or SPRY) and MKP3 proteins act as negative regulators of the FGF/Ras-MAPK signaling pathway. Both Spry1 and Spry2 are expressed at the midbrain-R1 region at E10.5. In the Fgfr1 mutant embryos, Spry1 transcripts were abolished from the dorsal midbrain-R1 domain, but remained in the ventral midbrain-R1 region. By contrast, expression of Spry2 and Mkp3 was down-regulated throughout the midbrain-R1 region in the Fgfr1 mutant mice at E10.5 compared to wild-type embryos. Although, Mkp3 expression was clearly down-regulated at E10.5 in Fgfr1 mutants, some expression was detected in the most ventral midbrain-R1 domain when whole-mount embryos were sectioned after in situ hybridizations. A positive feedback loops provides a basis for the formation and
maintenance of local organizing centers. In Xenopus and zebrafish, expression of Mkp3 has been shown to induce by RA and β-catenin pathways (Tsang and Dawid, 2004; Tsang et al., 2004). In Fgfr1 mutants, Mkp3 expression was lost from the dorsal midbrain-R1 region already at E9.5. Interestingly, at this stage, Wnt1 and Drapc1 expression is still detected in the dorsal region. Thus, it can be speculated that FGF8/17/18 are the key molecules which are regulating the MAPK-RAS pathway, which in turn is required for the dorsal patterning of R1.
Recent studies have shown that rat and Xenopus Flrt3 genes are coexpressed with Fgfs (Bottcher et al., 2004; Lacy et al., 1999; Robinson et al., 2004). We detected Flrt3 expression in wild-type embryos from E10.5 onwards at the narrow midbrain-R1 region. In the Fgfr1 mutant embryos, Flrt3 expression domain at the midbrain-R1 region was abolished. The lack of Flrt3 expression in the boundary cells between the midbrain and R1 may be the mechanism to the observed tissue segregation in Fgfr1 mutants. Thus,
Figure 14. Cnpy1 is specifi cally expressed in the midbrain-R1 region. Expression pattern of Cnpy1 is conserved between mouse (A) and zebrafi sh (B). Arrowheads point to the IsO and an arrow marks the more posterior expression of Cnpy1. hpf, hours post fertilization; ss, somite stage.
Results and Discussion
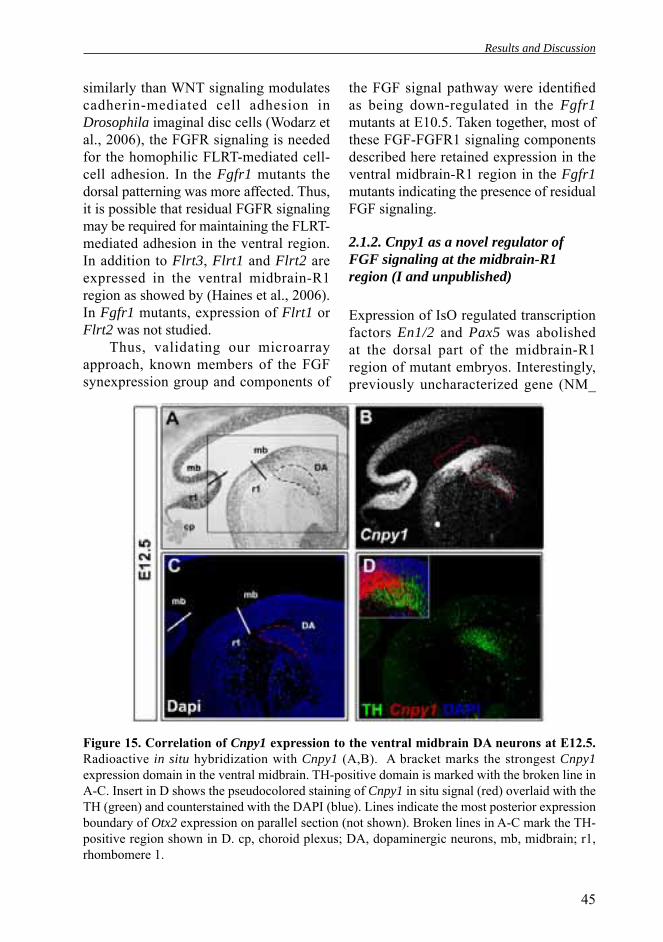
45
similarly than WNT signaling modulates cadherin-mediated cell adhesion in Drosophila imaginal disc cells (Wodarz et al., 2006), the FGFR signaling is needed for the homophilic FLRT-mediated cell-cell adhesion. In the Fgfr1 mutants the dorsal patterning was more affected. Thus, it is possible that residual FGFR signaling may be required for maintaining the FLRT-mediated adhesion in the ventral region. In addition to Flrt3, Flrt1 and Flrt2 are expressed in the ventral midbrain-R1 region as showed by (Haines et al., 2006). In Fgfr1 mutants, expression of Flrt1 or Flrt2 was not studied.
Thus, validating our microarray approach, known members of the FGF synexpression group and components of
the FGF signal pathway were identifi ed as being down-regulated in the Fgfr1 mutants at E10.5. Taken together, most of these FGF-FGFR1 signaling components described here retained expression in the ventral midbrain-R1 region in the Fgfr1 mutants indicating the presence of residual FGF signaling.
2.1.2. Cnpy1 as a novel regulator of FGF signaling at the midbrain-R1 region (I and unpublished)
Expression of IsO regulated transcription factors En1/2 and Pax5 was abolished at the dorsal part of the midbrain-R1 region of mutant embryos. Interestingly, previously uncharacterized gene (NM_
Figure 15. Correlation of Cnpy1 expression to the ventral midbrain DA neurons at E12.5. Radioactive in situ hybridization with Cnpy1 (A,B). A bracket marks the strongest Cnpy1 expression domain in the ventral midbrain. TH-positive domain is marked with the broken line in A-C. Insert in D shows the pseudocolored staining of Cnpy1 in situ signal (red) overlaid with the TH (green) and counterstained with the DAPI (blue). Lines indicate the most posterior expression boundary of Otx2 expression on parallel section (not shown). Broken lines in A-C mark the TH-positive region shown in D. cp, choroid plexus; DA, dopaminergic neurons, mb, midbrain; r1, rhombomere 1.
Results and Discussion

46
Figure 16. Correlation of Cnpy1 expression to the ventral midbrain DA neurons at E15.5 and E16.5. Comparison of TH (A,C) and En1 with Cnpy1 (B,D) on parallel sagittal sections. Broken circles (B) or lines (D) indicate the strongest TH immunostaings at E15.5 and E16.5 in parallel sections. Square in A shows the depicted TH staining (green) in A. cb, cerebellar primordium; cp, choroid plexus; mb, midbrain.
175651; Affymetrix probe ID: 138472_at) showed similar expression pattern to the En2 gene specifi cally at the midbrain-R1 (Fig. 14A). The zebrafish ortholog was recently named as Canopy1 (Cnpy1, NM_001039497; Fig. 14B) and its inactivation by antisense morpholinos resulted in MHB defects (Hirate and Okamoto, 2006).
Given the importance of En1 and En2 in the development of midbrain DA neurons (Alberi et al., 2004; Simon et al., 2001; Simon et al., 2004; Simon et al., 2005) we also studied mouse Cnpy1 expression in relation to the known DA markers (TH and En1). At E12.5, Cnpy1 was expressed strongly in the dorsal midbrain-R1 region whereas its expression in the TH-positive DA neurons was weaker. In addition, the co-localization of Cnpy1 and TH was restricted to the most posterior DA neurons adjacent to the isthmal region (Fig. 15). Later at E15.5 and E16.5, Cnpy1 expression in TH-positive cell populations was even weaker (Fig. 16). Thus, our analysis indicates that Cnpy1 might be needed for the development of the most posterior midbrain DA neurons and in the early patterning of midbrain-R1 region. The proposed model for this patterning activity is the direct interaction of CNPY1 with the extracellular domain of FGFR1. Hirate and Okamoto (2006), suggest that together with other FGF-FGFR signaling components CNPY1 promotes the FGF signaling in the midbrain-R1 region.
The role of Cnpy1 in the maturation of ventral DA neurons might be less obvious. However, further functional analyses of mouse Cnpy1 are needed to clarify its role in the FGF-FGFR regulated patterning and differentiation in the midbrain-R1 region.
2.1.3. Down-regulated genes expressed as a narrow stripe near the MHB (I and unpublished)
Genes that were identifi ed to be expressed in a narrow stripe near the MHB included Trh, Mrp4, Igfbp5 and Jumonji (Jmj). The role of Jmj in the midbrain-R1 region is discussed in section 5.4. Trh and Mrp4 showed specifi c expression in the midbrain-R1 region whereas Igfbp5 expression was detected in various brain
Results and Discussion

47
regions between E9.5 and E11.5. The importance of these genes during the midbrain-R1 development has not been reported. Mouse knockouts of Trh, Mrp4, Igfbp5 and Jumonji has been generated, but only Jmj knockout mice show obvious brain phenotype (Assem et al., 2004; Lai and Tan, 2002; Motoyama et al., 1997; Ning et al., 2007; Takeuchi et al., 1995; Takeuchi et al., 1999; Urayama et al.,
Figure 17. Expression of patterning genes in the Trh KO at E10.5. Radioactive in situ hybridization analysis with the probes indicated (A-F). Lines mark the most posterior Otx2 expression boundary. mb, midbrain; r1, rhombomere 1.
2002; Yamada et al., 1997). We studied the expression of early patterning genes in Trh KO embryos. At E10.5, expression of the genes studied was unchanged in the Trh KO embryos compared with the wild-type (+/+) litter mates (Fig. 17). At the later stage (E15.5), as well, no obvious changes in gene expression patterns of Otx2, En1 or Drapc1 were detected (Fig. 18).
Results and Discussion

48
Figure 18. Expression of patterning genes in the Trh KO at E15.5. Radioactive in situ hybridization analysis with the probes indicated (A-C). Lines mark the most posterior Otx2 expression boundary. cb, cerebellum; mb, midbrain.
2.1.4. Other down-regulated genes in the Fgfr1 CKO mutants (I)
Among the other down-regulated genes (Table 5) we observed Cyclins (CyclinD1/D2/B1) and Sox3 and Sox21, which were broadly expressed in the dorsal midbrain and hindbrain. Interestingly, a narrow domain of Cyclins- and Sox3-negative cells was detected in the border between mid- and hindbrain. Expression of these genes was downregulated in the dorsal midbrain-R1 region of Fgfr1 mutant embryos. It has been suggested that expression of Sox genes is dependent of FGF signaling (Takemoto et al., 2006). In addition, Sox3 expression is inhibited in the neuroepithelial boundary regions to prevent the early exit from the cell cycle (Rizzoti et al., 2004). Thus, these cellular mechanisms linking FGF signaling to proliferation and differentiation prompted us to study the genes important for the neuronal differentiation in the vicinity of the MHB (see section 3 below).
2.2. Up-regulated genes show loss of expression gradients in Fgfr1 CKO mutant embryos (I)
Taken together, the majority of upregulated genes (Table 6) showed mainly two main types of expression in wild-type embryos - dorsal gradients or combined dorsal and ventral gradients. Genes such as Fst, Vtn, Wfdc1, RgmA, Math1, Dach1 and Mab21l1 were expressed as dorsal gradients decreasing towards the MHB in wild-type embryos. In Fgfr1 mutants, the midbrain and R1 gradients were lost and the expression continued uniformly strong towards the boundary or across it. This effect was the most prominent for Fst, which is a known BMP signaling component.
Results and Discussion
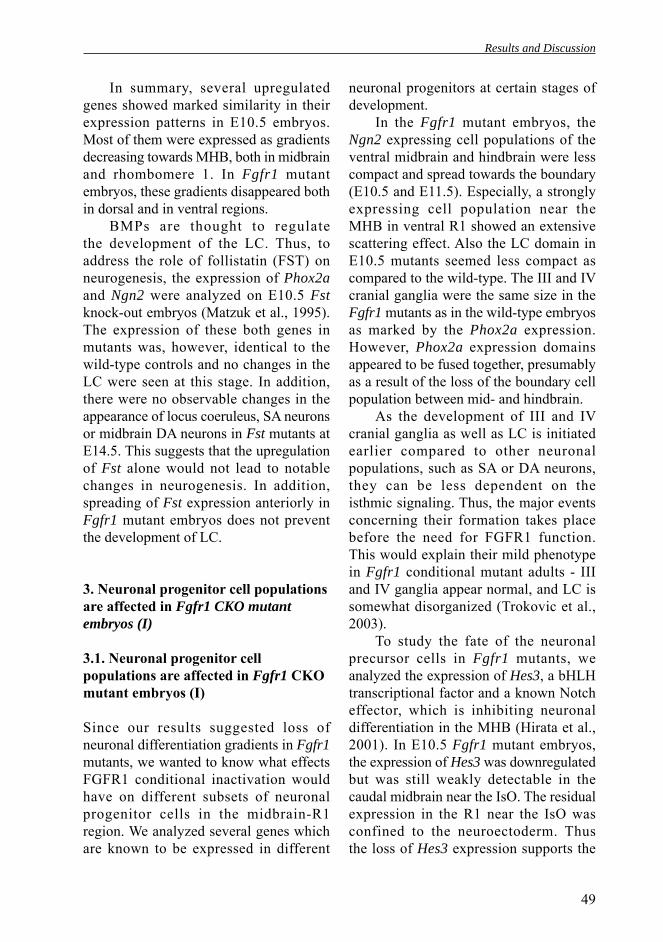
49
In summary, several upregulated genes showed marked similarity in their expression patterns in E10.5 embryos. Most of them were expressed as gradients decreasing towards MHB, both in midbrain and rhombomere 1. In Fgfr1 mutant embryos, these gradients disappeared both in dorsal and in ventral regions.
BMPs are thought to regulate the development of the LC. Thus, to address the role of follistatin (FST) on neurogenesis, the expression of Phox2a and Ngn2 were analyzed on E10.5 Fst knock-out embryos (Matzuk et al., 1995). The expression of these both genes in mutants was, however, identical to the wild-type controls and no changes in the LC were seen at this stage. In addition, there were no observable changes in the appearance of locus coeruleus, SA neurons or midbrain DA neurons in Fst mutants at E14.5. This suggests that the upregulation of Fst alone would not lead to notable changes in neurogenesis. In addition, spreading of Fst expression anteriorly in Fgfr1 mutant embryos does not prevent the development of LC.
3. Neuronal progenitor cell populations are affected in Fgfr1 CKO mutant embryos (I)
3.1. Neuronal progenitor cell populations are affected in Fgfr1 CKO mutant embryos (I)
Since our results suggested loss of neuronal differentiation gradients in Fgfr1 mutants, we wanted to know what effects FGFR1 conditional inactivation would have on different subsets of neuronal progenitor cells in the midbrain-R1 region. We analyzed several genes which are known to be expressed in different
neuronal progenitors at certain stages of development.
In the Fgfr1 mutant embryos, the Ngn2 expressing cell populations of the ventral midbrain and hindbrain were less compact and spread towards the boundary (E10.5 and E11.5). Especially, a strongly expressing cell population near the MHB in ventral R1 showed an extensive scattering effect. Also the LC domain in E10.5 mutants seemed less compact as compared to the wild-type. The III and IV cranial ganglia were the same size in the Fgfr1 mutants as in the wild-type embryos as marked by the Phox2a expression. However, Phox2a expression domains appeared to be fused together, presumably as a result of the loss of the boundary cell population between mid- and hindbrain.
As the development of III and IV cranial ganglia as well as LC is initiated earlier compared to other neuronal populations, such as SA or DA neurons, they can be less dependent on the isthmic signaling. Thus, the major events concerning their formation takes place before the need for FGFR1 function. This would explain their mild phenotype in Fgfr1 conditional mutant adults - III and IV ganglia appear normal, and LC is somewhat disorganized (Trokovic et al., 2003).
To study the fate of the neuronal precursor cells in Fgfr1 mutants, we analyzed the expression of Hes3, a bHLH transcriptional factor and a known Notch effector, which is inhibiting neuronal differentiation in the MHB (Hirata et al., 2001). In E10.5 Fgfr1 mutant embryos, the expression of Hes3 was downregulated but was still weakly detectable in the caudal midbrain near the IsO. The residual expression in the R1 near the IsO was confined to the neuroectoderm. Thus the loss of Hes3 expression supports the
Results and Discussion

50
results obtained from the upregulated genes (see above), which suggested that neuronal differentiation was shifted towards the MHB region in Fgfr1 mutant embryos.
In wild type embryos, a gap of mature neurons was evident near the MHB region, as seen with anti-TUJ1 staining. In Fgfr1 mutants the gap disappeared. The number of radial glia cells and mitotic cells outside the boundary region, as determined by anti-RC2 and anti-PH3 immunostainings, respectively, was not signifi cantly altered in Fgfr1 mutants (data not shown). Earlier quantification studies did not show any changes in cell proliferation and apoptosis in the ventral MHB region (Trokovic et al., 2003). However, the changes in the ratio of progenitor neurons to mature neurons might be too subtle to be easily detectable in these early embryonic stages.
3.2. Midbrain dopaminergic neuron progenitor pool spreads in Fgfr1 CKO mutants (I)
Since FGF is thought to control the development of DA neurons in the ventral midbrain, we examined what happens to the DA neuron progenitors in the midbrain. For this, we analyzed the expression of several genes known to be involved in the early development of midbrain DA neurons and quantifi ed the neurons in E15.5 Fgfr1 mutant and wild-type embryos.
In E11.5 Fgfr1 mutant embryos, the expression of Nurr1, Pitx3 and Aldh1 (also known as Aldh1a1 and Raldh1) was expanded posteriorly towards the border between midbrain and R1. Then we analyzed the tyrosine hydroxylase (TH) positive dopaminergic neurons of the ventral tegmental area (VTA) and substantia nigra at E15.5 wild-type and Fgfr1 mutant embryos. The
comparison between the total numbers of DA neurons showed not statistically signifi cant difference between the wild-type and mutant embryos. Next, we looked at the differences between the caudal and rostral DA populations as these were compared individually. The analysis revealed an increase in the caudal population and conversely a decrease in the rostral population of DA neurons in the Fgfr1 mutant embryos. Thus, consistent with observed changes in gene expression patterns of DA markers TH immunostaining at E15.5 stage revealed a caudal shift in the position of DA neurons in Fgfr1 mutants. Thus, it seems that although the area where the DA neurons are located expands in mutants, the total number of these neurons does not change. The caudal shift is probably due to the caudal spreading of Otx2 expression. In ventral midbrain, Otx2 expression is scattered in Fgfr1 mutants at E15.5, and the boundary between Otx2 positive and negative areas is less obvious than in the wild-type. This would suggest that the mixing of ventral midbrain and R1 cells forms a tissue mosaic in the Fgfr1 mutants. A similar phenomenon has bee observed in zebrafi sh Ace mutants where R1 is transformed into midbrain in the absence of Fgf8 from the IsO (Jaszai et al., 2003). However, in Fgfr1 mutants, instead of complete fate transformation of R1 an extensive mixing of ventral midbrain cells into R1 is observed.
3.3. The most rostral serotonergic neuron precursors are lost in Fgfr1 CKO mutant embryos (I)
FGF8 from the IsO is thought to be one of the major signals guiding the development of serotonergic (SA) neurons in the raphe nuclei (Ye et al., 1998). To fi nd out whether
Results and Discussion
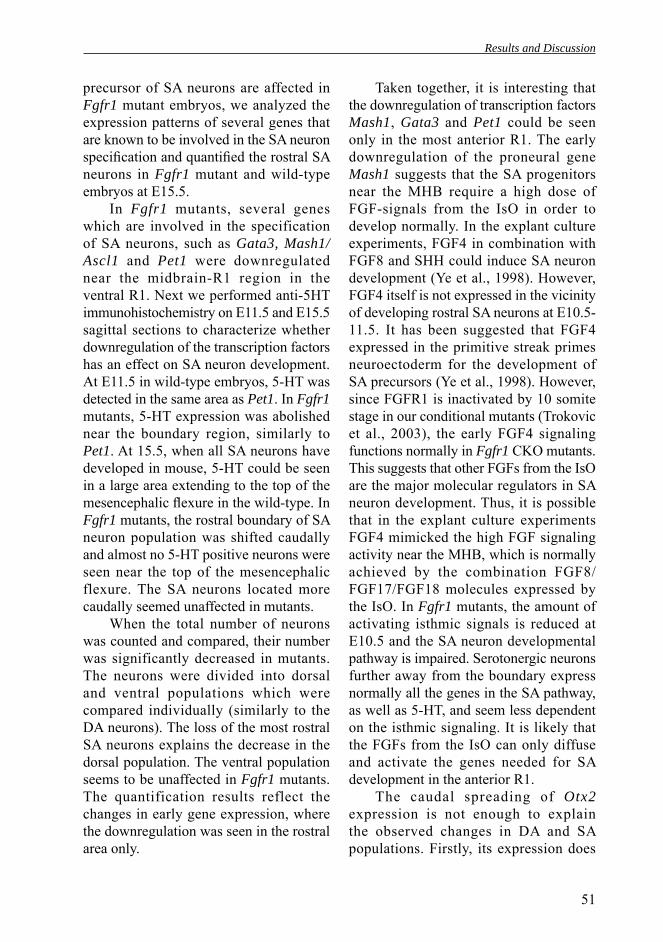
51
precursor of SA neurons are affected in Fgfr1 mutant embryos, we analyzed the expression patterns of several genes that are known to be involved in the SA neuron specifi cation and quantifi ed the rostral SA neurons in Fgfr1 mutant and wild-type embryos at E15.5.
In Fgfr1 mutants, several genes which are involved in the specification of SA neurons, such as Gata3, Mash1/Ascl1 and Pet1 were downregulated near the midbrain-R1 region in the ventral R1. Next we performed anti-5HT immunohistochemistry on E11.5 and E15.5 sagittal sections to characterize whether downregulation of the transcription factors has an effect on SA neuron development. At E11.5 in wild-type embryos, 5-HT was detected in the same area as Pet1. In Fgfr1 mutants, 5-HT expression was abolished near the boundary region, similarly to Pet1. At 15.5, when all SA neurons have developed in mouse, 5-HT could be seen in a large area extending to the top of the mesencephalic fl exure in the wild-type. In Fgfr1 mutants, the rostral boundary of SA neuron population was shifted caudally and almost no 5-HT positive neurons were seen near the top of the mesencephalic flexure. The SA neurons located more caudally seemed unaffected in mutants.
When the total number of neurons was counted and compared, their number was significantly decreased in mutants. The neurons were divided into dorsal and ventral populations which were compared individually (similarly to the DA neurons). The loss of the most rostral SA neurons explains the decrease in the dorsal population. The ventral population seems to be unaffected in Fgfr1 mutants. The quantification results reflect the changes in early gene expression, where the downregulation was seen in the rostral area only.
Taken together, it is interesting that the downregulation of transcription factors Mash1, Gata3 and Pet1 could be seen only in the most anterior R1. The early downregulation of the proneural gene Mash1 suggests that the SA progenitors near the MHB require a high dose of FGF-signals from the IsO in order to develop normally. In the explant culture experiments, FGF4 in combination with FGF8 and SHH could induce SA neuron development (Ye et al., 1998). However, FGF4 itself is not expressed in the vicinity of developing rostral SA neurons at E10.5-11.5. It has been suggested that FGF4 expressed in the primitive streak primes neuroectoderm for the development of SA precursors (Ye et al., 1998). However, since FGFR1 is inactivated by 10 somite stage in our conditional mutants (Trokovic et al., 2003), the early FGF4 signaling functions normally in Fgfr1 CKO mutants. This suggests that other FGFs from the IsO are the major molecular regulators in SA neuron development. Thus, it is possible that in the explant culture experiments FGF4 mimicked the high FGF signaling activity near the MHB, which is normally achieved by the combination FGF8/FGF17/FGF18 molecules expressed by the IsO. In Fgfr1 mutants, the amount of activating isthmic signals is reduced at E10.5 and the SA neuron developmental pathway is impaired. Serotonergic neurons further away from the boundary express normally all the genes in the SA pathway, as well as 5-HT, and seem less dependent on the isthmic signaling. It is likely that the FGFs from the IsO can only diffuse and activate the genes needed for SA development in the anterior R1.
The caudal spreading of Otx2 expression is not enough to explain the observed changes in DA and SA populations. Firstly, its expression does
Results and Discussion

52
not extend to the whole region where the downregulation of the SA marker genes was observed. Secondly, although Otx2 shows a larger caudal shift in its expression in ventral midbrain, the region where Otx2 spreads is not completely void of SA neurons, although their number is significantly reduced. At the same time, Otx2 expression is scattered and somewhat downregulated in ventral midbrain-R1 region. Based on these observations, it seems that the mixing of MHB region cells, already visible at E10.5, continues during development. At E15.5, the observed cell mixing results to a mosaic midbrain-R1 region where cells of the ventral midbrain, including DA neurons have extensively scattered into ventral R1, but R1 has not changed its fate completely into midbrain. Consequently, there are a mixture of ectopic DA neurons and some SA neurons in the same area. This scattering effect enhances the already impaired development of rostral SA neurons by disrupting the patterning of midbrain-R1 region.
It is interesting that various neuronal populations differ in their requirement for FGF signaling through FGFR1 (see sections 3.1.-3.3). Whereas the midbrain DA neurons shift posteriorly but their numbers are largely unaffected, the rostral SA neurons are greatly reduced in Fgfr1 mutants. Thus, isthmic FGF signaling is required for the proper development of the rostral SA neurons in R1. Our model suggests that high FGF-signaling levels from the IsO prevent neuronal differentiation in the midbrain side near the MHB. When FGF-signaling from IsO is abolished in Fgfr1 mutants, neurogenesis can proceed closer to MHB in the midbrain but is impaired in the ventral R1. This effect is enhanced by the mixing of the cells in ventral midbrain-R1
region which disrupts the patterning of midbrain and R1. Additionally, the slowly proliferating boundary cell population is needed for the positioning and stabilization of the IsO that function by informing the DA and SA progenitor cells in the adjacent brain regions.
4. Identifi cation of a putative target gene of WNT-β-catenin pathway (II)
The first transcript among the down-regulated probesets showing an interesting expression pattern was annotated to be a gene called EIG180 (ethanol induced gene product). Further sequence analysis, however, revealed that this transcript is a part of the novel mouse gene located upstream of EIG180 locus on the mouse chromosome 18 (Fig. 19B). This novel mouse gene was found to be orthologous to a human gene called Drapc1 (or Apcdd1), which was earlier showed to be down-regulated in cancer cells by exogenous APC (Takahashi et al., 2002). In addition, they showed that human DRAPC1 is capable to promote growth of cancer cells in vitro and it is a putative target of WNT/β-catenin pathway. The latter notion was further supported by our in situ hybridization analysis. Mouse Drapc1 expression pattern showed striking similarities to active WNT/β-catenin signaling (Maretto et al., 2003) in the developing embryos (Fig. 19A). To support our sequence analysis of the mouse Drapc1 locus and predicted exon structure, we detected similar expression patterns with three individual probes transcribed from different cDNA clones (Fig. 19B). At the midbrain-R1 region, Drapc1 expression was located in the Wnt1- and Otx2-positive cells in the midbrain (Fig. 19D-F). In the Fgfr1 mutants, Drapc1 was
Results and Discussion
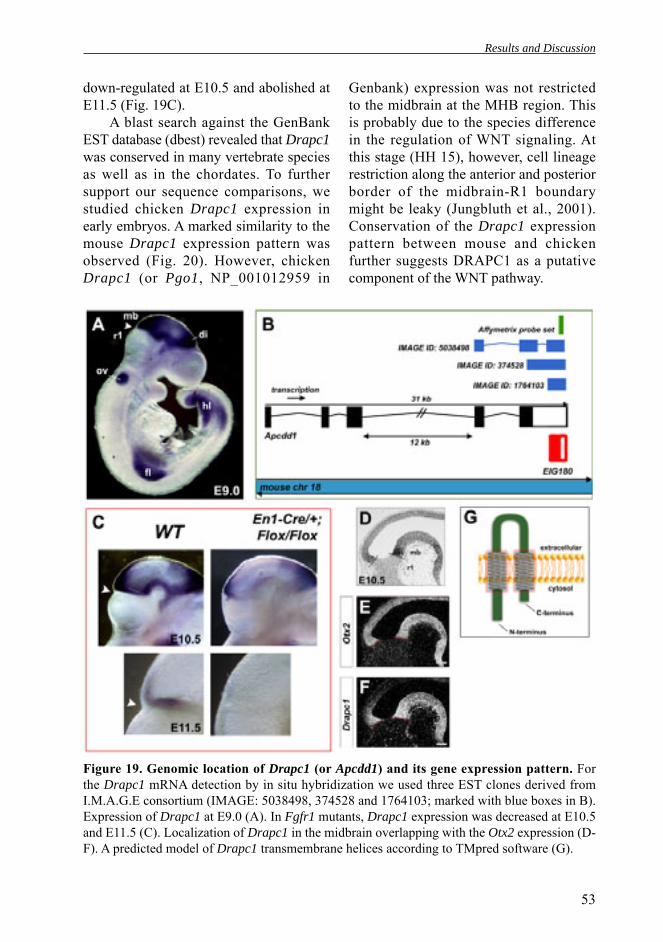
53
down-regulated at E10.5 and abolished at E11.5 (Fig. 19C).
A blast search against the GenBank EST database (dbest) revealed that Drapc1 was conserved in many vertebrate species as well as in the chordates. To further support our sequence comparisons, we studied chicken Drapc1 expression in early embryos. A marked similarity to the mouse Drapc1 expression pattern was observed (Fig. 20). However, chicken Drapc1 (or Pgo1, NP_001012959 in
Figure 19. Genomic location of Drapc1 (or Apcdd1) and its gene expression pattern. For the Drapc1 mRNA detection by in situ hybridization we used three EST clones derived from I.M.A.G.E consortium (IMAGE: 5038498, 374528 and 1764103; marked with blue boxes in B). Expression of Drapc1 at E9.0 (A). In Fgfr1 mutants, Drapc1 expression was decreased at E10.5 and E11.5 (C). Localization of Drapc1 in the midbrain overlapping with the Otx2 expression (D-F). A predicted model of Drapc1 transmembrane helices according to TMpred software (G).
Genbank) expression was not restricted to the midbrain at the MHB region. This is probably due to the species difference in the regulation of WNT signaling. At this stage (HH 15), however, cell lineage restriction along the anterior and posterior border of the midbrain-R1 boundary might be leaky (Jungbluth et al., 2001). Conservation of the Drapc1 expression pattern between mouse and chicken further suggests DRAPC1 as a putative component of the WNT pathway.
Results and Discussion

54
Figure 20. Drapc1 expression pattern in chick embryos at 15 and 17 HH stage (Hamburger–Hamilton stage). Whole mount in situ hybridization with Drapc1 antisense (A,C,D) and sense (B) probes. ba1 & 2, branchial arch 1 & 2; IsO, isthmic organizer; mb, midbrain; ov, otic vesicle; psm. presomitic mesoderm; r1, rhombomere 1; sc, spinal cord; te, telencephalon; ZLI, zona limitans intrathalamica.
5. A slowly proliferating narrow population of cells exists at the boundary between the midbrain and R1 (III,IV).
5.1. Initial changes in gene expression occur close to the midbrain-hindbrain boundary in Fgfr1 mutants (III)
5.1.1. Initial gene expression changes of FGF-FGFR signaling components at E9.5 (III) A downregulation of Fgf15, Spry1, Spry2, Pea3 and Erm was detected in Fgfr1 mutants at E10.5 by microarray analysis (Table 5). Thus these genes were analyzed at E9.5 with whole-mount in situ hybridization. Interestingly,
Results and Discussion

55
expression of Spry1, Spry2, Pea3 and Erm was downregulated only at the narrow boundary region between midbrain and R1 in Fgfr1 mutants compared to wild-type embryos. Conversely, in Fgfr1 mutants Fgf15 expression was expanded to the narrow boundary region where it is not normally detected. These analyses of gene expressions at E9.5 thus suggested that initial changes in the isthmic gene expression in Fgfr1 mutant embryos occur close to the midbrain-hindbrain boundary.
5.2. Other FGFRs may mediate FGF signaling at a distance from the midbrain-hindbrain boundary (III)
As there are other FGF receptors which can mediate the isthmic FGF signals we compared the expressions of Fgfr1, Fgfr2 and Fgfr3 in E7.5-E9.5 wild type embryos. In addition, expression of Fgfr2 and Fgfr3 was analyzed in E9.5 Fgfr1 mutants. Based on these analyses Fgfr1 seems to be the only FGF receptor expressed at the boundary region whereas the expression of Fgfr2 and Fgfr3 in the midbrain-hindbrain region was graded gradually diminishing towards the boundary and could not be detected in the cells near the midbrain-hindbrain border by our in situ hybridization analyses. Recently, Blak et al. (2005) reported that Fgfr2 expression is spanning the midbrain-R1 boundary ventrally at E9.5, which is inconsistent with our data. This, however, would explain why Spry1, Sef, Pea3, Erm and possibly Mkp3 were not completely downregulated in the most ventral midbrain-R1 region in Fgfr1 mutants. Fgfr2 and Fgfr3 expression was not upregulated in Fgfr1 mutants at E9.5. At E10.5, however, only few Erm and Pea3 positive cells were detected in the midbrain of Fgfr1 mutants where Fgfr2 is thought to be expressed at E10.5 (Blak et al., 2005).
5.3. Isthmic constriction fails to develop in the Fgfr1 CKO mutant embryos (III)
The most obvious morphological landmark at the IsO is a constriction which forms at the boundary between midbrain and R1. In the mouse embryos, the constriction starts to form around E9.25 and it is clearly visible at E10.5. In Fgfr1 mutants, however, the isthmic constriction was not evidently recognized at E10.5 and was clearly absent at E11.5. These morphological defects further suggested that the cell population at the boundary failed to develop normally and might be required for a stabilization of the IsO.
5.4. Expression of cell cycle regulators at the midbrain-R1 region (I, III, IV)
Several genes responsible for cell cycle regulation were differentially expressed in Fgfr1 mutants compared with wild-type embryos at E10.5 (Tables 5 and 7). These were validated by in situ hybridization. We found out that CyclinD1 and CyclinD2 (or Ccnd1 and 2) and CyclinB2 (or Ccnb1) were broadly expressed in the dorsal midbrain and hindbrain, but a narrow domain of CyclinD1, CyclinD2 and CyclinB2 negative cells were detected in the border between midbrain and R1. Microarray screen identified also a negative regulator of the cell cycle, Jumonji (Jmj or Jarid), which expression was detected as a stripe at the midbrain-hindbrain boundary in wild-type embryos at E9.5 and E10.5. In the Fgfr1 mutant embryos, Jmj was clearly down-regulated at these both stages. Subsequently, we looked at the expression of other cell cycle inhibitors such as p21, p27 and p57. Among these only p21 showed a specific expression at the midbrain-R1 region between E9.0-E11.5. In the wild-
Results and Discussion

56
type embryos p21 was expressed as a narrow stripe at the midbrain-hindbrain boundary. In contrast, p21 positive cells were dispersed both in midbrain and R1 in the Fgfr1 embryos at E9.5. Later, p21 expression was completely abolished from Fgfr1 embryos.
5.5. Cell proliferation at the border between midbrain and R1 (III,IV)
5.5.1. The location of p21 expressing cells at the border between midbrain and R1 (III,IV)
Our in situ hybridization analysis revealed the p21-positive cell population within a midbrain-R1 region. Interestingly, p21 expression domain appeared to correspond to the region where CyclinD1/2 and CyclinB1 negative cells were observed. Comparative analysis with Otx2, Wnt1, and Fgf8 determined that these cells
were located on both sides of the border between midbrain and R1. The location of p21 expression was further analyzed using immunostaining with anti-p21 antibody and Otx2 in situ hybridization on parallel sections. Consistent with our in situ hybridization analysis, p21 proteins were located on both sides of the midbrain-R1 boundary (Fig. 21). In addition, they were profoundly in the pial side of the neural tube.
Figure 21. Location of the p21 transcripts and proteins in the boundary cells between midbrain and anterior hindbrain (r1) at E11.5. Whole-mount in situ hybridization analysis of p21 expression in wild-type embryos. Parallel coronal sections of E11.5 wild-type embryos were analyzed using anti-p21 antibody (D) and Otx2 radioactive in situ hybridization (E,F). Parasagittal frozen sections immunostained with anti-p21 and anti-PH3 (G-J). The rectangles in C and G show the areas presented in the close-up micrographs D-F and H-J, respectively. Arrowheads show the nuclear p21 expression in the boundary cells (insets in H, I). Arrow in J shows weakly p21-positive cells in the r1, at a distance from the boundary cell population. mb, midbrain; r1, rhombomere 1. Scale bars: 50 μm.
Results and Discussion

57
5.5.2. Slowly proliferating cell population at the midbrain-R1 boundary (III,IV)
As several genes regulating the cell cycle showed specific expression patterns at the midbrain-hindbrain boundary we analyzed the cellular proliferation in the midbrain-R1 region. In wild-type embryos (at E10.5), a narrow cell population was found to show a reduced proliferation index assayed by the BrdU incorporation and mitotic cell analyses. Subsequently, this cell population was showed to correlate with the p21 expression at the border between midbrain and R1.
Moreover, we could not detect any p21-positive cells which were in S phase of the cell cycle (BrdU analysis) between E10.5 and E11.5 (Fig. 22A-C). Thus, these data suggest that p21-expressing cells are a slow-proliferating population which is needed to maintain the coherent boundary between midbrain and R1. To further characterize the role of p21-positive cells in the midbrain-R1 boundary region we analyzed the expression of p21 protein together with KI67 that is expressed at all phases of the cell cycle but is absent from quiescent cells (G0) (Schluter et al., 1993). We could not detect any p21 proteins overlapping with the KI67-positive cells
Figure 22. Cell proliferation and p21 expression in the boundary cells. Micrographs of coronal sections of the midbrain-R1 region at E11.5 immunostained with anti-p21 and anti-BrdU (A-C). Coronal sections were also immunostained with anti-p21 and anti-KI67 to detect all cell cycle phases (D-J). DAPI was used to stain the nuclei. BrdU injection was given 1 hour before the mice were sacrifi ced. Dorsal (A-C,D,E, H-J) and ventral (F,G) regions are shown. Orange arrowheads indicate cells expressing both p21 and KI67 in the midbrain (E). White arrowheads point to the boundary between midbrain and R1. mb, midbrain; r1, rhombomere 1. Scale bars: 50 μm.
Results and Discussion

58
at the vicinity of the boundary cells (Fig. 22E,G,I-J). However, p21 and KI67 were co-expressed in the same cells further away from the boundary cells (IV, Fig. 22E, orange arrowheads).
The narrow boundary cell population is dependent on Fgfr1 signaling and may prevent cell mixing between midbrain and R1. In Fgfr1 mutants, loss of p21 expression might interrupt the normal cell cycle kinetics leading into cell sorting and/or cell fate changes at the midbrain-R1 boundary region (see Fig. 24 below). Consistent with this, both Wnt1 and Otx2 were ectopically expressed in the R1 region in Fgfr1 mutants at E10.5. Because we also detected downregulation of cell adhesion molecules (e.g. Pb-cadherin and Ob-cadherin, Fig. 23), a decrease in the p21 expression level might be due to the loss of these cells. In addition, Fgfr1 is not absolutely required for the development of the boundary cells as scattered p21 expressing cells were observed at E9.5 in Fgfr1 mutants. 5.5.3. The contribution of the boundary cell population to the midbrain-R1 development (IV)
The cell lineage properties of the boundary cell population were studied with a mouse line expressing the Cre-recombinase in a boundary cell –specific fashion (designated MHB-Cre mouse line). We detected a marked similarity between the MHB-Cre activity and the p21-expressing boundary cells between the E10.5-E11.5.
Figure 23. The loss of cell adhesion properties in the Fgfr1 mutant. In addition to the Pb-cadherin (Trokovic et al., 2003), we also detected the downregulation of Ob-cadherin at the midbrain-R1 region in Fgfr1 mutant embryos at E10.5 (B).
More detailed analysis showed that a subset of recombined cells (MHB-Cre/+: R26R/+ embryos) overlapped with the p21 expression in the most posterior midbrain and the most anterior R1. As we could not detect any p21-expressing cells that were in S phase, this observation suggests that boundary cells may represent a slowly proliferating stem cell population. Additional hypothesis suggests that the p21-expressing cells might be differentiating within the Cre-expressing domain between E10.5-E11.5.
Fate mapping data of MHB-Cre/+: R26R/+ embryos revealed that the midbrain-R1 boundary cells marked by MHB-Cre contributed to the midbrain and R1 derivatives such as inferior colliculi and cerebellar vermis, respectively. Interestingly, the majority of recombined cells remained near the border between midbrain and R1, further suggesting tightly controlled lineage restriction between these brain compartments.
Our results suggest that p21-expressing boundary cells posses a decreased proliferation potential and would require re-activation of self-
Results and Discussion

59
Figure 24. Maintenance of compartments between midbrain and R1 is dependent on Fgfr1 signaling. In a cell sorting-based model, cells cannot move to the other side of the boundary (Aa, a cell sorting-based mechanism) whereas in a cell fate-based mechanism cells regulate their gene expression to match that of their neighbors (Ab). Different cell adhesion properties of midbrain and R1 cells (e.g. Pb-cadherin) and our data of existence on boundary cell population favor the presence of cell sorting at the IsO. In wild-type embryos this sorting mechanism leads to a sharp Wnt1/Fgf8 expression boundary (A; E10.5). Conversely, In Fgfr1 mutants (Mut) disruption of a coherent signaling from the IsO and subsequent loss of the cell sorting mechanism leads to a cell mixing at the border between midbrain and R1 (B; E10.5). White arrowheads point to the cell mixing in the R1.
renewal pathways. Decrease of Cyclin D1/2, by limiting the proliferation of early boundary cells, would reduce the number of cells arising from the early border between midbrain and R1. Although p21 expressing nuclei are located at the basal side there is fewer cells which are entering the cell cycle. In the midbrain-R1 region a domain of reduced cell proliferation has been reported earlier in E14 rat (Altman
and Bayer 1997) and in E12.5 mouse (Li et al., 2002). In these studies the region of slowly proliferating cells was co-localized with the broad Fgf8 (100 μm) expression domain in the R1, whereas in our analyses the reduced cell proliferation rates and p21 (50 μm) expression were detected only in the most anterior part of the Fgf8 expression domain (app. 25% of it) and in the most posterior midbrain.
Results and Discussion

60
CONCLUSIONS
The Iso provides as one of the best models to study the cellular mechanism of the regionalization and differentiation of the brain along the AP axis. Two secreted factors, FGF8 and WNT1, are required for the IsO activity and the development of the midbrain and cerebellum.
In this study we have studied the role of FGFR1 in the development of midbrain-R1 region. We compared the gene-expression profi les of wild-type and Fgfr1 CKO mutant embryos in order to discover new molecules regulating the IsO activity and development of this brain region.
In this work, we have characterized mouse genes that are involved in the FGF-FGFR1 signal transduction in the midbrain-R1 region. Our gene-expression analyses showed that a number of these molecules are regulated by FGFR1 signal transduction pathway and they show specific expression at the IsO. These molecules are modulating the FGFR signaling either positively (CNPY1, FLRT3) or negatively (MKP3, SEF).
The present study suggests that the mouse CNPY1 is a novel FGFR1 pathway component which is essential for the FGF signal transduction at the IsO. It has been hypothesized that CNPY1 activity is needed to attenuate the FGFR signaling through physical interaction with the lipid rafts on the plasma membrane (Hirate and Okamoto 2006). This assumption provides an interesting mechanism how the activity of broadly expressed FGFR1 is modulated in the vicinity of the IsO.
In addition to components of FGFR signal transduction, our gene-expression profiling revealed a transcript, Drapc1, which was found to be a novel component of the WNT signaling. Although, its
expression at the MHB is striking, the actual role of DRAPC1 in the midbrain or hindbrain development needs to be resolved.
Prior to this study the role FGFR1 in the early development of neuronal populations such as DA and SA neurons was not addressed. The data from microarray screen showed that a number of genes regulating the neuronal differentiation were up-regulated in the Fgfr1 CKO mutants. Further studies with conditional Fgfr1 mutants provided in vivo evidence for the involvement of FGF signaling in the development of DA and SA cell-types characteristic for the ventral midbrain and R1, respectively. In the developing midbrain DA neuron population, we suggest that FGF signaling is required for active proliferation of the early precursor cells rather than the neural differentiation process itself. FGF signaling likely regulates the development of other neuronal precursor pools in the midbrain-R1 region in a similar fashion. However, due to redundancy of different FGFRs further analyses of FGFR1-3 compound mutants are needed to clarify the role of FGFR signaling in the neuronal development.
About fi fteen years ago the existence and importance of compartment boundaries was discovered in the embryonic rhombomeres (Fraser et al. 1990). It was postulated that compartment boundaries in the developing CNS have a dual function during development and serve a similar function with the Drosophila embryonic structures such as imaginal discs. Firstly, neuroepithelial compartment boundaries are preventing the intermingling of cells that are fated to contribute to different parts of the embryo (e.g. midbrain vs.
Conclusions

61
R1). Secondly, compartment boundaries are providing positional information to adjacent cell populations. In addition to the compartmentalization of rhombomeres, it was also shown that the positional identity of each rhombomere is defined by the combinatorial expression of homeotic selector genes such as the Hox genes. Thus, after the initial studies of rhombomeric boundaries there has been continuous search for compartments and these so-called selector genes in other regions of the developing brain as well.
Before this study was initiated, it was not clear whether the midbrain-R1 compartment boundary really exists. For example, Jungbluth et al. (2001) proposed that midbrain-R1 boundary does not represent a compartment boundary in the chick embryos (HH 11 stage). The loss of isthmic constriction in the Fgfr1 mutants by E10.5 together with the deregulation of the cell cycle regulators prompted us to study the cellular characteristics behind this morphological landmark (see Fig. 24). Subsequent characterization of the cell proliferation at the boundary between midbrain and R1 identified a slowly proliferating cell population (p21-expressing cells) that may contribute to compartmentalization of this brain region. Furthermore, in the present study, we present that one of the main aspect of the boundary between midbrain and R1 is to position and stabilize the local signaling centre, the IsO.
To support our hypothesis of compartmentalization at the midbrain-R1 region Brand and co-workers (Langenberg and Brand, 2005) have reported recently a state-of-the-art time-lapse study, in which they mapped the fates of hundreds of cells in the developing zebrafi sh midbrain-R1 region. They proposed that cells do not cross the border between midbrain and R1 during the zebrafi sh development. In mice, the existence of cell lineage restriction at the midbrain-R1 boundary was supported by a study that used genetic fate mapping with an inducible transgene (Zervas et al., 2004). Both these analyses clearly showed the presence of cell lineage restriction boundary between the midbrain and R1, but it was proposed that in the mouse the cell lineage restriction is set up at different phases in ventral and dorsal midbrain-R1 domains (Zervas et al., 2004). Importantly, our analysis with the cells marked by MHB-Cre further suggests limited cell mixing within these brain compartments.
In addition, the role of slowly proliferating boundary cells between midbrain and R1 has been recently confi rmed by others. Baek et al. (2006) showed that a high expression levels of transcription factor Hes1 in the border between midbrain and R1 is needed for the coherent boundary formation. This narrow expression domain of high Hes1 expression level correlates with the p21-expressing cells.
Conclusions

62
ACKNOWLEDGEMENTS
I am very grateful for the opportunity to work in the lab managed by Docent Juha Partanen in the Institute of Biotechnology (BI), University of Helsinki. Also, I like to thank Juha sincerely for the extensive supervision and his useful advice and tremendous help for my PhD thesis. The working environment in the BI and Developmental Biology Program was excellent; actually I think it has to be one of the best in the world. For that, I want to thank BI’s director, professor Mart Saarma. I sincerely want to thank all the people who have been involved for this thesis:
My co-authors and our laboratory’s present and past group members Ras Trokovic, Nina Trokovic, Natalia Sinjushina, Laura Lahti, Jonna Saarimäki-Vire, Paula Peltopuro, Kaia Kala, Emilia Carlsson and Dmitri Chilov. I am very grateful for the help, advice, discussions that I have had with my colleagues during my PhD work in the lab.
Kindest appreciation to our lab technicians and research assistants Eija Koivunen, Marjo Virtanen, Päivi Hannuksela and Mona Augustin for their excellent technical expertise. Special recognition for Eija Koivunen whose histological expertise and help for my thesis was outstanding.
The members of Prof. Irma Thesleff’s, Prof. Hannu Sariola’s, Doc. Tapio Heino’s, Doc. Marjo Salminen’s and Mikko Frilander’s research groups as well as the whole Developmental Biology Program both in Viikki and in Biomedicum. Especially, I want to thank for the great discussions and chats I have had with Janne Hakanen, Tanja Matilainen, Katja Piltti, Nina Perälä, Martyn James, Mari Palgi, Johanna Pispa and many others.
I am also grateful for the D&C publication team and its editors Satu Kuure (editor-in-chief), Mark Tummers (editor-in-chief), Elina Järvinen and other editors in Turku and Oulu as well as other people who have contributed to this students’ journal.
I want to acknowledge the Helsinki Biotechnology and Molecular Biology Graduate School (GSBM) and its director Dr. Pekka Lappalainen, co-ordinator Dr. Erkki Raulo and Ms. Anita Tienhaara for their excellent courses, seminars, steering days, Christmas parties and travel grants. Special thanks to Dr. Erkki Raulo for fruitful conversations and ideas.
I thank reviewers professor Eero Castren and professor Seppo Vainio for their excellent comments and critical reading of this thesis book.
Turku Affymetrix Core Facility and is acknowledged for the help with the microarray analysis. Also, Dr. Mikko Frilander and Dr. Martyn James who gave me valuable information and assistance that I needed for RNA isolation and analysis. For help with the data analysis I want to acknowledge Kai Lähteenmäki and Jarno Tuimala (CSC).
To my parents Maarit and Tuomo, brother Tuomas and sisters Mari and Maija for all kind of support, encouragement and discussions. I also want to express grateful thanks for my parents-in-law Raija and Veikko Marttila for their continuous support.
I also want to thank my friends Hemmo Jauhiainen, Perttu Salmenperä and Topi Törrönen for their support and friendship.
Finally, to my lovely wife Minttu Marttila and to my little daughters Emma and Miusa, for being supportive and loving as well as helping me with many things.
Tomi Jukkola, Helsinki 1.5.2007
Acknowledgements

63
REFERENCES
Acampora,D., Avantaggiato,V., Tuorto,F. and Simeone,A. (1997) Genetic control of brain morphogenesis through Otx gene dosage requirement. Development, 124, 3639-3650.Alberi,L., Sgado,P. and Simon,H.H. (2004) Engrailed genes are cell-autonomously required to prevent apoptosis in mesencephalic dopaminergic neurons. Development, 131, 3229-3236.Altman and Bayer, 1997. J. Altman and S.A. Bayer, The Development of the Cerebellar System: In Relation to Its Evolution, Structure, and Functions, CRC Press, Boca Raton, FL (1997).Amoyel,M., Cheng,Y.C., Jiang,Y.J. and Wilkinson,D.G. (2005) Wnt1 regulates neurogenesis and mediates lateral inhibition of boundary cell specifi cation in the zebrafi sh hindbrain. Development, 132, 775-785.Andersson,E., Jensen,J.B., Parmar,M., Guillemot,F. and Bjorklund,A. (2006a) Development of the mesencephal ic dopaminergic neuron system is compromised in the absence of neurogenin 2. Development, 133, 507-516.Andersson,E., Tryggvason,U., Deng,Q., Fril ing,S., Alekseenko,Z., Robert,B., Perlmann,T. and Ericson,J . (2006b) Identification of intrinsic determinants of midbrain dopamine neurons. Cell, 124, 393-405.Ang,S.L. (2006) Transcriptional control of midbrain dopaminergic neuron development. Development, 133, 3499-3506.Ang,S.L., Conlon,R.A., Jin,O. and Rossant,J. (1994) Positive and negative signals from mesoderm regulate the expression of mouse Otx2 in ectoderm explants. Development, 120, 2979-2989.Ang,S.L. and Rossant,J. (1993) Anterior mesendoderm induces mouse Engrailed genes in explant cultures. Development, 118, 139-149.
Arber,S., Ladle,D.R., Lin,J.H., Frank,E. and Jessell,T.M. (2000) ETS gene Er81 controls the formation of functional connections between group Ia sensory afferents and motor neurons. Cell, 101, 485-498.Arman,E., Haffner-Krausz,R., Chen,Y., Heath,J.K. and Lonai,P. (1998) Targeted disruption of fi broblast growth factor (FGF) receptor 2 suggests a role for FGF signaling in pregastrulation mammalian development. Proc.Natl.Acad.Sci.U.S.A., 95, 5082-5087.Assem,M., Schuetz,E.G., Leggas,M., Sun,D., Yasuda,K., Reid,G., Zelcer,N., Adachi,M., Strom,S., Evans,R.M., Moore,D.D., Borst,P. and Schuetz,J.D. (2004) Interactions between hepatic Mrp4 and Sult2a as revealed by the constitutive androstane receptor and Mrp4 knockout mice. J.Biol.Chem., 279, 22250-22257.Baek,J.H., Hatakeyama,J., Sakamoto,S., Ohtsuka,T. and Kageyama,R. (2006) Persistent and high levels of Hes1 expression regulate boundary formation in the developing central nervous system. Development, 133, 2467-2476.Bailey,A.P., Bhattacharyya,S., Bronner-Fraser,M. and Streit ,A. (2006) Lens specifi cation is the ground state of all sensory placodes, from which FGF promotes olfactory identity. Dev.Cell., 11, 505-517.Bally-Cuif,L., Cholley,B. and Wassef,M. (1995) Involvement of Wnt-1 in the formation of the mes/metencephalic boundary. Mech.Dev., 53, 23-34.Bayer,S.A., Altman,J., Russo,R.J., Dai,X.F. and Simmons,J.A. (1991) Cell migration in the rat embryonic neocortex. J.Comp.Neurol., 307, 499-516.Ben-Arie,N., Bellen,H.J., Armstrong,D.L., McCall,A.E., Gordadze,P.R., Guo,Q., Matzuk,M.M. and Zoghbi,H.Y. (1997) Math1 is essential for genesis of cerebellar granule neurons. Nature, 390, 169-172.
References
64
Blaess,S., Corrales,J.D. and Joyner,A.L. (2006) Sonic hedgehog regulates Gli activator and repressor functions with spatial and temporal precision in the mid/hindbrain region. Development, 133, 1799-1809.Blak,A.A., Naserke,T., Saarimaki-Vire,J., Peltopuro,P., Giraldo-Velasquez,M., Vogt Weisenhorn,D.M., Prakash,N., Sendtner,M., Partanen,J. and Wurst,W. (2007) Fgfr2 and Fgfr3 are not required for patterning and maintenance of the midbrain and anterior hindbrain. Dev.Biol., 303, 231-243.Blak,A.A., Naserke,T., Weisenhorn,D.M., Prakash,N., Partanen,J. and Wurst,W. (2005) Expression of Fgf receptors 1, 2, and 3 in the developing mid- and hindbrain of the mouse. Dev.Dyn., 233, 1023-1030.Blum,M. (1998) A null mutation in TGF-alpha leads to a reduction in midbrain dopaminergic neurons in the substantia nigra. Nat.Neurosci., 1, 374-377.Bottcher,R.T., Pollet,N., Delius,H. and Niehrs,C. (2004) The transmembrane protein XFLRT3 forms a complex with FGF receptors and promotes FGF signalling. Nat.Cell Biol., 6, 38-44.Bouwmeester,T., Kim,S., Sasai,Y., Lu,B. and De Robertis,E.M. (1996) Cerberus is a head-inducing secreted factor expressed in the anterior endoderm of Spemann’s organizer. Nature, 382, 595-601.Brandeis,M., Rosewell,I., Carrington,M., Crompton,T., Jacobs,M.A., Kirk,J., Gannon,J. and Hunt,T. (1998) Cyclin B2-null mice develop normally and are fertile whereas cyclin B1-null mice die in utero. Proc.Natl.Acad.Sci.U.S.A., 95, 4344-4349.Brault,V., Moore,R., Kutsch,S., Ishibashi,M., Rowitch,D.H., McMahon,A.P., Sommer,L., Boussadia,O. and Kemler,R. (2001) Inactivation of the beta-catenin gene by Wnt1-Cre-mediated deletion results in dramatic brain malformation and failure of craniofacial development. Development, 128, 1253-1264.Broccoli,V., Boncinelli,E. and Wurst,W. (1999) The caudal limit of Otx2 expression positions the isthmic organizer. Nature, 401, 164-168.
Brodski,C., Weisenhorn,D.M., Signore,M., Sillaber,I., Oesterheld,M., Broccoli,V., Acampora,D., Simeone,A. and Wurst,W. (2003) Location and size of dopaminergic and serotonergic cell populations are controlled by the position of the midbrain-hindbrain organizer. J.Neurosci., 23, 4199-4207.Buckles,G.R., Thorpe,C.J., Ramel,M.C. and Lekven,A.C. (2004) Combinatorial Wnt control of zebrafish midbrain-hindbrain boundary formation. Mech.Dev., 121, 437-447.Cappello,S., Attardo,A., Wu,X., Iwasato,T., Itohara,S., Wilsch-Brauninger,M., Eilken,H.M., Rieger,M.A., Schroeder,T.T., Huttner,W.B., Brakebusch,C. and Gotz,M. (2006) The Rho-GTPase cdc42 regulates neural progenitor fate at the apical surface. Nat.Neurosci., 9, 1099-1107.Castella,P., Sawai,S., Nakao,K., Wagner,J.A. and Caudy,M. (2000) HES-1 repression of differentiation and proliferation in PC12 cells: role for the helix 3-helix 4 domain in transcription repression. Mol.Cell.Biol., 20, 6170-6183.Chao,J. and Nestler,E.J. (2004) Molecular neurobiology of drug addiction. Annu.Rev.Med., 55, 113-132.Chellaiah,A., Yuan,W., Chellaiah,M. and Ornitz,D.M. (1999) Mapping ligand binding domains in chimeric fi broblast growth factor receptor molecules. Multiple regions determine ligand binding specifi city. J.Biol.Chem., 274, 34785-34794.Chi,C.L., Martinez,S., Wurst,W. and Martin,G.R. (2003) The isthmic organizer signal FGF8 is required for cell survival in the prospective midbrain and cerebellum. Development, 130, 2633-2644.Chizhikov,V.V., Lindgren,A.G., Currle,D.S., Rose,M.F., Monuki,E.S. and Millen,K.J. (2006) The roof plate regulates cerebellar cell-type specification and proliferation. Development, 133, 2793-2804.Chotteau-Lelievre,A., Dolle,P., Peronne,V., Coutte,L., de Launoit,Y. and Desbiens,X. (2001) Expression patterns of the Ets
References

65
transcription factors from the PEA3 group during early stages of mouse development. Mech.Dev., 108, 191-195.Christen,B. and Slack,J.M. (1999) Spatial response to fi broblast growth factor signalling in Xenopus embryos. Development, 126, 119-125.Ciani,L. and Salincookeas,P.C. (2005) WNTs in the vertebrate nervous system: from patterning to neuronal connectivity. Nat.Rev.Neurosci., 6, 351-362.Ciemerych,M.A., Kenney,A.M., Sicinska,E., Kalaszczynska,I., Bronson,R.T., Rowitch,D.H., Gardner,H. and Sicinski,P. (2002) Development of mice expressing a single D-type cyclin. Genes Dev., 16, 3277-3289.Ciemerych,M.A. and Sicinski,P. (2005) Cell cycle in mouse development. Oncogene, 24, 2877-2898.Clarke,A.R., Maandag,E.R., van Roon,M., van der Lugt,N.M., van der Valk,M., Hooper,M.L., Berns,A. and te Riele,H. (1992) Requirement for a functional Rb-1 gene in murine development. Nature, 359, 328-330.Colvin,J.S., Bohne,B.A., Harding,G.W., McEwen,D.G. and Ornitz,D.M. (1996) Skeletal overgrowth and deafness in mice lacking fibroblast growth factor receptor 3. Nat.Genet., 12, 390-397.Cooke,J.E., Kemp,H.A. and Moens,C.B. (2005) EphA4 Is Required for Cell Adhesion and Rhombomere-Boundary Formation in the Zebrafi sh. Current Biology, 15, 536-542.Corson,L.B., Yamanaka,Y., Lai,K.M. and Rossant,J. (2003) Spatial and temporal patterns of ERK signaling during mouse embryogenesis. Development, 130, 4527-4537.Crossley,P.H. and Martin,G.R. (1995) The mouse Fgf8 gene encodes a family of polypeptides and is expressed in regions that direct outgrowth and patterning in the developing embryo. Development, 121, 439-451.
Crossley,P.H., Martinez,S. and Martin,G.R. (1996) Midbrain development induced by FGF8 in the chick embryo. Nature, 380, 66-68.Darnell,D.K. and Schoenwolf,G.C. (1997) Vertical induction of engrailed-2 and other region-specific markers in the early chick embryo. Dev.Dyn., 209, 45-58.Davidson,D., Graham,E., Sime,C. and Hill,R. (1988) A gene with sequence similarity to Drosophila engrailed is expressed during the development of the neural tube and vertebrae in the mouse. Development, 104, 305-316.Davis,C.A. and Joyner,A.L. (1988) Expression patterns of the homeo box-containing genes En-1 and En-2 and the proto-oncogene int-1 diverge during mouse development. Genes Dev., 2, 1736-1744.de Bruin ,A. , Wu,L. , Saavedra ,H.I . , Wilson,P., Yang,Y., Rosol,T.J., Weinstein,M., Robinson,M.L. and Leone,G. (2003) Rb function in extraembryonic lineages suppresses apoptosis in the CNS of Rb-deficient mice. Proc.Natl.Acad.Sci.U.S.A., 100, 6546-6551.Deng,C., Wynshaw-Boris,A., Zhou,F., Kuo,A. and Leder,P. (1996) Fibroblast growth factor receptor 3 is a negative regulator of bone growth. Cell, 84, 911-921.Deng,C., Zhang,P., Harper,J.W., Elledge,S.J. and Leder,P. (1995) Mice lacking p21CIP1/WAF1 undergo normal development, but are defective in G1 checkpoint control. Cell, 82, 675-684.Deng,C.X., Wynshaw-Boris,A., Shen,M.M., Daugherty,C., Ornitz,D.M. and Leder,P. (1994) Murine FGFR-1 is required for early postimplantation growth and axial organization. Genes Dev., 8, 3045-3057.Ding,Y.Q., Marklund,U., Yuan,W., Yin,J., Wegman,L., Ericson,J., Deneris,E., Johnson,R.L. and Chen,Z.F. (2003) Lmx1b is essential for the development of serotonergic neurons. Nat.Neurosci., 6, 933-938.
References
66
Eblaghie,M.C., Lunn,J.S., Dickinson,R.J., Munsterberg,A.E., Sanz-Ezquerro,J.J., Farrell,E.R., Mathers,J., Keyse,S.M., Storey,K. and Tickle,C. (2003) Negative feedback regulation of FGF signaling levels by Pyst1/MKP3 in chick embryos. Curr.Biol., 13, 1009-1018.Echevarria,D., Martinez,S., Marques,S., Lucas-Teixeira,V. and Belo,J.A. (2005) Mkp3 is a negative feedback modulator of Fgf8 signaling in the mammalian isthmic organizer. Dev.Biol., 277, 114-128.Echevarria,D., Vieira,C., Gimeno,L. and Martinez,S. (2003) Neuroepithelial secondary organizers and cell fate specification in the developing brain. Brain Res.Brain Res.Rev., 43, 179-191.Ekker,S.C., Ungar,A.R., Greenstein,P., von Kessler,D.P., Porter,J.A., Moon,R.T. and Beachy,P.A. (1995) Patterning activities of vertebrate hedgehog proteins in the developing eye and brain. Curr.Biol., 5, 944-955.Es t iv i l l -Tor rus ,G. , Pearson ,H. , van Heyningen,V., Price,D.J. and Rashbass,P. (2002) Pax6 is required to regulate the cell cycle and the rate of progression from symmetrical to asymmetrical division in mammalian cortical progenitors. Development, 129, 455-466.Fantl,V., Stamp,G., Andrews,A., Rosewell,I. and Dickson,C. (1995) Mice lacking cyclin D1 are small and show defects in eye and mammary gland development. Genes Dev., 9, 2364-2372.Farah,M.H., Olson,J.M., Sucic,H.B., Hume,R.I., Tapscott,S.J. and Turner,D.L. (2000) Generation of neurons by transient expression of neural bHLH proteins in mammalian cells. Development, 127, 693-702.Farkas ,L.M., Dunker,N. , Roussa ,E. , Unsicker,K. and Krieglstein,K. (2003) Transforming growth factor-beta(s) are essential for the development of midbrain dopaminergic neurons in vitro and in vivo. J.Neurosci., 23, 5178-5186.
Fraser,S., Keynes,R. and Lumsden,A. (1990) Segmentation in the chick embryo hindbrain is defi ned by cell lineage restrictions. Nature, 344, 431-435.Friedman,G.C. and O’Leary,D.D. (1996) Retroviral misexpression of engrailed genes in the chick optic tectum perturbs the topographic targeting of retinal axons. J.Neurosci., 16, 5498-5509.Frilander,M.J. and Steitz,J.A. (1999) Initial recognition of U12-dependent introns requires both U11/5’ splice-site and U12/branchpoint interactions. Genes Dev., 13, 851-863.Furthauer,M., Reifers,F., Brand,M., Thisse,B. and Thisse,C. (2001) sprouty4 acts in vivo as a feedback-induced antagonist of FGF signaling in zebrafi sh. Development, 128, 2175-2186.Galaktionov,K. and Beach,D. (1991) Specifi c activation of cdc25 tyrosine phosphatases by B-type cyclins: evidence for multiple roles of mitotic cyclins. Cell, 67, 1181-1194.Gavalas,A. and Krumlauf,R. (2000) Retinoid signalling and hindbrain patterning. Curr.Opin.Genet.Dev., 10, 380-386.German,D.C. and Manaye,K.F. (1993) Midbrain dopaminergic neurons (nuclei A8, A9, and A10): three-dimensional reconstruction in the rat. J.Comp.Neurol., 331, 297-309.Gimeno,L., Brulet,P. and Martinez,S. (2003) Study of Fgf15 gene expression in developing mouse brain. Gene Expr.Patterns, 3, 473-481.Gimeno,L., Hashemi,R., Brulet,P. and Martinez,S. (2002) Analysis of Fgf15 expression pattern in the mouse neural tube. Brain Res.Bull., 57, 297-299.Glover,J.C., Renaud,J.S. and Rijli,F.M. (2006) Retinoic acid and hindbrain patterning. J.Neurobiol., 66, 705-725.Gotz,M. and Huttner,W.B. (2005) The cell biology of neurogenesis. Nat.Rev.Mol.Cell Biol., 6, 777-788.Guo,S., Brush,J., Teraoka,H., Goddard,A., Wilson,S.W., Mullins,M.C. and Rosenthal,A. (1999) Development of noradrenergic neurons in the zebrafi sh hindbrain requires BMP, FGF8,
References

67
and the homeodomain protein soulless/Phox2a. Neuron, 24, 555-566.Guo, C., Qiu, H.Y, Huang, Y., Chen, H., Yang, R.Q., Chen, S.D., Johnson, R.L., Chen, Z.F., Ding, Y.Q. (2007) Lmx1b is essential for Fgf8 and Wnt1 expression in the isthmic organizer during tectum and cerebellum development in mice. Development, 134, 317-325.Guthrie,S., Butcher,M. and Lumsden,A. (1991) Patterns of cell division and interkinetic nuclear migration in the chick embryo hindbrain. J.Neurobiol., 22, 742-754.Guthrie,S., Muchamore,I., Kuroiwa,A., Marshall,H., Krumlauf,R. and Lumsden,A. (1992) Neuroectodermal autonomy of Hox-2.9 expression revealed by rhombomere transpositions. Nature, 356, 157-159.Haines,B.P., Wheldon,L.M., Summerbell,D., Heath,J.K. and Rigby,P.W. (2006) Regulated expression of FLRT genes implies a functional role in the regulation of FGF signalling during mouse development. Dev.Biol., 297, 14-25.Hamburger,V. (1988) Ontogeny of neuroembryology. J.Neurosci., 8, 3535-3540.Hanafusa,H., Torii,S., Yasunaga,T. and Nishida,E. (2002) Sprouty1 and Sprouty2 provide a control mechanism for the Ras/MAPK signalling pathway. Nat.Cell Biol., 4, 850-858.Harland,R. and Gerhart,J. (1997) Formation and function of Spemann’s organizer. Annu.Rev.Cell Dev.Biol., 13, 611-667.Hemmati-Brivanlou,A., Stewart,R.M. and Harland,R.M. (1990) Region-specifi c neural induction of an engrailed protein by anterior notochord in Xenopus. Science, 250, 800-802.Hendricks,T.J., Fyodorov,D.V., Wegman,L.J., Lelutiu,N.B., Pehek,E.A., Yamamoto,B., Silver,J., Weeber,E.J., Sweatt,J.D. and Deneris,E.S. (2003) Pet-1 ETS gene plays a critical role in 5-HT neuron development and is required for normal anxiety-like and aggressive behavior. Neuron, 37, 233-247.Henrique,D., Adam,J., Myat,A., Chitnis,A., Lewis,J. and Ish-Horowicz,D. (1995) Expression of a Delta homologue in
prospective neurons in the chick. Nature, 375, 787-790.Hermanson,E., Joseph,B., Castro,D., Lindqvist,E., Aarnisalo,P., Wallen,A., Benoit,G., Hengerer,B., Olson,L. and Perlmann,T. (2003) Nurr1 regulates dopamine synthesis and storage in MN9D dopamine cells. Exp.Cell Res., 288, 324-334.Hirata,H., Tomita,K., Bessho,Y. and Kageyama,R. (2001) Hes1 and Hes3 regulate maintenance of the isthmic organizer and development of the mid/hindbrain. EMBO J., 20, 4454-4466.Hirate,Y. and Okamoto,H. (2006) Canopy1, a novel regulator of FGF signaling around the midbrain-hindbrain boundary in zebrafish. Curr.Biol., 16, 421-427.Hirsch,E.C., Faucheux,B., Damier,P., Mouatt-Prigent,A. and Agid,Y. (1997) Neuronal vulnerability in Parkinson’s disease. J.Neural Transm.Suppl., 50, 79-88.Hirsch,M.R., Tiveron,M.C., Guillemot,F., Brunet,J.F. and Goridis,C. (1998) Control of noradrenergic differentiation and Phox2a expression by MASH1 in the central and peripheral nervous system. Development, 125, 599-608.Holder,N. and Klein,R. (1999) Eph receptors and ephrins: effectors of morphogenesis. Development, 126, 2033-2044.Houart,C., Caneparo,L., Heisenberg,C., Barth,K., Take-Uchi,M. and Wilson,S. (2002) Establishment of the telencephalon during gastrulation by local antagonism of Wnt signaling. Neuron, 35, 255-265.Huard,J.M., Forster,C.C., Carter,M.L., Sicinski,P. and Ross,M.E. (1999) Cerebellar histogenesis is disturbed in mice lacking cyclin D2. Development, 126, 1927-1935.Hynes ,M. and Rosenthal ,A. (1999) Specifi cation of dopaminergic and serotonergic neurons in the vertebrate CNS. Curr.Opin.Neurobiol., 9, 26-36.Inglis-Broadgate,S.L., Thomson,R.E., Pellicano,F., Tartaglia,M.A., Pontikis,C.C., Cooper,J.D. and Iwata,T. (2005) FGFR3
References

68
regulates brain size by controlling progenitor cell proliferation and apoptosis during embryonic development. Dev.Biol., 279, 73-85.Irving,C. and Mason,I. (2000) Signalling by FGF8 from the isthmus patterns anterior hindbrain and establishes the anterior limit of Hox gene expression. Development, 127, 177-186.Isaacs,H.V., Pownall,M.E. and Slack,J.M. (1998) Regulation of Hox gene expression and posterior development by the Xenopus caudal homologue Xcad3. EMBO J., 17, 3413-3427.Ishibashi,M. and McMahon,A.P. (2002) A sonic hedgehog-dependent signaling relay regulates growth of diencephalic and mesencephalic primordia in the early mouse embryo. Development, 129, 4807-4819.Itasaki,N. and Nakamura,H. (1996) A role for gradient en expression in positional specifi cation on the optic tectum. Neuron, 16, 55-62.Jacobson and Rao, 2005. Rao, Mahendra S.; Jacobson, Marcus (Eds.), Developmental Neurobiology, Springer, New York.Jaszai,J., Reifers,F., Picker,A., Langenberg,T. and Brand,M. (2003) Isthmus-to-midbrain transformation in the absence of midbrain-hindbrain organizer activity. Development, 130, 6611-6623.Jho,E.H., Zhang,T., Domon,C., Joo,C.K., Freund,J.N. and Costantini,F. (2002) Wnt/beta-catenin/Tcf signaling induces the transcription of Axin2, a negative regulator of the signaling pathway. Mol.Cell.Biol., 22, 1172-1183.Jungbluth,S., Larsen,C., Wizenmann,A. and Lumsden,A. (2001) Cell mixing between the embryonic midbrain and hindbrain. Curr.Biol., 11, 204-207.Kabos,P., Kabosova,A. and Neuman,T. (2002) Blocking HES1 expression initiates GABAergic differentiation and induces the expression of p21(CIP1/WAF1) in human neural stem cells. J.Biol.Chem., 277, 8763-8766.Kakizuka,A., Sebastian,B., Borgmeyer,U., Hermans-Borgmeyer,I., Bolado,J., Hunter,T.,
Hoekstra,M.F. and Evans,R.M. (1992) A mouse cdc25 homolog is differentially and developmentally expressed. Genes Dev., 6, 578-590.Karaulanov,E.E., Bottcher,R.T. and Niehrs,C. (2006) A role for fibronectin-leucine-rich transmembrane cell-surface proteins in homotypic cell adhesion. EMBO Rep., 7, 283-290.Katahira,T., Sato,T., Sugiyama,S., Okafuji,T., Araki,I., Funahashi,J. and Nakamura,H. (2000) Interaction between Otx2 and Gbx2 defi nes the organizing center for the optic tectum. Mech.Dev., 91, 43-52.Kawakami,Y., Rodriguez-Leon,J., Koth,C.M., Buscher,D., Itoh,T., Raya,A., Ng,J.K., Esteban,C.R., Takahashi,S., Henrique,D., Schwarz,M.F., Asahara,H. and Izpisua Belmonte,J.C. (2003) MKP3 mediates the cellular response to FGF8 signalling in the vertebrate limb. Nat.Cell Biol., 5, 513-519.Kele,J., Simplicio,N., Ferri,A.L., Mira,H., Guillemot,F., Arenas,E. and Ang,S.L. (2006) Neurogenin 2 is required for the development of ventral midbrain dopaminergic neurons. Development, 133, 495-505.Khokha,M.K., Yeh,J., Grammer,T.C. and Harland,R.M. (2005) Depletion of three BMP antagonists from Spemann’s organizer leads to a catastrophic loss of dorsal structures. Dev.Cell., 8, 401-411.Kiecker,C. and Lumsden,A. (2005) Compartments and their boundaries in vertebrate brain development. Nat.Rev.Neurosci., 6, 553-564.Kimmel,R.A., Turnbull,D.H., Blanquet,V., Wurst,W., Loomis,C.A. and Joyner,A.L. (2000) Two lineage boundaries coordinate vertebrate apical ectodermal ridge formation. Genes Dev., 14, 1377-1389.Kiyokawa,H., Kineman,R.D., Manova-Todorova,K.O., Soares,V.C., Hoffman,E.S., Ono,M., Khanam,D., Hayday,A.C., Frohman,L.A. and Koff,A. (1996) Enhanced growth of mice lacking the cyclin-dependent kinase inhibitor function of p27(Kip1). Cell, 85, 721-732.
References

69
Klingensmith,J., Ang,S.L., Bachiller,D. and Rossant,J. (1999) Neural induction and patterning in the mouse in the absence of the node and its derivatives. Dev.Biol., 216, 535-549.Kovalenko,D., Yang,X., Nadeau,R.J. , Harkins,L.K. and Friesel,R. (2003) Sef inhibits fi broblast growth factor signaling by inhibiting FGFR1 tyrosine phosphorylation and subsequent ERK activation. J.Biol.Chem., 278, 14087-14091.Kowalczyk,A., Filipkowski,R.K., Rylski,M., Wilczynski,G.M., Konopacki,F.A., Jaworski,J., Ciemerych,M.A., Sicinski,P. and Kaczmarek,L. (2004) The critical role of cyclin D2 in adult neurogenesis. J.Cell Biol., 167, 209-213.Kozar,K., Ciemerych,M.A., Rebel,V.I., Shigematsu,H., Zagozdzon,A., Sicinska,E., Geng,Y., Yu,Q., Bhattacharya,S., Bronson,R.T., Akashi,K. and Sicinski,P. (2004) Mouse development and cell proliferation in the absence of D-cyclins. Cell, 118, 477-491.Kudoh,T., Wilson,S.W. and Dawid,I.B. (2002) Distinct roles for Fgf, Wnt and retinoic acid in posteriorizing the neural ectoderm. Development, 129, 4335-4346.Kukoski,R., Blonigen,B., Macri,E., Renshaw,A.A., Hoffman,M., Loda,M. and Datta,M.W. (2003) p27 and cyclin E/D2 associations in testicular germ cell tumors: implications for tumorigenesis. Appl.Immunohistochem.Mol.Morphol., 11, 138-143.Lacy,S.E., Bonnemann,C.G., Buzney,E.A. and Kunkel,L.M. (1999) Identification of FLRT1, FLRT2, and FLRT3: a novel family of transmembrane leucine-rich repeat proteins. Genomics, 62, 417-426.Lai,L. and Tan,T.M. (2002) Role of glutathione in the multidrug resistance protein 4 (MRP4/ABCC4)-mediated efflux of cAMP and resistance to purine analogues. Biochem.J., 361, 497-503.Laing,M.A., Coonrod,S., Hinton,B.T., Downie,J.W., Tozer,R., Rudnicki,M.A. and Hassell,J.A. (2000) Male sexual dysfunction in mice bearing targeted mutant alleles of the PEA3 ets gene. Mol.Cell.Biol., 20, 9337-9345.
Langenberg,T. and Brand,M. (2005) Lineage restriction maintains a stable organizer cell population at the zebrafi sh midbrain-hindbrain boundary. Development, 132, 3209-3216.Lee,K.J. and Jessell,T.M. (1999) The specification of dorsal cell fates in the vertebrate central nervous system. Annu.Rev.Neurosci., 22, 261-294.Lekven,A.C., Buckles,G.R., Kostakis,N. and Moon,R.T. (2003) Wnt1 and wnt10b function redundantly at the zebrafish midbrain-hindbrain boundary. Dev.Biol., 254, 172-187.Leyns,L., Bouwmeester,T., Kim,S.H., Piccolo,S. and De Robertis,E.M. (1997) Frzb-1 is a secreted antagonist of Wnt signaling expressed in the Spemann organizer. Cell, 88, 747-756.Li,J.Y. and Joyner,A.L. (2001) Otx2 and Gbx2 are required for refi nement and not induction of mid-hindbrain gene expression. Development, 128, 4979-4991.Li,J.Y., Lao,Z. and Joyner,A.L. (2002) Changing requirements for Gbx2 in development of the cerebellum and maintenance of the mid/hindbrain organizer. Neuron, 36, 31-43.Lillevali,K., Matilainen,T., Karis,A. and Salminen,M. (2004) Partially overlapping expression of Gata2 and Gata3 during inner ear development. Dev.Dyn., 231, 775-781.Lin,J.C., Cai,L. and Cepko,C.L. (2001) The external granule layer of the developing chick cerebellum generates granule cells and cells of the isthmus and rostral hindbrain. J.Neurosci., 21, 159-168.Lin,W., Furthauer,M., Thisse,B., Thisse,C., Jing,N. and Ang,S.L. (2002) Cloning of the mouse Sef gene and comparative analysis of its expression with Fgf8 and Spry2 during embryogenesis. Mech.Dev., 113, 163-168.Liu,A. and Joyner,A.L. (2001a) Early anterior/posterior patterning of the midbrain and cerebellum. Annu.Rev.Neurosci., 24, 869-896.Liu,A. and Joyner,A.L. (2001b) EN and GBX2 play essential roles downstream of FGF8 in patterning the mouse mid/hindbrain region. Development, 128, 181-191.
References

70
Liu,D., Matzuk,M.M., Sung,W.K., Guo,Q., Wang,P. and Wolgemuth,D.J. (1998) Cyclin A1 is required for meiosis in the male mouse. Nat.Genet., 20, 377-380.Liu,G., Loraine,A.E., Shigeta,R., Cline,M., Cheng,J., Valmeekam,V., Sun,S., Kulp,D. and Siani-Rose,M.A. (2003a) NetAffx: Affymetrix probesets and annotations. Nucleic Acids Res., 31, 82-86.Liu,Y., Jiang,H., Crawford,H.C. and Hogan,B.L. (2003b) Role for ETS domain transcription factors Pea3/Erm in mouse lung development. Dev.Biol., 261, 10-24.Lobe,C.G., Koop,K.E., Kreppner,W., Lomeli,H., Gertsenstein,M. and Nagy,A. (1999) Z/AP, a double reporter for cre-mediated recombination. Dev.Biol., 208, 281-292.Logan,C., Wizenmann,A., Drescher,U., Monschau,B., Bonhoeffer,F. and Lumsden,A. (1996) Rostral optic tectum acquires caudal characteristics following ectopic engrailed expression. Curr.Biol., 6, 1006-1014.Lumsden,A. and Keynes,R. (1989) Segmental patterns of neuronal development in the chick hindbrain. Nature, 337, 424-428.Lumsden,A. and Krumlauf,R. (1996) Patterning the vertebrate neuraxis. Science, 274, 1109-1115.Maden,M. (2006) Retinoids and spinal cord development. J.Neurobiol., 66, 726-738.Mailleux,A.A., Tefft,D., Ndiaye,D., Itoh,N., Thiery,J.P., Warburton,D. and Bellusci,S. (2001) Evidence that SPROUTY2 functions as an inhibitor of mouse embryonic lung growth and morphogenesis. Mech.Dev., 102, 81-94.Maretto,S., Cordenonsi,M., Dupont,S., Braghetta,P., Broccoli,V., Hassan,A.B., Volpin,D., Bressan,G.M. and Piccolo,S. (2003) Mapping Wnt/beta-catenin signaling during mouse development and in colorectal tumors. Proc.Natl.Acad.Sci.U.S.A., 100, 3299-3304.Martinez,S., Wassef,M. and Alvarado-Mallart ,R.M. (1991) Induction of a mesencephalic phenotype in the 2-day-old chick prosencephalon is preceded by the early
expression of the homeobox gene en. Neuron, 6, 971-981.Martinez-Barbera,J.P., Signore,M., Boyl,P.P., Puelles,E., Acampora,D., Gogoi,R., Schubert,F., Lumsden,A. and Simeone,A. (2001) Regional i sa t ion of an ter ior neuroectoderm and its competence in responding to forebrain and midbrain inducing activities depend on mutual antagonism between OTX2 and GBX2. Development, 128, 4789-4800.Matzuk,M.M., Lu,N., Vogel,H., Sellheyer,K., Roop,D.R. and Bradley,A. (1995) Multiple defects and perinatal death in mice defi cient in follistatin. Nature, 374, 360-363.McGrew,L.L., Takemaru,K., Bates,R. and Moon,R.T. (1999) Direct regulation of the Xenopus engrailed-2 promoter by the Wnt signaling pathway, and a molecular screen for Wnt-responsive genes, confi rm a role for Wnt signaling during neural patterning in Xenopus. Mech.Dev., 87, 21-32.McMahon,A.P. and Bradley,A. (1990) The Wnt-1 (int-1) proto-oncogene is required for development of a large region of the mouse brain. Cell, 62, 1073-1085.McMahon,A.P., Joyner,A.L., Bradley,A. and McMahon,J.A. (1992) The midbrain-hindbrain phenotype of Wnt-1-/Wnt-1- mice results from stepwise deletion of engrailed-expressing cells by 9.5 days postcoitum. Cell, 69, 581-595.McMahon,J.A., Takada,S., Zimmerman,L.B., Fan,C.M., Harland,R.M. and McMahon,A.P. (1998) Noggin-mediated antagonism of BMP signaling is required for growth and patterning of the neural tube and somite. Genes Dev., 12, 1438-1452.Mellitzer,G., Xu,Q. and Wilkinson,D.G. (1999) Eph receptors and ephrins restrict cell intermingling and communication. Nature, 400, 77-81.Millen,K.J., Wurst,W., Herrup,K. and Joyner,A.L. (1994) Abnormal embryonic cerebellar development and patterning of postnatal foliation in two mouse Engrailed-2 mutants. Development, 120, 695-706.
References

71
Millet,S., Campbell,K., Epstein,D.J., Losos,K., Harris,E. and Joyner,A.L. (1999) A role for Gbx2 in repression of Otx2 and positioning the mid/hindbrain organizer. Nature, 401, 161-164.Minowada,G., Jarvis ,L.A., Chi,C.L. , Neubuser,A., Sun,X., Hacohen,N., Krasnow,M.A. and Martin,G.R. (1999) Vertebrate Sprouty genes are induced by FGF signaling and can cause chondrodysplasia when overexpressed. Development, 126, 4465-4475.Mohammadi,M., Dikic,I., Sorokin,A., Burgess,W.H., Jaye,M. and Schlessinger,J. (1996) Ident i f ica t ion of s ix novel autophosphorylation sites on fi broblast growth factor receptor 1 and elucidation of their importance in receptor activation and signal transduction. Mol.Cell.Biol., 16, 977-989.Mohammadi,M., Honegger,A.M., Rotin,D., Fischer,R., Bellot,F., Li,W., Dionne,C.A., Jaye,M., Rubinstein,M. and Schlessinger,J. (1991) A tyrosine-phosphorylated carboxy-terminal peptide of the fi broblast growth factor receptor (Flg) is a binding site for the SH2 domain of phospholipase C-gamma 1. Mol.Cell.Biol., 11, 5068-5078.Mori,S., Sugawara, S., Kikuchi,T., Tanji,M., Narumi,O., Stoykova,A., Nishikawa,S.I. and Yokota,Y. (1999) The leukemic oncogene tal-2 is expressed in the developing mouse brain. Brain Res.Mol.Brain.Res., 642, 199-210.Morin,X., Cremer,H., Hirsch,M.R., Kapur,R.P., Goridis,C. and Brunet,J.F. (1997) Defects in sensory and autonomic ganglia and absence of locus coeruleus in mice deficient for the homeobox gene Phox2a. Neuron, 18, 411-423.Motoyama,J., Kitajima,K., Kojima,M., K o n d o , S . a n d Ta k e u c h i , T. ( 1 9 9 7 ) Organogenesis of the liver, thymus and spleen is affected in jumonji mutant mice. Mech.Dev., 66, 27-37.Murphy,M., Stinnakre,M.G., Senamaud-Beaufort,C., Winston,N.J., Sweeney,C., Kubelka,M., Carrington,M., Brechot,C. and Sobczak-Thepot,J. (1997) Delayed early embryonic lethality following disruption of the murine cyclin A2 gene. Nat.Genet., 15, 83-86.
Mutoh,H., Naya,F.J., Tsai,M.J. and Leiter,A.B. (1998) The basic helix-loop-helix protein BETA2 interacts with p300 to coordinate differentiation of secretin-expressing enteroendocrine cells. Genes Dev., 12, 820-830.Nelson,W.J. and Nusse,R. (2004) Convergence of Wnt, beta-catenin, and cadherin pathways. Science, 303, 1483-1487.N g u y e n , L . , B e s s o n , A . , H e n g , J . I . , Schuurmans,C., Teboul,L., Parras,C., Philpott,A., Roberts,J.M. and Guillemot,F. (2006) p27kip1 independently promotes neuronal differentiation and migration in the cerebral cortex. Genes Dev., 20, 1511-1524.Ning,Y., Hoang,B., Schuller,A.G., Cominski,T.P., Hsu,M.S., Wood,T.L. and Pintar,J.E. (2007) Delayed mammary gland involution in mice with mutation of the insulin-like growth factor binding protein 5 gene. Endocrinology, .Ohkubo,Y., Chiang,C. and Rubenstein,J.L. (2002) Coordinate regulation and synergistic actions of BMP4, SHH and FGF8 in the rostral prosencephalon regulate morphogenesis of the telencephalic and optic vesicles. Neuroscience, 111, 1-17.Olander,S., Nordstrom,U., Patthey,C. and Edlund,T. (2006) Convergent Wnt and FGF signaling at the gastrula stage induce the formation of the isthmic organizer. Mech.Dev., 123, 166-176.Olsen ,S .K . , L i , J .Y. , Bromle igh ,C . , Eliseenkova,A.V., Ibrahimi,O.A., Lao,Z., Zhang,F., Linhardt,R.J., Joyner,A.L. and Mohammadi,M. (2006) Structural basis by which alternative splicing modulates the organizer activity of FGF8 in the brain. Genes Dev., 20, 185-198.Ong,S.H., Hadari,Y.R., Gotoh,N., Guy,G.R., Schlessinger,J. and Lax,I. (2001) Stimulation of phosphatidylinositol 3-kinase by fi broblast growth factor receptors is mediated by coordinated recruitment of multiple docking proteins. Proc.Natl.Acad.Sci.U.S.A., 98, 6074-6079.Ornitz,D.M. (2000) FGFs, heparan sulfate and FGFRs: complex interactions essential for development. Bioessays, 22, 108-112.
References

72
Ornitz,D.M. and Itoh,N. (2001) Fibroblast g rowth fac to rs . Genome Bio l . , 2 , REVIEWS3005.Panhuysen,M., Vogt Weisenhorn,D.M., Blanquet,V., Brodski,C., Heinzmann,U., Beisker,W. and Wurst,W. (2004) Effects of Wnt1 signaling on proliferation in the developing mid-/hindbrain region. Mol.Cell.Neurosci., 26, 101-111.Parker,S.B., Eichele,G., Zhang,P., Rawls,A., Sands,A.T., Bradley,A., Olson,E.N., Harper,J.W. and Elledge,S.J. (1995) p53-independent expression of p21Cip1 in muscle and other terminally differentiating cells. Science, 267, 1024-1027.Partanen,J., Schwartz,L. and Rossant,J. (1998) Opposite phenotypes of hypomorphic and Y766 phosphorylation site mutations reveal a function for Fgfr1 in anteroposterior patterning of mouse embryos. Genes Dev., 12, 2332-2344.Pattyn,A., Goridis,C. and Brunet,J.F. (2000) Specification of the central noradrenergic phenotype by the homeobox gene Phox2b. Mol.Cell.Neurosci., 15, 235-243.Pattyn,A., Simplicio,N., van Doorninck,J.H., Goridis,C., Guillemot,F. and Brunet,J.F. (2004) Ascl1/Mash1 is required for the development of central serotonergic neurons. Nat.Neurosci., 7, 589-595.Peters,K.G., Marie,J., Wilson,E., Ives,H.E., Escobedo,J., Del Rosario,M., Mirda,D. and Williams,L.T. (1992) Point mutation of an FGF receptor abolishes phosphatidylinositol turnover and Ca2+ fl ux but not mitogenesis. Nature, 358, 678-681.Pinson,K.I., Brennan,J., Monkley,S., Avery,B.J. and Skarnes,W.C. (2000) An LDL-receptor-related protein mediates Wnt signalling in mice. Nature, 407, 535-538.Placzek,M. (1995) The role of the notochord and fl oor plate in inductive interactions. Curr.Opin.Genet.Dev., 5, 499-506.Prabhu,S., Ignatova,A., Park,S.T. and Sun,X.H. (1997) Regulation of the expression of cyclin-dependent kinase inhibitor p21 by E2A and Id proteins. Mol.Cell.Biol., 17, 5888-5896.
Prakash,N. , Brodski ,C. , Naserke,T. , Puelles,E., Gogoi,R., Hall,A., Panhuysen,M., Echevarria,D., Sussel,L., Weisenhorn,D.M., Martinez,S., Arenas,E., Simeone,A. and Wurst,W. (2006) A Wnt1-regulated genetic network controls the identity and fate of midbrain-dopaminergic progenitors in vivo. Development, 133, 89-98.Prakash,N. and Wurst,W. (2006) Development of dopaminergic neurons in the mammalian brain. Cell Mol.Life Sci., 63, 187-206.Preger,E., Ziv,I., Shabtay,A., Sher,I., Tsang,M., Dawid,I.B., Altuvia,Y. and Ron,D. (2004) Alternative splicing generates an isoform of the human Sef gene with altered subcellular localization and specifi city. Proc.Natl.Acad.Sci.U.S.A., 101, 1229-1234.Puelles,E., Acampora,D., Lacroix,E., Signore,M., Annino,A., Tuorto,F., Filosa,S., Corte,G., Wurst,W., Ang,S.L. and Simeone,A. (2003) Otx dose-dependent integrated control of antero-posterior and dorso-ventral patterning of midbrain. Nat.Neurosci., 6, 453-460.Puelles,E., Annino,A., Tuorto,F., Usiello,A., Acampora,D., Czerny,T., Brodski,C., Ang,S.L., Wurst,W. and Simeone,A. (2004) Otx2 regulates the extent, identity and fate of neuronal progenitor domains in the ventral midbrain. Development, 131, 2037-2048.Raible,F. and Brand,M. (2001) Tight transcriptional control of the ETS domain factors Erm and Pea3 by Fgf signaling during early zebrafi sh development. Mech.Dev., 107, 105-117.Raible,F. and Brand,M. (2004) Divide et Impera – The Midbrain-Hindbrain Boundary and Its Organizer. Trends in Neurosciences, 27, 727-734.Rhinn,M., Lun,K., Luz,M., Werner,M. and Brand,M. (2005) Positioning of the midbrain-hindbrain boundary organizer through global posteriorization of the neuroectoderm mediated by Wnt8 signaling. Development, 132, 1261-1272.Riley,B.B., Chiang,M.Y., Storch,E.M., Heck,R., Buckles,G.R. and Lekven,A.C. (2004) Rhombomere boundaries are Wnt signaling centers that regulate metameric
References

73
patterning in the zebrafish hindbrain. Dev.Dyn., 231, 278-291.Rizzoti,K., Brunelli,S., Carmignac,D., Thomas,P.Q., Robinson,I.C. and Lovell-Badge,R. (2004) SOX3 is required during the formation of the hypothalamo-pituitary axis. Nat.Genet., 36, 247-255.Roberts,J.M. (1999) Evolving ideas about cyclins. Cell, 98, 129-132.Roberts,J.M. and Sherr,C.J. (2003) Bared essentials of CDK2 and cyclin E. Nat.Genet., 35, 9-10.Robinson,M., Parsons Perez,M.C., Tebar,L., Palmer,J., Patel,A., Marks,D., Sheasby,A., De Felipe,C., Coffi n,R., Livesey,F.J. and Hunt,S.P. (2004) FLRT3 is expressed in sensory neurons after peripheral nerve injury and regulates neurite outgrowth. Mol.Cell.Neurosci., 27, 202-214.Roehl,H. and Nusslein-Volhard,C. (2001) Zebrafi sh pea3 and erm are general targets of FGF8 signaling. Curr.Biol., 11, 503-507.Ruiz i Altaba,A. and Jessell,T.M. (1993) Midline cells and the organization of the vertebrate neuraxis. Curr.Opin.Genet.Dev., 3, 633-640.Ryan,P.J., Paterno,G.D. and Gillespie,L.L. (1998) Identification of phosphorylated proteins associated with the fi broblast growth factor receptor type I during early Xenopus development . Biochem.Biophys.Res .Commun., 244, 763-767.Saucedo-Cardenas,O., Quintana-Hau,J.D., Le,W.D., Smidt,M.P., Cox,J.J., De Mayo,F., Burbach,J.P. and Conneely,O.M. (1998) Nurr1 is essential for the induction of the dopaminergic phenotype and the survival of ventral mesencephalic late dopaminergic precursor neurons. Proc.Natl.Acad.Sci.U.S.A., 95, 4013-4018.Schluter,C., Duchrow,M., Wohlenberg,C., Becker,M.H., Key,G., Flad,H.D. and Gerdes,J. (1993) The cell proliferation-associated antigen of antibody Ki-67: a very large, ubiquitous nuclear protein with numerous repeated elements, representing a new kind of cell cycle-maintaining proteins. J.Cell Biol., 123, 513-522.
Scholpp,S. and Brand,M. (2004) Endocytosis controls spreading and effective signaling range of Fgf8 protein. Curr.Biol., 14, 1834-1841.Sesack,S.R. and Carr,D.B. (2002) Selective prefrontal cortex inputs to dopamine cells: implications for schizophrenia. Physiol.Behav., 77, 513-517.Shamim,H., Mahmood,R. , Logan,C. , Doherty,P., Lumsden,A. and Mason,I. (1999) Sequential roles for Fgf4, En1 and Fgf8 in specification and regionalisation of the midbrain. Development, 126, 945-959.Sharrocks,A.D. (2001) The ETS-domain transcription factor family. Nat.Rev.Mol.Cell Biol., 2, 827-837.Sherr,C.J. (1994) G1 phase progression: cycling on cue. Cell, 79, 551-555.Sherr,C.J. and Roberts,J.M. (1999) CDK inhibitors: positive and negative regulators of G1-phase progression. Genes Dev., 13, 1501-1512.Shih,J. and Fraser,S.E. (1996) Characterizing the zebrafi sh organizer: microsurgical analysis at the early-shield stage. Development, 122, 1313-1322.Shimizu,T., Bae,Y.K. and Hibi,M. (2006) Cdx-Hox code controls competence for responding to Fgfs and retinoic acid in zebrafi sh neural tissue. Development, 133, 4709-4719.Shtutman,M., Zhurinsky,J., Simcha,I., Albanese,C., D’Amico,M., Pestell,R. and Ben-Ze’ev,A. (1999) The cyclin D1 gene is a target of the beta-catenin/LEF-1 pathway. Proc.Natl.Acad.Sci.U.S.A., 96, 5522-5527.Sicinska,E., Aifantis,I., Le Cam,L., Swat,W., Borowski,C., Yu,Q., Ferrando,A.A., Levin,S.D., Geng,Y., von Boehmer,H. and Sicinski,P. (2003) Requirement for cyclin D3 in lymphocyte development and T cell leukemias. Cancer.Cell., 4, 451-461.Sicinski,P., Donaher,J.L., Parker,S.B., Li,T., Fazeli,A., Gardner,H., Haslam,S.Z., Bronson,R.T., Elledge,S.J. and Weinberg,R.A. (1995) Cyclin D1 provides a link between development and oncogenesis in the retina and breast. Cell, 82, 621-630.
References
74
Simon,H.H., Bhatt,L., Gherbassi,D., Sgado,P. and Alberi,L. (2003) Midbrain dopaminergic neurons: determination of their developmental fate by transcription factors. Ann.N.Y.Acad.Sci., 991, 36-47.Simon,H.H., Saueressig,H., Wurst,W., Goulding,M.D. and O’Leary,D.D. (2001) Fate of midbrain dopaminergic neurons controlled by the engrailed genes. J.Neurosci., 21, 3126-3134.Simon,H.H., Scholz,C. and O’Leary,D.D. (2005) Engrailed genes control developmental fate of serotonergic and noradrenergic neurons in mid- and hindbrain in a gene dose-dependent manner. Mol.Cell.Neurosci., 28, 96-105.Simon,H.H., Thuret,S. and Alberi,L. (2004) Midbrain dopaminergic neurons: control of their cell fate by the engrailed transcription factors. Cell Tissue Res., 318, 53-61.Smidt,M.P., Smits,S.M., Bouwmeester,H., Hamers,F.P., van der Linden,A.J., Hellemons,A.J., Graw,J. and Burbach,J.P. (2004) Early developmental failure of substantia nigra dopamine neurons in mice lacking the homeodomain gene Pitx3. Development, 131, 1145-1155.Smits ,S .M. , Ponnio,T. , Conneely,O.M., Burbach,J.P. and Smidt,M.P. (2003) Involvement of Nurr1 in specifying the neurotransmitter identity of ventral midbrain dopaminergic neurons. Eur.J.Neurosci., 18, 1731-1738.Soriano,P. (1999) Generalized lacZ expression with the ROSA26 Cre reporter strain. Nat.Genet., 21, 70-71.Stern,C.D. (2001) Initial patterning of the central nervous system: how many organizers? Nat.Rev.Neurosci., 2, 92-98.Storey,K.G., Goriely,A., Sargent,C.M., Brown,J.M., Burns,H.D., Abud,H.M. and Heath,J.K. (1998) Early posterior neural tissue is induced by FGF in the chick embryo. Development, 125, 473-484.Streit,A., Berliner,A.J., Papanayotou,C., Sirulnik,A. and Stern,C.D. (2000) Initiation of neural induction by FGF signalling before gastrulation. Nature, 406, 74-78.
Suda,Y., Matsuo,I. and Aizawa,S. (1997) Cooperation between Otx1 and Otx2 genes in developmental patterning of rostral brain. Mech.Dev., 69, 125-141.Takahashi,M., Fujita,M., Furukawa,Y., Hamamoto,R., Shimokawa,T., Miwa,N., Ogawa,M. and Nakamura,Y. (2002) Isolation of a novel human gene, APCDD1, as a direct target of the beta-Catenin/T-cell factor 4 complex with probable involvement in colorectal carcinogenesis. Cancer Res., 62, 5651-5656.Takemoto,T., Uchikawa,M., Kamachi,Y. and Kondoh,H. (2006) Convergence of Wnt and FGF signals in the genesis of posterior neural plate through activation of the Sox2 enhancer N-1. Development, 133, 297-306.Takeuchi,T., Kojima,M., Nakajima,K. and Kondo,S. (1999) jumonji gene is essential for the neurulation and cardiac development of mouse embryos with a C3H/He background. Mech.Dev., 86, 29-38.Takeuchi,T., Yamazaki,Y., Katoh-Fukui,Y., Tsuchiya,R., Kondo,S., Motoyama,J. and Higashinakagawa,T. (1995) Gene trap capture of a novel mouse gene, jumonji, required for neural tube formation. Genes Dev., 9, 1211-1222.Temple,S. and Raff,M.C. (1986) Clonal analysis of oligodendrocyte development in culture: evidence for a developmental clock that counts cell divisions. Cell, 44, 773-779.Thomas,K.R. and Capecchi,M.R. (1990) Targeted disruption of the murine int-1 proto-oncogene resulting in severe abnormalities in midbrain and cerebellar development. Nature, 346, 847-850.Thomas,K.R., Musci,T.S., Neumann,P.E. and Capecchi,M.R. (1991) Swaying is a mutant allele of the proto-oncogene Wnt-1. Cell, 67, 969-976.Trokovic,R., Trokovic,N., Hernesniemi,S., Pirvola,U., Vogt Weisenhorn,D.M., Rossant,J., McMahon,A.P., Wurst,W. and Partanen,J. (2003) FGFR1 is independently required in both developing mid- and hindbrain for sustained response to isthmic signals. EMBO J., 22, 1811-1823.
References

75
Tsang,M. and Dawid,I.B. (2004) Promotion and attenuation of FGF signaling through the Ras-MAPK pathway. Sci.STKE, 2004, pe17.Tsang,M., Friesel,R., Kudoh,T. and Dawid,I.B. (2002) Identifi cation of Sef, a novel modulator of FGF signalling. Nat.Cell Biol., 4, 165-169.Tsang,M., Maegawa,S., Kiang,A., Habas,R., Weinberg,E. and Dawid,I.B. (2004) A role for MKP3 in axial patterning of the zebrafi sh embryo. Development, 131, 2769-2779.Urayama,A., Yamada,S., Kimura,R., Zhang,J. and Watanabe,Y. (2002) Neuroprotective effect and brain receptor binding of taltirelin, a novel thyrotropin-releasing hormone (TRH) analogue, in transient forebrain ischemia of C57BL/6J mice. Life Sci., 72, 601-607.Vieira,C., Garda,A.L., Shimamura,K. and Martinez,S. (2005) Thalamic development induced by Shh in the chick embryo. Dev.Biol., 284, 351-363.Wal len ,A. and Per lmann,T. (2003) Transcriptional control of dopamine neuron development. Ann.N.Y.Acad.Sci., 991, 48-60.Wallen,A., Zetterstrom,R.H., Solomin,L., Arvidsson,M., Olson,L. and Perlmann,T. (1999) Fate of mesencephalic AHD2-expressing dopamine progenitor cells in NURR1 mutant mice. Exp.Cell Res., 253, 737-746.Wang,F., Kan,M., Yan,G., Xu,J. and McKeehan,W.L. (1995) Alternately spliced NH2-terminal immunoglobulin-like Loop I in the ectodomain of the fi broblast growth factor (FGF) receptor 1 lowers affinity for both heparin and FGF-1. J.Biol.Chem., 270, 10231-10235.Wa s s a r m a n , K . M . , L e w a n d o s k i , M . , Campbell,K., Joyner,A.L., Rubenstein,J.L., Martinez,S. and Martin,G.R. (1997) Specification of the anterior hindbrain and establishment of a normal mid/hindbrain organizer is dependent on Gbx2 gene function. Development, 124, 2923-2934.Waters,S.T. and Lewandoski,M. (2006) A threshold requirement for Gbx2 levels in hindbrain development. Development, 133, 1991-2000.
Weidinger,G., Thorpe,C.J., Wuennenberg-Stapleton,K., Ngai,J. and Moon,R.T. (2005) The Sp1-related transcription factors sp5 and sp5-like act downstream of Wnt/beta-catenin signaling in mesoderm and neuroectoderm patterning. Curr.Biol., 15, 489-500.Weinstein,D.C., Ruiz i Altaba,A., Chen,W.S., Hoodless,P., Prezioso,V.R., Jessell,T.M. and Darnell,J.E.,Jr. (1994) The winged-helix transcription factor HNF-3 beta is required for notochord development in the mouse embryo. Cell, 78, 575-588.Wianny,F., Real,F.X., Mummery,C.L., Van Rooijen,M., Lahti,J., Samarut,J. and Savatier,P. (1998) G1-phase regulators, cyclin D1, cyclin D2, and cyclin D3: up-regulation at gastrulation and dynamic expression during neurulation. Dev.Dyn., 212, 49-62.Wilkinson DG, Green J (1990) In situ hybridization and the three-dimensional reconstruction of serial sections. In Copp AJ, Cockroft DL, eds. Postimplantation Mammalian Embryos. New York, Oxford University Press, 155-171.Wilson,S.I., Graziano,E., Harland,R., Jessell,T.M. and Edlund,T. (2000) An early requirement for FGF signalling in the acquisition of neural cell fate in the chick embryo. Curr.Biol., 10, 421-429.Wingate,R.J. and Lumsden,A. (1996) Persistence of rhombomeric organisation in the postsegmental hindbrain. Development, 122, 2143-2152.Winnier,G., Blessing,M., Labosky,P.A. and Hogan,B.L. (1995) Bone morphogenetic protein-4 is required for mesoderm formation and patterning in the mouse. Genes Dev., 9, 2105-2116.Wizenmann,A. and Lumsden,A. (1997) Segregation of rhombomeres by differential chemoaffinity. Mol.Cell.Neurosci., 9, 448-459.Wodarz,A., Stewart,D.B., Nelson,W.J. and Nusse,R. (2006) Wingless signaling modulates cadherin-mediated cell adhesion in Drosophila imaginal disc cells. J.Cell.Sci., 119, 2425-2434.
References

76
Wu,L., de Bruin,A., Saavedra,H.I., Starovic,M., Trimboli,A., Yang,Y., Opavska,J., Wilson,P., Thompson,J.C., Ostrowski,M.C., Rosol,T.J., Woollett,L.A., Weinstein,M., Cross,J.C., Robinson,M.L. and Leone,G. (2003) Extra-embryonic function of Rb is essential for embryonic development and viability. Nature, 421, 942-947.Wurst,W., Auerbach,A.B. and Joyner,A.L. (1994) Multiple developmental defects in Engrailed-1 mutant mice: an early mid-hindbrain deletion and patterning defects in forelimbs and sternum. Development, 120, 2065-2075.Wurst,W. and Bally-Cuif,L. (2001) Neural plate patterning: upstream and downstream of the isthmic organizer. Nat.Rev.Neurosci., 2, 99-108.Xu,J., Liu,Z. and Ornitz,D.M. (2000) Temporal and spatial gradients of Fgf8 and Fgf17 regulate proliferation and differentiation of midline cerebellar structures. Development, 127, 1833-1843.Yamada,M., Saga,Y., Shibusawa,N., Hirato,J., Murakami,M., Iwasaki,T., Hashimoto,K., Satoh,T., Wakabayashi,K., Taketo,M.M. and Mori,M. (1997) Tertiary hypothyroidism and hyperglycemia in mice with targeted disruption of the thyrotropin-releasing hormone gene. Proc.Natl.Acad.Sci.U.S.A., 94, 10862-10867.
Yang,R.B., Ng,C.K., Wasserman,S.M., Komuves,L.G., Gerritsen,M.E. and Topper,J.N. (2003) A novel interleukin-17 receptor-like protein identified in human umbilical vein endothelial cells antagonizes basic fi broblast growth factor-induced signaling. J.Biol.Chem., 278, 33232-33238.Ye,W., Shimamura,K., Rubenstein,J.L., Hynes,M.A. and Rosenthal,A. (1998) FGF and Shh signals control dopaminergic and serotonergic cell fate in the anterior neural plate. Cell, 93, 755-766.Yusoff,P., Lao,D.H., Ong,S.H., Wong,E.S., Lim,J., Lo,T.L., Leong,H.F., Fong,C.W. and Guy,G.R. (2002) Sprouty2 inhibits the Ras/MAP kinase pathway by inhibiting the activation of Raf. J.Biol.Chem., 277, 3195-3201.Zervas,M., Millet,S., Ahn,S. and Joyner,A.L. (2004) Cell behaviors and genetic lineages of the mesencephalon and rhombomere 1. Neuron, 43, 345-357.Zetterstrom,R.H., Solomin,L., Jansson,L., Hoffer,B.J., Olson,L. and Perlmann,T. (1997) Dopamine neuron agenesis in Nurr1-defi cient mice. Science, 276, 248-250.Zhang,X., Ibrahimi,O.A., Olsen,S.K., Umemori,H., Mohammadi,M. and Ornitz,D.M. (2006) Receptor specificity of the fi broblast growth factor family. The complete mammalian FGF family. J.Biol.Chem., 281, 15694-15700.
References