Embed Size (px)
Citation preview

Fiber-Reinforced Ti3SiC2 and Ti2AlC MAX Phase Composites
A Thesis
Submitted to the Faculty
of
Drexel University
by
Charles B. Spencer Jr.
in partial fulfillment of the
requirements for the degree
of
Master of Science in Materials Science and Engineering
June 2010

© Copyright 2010
Charles B. Spencer Jr. All rights reserved.

ii
Dedications
This work is dedicated to the practice of ideals, for having a reason to push ahead and for
perseverance.

iii
Acknowledgments
I would like to thank all those who have made this work possible. First I must
acknowledge Dr. Michel W. Barsoum; advisor, teacher, but more importantly, my
mentor, throughout all of this work. For whom without his guidance, and healthy balance
between patience and expectation, my time at Drexel University may have gone for
naught. I must thank Dr. Miladin Radovic, of Texas A & M University, who helped start
this exploration and who acted as a co-advisor throughout my struggles.
I would like to thank my committee members, Dr. A. Zavaliangos, Dr. U. Wegst, Dr. M.
Taheri, and Dr. A. Kontsos. They may never know how truly appreciative of their
commitment to my committee I am. With short notice, each one of them graciously
offered to serve on my committee.
I want to thank all of my colleagues, past and present, from the MAX phase research
group at Drexel University for their help, guidance and most importantly friendship; Dr.
A. Zhou, Dr. S. Basu, Dr. A. Sakulich, Dr. S. Amini, Dr. T. Scarbozi, Mr. B. Anasori,
Mr. S. Miller, Mr. J. Lloyd, Ms. N. Lane, Mr. M. Shamma, and Mr. A. Moseson. And
special thanks to Mr. I. Albayrak, my „partner in crime‟ when it came to creep testing.
Additionally, I would like to thank Dr. Y. Chung, of Drexel University. His support and
presence is immeasurable.

iv
Without the master skills of both Mr. Tom Livingstone [Pennsylvania College of
Technology] and Mr. Mark Schiber [Hess Labs, Drexel University], I can safely say that
this work would never have been completed. I would like to thank them both for
completing the machining necessary to complete the creep testing in this work.
And lastly, but certainly not least, I want to thank Dr. L. Hultman, Dr. P. Eklund, and Dr.
J. M. Cordoba of Linköping University, Sweden, for their guidance from thousands of
miles away.
This work was funded by the Army Research Office (W911NF-07-1-0628), the Metals
Division of the NSF (SGER 0736218) and the Swedish Foundation for Strategic
Research (SSF).

v
Table of Contents LIST OF TABLES ....................................................................................................................................... vii
LIST OF FIGURES .................................................................................................................................... viii
ABSTRACT ................................................................................................................................................... xii
CHAPTER 1. BACKGROUND AND LITERATURE SURVEY ...............................................1
1.1 Background on Ceramic-Ceramic Composites ................................................................................1
i. Material Selection ..............................................................................................................................2
ii. Processing .............................................................................................................................................3
a. Powder Processing ............................................................................................................................4
b. Liquid Processing ..............................................................................................................................6
c. Vapor Processing ...............................................................................................................................8
iii. Design Considerations .................................................................................................................. 10
iv. Failure Modes ................................................................................................................................... 15
1.2 Properties of MAX Phases and MAX Phase Composites ......................................................... 15
1.2.1 Ti2AlC.................................................................................................................................................. 18
1.2.2 Ti3SiC2 ................................................................................................................................................. 20
1.2.3 MAX Phase Composites .............................................................................................................. 22
1.3 High Temperature Creep Mechanical Testing ............................................................................... 24
CHAPTER 2. REACTION STUDIES ................................................................................................. 26
2.1. Ti2AlC:Al2O3 ............................................................................................................................................... 26
2.1.1 Synthesis ............................................................................................................................................. 26
2.1.2 Characterization............................................................................................................................... 28
2.1.3 Results ................................................................................................................................................. 29
2.1.4 Discussion .......................................................................................................................................... 41
2.1.5 Summary and Conclusions ......................................................................................................... 47

vi
2.2 Ti2AlC:SiC .................................................................................................................................................... 48
2.2.1 Synthesis ............................................................................................................................................. 48
2.2.2 Characterization............................................................................................................................... 50
2.2.3 Results ................................................................................................................................................. 51
2.2.4 Discussion .......................................................................................................................................... 58
2.2.5 Summary and Conclusions ......................................................................................................... 60
2.3 Ti3SiC2:TiC:SiC.......................................................................................................................................... 61
2.3.1 Synthesis ............................................................................................................................................. 61
a. Bulk Ti3SiC2-TiC ............................................................................................................................ 61
b. Ti3SiC2:TiC:SiC Composites ..................................................................................................... 61
2.3.2 Characterization............................................................................................................................... 62
2.3.3 Results and Discussion ................................................................................................................. 63
2.3.4 Summary and Conclusions ......................................................................................................... 65
CHAPTER 3. HIGH TEMPERATURE MECHANICAL RESPONSE RESULTS –
CREEP .............................................................................................................................................................. 67
3.1 Set-Up and Parameters ............................................................................................................................ 67
3.2 Bulk Ti3SiC2:TiC Samples ..................................................................................................................... 70
3.3 Ti3SiC2:TiC:SiC Composites ................................................................................................................ 72
3.3.1 Microstructural Characterization of Fracture Surface ..................................................... 74
3.4 Discussion ..................................................................................................................................................... 76
3.5 Summary and Conclusions .................................................................................................................... 81
CHAPTER 4. SUMMARY AND CONCLUSIONS ................................................................................... 82
4.1 Summary and Conclusions .................................................................................................................... 82
4.2 Future Work ................................................................................................................................................. 83

vii
LIST OF TABLES
Table 1: Effect of processing parameters on the theoretical densities of SiC whisker-
Al2O3 composites pressed at 31 MPa pressure.[4]
.............................................................6
Table 2: Summary of MAX phases known to date. ........................................................ 16
Table 3: Summary of runs made herein. Column 1 lists the fiber diameter, 211; column 2
the matrix/fiber molar ratio. The key to the label listed in column 7 is: 211 (for Ti2AlC
powder) or fiber diameter or DSC, followed by fiber vol. fraction, followed by
consolidation method or DSC and last the processing temperature. The processing time
was 3 or 4 h. .................................................................................................................. 27
Table 4: Summary of Rietveld analysis of as-received powders and 3Ti2AlC + Al2O3
powder mixture after heating twice to 1410 °C or 1550 °C in a DSC at 20 °C/min and
immediately cooling at same rate. The goodness of fit, χ2, is indicated. .......................... 30
Table 5: Summary of runs made with Ti2AlC matrix and SiC fibers. Column 1 lists the
fiber diameter, 211; column 2 the matrix/fiber molar ratio. The key to the label listed in
column 7 is: fiber vol. fraction or blank when no fiber was added, followed by 211 (for
Ti2AlC powder), followed by consolidation method or DSC and last the processing
temperature. The processing time was 3 or 4 h. .............................................................. 48
Table 6: Summary of Rietveld analysis results of as-received 2Ti2AlC + SiC powder
mixture, and those of samples 211-DSC-1410 and 211-DSC-1550. The powder mixture
was heated in the DSC at 20 °C/min to 1410 °C or 1550 °C and immediately cooled at
same rate. ...................................................................................................................... 52
Table 7: Summary of runs made with Ti3SiC2 matrix and SiC fibers. Column 1 lists the
fiber diameter; column 2 the matrix/fiber molar ratio. The key to the label listed in
column 7 is: fiber vol. fraction or blank when no fiber was added, followed by 312 (for
Ti3SiC2 powder), followed by consolidation method, HP for hot pressing, and last the
processing temperature. The processing time was 4 h. ................................................... 62

viii
LIST OF FIGURES Figure 1: Directional metal oxidation method for processing ceramic composites.
[5] ........7
Figure 2
[3]: Mechanism of directed metal oxidation growth
[6]. (a) no growth due to stable
grain boundary; (b) oxide growth mechanism with unstable grain boundary.[3]
................8
Figure 3
[3]: Forced flow thermal gradient method for CVI processing.
[7] ..........................9
Figure 4
[3]: Strength prediction for high stiffness, high strength fiber and a lower stiffness
to failure matrix. ............................................................................................................ 11
Figure 5
[3]: Strength prediction for a high strength fiber and higher stiffness, low strain to
failure matrix. ................................................................................................................ 12
Figure 6: MAX unit cells of; (a) 211, (b) 312 and (c) 413. Vertical arrows labeled c,
denote the unit cell, while a horizontal line marks the center of each unit cell.[29]
........... 17
Figure 7: Typical creep strain versus time creep curve showing three regions; primary,
secondary and tertiary. Creep strain rates are obtained in the secondary region.
Experimentally, not always all three regions are observed.[68]
........................................ 25
Figure 8: XRD spectrum of, a) as-received Ti2AlC powder and, b) sample 211-HP-1500.
Pure Si was added as an internal standard and all peaks were normalized to the Si peak at
28.44° 2Θ. ..................................................................................................................... 31
Figure 9: (a) Backscattered electron image of 211-HP-1500. b) EDS results of regions
numbered in a. Three phases are present; light grey (Ti3AlC2), dark grey (AlxTi) and
black (Al2O3). ................................................................................................................ 32
Figure 10: X-ray diffraction patterns of samples, a) 10-17-HIP-1300, b) 10-9-HIP-1500,
c) 3-9-HIP-1500 and, d) 10-46-HIP-1500. All spectra normalized to 10 wt. % Si. .......... 33
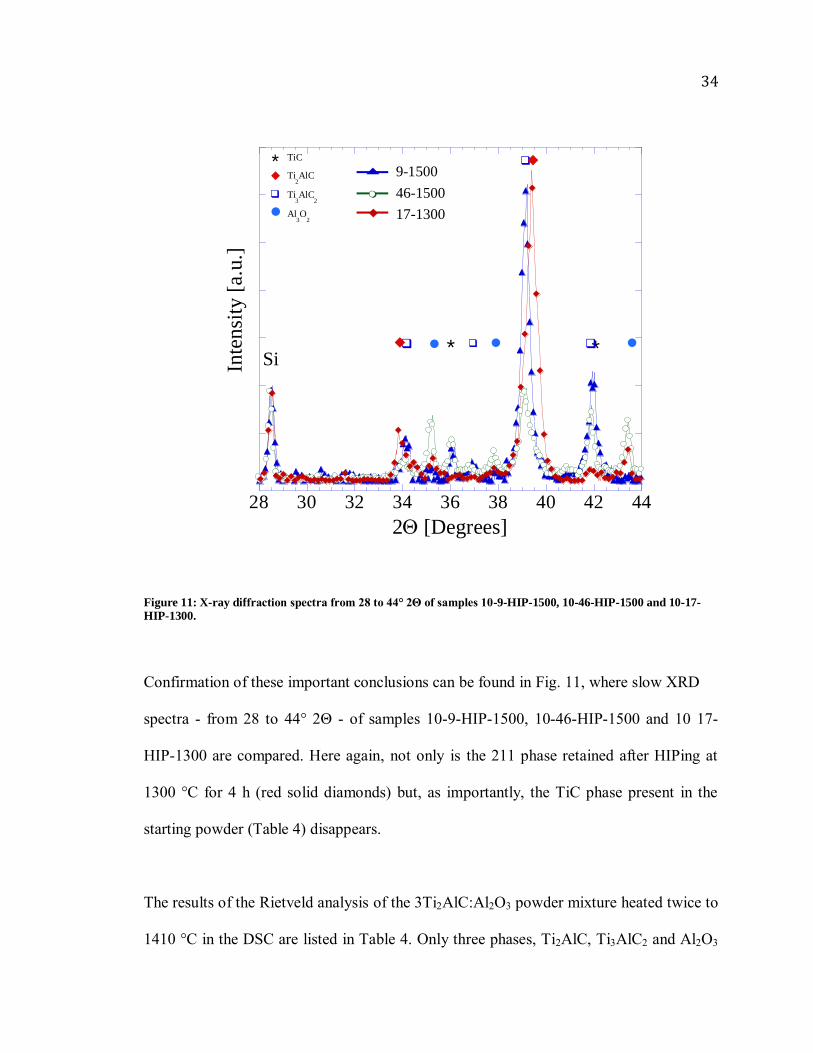
Figure 11: X-ray diffraction spectra from 28 to 44° 2Θ of samples 10-9-HIP-1500, 10-46-
HIP-1500 and 10-17-HIP-1300. ..................................................................................... 34
Figure 12: Polished and etched OM micrographs of sample; a) 3-9-HIP-1500. The
multicolored phase is Ti3AlC2; the white phase is TiCx; the dark regions are either
porosity or Al2O3 fibers; b) 10-17-HIP-1300. The majority, brown phase, is Ti2AlC and
the colored phase is Ti3AlC2. The 3 μm diameter Al2O3 fibers appear black. c) and, d)
10-9-HIP-1500. The majority colored phase is Ti3AlC2; the minority white phase, TiCx.
...................................................................................................................................... 36

ix
Figure 13: a) Backscattered electron, SEM image of sample 3-9-HIP-1500. b) Summary
of EDS results for various locations labeled in a. Based on EDS results four phases are
identified; Ti3AlC2 (pts. 3, 9 and 11), Ti3C2 (pts. 7, 8 and 10), Al2O3 (pts. 1, 2 and 5) and
a Ti-Si phase (pts. 4 and 6). The Si comes from the borosilicate glass used to encapsulate
the samples during HIPing (see below). ......................................................................... 37
Figure 14: Backscattered electron SEM micrographs of sample 3-9-HIP-1500 near the
borosilicate glass interface at, (a) low magnification and, (b) higher magnification. EDS
results of the various numbered locations in the SEM micrograph are listed in table
shown below the micrograph. ........................................................................................ 38
Figure 15: Backscattered electron SEM images showing effect of temperature on Al2O3
fiber morphology, for sample, a) 10-17-HIP-1300 and, b) 10-46-HIP-1500. The fibers in
a appear to have retained their shape; those in b appear to have agglomerated and sintered
together. ........................................................................................................................ 39
Figure 16: a) TEM image of a typical Ti2AlC particle after heat treatment, showing
multiple nanograins. b) EDS of particle shown in a indicating presence of Ti, Al and C.
Top inset is selected area diffraction of same particle showing multiplicity of grains. .... 40
Figure 17: a) DSC of 3Ti2AlC:Al2O3 powder mixture heated to 1410 °C. A small
endothermic peak registers at ~1350°C; on cooling a small exothermic peak is seen at
around the same temperature. Inset shows DTA results of same composition heated to
1550 °C. A broad exothermic peak centered around 1520 °C is observed on cooling; b)
TGA of sample heated to 1550 °C. Early mass loss is followed by mass gain and
ultimately mass loss at T > 1450 °C. The gases evolved during heating are indicated on
the figure. ...................................................................................................................... 41
Figure 18: XRD spectra of (a) As received Ti2AlC powder [3ONE2], (b) 211-HP-1400
(c) 2-211-HP-1400 and (d) 12-211-HP-1400. In all spectra ~ 10 wt. % pure Si powder
was added for reference. ................................................................................................ 51
Figure 19: XRD pattern of, a) samples 2-211-HP-1400, 12-211-HP-1400 and the 2:1
molar ratio of Ti2AlC and SiC powders used for thermal analysis. The red dotted line
represents the 2Θ location of the most Ti3AlC2, intense peak; the black dotted line refers
to the 2Θ location of the most intense Ti3SiC2 peak. One can observe that with an
increase of SiC the strongest peak shifts from left (Ti3AlC2) to right (Ti3SiC2). (b)
2Ti2AlC:SiC powders heated to 1550°C in DSC. ........................................................... 53
Figure 20: OM micrograph of Ti2AlC sample reinforced with 140 µm SiC. fiber; (a) 3-
211-HIP-1300 in the as polished condition. (b) OM of 9-211-HIP-1500 etched with a
1:1:1 solution of water and concentrated HF and HNO3 for 5 s. The white phase is TiC
and the colored phase is Ti3(Si1-x,Alx)C2. ....................................................................... 54
Figure 21: a) Backscattered SEM image of sample 9-211-HIP-1500, b) EDS
quantification of various regions marked in a. ................................................................ 55

x
Figure 22: TEM micrograph of a single particle of 211-DSC-1550 sample heated to
1550°C. Inset shows the EDS spectra of the various regions marked. ............................. 56
Figure 23: (a) The DSC data for 2Ti2AlC:SiC powders heated to a temperature of 1410°C
and instantly cooled at the same heating rate, (b) shows the TGA data for the same
compaction but to a max temperature of 1550°C with mass spectroscopy. ..................... 57
Figure 24: XRD of samples 9-312-HP-1500, 312-HP-1500 and Ti3SiC2 powder (as
received from 3-one-2). Pure Si powder ~ 10 wt. %, was added as an internal reference.
...................................................................................................................................... 63
Figure 25: OM of polished surface of sample 9-312-HP-1500. (a) at low magnification
and, b) at higher magnification. Here the fiber and matrix do not interact and
fibers/matrix interface is clean. Sample is dense and no porosity exists even when fibers
are less than 100 µm apart. ............................................................................................ 64
Figure 26: OM of sample 312-HP-1500, polished to 1 µm diamond solution and etched
with a 1:1:1 solution of H20:HF:HNO3. Etching reveals the presence of both Ti3SiC2 and
TiC grains, colored and white, respectively. OM imaging allowed for the grain
measurement. Average Ti3SC2 grain size is 7±2 µm. ..................................................... 65
Figure 27: Diagrams of creep testing equipment. (a) A general depiction of all points in
the creep testing apparatus. (b) A more specific schematic of the inside of the furnace,
showing the SiC rods in which the test specimen is placed. ............................................ 67
Figure 28: (a) Schematics of the dog-bone specimens used in this work. Dimensions are
based on NIST standards for the high temperature, mechanical testing of ceramics. (b)
Photograph of SR30 composite sample with champfered corners. Champfering was
completed on SR30 samples in order to produce the maximum number of samples from
bulk discs. Scale is in inches. ......................................................................................... 68
Figure 29: Schematic of test specimens seen in Fig. 28. (a) SR51 test specimen with
attached SiC flags, used as guides for the laser extensometer to record the strain. (b) For
the SR30 specimen, where the gauge length was too small to affix SiC flags, the SiC rods
themselves were used instead as points of reference for the strain measurement............. 69
Figure 30: Tensile creep strain vs time of bulk Ti3SiC2:TiC test specimen SR51. Test was
carried out at 1100 °C at a constant σ = 40 MPa. When secondary creep, region between
the two angled dotted lines, is analyzed, the strain rate is found to be 8.1 x 10⁻⁹
s-1
. ........ 71
Figure 31: Tensile creep strain vs time for bulk Ti3SiC2:TiC SR30 specimen. Testing was
carried out at 1100 °C, but at varying loads. For the initial 22 h, σ = 20 MPa, followed by
an increase to σ = 30 MPa for 42 h and finally the load was taken to σ = 40 MPa till
failure, totaling 93 h. Strain rates were measured for the 20, 30 and 40 MPa loads as 3.9 x
10-7
, 8.1 x 10⁻⁷
and 2.2 x 10⁻⁶
s-1
, respectively................................................................. 72

xi
Figure 32: Creep strain vs time at different loads at 1100 °C for Ti3SiC2:TiC:SiC,
composite, SR30 specimen. For the initial 118 h σ = 20 MPa, followed by an increase to
σ = 40 MPa, till failure, ~ 14 h after load increase. Strain rate for the 20 MPa region was
calculated to be 8.9 x 10⁻⁸
s-1
. ......................................................................................... 73
Figure 33: (a) and (b) SEM, secondary electron, images of the SR30 composite
specimen’s fracture surfaces. Surface was extensively oxidized. Circled in the bottom left
hand corner, in red, on b are three SiC fibers.................................................................. 74
Figure 34: SEM secondary electron images of the fibers seen, circled in Fig. 33. (b) and
(d) are tilted images of (a) and (c). The fibers in b are clearly at different levels. The fiber
seen in b and d is the cleanest fiber found for analysis. The fiber can be clearly seen
offset from the matrix surface. These two observations suggest at least some fiber pull-
outs................................................................................................................................ 75
Figure 35: Tensile creep strain vs time for all three tests. This overlain plot easily shows
the improvements the SiC fibers, line c, is for the Ti3SiC2:TiC matrix, lines a and b. ..... 76
Figure 36: A log-log plot of creep strain rate vs stress. This original plot is taken from the
work by Radovic et al.[90]
on FG Ti3SiC2. The results from this work on both a monolithic
matrix of Ti3SiC2:TiC and a composite of Ti3SiC2:Ti:SiC have been overlain. The brown
triangles represent the monolithic SR30 specimen tested at T = 1100 °C and σ = 20 and
40 MPa. These fall very close to the data Radovic et al. published at this same T and σ.
The yellow star, is the composite specimen tested at T = 1100 °C and σ = 20 MPa. This is
still within reason of the Radovic et al. data, but shows a definite reduction in strain rate.
...................................................................................................................................... 77
Figure 37: OM imaging of the polished cross-section just below the fracture surface of,
(a) composite SR30 specimen, at T = 1100 °C for ~132 h, and bulk SR30 specimen, at T
= 1100 °C for ~93 h. Oxidation is clearly seen in both samples. ..................................... 78
Figure 38: SEM of cross-section of SR30 composite specimen, (a) a secondary electron
SEM image of the entire cross-section with the backscattered image shown in (b). (c)
Secondary electron SEM image of just one fiber within the inner oxide layer, with a
backscattered electron SEM image shown in (d). ........................................................... 79
Figure 39: (a) SEM, backscattered image of Figs. 38c-d. Several regions have been
identified with the use of EDS; the results shown in (b). Although, EDS was not
calibrated for accurate measuring, the data is shown for comparison. Three major regions
are identified. The outermost region, spot 4, is made up of Ti and O. The middle layer,
spots 6 and 7, is made of Ti, Si and O. And the inner layer, spot 5, is Ti, Si and C. These
results agree with the literature that show that the oxidation of Ti3SiC2 occurs by the
formation of an outer TiO2 and an inner, or middle layer, of TiO2 and SiO2[63]
. .............. 80

xii
ABSTRACT
Fiber-Reinforced Ti3SiC2 and Ti2AlC MAX Phases Composites
Charles B. Spencer Jr.
Dr. Michel W. Barsoum
It was proposed that reinforcing commercially available MAX phase powders would
enhance their high temperature mechanical properties in general, and their creep
resistance in particular. Three reaction pairs were studied; Ti2AlC:Al2O3, Ti2AlC:SiC
and Ti3SiC2:TiC:SiC. Composites were hot-pressed and hot-isostatic pressed to
temperatures as high as 1500 °C. At 1300 °C dense Ti2AlC-alumina composites were
fabricated wherein the fibers did not appear to sinter together. At 1500 °C, the alumina
fibers agglomerated and sintered together and presumably lost their structural integrity.
At these same temperatures, the SiC fibers reacted with the Ti2AlC matrix, losing their
integrity as well. It was also shown, through the use of differential scanning calorimetry
and x-ray diffraction that Ti2AlC is only kinetically stable at 1500 °C and when the
activity of Al in the processing environment is small, Al is lost while Ti3AlC2 and Ti-
aluminides are formed.
With the Ti3SiC2:TiC:SiC combination, however, processed at 1500 °C, no evidence for a
reaction was found. The SiC/Ti3SiC2 interface remained sharp and reaction free. These
samples were fully dense. Preliminary results have shown that ≈ 6 vol. % SiC fibers,
decreased the creep tensile strain rates at 1100 °C, and increased the times to failure.
Based on this work, we conclude that when continuous SiC fibers are incorporated in
Ti3SiC2, an increase in the latter’s high temperature creep response will occur and is
thus a viable method of extending the life of Ti3SiC2-based materials in high temperature
load bearing applications.


1
CHAPTER 1. BACKGROUND AND LITERATURE SURVEY
Note: The content of this section has been adapted from two papers for which
Charles Spencer was a primary author.[1-2]
1.1 Background on Ceramic-Ceramic Composites
The field of high-temperature, low-density composite materials has been rapidly growing
for some time. With great aptitude for applications in the aerospace and sporting goods
markets, composites are being developed that replace their monolithic, metallic
counterparts.
Composites are made up of two parts, the matrix and the reinforcement. This introduction
focuses on ceramic matrices and reinforcements in the form of fibers. In general the
function of the matrix is to; keep the fibers in place, help to distribute and transfer the
load, protect the fibers in both the structure and during the processing, control the
electrical and chemical properties of the finished material, and to carry interlaminar
shearing.[3]
The functions of the fiber reinforcement are to increase the stiffness and to
increase the thermal and electrical conductivity (e.g. rebar in concretes).[3]
Aligning the
fibers in the matrix can achieve an increase in strength of a specific mode.[3]
In a polymer
or metal-based composite, the reinforcements are meant to carry the bulk of the applied
load and directly increase the strength and stiffness of the material. However, in the case
where the matrix is a ceramic material, the reinforcements are used in a different manner.
The fibers, of a specific orientation, increase the strength, indirectly by increasing the
toughness of the matrix.[3]
2
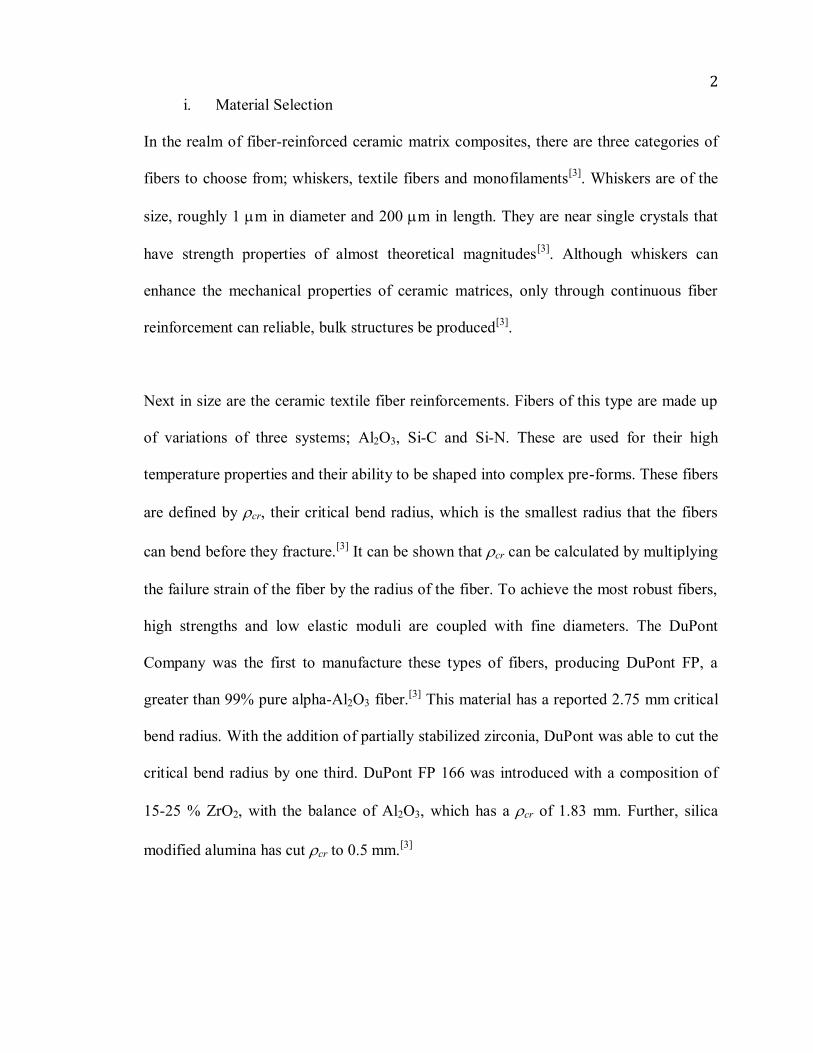
i. Material Selection
In the realm of fiber-reinforced ceramic matrix composites, there are three categories of
fibers to choose from; whiskers, textile fibers and monofilaments[3]
. Whiskers are of the
size, roughly 1 m in diameter and 200 m in length. They are near single crystals that
have strength properties of almost theoretical magnitudes[3]
. Although whiskers can
enhance the mechanical properties of ceramic matrices, only through continuous fiber
reinforcement can reliable, bulk structures be produced[3]
.
Next in size are the ceramic textile fiber reinforcements. Fibers of this type are made up
of variations of three systems; Al2O3, Si-C and Si-N. These are used for their high
temperature properties and their ability to be shaped into complex pre-forms. These fibers
are defined by cr, their critical bend radius, which is the smallest radius that the fibers
can bend before they fracture.[3]
It can be shown that cr can be calculated by multiplying
the failure strain of the fiber by the radius of the fiber. To achieve the most robust fibers,
high strengths and low elastic moduli are coupled with fine diameters. The DuPont
Company was the first to manufacture these types of fibers, producing DuPont FP, a
greater than 99% pure alpha-Al2O3 fiber.[3]
This material has a reported 2.75 mm critical
bend radius. With the addition of partially stabilized zirconia, DuPont was able to cut the
critical bend radius by one third. DuPont FP 166 was introduced with a composition of
15-25 % ZrO2, with the balance of Al2O3, which has a cr of 1.83 mm. Further, silica
modified alumina has cut cr to 0.5 mm.[3]

3
Monofilament reinforcements come in two types, boron carbide and silicon carbide.
These fibers are produced by chemical vapor deposition, CVD, onto a fine filament
substrate. The advantage of the use of these fibers, over textiles and whiskers, are their
ability to withstand some degree of surface reaction with the matrix during fabrication.
These fibers, because of their large critical bend radius, are limited to pre-forms such as
sheets, plates and large diameter cylinders. The matrix material can then infiltrate the
fibers by several processing techniques such as, powder sintering, powder hot pressing,
plasma spraying and melt infiltration.[3]
The matrix materials for these fiber-reinforced ceramic composites are chosen based on
their thermal stability and processing conditions. Most composites are made with oxides,
carbides, nitrides, borides and silicides. What ultimately defines what composite can be
made is the chemical and mechanical compatibility between the matrix and the fiber.
Furthermore, large differences in thermal expansion between the reinforcement and the
matrix can result in residual stresses during fabrication, which can lead to degradation of
the final mechanical properties.
ii. Processing
The processing of ceramic composites can be carried out using the matrix in one of three
phases; solid, liquid or vapor. The goal of these processes is to achieve an even
dispersion of the matrix around the fibers. This should create a final product that is of
minimum porosity, uniform dispersion of constituents, and a controlled bonding between
the matrix and the reinforcing fibers.

4
a. Powder Processing
The steps included in processing ceramic composites from powdered constituents are as
follows; powder selection, powder characterization, agglomerate reduction, mixing, green
body fabrication, green body machining, binder removal, densification, burr removal and
inspection.[3]
The ceramic powder is selected based on chemical, mechanical and thermoelastic
compatibility between the powder and fibers. Also the desired physical and mechanical
properties of the resulting product can help define the starting material. Reactions
between the fibers and matrix, and also differences in melting temperatures and thermal
expansion coefficients, can eliminate certain matrix/fiber combinations.
To reduce voids and increase interfacial strength and the toughening effect of the
reinforcing phase, uniformity must be achieved in the mixture. This uniformity is
achieved through „packing‟ of the matrix powder and the reinforcement fibers. In the case
of round fibers, or whiskers, if they are perfectly aligned in a closed packed array then the
matrix particles, that are ≈ 0.15 times the size of the fiber diameter, sit in the interstitial
positions between the fibers.[3]
Powder can be made up of both primary particles and agglomerates, where agglomerates
are a group of primary particles bonded by surface chemical forces, electrostatic forces or
solid bridging. In order to have a homogeneous mixture of fibers and powder, these
agglomerates must be reduced. If the fibers being used are robust, or if some damage can

5
be tolerated, then the agglomerates can be broken down mechanically as the constituents
are mixed during ball milling.[3]
An organic binder is usually added to the fiber/matrix mixture. This binder ensures that
the first consolidation step yields a body that is dense. This consolidated body is referred
to as a green body, and usually can be machined without damage. Several processes that
can achieve a green body are; uniaxial pressing (CP), cold isostatic pressing (CIP), tape
casting, extrusion, compression molding and injection molding.[3]
Final densification can be accomplished at high temperatures, most commonly through
sintering, hot pressing (HP) or hot isostatic pressing (HIP). Sintering may be used when
attempting composites with a low percentage of fiber (< 5%).[3]
However, complete
densification during sintering usually involves excessive temperatures and many hours,
which may be impractical. In composites with high percentage fiber, HPing and HIPing
are the only effective methods to achieve densification. Below can be found Table 1,
from the text Handbook of Composites, which shows how fiber volume percent affects
the densification temperature of SiC-whisker reinforced Al2O3 composites. With higher
percent fibers, the temperature increases to achieve the same densification as the pure
alumina.

6
Table 1: Effect of processing parameters on the theoretical densities of SiC whisker-Al2O3 composites pressed at
31 MPa pressure.[4]
Vol. %
Whiskers
Pressing
Temperature (°C)
Pressing
Time (min)
Density
(g cm-3
)
Density
(theoretical)
0 1500 60 3.95 99.1
10 1500 35 3.78 96.7
10 1650 60 3.89 99.5
20 1500 120 3.68 96.1
20 1650 60 3.72 97.1
20 1725 60 3.78 98.6
20 1800 25 3.81 99.5
b. Liquid Processing
The need for high temperatures and large loads to achieve fully dense ceramic
composites can adversely impact the final strengths supplied by the fiber reinforcements.
By reducing the processing temperature, time and load, the damage to the reinforcements
can be minimized. One way to reduce the mechanical damage is to process by infiltration
with molten matrices. However, because the high melting temperatures of most ceramics,
the general use of this process is limited. With special treatment of the matrix and the use
of innovative in situ reaction techniques, melt infiltration has been utilized successfully to
fabricate ceramic composites.[3]
The literature has stated that as recently as 1998, melt gas-metal reactions have been
applied to produce ceramic-matrix composites directly from liquid metals[3]
. This process
has been commercially developed and is known as the DIMOXTM
process of the Lanxide
Corporation. During this process oxidation or nitridation forms on the surface of the
molten metal, which forms a layer of solid ceramic. The layer then thickens as the molten

7
metal wicks up between the grains of the ceramic, this process is presented in the Fig.
1.[3]
Figure 1: Directional metal oxidation method for processing ceramic composites.
[5]
The growth of the ceramic phase is possible by modification of the surface energies
between the various phases. In the case where the grain boundary energy, B, is less than
twice the energy of the solid-liquid interface, SL, and the energy of the solid-liquid
interface, SL, is greater than the energy of the solid-vapor interface, SV, thickening of the
reaction compound (oxide, nitride, etc.) layer cannot take place. But by reversing the
relative values of the surface energies, the unstable grain boundary will permit wicking of
the liquid metal through the grain boundaries of the reaction product phase.[3]
A
schematic, taken from the Handbook of Composites, of this can be in Fig. 2.

8
Figure 2[3]
: Mechanism of directed metal oxidation growth[6]
. (a) no growth due to stable grain boundary; (b)
oxide growth mechanism with unstable grain boundary.[3]
c. Vapor Processing
Chemical vapor infiltration, CVI, is the infiltration of the reinforcing phase by a gas that
decomposes to form a solid matrix phase[3]
. Using this method, various carbides, nitrides,
oxides and borides have been deposited on silicon carbide-based yarn fibers like those
produced by Nicalon and Tyranno and oxide based fibers like Nextel[3]
. Also, deposition
has been used with carbon yarn fibers and SiC whiskers. The most common matrix used
with this method is SiC.[3]
There are two basic methods of CVI: isothermal processing and forced flow/thermal
gradient processing. Isothermal processing heats the fiber pre-form by radiation from the

9
walls of a furnace or by inductively heating a carbon mandrel on which the pre-form is
placed.[3]
In either case, the decomposing gases are allowed to diffuse through the fiber
pre-form. The forced flow/thermal gradient method takes the reactant gases and forces
them through the fiber pre-form, which is retained in a graphite holder with a sharp
thermal gradient maintained by water cooling. Below, Fig. 3, is a schematic from the
Handbook of Composites of the forced flow/thermal gradient method.
Figure 3
[3]: Forced flow thermal gradient method for CVI processing.
[7]
Drawbacks to the CVI method include both high processing time and high cost. It is also
difficult to achieve 100 % density because as the deposition occurs, pathways begin to
block up for the gas to travel. It is necessary to stop the infiltration process to grind the
surfaces in order to reopen the pathways to the fibers. A residual porosity of 10-20% and
an open porosity of less than 10% are usually obtained with this method.[3]

10
iii. Design Considerations
As stated above, the rationale for ceramic-based composites is to impart the toughness
that is otherwise unachievable with a monolithic ceramic.[3]
In designing a fiber-
reinforced ceramic composite there are three ways of aligning the fiber reinforcements;
continuous unidirectional, discontinuous and multi-directional/multi-layer.
The design considerations are unique for each of these composites. For continuous
unidirectional aligned fibers the rule of mixtures can be applied when calculating the
resulting elastic and thermoelastic properties of the final product.[3]
The Young‟s
modulus of the composite, Ec, is calculated assuming;
EcVfEf VmEm
where Ef is the modulus of the fibers, Em is the modulus of the matrix, Vf is the volume
fraction of fibers and Vm is the volume fraction of the matrix. In the composite,
Vf + Vm = 1, therefore:
Ec = VfEf + Em(1-Vf) (1.1)
[3]
However, strength properties cannot be accurately predicted because reinforcement-
matrix bond strength and flaw sensitivity are not considered in the rule of mixtures.
When the bond strength between the fibers and matrix is at a maximum the strength
depends on the relative fracture strains, strength and stiffness of the constituents. There
are two combinations that can be made with fibers and matrix. The first is high stiffness,
high strength fiber and a lower stiffness, low strain to failure matrix. This strength
prediction can be found below, Fig. 4[3]
;

11
Figure 4
[3]: Strength prediction for high stiffness, high strength fiber and a lower stiffness to failure matrix.
At a fiber volume fraction, Vcrit, the composite fails when the matrix fails. At values
below this point there is a simple linear stress-strain behavior to failure, but values above
Vcrit the fibers strengthen the composite. Although the matrix fails before the fibers, the
fibers can retain the broken matrix in place before the fibers break at a higher load.[3]
In
the case where high strength fibers are combined with a higher stiffness, low strain to
failure matrix, the predicted strength will decrease with increasing fiber percentage. This
is until the Vf = Vmin, where Vmin is a minimum fiber percentage. Below Vmin the failure
of the matrix still means failure of the composite, and values above Vmin extend the
strength of the matrix with the fiber strength. This can be seen in the charts below, Fig. 5,
from the text Handbook of Composites.

12
Figure 5
[3]: Strength prediction for a high strength fiber and higher stiffness, low strain to failure matrix.
These two descriptions of continuous unidirectional fiber alignment neglect the effect of
fracture surface energy.
When working with discontinuously reinforced composites, the rule of mixtures is less
important. Here, the goal is to improve the toughness by a combination of fiber pullout,
crack deflection and crack bridging. Because the fibers are randomly dispersed the elastic
modulus must be broken into the transverse, ET, and the longitudinal, EL. These are
determined by the Halpin-Tsai relation[3]
:
fL
fLL
LV
VE
1
1
fT
fTT
TV
VE
1
1
13
where
Lmf
mf
LEE
EE
/
1/
Tmf
mf
TEE
EE
/
1/
d
lL 2 , and
T 2
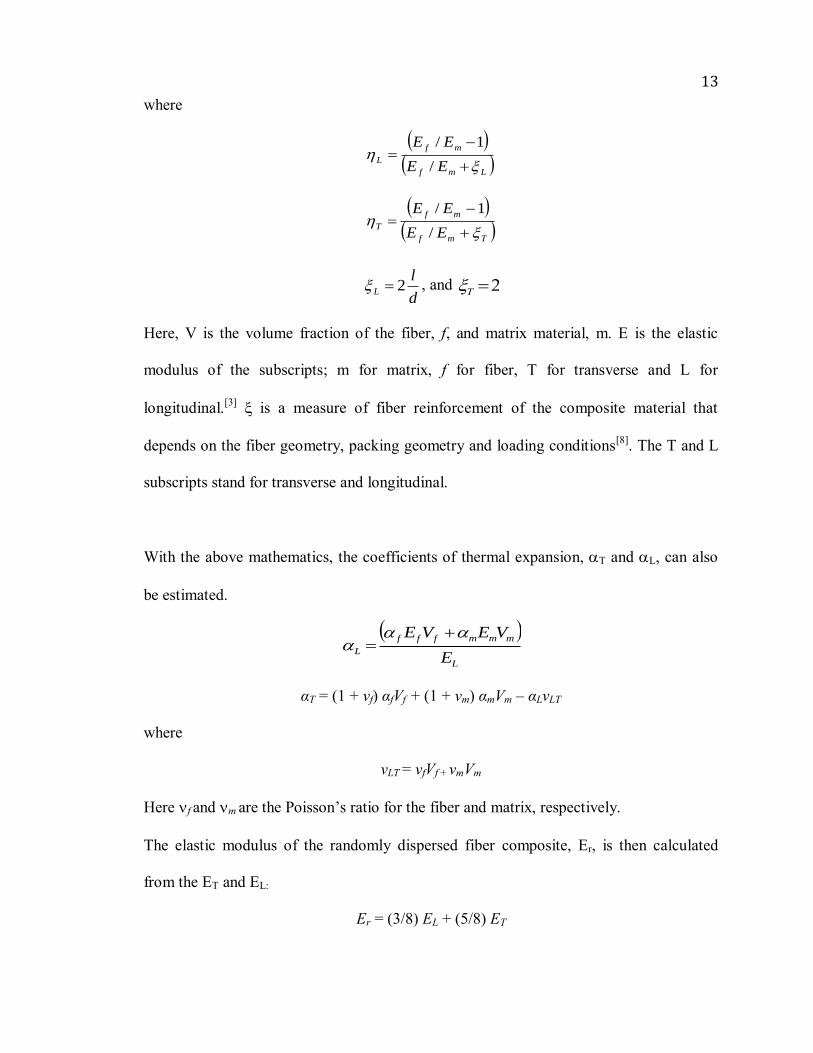
Here, V is the volume fraction of the fiber, f, and matrix material, m. E is the elastic
modulus of the subscripts; m for matrix, f for fiber, T for transverse and L for
longitudinal.[3]
is a measure of fiber reinforcement of the composite material that
depends on the fiber geometry, packing geometry and loading conditions[8]
. The T and L
subscripts stand for transverse and longitudinal.
With the above mathematics, the coefficients of thermal expansion, T and L, can also
be estimated.
L
mmmfff
LE
VEVE
αT = (1 + νf) αfVf + (1 + νm) αmVm – αLνLT
where
νLT = νfVf + νmVm
Here f and m are the Poisson‟s ratio for the fiber and matrix, respectively.
The elastic modulus of the randomly dispersed fiber composite, Er, is then calculated
from the ET and EL:
Er = (3/8) EL + (5/8) ET

14
It is important to point out that all of the calculations pertaining to discontinuous
randomly dispersed fiber reinforced composites are for an ideal scenario. They
overestimate the value of these properties because of the ineffective bonding between the
fiber reinforcement and the matrix and deviation from ideal fiber alignment.[3]
For the design of multilayer/multidirectional reinforcement laminates, both mechanical
and physical properties can be predicted from theoretical and semi-empirical treatment of
the constituent properties such as; elastic modulus of the fiber and matrix, orientation
factor, f, the volume fraction of the fiber, Vf, the fiber aspect ratio, l/d, and the
coefficients of thermal expansion of both the fibers and matrix material.[3]
Using the
classical laminate plate theory, the elastic and thermoelastic properties can be predicted
from the layer properties.[3]
However, the strength cannot be predicted this way because
of unknown flaws in the resulting composite. For this, modified laminate fracture theories
must be employed.[3]
In any of the fiber orientations from above, the design must also keep in mind symmetry
and balance. In composites, this refers to the geometric mid-plane that acts as a reference
surface for determining if a laminate is symmetrical. In order to reduce out-of-plane
strains, coupled bending and stretching of the laminate, and complexity of analysis,
symmetric laminates should be used.[3]
Balance helps the laminates achieve in-plane
orthotropic behavior. Balance is achieved by ensuring that for every layer of fibers, there

15
is another layer of opposite orientation. Laminates that only contain 0 and/or 90 layers
satisfy the requirements for balance.[3]
iv. Failure Modes
Failure modes for unidirectional continuous, monofilament fiber-reinforced ceramic
composites are mode I, mode II and mixed mode I/II[9]
. In tensile loading, mode I is the
main factor with contributions from debonding and sliding. Matrix cracking results first,
then failure of the fibers follows. If the interfacial bonding between the fibers and matrix
is weak, pullouts may occur. Mode II is the failure mechanism under shear loading, with
damage occurring at quite low shear stresses. This mode of failure is governed by
microcracking, which are presumably caused by stress concentrations in the matrix that
form normal to the local principal tensile stress, but then deflect to the mode II plane and
combine. The two modes are linked as it has been shown that as the shear strength
decreases, the mode I toughness increases. The mixed mode conditions can exploit failure
along the fiber-matrix interface. Because this interface can have a lower fracture
resistance than either the fibers or the matrix, the debond crack can continue to extend
along the interface.[9]
1.2 Properties of MAX Phases and MAX Phase Composites
MAX phases, named for their general formula of Mn+1AXn (n=1,2,3), are a group of
nanolayered ternary carbides and nitrides where M is an early transition metal, A is an A-
group (mostly IIIA and IVA) element, and X is either a C and/or N[10-13]
. These phases
have a hexagonal crystal structure with the space group P63/mmc, having two formula

16
units per unit cell. They consist of Mn+1Xn layers that are interleaved with pure A-group
layers.[14]
To date, there are over 60 known MAX phases. Subsequently, these phases
come in three variations. The largest group of these phases, where roughly 50
combinations exist, is the form M2AX[15]
, which includes Ti2AlC, V2GaN and Ti2SC.
There are five of the form M3AX2[16-20]
, which includes such materials as Ti3SiC2 and
Ti3AlC2. With the form of M4AX3 rounding off the last seven[18, 21-27]
. Examples of this
413 phase are Ta4AlC3 and Ti4AlN3.[14, 28]
A comprehensive listing of these phases can be
found below as Table 2.
Table 2: Summary of MAX phases known to date.
211
Ti2AlC Ti2AlN Hf2PbC Cr2GaC V2AsC Ti2InN
Nb2AlC (Nb,Ti)2AlC Ti2AlN0.5C0.5 Nb2GaC Nb2AsC Zr2InN
Ti2GeC Cr2AlC Zr2SC Mo2GaC Ti2CdC Hf2InN
Zr2SnC Ta2AlC Ti2SC Ta2GaC Sc2InC Hf2SnN
Hf2SnC V2AlC Nb2SC Ti2GaN Ti2InC Ti2TiC
Ti2SnC V2PC Hf2SC Cr2GaN Zr2InC Zr2TiC
Nb2SnC Nb2PC Ti2GaC V2GaN Nb2InC Hf2TiC
Zr2PbC Ti2PbC V2GeC V2GeC Hf2InC Zr2TiN
312
413
Ti3AlC2 Ti3GeC2 Ti4AlN3 Ta4AlC3 Ta4AlN3
Ti3SiC2 Ta3AlC2 Ti4SiC3 Nb4AlC3
Ti3SnC2 Ti4GeC3 V4AlC3

17
Figure 6: MAX unit cells of; (a) 211, (b) 312 and (c) 413. Vertical arrows labeled c, denote the unit cell, while a horizontal line marks the center of each unit cell.[29]
These extraordinary ternary carbides were first discovered as early as the 1960‟s when
Nowotny and his colleagues reported approximately 30 phases, then referred to as H-
phases[13, 15, 29]
. H-phases are of the form M2AX (Fig. 6a) and included the phases Ti2AlC
and Ti2AlN.[13, 29]
The phase Ti3SiC2 was then discovered by Nowotny et al. in 1967,
which is structurally related to the 211 phases, where M3C2 layers are interleaved with
pure A-layers[30]
. (Fig. 6b)
18
The MAX phases combine properties that are a mixture of metallic and ceramic
materials. Similar to their corresponding binary carbides and nitrides, they are elastically
stiff, have relatively low thermal expansion coefficients and are resistant to chemical
attack. These phases, however, could not be more different than their binary cousins
when it comes to their mechanical response. They are relatively soft (1-5 GPa) and
machinable, thermal shock resistant, damage tolerant, and have good thermal and
electrical conductivities. Some are even fatigue, creep and oxidation resistant.[14]
1.2.1 Ti2AlC
Ti2AlC, which crystallizes in the Cr2AlC-type structure (Fig. 6a) is of particular interest.
The atoms are located at the following Wycoff positions: Ti at 4f, Al at 2c and C at 2a,
with the lattice constants being a=3.04 Å and c=13.60 Å.[31]
The hardness and room
temperature electrical and thermal conductivities were reported by Barsoum et al. to be
4.5-5.5 GPa, 2.7x10⁶ -2.8x10
6 Sm
[32-33] and 33-46 Wm/K, respectively.
[33-34] It‟s Poisson‟s
ratio, Young‟s, shear and bulk moduli are 0.19, 277 GPa, 118 GPa and 186 GPa,
respectively[35-36]
.
In addition, the room temperature compressive strength of Ti2AlC fabricated by a
reactive hot-isostatic pressing method at 1600 °C was reported to be 540 MPa. When the
material was taken to T ≈ 1000 °C the deformation became plastic and strongly depended
on the strain rate. The yield point was in the range of 270-435 MPa between 1000C and
1300C.[33, 37]
Wang et al. recently reported on the room temperature compressive and

19
flexural strengths as 670 and 384 MPa, respectively, a fracture toughness of 7.0 MPa-m1/2
and Vickers hardness values between 4.2-5.7 GPa for hot pressed Ti2AlC.[38]
The attractiveness of Ti2AlC for high temperature applications, however, derives mostly
from its superb oxidation resistance.[39-40]
Early work on the oxidation behavior of
Ti2AlC,[41-42]
showed that oxidation occurred by the inward diffusion of oxygen and the
outward diffusion of Al3+
and Ti4+
ions through a (Ti1-yAly)O2-y/2 oxide surface layer and
that the oxidation kinetics were parabolic up to 1100 °C at short times (up to 20 h). Wang
and Zhou reported that Ti2AlC follows a cubic oxidation law in the 1000-1300°C range,
where scale growth is governed by oxygen grain-boundary transport.[40]
The scales
reported by Wang and Zhou were fully dense, adherent and resistant to thermal
cycling.[40]
More recently, Sundberg et al. showed that dense, crack-free, stable and
protective alumina, Al2O3, scales form on Ti2AlC surfaces. These scales did not spall off
even after 8,000 thermal cycles to 1350 °C.[39]
The remarkable thermal shock resistance
of the protective oxide scale was attributed to the fact that the thermal expansion
coefficient of Ti2AlC (8.2x10⁻⁶
K-1
)[33]
and Al2O3 are quite similar. Lastly, Byeon et al.[43]
confirmed that the compressive residual stresses formed during oxidation of Ti2AlC are
small. They also demonstrated that the oxidation and spallation resistance of Ti2AlC is
comparable, and sometimes even better than those of the best-known alumina-forming
materials currently available. These adherent scales make Ti2AlC a strong candidate for
high temperature structural applications.

20
Despite the potential for Ti2AlC to be used as a high temperature structural material,
surprisingly no results on its creep behavior have been published to date.
1.2.2 Ti3SiC2
Although Ti3SiC2 was first discovered in 1967 by Jeitschko and Nowotny[30]
through a
reaction between TiH2, Si and graphite at 2000 °C , it was not until a few decades later, in
1996, that Barsoum and El-Raghy[44]
could synthesize a bulk sample of full density and
purity through reactive hot pressing Ti, graphite and SiC powders at 1600 °C. This is not
to say there were not many attempts at synthesis and characterization. Many works have
been completed to synthesize Ti3SiC2. After the work of Jeitschko and Nowotny came the
work of Nickl et al. in 1972, where they used TiCl4(g) + SiCl4(g) + CCl4(g) + H2(ex) to
deposit a thin film of Ti3SiC2 and Ti5Si3Cx[31, 45]
. Racault et al. additionally published on
reactive sintering of Ti3SiC2; however, they were unable to achieve single-phase.[46]
Over
the years from 1967 to present, many techniques had been employed to synthesize this
phase, but most had either failed to be replicable in bulk or unable to produce pure, single
phase. These methods include; magnetron sputtering (MS)[25, 47-48]
, pulsed laser
deposition (PLD)[49]
, self-propagating high-temperature synthesis (SHS)[50-51]
, arc-
melting and post annealing[52]
, spark plasma sintering (SPS) and pulse discharge sintering
(PDS)[53-55]
, pressureless sintering[56-57]
, and mechanical alloying (MA)[58-61]
.
The mechanical response of Ti3SiC2 has been extensively studied and reported for both
fine grained (FG), 3-5 µm, and coarse grained (CG), 100-200 µm, microstructures. At
room temperature, Ti3SiC2 exhibits brittle failure with compressive strengths reported as

21
1050 and 720 MPa and flexural strengths of 600 and 330 MPa, for CG and FG,
respectively. It has been shown that with increasing the temperature the compressive
strength decreases and at T > 1200 °C, both microstructures exhibit plastic deformation,
with yield points of 500 MPa and 320 MPa for CG and FG, respectively. At T = 1300 °C
the flexural strengths were reported to drop to 120 and 100 MPa, respectively.[62]
In
addition, Ti3SiC2 is damage tolerant and thermal shock resistant. The CG microstructure
is thermal shock resistant up to 1400 °C, while the FG microstructure loses strength
gradually when quenched from 750 °C and 1000 °C by 10 % and 50 %, respectively.[62]
The oxidation kinetics and morphology of the oxide phases that form on Ti3SiC2 at
temperatures up to 1300 °C have been studied intensively over the last decade[61]
.
Barsoum et al.[63]
showed that long term oxidation (up to 1500 h) of Ti3SiC2 resulted in
the formation of a TiO2 outer scale and mixed TiO2 and SiO2 inner scale due to the
inward diffusion of oxygen and outward diffusion of Ti and C. They also showed that
oxidation kinetics at temperatures of 1000 °C or greater and times greater than 30 h
changes from parabolic to linear. Sun et al.[64]
and Liu et al.[65]
investigated the cyclic-
oxidation behavior of Ti3SiC2 in air at 1100 °C and showed no spallation or separation of
oxide scales up to 360 cycles despite the formation of a large number of microcracks in
the oxide scale. The latter contributed to the faster oxidation kinetics when compared to
the isothermal oxidation.
Radovic et al. and Zhen et al. studied creep extensively in both coarse- and fine-grained
Ti3SiC2 materials. In the coarse-grained material (>20 m) the dominating mechanism

22
for creep is through dislocation creep and high plastic anisotropy in the Ti3SiC2 results in
large internal stresses.[66-67]
Dislocation creep is defined as;
(1.2)
[68]
where b is the Burger‟s vector, ρ the dislocation density, υ(σ) the average velocity of a
dislocation at an applied stress σ, dρ/dt is the rate of nucleation of the dislocations at
stress σ, and λ is the average distance they move before they are pinned[68]
. Also, the
brittle-to-plastic, BTD, transition was found to be between 1100-1200C. At this
transition the fracture toughness of Ti3SiC2 drops from about 8-10 MPa m-1/2
to roughly 4
MPa m-1/2
. These events lend a hand in high temperature failure of the MAX phase.[66]
1.2.3 MAX Phase Composites
a. Ti-Al-C Reinforced
The reinforcement of Ti3AlC2 with 10% by volume Al2O3 has been shown by Chen et al.
The addition of the -Al2O3 significantly enhanced the strength of the Ti3AlC2 in the
brittle mode of failure regime, but due to softening of the matrix, strength in the ductile
mode of failure had little improvement. It was shown that both the Ti3AlC2 and
Ti3AlC2/10 vol.% Al2O3 composite strengths decrease with increasing temperature.[69]
b. Ti-Si-C Reinforced
Benko et al. increased the Young‟s modulus and Vickers hardness of Ti3SiC2 by hot-
pressing cubic boron nitride (cBN) with Ti3SiC2. The extreme hardness of cBN, which is
second only to diamond, drastically improved that of the Ti3SiC2 from a Vickers hardness

23
value of 4 GPa to 19.9 GPa (Vickers hardness for TiC = 16.0-28.0 GPa[68]
). The addition
of the cBN also increased the modulus from 320 GPa to 525 GPa.[70]
Several composites utilizing Ti3SiC2 and a binary carbide have been explored in recent
years. Wang et al. [71]
used Ti and SiC powders to fabricate nanostructured Ti5Si3-TiC-
Ti3SiC2. Konoplyuk et al. [72-73]
used pulsed discharge sintering to synthesize Ti3SiC2/TiC
composites. Using initial powders of TiH2/SiC/TiC, samples were sintered with (001)
texture and exhibited hardness values of 4-6 GPa and a flexural strength of 400-550 MPa.
Ho-Duc et al.[74]
studied the fabrication of Ti3SiC2/TiC and Ti3SiC2/SiC, 30 vol.%
reinforcement, composites by hot-isostatic pressing Ti, SiC and C powders for 8 h at
temperatures as high as 1600 °C. Flexural strength of both composites decreased, but
damage tolerance and thermal shock resistance increased up to a quenching from 1400°C.
c. MAXmet
Recent studies by several groups have shown the possibilities of reinforcing such MAX
phases as Ti2AlC and Ti3SiC2 with metals, such as Ag, Cu and Mg. Ngai et al. and Zhang
et al. have reinforced Cu matrices with particulates of Ti3SiC2. To enhance the
tribological performances of several MAX phases, Gupta et al. reinforced Ta2AlC and
Cr2AlC with 20% Ag. It is proposed that these composites be used as a high-temperature
solid-lubricant that could be used against Ni-based superalloys and alumina.[75]
Work
presented by Amini et al.[76]
has recently shown the successful reinforcement of Ti2AlC
with nano-particles of Mg, a 50/50 mix. The resulting composite was readily machinable,

24
stiff ( ≈ 70 GPa), strong, light (2.9 g/cm3) and exhibited exceptional damping
capabilities[76]
.
If the MAX phases are ever to be used in high temperature, mechanical applications, they
will need to be reinforced with ceramic fibers. To the best of our knowledge neither
Ti2AlC nor Ti3SiC2, or any of MAX phase for that matter, has ever been reinforced with
ceramic fibers. However, from the work of Chen et al. on Ti3AlC2/10% by vol. Al2O3 and
Radovic et al. on creep of MAX phases, it is our belief that if the MAX phases could be
reinforced with stiff fibers, the internal stresses occurring due to applied loads at elevated
temperatures could be taken up by the fibers. It was our contention that Al2O3 or SiC
fibers would be a good match for these phases.
1.3 High Temperature Creep Mechanical Testing
It can be said, for a simplistic model, that metals and ceramics will deform at room
temperature in a way that depends on stress and is independent of time. However, at
elevated temperatures, the material response will not only depend on stress but also
temperature and time. This is considered creep and can be defined as the slow,
continuous deformation of a material with time at a high temperature. But what is
considered a high temperature? Materials have all different values of melting
temperatures which range from ice at 0 °C to diamond at 3727 K. It is generally accepted
that creep will occur according to the following equations:[77]

25
It has been well established that creep is manifested in metals by grain boundary sliding
and cavity growth. For these reasons, single-crystal superalloys have been developed for
the use as turbine blades, which are very creep resistant. However, for the case of
ceramics, several different mechanisms can be operative during varying temperatures.
Generally, creep in ceramics depends on; stress, strain, time, temperature, grain size and
shape, microstructure, etc.[68]
Creep testing can be completed in either compression or tension, with constant load
inside a furnace that is maintained at a constant temperature. To analyze the results,
strain, ε, is plotted vs. time, T. A typical creep plot is shown in figure 7.
Figure 7: Typical creep strain versus time creep curve showing three regions; primary, secondary and tertiary.
Creep strain rates are obtained in the secondary region. Experimentally, not always all three regions are observed.
[68]

26
CHAPTER 2. REACTION STUDIES
Note: The content of this section has been adapted from two papers for which
Charles Spencer was a primary author.[1-2]
2.1. Ti2AlC:Al2O3
2.1.1 Synthesis
The Ti2AlC powder used was a - 325 mesh powder [3ONE2, Voorhees, NJ]. Two types
of Al2O3 fibers were used: 10 μm diameter [3M Nextel, St. Paul, MN] and ≈ 3 μm
diameter [Zircar Ceramics, Florida, NY] fibers. In both cases, the fibers were chopped
with a razor blade into ≈ 5 cm lengths. Mixing of the powder and fiber was carried out in
several ways: i) in situ layering of powder layers, interspersed with layers of chopped
fiber; ii) dry mixing by shaking in a plastic bottle; iii) powders and fibers were dispersed
in an ethanol solution, mixed with a magnetic stirrer and allowed to dry; iv) dispersed in
an ethanol solution and mixed in a plastic bottle placed on a ball mill (without balls), for
≈ 12 h and then allowed to dry.

27
Table 3: Summary of runs made herein. Column 1 lists the fiber diameter, 211; column 2 the matrix/fiber molar
ratio. The key to the label listed in column 7 is: 211 (for Ti2AlC powder) or fiber diameter or DSC, followed by
fiber vol. fraction, followed by consolidation method or DSC and last the processing temperature. The
processing time was 3 or 4 h.
Fiber
Dia.
(μm)
Molar
Ratio
Vol.
%
Proc.
Meth
T
(°C)
Time
(h) Label
Major Phases
Present
211^ N/A N/A HIP 1400 3 211-HP-1400 211
211^ N/A N/A HP 1500 4 211-HP-1500 312
3 1.3:1 40 HIP 1300 4 3-40-HIP-1300 211
10 4.1:1 17 HIP 1300 4 10-17-HIP-1300 211
3 7.6:1 9 HIP 1500 4 3-9-HIP-1500 312 + TiC
10 7.6:1 9 HIP 1500 4 10-9-HIP-1500 312
3 1:1 46 HIP 1500 4 3-46-HIP-1500 312
10 1:1 46 HIP 1500 4 10-46-HIP-1500 312 + TiC
10 7.6:1 9 HP 1500 4 10-9-HP-1500 211 + 312
10* 3:1 21 DSC 1410 0 DSC-1410 211+312+TiC
10* 3:1 21 DSC 1550 0 DSC-1550 211 + 312 + TiC ^ Ti2AlC powder only * Fibers were manually crushed, mixed with Ti2AlC powder and cold pressed into small pellets that were then introduced into the DSC.
Prior to HIPing, the mixed dried powders – with various volume fractions of alumina
fibers (Table 3, above) - were loaded in a steel die and compressed to loads
corresponding to stresses of 57 or 97 MPa for 60 s into 12.5 x 70 mm2 bars or 25 mm
diameter discs, respectively. On an as needed basis, polyvinyl alcohol ≈ 5 ml per 15
grams of powder, was added as a binder to enhance the strength of the green bodies. The
latter were then placed in a graphite crucible and covered in a bed of borosilicate glass
[Fisher Scientific, Pittsburgh, PA]. The HIP [Flow Autoclave Systems Inc., Columbus,
OH] was then sealed and the temperature ramped to 750 °C or 850 °C at 10 °C/min, then
subsequently ramped to 850 °C or 1000 °C at 2.5 °C/min and 5 °C/min, respectively.
These intermediate temperatures were held for 60 mins, before further pressurizing with

28
Ar. Once pressurized the temperature was increased again at 10 °C/min up to
temperatures of 1300-1500 °C and held at these temperatures for 4 h before furnace
cooling. The pressure at temperature was ≈100 MPa.
Three specimens – two pure Ti2AlC and one containing 9 vol. %, 10 μm chopped in situ
layered Al2O3 fibers - were hot pressed in a graphite heated hot press [Series 3600,
Centorr Vacuum Industries, Somerville, MA] under a vacuum of 10-2
torr, and ramped at
500 °C/h to 1400 or 1500 °C and held for 3 or 4 h, in the graphite dies. The load at
maximum temperature corresponded to a stress of 20 MPa.
A 3:1 molar ratio of Ti2AlC powder and 10 μm Al2O3 fibers - pre-crushed in a mortar and
pestle - were ball milled, using alumina balls, for ≈ 12 h and compacted into green bodies
(dia. = 13 mm) with a small pellet press. These pressed pellets were then cut to a size of ≈
4 mm height by 5 mm dia., and placed in a combined differential scanning calorimetry
(DSC) and thermogravimetric unit [Netzsch-STA 449 C Jupiter®], equipped with a mass
spectrometer [Netzsch-QMS 403 C Aëolos®] and heated at 20 °C/min up to 1410 °C or
1550 °C in an ultra pure He atmosphere.
2.1.2 Characterization
The HIPed, HPed samples and those placed in the DSC were powdered, using a diamond
coated needle file, for x-ray diffraction (XRD) [Model 500D, Siemens, Karlsruhe,
Germany and PW1729, Philips, Eindhoven, Netherlands]. In most cases, 10 wt. % pure
silicon, Si, powder was used as an internal standard. Scans were made with Cu Kα

29
radiation (40 kV and 30 mA) at rates of 1.2 or 2.4 deg (2Θ)/min, using steps of 0.02 or
0.04 deg, respectively.
Post DSC, runs were scanned with Cu Kα radiation (40 kV and 40 mA) at 0.057 deg
(2Θ)/min. Select runs were scanned from 41–48° 2Θ at rates of 0.12 (2Θ)/min, in order to
detect any hints of Al-Ti intermetallics.
Samples were also cut with a precision diamond saw [Struers Accutom-5, Westlake,
OH], mounted and polished to a 1 μm diamond suspension. A scanning electron
microscope (SEM) [Zeiss Supra 50VP, Thornwood, NY] equipped with energy-
dispersive spectroscopy (EDS) [Oxford Inca X-Sight, Oxfordshire, UK] and a
microprobe [Cameca SX50, Nampa, ID] equipped with a wavelength-dispersive
spectrometer (WDS) [PGT, Princeton, NJ] were used for microstructural and elemental
analysis. Select surfaces were then etched with a 1:1:1 ratio of water, concentrated HF
and HNO3 for 5 s and immediately rinsed with water. The microstructure was then
viewed under an optical microscope, OM, [Olympus PMG3, Center Valley, PA or
KEYENCE VHX 600, Woodcliff Lake, NJ].
2.1.3 Results
a) Monolithic Bulk
Rietveld analysis of the as-received powders (Table 4) indicates that it contains ≈ 14 mol.
% Ti3AlC2 and ≈ 19 mol. % TiC. Note that these results only quantify the crystalline
phases; the presence of amorphous titanium-aluminide intermetallic phases (see below)
cannot be ruled out at this juncture.

30
Table 4: Summary of Rietveld analysis of as-received powders and 3Ti2AlC + Al2O3 powder mixture after
heating twice to 1410 °C or 1550 °C in a DSC at 20 °C/min and immediately cooling at same rate. The goodness
of fit, χ2, is indicated.
Phases Molar
Fraction
Lattice Parameter
c (Å) a = b (Å)
As-received powders
Ti2AlC 0.67 13.6946 3.0600
Ti3AlC2 0.14 18.540 3.0652
TiC 0.19 a = 4.3093
1410 °C DSC 2.1
Ti2AlC 0.65 13.6711 3.0602
Ti3AlC2 0.22 18.5153 3.0709
Al2O3 0.13 13.0100 4.7669
1550 °C DSC 3.9 Ti2AlC 0.65 13.6143 3.0523
Ti3AlC2 0.20 18.4585 3.0685
Al2O3 0.14 12.9879 4.7552
When the XRD spectrum of the as-received Ti2AlC powder (Fig. 8a) is compared to one
after HPing the same powders at 1500°C for 4 h (Fig. 8b) it is obvious that Ti2AlC
converts to Ti3AlC2. Note that in most XRD spectra, the peak intensities are normalized
by the intensity of the internal standard Si peaks and are thus comparable on an absolute
scale. A comparison of the two spectra also leaves little doubt that HPing in general
reduces the peak intensities.

31
10 20 30 40 50 60 70 80
Inte
nsi
ty [
a.u
.]
2 [Degrees]
* TiC
^ Ti2AlC
+ Ti3AlC
2
> Si
>
> >
>
>
>
>
>
^ ^^^^
^
^^
^+
+
+
++ ++++ +++ +^
211-As Received
211-HP-1500
+
^>
>
(b)
(a)
Figure 8: XRD spectrum of, a) as-received Ti2AlC powder and, b) sample 211-HP-1500. Pure Si was added as an internal standard and all peaks were normalized to the Si peak at 28.44° 2Θ.
A typical backscattered electron SEM micrograph (Fig. 9a) of the same sample – that was
fully dense - showed the presence of two phases. The light grey phase, encompassing ≈
96% of the image area, is identified by EDS (Fig. 9b) to be Ti3AlC2, since the Ti:Al ratio
is ≈ 3.28±0.1 (e.g. points 1, 4 and 6, Fig. 9b). The darker grey, minority phase - making
up the remaining 4% of the imaged area - is an Al-Ti intermetallic (e.g. points 2, 3, 7 and
8, Fig. 9b). At 2.5±0.26, the Al:Ti ratio suggests its chemistry is between TiAl2 and
TiAl3. Speckles of a black phase, identified as Al2O3, covers less than 1% of the area. In
an attempt to find XRD evidence for Ti-Al intermetallics, a slow XRD scan was carried
out in the 41-48° 2Θ range of sample 211-HP-1500 (not shown). No peaks belonging to

32
any Ti-aluminide intermetallics were found, suggesting them to be amorphous or at least
nano-crystalline.
(a)
Atomic %
Point C K Al K Ti K O K Major Phase
1 29.52 16.39 54.09 -- Ti3AlC2
2 11.17 61.87 26.96 -- Al3Ti
3 9.95 65.46 24.59 -- Al3Ti
4 29.84 16.42 53.74 -- Ti3AlC2
5 4.58 31.75 6.76 56.91 Al2O3
6 29.71 16.44 53.85 -- Ti3AlC2
7 8.61 62.17 29.22 -- Al3Ti
8 10.47 64.91 24.62 -- Al3Ti
(b)
Figure 9: (a) Backscattered electron image of 211-HP-1500. b) EDS results of regions numbered in a. Three phases are present; light grey (Ti3AlC2), dark grey (AlxTi) and black (Al2O3).

33
b) Fiber Composite
When typical XRD diffractograms of HIPed composite samples are compared (Fig. 10) it
is obvious that, here again, HIPing results in, i) a diminution of the peak intensities
belonging to Ti2AlC; ii) peak broadening; iii) the emergence of peaks belonging to
Ti3AlC2 and TiCx (Figs. 10b, 10c and 10d). The latter are much more pronounced at 1500
°C, than at 1300 °C (compare Fig. 10a to 10b or 10d for e.g.). The transformation of the
sample containing 9 vol. % is also less than the one containing 46 vol. % Al2O3 fibers.
10 20 30 40 50 60 70 80
Inte
nsi
ty [
a.u
.]
2[Degrees]
10-17-HIP-1300
* TiC ^ Ti2AlC+ Ti
3AlC
2> Si ~ Al
3O
2
+
+
+
+
+
+
+
+
+
+
+
+
+
~ ~ ~ ~
*
~ ~ ~~
>
>
>
>
>
>
>
>
>
>
>
>
*
+
^ ^ ^^^^^
*
+^
* *
*
*
*
*
*
+ + +* ** +
+
+
+
10-9-HIP-1500
3-9-HIP-1500
10-46-HIP-1500
a
b
c
d
Figure 10: X-ray diffraction patterns of samples, a) 10-17-HIP-1300, b) 10-9-HIP-1500, c) 3-9-HIP-1500 and, d) 10-46-HIP-1500. All spectra normalized to 10 wt. % Si.
34
28 30 32 34 36 38 40 42 44
Inte
nsi
ty [
a.u.]
2 [Degrees]
* *
* TiC
Ti2AlC
Ti3AlC
2
Si
Al3O
2
9-1500
46-1500
17-1300
Figure 11: X-ray diffraction spectra from 28 to 44° 2Θ of samples 10-9-HIP-1500, 10-46-HIP-1500 and 10-17-HIP-1300.
Confirmation of these important conclusions can be found in Fig. 11, where slow XRD
spectra - from 28 to 44° 2Θ - of samples 10-9-HIP-1500, 10-46-HIP-1500 and 10 17-
HIP-1300 are compared. Here again, not only is the 211 phase retained after HIPing at
1300 °C for 4 h (red solid diamonds) but, as importantly, the TiC phase present in the
starting powder (Table 4) disappears.
The results of the Rietveld analysis of the 3Ti2AlC:Al2O3 powder mixture heated twice to
1410 °C in the DSC are listed in Table 4. Only three phases, Ti2AlC, Ti3AlC2 and Al2O3

35
were detected. Rietveld analysis of another sample, heated twice to 1550 °C in the DSC,
yielded very similar results (Table 4).
A polished and etched OM micrograph of sample 3-9-HIP-1500 is shown in Fig. 12a.
Comparing this figure with its XRD spectrum (Fig. 10c), three distinct phases can be
identified. The white phase is TiCx, the colored phase is Ti3AlC2 and the black phase,
which is a minority phase, and barely registers in the XRD pattern, is the Al2O3 fibers. In
previous work, we have shown that only when the Ti:A ratio is 3:1 does the etching result
in vivid, multicolored grains.[78]
We have also repeatedly shown that the easiest method
to differentiate between the Ti containing MAX phases and TiCy is to etch the samples:
the latter shows up as a white, or bright phase.[79-80]
. The polished and etched OM
micrograph of sample 10-17-HIP-1300 (Fig. 12b) is also consistent with this notion.
According to its XRD spectrum (Fig. 10a) the majority phase is Ti2AlC, which turns
brown upon etching. The colored phase is Ti3AlC2, and the dark, or black, areas are
alumina. Note that the top and bottom areas in Fig. 12b are not etched.

36
(a) (b)
(c) (d)
Figure 12: Polished and etched OM micrographs of sample; a) 3-9-HIP-1500. The multicolored phase is Ti3AlC2;
the white phase is TiCx; the dark regions are either porosity or Al2O3 fibers; b) 10-17-HIP-1300. The majority,
brown phase, is Ti2AlC and the colored phase is Ti3AlC2. The 3 μm diameter Al2O3 fibers appear black. c) and, d) 10-9-HIP-1500. The majority colored phase is Ti3AlC2; the minority white phase, TiCx.
The polished and etched OM micrographs (Figs. 12c and 12d) of sample 10-9-HIP-1500
also confirm the aforementioned conclusions. Consistent with its XRD pattern (Fig. 10b),
the colored phase must be Ti3AlC2 and the white phase, TiCx. Note that etching dissolves
the Ti-aluminide phases, if present.

37
Based on backscattered electron, SEM images of sample 3-9-HIP-1500 (Fig. 13a), also
shown in Fig. 12a, and the EDS results listed in the Fig. 13b, for the various locations
labeled in a, four phases are identified; Ti3AlC2 (pts. 3, 9 and 11), Ti3C2 (pts. 7, 8 and 10)
Al2O3 (pts. 1, 2 and 5) and a Ti-Si phase (pts. 4 and 6). As noted above, the contrast
between TiCx and Ti3AlC2 or Ti3SiC2 is weak in backscattered mode, which is why it is
imperative to combine etched OM micrographs with the latter.
(a)
Atomic %
Point Al K O K C K Si K Ti K Phase
1 37.06 62.94 -- -- -- Al2O3
2 37.16 62.84 -- -- -- Al2O3
3 9.87 -- 34.41 0.59 55.13 Ti3AlC2
4 2.86 -- 8.11 32.28 56.76 Ti2Si(C,Al)
5 34.29 61.15 2.15 1.15 1.26 Al2O3
6 2.5 -- 9.46 32.88 55.17 Ti2Si(C,Al)
7 3.99 -- 38.22 -- 57.59 Ti3C2
8 -- -- 39.69 -- 60.31 Ti3C2
9 16.08 -- 30.76 0.74 52.42 Ti3AlC2
10 -- -- 38.47 -- 61.53 Ti3C2
11 16.06 -- 28.43 0.86 54.66 Ti3AlC2
(b)
Figure 13: a) Backscattered electron, SEM image of sample 3-9-HIP-1500. b) Summary of EDS results for
various locations labeled in a. Based on EDS results four phases are identified; Ti3AlC2 (pts. 3, 9 and 11), Ti3C2
(pts. 7, 8 and 10), Al2O3 (pts. 1, 2 and 5) and a Ti-Si phase (pts. 4 and 6). The Si comes from the borosilicate glass used to encapsulate the samples during HIPing (see below).

38
Figure 14a shows a low magnification backscattered SEM micrograph of the interface
between sample 3-9-HIP-1500 (on right) and borosilicate glass (left). A higher
magnification micrograph is shown in Fig. 14b. EDS results of the various numbered
regions shown in Fig. 14b, are listed Fig. 14c. Based on these results the following
phases/regions are identified: an Al2O3 layer, a boron-rich minority phase and
borosilicate glass. (The boron and carbon concentrations should not be taken at face
value, but are included for the sake of completion). Additionally a bright Ti-Si rich
region, similar in composition to the bright areas found in Fig. 13 (e.g. pts. 4 and 6), is
present.
(a) (b)
Atomic %
Point
B
K
C
K
O
K
Na
K
Al
K
Si
K
K
K
Ti
K Phase
1 58.61 4.64 -- -- -- 13.3 -- 23.46 B Rich
2 -- 4.85 58.1 6.3 11.17 18.48 1.09 -- O Rich
3 -- 8.66 -- -- -- 36.17 -- 55.18 Ti-Si
4 -- 8.6 -- -- -- 58.73 -- 32.68 Ti-Si
5 -- -- 60.51 -- 39.49 -- -- -- Al2O3
6 -- 12.73 -- -- 1.31 33.9 -- 52.05 Ti-Si
7 -- 2.49 60.66 4.74 9.29 21.52 1.29 -- silicate glass
(c)
Figure 14: Backscattered electron SEM micrographs of sample 3-9-HIP-1500 near the borosilicate glass
interface at, (a) low magnification and, (b) higher magnification. EDS results of the various numbered locations in the SEM micrograph are listed in table shown below the micrograph.

39
Figures 15a and 15b show how the fibers‟ microstructure changes between processing at
1300°C and 1500°C. When processed at 1300°C (Fig. 15a), the 10 μm Al2O3 fibers
neither sinter together, nor appear to have reacted with the matrix, as greatly as they do at
1500°C (Fig. 15b).
(a)
(b)
Figure 15: Backscattered electron SEM images showing effect of temperature on Al2O3 fiber morphology, for
sample, a) 10-17-HIP-1300 and, b) 10-46-HIP-1500. The fibers in a appear to have retained their shape; those in b appear to have agglomerated and sintered together.

40
A typical TEM micrograph of a particle obtained from a sample of Ti2AlC, without
alumina, HPed at 1500 °C for 4 h is shown in Fig. 16a. The EDS confirming the presence
of Ti, Al and C is shown in Fig. 16b. A selected area diffraction of the same particle
(inset in Fig. 16) clearly shows the area imaged to be comprised of a large number of
nano-grains or domains.
(a) (b)
Figure 16: a) TEM image of a typical Ti2AlC particle after heat treatment, showing multiple nanograins. b)
EDS of particle shown in a indicating presence of Ti, Al and C. Top inset is selected area diffraction of same
particle showing multiplicity of grains.
The DSC results of the 3:1 molar ratio Ti2AlC:Al2O3 powder mixture, heated to 1410 °C,
(Fig. 17a) are for the most part featureless. A small, but observable endothermic event at
1350°C during heating, which is also mirrored upon cooling, can be discerned. The TGA
results of the sample heated to 1550 °C (Fig. 17b) show four regions of mass change: i) a

41
weight loss during the initial temperature increase, ii) a gradual mass gain until ≈ 1475°C,
at which temperature mass is lost, iii) mass loss continues upon cooling reaching a
minimum also ≈ 1475 °C, after which the sample gains weight down to ≈ 800 °C, after
which it levels off. The concomitant mass spectroscopy results, also shown Fig. 17b,
indicate the emission of several gaseous products such as CH4, CO2 and CO.
Figure 17: a) DSC of 3Ti2AlC:Al2O3 powder mixture heated to 1410 °C. A small endothermic peak registers at
~1350°C; on cooling a small exothermic peak is seen at around the same temperature. Inset shows DTA results
of same composition heated to 1550 °C. A broad exothermic peak centered around 1520 °C is observed on
cooling; b) TGA of sample heated to 1550 °C. Early mass loss is followed by mass gain and ultimately mass loss at T > 1450 °C. The gases evolved during heating are indicated on the figure.
2.1.4 Discussion
Based on the results presented above there is little doubt that at 1300 °C the Ti2AlC
structure is maintained (solid diamonds in Fig. 11) and that no reaction occurs between
the fiber and matrix (Fig. 15a). Upon heating to 1500 °C, however, Ti2AlC converts to
Ti3AlC2 (Figs. 10 and 11) in a transformation that depends on temperature, time and
“access” of Al to surroundings (see below). The question remaining is what are the
operative reactions. One possibility is for Ti2AlC to react with TiC and form Ti3AlC2.[81]

42
It is this reaction that most probably consumes the TiC present in the initial powder and
thus explains why neither the samples HIPed at 1300 °C (Fig. 11) nor those heated in the
DSC (Table 4) contained TiC. Note that after heating in the DSC the 211/312 ratio
decreases from ≈ 5 to 3 (Table 4).
The amount of TiC in the initial powder, however, is insufficient to convert all the 211 to
312. At higher temperatures Ti2AlC transform to Ti3AlC2 most probably according to the
following simplified reaction:
2 Ti2AlC = Ti3AlC2 + TiAl1-x + x Al (vap.) (2.1)
where x < 1. Note that the composition of the intermetallic formed depends on the
amount of Al lost to the surroundings. If one mole of Al were lost, pure Ti would remain.
However, before this can occur, the continued loss of Al should lead to the formation of
TiCx according to following simplified reaction:
Ti3AlC2 = Ti3C2 + Al (vap.) (2.2)
So the presence of TiCy in the final composite (Figs. 10c and d) is not too surprising.
Reaction 2.1 is simplified in the sense that we are not allowing any non-stoichiometry in
the Ti3AlC2 phase. Based on the various micrographs of the various samples (e.g. Fig. 9)
it is clear that the volume fraction of the TiAlx phase is significantly less than it should be
based on reaction 2.1. And while the exact reason for this state of affairs is not fully
understood, one, or more, of the following two arguments can be invoked. First, the TiAlx
– which is presumably a liquid at 1500 °C - is squeezed to the surface of the samples,

43
where it reacts with the surrounding glass in the HIP (see below) or the graphite foil
surrounding the samples in the HP. The evaporation of Ti cannot be ruled out at this time.
Second, the Ti3AlC2 phase contains excess Ti and possibly C. This conjecture is
consistent with the fact that the Ti/Al ratio of the Ti3AlC2 phase in Figs. 9 and 13 is
closer to 3.3, than it is to 3. Given the difficulty of accurately quantifying the C-content
in the EDS, more careful work is needed to explore whether the C/Al ratio also increases.
The apparent Ti and C excesses can be explained by an Al deficiency in the A-layers as
well as thickening of any TiCy layers sandwiched between the Ti3AlC2 planes. A similar
decomposition mechanism was reported for Ti3SiC2 (0001) thin films.[82]
The latter conclusion is also in tune with our understanding of how the MAX phases
react. Given the chemical stability of the Mn+1Xn blocks, and the fact that the A-layers are
relatively loosely held, by now it is fairly well established that the most common reaction
of the MAX phases is the selective loss/reaction of the A-group element. For example the
MAX phases do not melt congruently, but decompose peritectically into Mn+1Xn and the
A-group element. The decomposition temperatures vary over a wide range; from ≈ 850
°C for Cr2GaN [83]
to above 2300 °C for Ti3SiC2.[84]
The decomposition temperatures of
the Sn-containing ternaries range from 1200 to 1400 °C.[85]
Ti3SiC2 can be processed at
1600 °C in bulk form, but thin epitaxial films lose Si at temperatures as low as 1100
°C[82]
. Heating Ti3SiC2 in a C-rich atmosphere results in the loss of Si and the formation
of TiCx.[86]
When the same compound is placed in molted cryolite[78]
, or molten Al[87]
,
essentially the same reaction occurs: Si escapes and TiCy forms.

44
The effect of temperature on the transformation is best seen in Fig. 10; when the powder
was HIPed to 1300 °C, there was little change compared to the initial powder (compare
Figs. 8b and 10a). When the same powder was HIPed or HPed at 1500 °C for 4 h, it
disassociated to Ti3AlC2 (Fig. 8a and Figs. 10b-d). After the two rapid consecutive DSC
runs to 1410 °C and 1550 °C only a small fraction of the initial Ti2AlC dissociated.
The evidence for the presence of an amorphous Ti-aluminide phase is multifold. It is
clearly seen at the boundaries between the Ti3AlC2 grains (Fig. 9). A broad exothermic
peak, centered around 1520 °C, is observed just upon cooling in the DTA (inset in Fig.
17a). Since no peaks belonging to any Ti-aluminide phases were observed in any of the
XRD spectra they must be amorphous or nano-crystalline. Finally, a few Ti-rich nano
particles, that SAD showed to be amorphous (not shown), were imaged in the TEM. In
another region, an Al-rich, Ti-aluminide particle was found that was not amorphous.
SAD showed it be the tetragonal intermetallic Al0.64Ti0.36 (ICSD-file 50-0726) with lattice
parameter, a = b = 4.0296 Å; the c lattice parameter was 2.9561 Å.
Using the Scherer formula the average particle size of the Ti3AlC2 phase formed during
the DSC run is estimated to be ≈ 12 ± 3 nm, a conclusion confirmed by TEM (Fig. 16 and
its inset). This is an important result since it can explain both the general diminution of
the MAX phase peaks upon heating, as well as suggesting a relatively easy method to
produce nano-grains of the MAX phases. The very fine nature of the grains that form
suggest that they formed by a nucleation and growth process. Had the 211 to 312
transformation occurred by a rearrangement of the number of TiCx layers in between the

45
Al planes – i.e. by a topotaxial or intergrowth process - larger grains would most
probably have formed.
The evidence for the loss of Al from the system is also clear and multifold. Given its low
melting point relative to Ti it is likely that the majority of the weight loss at T > 1475 °C
is due to the loss of Al. The initial weight loss during heating in Fig. 17b is due to the loss
of moisture and other adsorbed gases from the powder compact. It is presumably the
reaction between moisture and C in the compact that produces CH4, CH2, CO and CO2.
The weight gain between ≈ 800 °C and 1475 °C is presumably due to oxidation. Why that
increases the oxygen concentration (Fig. 17b) however, is unclear. The relatively sharp
mass loss around 1475 °C that continues as the sample is cooled (Fig. 17b) is presumably
due to the loss of Al from the system. The reason Al or AlO were not detected by the
mass spectrometer (Fig. 17b) is most probably due to the condensation of these gases in
the tubes connecting the reaction chamber to the mass spectrometer.
Figure 14 not only shows that the Al is highly mobile, but, as important, that it reacts
with the surrounding glass. Since alumina is thermodynamically more stable than silica,
then the most likely simplified reaction is:
boro-silicate glass + yTiAl2 = yAl2O3 + TiSiz (2.3)
In other words, the Al reduces the Si in the glass. This reaction explains the presence of
an almost continuous layer of both Al2O3 and TiSiz near the glass/sample interface (Figs.
14a and b). It also explains the presence of TiSiz pockets deep within the sample (Figs.

46
13a and b). Note that the morphology of the TiSiz phase formed (Fig. 13a and Figs. 14a
and b) strongly suggests that it was liquid when it formed.
The results presented herein do not necessarily imply that Ti2AlC is unstable at
temperatures > 1400 °C. After all the first successful bulk synthesis of this compound
was carried out by HPing elemental powders for 4 h at 1600 °C.[37]
The answer to this
apparent paradox, for which there is some confusion in the literature, has to do with the
free energy change, ΔG, of reaction 2.1 or one that transforms Ti2AlC to TiCx directly. In
an open system, where the activity of Al in the surroundings is vanishingly small, ΔG
will be negative at all temperatures. In other words, the MAX phases are only kinetically
stable. This is seen here in that the DSC sample rapidly heated to, and cooled from,
1550°C only marginally transformed to Ti3AlC2, while the sample heated to 1500 °C for
4 h did.
This insight also explains why samples in which the volume fraction of fibers was high
tended to dissociate more. Presumably the fibers delayed densification long enough to
allow much of the Al and Ti to escape into the vacuum of the hot press or react with the
encapsulating glass during HIPing. The main evidence for this conjecture can be seen in
comparing the SEM micrographs of sample 211-HP-1500 (Fig. 9) and 3-9-HIP-1500
(Fig. 13). In the both cases, the major phase present is Ti3AlC2, however, with the
incorporation of fiber in the latter, no Ti-Al was found within the bulk of the sample.

47
The results presented herein suggest that alumina fibers can be used to reinforce Ti3AlC2
and/or Ti2AlC, if the latter does not decompose (Fig. 15a). However, based on this work,
1300 °C may be near the maximum processing temperature, not because the fibers react
with the matrix – they do not - but because at 1500 °C they sinter together (Fig. 15b) and
presumably lose their load bearing capabilities. If more stable Al2O3 fibers can be found,
the results shown here suggest that they can be used to reinforce Ti2AlC and/or Ti3AlC2.
2.1.5 Summary and Conclusions
Fully dense, alumina fiber-reinforced composites can be fabricated, at temperatures as
low as 1300 °C, by HIPing or HPing commercially available Ti2AlC powders with 3-10
μm alumina fibers for 4 h. At 1500 °C, the alumina fibers sinter together and as
importantly, the loss of Al to the surrounding results in the dissociation of Ti2AlC into
Ti3AlC2 and TiAlx. If the loss of Al is severe, the ultimate phase remaining would be
TiCy. The loss of Ti by evaporation/reaction at 1500 °C cannot be ruled out at this time.
Since the MAX phases can only be kinetically stable when heated in an environment in
which the activity of the A-element is vanishingly small, it is not surprising that the
aforementioned transformation reaction is time, temperature and densification rate
dependent. Low temperature, short times and rapid densification decrease the propensity
of dissociation at high temperatures.

48
2.2 Ti2AlC:SiC
2.2.1 Synthesis
Ti2AlC powder [- 325 mesh, 3one2, Voorhees, NJ] was combined with 140 µm diameter
SiC fibers [Avco Specialty Materials, Lowell, MA] or 10 µm diameter SiC fibers
[Nippon Carbon Co. Ltd., Tokyo, Japan]. Hot-pressig (HPing) or hot isostatic pressing
(HIPing) was used to densify the samples.
Techniques for combining the powder and fibers was completed in one of two ways; i) in
situ layering of powder layers, interspersed with layers of 140 µm diameter fibers and, ii)
dry mixing powder and 10 µm fibers in a plastic bottle.
Table 5: Summary of runs made with Ti2AlC matrix and SiC fibers. Column 1 lists the fiber diameter, 211;
column 2 the matrix/fiber molar ratio. The key to the label listed in column 7 is: fiber vol. fraction or blank
when no fiber was added, followed by 211 (for Ti2AlC powder), followed by consolidation method or DSC and
last the processing temperature. The processing time was 3 or 4 h.
Fiber
Dia.
(µm)
Molar
Ratio Vol. %
Proc.
Meth. T (°C)
Time
(h) Label
N/A N/A N/A HP 1400 3 211-HP-1400
10 3:1 12 HP 1400 3 12-211-HP-1400
10 16.4:1 2 HP 1400 3 2-211-HP-1400
140 12.3:1 3 HIP 1300 4 3-211-HIP-1300
140 3:1 9 HIP 1500 4 9-211-HIP-1500
N/A 2:1 16 DSC 1550 N/A 211-DSC-1550
N/A 2:1 16 DSC 1410 N/A 211-DSC-1410
HIP = Hot Isostatic Press
HP = Hot Press
DSC = Differential Scanning Calirometry
^ = Powder [Superior Graphite, Chicago, IL]
HIPed samples were first pressed into green bodies utilizing steel dies, 12.5 x 70 mm
2 in
size, loaded corresponding to a pressure of 57 MPa for 60 s. Polyvinyl alcohol was added

49
as binder on an as needed basis (≈ 5 ml per 15 grams of powder). The green bars were
embedded in a borosilicate glass powder [Fisher Scientific, Pittsburgh, PA] and brought
to temperatures ranging from 1300-1500 °C at a rate of 10 °C/min and held for 4 h. The
Ar pressure at temperature was 110 MPa.
The HPed samples utilized a graphite-heated hot press [Series 3600, Centorr Vacuum
Industries, Somerville, MA] under vacuum of 10-2
torr, which was ramped at 500 °C/h to
1400 °C and held for 3-4 h under a pressure of 10-20 MPa. Green bodies were prepared
directly in the 38 mm graphite dies that were used during synthesis according to
previously described methods above.
Differential thermal analysis, DTA, was carried out on a 2:1 molar ratio of Ti2AlC to SiC
powders [Superior Graphite, Chicago, IL], in a He atmosphere. The powders were ball
milled for ≈ 12 h and compacted into green bodies with a small pellet press. The latter
were then heated at 20 °C/min up to 1410 °C or 1550 °C in a combined differential
scanning calorimetry/thermogravimetric unit [Netzsch-STA 449 C Jupiter®, Selb,
Germany]. The unit was also equipped with a mass spectrometer [Netzsch-QMS 403 C
Aëolos®, Selb, Germany]. Each sample was heated twice to the same maximum
temperature.

50
2.2.2 Characterization
For post synthesis characterization, the HIPed and HPed samples were filed using a
diamond coated needle file into powders for X-ray diffraction (XRD) on a diffractometer
[Model D500, Siemens, Karlsruhe, Germany]. In most cases, pure silicon, Si, powder
(~10 wt. %) was added as an internal standard. Scans were carried out with Cu Kα
radiation (40 kV and 30 mA) at rates of 1.2 or 2.4 deg (2Θ)/min, using steps of 0.02 and
0.04 deg, respectively.
For microstructural analysis, samples were cut with a precision diamond saw [Struers
Accutom-5, Westlake, OH], mounted and polished to a 1 µm diamond suspension.
Microstructure and elemental analysis were carried in a SEM [Zeiss Supra 50VP,
Thornwood, NY] equipped with an energy-dispersive spectroscope (EDS) [Oxford Inca
X-Sight, Oxfordshire, UK].
Selected surfaces were then etched with a 1:1:1 ratio of water and concentrated HF and
HNO3 for 5 s and immediately rinsed with water. The fiber/matrix interface was observed
with an OM, [Olympus PMG3, Center Valley, PA or Keyence, VHX 600, Woodcliff
Lake, NJ].
A TEM [FEI Tecnai, G2 TF 20, Hillsboro, Oregon] was also used on particles from the
2:1 pellets heated in the DSC. The TEM sample was prepared by dispersing powders in
ethanol and depositing the solution onto a holey carbon grid.

51
2.2.3 Results
XRD spectra of the as-received powders and a bulk Ti2AlC sample HPed at 1400 °C
(211-HP-1400) are shown in Figs. 18 a and b, respectively. In both cases, the majority
phase is Ti2AlC. Rietveld analysis of the as-received powders (Table 4), however,
indicated that the starting Ti2AlC powder contained ≈ 19 mol.% TiC and ≈ 14 mol.%
Ti3AlC2. The former two phases tend to react together to produce Ti3AlC2 at temperatures
as low as 1300 °C[2]
. Said otherwise, the starting matrix contained ≈ 15 mol.% Ti3AlC2.
10 20 30 40 50 60 70 80
Inte
nsi
ty [
a.u.]
2 [Degrees]
a
b
c
d* *
* *
* ** * *
* ** * *
* ** * *
* Si
^^ ^
^ TiC
~Ti
2AlCx
Ti3AlC
2
Ti3SiC
2
xx
x
x x xx
x x
x
x x x x
~ ~
~ ~
~
~
~~ ~~ ~ ~
~ ~~ ~
~~ ~
~
~
~
~ ~
^ ^
^^
Figure 18: XRD spectra of (a) As received Ti2AlC powder [3ONE2], (b) 211-HP-1400 (c) 2-211-HP-1400 and (d) 12-211-HP-1400. In all spectra ~ 10 wt. % pure Si powder was added for reference.
The XRD spectra of samples 2-211-HP-1400 and 12-211-HP-1400 are shown in Figs.
18c and 18d, respectively. Both samples were HPed at 1400 °C, but the latter had 6 times

52
more SiC than the former. In both cases, the major phase is Ti3AlC2. The sample with
more SiC, however, not only contains more TiCy, but the location of the most intense
peak shifts towards Ti3SiC2. Both observations are more clearly seen when the foregoing
spectra are superimposed on those of the powders ran through the DSC to 1550 °C (Fig.
19a). A perusal of these results establishes that: i) the DSC sample - a 2:1 molar mixture
of Ti2AlC and SiC powders - transformed to Ti3SiC2 and Al. This conclusion is
confirmed and quantified in Table 6 (see below); ii) the sample containing 2 vol. % SiC,
viz. 2-211-HP-1400, transformed mostly to Ti3AlC2; iii) sample containing 12 vol. %
SiC, is in between the two.
Table 6: Summary of Rietveld analysis results of as-received 2Ti2AlC + SiC powder mixture, and those of
samples 211-DSC-1410 and 211-DSC-1550. The powder mixture was heated in the DSC at 20 °C/min to 1410 °C
or 1550 °C and immediately cooled at same rate.
Phases Molar
Fraction
Lattice Parameters Comments
C (Å) a = b (Å)
2 Ti2AlC + SiC as-received powder mixture
Ti2AlC 0.49 13.6946 3.0600 Goodness of fit;
χ2 = 5.82 TiCy 0.14 4.3093
SiC 0.27 15.0750 3.0532
Ti3AlC2 0.09 18.5400 3.0652
2 Ti2AlC + SiC powder mixture heated to 1410 °C
Ti3SiC2 0.29 17.7022 3.0690 Goodness of fit;
χ2 = 3.82 TiCy 0.50 4.3310
Al 0.17 4.0584
Al2O3 0.03 12.9880 4.7787
Al4O12SiTi2 0.01 9.4460 3.8014
2 Ti2AlC + SiC powder mixture heated to 1550 °C
Ti3SiC2 0.27 17.6877 3.0682 Goodness of fit;
χ2 = 4.23 TiCy 0.36 4.3257
Al 0.30 4.0499
Al2O3 0.06 12.8847 4.8091
Al4O12SiTi2 0.01 9.4745 3.7756

53
36 38 40 42 44
Inte
nsi
ty [
a.u
]
2[Degrees]
Ti3SiC
2Ti
3AlC
2
TiC
Ti3SiC
2
Ti3AlC
2
*
* Al
211-DSC-1550
12-211-HP-1400
2-211-HP-1400
^
~
^
^
~
~
(a)
10 20 30 40 50 60 70 80 90
Inte
nsi
ty [
a.u
.]
2 [Degrees]
^ TiC
Ti3SiC
2
^^
^
^
^
(b)
Figure 19: XRD pattern of, a) samples 2-211-HP-1400, 12-211-HP-1400 and the 2:1 molar ratio of Ti2AlC and
SiC powders used for thermal analysis. The red dotted line represents the 2Θ location of the most Ti3AlC2,
intense peak; the black dotted line refers to the 2Θ location of the most intense Ti3SiC2 peak. One can observe
that with an increase of SiC the strongest peak shifts from left (Ti3AlC2) to right (Ti3SiC2). (b) 2Ti2AlC:SiC powders heated to 1550°C in DSC.

54
The XRD diffraction spectrum of sample 211-DSC-1550 is shown in Fig. 19b. Summary
of the Rietveld analysis - shown in Table 6 – confirm that the sample transformed to
Ti3SiC2, TiCy and Al. Traces of alumina and Al4SiTi2O12 are also found.
(a) (b)
Figure 20: OM micrograph of Ti2AlC sample reinforced with 140 µm SiC. fiber; (a) 3-211-HIP-1300 in the as
polished condition. (b) OM of 9-211-HIP-1500 etched with a 1:1:1 solution of water and concentrated HF and
HNO3 for 5 s. The white phase is TiC and the colored phase is Ti3(Si1-x,Alx)C2.
A typical polished OM micrograph of sample 3-211-HIP-1300, reinforced with the 140
µm diameter SiC fibers, is shown in Fig. 20a; a polished and etched OM micrograph of
sample 9-211-HIP-1500 is shown in Fig. 20b. Both micrographs clearly show that the
140 µm diameter of the SiC fibers was greatly diminished and resulted in the formation
of a TiC layer – white phase in Fig. 20b – where the fiber used to be. Where the fibers
clustered, (e.g. top left in Fig. 20a) the reaction is less severe and the initial fiber diameter
is partially maintained.
A backscattered SEM micrograph of sample 9-211-HIP-1500 (Fig. 21a) shows the
presence of 4 distinct regions that EDS (Fig. 21b) indicates are, from inside out: carbon,

55
SiC, TiCx, with x ≈ 0.66, and a Ti3(Al,Si)C2 solid solution. The EDS results are
consistent with the fact that TiCx etches white and the 312 phases color when etched[78-80]
(Note that the Avco fibers are CVD fibers deposited on graphite cores). A fifth grey
region (points 1 to 3) is an Al-rich layer containing Ti, with a Al:Ti ratio is ≈ 2.6.
(a)
Atomic %
Point C K Al K Si K Ti K O K Phase
1 15.78 56.92 1.41 25.89 -- Al2Ti, Al3Ti(C)
1 9.95 64.43 1.47 24.15 -- Al3Ti(C)
2 7.94 65.53 1.59 24.94 -- Al3Ti(C)
3 9.46 64.7 1.12 24.71 -- Al3Ti(C)
4 96.81 -- -- -- 1.76 Carbon
5 51.5 -- 48.5 -- -- SiC
6 51.53 -- 48.47 -- -- SiC
7 40.57 -- -- 59.43 -- Ti3C2
8 43.11 -- -- 56.89 -- Ti3C2
9 30.69 14.23 2.48 52.6 -- Ti3(Al,Si)C2
10 31.23 13.84 2.78 52.15 -- Ti3(Al,Si)C2
(b)
Figure 21: a) Backscattered SEM image of sample 9-211-HIP-1500, b) EDS quantification of various regions marked in a.

56
EDS of a typical TEM micrograph of sample 211-DSC-1550 (Fig. 22) confirmed the
solid solution nature of the Ti3(Al,Si)C2. Note that the Al/Si ratio is not uniform across
the sample and that this particle is Si-rich as compared to those shown in Fig. 21.
Figure 22: TEM micrograph of a single particle of 211-DSC-1550 sample heated to 1550°C. Inset shows the EDS
spectra of the various regions marked.
The DSC results of the 2Ti2AlC:SiC mixture (211-DSC-1550) are shown in Fig. 23. The
DSC run to 1410 °C (Fig. 23a), shows three specific events. Upon initial heating, there is
an exothermic peak at ≈ 1160 °C, followed by an endothermic peak at ≈ 1230 °C. Upon
cooling, a relatively small, exothermic peak is observed at ≈ 680 °C. In the sample heated
to 1550 °C (not shown), the first two events are present, but with smaller intensities, and
the event at 680 °C is absent.

57
The TGA data to 1550 °C (Fig. 23b) exhibits four regimes. An initial mass loss followed
by an increase starting at a temperature of approximately 400 °C. This increase continues
until 1450 °C, close to the maximum temperature of the experiment. At this point a mass
loss begins and continues until the temperature reaches a maximum and then decreases
again to 1450 °C. From 1450 °C to 950 °C mass is gained, after which no more weight
changes are recorded.
-3
-2.5
-2
-1.5
-1
-0.5
0
0.5
0 500 1000 1500
Q/(
W/g
)
T (°C)
(a)
99
99.5
100
100.5
101
0 400 800 1200 1600
Mas
s/%
Ion
Cu
rrent [a.u
.]
T (°C)
CO
CH2
CO2
O2
CH4
(b)
Figure 23: (a) The DSC data for 2Ti2AlC:SiC powders heated to a temperature of 1410°C and instantly cooled
at the same heating rate, (b) shows the TGA data for the same compaction but to a max temperature of 1550°C
with mass spectroscopy.
XRD of the powder (Fig. 19b), after the excursion to 1550 °C indicates the majority
phases are Ti3SiC2 and TiC. The mass spectrometry data (Fig. 23b) indicate the existence
of CH4, O2, CO2, CH2, and CO due a combination of air in the system and drying of the
pellet.

58
2.2.4 Discussion
Based on the aforementioned results, it is reasonable to conclude that SiC reacts with
Ti2AlC according to the following, simplified reaction;
2 Ti2AlC + x SiC = Ti3(Al1-x,Six)C2 + Al1+xTi1-x + x TiC (2.4)
where x ranges from 0 to 1. The reaction is simplified because it assumes the Ti to C ratio
in TiC to be 1 and no loss of the Al to evaporation. Even in the absence of SiC, 211 still
converts to 312, while rejecting a mole of Al and Ti atoms for every 2 moles of 211[2]
. It
is also important to note that the fraction of Si in the solid solution is a function of
starting SiC content, i.e. x. At the x = 1 limit, pure Al is formed according to:
2 Ti2AlC + SiC = Ti3SiC2 + 2 Al + TiC (2.5)
The presence of Al is clearly evidenced in the Rietveld analysis (Table 6) and the
exothermic peak at 680 °C upon cooling from 1410 °C in the DSC (Fig. 23a).
The DSC results (Fig. 23a) suggest that reaction 2.4 is initially exothermic and starts ≈
1170 °C. The endothermic peak observed at 1230 °C is presumably due to the melting of
the Al when it comes out of the 312 lattice. To confirm this conjecture, the same sample
was re-heated to 1410 °C a second time. The 1230°C endothermic peak was greatly
diminished. Intriguingly, and for reasons that are unclear, a relatively large, double
endothermic peak at ≈ 900 °C was observed upon re-heating. The origin of this peak, and
why it does not occur at ≈ 680 °C, is unclear. Interestingly, upon cooling the second time,
a clear peak at 680 °C is still clearly visible.
59
According to reaction 2.5, starting with a 2:1 Ti2AlC:SiC molar ratio, should result in
pure Al, Ti3SiC2 and TiC as observed (see Table 6). The a and c-lattice parameters of
Ti3SiC2 are 3.0665 Å and 17.671 Å, respectively; the corresponding values for Ti3AlC2
are 3.075 Å and 18.578 Å. Based on the results listed in Table 6, it is obvious that the
measured lattice parameters are closer to the former than the latter. The lattice
parameters of TiCy are a function of y. Based on the lattice parameter measured, viz.
4.089 Å (Table 6), and literature data[29]
it is reasonable to assume y = 0.9.
For the other runs, x was < 1. In the latter situation a Ti3(Al1-x,Six)C2 solid solution,
whose Si content scales with x is expected and observed. This is best seen in Fig. 19a,
where the major 312 peak shifts from that near the location of the Ti3AlC2 peak to that of
the Ti3SiC2 peak position with increasing x. In other words, the Si atoms prefer to be in
the 312 structure than bonded to C in SiC.
The Ti-Al intermetallic phase appears at the grain boundaries (pts. 1-3 in Fig. 21). This
phase, is similar in morphology and chemistry to that found when Ti2AlC is heated to
1500 °C (Fig. 9) [2]
. In other words, it is most likely a result of the dissociation of the
Ti2AlC, and not necessarily due to a reaction with SiC. Consistent with reaction 2.4, the
intensities of the TiCy peaks appear to increase with increasing SiC content (Fig. 19).
That a reaction occurs between the SiC fiber and Ti2AlC to form TiC is clearly shown in
Fig. 20. The original fiber diameter was 140 µm; after heating to a temperature as low as
1300 °C for 4 h, the fiber diameters were significantly reduced. Where the fibers bundle

60
together, they shielded each other from reaction and form 3-sided shapes as shown on the
left in Fig. 20a. The etched OM micrograph, shown in Fig. 20b, further confirm the
occurrence of a reaction. When etched, TiCy is white, and the 312 MAX phases color[78-
80]. The latter is confirmed because neither the 211 or 413 MAX chemistries color; only
the 312‟s. The TEM/EDS micrographs, Fig. 22, of the DSC powders taken to 1550 °C
confirm that a Si-rich solid solution forms. Interestingly upon cooling of the latter, no
exothermic peak at 680 °C was observed. The most likely explanation is that at least a
fraction of the Al evaporated as evidenced by the weight loss observed (Fig. 23b). Note
that a weight loss is recorded in spite of the fact that the sample was oxidizing slowly –
i.e. gaining weight - starting at about 800 °C.
2.2.5 Summary and Conclusions
HIPing or HPing, in the 1300-1500 °C temperature range, of Ti2AlC powder with SiC
fibers or powders resulted in fully dense composites. Based on the totality of our results
we conclude that in the case of Ti2AlC, the following reaction occurs:
2 Ti2AlC + x SiC = Ti3(Al1-x,Six)C2 + Al1+xTi1-x + x TiC.
It thus follows that SiC fibers and/or powders cannot be used to reinforce commercially
available Ti2AlC powders.

61
2.3 Ti3SiC2:TiC:SiC
2.3.1 Synthesis
a. Bulk Ti3SiC2-TiC
Commercial Ti3SiC2 powder [-325 mesh, 3-ONE-2, Voorhees, NJ], which had approx. 16
vol.% TiCx phase – calculated from post-synthesis image analysis – was HPed into a 63.5
mm diameter disc in order to establish a baseline. This fiber-free sample will henceforth,
be labeled as 312-HP-1500. The raw powder was poured into a graphite foil lined
graphite die and placed into the HP [Series 3600, Centorr Vacuum Industries, Somerville,
MA]. The temperature in the HP was increased at a rate of 500 °C/h, to 1500 °C and held
for 4 h in vacuum (10-2
torr). At temperature, a uniaxial pressure of 11.5 MPa was
applied and held. After 4 h, the pressure was released and the sample was allowed to
furnace cool.
b. Ti3SiC2:TiC:SiC Composites
The same Ti3SiC2 powder [-325 mesh, 3-ONE-2, Voorhees, NJ] was used to prepare two
composite samples with the 140 µm diameter SiC fibers [Avco Specialty Materials,
Lowell, MA]. Layers of fibers were produced by laying individual fibers in a mold. The
mold was a slab of Al that had grooves spaced 200 µm apart. Fibers were then taped at
the ends so a single layer, evenly spaced, could be incorporated into the powders. Each
fiber plane, layer, was then interspersed with alternating layers of powder (see Fig. 25a).

62
Table 7: Summary of runs made with Ti3SiC2 matrix and SiC fibers. Column 1 lists the fiber diameter; column 2
the matrix/fiber molar ratio. The key to the label listed in column 7 is: fiber vol. fraction or blank when no fiber
was added, followed by 312 (for Ti3SiC2 powder), followed by consolidation method, HP for hot pressing, and
last the processing temperature. The processing time was 4 h.
Fiber
Dia.
(µm)
Molar
Ratio Vol. %
Proc.
Meth.
T
(°C)
Time
(h) Label
N/A N/A N/A HP 1500 4 312-HP-1500
140 13.6:1 2 HP 1500 4 2-312-HP-1500
140 3:1 9 HP 1500 4 9-312-HP-1500
Samples were HPed in the same manner as the monolithic sample, in cylindrical graphite
dies with diameters of 38 mm or 63.5 mm. Pressed to a uniaxial pressure of 11.5 MPa at
a temperature of 1500 °C in a mechanical (10-2
torr) vacuum for 4 h.
2.3.2 Characterization
The microstructure of the Ti3SiC2:TiC, monolithic and the fiber/matrix interface of the
Ti3SiC2:TiC:SiC, composite, samples were observed using an OM [Olympus PMG3,
Center Valley, PA]. Samples were cut from the bulk with a precision diamond saw
[Struers Accutom-5, Westlake, OH], mounted and polished to 1 µm diamond solution. In
order to study the grain size, samples were then etched with a 1:1:1 combination of
concentrated HNO3:HF:H2O and observed under an OM.
XRD was also completed to determine the phases present in the pre- and post-fabricated
samples. The powders used for XRD were taken by filing with a diamond coated needle
file. In most cases, 10 wt % pure silicon, Si, powder was used as an internal standard.
Using an x-ray diffractometer [Model 500D, Siemens, Karlsruhe, Germany] scans were

63
made with Cu Kα radiation (40 kV and 30 mA) at rates of 1.2 or 2.4 deg (2Θ)/min, using
steps of 0.02 and 0.04 deg, respectively
2.3.3 Results and Discussion
In contradistinction to Ti2AlC discussed in section 2.2, the Ti3SiC2 powders do not react
with SiC even at temperatures as high as 1500 °C. This is best seen when XRD spectra of
the as-received powders and two samples (Fig. 24) – one with and the other without
fibers - HPed to 1500 °C are compared. In addition to Ti3SiC2, the starting powder
contained TiCx. The resulting majority phases of both matrices of the monolithic Ti3SiC2
and fiber composite Ti3SiC2 samples are Ti3SiC2 and TiCy.
25 30 35 40 45 50 55 60
Inte
nsi
ty [
a.u
.]
2 [Degrees]
TiCTi3SiC
2 ^
9-312-HP-1500
312-HP-1500
As Rec. Ti3SiC
2 [3-one-2]
* Si
* ^ ^
* ^
* ^
^
^
Figure 24: XRD of samples 9-312-HP-1500, 312-HP-1500 and Ti3SiC2 powder (as received from 3-one-2).
Pure Si powder ~ 10 wt. %, was added as an internal reference.

64
The diffractogram (Fig. 24), shows a diminution in intensities of the Ti3SiC2 peaks
similar to those in sections 2.1 and 2.2 (Figs. 10 and 18). The reason for this diminution
in intensities is unknown at this time. The intensities of the TiCy appear to stay relatively
constant with respect to the added Si.
More direct evidence for the lack of a reaction is shown in OM micrograph (Fig. 25a and
b) of sample 9-312-HP-1500. Unlike the fibers in the Ti2AlC matrix (Fig. 20a and b), in
this case there is clearly no reaction. The fiber/matrix interface is sharp and the fiber
diameter is maintained at its original value of 140 µm. The Ti3SiC2 forms a dense matrix
even in the case where the SiC fibers are only a few microns apart from one another, as
can be seen in Fig. 25a.
(a) (b)
Figure 25: OM of polished surface of sample 9-312-HP-1500. (a) at low magnification and, b) at higher
magnification. Here the fiber and matrix do not interact and fibers/matrix interface is clean. Sample is dense and no porosity exists even when fibers are less than 100 µm apart.
In order to measure the grain size of the specimens, polished surfaces were etched with a
1:1:1 solution of H2O and concentrated HF and HNO3. A typical etched surface can be
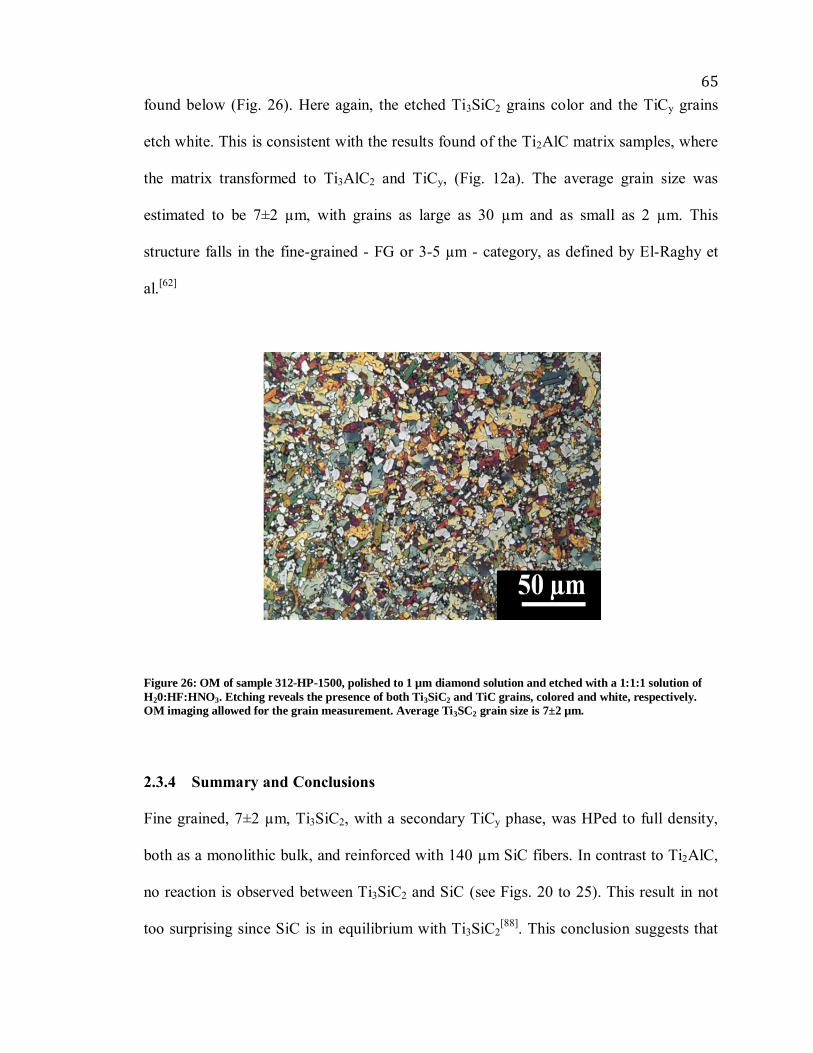
65
found below (Fig. 26). Here again, the etched Ti3SiC2 grains color and the TiCy grains
etch white. This is consistent with the results found of the Ti2AlC matrix samples, where
the matrix transformed to Ti3AlC2 and TiCy, (Fig. 12a). The average grain size was
estimated to be 7±2 µm, with grains as large as 30 µm and as small as 2 µm. This
structure falls in the fine-grained - FG or 3-5 µm - category, as defined by El-Raghy et
al.[62]
Figure 26: OM of sample 312-HP-1500, polished to 1 µm diamond solution and etched with a 1:1:1 solution of
H20:HF:HNO3. Etching reveals the presence of both Ti3SiC2 and TiC grains, colored and white, respectively.
OM imaging allowed for the grain measurement. Average Ti3SC2 grain size is 7±2 µm.
2.3.4 Summary and Conclusions
Fine grained, 7±2 µm, Ti3SiC2, with a secondary TiCy phase, was HPed to full density,
both as a monolithic bulk, and reinforced with 140 µm SiC fibers. In contrast to Ti2AlC,
no reaction is observed between Ti3SiC2 and SiC (see Figs. 20 to 25). This result in not
too surprising since SiC is in equilibrium with Ti3SiC2[88]
. This conclusion suggests that

66
SiC reinforced Ti3SiC2 matrix composites can be utilized as high temperature materials.
The next stage in this research was to characterize the creep response of the composites
and establish whether the addition of fibers enhances the creep properties.

67
CHAPTER 3. HIGH TEMPERATURE MECHANICAL RESPONSE RESULTS –
CREEP
3.1 Set-Up and Parameters
The creep testing for this work was completed at Drexel University. The testing apparatus
consisted of a furnace and a load cell that measured the applied force. A voltmeter and
power-supply were used in union with the load cell in order to obtain accurate readings.
The force in the system was applied by an air compressor and the strain was measured by
a laser system made up of a laser transmitter and laser controller. A diagram of the set-up
can be found below (Fig. 27). Samples were then affixed between the SiC rods by SiC
pins that fit holes in the ends of dog-bone specimens (see below). This system is based on
the one developed by Carroll and Wiederhorn for the high temperature testing of
ceramics.[89]
(a) (b)
Figure 27: Diagrams of creep testing equipment. (a) A general depiction of all points in the creep testing
apparatus. (b) A more specific schematic of the inside of the furnace, showing the SiC rods in which the test specimen is placed.

68
Samples were prepared according to specifications set forth by the National Institute of
Standards and Technology, NIST. In this work, we utilized SR30 and SR51 samples,
whose dimensions are shown in Fig. 28a. Three specimens were successfully prepared at
the Pennsylvania College of Technology [Williamsport, PA, USA] with wire electro-
discharge machining, EDM, using regular carbide settings.
(a)
(b)
Figure 28: (a) Schematics of the dog-bone specimens used in this work. Dimensions are based on NIST
standards for the high temperature, mechanical testing of ceramics. (b) Photograph of SR30 composite sample
with champfered corners. Champfering was completed on SR30 samples in order to produce the maximum
number of samples from bulk discs. Scale is in inches.

69
As stated above, strain was measured with the aid of a laser-system. SiC flags were
attached to the gauge of the SR51 specimens, at a slight angle in order to lock them into
position (Fig. 29a). During the experiments, the flags become permanently affixed to the
sample due to the latter‟s oxidation. The SR30 specimens were too short to affix the flags
since the SiC rods overlapped too far and the space available could not accommodate the
SiC flags. In this case, the rods themselves were then used as markers, (Fig. 29b).
(a) (b)
Figure 29: Schematic of test specimens seen in Fig. 28. (a) SR51 test specimen with attached SiC flags, used as
guides for the laser extensometer to record the strain. (b) For the SR30 specimen, where the gauge length was
too small to affix SiC flags, the SiC rods themselves were used instead as points of reference for the strain measurement.
The laser system measured the strain changes. In the case where SiC flags were used,
SR51 specimens, the system would measure the difference in distance between the flags
on the specimen. Where the SiC rods were used, SR30 specimens, the system would

70
measure the difference in distance between the rods. Then the laser system controller
would calculate the strain change values by the data collected.
Before every experiment, the initial distance, Lo, between the SiC flags, or rods in the
case of the SR30 specimens, was measured and programmed into the controller in order
to zero out the calculation with the following equation:
0
0
L
LL
(3.1)
In Eq. (3.1), is strain, L is the distance change between flags, or rods, which is
measured by the laser system every second.
3.2 Bulk Ti3SiC2:TiC Samples
Two tests were successfully completed on the Ti3SiC2:TiC sample, one SR30 and one
SR51. Each test was completed using the same set-up. Once the specimen was placed in
the apparatus, as discussed above, it was subjected to an initial load. The load, however,
was nominal and only applied in order to maintain alignment of the specimen during set-
up. The furnace chamber was then heated at a rate of 13.75 °C/min to a maximum
temperature of 1100 °C. The specimen was then soaked at this maximum temperature for
at least 75 min. After the soak, the pressure was increased from 20 MPa to 30 MPa to 40
MPa, taking approximately one minute to reach the chosen pressure.
The SR51 specimen was held at 40 MPa during the entire length of the test. The strain vs.
time plot (Fig. 30) indicates that the specimen failed after 52.1 h at a strain rate of ≈
8.1x10⁻⁹
s-1
. The strain rate was determined by sampling the data in the middle of the

71
strain vs. time curve, in order not to get the data mixed with the initial loading or the
failing region of the plot.
0
0.05
0.1
0.15
0.2
0.25
0.3S
trai
n
Time, h
ddt= 8.1 x 10 -9
s-1
5 10 15 20 25 30 35 40 45 50
Figure 30: Tensile creep strain vs time of bulk Ti3SiC2:TiC test specimen SR51. Test was carried out at 1100 °C
at a constant σ = 40 MPa. When secondary creep, region between the two angled dotted lines, is analyzed, the strain rate is found to be 8.1 x 10
-9 s
-1.
A second test was run on a SR30 specimen. After a temperature of 1100 °C was reached,
a load of 20 MPa was applied and held for 22 h after which it was increased to 30 MPa
for 42 h and finally 40 MPa where it was held till failure, for a total of ≈ 93 h. Each load
produced a different strain rate; 3.9x10⁻⁷
, 8.1x10⁻⁷
and 2.2x10⁻⁶
s-1
for the 20, 30 and 40
MPa loads, respectively.

72
0
0.1
0.2
0.3
0.4
0.5
0 20 40 60 80 100
Str
ain
Time, h
20 MPa
22 hours30 MPa
43 hours
40 MPa
Until fracture
"29 hours"
ddt20x 10
-7s
-1
ddt30x 10
-7s
-1
ddt40x 10
-6s
-1
Figure 31: Tensile creep strain vs time for bulk Ti3SiC2:TiC SR30 specimen. Testing was carried out at 1100 °C,
but at varying loads. For the initial 22 h, σ = 20 MPa, followed by an increase to σ = 30 MPa for 42 h and finally
the load was taken to σ = 40 MPa till failure, totaling 93 h. Strain rates were measured for the 20, 30 and 40 MPa loads as 3.9 x 10
-7, 8.1 x 10
-7 and 2.2 x 10
-6 s
-1, respectively.
3.3 Ti3SiC2:TiC:SiC Composites
One test was successfully completed on a SR30 Ti3SiC2:TiC:SiC composite sample.
Once the specimen was placed in the apparatus, as discussed above, it was subjected to
an initial load. The load, however, was nominal and only applied in order to maintain
alignment of the sample during set-up. The furnace chamber was then heated at a rate of
13.75 °C/min to a maximum temperature of 1100 °C. The specimen was then soaked at
this maximum temperature for at least 75 min. After the soak, the pressure was applied to
20 MPa and then 40 MPa, taking approximately one minute to reach the chosen pressure.
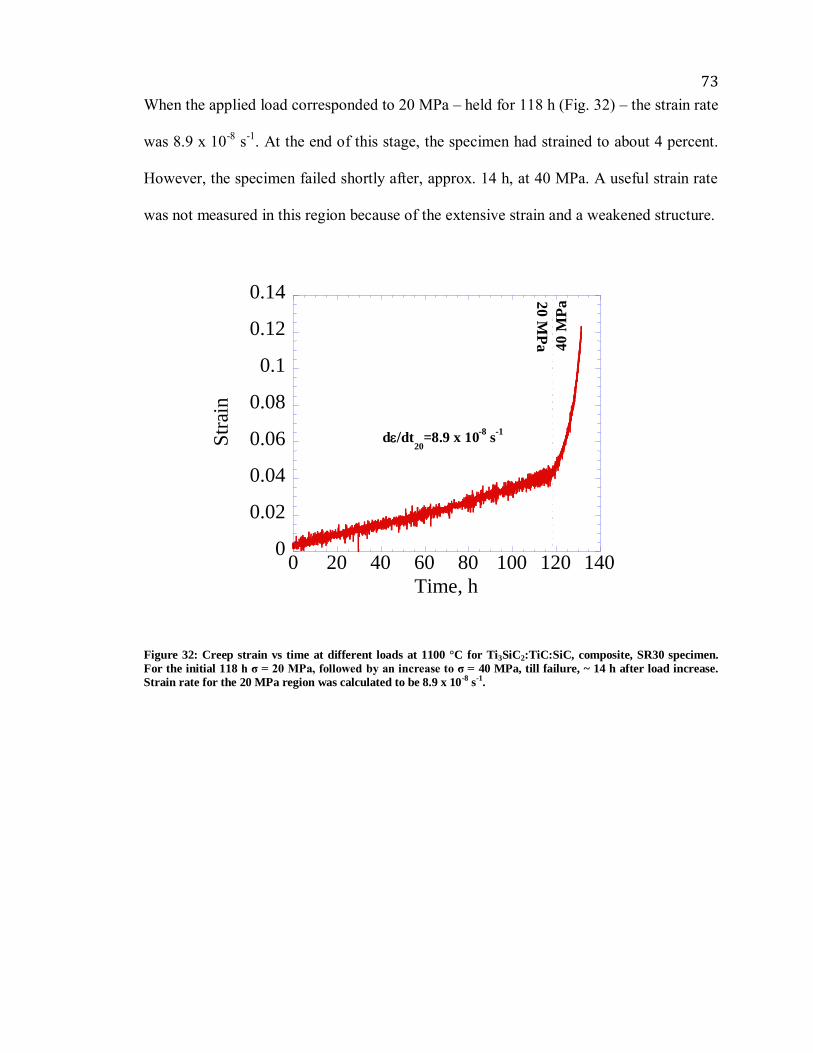
73
When the applied load corresponded to 20 MPa – held for 118 h (Fig. 32) – the strain rate
was 8.9 x 10⁻⁸
s-1
. At the end of this stage, the specimen had strained to about 4 percent.
However, the specimen failed shortly after, approx. 14 h, at 40 MPa. A useful strain rate
was not measured in this region because of the extensive strain and a weakened structure.
0
0.02
0.04
0.06
0.08
0.1
0.12
0.14
0 20 40 60 80 100 120 140
Str
ain
Time, h
ddt20
=8.9 x 10⁻⁸
s-1
20
MP
a 40
MP
a
Figure 32: Creep strain vs time at different loads at 1100 °C for Ti3SiC2:TiC:SiC, composite, SR30 specimen.
For the initial 118 h σ = 20 MPa, followed by an increase to σ = 40 MPa, till failure, ~ 14 h after load increase.
Strain rate for the 20 MPa region was calculated to be 8.9 x 10⁻⁸
s-1
.

74
3.3.1 Microstructural Characterization of Fracture Surface
Below are secondary SEM images of both fractured surfaces.
(a) (b)
Figure 33: (a) and (b) SEM, secondary electron, images of the SR30 composite specimen’s fracture surfaces.
Surface was extensively oxidized. Circled in the bottom left hand corner, in red, on b are three SiC fibers.
Figure 33 clearly shows extensive surface oxidation of the two halves. The oxidation
covers most of the fiber surfaces and therefore it is difficult to analyze the failure
mechanism. Fibers encompass only one half the cross-sectional surface, which can be
observed clearly in Figs. 37a and 38a-b. This being the case, it is logical that half of the
fractured surface, the half that was not reinforced – the left and right sections of Fig. 33a
and b, respectively – failed before the reinforced area and thus was exposed to the
environment longer and oxidized uniformly when compared to the right and left sections
in Figs. 33a and b, respectively. Several fibers are apparent and can be seen, circled, in
the bottom of Fig. 33b. Figure 34, below, further explores this area.

75
(a) (b)
(c) (d)
Figure 34: SEM secondary electron images of the fibers seen, circled in Fig. 33. (b) and (d) are tilted images of
(a) and (c). The fibers in b are clearly at different levels. The fiber seen in b and d is the cleanest fiber found for
analysis. The fiber can be clearly seen offset from the matrix surface. These two observations suggest at least
some fiber pull-outs.
Fibers of interest in Figs. 34a and b are at different heights with respect to one another.
Fig. 34d is a tilted secondary electron SEM image of the fiber seen in Fig. 34c. As can be
seen, the fiber is offset from the matrix interface. It is clear that all fibers are not at the
same depth in comparison to the matrix surface, which suggests at least some pullout. At
this time, there is no conclusive evidence to state if pullouts were in effect, or if the fibers
being outset from the matrix surface is due to the oxidation of the fracture surface after

76
failure. It is our contention that fiber pullout aided in the additional strengthening of the
composite and thus increased the time to failure and decreased the strain rate of this
specimen.
3.4 Discussion
0
0.1
0.2
0.3
0.4
0.5
0 20 40 60 80 100 120 140
Str
ain
Time, h
a: SR51M
b: SR30M
c: SR30C
a
b
c
20 MPa
30 MPa
40 MPa
Figure 35: Tensile creep strain vs time for all three tests. This overlain plot easily shows the improvements the
SiC fibers, line c, is for the Ti3SiC2:TiC matrix, lines a and b.
Figure 35 compares the three successful creep tests. This comparison makes it easy to see
the improvements made to both the time to failure, tf, and to the total strain to failure of
the Ti3SiC2 matrix. The most important of these comparisons is the first segment of the
20 MPa portion of line b (monolithic), and the 20 MPa portion of line c (composite) –
both in green – shows the extent of the improvement. While the monolithic sample

77
reached a strain of roughly 4 % in 22 h, the composite sample did not reach a strain of 4
% until after 118 h.
Further confirmation of the impact of the fibers can be obtained by comparing the results
obtained herein to those of Radovic et al.[90]
on FG Ti3SiC2. Radovic et al. tested Ti3SiC2
at varying temperatures, one of them being 1100 °C. When the data from the experiments
of this work are overlain in Fig. 36 they fall within reason to the 1100 °C line. This plot
compares the creep rate, s-1
, of varying test specimens with respect to testing temperature,
°C, and applied stress, MPa. With increasing temperature and stress, the strain rates of
the FG Ti3SiC2 samples will also increase. This is none too surprising.
Figure 36: A log-log plot of creep strain rate vs stress. This original plot is taken from the work by Radovic et
al.[90]
on FG Ti3SiC2. The results from this work on both a monolithic matrix of Ti3SiC2:TiC and a composite of
Ti3SiC2:Ti:SiC have been overlain. The brown triangles represent the monolithic SR30 specimen tested at T =
1100 °C and σ = 20 and 40 MPa. These fall very close to the data Radovic et al. published at this same T and σ.
The yellow star, is the composite specimen tested at T = 1100 °C and σ = 20 MPa. This is still within reason of the Radovic et al. data, but shows a definite reduction in strain rate.

78
In addition to the fractured surface presented in Figs. 33 and 34, cross-sections were
taken from the gauge of both the monolithic and composite specimens, right below the
fracture surface. These specimens were mounted, polished and imaged with both OM and
SEM with secondary and backscattered electrons.
(a) (b)
Figure 37: OM imaging of the polished cross-section just below the fracture surface of, (a) composite SR30
specimen, at T = 1100 °C for ~132 h, and bulk SR30 specimen, at T = 1100 °C for ~93 h. Oxidation is clearly seen in both samples.
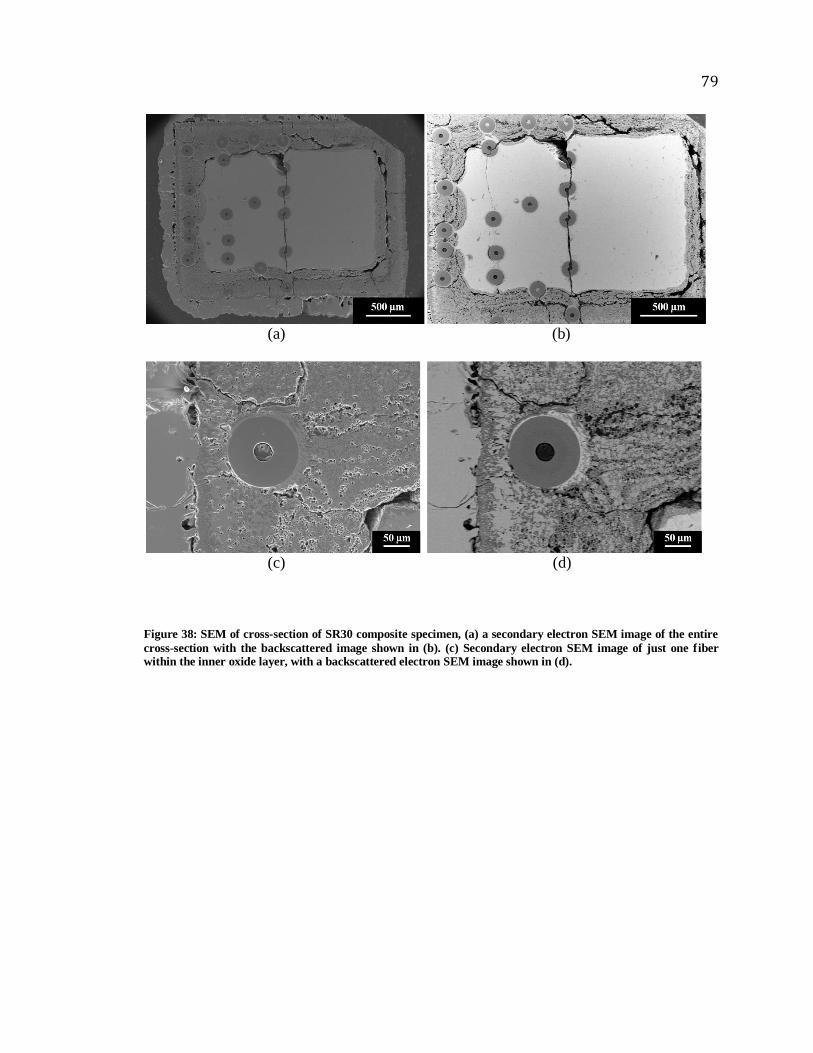
79
(a) (b)
(c) (d)
Figure 38: SEM of cross-section of SR30 composite specimen, (a) a secondary electron SEM image of the entire
cross-section with the backscattered image shown in (b). (c) Secondary electron SEM image of just one fiber within the inner oxide layer, with a backscattered electron SEM image shown in (d).

80
(a)
Atomic %
Spot C K O K Si K Ti K
1 29.07 -- 70.93 --
2 82.61 17.39 -- --
3 3.83 -- 53.41 42.76
4 -- 45.09 -- 54.91 5 15.17 -- 13.64 71.19
6 -- 39.97 -- 60.03
7 -- -- 91.67 8.33
(b)
Figure 39: (a) SEM, backscattered image of Figs. 38c-d. Several regions have been identified with the use of
EDS; the results shown in (b). Although, EDS was not calibrated for accurate measuring, the data is shown for
comparison. Three major regions are identified. The outermost region, spot 4, is made up of Ti and O. The
middle layer, spots 6 and 7, is made of Ti, Si and O. And the inner layer, spot 5, is Ti, Si and C. These results
agree with the literature that show that the oxidation of Ti3SiC2 occurs by the formation of an outer TiO2 and an
inner, or middle layer, of TiO2 and SiO2[63]
.
The above micrograph and table, (Fig. 39), show the results of energy dispersive
spectroscopy, EDS, completed on the polished surface. These results agree with the
literature that show that the oxidation of Ti3SiC2 occurs by the formation of an outer TiO2

81
and an inner, or middle layer, of TiO2 and SiO2[63]
. It is important to note that the EDS
measurements were not calibrated when Fig. 39 was obtained. Therefore the
measurements are slightly out of proportion. The purpose of this figure is only to show
that, point 4, in the outer scale, does appear to be made up TiO2 and that points 6 and 7
are comprised of Ti, Si and O.
3.5 Summary and Conclusions
Monolithic and composite samples were hot pressed to 1500 °C for 4 h with starting
materials of: a) Ti3SiC2:TiCx powder and, b) Ti3SiC2:TiCx powder and 140 µm SiC
fibers, respectively. Test specimens were machined, using EDM, into dog-bones to NIST
standards, SR30 and SR51. Creep tests were completed at 1100 °C and stresses of 20, 30
and 40 MPa. Tests were run until failure, which was followed by post-creep
microstructure analysis with the aid of OM and SEM, with EDS.
The creep results of the SiC fiber-reinforced composite showed a decrease in strain rate
when compared to both the literature[90]
and those carried out on monolithic samples
made in this work. It is concluded that continuous, SiC fibers, 6.3 vol.%, increase the
high temperature creep resistance of a Ti3SiC2:TiC matrix.

82
CHAPTER 4. SUMMARY AND CONCLUSIONS
4.1 Summary and Conclusions
The work presented above evaluated several possible MAX phase/ceramic fiber
composites, namely: Ti2AlC:Al2O3, Ti2AlC:SiC and Ti3SiC2:TiC:SiC. Varying results
were observed, some of which were initially surprising. The first reaction pair,
Ti2AlC:Al2O3, was processed by HIPing and HPing Ti2AlC powders and 3-10 µm
alumina fibers to temperatures of 1300-1500 °C for 4 h. At 1300 °C fully-dense,
microstructurally sound composites were produced. However, at 1500 °C the alumina
fibers agglomerate and, more importantly, Al was lost to the environment, converting the
Ti2AlC, to Ti3AlC2 and TiAlx. Therefore this combination may produce a viable
composite, but only at T < 1300 °C.
The second combination, Ti2AlC:SiC, was produced by HIPing and HPing Ti2AlC
powder and 140 µm SiC to temperatures of 1300-1500 °C for 4 h. At the maximum
temperature, 1500 °C, the matrix forms Ti3AlC2 and TiAlx. However, in addition to this
reaction, at both temperatures, 1300 and 1500 °C, the SiC fibers and matrix also reacted
forming a solid solution according to the following equation:
2 Ti2AlC + x SiC = Ti3(Al1-x,Six)C2 + Al1+xTi1-x + x TiC
Note that at x = 1, Ti3SiC2 and pure Al are formed. Therefore, this combination is not a
suitable composite at temperatures high enough to produce fully dense matrices.
Finally, it was shown that the combination of Ti3SiC2:TiC:SiC produced a viable
composite that was fully dense with a matrix/fiber interface that was clean and reaction

83
free. Dog-bone tensile samples, conforming to NIST standards for SR30 and SR51
specimens, were EDMed for both the monolithic, Ti3SiC2:TiC, and composite,
Ti3SiC2:TiC:SiC samples. Even at ≈ 6 vol. %, the creep resistance at 1100 °C and 20
MPa for the composite was better than the monolithic specimens made with the same
powders. Although the improvement of the high temperature mechanical properties of
Ti3SiC2 shown is not groundbreaking, it is significant and convincing enough to instigate
further research.
4.2 Future Work
This work opens the doors to the promising field of ceramic fiber-reinforced MAX phase
composites, which had not been previously explored. Although this work is a good start,
there is much to still be completed. It is the author‟s recommendation that more work is
needed with respect to several topics:
The reaction combination of Ti3SiC2:TiC:SiC showed an increase in time to
failure with only 6.3 vol.% fiber located in only one half of the cross-section.
Work is needed to produce samples with higher loadings of fibers, and a more
effective method of dispersing these fibers in the matrix.
A pure Ti3SiC2 matrix is recommended for further study. Although the
Ti3SiC2:TiC, 84:16, matrix gave similar results to a pure Ti3SiC2 matrix, future
work would benefit from a more pure matrix.
This work successfully completed creep testing on three specimens; two on the
monolithic samples and one of the SiC fiber-reinforced samples. Future work is
recommended to complete more tests to ensure reproducibility of data. In addition
84
to testing needed at 1100 °C and 20 MPa, more testing is recommended to explore
the 1000-1200 °C temperature range and up to 100 MPa for further comparison
with Radovic et al.[66, 90]
Studies on the fracture toughness are also recommended for further comparison
with the work of others.

85
REFERENCES
1. Spencer, C.B., Cordoba, J., Sakulich, A., Obando, N., Radovic, M., Oden, M.,
Hultman, L., and Barsoum, M.W., On the Reactivities of Ti2AlC and Ti3SiC2 with
SiC Fibers and Powders up to Temperatures of 1550°C. Submitted to J. of Amer.
Cer. Soc, 2010.
2. Spencer, C.B., Cordoba, J.M., Sakulich, A., Obando, N., Radovic, M., Oden, M.,
Hultman, L., and Barsoum, M.W., Processing of Ti2AlC Matrix Composites
Reinforced with Al2O3 Fibers. Submitted to: J. Amer. Cer. Soc., 2010.
3. Peters, S.T., ed. Handbook of Composites. 1998, Chapman & Hall: London.
4. Kragnes, E.D., Processing and mechanical behavior of tape cast and laminated
silicon cabide whisker/alumina composites. 1988, Pennsylvania State University:
Happy Valley.
5. Holtz, A.R., and Grether, M.F., High temperature properties of three Nextel
ceramic fibers, in 32nd International SAMPE Symposium and Exhibition 1987:
Anaheim Convention Center.
6. Newkirk, M.S., Urquart, A.W., Zwicker, H.R., and Brevel, E., Formation of
LANXIDETM
ceramic composite material. J. Mater. Res., 1986. 1(1): p. 81-88.
7. Stinton, D.P., Besmann, T.M., and Louden, R.A., Advanced ceramics by chemical
vapor deposition techniques. Am. Ceram. Soc. Bull., 1988. 67(2): p. 350-355.
8. Jones, R.M., Mechanics of Composite Materials. 2nd ed. 1999, Philadelphia:
Taylor & Francis, Inc. 519.
9. Mazdiyasni, K.S., ed. Fiber Reinforced Ceramic Composites: Materials,
Processing and Technology. 1990, Noyes Publications: New Jersey.
10. Barsoum, M.W., and El-Raghy, T., The MAX Phases: Unique New Carbide and
Nitride Materials. American Scientist, 2001. 89(July-August): p. 334-343.
11. Jeitschko, W., Nowotny, H., and Benesovsky, F., Kohlenstoffhaltige ternare
Verbindungen (H-Phase). Monatsh. Chem., 1963. 94: p. 672-676.
12. Jeitschko, W., Nowotny, H., and Benesovsky, F., Ti2AlN, eine stickstoffhaltige H-
Phase. Monatsh. Chem., 1963. 94: p. 1198-1200.

86
13. Jeitschko, W., Nowotny, H., and Benesovsky, F., Carbides of Formula Ti2MC.
Journal of the Less-Common Metals, 1964(7): p. 133-138.
14. Barsoum, M.W., Physical propeties of the MAX phases, in Encyclopedia of
Materials: Science and Technology, C. Buschow, Flemings, Kramer, Mahajan,
and Veyssiere, Editor. 2001, Elsevier Ltd. p. 1-11.
15. Nowotny, H., Struktuchemie Einiger Verbindungen der Ubergangsmetalle mit
den elementen C, Si, Ge, Sn. Prog. Solid St. Chem., 1970. 2.
16. Goto, T., and Harai, T., Chemically Vapor Deposited Ti3SiC2. Mater. Res. Bull.,
1987. 22: p. 1195-1202.
17. Dubois, S., Cabioc'h, T., Chartier, P., Gauthier, V., and Jaouen, M., A New
Ternary Nanolaminate Carbide: Ti3SnC2. J. Am. Ceram. Soc., 2007. 90.
18. Lin, Z., Zhou, M., Zhou, Y., Li, M., and Wang, J., Microstructures and
Theoretical Bulk Modulus of Layered Ternary Tantalum Aluminum Carbides. J.
Am. Ceram. Soc., 2006. 89.
19. Pietzka, M.A., and Schuster, J.C., Summary of constitution data of the system Al-
C-Ti. J. Phase Equilibria, 1994. 15.
20. Wolfsgruber, H., Nowotny, H., and Benesovsky, F., Die Kristallstruktur von
Ti3GeC2. Monatsh. Chem., 1967. 98.
21. Etzkorn, J., Ade, M., Kotzott, D., Kleczek, M., and Hillebrecht, H., Ti2GaC,
Ti4GaC3, and Cr2GaC--Synthesis, crystal growth and structure analysis of Ga-
containing MAX-phases Mn+1GaCn with M=Ti, Cr and n=1,3. J. Solid State
Chem., 2009. 182.
22. Hogberg, H., Eklund, P., Emmerlich, J., Birch, J., and Hultman, L., Epitaxial
Ti2GeC, Ti3GeC2, and Ti4GeC3 MAX-phase thin films grown by magnetron
sputtering. J. Mater. Res., 2004. 20.
23. Hu, C., Li, F., Zhang, J., Wang, J., Wang, J., and Zhou, Y., Nb4AlC3. Scripta
Materialia, 2007. 57.
24. Hu, C., Zhang, J., Wang, J., Li, F., Wang, J., and Zhou, Y., Crystal Structure of
V4AlC3: A New Layered Ternary Carbide. J. Am. Ceram. Soc., 2008. 91.
25. Palmquist, J.P., Li, S., Persson, P.O.A., Emmerlich, J., Wilhelmsson, O.,
Hogberg, H., Katnelson, M.I., Johansson, B., Eriksson, O., Hultman, L., and
Jansson, U., Mn+1AXn phases in the Ti-Si-C system studied by thin-film synthesis
and ab initio calculations. Physical Review B, 2004. 70.

87
26. Procopio, A.T., Barsoum, M.W., and El-Raghy, T., Characterization of Ti4AlN3.
Metallurgical and Materials Transaactions A, 2000. 31A.
27. Rawn, C.J., Barsoum, M.W., El-Raghy, T., Procipio, A., Hoffmann, C.M., and
Hubbard, C.R., Structure of Ti4AlN3--a layered Mn+1AXn nitride. Materials
Research Bulletin, 2000. 35.
28. Zhou, Y., et al., New MAX-Phase Compounds in the V-Cr-Al-C System. J. Am.
Ceram. Soc., 2008. 91(4): p. 1357-1360.
29. Barsoum, M.W., The MN+1AXN Phases: A New Class of Solids;
Thermodynamically Stable Nanolaminates. Prog. Solid St. Chem., 2000. 28: p.
201-281.
30. Jeitschko, W., and Nowotny, H., Die Kristallstructur von Ti3SiC2 - Ein Neuer
Komplxcarbid-Type. Monatsh. Chem., 1967. 98: p. 329-337.
31. Zhou, Y.C., and Wang, X.H., Deformation of polycrystalline Ti2AlC under
compression. Mat Res Innovat, 2001. 5: p. 87-93.
32. Barsoum, M.W., Brodkin, D., and El-Raghy, T., Layered Machinable Ceramics
For High Temperature Applications. Scripta Materialia, 1997. 36(5): p. 535-541.
33. Barsoum, M.W., Ali, M., and El-Raghy, T., Processing and Characterization of
Ti2AlC, Ti2AlN, and Ti2AlC0.5N0.5. Metallurgical and Materials Transactions A,
2000. 31A: p. 1857-1865.
34. Hettinger, J.D., Lofland, S.E., Finkel, P., Palma, J., Harnell, K., Gupta, S.,
Ganguly, A., El-Raghy, T., and Barsoum, M.W., Electrical Transport, Thermal
Transport and Elastic Properties of M2AlC (M=Ti, Cr, Nb and V) Phases. Phys.
Rev. B, 2005. 72: p. 115-120.
35. Radovic, M., Ganguly, A., Barsoum, M.W., Zhen, T., Finkel, P., Kalidindi, S.R.,
and Lara-Curzio, E., On the Elastic Properties and Mechanical Damping of
Ti3SiC2, Ti3GeC2, Ti3Si0.5Al0.5C2 and Ti2AlC in the 300-1573 K Temperature
Range. Acta Materialia, 2006. 54.
36. Manoun, B., Saxena, S.K., Barsoum, M.W., and El-Raghy, T., High-Pressure
Study of Ti2AlN and Ti2AlC. J. Phys. Chem. Solids, 2006. 67: p. 2091.
37. Barsoum, M.W., Brodkin, D., and El-Raghy, T., Layered Machinable Ceramics
For High Temperature Applications. Scripta Materialia 1996. 36(5): p. 535-541.
38. Wang, P., Mei, B., Hong, X., and Zhou, W., Synthesis of Ti2AlC by hot pressing
and its mechanical and electrical properties. Trans. Nonferrous Met. Soc. China,
2007. 17: p. 1001-1004.

88
39. Sundberg, M., Malmqvist, G., Magnusson, A., and El-Raghy, T., Alumina
forming high temperature silicides and carbides. Ceramics International,
2004(30): p. 1899-1904.
40. Wang, X.H., and Zhou, Y.C., High-Temperature Oxidation Behavior of Ti2AlC in
Air. Oxidation of Metals, 2003. 59(3/4): p. 303-320.
41. Barsoum, M.W., Tzenov, N., Procopio, A., El-Raghy, T., and Ali, M., Oxidation
of Tin+1AlXn (n=1-3 and X=C, N) II. Experimental Results. Journal of The
Electrochemical Society, 2001. 148(8): p. C551-C562.
42. Barsoum, M.W., Oxidation of Tin+1AlXn (n=1-3 and X=C, N): I. Model. J.
Electrochem. Soc., 2001. 148(8).
43. Byeon, J.W., Liu, J., Hopkins, M., Fischer, W., Garimella, N., Park, K.B., Brady,
M.P., Radoviv, M., El-Raghy, T., and Sohn, Y.H., Microstructure and Residual
Stress of Alumina Scale Formed on Ti2AlC at High Temperature in Air. Oxidation
of Metals, 2007(68): p. 97-111.
44. Barsoum, M.W., and El-Raghy, T., Synthesis and Charaterization of a
Remarkable Ceramic: Ti3SiC2. J. Am. Ceram. Soc., 1996. 79.
45. Nickl, J.J., Schweitzer, K.K., and Luxenberg, P., Gaphasenabscheidung im
Systeme Ti-C-Si. J. Less Common Metals, 1972. 26.
46. Racault, C., Langlais, F., and Naslain, R., Solid-state synthesis and
characterization of the ternary phase Ti3SiC2 J. Mater. Sci. , 1994. 29: p. 3384.
47. Emmerlich, J., Hogberg, H., Sasvari, S., Persson, P.O.A., Hultman, L., Palmquist,
J.P., Jansson, U., Molina-Aldareguia, J.M., and Czigany, Z., Growth of Ti3SiC2
thin films by elemental target magnetron sputtering. J. Appl. Phys., 2004. 96(9):
p. 4817.
48. Hogberg, H., Hultman, L., Emmerlich, J., Joelsson, T., Eklund, P., Molina-
Aldareguia, J.M., Palmquist, J.P., Wilhelmsson, O., and Jansson, U., Growth and
characterization of MAX-phase thin films. Surf. Coat. Tech., 2005. 193(1-3): p. 6.
49. Hu, J.J., Bultman, J.E., Patton, S., and Zabinski, J.S., Pulsed Laser Deposition
and Properties of Mn+1AXn Phase Formulated Ti3SiC2 Thin Films Tribology
Lett., 2004. 16(1/2): p. 113.
50. Lis, J., and Pampuch, R., Reaction sintering phenomena of self-propagating high-
temperature synthesis-derived ceramic powders in the Ti-Si-C system. Solid State
Ionics, 1997. 101-103(1-2): p. 59.

89
51. Riley, D.P., Kisi, E.H., and Phelan, D., SHS of Ti3SiC2: ignition temperature
depression by mechanical activation J. Euro. Ceram. Soc. , 2006. 26(6): p. 1051.
52. Arunajatesan, S., and Carim, A.H., Synthesis of Titanium Silicon Carbide. J. Am.
Ceram. Soc., 1995. 78(3): p. 667.
53. Zhang, Z.F., Sun, Z.M., and Hashimoto, H., Rapid synthesis of ternary carbide
Ti3SiC2 through pulse-discharge sintering from Ti/Si/TiC powders. Metall. Mater.
Trans. A, 2002. 33(11): p. 3321.
54. Zhang, Z.F., Sun, Z.M., Hashimoto, H., and Abe, T., A new synthesis reaction of
Ti3SiC2 through pulse discharge sintering Ti/SiC/TiC powder. Script. Mater.,
2001. 45(12): p. 1461.
55. Gao, N.F., Li, J.T., Zhang, D., and Miyamoto, Y., Rapid synthesis of dense
Ti3SiC2 by spark plasma sintering. J. Eur. Cer. Soc., 2002. 22(13): p. 2365.
56. Tang, K., Wang, C.A., Wu, L.F., Guo, X.J., Xu, X.L., and Huang, Y., Sintering of
Ti3SiC2 with B2O3 additions Ceram. Inter., 2002. 28(7): p. 761.
57. Li, J.F., Matsuki, T., and Watanabe, R., Fabrication of highly dense Ti3SiC2
ceramics by pressureless sintering of mechanically alloyed elemental powders. J.
Mater. Sci. , 2003. 38(12): p. 2661-2666.
58. Li, J.F., Matsuki, T., and Watanabe, R., Combustion Reaction During Mechanical
Alloying Synthesis of Ti3SiC2 Ceramics from 3Ti/Si/2C Powder Mixture. J. Am.
Ceram. Soc., 2005. 88(5): p. 1318.
59. Li, S.B., and Zhai, H.X., Synthesis and Reaction Mechanism of Ti3SiC2 by
Mechanical Alloyinh of Elemental Ti, Si and C Powders. J. Am. Ceram. Soc.,
2005. 88(8): p. 2092-2098.
60. Li, S.B., Zhai, H.X., Zhou, Y., and Zhang, Z.L., Synthesis of Ti3SiC2 powders by
mechanically activated sintering of elemental powders of Ti, Si and C. Mater. Sci.
Eng. A, 2005. 407(1-2): p. 315.
61. Zhang, H.B., Bao, Y.W., and Zhou, Y.C., Current Status in Layered Ternary
Carbide Ti3SiC2, a Review. J. Mater. Sci. Technol., 2009. 25.
62. El-Raghy, T., Barsoum, M.W., Zavaliangos, A., and Kalidindi, S.R., Processing
and Mechanical Properties of Ti3SiC2:II, Effect of Grain Size and Deformation
Temperature. J. Am. Ceram. Soc., 1999. 82(10): p. 2855-2860.
63. Barsoum, M.W., Ho-Duc, L.H., Radovic, M., and El-Raghy, T., Long Time
Oxidation of Ti3SiC2, Ti3SiC2/SiC and Ti3SiC2/TiC Composites in Air. J.
Electrochem. Soc., 2003. 150.

90
64. Sun, Z., Zhou, Y., and Li, M., Cyclic-Oxidation Behavior of Ti3SiC2-Base
Material at 1100 C. Oxidation of Metals, 2002. 57.
65. Liu, G., Li, M., Zhang, Y., and Zhen, Y., Cracking behavior of oxide scale formed
on Ti3SiC2-based ceramic. Materials Science and Engineering, 2003. A360.
66. Radovic, M., Barsoum, M.W., El-Raghy, T., and Wiederhorn, S.M., Tensile creep
of coarse-grained Ti3SiC2 in the 1000-1200 C temperature range. Journal of
Alloys and Compounds, 2003. 361: p. 299-312.
67. Zhen, T., Barsoum, M.W., Kalidindi, S.R., Radovic, M., Sun Z.M., and El-Raghy,
T., Compressive creep of fine and coarse-grained Ti3SiC2 in air in the 1100-1300
C temperature range. Acta Materialia, 2005. 53.
68. Barsoum, M.W., Fundamentals of Ceramics. Second ed. Series in Materials
Science and Engineering, ed. B. Cantor, and Goringe, M.J. 2003, New York:
Taylor & Francis. 603.
69. Chen, J., Liu, M., Bao, Y., and Zhou, Y., Failure-mode dependence of the
strengthening effect in Ti3AlC2/10 vol.% Al2O3 composite. Int. J. Mat. Res., 2006.
97(8): p. 1115-1118.
70. Benko, E., Klimczyk, P., Mackiewciz, S., Barr, T.L., and Piskorska, E., cBN-
Ti3SiC2 composites. Diamond and Related Mater., 2004. 13(3): p. 521.
71. Wang, L.J., Jiang, W., Chen, L.D., and Bai, G.Z., Microstructure of
Ti5Si3/TiC/Ti3SiC2 and Ti5Si3/TiC nanocomposites in situ synthesized by spark
plasma sintering J. Mater. Res., 2004. 19(10): p. 3004.
72. Konoplyuk, S., Abe, T., Uchimoto, T., and Takagi, T., Synthesis of TiSiC/TiC
composites from TiH/SiC/TiC powders. Mater. Lett., 2005. 59(18): p. 2342.
73. Konoplyuk, S., Abe, T., Uchimoto, T., and Takagi, T., Ti3SiC2/TiC composites
prepared by PDS. J. Mater. Sci., 2005. 40(13): p. 3409.
74. Ho-Duc, L.H., El-Raghy, T., and Barsoum, M.W., Synthesis and characterization
of 0.3 Vf TiC-Ti3SiC2 and 0.3 Vf SiC-Ti3SiC2 composites. Journal of Alloys and
Compounds, 2003. 350: p. 303-312.
75. Gupta, S., Filimonov, D., Palanisamy, T., El-Raghy, T., and Barsoum, M.W.,
Ta2AlC and Cr2AlC Ag-based composites - New solid lubricant materials for use
over a wide temperature range against Ni-based superalloys and alumina. Wear,
2007. 262: p. 1479-1489.

91
76. Amini, S., Ni, C., and Barsoum, M.W., Processing, microstructural
characterization and mechanical properties of a Ti2AlC/nanocrystalline Mg-
matrix composite. Comp. Sci. and Tech., 2009. 69: p. 414-420.
77. Ashby, M.F., and Jones, D.R.H., Engineering Materials 1: An Introduction to
Properties, Applications and Design. Third ed. 1980, Burlington: Elsevier Ltd.
424.
78. Barsoum, M.W., El-Raghy, T., Farber, L., Amer, M., Christini, R., and Adams,
A., The Topotaxial Transformation of Ti3SiC2 To Form a Partially Ordered Cubic
TiC0.67 Phase by the Diffusion of Si into Molten Cryolite. J. Electrochem. Soc.,
1999.
79. El-Raghy, T., and Barsoum, M.W., Processing and mechanical properties of
Ti3SiC2: part I: reaction path and microstructure evolution. J. Am. Ceram. Soc.,
1999. 82.
80. Ganguly, A., Zhen, T., and Barsoum, M.W., Synthesis and Mechanical Properties
of Ti3GeC2 and Ti3(SixGe1-x)C2 (x=0.5, 0.75) Solid Solutions. J. Alloys and
Cmpnds, 2004. 376.
81. Kisi, E.H., Wu, E., Zobec, J.S., Forrester, J.S., and Riley, D.P., Inter-Conversion
of Mn+1AXn Phases in the Ti-Al-C System. J. Am. Ceram. Soc., 2007. 90.
82. Emmerlich, J., Hogberg, H., Eklund, L., Wilhelmsson, O., Jansson, U., Music, D.,
Schneider, J.M., and Hultman, L., Thermal Stability of MAX-phase Ti3SiC2 Thin
Films. Acta Materialia, 2007. 55.
83. Farber, L., and Barsoum, M.W., Isothermal Sections in the Cr-Ga-N System in the
650-1000 C Temperature Range. J. Mater. Res., 1999. 14: p. 2560.
84. Du, Y., Schuster, J., Seifert, H., and Aldinger, F., Experimental Investigation and
Thermodynamic Calculation of the Titanium-Silicon-Carbon System. J. Am.
Ceram. Soc., 2000. 83: p. 197.
85. El-Raghy, T., Chakraborty, S., and Barsoum, M.W., Synthesis and
Characterization of Hf2PbC, Zr2PbC and M2SnC (M=Ti, Hf, Nb and Zr). J. Eur.
Cer. Soc., 2000. 20.
86. El-Raghy, T., and Barsoum, M.W., Diffusion Kinetics of the Carburization and
Silicidation of Ti3SiC2. J. Appl. Phys., 1998. 83: p. 112.
87. El-Raghy, T., Barsoum, M.W., and Sika, M., Reaction of Al with Ti3SiC2 in the
800-1000 C Temperature Range. Mater. Sci. Eng., 2001. 298: p. 174.

92
88. Wakelkamp, W.J.J., van Loo, F.J.J., and Metselaar, R., Phase Relations in the Ti-
Si-C System. Journal of the European Ceramic Society, 1991. 8: p. 135-139.
89. Carroll, D.F., and Wiederhorn, S.M., High Temperature Creep Testing of
Ceramics. Int. J. High Tech. Cer., 1988. 4: p. 227-241.
90. Radovic, M., Barsoum, M.W., El-Raghy, T., and Wiederhorn, S.M., Tensile
Creep of Fine Grained (3-5 um) Ti3SiC2 in the 1000-1200 C Temperature Range.
Acta Materialia, 2001. 49: p. 4103-4112.