Embed Size (px)
Citation preview

Supported by
the World oforganic agriculture
AFRICA 1.8 MILLION HA
STATISTICS & EMERGING TRENDS 2018
NORTH AMERICA 3.1 MILLION HA
OCEANIA 27.3 MILLION HA
LATIN AMERICA 7.1 MILLION HA
ASIA 4.9 MILLION HA
EUROPE 13.5 MILLION HA
FiBL & IFOAM – ORGANICS INTERNATIONAL
FiB
L &
IFO
AM
– O
RG
AN
ICS
IN
TER
NA
TIO
NA
L TH
E W
OR
LD O
F O
RG
AN
IC A
GR
ICU
LTU
RE
201
8
STA
TIS
TIC
S

GLOBAL POLICY TOOLKITON PUBLIC SUPPORTTO ORGANIC AGRICULTURE
AVAILABLE AT: WWW.IFOAM.BIO/POLICY-TOOLKITS
Looking for professional information?FiBL’s online shop has more than 400 publications!It is an invaluable source of information on organic farming, sustainable agriculture, animal husbandry and nature conservation. Publications are available in English, German, French and several other languages. Most publications are free to download!
Research Institute of Organic Agriculture FiBL. Reducing the use of copper in potatoes.
OK-Net Arable Practice Abstract.
OK
-NE
T A
RA
BL
E P
RA
CT
ICE
AB
ST
RA
CT
PR
AC
TIC
E A
BST
RA
CT
NR
.011
Commercial organic fertiliser as supplementary
fertilisers in potato crop production
Problem
During the first 35-50 days after emergence, potatoes
require an optimal nitrogen supply in order to develop a
good haulm and tuber growth. Manure and slurry cannot
meet the demand of the crop during its growth stage.
High or late fertiliser inputs lead to a late nitrogen supply,
which delays the maturing of the plants, complicated the
removal of the haulm and decreases tuber quality.
Solution
Effective commercial organic N fertilisers can optimally
complement the basic supply for potatoes in spring, which
consists of the preceding crop, rotted manure and slurry.
Outcome
Commercial organic N fertilisers allow a relatively accurate
dosage of the nitrogen supply without increasing the in-
festation risk of Rhizoctonia. Due to the relatively high costs, commercial fertilisers are, however, only eco-
nomically viable as an addition to farm manure.
Practical recommendation
The nitrogen requirement varies depending on variety and usage. The conventional fertilisation amounts
to 120 kg of N per ha in table potatoes and potatoes for processing. Early potatoes and seed potatoes re-
quire slightly less nitrogen at about 100 kg of N per ha.
Figure 1: Nitrogen requirement and composition of nitrogen supply during the different growth stages of potatoes
The nitrogen supply strongly depends on the conditions for N mineralisation (weather, humus content of
the soil, preceding crop residues). Thus, optimising the N supply is complex (Figure 1).
Applicability box
Theme Nutrient availability, pest and disease control,
crop-specific measures
Geographical coverage
Potato cultivation areas
Application time
After emergence
Required time
Additional fertiliser application
Period of impact
Potato crop
Equipment
Standard fertiliser spreader
Best in Potatoes
Reducing the use of copper in potatoes.
Commercial organic fertiliser as supplementary
. Due to the relatively high costs, commercial fertilisers are, however, only eco-
varies depending on variety and usage. The conventional fertilisation amounts
to 120 kg of N per ha in table potatoes and potatoes for processing. Early potatoes and seed potatoes re-
Figure 1: Nitrogen requirement and composition of nitrogen supply during the different growth stages of potatoes
The nitrogen supply strongly depends on the conditions for N mineralisation (weather, humus content of
the soil, preceding crop residues). Thus, optimising the N supply is complex (Figure 1).
Nutrient availability, pest
specific measures
cal coverage
cultivation areas
Additional fertiliser application
Period of impact
ser spreader
Artgerechte Kälbermast und Aufzucht
von Mastremonten
Alternativen zur herkömmlichen Mast von
Kälbern aus Milchwirtschaftsbetrieben
Merkblatt2017 | Ausgabe Schweiz
Artgerechte Kälbermast und Aufzucht
Alternativen zur herkömmlichen Mast von
Kälbern aus Milchwirtschaftsbetrieben
2017
TEC
HN
ICA
L G
UID
E
Organic potatoes
Potatoes are very suitable for direct marketing due to their popularity and versatility. But good yields are needed for commercial production to cover the high costs of cultivation and mechanisation. The very high quality requirements at every stage of market-ing require the highest care from seed
Cultivating quality– step by step
preparation to plant protection, nutri-ent and water supply to harvest and storage.This guide provides a good basis for achieving high-quality products. Com-mercial potato farms complement their knowledge with the help of experts and further literature.
netarable
This publication results from the Organic Knowledge Network Arable project funded by the Horizon 2020 programme of the European Union.
Looking for professional information?
cover the high costs of cultivation and mechanisation. The very high quality requirements at every stage of marketing require the highest care from seed
achieving high-quality products. Com-mercial potato farms complement their knowledge with the help of experts
This publication results from the Organic Knowledge Network Arable project funded by the Horizon 2020 programme of the European Union.
IMPROVING HEALTH AND WELFARE OF PIGSA handbook for organic pig farmers
shop.�bl.org
Looking for professional information?
FiBL’s online shop has more than 400 publications!
It is an invaluable source of information on organic farming, sustainable
agriculture, animal husbandry and nature conservation. Publications
are available in English, German, French and several other languages.
Most publications are free to download!
Research Institute of Organic Agriculture FiBL. Reducing the use of copper in potatoes.
OK-Net Arable Practice Abstract.
OK
-NE
T A
RA
BL
E P
RA
CT
ICE
AB
ST
RA
CT
PRA
CTI
CE
AB
STR
AC
T N
R.0
11
Commercial organic fertiliser as supplementary
fertilisers in potato crop production
Problem
During the first 35-50 days after emergence, potatoes
require an optimal nitrogen supply in order to develop a
good haulm and tuber growth. Manure and slurry cannot
meet the demand of the crop during its growth stage.
High or late fertiliser inputs lead to a late nitrogen supply,
which delays the maturing of the plants, complicated the
removal of the haulm and decreases tuber quality.
Solution
Effective commercial organic N fertilisers can optimally
complement the basic supply for potatoes in spring, which
consists of the preceding crop, rotted manure and slurry.
Outcome
Commercial organic N fertilisers allow a relatively accurate
dosage of the nitrogen supply without increasing the in-
festation risk of Rhizoctonia. Due to the relatively high costs, commercial fertilisers are, however, only eco-
nomically viable as an addition to farm manure.
Practical recommendation
The nitrogen requirement varies depending on variety and usage. The conventional fertilisation amounts
to 120 kg of N per ha in table potatoes and potatoes for processing. Early potatoes and seed potatoes re-
quire slightly less nitrogen at about 100 kg of N per ha.
Figure 1: Nitrogen requirement and composition of nitrogen supply during the different growth stages of potatoes
The nitrogen supply strongly depends on the conditions for N mineralisation (weather, humus content of
the soil, preceding crop residues). Thus, optimising the N supply is complex (Figure 1).
Applicability box
Theme
Nutrient availability, pest and disease control,
crop-specific measures
Geographical coverage
Potato cultivation areas
Application time
After emergence
Required time
Additional fertiliser application
Period of impact
Potato crop
Equipment
Standard fertiliser spreader
Best in
Potatoes
Merkblatt2017 | Ausgabe Schweiz
2017
TEC
HN
ICA
L G
UID
E
Potatoes are very suitable for direct
marketing due to their popularity
and versatility. But good yields are
needed for commercial production to
cover the high costs of cultivation and
mechanisation. The very high quality
requirements at every stage of market-
ing require the highest care from seed
preparation to plant protection, nutri-
ent and water supply to harvest and
storage.
This guide provides a good basis for
achieving high-quality products. Com-
mercial potato farms complement their
knowledge with the help of experts
and further literature.
netarableThis publication results from the Organic Knowledge Network Arable project
funded by the Horizon 2020 programme of the European Union.
IMPROVING HEALTH AND WELFARE OF PIGS
shop.�bl.org
Looking for professional information?FiBL’s online shop has more than 400 publications!It is an invaluable source of information on organic farming, sustainable
agriculture, animal husbandry and nature conservation. Publications
are available in English, German, French and several other languages.
Most publications are free to download!
Research Institute of Organic Agriculture FiBL. Reducing the use of copper in potatoes. OK-Net Arable Practice Abstract.
OK
- NE
T A
RA
BL
E P
RA
CT
I CE
AB
ST
RA
CT
PR
AC
T IC
E A
BS T
RA
CT
NR
. 011
Commercial organic fertiliser as supplementary fertilisers in potato crop productionProblem
During the first 35-50 days after emergence, potatoes require an optimal nitrogen supply in order to develop a good haulm and tuber growth. Manure and slurry cannot meet the demand of the crop during its growth stage. High or late fertiliser inputs lead to a late nitrogen supply, which delays the maturing of the plants, complicated the removal of the haulm and decreases tuber quality.
Solution Effective commercial organic N fertilisers can optimally complement the basic supply for potatoes in spring, which consists of the preceding crop, rotted manure and slurry.
Outcome Commercial organic N fertilisers allow a relatively accurate dosage of the nitrogen supply without increasing the in-festation risk of Rhizoctonia. Due to the relatively high costs, commercial fertilisers are, however, only eco-nomically viable as an addition to farm manure.
Practical recommendation The nitrogen requirement varies depending on variety and usage. The conventional fertilisation amounts to 120 kg of N per ha in table potatoes and potatoes for processing. Early potatoes and seed potatoes re-quire slightly less nitrogen at about 100 kg of N per ha.
Figure 1: Nitrogen requirement and composition of nitrogen supply during the different growth stages of potatoes
The nitrogen supply strongly depends on the conditions for N mineralisation (weather, humus content of the soil, preceding crop residues). Thus, optimising the N supply is complex (Figure 1).
Applicability box Theme Nutrient availability, pest and disease control, crop-specific measures Geographical coverage Potato cultivation areas Application time After emergence Required time Additional fertiliser application Period of impact Potato crop Equipment Standard fertiliser spreader Best in Potatoes
Merkblatt2017 | Ausgabe Schweiz
2017
TEC
HN
ICA
L G
UID
E
Potatoes are very suitable for direct marketing due to their popularity and versatility. But good yields are needed for commercial production to cover the high costs of cultivation and mechanisation. The very high quality requirements at every stage of market-ing require the highest care from seed
preparation to plant protection, nutri-ent and water supply to harvest and storage.This guide provides a good basis for achieving high-quality products. Com-mercial potato farms complement their knowledge with the help of experts and further literature.
netarable
This publication results from the Organic Knowledge Network Arable project
funded by the Horizon 2020 programme of the European Union.
IMPROVING HEALTH AND WELFARE OF PIGS
shop.�bl.org

Research Institute of Organic Agriculture FiBL IFOAM – Organics International
The World of Organic Agriculture Statistics and Emerging Trends 2018
Edited by Helga Willer and Julia Lernoud
For PDF version, corrigenda and supplementary material see http://www.organic-world.net/yearbook/yearbook-2018.html

All of the statements and results contained in this book have been compiled by the authors and are to the best of their knowledge correct and have been checked by the Research Institute of Organic Agriculture (FiBL) and IFOAM – Organics International. However, the possibility of mistakes cannot be ruled out entirely. Therefore, the editors, authors, and publishers are not subject to any obligation and make no guarantees whatsoever regarding any of the statements or results in this work; neither do they accept responsibility or liability for any possible mistakes, nor for any consequences of actions taken by readers based on statements or advice contained therein. Authors are responsible for the content of their own articles. Their opinions do not necessarily express the views FiBL or IFOAM – Organics International. This document has been produced with the support of the International Trade Centre (ITC), the Swiss State Secretariat for Economic Affairs (SECO), and NürnbergMesse. The views expressed herein can in no way be taken to reflect the official opinions of ITC, SECO, or NürnbergMesse. Should corrections and updates become necessary, they will be published at www.organic-world.net. This book is available for download at http://www.organic-world.net/yearbook/yearbook-2018.html. Any enquiries regarding this book and its contents should be sent to Julia Lernoud and Helga Willer, FiBL, Ackerstrasse 113, 5070 Frick, Switzerland, e-mail [email protected] and [email protected]. Please quote articles from this book individually with name(s) of author(s) and title of article. The same applies to the tables: Please quote source, title of table and then the overall report. The whole report should be cited as: Willer, Helga and Julia Lernoud (Eds.) (2018): The World of Organic Agriculture. Statistics and Emerging Trends 2018. Research Institute of Organic Agriculture (FiBL), Frick, and IFOAM – Organics International, Bonn. Die Deutsche Bibliothek – CIP Cataloguing-in-Publication-Data A catalogue record for this publication is available from Die Deutsche Bibliothek © February 2018. Research Institute of Organic Agriculture (FiBL) and IFOAM – Organics International. Research Institute of Organic Agriculture (FiBL), Ackerstrasse113, 5070 Frick, Switzerland, Tel. +41 62 865 72 72, Fax +41 62 865 72 73, e-mail [email protected], Internet www.fibl.org IFOAM – Organics International, Charles-de-Gaulle-Str. 5, 53113 Bonn, Germany, Tel. +49 228 926 50-10, Fax +49 228 926 50-99, e-mail [email protected], Internet www.ifoam.bio, Trial Court Bonn, Association Register no. 8726 Language editing: Laura Kemper and Simon Moakes, FiBL, Frick, Switzerland Cover: Kurt Riedi, FiBL, Frick, Switzerland Layout: Julia Lernoud and Helga Willer, FiBL, Frick, Switzerland Maps: Simone Bissig and Julia Lernoud, FiBL, Frick, Switzerland Graphs (if not otherwise stated): Julia Lernoud and Helga Willer, FiBL, Frick, Switzerland Infographic: Kurt Riedi, FiBL, Frick, Switzerland Cover picture: Certified organic cattle property in Australia. © Arcadian Organic & Natural Meat Co. Printed by Medienhaus Plump, Rolandsecker Weg 33, 53619 Rheinbreitbach, Germany Price: 30 Euros, IFOAM – Organics International affiliates: 20 Euros Printed copies of this volume may be ordered directly from IFOAM – Organics International and FiBL (see addresses above) or via the IFOAM – Organics International website at www.ifoam.bio or the FiBL shop at shop.fibl.org Printed version ISBN 978-3-03736-067-5 PDF version ISBN 978-3-03736-068-2

Table of Contents
FiBL & IFOAM – Organics International (2018): The World of Organic Agriculture. Frick and Bonn 3
Table of contents Glossary 12 Foreword from SECO and ITC 13 Foreword from FiBL and IFOAM – Organics International 14 Foreword from the Editors 15 Acknowledgements 16 Organic Agriculture: Key Indicators and Top Countries 21 The World of Organic Agriculture 2018: Summary 22 Helga Willer, Julia Lernoud, and Laura Kemper ORGANIC AGRICULTURE WORLDWIDE: CURRENT STATISTICS 32 Current Statistics on Organic Agriculture Worldwide: Area, Operators, and Market 34 Julia Lernoud and Helga Willer General notes on the data 36 Organic land 38
› Organic agricultural land 38 › Organic share of total agricultural land 42 › Growth of the organic agricultural land 46 › Further organic areas 53
Organic producers and other operator types 60 Retail sales and international trade data 67 Organic farming in developing countries and emerging markets 72
Land use and key commodities in organic agriculture 74 › Land use 74 › Arable land 78 › Permanent crops 80 › Wild collection and beekeeping areas 82 › Beehives 86 › Aquaculture 88 › Statistics on selected crops 91 › › Cereals 92 › › Citrus fruit 96 › › Cocoa beans 99 › › Coffee 101 › › Dry pulses 103 › › Fruit: Temperate fruit 106 › › Fruit: Tropical and subtropical fruit 110 › › Grapes 114 › › Oilseeds 116 › › Olives 120 › › Vegetables 122

Table of Contents
4 FiBL & IFOAM – Organics International (2018): The World of Organic Agriculture. Frick and Bonn
COMMODITY CASE STUDIES 127 The State of Sustainable Markets: Statistics and Emerging Trends – 2017 128 Julia Lernoud, Jason Potts, Gregory Sampson, Salvador Garibay, Matthew Lynch, Vivek Voora, Helga Willer and Joseph Wozniak Organic Cotton 137 Liesl Truscott, Evonne Tan, Lisa Emberson, Nicole Lambert, and Amish Gosai
› Global Trends 137 › Outlook 138 › Geography of production 138 › Organic Farm and Textile Standards 142 › Conclusion 143
GLOBAL MARKET 145 The Global Market for Organic Food & Drink 146 Amarjit Sahota
› Introduction 146 › North America 146 › Europe 147 › Other regions 147 › The organic consumer 148 › Challenges & growth outlook 149
STANDARDS AND REGULATIONS 151 Standards and Regulations 152 Beate Huber, Otto Schmid, and Verena Batlogg
› Organic legislation worldwide: current situation 152 › The Codex Alimentarius Guidelines: Recent developments 157 › Import requirements of major economies 158
PGS in 2017 – Trends and Latest Figures 161 Flávia Moura e Castro and Federica Varini Processed with care? Comparing Different Organic Regulations and Standards for Major Markets 165 Verena Batlogg, Otto Schmid, and Beate Huber The First Global Compilation of Policies Supporting Organic Agriculture 170 Joelle Katto-Andrighetto AFRICA 173 Latest Developments in Organic Agriculture in Africa 174 Jordan Gama
› The African Organic Network (AfrONet) 174 › Organic agriculture conferences 175 › Strategic Plan (2015-2025) for the Ecological Organic Agriculture
Initiative (EOAI) for Africa 175 › Outlook 176

Table of Contents
FiBL & IFOAM – Organics International (2018): The World of Organic Agriculture. Frick and Bonn 5
Africa: Current Statistics 177 Julia Lernoud, Helga Willer and Bernhard Schlatter Organic Agriculture in Africa: Graphs 179 Organic Agriculture in Africa: Tables 182 ASIA 187 Asia Sector Report 188 Compiled by IFOAM Asia
› Summary 188 › Achievements of IFOAM Asia in 2017 196 › Contributors by country 197
Working in Partnership with Local Governments - the ALGOA Project 198 Jennifer Chang Asia: Current statistics 200 Julia Lernoud, Helga Willer, and Bernhard Schlatter Organic Agriculture in Asia: Graphs 202 Organic Agriculture in Asia: Tables 204 EUROPE 208 Organic in Europe: Prospects and Developments 210 Helga Willer, Stephen Meredtih, Bram Moeskops, and Emanuele Busacca
› EU policy and regulatory framework for the organic sector 211 › Research 213 › OK-Net platforms for farmers to exchange knowledge 214 › Science Day 2017 at Biofach 214 › TP Organics 215 › FiBL Europe 215 › Organic Roadmap for Sustainable Food and Farming 215
Europe and the European Union: Key indicators 2016 217 Organic Farming and Market Development in Europe and the European Union 218 Helga Willer, Diana Schaack, and Julia Lernoud
› 1 Production and market highlights 219 › 2 Organic agricultural land 220 › 3 Land use and crops grown in organic agriculture 227 › 4 Organic livestock 233 › 5 Producers, processors, importers, and exporters 236 › 6 Organic retail sales 239 › 7 Conclusion 248 › 8 Acknowledgements 248 › 9 References and further reading 249
Organic Agriculture in Europe: Tables 250 Organic in Ukraine 256 Olga Trofimtseva and Natalie Prokopchuk
Table of Contents
6 FiBL & IFOAM – Organics International (2018): The World of Organic Agriculture. Frick and Bonn
MEDITERRANEAN COUNTRIES 261 Organic Agriculture in the Mediterranean Region: Recent Data Outline 262 Marie Reine Bteich, Patrizia Pugliese, Lina Al-Bitar, and Suzana Madžarić
› Latest figures 262 › Organic share of the agricultural area 264 › A focus on processors 264 › A focus on data collection 265
LATIN AMERICA AND THE CARIBBEAN 267 Latin America and the Caribbean 268 Patricia Flores
› Inter-American Commission for Organic Agriculture (CIAO) 268 › Country reports 269 › Regional meetings of the agroecological and organic movement 272
Latin America and the Caribbean: Current statistics 275 Julia Lernoud, Helga Willer, and Bernhard Schlatter Organic Agriculture in Latin America and Caribbean: Graphs 277 Organic Agriculture in Latin America and Caribbean: Tables 279 NORTH AMERICA 283 U.S. organic sales set new records 284 Barbara Fitch Haumann
› Consumer trends 284 › Production growth 285 › Integrity of imports 285 › Animal welfare 286 › Advocating for organic 286 › Rallying check-off support 287 › Advocating for organic research 287 › International trade 288
Canada 289 Tia Loftsgard and Jill Guerra
› Data collection 289 › Expansion of organic operations and acreage 290 › Research and innovation 291 › Market growth and trends 291 › Canada organics on the global stage 292 › Challenges ahead 293

Table of Contents
FiBL & IFOAM – Organics International (2018): The World of Organic Agriculture. Frick and Bonn 7
North America: Current statistics 296 Julia Lernoud, Helga Willer, and Bernhard Schlatter Organic Agriculture in North America: Graphs 298 Organic Agriculture in North America: Tables 300 OCEANIA 301 Australia 302 Andrew Lawson, Andrew Monk, and Amy Cosby
› Introduction 302 › Primary producers and area of farmland 302 › Exports 303 › Regulatory framework 305 › Competitive exports 306 › A new peak structure and voice for organics in Australia? 306 › Review of export regulations 307 › Common voluntary organic logo for Australia 307
The Pacific Islands 309 Karen Mapusua
› Recent developments 309 › Third-party certification 310 › Market & trade 311 › Legislation 312 › Government and international support 312 › Outlook 312
Oceania: Current statistics 314 Julia Lernoud, Helga Willer, and Bernhard Schlatter Organic Agriculture in Oceania: Graphs 315 Organic Agriculture in Oceania: Tables 317 ACHIEVEMENTS AND OUTLOOK 319 A new narrative for the organic movement and IFOAM – Organics International 320 Markus Arbenz
› The umbrella 320 › The new narrative 321 › The institutional context 322
ANNEX 325 Key Indicators by Country and Region 326 Data Providers and Data Sources 330

Table of Contents
8 FiBL & IFOAM – Organics International (2018): The World of Organic Agriculture. Frick and Bonn
Tables Table 1: Countries and territories covered by the global survey on organic agriculture 2016 35 Table 2: World: Organic agricultural land (including in-conversion areas) and regions’ shares of the global organic agricultural land 2016 38 Table 3: World: Organic agricultural land (including in-conversion areas) by country 2016 (sorted) 40 Table 4: World: Organic agricultural land (including in-conversion areas) and organic share of total agricultural land by region 2016 42 Table 5: World: Organic shares of total agricultural land by country 2016 (sorted) 44 Table 6: World: Organic agricultural land (including in-conversion areas) by region: growth 2015-2016 46 Table 7: World: Development of organic agricultural land by country 2013-2016 48 Table 8: World: Organic areas: Agricultural land (including conversion areas) and further organic areas by region in 2016 54 Table 9: World: Organic areas: Agricultural land (including conversion areas) and further organic areas by country 2016 54 Table 10: World: Development of the numbers of producers by region 2015 to 2016 60 Table 11: World: Organic producers and other operator types by country 2016 62 Table 12: Global market data: Retail sales and per capita consumption by region 2016 68 Table 13: Global market data: Retail sales, organic share of all retail sales, per capita consumption, and exports by country 2016 70 Table 14: Countries on the DAC list: Development of organic agricultural land 2011-2016 73 Table 15: World: Land use in organic agriculture by region (including in-conversion areas) 2016 77 Table 16: World: Land use and crop categories in organic agriculture worldwide 2016 77 Table 17: Use of organic arable land (including in-conversion areas), 2015 and 2016 compared 78 Table 18: Use of organic permanent cropland (including in-conversion areas), 2015 and 2016 compared 80 Table 19: Wild collection and beekeeping areas by region 2015 and 2016 compared 82 Table 20: Wild collection and beekeeping areas by crop group 2016 82 Table 21: Wild collection and beekeeping areas by country 2016 84 Table 22: Number of organic beehives by country 2016 87 Table 23: Organic aquaculture: Production volume by species 2016 88 Table 24: Organic aquaculture: Production volume by country 2016 90 Table 25: World: Selected key crop groups and crops in organic agriculture 2016 (overview): Land under organic management (including conversion areas) 91 Table 26: Cereals: Organic area by country 2016 94 Table 27: Citrus fruit: Organic area by country 2016 98 Table 28: Cocoa beans: Organic area by country 2016 100 Table 29: Coffee: Organic area by country 2016 102 Table 30: Dry pulses: Organic area by country 2016 104 Table 31: Temperate fruit: Organic area by crop 2016 106 Table 32: Temperate fruit: Organic area by country 2016 108 Table 33: Tropical and subtropical fruit: Organic area by crop 2016 111 Table 34: Tropical and subtropical fruit: Organic area by country 2016 112 Table 35: Grapes: Organic area by country 2016 115 Table 36: Oilseeds: Organic area by crop 2016 116 Table 37: Oilseeds: Organic area by country 2016 118 Table 38: Olives: Organic area by country 2016 121 Table 39: Vegetables: Organic area by country 2016 123 Table 40: Organic cotton farmers, area and production 2015/2016 139 Table 41: Countries with regulations on organic agriculture 2017 154 Table 42: Countries in the process of drafting regulations 2017 156 Table 43: Countries with a national standard but without a national legislation 2017 156 Table 44: Africa: Organic agricultural land, organic share of total agricultural land and number of organic producers 2016 182 Table 45: Africa: All organic areas 2016 183 Table 46: Africa: Land use in organic agriculture 2016 184 Table 47: Africa: Use of wild collection areas 2016 185 Table 48: Asia: Organic agricultural land, organic share of total agricultural land, and number of producers 2016 204 Table 49: Asia: All organic areas 2016 205 Table 50: Asia: Land use in organic agriculture (fully converted and in conversion) 2016 206

Table of Contents
FiBL & IFOAM – Organics International (2018): The World of Organic Agriculture. Frick and Bonn 9
Table 51: Asia: Use of wild collection areas 2016 207 Table 52: Europe and the European Union: Key indicators 2016 217 Table 53: Europe: Organic agricultural land in Europe and the European Union 220 Table 54: Europe and the European Union: Land use 2016 227 Table 55: Europe and the European Union: Key crops/crop group 2016 230 Table 56: Europe and the European Union: Organic livestock 2016 233 Table 57: Europe: Organic operators by country group 2016 236 Table 58: Europe and the European Union: Organic retail sales 2016: Key data 239 Table 59: Organic shares for retail sales values (euros) for selected products 2016 246 Table 60: Europe: Organic agricultural land by country 2016 250 Table 61: Europe: Conversion status of organic agricultural land 2016 251 Table 62: Europe: Land use in organic agriculture by country 2016 252 Table 63: Europe: Organic agricultural land and wild collection areas by country 2016 253 Table 64: Europe: Organic producers’ processors and importers by country 2016 254 Table 65: Europe: The organic food market 2016 255 Table 66: Organic statistics in EU Med, Candidate and Potential Candidate (CPC) and Southern and Eastern Mediterranean (SEM) countries, 2016 263 Table 67: Latin America: Organic agricultural land, organic share of total agricultural land, and number of producers 2016 279 Table 68: Latin America: All organic areas 2016 280 Table 69: Latin America: Land use in organic agriculture 2016 281 Table 70: Latin America: Use of wild collection areas 2016 282 Table 71: North America: Organic agricultural land, organic share of total agricultural land, and number of producers 2016 300 Table 72: North America: All organic areas 2016 300 Table 73: North America: Land use in organic agriculture 2016 300 Table 74: Estimated certified organic primary production operations and area [ha] in Australia 2002-2016 303 Table 75: Pacific region: Main products, which are currently organically certified 311 Table 76: Oceania: Organic agricultural land, organic share of total agricultural land, and number of producers 2016 317 Table 77: Oceania: All organic areas 2016 317 Table 78: Oceania: Land use in organic agriculture 2016 318 Table 79: Organic agricultural land (including in-conversion areas): Key indicators by region 2016 326 Table 80: Organic agricultural land, share of total agricultural land, number of producers, and retail sales 2016 326
Figures Figure 1: World: Distribution of organic agricultural land by region 2016 39 Figure 2: World: The ten countries with the largest areas of organic agricultural land 2016 39 Figure 3: World: Countries with an organic share of the total agricultural land of at least 10 percent 2016 43 Figure 4: World: Distribution of the organic shares of the agricultural land 2016 43 Figure 5: World: Growth of the organic agricultural land and organic share 1999-2016 47 Figure 6: World: Growth of the organic agricultural land by continent 2008 to 2016 47 Figure 7: World: The ten countries with the highest increase of organic agricultural land 2016 48 Figure 8: World: Distribution of all organic areas 2016. Total: 97.5 million hectares 53 Figure 9: World: Distribution of organic producers by region 2016 (Total: 2.7 million producers) 61 Figure 10: World: The ten countries with the largest numbers of organic producers 2016 61 Figure 11: Global market for organic food: Distribution of retail sales by country 2016 68 Figure 12: Global market for organic food: Distribution of retail sales by region 2016 68 Figure 13: Global market: The countries with the largest markets for organic food 2016 69 Figure 14: Global market: The ten countries with the highest per capita consumption 2016 69 Figure 15 (left): Countries on the DAC list: The ten countries with the largest areas of organic agricultural land in 2016 73 Figure 16 (right): Countries on the DAC list: The ten countries with the highest organic shares of the total agricultural land in 2016 73 Figure 17: World: Distribution of main land use types by region 2016 75 Figure 18: World: Distribution of main land use types and key crop categories 2016 76 Figure 19: World: Development of organic arable land, permanent cropland and permanent grassland/grazing areas 2004-2016 76 Figure 20: World: Distribution of organic arable cropland by region 2016 79

Table of Contents
10 FiBL & IFOAM – Organics International (2018): The World of Organic Agriculture. Frick and Bonn
Figure 21: World: Use of arable cropland by crop group 2016 79 Figure 22: World: Distribution of permanent cropland by region 2016 81 Figure 23: World: Use of permanent cropland by crop group 2016 81 Figure 24: World: Distribution of organic wild collection and beekeeping areas by region in 2016 83 Figure 25: World: The ten countries with the largest organic wild collection and beekeeping areas in 2016 83 Figure 26: World: Distribution of organic beehives by region in 2016 86 Figure 27: World: Development of the organic beehives 2007-2016 87 Figure 28: World: Organic aquaculture production volume: Distribution by continent and top 10 countries 2016 89 Figure 29: World: Organic aquaculture production volume: Distribution by species and key species 2016 89 Figure 30: Cereals: Development of the global organic area 2004-2016 93 Figure 31: Cereals: Distribution of global organic area by cereal type 2016 93 Figure 32: Citrus fruit: Development of the global organic area 2004-2016 and distribution of the organic citrus area by citrus type and by region 2016 97 Figure 33: Cocoa beans: Development of the global organic area 2004-2016 99 Figure 34: Coffee: Development of the global organic area 2004-2016 101 Figure 35: Dry pulses: Development of the global organic area 2004-2016 104 Figure 36: Temperate fruit: Use of organic temperate fruit area 2016 107 Figure 37: Temperate fruit: Development of the global organic area 2004-2016 107 Figure 38: Tropical and subtropical fruit: Distribution of global organic area by crop 2016 111 Figure 39: Tropical and subtropical fruit: Development of the global organic area 2004-2016 112 Figure 40: Grapes: Development of the global organic area 2004-2016 114 Figure 41: Oilseeds: Development of the global organic oilseed area 2004-2016 117 Figure 42: Oilseeds: Use of organic oilseed area by crop 2016 117 Figure 43: Organic olive area: Distribution by region and top 10 producing countries 2016 120 Figure 44: Olives: Development of the global organic area 2004-2016 121 Figure 45: Vegetables: Development of the global organic area 2004-2016 123 Figure 46: Development of the VSS compliant area worldwide, 2008-2015 (eight selected commodities, minimum possible) 129 Figure 47: Total certified area per VSS, 2015 (only agriculture) 130 Figure 48: Bananas: Development of the area by VSS, 2008–2015 133 Figure 49: Cocoa: Development of the area by VSS 2008–2015 133 Figure 50: Coffee: Development of the area by VSS, 2008–2015 134 Figure 51: Cotton: Development of the area by VSS, 2008–2015 134 Figure 52: Oil palm: Development of the area by VSS, 2008–2015 135 Figure 53: Soybeans: Development of the area by VSS, 2008–2015 135 Figure 54: Sugarcane: Development of the area by VSS, 2008–2015 136 Figure 55: Tea: Development of the area by VSS, 2008–2015 136 Figure 56: Organic cotton: Global trend in organic cotton production 138 Figure 57: Growth of GOTS and OCS certified facilities 2013-2016 143 Figure 58: Growth in organic food & drinks sales and farmland, 2001-2016 149 Figure 59: Africa: The ten countries with the largest organic agricultural area 2016 179 Figure 60: Africa: The countries with the highest organic share of total agricultural land 2016 179 Figure 61: Africa: Development of organic agricultural land 2000 to 2016 180 Figure 62: Africa: Use of organic agricultural land 2016 180 Figure 63: Africa: The ten countries with the largest number of organic producers 2016 181 Figure 64: Asia: The ten countries with the largest organic agricultural area 2016 202 Figure 65: Asia: The countries with the highest organic share of total agricultural land 2016 202 Figure 66: Asia: Development of organic agricultural land 2000 to 2016 203 Figure 67: Asia: Use of organic agricultural land 2016 203 Figure 68: Europe and the European Union: Cumulative growth of organic farmland and retail sales compared 2000-2016 210 Figure 69: Europe: Distribution of organic farmland by country 2016 220 Figure 70: Europe: Organic agricultural land by country 2016 221 Figure 71: Europe: Organic shares of total agricultural land 2016 223 Figure 72: Europe and the European Union: Development of organic agricultural land 1985-2016 224 Figure 73: Europe: Growth rates for organic agricultural land in Europe and the European Union 1985-2016 224 Figure 74: Europe: The ten countries with the highest growth of organic agricultural land in hectares and percentage in 2016 225

Table of Contents
FiBL & IFOAM – Organics International (2018): The World of Organic Agriculture. Frick and Bonn 11
Figure 75: Europe and the European Union: Conversion status of organic land in Europe and the European Union 2016 226 Figure 76: Europe: Distribution of land use in organic agriculture 2016 227 Figure 77: Europe: Land use in organic agriculture by top 10 countries 2016 228 Figure 78: Europe: Growth of organic agricultural land by land use type 2004-2016 229 Figure 79: European Union: Growth of organic agricultural land by land use type 2004-2016 229 Figure 80: Europe: Growth of selected arable and permanent crop groups in Europe 2007 to 2016 232 Figure 81: Europe and the European Union: Development of organic cows’ milk production 2007-2016 235 Figure 82: Europe and the European Union: Development of organic producers in 2000-2016 237 Figure 83: Europe: Distribution of organic producers and processors by country 2016 237 Figure 84: Europe: Numbers of organic producers by country 2016 238 Figure 85: Europe: Distribution of retail sales by country and by single market worldwide 2016 239 Figure 86: Europe: Retail sales by country 2016 240 Figure 87: Europe: Growth of organic retail sales in Europe and the European Union, 2000-2016 241 Figure 88: Europe: The countries with the highest organic market growth 2016 242 Figure 89: Europe: The countries with the highest per capita consumption 2016 243 Figure 90: Europe: Growth of the per capita consumption 2000-2016 243 Figure 91: Europe: The countries with the highest shares of the total retail sales 2016 244 Figure 92: Europe: Marketing channels for organic products in selected countries 2016 247 Figure 93: Ukrainian state organic logo 259 Figure 94: Share of organic operators involved in processing in the EU Med, candidate and potential candidate (CPC), and southern and eastern Mediterranean (SEM) countries, 2016 265 Figure 95: Ecuador: Agrocalidad organic seal 271 Figure 96: Chile: National organic seal 272 Figure 97: Latin America and Caribbean: The ten countries with the largest areas of organic agricultural land 2016 277 Figure 98: Latin America and Caribbean: The ten countries with the highest organic share of total agricultural land 2016 277 Figure 99: Latin America and Caribbean: Development of organic agricultural land 2000-2016 278 Figure 100: Latin America and Caribbean: Use of agricultural organic land 2016 278 Figure 101: Canada organic logo 291 Figure 102: Canada: Tracked certified organic imports by volume and value, 2009-2016 292 Figure 103: North America: Organic agricultural land in Canada and the United States 2016 298 Figure 104: North America: Organic share of total agricultural land in Canada and the United States 2016 298 Figure 105: North America: Development of organic agricultural land 2000-2016 299 Figure 106: North America: Land use in organic agriculture 2016 299 Figure 107: Estimated percentage of certified export volume from Australia destined for global regions 2016 304 Figure 108: Oceania: Organic agricultural land by country 2016 315 Figure 109: Oceania: Organic share of total agricultural land by country 2016 315 Figure 110: Oceania: Development of organic agricultural land 2000-2016 316 Figure 111: The theory of change of IFOAM – Organics International 322 Figure 112: The institutional context 323
Maps Map 1: Organic agricultural land and non-agricultural areas in 2016 33 Map 2: Organic agricultural land in the countries of Africa 2016 173 Map 3: Organic agricultural land in the countries of Asia 2016 187 Map 4: Organic agricultural land in the countries of Europe 2016 209 Map 5: Organic agricultural land in the countries of Latin America and the Caribbean 2016 267 Map 6: Organic agricultural land in Canada and the United States 2016 283 Map 7: Organic agricultural land in the countries of Oceania 2016 301

Glossary
12 FiBL & IFOAM – Organics International (2018): The World of Organic Agriculture. Frick and Bonn
Glossary €/person: Per capita consumption in euros AMI: Agrarmarkt-Informationsgesellschaft - Agricultural Market Information Company, Germany CAP: Common Agricultural Policy of the European Union CIHEAM: Centre international de hautes études agronomiques méditerranéennes CNCA: China National Certification and Accreditation Administration COROS: Common Objectives and Requirements of Organic Standards (COROS) are the Standards Requirements of COTA: Canada Organic Trade Association, Canada CPC: Candidates and Potential Candidates for the European Union EFTA: European Free Trade Association EOA: Ecological Organic Agriculture; Ecological Organic Agriculture Initiative for Africa EU: European Union EU-28: Member countries of the European Union EU-Med: European Mediterranean Countries Eurostat: Statistical office of the European Union, Luxembourg FAO: Food and Agriculture Organisation of the United Nations FAOSTAT: Statistics Division of FAO, the Food and Agriculture Organisation of the United Nations FiBL: Forschungsinstitut für biologischen Landbau – Research Institute of Organic Agriculture, Switzerland FYROM: The Former Yugoslav Republic of Macedonia GMO: Genetically Modified Organisms GOTS: Global Organic Textile Standard Ha: Hectares Hivos: Dutch Humanist Institute for Cooperation Horizon 2020: Research and Innovation programme of the European Union, running from 2014 to 2020 HS codes: Harmonized System Codes IAMB: L'Istituto Agronomico Mediterraneo di Bari – Mediterranean Agronomic Institute Bari, Italy IFAD: International Fund for Agricultural Development IFOAM EU Group: European Union Group of IFOAM – Organics International IISD: International Institute of Sustainable Development, Canada ISOFAR: International Society of Organic Agriculture Research, Germany ITC: International Trade Centre, Switzerland Mio.: Million MOAN: Mediterranean Organic Agriculture Network, Italy MT: Metric tons NASAA: National Association for Sustainable Agriculture, Australia NASS: USDA’s National Agricultural Statistics Services, United States of America OCS: Organic Content Standard OrganicDataNetwork: Data network for better European organic market information OTA: Organic Trade Association, United States of America PGS: Participatory Guarantee Systems POETcom: Pacific Organic and Ethical Trade Community SECO: State Secretariat for Economic Affairs, Switzerland SEM: Southern and Eastern Mediterranean countries SÖL: Stiftung Ökologie & Landbau – Foundation Ecology & Agriculture, Germany SSI: State of Sustainability Initiatives, Canada SOAAN: Sustainable Organic Agriculture Action Network TIPI: Technology Innovation Platform of IFOAM – Organics International TP Organics: European Technology Platform for Organic Food and Farming U.S.: United States USDA: United States Department of Agriculture VSS: Voluntary Sustainability Standards
Foreword from SECO and ITC
FiBL & IFOAM – Organics International (2018): The World of Organic Agriculture. Frick and Bonn 13
Foreword from SECO and ITC
This book provides a clear statement on the resilience of the organic market trend. On the consumer side, organic products with a total value of almost 90 billion US dollars were sold globally in 2016. Double-digit rates were recorded in many advanced markets for organic products, and a growth rate of even 20 percent and more of the organic retail sales value was noticed for Ireland and France in 2016. In Switzerland, where the market has been evolving over several years with high growth rates, it grew by 8.4 percent. The production side is also keeping pace: The latest data shows that organic farmland has grown in many countries, and the total organic area increased to almost 58 million hectares, managed by over 2.7 million producers. In particular, for some crops such as citrus fruit, dry pulses, grapes, area growth rates of 15 percent and more were reached in 2016.
On the other hand, the importance of other sustainability standards is increasing. Data on the performance of these Voluntary Sustainability Standards (VSS) are still scarce; therefore, collecting timely and accurate market data to facilitate policy and investment decisions is important for policymakers, market actors, and donors. The Research Institute of Organic Agriculture (FiBL), the State of Sustainability Initiatives (SSI) of the International Institute of Sustainable Development (IISD), and the International Trade Centre (ITC) have partnered with the support of SECO in a joint data publication effort to ensure continuous, accurate, and relevant reporting. Since 2014, this partnership has been collecting data from 14 VSS with a special focus on nine selected commodities. The new data will be published in May 2018, in the new edition of The State of Sustainable Markets.
It is essential for the organic community to gather relevant information on organic market trends in order to continue attracting various stakeholders. Transparent information enables credibility and informed decisions on the costs and benefits of organic production for both the producer and the buyer. This book makes a major contribution to such transparency.
Considering the latest figures and the continuous and sustainable growth over many years, the organic movement can look confidently to the future.
Monica Rubiolo Head of the Division for Trade Promotion Swiss State Secretariat for Economic Affairs (SECO) Bern, Switzerland
Joseph Wozniak Manager of the Trade for Sustainable Development (T4SD) Programme International Trade Centre (ITC) Geneva, Switzerland

Foreword from FiBL and IFOAM – Organics International
14 FiBL & IFOAM – Organics International (2018): The World of Organic Agriculture. Frick and Bonn
Foreword from FiBL and IFOAM – Organics International
Data collection is a major and constant concern of the Research Institute of Organic Agriculture (FiBL) and IFOAM – Organics International. The comprehensive data provided in this publication serve as an important tool for stakeholders, policymakers, authorities, and the industry, as well as for researchers and extension professionals. It has also proven useful in development programs and supporting strategies for organic agriculture and markets, and crucial for monitoring the impact of these activities. The data collection on organic farming worldwide has become one of the most frequently quoted pieces of literature in scientific, technical and descriptive papers and reports on organic agriculture.
With this edition, FiBL and IFOAM – Organics International are presenting “The World of Organic Agriculture” for the 19th time and the good news continues: more area, more producers, and a continuously growing global market.
Growing markets also mean higher added value on millions of farms. And it means 57.8 million hectares of increased soil fertility, farm and field diversity and billions of farm animals raised under animal welfare standards. This is an important contribution to the Sustainable Development Goals of the United Nations.
We would like to express our thanks to all authors and data providers for contributing in-depth information and figures on their region, their country or their field of expertise.
We are grateful to Swiss State Secretariat for Economic Affairs (SECO) and the International Trade Centre (ITC) for their support.
Frick and Bonn, February 2018
Prof. Dr. Urs Niggli Director Research Institute of Organic Agriculture FiBL Frick, Switzerland
Markus Arbenz Executive Director IFOAM – Organics International Bonn, Germany

Foreword from the Editors
FiBL & IFOAM – Organics International (2018): The World of Organic Agriculture. Frick and Bonn 15
Foreword from the Editors
In the 19th edition of “The World of Organic Agriculture,” we are presenting, like in the past, the latest available data on organic agriculture worldwide – data on area, operators, and retail sales. This data is provided by a large number of data suppliers from all over the world, to whom we are very grateful!
Knowledgeable authors have contributed articles on their regions, their countries, or their fields of expertise. As in the past, we have the global market report from Ecovia Intelligence, regional reports on Africa, Asia, Europe, the Mediterranean, Latin America and the Caribbean, and the Pacific Region, as well as country reports on Australia, Canada, Ukraine, and the United States.
Furthermore, we have included an article on organic cotton from the Textile Exchange and a chapter on Voluntary Sustainability Standards.
In our section “Standards and Regulations,” in addition to the annual update on organic regulations and Participatory Guarantee Systems, we also present a comparison of different organic processing standards and regulations for major markets.
We maintain our Organic-World.net website, where information on organic agriculture worldwide is available as well as the statistical yearbook on “The World of Organic Agriculture.” The news section of the website offers information about major developments in the field of organic agriculture, and via our Twitter account at www.twitter.com/FiBLStatistics, we keep our readers informed about the latest data on organic agriculture.
Furthermore, we have created the statistics website statistics.fibl.org, where the key data are available as interactive tables.
Julia Lernoud and Helga Willer
Research Institute of Organic Agriculture FiBL Frick, Switzerland

Acknowledgements
16 FiBL & IFOAM – Organics International (2018): The World of Organic Agriculture. Frick and Bonn
Acknowledgements The Research Institute of Organic Agriculture FiBL and IFOAM – Organics International are very grateful to their supporters for granting financial support for the global data collection and for the 2018 edition of “The World of Organic Agriculture”: the International Trade Centre (ITC), Geneva, Switzerland, the Swiss State Secretariat for Economic Affairs (SECO), Economic Development and Cooperation (within the framework of its support activities for organic production in developing countries), Bern, Switzerland, and NürnbergMesse, the organizers of BIOFACH, Nürnberg, Germany.
Numerous individuals have contributed to the making of this work. The editors are very grateful to all those listed below, without whom it would not have been possible to produce this yearbook.
Ibrahim Abdalhamid, Ministry of Agriculture and Rural Development; Mohamed Salih Abdalla, Organic Farming Project, GIZ International Services, Riyadh, Saudi Arabia; Hadjira Houria Abdellaoui, Ministry of Agriculture and Rural Development, Algeria; Gyorgyi Acs Feketene, Control Union Certifications, Zwolle, The Netherlands; Olugbenga O. AdeOluwa, University of Ibadan, Ibadan, Nigeria; Iskenderbek Aidaraliev, BIO-KG Federation of Organic Development, Bishkek, Kyrgyzstan; Florence Aillery, Ministry of Agriculture, Food and Forestry, France; Lina Al Bitar, CIHEAM - IAM Bari, Valenzano, Italy; Mazen Al Madani, Ministry of Agriculture and Agrarian Reform, Damascus, Syria; Khurshid Alam, Bangladesh Agricultural Research Institute (BARI), Bangladesh; Saif Moh Al-Shara, Ministry of Environment and Water, Agricultural Affairs and Animal Sector, Dubai, United Arab Emirates; Asan Alymkulov, BIO-KG Federation of Organic Development, Kyrgyzstan; Stoilko Apostolov, Bioselena: Foundation for organic agriculture, Karlovo, Bulgaria; Markus Arbenz, IFOAM - Organics International, Bonn, Germany; Mohammad Reza Ardakani, IFOAM-IRAN, Karaj, Iran; Lidya Ariesusanty, Indonesia Organic Alliance IOA, Bogor, Indonesia; Estevan Assi, Toledo Cacao Growers Association, Belmopan, Belize; Pranita Aswale, Ecocert Romania, Bucuresti, Romania; Angel Atallah, CCPB/IMC, Beirut, Lebanon; Mustafa Avci, ECOCERT IMO Denetim ve Belgelendirme Ltd. Sti, Izmir, Turkey; Elhag Meki Ali Awouda, Federal Ministry of Agriculture & Irrigation, Sudan; Roberto Azofeifa, Ministerio de Agricultura y Ganadería, San José, Costa Rica; Vugar Babayev, Ganja Agribusiness Association (GABA), Ganja City, Azerbaijan; Christian Báez, Agrocalidad, Quito, Ecuador; Ebba Barany, Eurostat, Luxembourg; Verena Batlogg, Research Institute of Organic Agriculture FiBL, Frick, Switzerland; Andrew Bayliss, Soil Association, Bristol, United Kingdom; Elif Bayraktar Öktem, Ministry of Food, Agriculture and Livestock, Ankara, Turkey; Milena Belli, Istituto per la Certificazione Etica e Ambientale (ICEA), Bologna. Italy; Olena Berezovska, Reform Support Team at the Ministry of Agrarian Policy and Food of Ukraine, Kyiv, Ukraine; Florian Bernardi, Klaus Büchel Anstalt, Mauren, Liechtenstein; Eva Berre, Ecocert International, L’Isle Jourdain, France; Paulina Betancourt, Agrocalidad, Quito, Ecuador; Dang Thi Bich Huong, Vietnam Organic Agriculture Association, Vietnam; Olivera Bicikliski, Ministry of Agriculture, Forestry and Water Management, Skopje, Former Yugoslav Republic of Macedonia; Simone Bissig, Research Institute of Organic Agriculture FiBL, Frick, Switzerland; Marian Blom, Bionext, AR Zeist, The Netherlands; Barbara Böck, NürnbergMesse/BIOFACH, Nuremberg, Germany; Nathalie Boes, Certisys, Walhain; Thavisith Bounyasouk, Department of Agriculture (DOA), Vientiane, Lao PDR; Lorcan Bourke, Bord Bia - Irish Food Board, Dublin, Ireland; Claudius Bredehoeft, Organic Farming Project, Deutsche Gesellschaft für Internationale Zusammenarbeit (GIZ) GmbH, Bonn, Germany; Trevor Brown, Jamaica Organic Agriculture Movement JOAM,

Acknowledgements
FiBL & IFOAM – Organics International (2018): The World of Organic Agriculture. Frick and Bonn 17
Kingston, Jamaica; Marie Reine Bteich, CIHEAM - IAM Bari, Bari, Italy; Klaus Büchel, Klaus Büchel Anstalt, Mauren, Liechtenstein; Andreas Bürkert, University of Kassel, Witzenhausen, Germany, Emanuele Busacca, IFOAM EU, Brussels, Belgium; Roberta Cafiero, Ministry of Agriculture and Forestry Policies, Rome, Italy; Ana Paula Cardona, LETIS S.A., Santa Fe, Argentina; Jennifer Chang, IFOAM Asia, Seoul, Republic of Korea; Tich Charova, Zimbabwe Organic Producers and Promoters Association ZOPPA, Zimbabwe; Eugene Chebotariov, Reform Support Team at the Ministry of Agrarian Policy and Food of Ukraine, Kyiv, Ukraine; Allal Chibane, Ministère de l’Agriculture et de la Pêche Maritime, Rabat, Morocco; Stanley Chidaya, Malawi Organic Growers Association (MOGA), Lilongwe, Malawi; Thomas Cierpka, IFOAM - Organics International, Bonn, Germany; Genaro Coronel, Servicio Nacional de Calidad y Sanidad Vegetal y de Semillas SENAVE, Asunción, Paraguay; Amy Cosby, Australian Centre for Agriculture and Law, University of New England, Armidale, Australia; Finn Cottle, Soil Association, Bristol, United Kingdom; Catarina Crisostomo, Portugal; Predrag Cvjetićanin, Agriculture, Forestry and Fisheries Production Statistic Department - Agriculture, forestry, fishery and environment Directorate, Croatia; Thomas Damm, ABCert GmbH, Esslingen, Germany; Joy Daniel, Institut for Integrated Rural Development (IIRD), Aurangabad, Maharashtra, India; Nune Darbinyan, ECOGLOBE - Organic, Yerevan, Armenia; Giorgia DeSantis, Food and Agriculture Organization of the United Nations (FAO), Rome, Italy; Zoltán Dezsény, Hungarian Research Institute of Organic Agriculture (ÖMKi), Budapest, Hungary; Famara Diédhiou, Fédération Nationale pour l’Agriculture Biologique, Thiès, Senegal; Dóra Drexler, Hungarian Research Institute of Organic Agriculture (ÖMKi), Budapest, Hungary; Tomaž Džuban, Ministry of Agriculture, Forestry and Food, Ljubljana, Slovenia; Pilar M. Eguillor Recabarren, Oficina de Estudios y Politicas Agrarias ODEPA, Santiago Centro, Chile; Pauline Eid Saad, Ministry of Agriculture, Lebanon; Brun Elhousseine, AMABIO, Casablanca, Morocco; Zaoui Elhousseine, AMABIO, Casablanca, Morocco; Lucy Ellis, Department of Agriculture, Stanley, Falkland Islands (Malvinas); Sandra Elvir Sanchez, Secretaria de Agricultura y Ganadería SENASA, Tegucigalpa, Honduras; Lisa Emerson, Textile Exchange, London, United Kingdom; Encheng, Certification and Accreditation Administration of the People’s Republic of China CNCA, Haidian district, Beijing, China; Richard Escobar, Ecocert Colombia, Bogota, Colombia; Carlos Andres Escobar Fernandez, ECONEXOS, Cali, Colombia; Addisu Alemayehu Ferede, Ethiopian Institute of Agricultural Research EIAR, Akaki, Ethiopia; Tobias Fischer, BCS Öko-Garantie GmbH, Nürnberg, Germany; Barbara Fitch Haumann, Organic Trade Association (OTA), Brattleboro, United States of America; Dorian Fléchet, Agence Bio, Montreuil-sous-Bois, France; Patricia Flores Escudero, Latin American Office of IFOAM - Organics International, Lima, Peru; Emmeline Foubert, Certisys, Walhain, Belgium; Sergiy Galashevskyy, Organic Standard, Kyiv, Ukraine; Carlos Galo, SENASA Honduras, Tegucigalpa, Honduras; Jordan Gama, AfrONet, Dar es Salaam, Tanzania; Salvador Garibay, Research Institute of Organic Agriculture FiBL, Frick, Switzerland; Claudine Gengler, Ministère de l’Agriculture, de la Viticulture et de la Protection des consommateurs, Luxembourg; Maheswar Ghimire, Kathmandu, Nepal; Laurent C. Glin, FiBL Regional Office for West Africa, Benin; Camille Godard, Ecocert International, Office, L’Isle Jourdain, France; Denise Godinho, IFOAM - Organics International, Bonn, Germany; Ana Goloborodco, Ecocert, Bucuresti, Romania; José Miguel González, Ministry of Agriculture, Food and Environment, Spain; Victor Gonzálvez Pérez, Spanish Society for Organic Agriculture SEAE, Catarroja, Spain; Amish Gosai, Bangalore, India; Katharina Gössinger, BIO AUSTRIA, Wien, Austria; Catherine Greene, Economic Research Service USDA, Washington DC, United States of Americas; Simone Groh, CERES, Happurg, Germany; Rannveig Guðleifsdóttir, Vottunarstofan Tún ehf., Reykjavik, Iceland; Jill Guerra, Canada Organic Trade Association, Ottawa, Canada; Sabahat Güllüoglu, Ministry of Food Agriculture and Livestock, Ankara, Turkey; Gunnar Gunnarsson,

Acknowledgements
18 FiBL & IFOAM – Organics International (2018): The World of Organic Agriculture. Frick and Bonn
Vottunarstofan Tún ehf., Reykjavik, Iceland; Arnaud Guyou, Ecocert International, Office, L’Isle Jourdain, France; Cristina Hagatong, Ministry of Agriculture, Forestry and Rural Development, Portugal; Abid Ali Hasan, Zakho Small Villages Projects ZSVP, Dohuk, Iraq; Stephen Hazelmann, Pacific Community SPC, Pacific Islands; Sampsa Heinonen, Evira, Helsinki, Finland; Shelly Hermon, Ministry of Agriculture and Rural Development, Israel; Željko Herner, Ministry of Agriculture, Fisheries and Rural Development, Zagreb; Brett Hickson, Ministry of Agriculture and Rural Development, Israel; Otto Hofer, Bundesministerium für Land- und Forstwirtschaft, Wien, Austria; Tanveer Hossain Shaikh, Friends in Village Development Bangladesh (FIVDB)/Vice-President IFOAM Asia, Dhaka, Bangladesh; Andrea Hrabalová, CTPOA, Brno, Czech Republic; Beate Huber, Research Institute of Organic Agriculture FiBL, Frick, Switzerland; Lee Hyejin, Korea Rural Economic Institute KREI, Joellanam-do, Republic of Korea; Basri Hyseni, Initiative for agricultural development of Kosovo (IADK), Mitrovica, Republic of Kosovo; Barbara Jäggin, Swiss State Secretariat for Economic Affairs (SECO), Bern, Switzerland; Edmundo Janco Mita, Asociación de Organizaciones de Productores Ecológicos de Bolivia (AOPEB), La Paz, Bolivia; Jorge Leonardo Jave Nakayo, Ministerio de Agricultura - SENASA- Perú, Lima, Peru; Ágnes Juhász, National Food Chain Safety Office nébih, Budapest, Hungary; Jack Juma, Kenya Organic Agricultural Network (KOAN), Nairobi, Kenya; ManChul Jung, Korea Institute of Rural Social Affairs, Chungnam Province, Republic of Korea; Edith Kalka, Namibian Organic Association NOA, Okahandja, Namibia; Joelle Kappeler, Bioinspecta, Frick, Switzerland; Thilak Kariyawasam, Lanka Organic Agriculture Movement (LOAM), Nawinna, Maharagama, Sri Lanka; Joelle Katto-Andrighetto, IFOAM - Organics International, Bonn, Germany; Laura Kemper, FiBL, Frick, Switzerland; Pravin Khare, Ecocert International, Office, L’Isle Jourdain, France; Tamam Khawalda, Ministry of Agriculture, Jordan; Cornelia Kirchner, IFOAM - Organics International, Bonn, Germany; Bernisa Klepo, Organska Kontrola (OK), Sarajevo, Bosnia and Herzegovina; Evgeniy Klimov, Kazakhstan Federation of Organic Agriculture Movements - KAZFOAM, Kazakhstan; Barbara Köcher-Schulz, AMA-Marketing GesmbH AMA, Wien, Austria; Marja-Riitta Kottila, Pro Luomu, Kauniainen, Finland; Olena Kovaliova, Deputy Minister, Ministry of Agrarian Policy and Food of Ukraine, Kyiv, Ukraine; Heinz Kuhlmann, ABC Enterprises, Tokyo, Japan; Manoj Kumar Menon, International Competence Centre for Organic Agriculture ICCOA, Bangalore, India; Nicole Lambert, Textile Exchange, Paris, France; Andrew Lawson, Australian Centre for Agriculture and Law, University of New England, Armidale, Australia; Lauren le Roux, Ecocert Southern Africa, Cape Town, South Africa; Ming Chao Liu, Organics Brazil, Brazil; Tia Loftsgard, Canada Organic Trade Association, Ottawa, Canada; Pedro Lopez, PROVOTEC, Madrid, Spain; Martin Lundø, Food Industries, Copenhagen, Denmark; Samia Maamer Belkhiria, Ministère de l’Agriculture, Tunis, Tunisia; Marcela Machuca Henao, Ecocert, Bogota D.C, Colombia; Suzana Madžarić, Centro Internazionale di Alti Studi Agronomici Mediterranei - Istituto Agronomico Mediterraneo di Bari - CIHEAM - IAM Bari, Bari, Italy; Hossein Mahmoudi, Environmental Sciences Research Institute, Evin Shahid Beheshti University SBU, Velenjak, Evin, Tehran, Iran; Antanas Makarevičius, Ekoagros, Lithuania; Fernando Maldonado, Dirección General de Sanidad Vegetal y Animal, El Salvador; Karen Mapusua, Coconut Industry Development for the Pacific (CIDP) Programme, Suva, Fiji; Brigitta Maurer, Research Institute of Organic Agriculture, Frick, Switzerland; Cliflyn McKenzie, Ecocert Southern Africa, Cape Town, South Africa; Stephen Meredith, IFOAM EU Group, Brussels, Belgium; Dóra Mészáros, FiBL Europe, Brussels; Dorota Metera, BIOEKSPERT Sp. z o.o., Warszawa, Poland; Merit Mikk, Centre of Ecological Engineering - Ökoloogiliste Tehnoloogiate Keskus, Tartu, Estonia; Jelena Milic, Ministry of Agriculture, Forestry and Water Economy, Belgrade, Republic of Serbia; Mwanzo Millinga, AfrONet, Dar es Salaam, Tanzania; Eugene Milovanov, Organic Federation of Ukraine, Kyiv, Ukraine; Satoko Miyoshi, Global

Acknowledgements
FiBL & IFOAM – Organics International (2018): The World of Organic Agriculture. Frick and Bonn 19
Organic Textile Standard (GOTS) Japan, Tokyo, Japan; Julie Kilde Mjelva, Landbruksdirektoratet / Norwegian Agriculture Agency, Oslo, Norway; Simon Moakes, FiBL, Frick, Switzerland; Bram Moeskops, IFOAM EU, Brussels, Belgium; Abdalla Mohammed, GIZ SA, Saudi Arabia; Andrew Monk, Australian Organic, Nundah, Australia; Mykola Moroz, Ministry of Agrarian Policy and Food of Ukraine, Kyiv, Ukraine; Flávia Moura e Castro, IFOAM - Organics International, Bonn, Germany; Darija Musulin, Ministry of Agriculture, Zagreb, Croatia; Mohammed Mutarad Aloun, Ministry of Climate Change and Environment, United Arab Emirates; Douglas A. Navarro, Ministerio de Agricultura y Ganadería Dirección General de Sanidad Vegetal, El Salvador; Richard Ngunjiri, Kenya Organic Agricultural Network (KOAN), Nairobi, Kenya; Từ Thị Tuyết Nhung, Vietnam Organic Agriculture Association, Hanoi, Vietnam; Urs Niggli, Research Institute of Organic Agriculture FiBL, Frick; Tomas Fibiger Nørfelt, Knowledge Centre for Agriculture VLF, Århus, Denmark; Minna Nurro, Pro Luomu, Kauniainen, Finland; Nick Nwolisa, Regional Extension and Resource Center, Azerbaijan; Fortunate Nyakanda, Zimbabwe Organic Producers and Promoters Association ZOPPA, Zimbabwe; Fatima Obaid Saeed, Ministry of Environment and Water of the United Arab Emirated, United Arab Emirates; Kung Wai Ong, Humus Consultancy, Penang, Malaysia; Maximiliano Ortega, Belize Organic Producers Association, Belmopan, Belize; Vitoon Panyakul, Green Net, Bangkok, Thailand; Ejvind Pedersen, Landbrug & Fødevarer, Copenhagen, Denmark; Eliza Petrosyan-Sudzilovskaya, ECOGLOBE, Yerevan, Armenia; Joan Picazos, Biocop Productos Biológicos, S.A. (BIOCOP), Barcelona, Spain; Diego Pinasco, Servicio Nacional de Sanidad y Calidad Agroalimentaria SENASA, Buenos Aires, Argentina; Roberto Pinton, Pinton Organic Consulting, Padova, Italy; Jonathan Platteau, Landbouw en Visserij, Brussels, Belgium; Natalie Prokopchuk, Swiss-Ukrainian project “Organic Certification and Market Development in Ukraine”, Kyiv, Ukraine; Patrizia Pugliese, CIHEAM - IAM Bari, Valenzano, Italy; Atef Abdel-Azziz Ragab, Central Laboratory for Organic Agriculture, Egypt; Andrijana Rakočević, Ministry of Agriculture and Rural Development, Podgorica, Montenegro; Dimbihary Alex Denis Ralaivao, Ecocert International, Office, L’Isle Jourdain, France; Tovohery Ramahaimandimbisoa, Ecocert, L’Isle Jourdain, France; Vonifanja Ramanoelina, Ecocert East Africa, Antananarivo, Madagascar; Juan Carlos Ramirez, Servicio Nacional de Sanidad y Calidad Agroalimentaria SENASA, Buenos Aires, Argentina; Wenndy Ramirez, Ecocert Colombia, Bogota D.C., Colombia; Zo Ranaivomanana, Ecocert East Africa, Antananarivo, Madagascar; Sandra Randrianarisoa, Ecocert East Africa, Antananarivo, Madagascar; Mihaja Rasolondraibe, Ecocert, L’Isle Jourdain, France; Pia Reindl, AMA-Marketing GesmbH AMA, Wien, Austria; Michel Reynaud, Ecocert International, Office, L’Isle Jourdain, France; Kurt Riedi, Research Institute of Organic Agriculture FiBL, Frick, Switzerland; Nathalie Rison Alabert, Agence Bio, Montreuil-sous-Bois, France; Christian Robin, Swiss State Secretariat for Economic Affairs (SECO), Bern, Switzerland; Fermín Romero, Ministerio de Desarrollo Agropecuario, Panama; Monica Rubiolo, Swiss State Secretariat for Economic Affairs (SECO), Bern, Switzerland; Cecilia Ryegård, Ekoweb, Sweden; Michal Rzytki, Ministry of Agriculture and Rural Development-Organic Farming Division, Warsaw, Poland; Ayman Saad Al-Ghamdi, Organic Agriculture Department, Saudi Arabia; Amarjit Sahota, Ecovia Intelligence, London, United Kingdom; Vincent Samborski, Landbouw en Visserij, Brussels, Belgium; Channa Samorn, GIZ International Services, Bonn, Germany; Gregory Sampson, International Trade Centre (ITC), Geneva, Switzerland; Sevinç Saygili, Ministry of Food Agriculture and Livestock, Ankara, Turkey; Diana Schaack, Agrarmarkt Informations-Gesellschaft mbH, Bonn, Germany; Aender Schanck, OIKOPOLIS Groupe, Munsbach, Luxembourg; Winfried Scheewe, Deutsche Gesellschaft für Internationale Zusammenarbeit (GIZ) GmbH, Phnom Penh, Cambodia; Bernhard Schlatter, Research Institute of Organic Agriculture FiBL, Frick, Switzerland; Otto Schmid, Research Institute of Organic

Acknowledgements
20 FiBL & IFOAM – Organics International (2018): The World of Organic Agriculture. Frick and Bonn
Agriculture FiBL, Frick, Switzerland; Robin Schrieber, Quality Certification Services, Gainesville, United States of America; Rita Schwentesius, Universidad Autónoma Chapingo, Chapingo, México; Ibrahima Seck, Fédération Nationale pour l’Agriculture Biologique, Thiès, Sénégal; Hana Šejnohová, Institute of agricultural economics and information, Brno, Czech Republic; Filippos Sekkas, Ministry of Rural Development and Food, Greece; Andreas Selearis, Department of Agriculture, Nicosia, Cyprus; Elene Shatberashvili, Elkana - Biological Farming Association, Akhaltsikhe, Georgia; Ivana Simic, National Association "Serbia Organica", Belgrade, Serbia; Anamarija Slabe, Institut za trajnostni razvoj, Lubljana, Slovenia; Nicolette van der Smissen, Consultant for Organic Production, Feres, Greece; Manjo Smith, Namibian Organic Association NOA, Okahandja, Namibia; Marcela Stahil, Ministry of Agriculture, Chişinău, Moldova; Emily Stone, Toledo Cacao Growers Association, Belmopan, Belize; Sylë Sylanaj, University of Prishtina, Prishtinë, Kosovo; Daniel Szalai, Control Union Certifications, Zwolle, The Netherlands; Vic Tagupa, League of Organic Agriculture Municipalities & Cities (LOAMC), Philippines; Evonne Tan, Textile Exchange, Kuala Lumpur, Malaysia; Benjamin Tissot, Ecocert, L’Isle Jourdain, France; Olga Trofimtseva, Deputy Minister, Ministry of Agrarian Policy and Food of Ukraine, Kyiv, Ukraine; Liesl Truscott, Textile Exchange, Bath, United Kingdom; Emma Tsessue, ECOCERT SAS, L’Isle Jourdain, France; Kesang Tshomo, Ministry of Agriculture MOA, Thimphu, Bhutan; Francesco Tubiello, Food and Agriculture Organization of the United Nations FAO, Rome, Italy; Hedwig Tushemerirwe, National Organic Agricultural Movement of Uganda (NOGAMU), Kampala, Uganda; Bavo van den Idsert, Bionext, AR Zeist, The Netherlands; Frederica Varini, IFOAM - Organics International, Bonn, Germany; Jelena Vasiljevic, Ministry of Agriculture Serbia, Belgrade, Serbia; Leo Vella, Ministry for the Environment, Sustainable Development and Climate Change, MOAN Delelgate, Malta; Triin Viilvere, IFOAM EU Group, Brussels, Belgium; Wendy W. C. KO, Fisheries and Conservation Department, Hong Kong, China; Maohua Wang, Certification and Accreditation Administration of the People’s Republic of China CNCA, Haidian district, Beijing, China; Magdalena Wawrzonkowska, IFOAM EU Group, Brussels, Belgium; Jonathan Wong, Hong Kong Organic Resource Centre, Hong Kong; Joseph Wozniak, International Trade Centre (ITC), Geneva, Switzerland; Els Wynen, Eco Landuse Systems, Flynn, ACT, 2615; Abdoul Aziz Yanogo, Ecocert SA West Africa Office, Ougadougou, Burkina Faso; Weimin Yu, Ecocert China, Beijing, China; Qiao Yuhui, China Agricultural University, Beijing, China; Aisuluu Zamirbekova, Organic Farming Kyrgyzstan, Kyrgyzstan; Pema Zangmo, National Organic Programme, Bhutan; Raffaele Zanoli, Università Politecnica delle Marche UNIVPM, Ancona, Italy; José Zapata, Oficina de Control Agricultura Organica, Republica Dominicana; Ulrike Zdralek, Bioinspecta, Frick, Switzerland; Lisa Zhen, Ecocert China, Beijing, China; Zhejiang Zhou, IFOAM Asia, China; Darko Znaor, Independent Consultant, Zagreb, Croatia

Statistics > Key Indicators
FiBL & IFOAM – Organics International (2018): The World of Organic Agriculture. Frick and Bonn 21
Organic Agriculture: Key Indicators and Top Countries
Indicator World Top countries Countries with organic activities1
2016: 178 countries
Organic agricultural land 2016: 57.8 million hectares (1999: 11 million hectares)
Australia (27.1 million hectares) Argentina (3.0 million hectares) China (2.3 million hectares)
Organic share of total agricultural land
2016: 1.2 % Liechtenstein (37.7 %) French Polynesia (31.3 %) Samoa (22.4%)
Wild collection and further non-agricultural areas
2016: 39.9 million hectares (1999: 4.1 million hectares)
Finland (11.6 million hectares) Zambia (6.7 million hectares) India (4.2 million hectares)
Producers 2016: 2.7 million producers (1999: 200’000 producers)
India (835’000) Uganda (210’352) Mexico (210’000)
Organic market 2016: 89.7 billion US dollars*2 (more than 80 billion euros) (2000: 17.9 billion US dollars)
US (43.1 billion US dollars; 38.9 billion euros) Germany (10.5 billion US dollars; 9.5 billion euros) France (7.5 billion US dollars; 6.7 billion euros)
Per capita consumption 2016: 12.1 US dollars (11.3 euros) Switzerland (304 US dollars; 274 euros) Denmark (252 US dollars; 227 euros) Sweden (218 US dollars; 197 euros)
Number of countries with organic regulations
2017: 87 countries
Number of affiliates of IFOAM – Organics International
2017: 1’003 affiliates from 127 countries
India - 111 affiliates Germany - 88 affiliates United States - 63 affiliates China - 56 affiliates
Source: FiBL survey 2018, based on national data sources and data from certifiers *Global market: Ecovia Intelligence (formerly Organic Monitor) 2018
1 Where the designation "country" appears in this book, it covers countries and territories, see UNSTAT website http://unstats.un.org/unsd/methods/m49/m49regin.htm. 2 According to the Central European Bank, I euro corresponded to 1.1069 US dollars in 2016.

Statistics › Summary
22 FiBL & IFOAM – Organics International (2018): The World of Organic Agriculture. Frick and Bonn
The World of Organic Agriculture 2018: Summary
HELGA WILLER,1 JULIA LERNOUD,2 AND LAURA KEMPER3
According to the latest FiBL survey on certified organic agriculture worldwide, as of the end of 2016, data on organic agriculture was available from 178 countries.
Almost 58 million hectares of organic farmland – Australia has the largest area
There were 57.8 million hectares of organic agricultural land in 2016, including in-conversion areas. The regions with the largest areas of organic agricultural land are Oceania (27.3 million hectares, which is almost half the world’s organic agricultural land) and Europe (13.5 million hectares, 23 percent). Latin America has 7.1 million hectares (12 percent) followed by Asia (4.9 million hectares, 9 percent), North America (3.1 million hectares, 6 percent), and Africa (1.8 million hectares, 3 percent). The countries with the most organic agricultural land are Australia (27.4 million hectares), Argentina (3 million hectares), and China (2.3 million hectares). See page 34 for the detailed results of the FiBL survey.
Globally, 1.2 percent of the farmland is organic – Liechtenstein has the highest organic share with 37.7 percent
Currently, 1.2 percent of the world’s agricultural land is organic. The highest organic shares of the total agricultural land, by region, are in Oceania (6.5 percent) and in Europe (2.7 percent; European Union 6.7 percent). However, some countries reach far higher shares: Liechtenstein (37.7 percent) and French Polynesia (31.3 percent) have the highest organic shares. In fifteen countries, 10 percent or more of the agricultural land is organic.
Organic farmland has increased by 7.5 million hectares or 15 percent
Organic farmland increased by 7.5 million hectares or 15 percent in 2016. This is mainly because 5 million additional hectares were reported from Australia. However, many other countries reported an important increase and thus contributed to the global growth, such as China (42 percent increase; over 0.67 million hectares more) Uruguay (27 percent increase; more than 0.3 million hectares more), and India and Italy, both with an additional 0.3 million hectares. There has been an increase in organic agricultural land in all regions. In Europe, the area grew by almost 1 million hectares (6.7 percent increase). In Asia, the area grew by almost 34 percent or an
1 Dr. Helga Willer, Research Institute of Organic Agriculture (FiBL), Frick, Switzerland, www.fibl.org 2 Julia Lernoud, Research Institute of Organic Agriculture (FiBL), Frick, Switzerland, www.fibl.org 3 Laura Kemper, Research Institute of Organic Agriculture (FiBL), Frick, Switzerland, www.fibl.org

Statistics › Summary
FiBL & IFOAM – Organics International (2018): The World of Organic Agriculture. Frick and Bonn 23
additional 0.9 million hectares; in Africa, the area grew by 7 percent or over 0.1 million hectares, in Latin America the area grew by almost 6 percent or 0.4 million hectares after several years of drops, and in North America by more than 5 percent or 0.2 million additional hectares. A major relative increase of organic agricultural land was noted in many Asian and African countries, such as Lao People’s Democratic Republic, Sierra Leone, and Zimbabwe.
Apart from the organic agriculture land, there is organic land dedicated to other activities, most of which area for wild collection and beekeeping. Other areas include aquaculture, forests, and grazing areas on non-agricultural land. The areas of non-agricultural land constitute more than 39.7 million hectares (see 53).
Organic producers on the rise – 2.7 million producers in 2016
There were at least 2.7 million organic producers in 2016.1 Forty percent of the world’s organic producers are in Asia, followed by Africa (27 percent) and Latin America (17 percent). The countries with the most producers are India (835’000), Uganda (210’352), and Mexico (210’000) (see page 60). There has been an increase in the number of producers of over 300’000, or over 13 percent, compared to 2015. A quarter of the world’s organic agricultural land (14.3 million hectares) and more than 87 percent (2.4 million) of the producers were in developing countries and emerging markets in 2016 (see page 72).
Growth for all major crop groups
Land use and crop details were available for over 90 percent of the organic agricultural land. Unfortunately, some countries with very large organic areas, such as Australia, Brazil, and India, had little or no information on their land use (see page 78). Over two-thirds of the agricultural land was grassland/grazing areas (almost 38 million hectares, an increase of 16.5 percent compared to 2015). With a total of almost 10.6 million hectares, arable land constitutes 18 percent of the organic agricultural land. An increase of almost 6.3 percent since 2015 was reported. Most of this category of land was used for cereals including rice (4.1 million hectares), followed by green fodder from arable land (2.8 million hectares), oilseeds (1.3 million hectares), dry pulses and textile crops (0.5 million hectares each). Permanent crops account for eight percent of the organic agricultural land, amounting to 4.5 million hectares. Compared with the previous survey, an increase of more than 126’000 hectares, or 9 percent, was reported. The most important permanent crop is coffee (with more than 0.9 million hectares, constituting over 20 percent of the organic permanent
1 Please note that some countries report only the numbers of companies, projects, or grower groups, which may each comprise a number of individual producers. The number of producers should, therefore, be treated with caution, and it may be assumed that the total number of organic producers is higher than that reported here.

Statistics › Summary
24 FiBL & IFOAM – Organics International (2018): The World of Organic Agriculture. Frick and Bonn
cropland), followed by olives (almost 0.7 million hectares), nuts (almost 0.6 million hectares), grapes (almost 0.4 million hectares), and tropical and subtropical fruits (over 0.3 million hectares) (see page 74).
Detailed information on organic cotton was provided by Textile Exchange, showing that during the 2015/16 growing season, 107’980 metric tons of organic cotton fibre was produced globally by 219’947 farmers on 302’562 hectares of land. There are currently 18 countries producing certified organic cotton, but 97 percent of the global supply comes from just seven countries. India remains by far the largest producer, accounting for almost two-thirds of total production, followed by China, Kyrgyzstan, Turkey, and Tajikistan. For more information including the situation of cotton production in individual countries and regions, see the chapter by Truscott et al. on page 137.
Looking at other voluntary sustainability standards (VSS), a recent survey among 14 standards (including organic) shows that strong growth continues and that at least 14 million hectares are covered by selected crops and standards. All standards covered experienced growth in their areas since 2011. The most successful commodity is coffee; at least 25 percent of the global coffee area is certified and 8.5 percent of the global coffee area is organic. (See the chapter by Lernoud et al., page 128).
Global market has increased to almost 90 billion US dollars
Organic food & drink sales have increased from less than 15 billion US dollars to almost 90 billion US dollars over two decades according to Ecovia Intelligence. Although the positive trend is likely to continue, there remain challenges. These include demand concentration (about 90 percent of sales are in North America and Europe), proliferating standards, and the fact that the farmland growth is slowing in parts of Europe and North America, which means there are concerns about supply shortfalls. (See the chapter by Amarjit Sahota on page 146).
In 2016, the countries with the largest organic markets were the United States (38.9 billion euros), Germany (9.7 billion euros), and France (6.7 billion euros). The largest single market was the United States (47 percent of the global market), followed by the European Union (30.7 billion euros, 37 percent), and China (5.9 billion euros, 6 percent). The highest per-capita consumption with more than 200 euros was found in Switzerland and Denmark. The highest organic market shares were reached in Denmark (9.7 percent), Luxembourg (8.6 percent), and Switzerland (8.4 percent) (See the chapter on the FiBL survey on the global market, page 174).

Statistics › Summary
FiBL & IFOAM – Organics International (2018): The World of Organic Agriculture. Frick and Bonn 25
Africa
There were over 1.8 million hectares of certified organic agricultural land in Africa in 2016. Compared to 2015, Africa reported an increase of almost 119’000 hectares, a 7 percent increase. There were more than 741’000 producers. The United Republic of Tanzania was the country with the largest organic area (with almost 270’000 hectares), and Uganda was the country with the largest number of organic producers (more than 210’000). The country with the highest share of organic agricultural land was the island state Sao Tome and Principe, with 13.8 percent of its agricultural area being organic. The majority of certified organic produce in Africa is destined for export markets. Key crops are coffee, olives, nuts, cocoa, oilseeds, and cotton (see page 177). In Africa, only Morocco and Tunisia have an organic regulation; however seven countries are drafting one and eleven countries have a national standard but not a national legislation (see page 152).
The year 2017 continued to see growing recognition among policymakers that organic agriculture has a significant role to play in addressing food insecurity, land degradation, poverty, and climate change in Africa. Organic conferences have become a success, and the next East African Organic Conference is scheduled for May 2018. The Fourth African Organic Conference will take place in November 2018 in Yaoundé, Cameroon. These conferences mark significant milestones for mainstreaming organic agriculture on the continent. For more information, see the chapter by Jordan Gama (page 174).
Asia
The total area dedicated to organic agriculture in Asia was almost 4.9 million hectares in 2016. There were 1.1 million producers; most of these were in India. The leading countries by area were China (2.3 million hectares) and India (almost 1.5 million hectares); Timor-Leste had the highest proportion of organic agricultural land (7.4 percent) (page 200). Twenty countries have regulations on organic agriculture, and six countries are in the process of drafting one. Eleven countries have a national standards but no organic legislation.
In 2017, there was an overall increase in organic production in all countries that submitted contributions to the Asia sector report for this book. Exports of organic products are also increasing as seen in the example of Bangladesh. An interesting development was the significant increase of national and local organic groups in China, such as organic marketing clubs or organic marketing alliances as market platforms. Community Supported Agriculture (CSA) and Participatory Guarantee Systems (PGS) are also attracting much interest. A mutual recognition of certified organic products between China and New Zealand was signed at the end of 2016. The authorities in India introduced a common logo for organic foods – “Jaivik Bharat.” The Philippines saw an increase in active involvement of more than 120 local municipal mayors in the development of organic agriculture. Some municipalities are

Statistics › Summary
26 FiBL & IFOAM – Organics International (2018): The World of Organic Agriculture. Frick and Bonn
now recognized internationally for their exemplary development of organic agriculture, and in September 2018, the 3rd IFOAM Asia Organic Congress will take in the Philippines. For more information, including country reports, see the chapter from IFOAM Asia (page 188).
There has been increasing interest and participation in the Asian Local Governments of Organic Agriculture (ALGOA). Some local governments are expressing interest in the formation of local chapters of ALGOA in their respective countries (page 198).
Europe
As of the end of 2016, 13.5 million hectares of agricultural land in Europe (European Union 12.1 million hectares) were managed organically by over 370’000 producers (European Union over 295’000). In Europe, 2.7 percent of the agricultural area was organic (European Union: 6.7 percent). Organic farmland has increased by 0.8 million hectares compared to 2015. The countries with the largest organic agricultural areas were Spain (2 million hectares), Italy (1.8 million hectares), and France (1.5 million hectares). In nine countries, at least 10 percent of the farmland is organic: Liechtenstein has the lead (37.7 percent), followed by Austria (21.9 percent) and Estonia (18.9 percent). Retail sales of organic products totalled 33.5 billion euros in 2016 (European Union: 30.7 billion euros), an increase of more than 11 percent since 2015. The largest market for organic products in 2016 was Germany, with retail sales of 9.5 billion euros, followed by France (6.7 billion euros), and Italy (2.6 billion euros) (see the article by Willer et al., page 218).
In Europe, all countries have an organic regulation or are drafting one. In 2017, negotiations by EU Institutions on the review of the EU organic regulation started to draw to a close, four years after the European Commission launched its legislative proposals. The basic text has been approved, and will contain some changes to the rules on production, controls, and imports. Discussions on the direction of the future of the Common Agricultural Policy (CAP) Post-2020 officially kicked-off in February 2017. The next years will be a critical period for the organic sector to work with policymakers and other agri-food stakeholders to use the debate on the future CAP as a means to support the development of organic food and farming in Europe. TP Organics launched its position paper “Research and Innovation for Sustainable Food and Farming” outlining what it would like to see in terms of the 9th EU Research & Innovation Framework Programme (FP9), which will start in 2021. TP Organics calls for the UN Sustainable Development Goals to be the basis for the next Framework Programme’s architecture (page 210).
For this edition of the book, we received a country report on organic agriculture in Ukraine, which has become an important supplier of organic products for Western markets The main organic exports from Ukraine are cereals, oil crops, pulses, wild collected berries, mushrooms, nuts, and herbs. Recent developments on the policy level include the introduction of a governmental data collection system. The

Statistics › Summary
FiBL & IFOAM – Organics International (2018): The World of Organic Agriculture. Frick and Bonn 27
Ukrainian state logo for labelling of organic products was officially registered as a trademark owned by the Ministry of Agrarian Policy and Food of Ukraine. For more information, see the article by Trofimtseva and Prokopchuk on page 256.
Mediterranean countries
For the Mediterranean countries, which include countries in Northern Africa, Western Asia and Southern Europe, the Mediterranean Organic Agriculture Network (MOAN) pursues its commitment to collect and disseminate data on the organic sector in the Mediterranean region. According to the latest data, the total certified organic area in the Mediterranean region covers over 7.9 million hectares, of which 6.9 million hectares are organic agricultural area. The largest part of the Mediterranean organic area is in the Mediterranean countries of the European Union (EU Med) totalling 87 percent of the agricultural organic area. Candidate and Potential Candidate (CPC) countries of the European Union follow with 8 percent. Only 5 percent is located in the Southern and Eastern Mediterranean (SEM) countries. The legislative and regulatory framework in the Mediterranean area highly differs between the countries. This directly affects organic data collection and availability. In the EU countries, official mechanisms for organic statistics collection are well established and many CPC countries implemented their national organic legislation and are at a very advanced stage of harmonisation with the EU regulation on organic farming. However, in the SEM countries where a national law had not been fully implemented, data collection is essentially based on direct and informal communication, which sometimes provides only partial information. For more information, see the article by Bteich et al. on page 262.
Latin America and the Caribbean
In Latin America, almost 460’000 producers managed 7.1 million hectares of agricultural land organically in 2016. This constituted 12 percent of the world’s organic land and almost one percent of the region’s agricultural land. The leading countries were Argentina (3 million hectares), Uruguay (1.7 million hectares), and Brazil (0.75 million hectares, 2014). The highest shares of organic agricultural land were in the Falkland Islands/Malvinas (12.2 percent), Uruguay (11.5 percent), and French Guiana (10 percent). Many Latin American countries remain important exporters of organic products such as bananas, cocoa, and coffee. In Argentina and Uruguay, temperate fruit and meat are key export commodities. Twenty-three countries in this region have an organic regulation or are drafting one (see page 152). In October 2017, the Republic of Chile and the European Union (EU) announced the completion of the necessary internal procedures related to the agreement on trade in organic products and it entered into force on January 1, 2018.
Organic domestic markets have been growing steadily in the last decade. The biggest organic domestic market is in Brazil, where the National Program of School Meals,
Statistics › Summary
28 FiBL & IFOAM – Organics International (2018): The World of Organic Agriculture. Frick and Bonn
which has been a major achievement since 2009, stipulates that 30 percent of the public procurement budget should be used to buy from family farms with preference given to organic farmers. In 2017, several important events took place such as the seventh Latin-American and Caribbean Meeting of Organic and Ecological Agriculture in Bolivia, the 6th Latin-American Congress of Agroecology, and IFOAM’s Organic Leadership Course (OLC) in Brazil. For more information, see the chapter by Flores on page 268.
North America
In North America, almost 3.1 million hectares of farmland were managed organically in 2016. Of these, 2 million were in the United States and 1.1 million in Canada, representing 0.8 percent of the total agricultural area in the region (see page 296).
The U.S. organic sector continues its upward trajectory, gaining new market share and shattering records, as consumers used more organic products than ever before. Organic sales in the U.S. totalled approximately 47 billion US dollars1 (43 billion US dollars in food sales) in 2016, reflecting new sales of almost 3.7 billion US dollars from the previous year. Organic food now accounts for 5.3 percent of total food sales in the U.S. Farm Bill advocacy has been a major thrust during the past year, and it will continue to take center stage during 2018. Organic leaders have worked with legislators to create three bipartisan bills for consideration. The first is the Organic Farmer and Consumer Protection Act to improve oversight over global organic trade. The second is the Organic Research Act of 2017 to increase annual funding for USDA’s Organic Agriculture Research and Extension Initiative to 50 million US dollars a year. The third is the Organic Farmers Access Act, designed to expand organic agriculture’s access to, and eligibility for, rural development programs. For more information see article by Haumann on page 284.
Canada’s organic sector continues its steady spread across Canada’s farmland and onto Canadians’ plates. There are over 5’000 organic operations nationally offering more organic ingredients, products and services than ever before. Canada’s organic sector was valued at an estimated 5.4 billion Canadian dollars in 2017, up from 4.7 billion Canadian dollars in 2015. The need for continuous dialogue with government and regulators is required to ensure that organic can stay competitive. Consistent and permanent funding for Canadian Organic Standards and the closing of regulatory gaps across provinces and territories is needed. (See the chapter by Loftsgard and Guerra, page 289).
1 The European Central Bank reference exchange rate U.S. dollar/Euro was 1.1069 in 2016.

Statistics › Summary
FiBL & IFOAM – Organics International (2018): The World of Organic Agriculture. Frick and Bonn 29
Oceania
This region includes Australia, New Zealand, and the Pacific Island states. Altogether, there were over 27’000 producers, managing 27.3 million hectares. This constituted 6.5 percent of the agricultural land in the region and almost half of the world’s organic land. More than 99 percent of the organic land in the region is in Australia (27.1 million hectares, 97 percent of which is estimated to be extensive grazing land), followed by New Zealand (more than 74’000 hectares, 2014 data), and Samoa (over 63’000 hectares). The highest organic shares of all agricultural land were in French Polynesia (31.3 percent), followed by Samoa (22.4 percent), Australia (6.7 percent), Vanuatu (6.3 percent), and the Solomon Islands (5.3 percent). Growth in the organic industry in Australia, New Zealand, and the Pacific Islands has been strongly influenced by a rapidly growing overseas demand; domestic sales are also growing (page 314).
Australia has seen even more growth in 2016 in the area of pastoral land under certified organic management and the number of certified organic primary producers increased steadily in 2016. It is estimated that the overall volume (in metric tons) of Australian-grown organic products exported to other countries increased 17 percent between 2015 and 2016. The regulatory and governance arrangements in the certified organic sector in Australia have remained stable since, but change is in the air. The Australian Government, organic industry groups, and the participants in the organic supply chain generally are involved in a number of initiatives aimed at enhancing value for the organic sector in Australia. For more information about Australia, see the report by Lawson et al. on page 302.
Regional and national agencies and development partners increasingly recognize the value of organic agriculture as a development tool for the Pacific Islands context. Innovations such as the Pacific Organic Tourism and Hospitality Standard and the online Pacific Organic Policy Toolkit are attracting interest from organic farmers through to policymakers. The number of organic farmers in the region is continuing to grow with PGS growing at a faster rate than third-party certification. It is expected that the local market for organic products will start to expand as the tourism and hospitality industries start to look towards organic and sustainability as part of the Pacific Islands’ brand (see the chapter by Karen Mapusua, page 309).
Standards, regulations, and policy support
According to the FiBL survey on organic rules and regulations, 87 countries had organic standards in 2017. Eighteen countries are in the process of drafting legislation, and at least 33 countries, mostly in Asia and Africa, have adopted national standards for organic agriculture. In the European Union (EU), after more than three years of intensive and controversial debates, the European Council and Parliament have agreed upon a basic text for a new organic regulation. The new regulation is expected to be adopted in April or May 2018. In the next two years, the implementation provisions will be discussed and agreed upon, and the new regulation shall enter into

Statistics › Summary
30 FiBL & IFOAM – Organics International (2018): The World of Organic Agriculture. Frick and Bonn
force on 1 January 2021. In the United States, the United States Department of Agriculture (USDA) further strengthened its measures to maintain organic integrity and published, for example the “Interim Instruction on Maintaining the Integrity of Organic Imports.” For more information, see the chapter by Huber et al. on page 152).
Organic standards represent important regulatory frameworks for guiding and controlling food processing activities for organic food. A comparison of eight organic standards shows that governmental standards are more general than private ones, with private ones offering more specific guidance as to what additives and processing aids as well as processing methods are allowed or not allowed. (See the article by Batlogg et al., page 165).
Participatory Guarantee Systems (PGS) are locally focused quality assurance systems. PGS have proven to be an affordable alternative to third-party certification, an effective tool to develop local markets for organic produce and are particularly appropriate for small-scale farmers. Based on the data collected through the Global PGS Survey 2017 conducted by IFOAM – Organics International, PGS initiatives are established in 66 countries, with at least 311’449 farmers involved in PGS initiatives worldwide. This includes mostly small farmers and small processors. It is estimated that there are currently at least 241 PGS initiatives, of which 127 are fully operational. For more information, see the chapter by Moura di Castro and Varini, page 161.
Governments now provide public support for organic agriculture, and outcomes, lessons learned, and policy recommendations have now been published in a toolkit format. The new IFOAM policy toolkit aims to fill a knowledge gap in the area of organic advocacy and policy-making: policy-makers can learn more about not only why we should support organic agriculture, but also how it can be done. More about this toolkit is presented in the chapter by Katto on page 170.
A new narrative
The global General Assembly of IFOAM – Organics International 2017 decided on a new strategy. The new IFOAM strategic plan will work on three key factors: Enhancing supply with capacity development of operators and other value chain actors; stimulating demand with communication support and awareness campaigns; and advocating for a policy and guarantee environment that is conducive to sustainable production and consumption. For more information, see the chapter by Arbenz on page 320.

Statistics › Summary
FiBL & IFOAM – Organics International (2018): The World of Organic Agriculture. Frick and Bonn 31
Next FiBL survey on organic agriculture worldwide
The next global organic survey will start in mid-2018; data will be published in February 2019 and presented at the Biofach Organic Trade Fair in Nuremberg, Germany. We will contact all relevant experts and would be very grateful if data could be sent to us. Should you notice any errors regarding the statistical data in this volume, please let us know; we will then correct the information in our database and provide the corrected data in the 2019 edition of “The World of Organic Agriculture.” Corrections will also be posted at www.organic-world.net.
Contact: [email protected] and [email protected]

32 FiBL & IFOAM – Organics International (2018): The World of Organic Agriculture. Frick and Bonn
Info
grap
hic
1: O
rgan
ic a
gric
ultu
re w
orld
wid
e: K
ey in
dica
tors
201
6
Sour
ce: F
iBL
surv
ey 2
018

FiBL & IFOAM – Organics International (2018): The World of Organic Agriculture. Frick and Bonn 33
Organic Agriculture Worldwide:
Current Statistics
Map 1: Organic agricultural land and non-agricultural areas in 2016 (in hectares)
Source: FiBL survey 2018

Statistics › Introduction
34 FiBL & IFOAM – Organics International (2018): The World of Organic Agriculture. Frick and Bonn
Current Statistics on Organic Agriculture Worldwide: Area, Operators, and Market
JULIA LERNOUD1 AND HELGA WILLER2
Introduction
The 19th survey of certified organic agriculture worldwide was carried out by the Research Institute of Organic Agriculture (FiBL) with many partners from around the world. The results are published jointly with IFOAM – Organics International. This survey, as were the past surveys, was supported by the Swiss State Secretariat for Economic Affairs (SECO), the International Trade Centre (ITC),3 and NürnbergMesse.4
In total, data was provided by more than 200 experts. Governments, private sector organizations, certifiers, and market research companies have contributed to the data collection effort. Several international certifiers deserve special mention as they provided data on a number of countries: BCS, CERES, Certisys, Control Union, Ecocert, ICEA, Institute for Marketecology (IMO), LACON, Quality Certification Services (QCS), and the Soil Association. Data from the Mediterranean countries was supplied by the Mediterranean Organic Agriculture Network (MOAN, c/o Mediterranean Agronomic Institute of Bari), and data from the Pacific Islands was provided by the Pacific Organic and Ethical Trade Community (POET.com). A list of all data sources and contacts is provided in the annex.
In total, data from 178 countries/territories was available. For Mayotte, data had been available in the past, but for 2016, data has not been received. Updated data on the organic area was available for 150 countries; however, for some countries, updates were only available for the total organic area and not necessarily for the number of farms, land use, or other indicators. For those countries for which FiBL compiles the data among certifiers, not all certifiers provided updated data.
When no new data was available, data from the previous survey were used.
1 Julia Lernoud, Research Institute of Organic Agriculture (FiBL), Frick, Switzerland, www.fibl.org 2 Helga Willer, Research Institute of Organic Agriculture (FiBL), Frick, Switzerland, www.fibl.org 3 Since 2014, data collection on organic agriculture worldwide has been funded by the International Trade Centre (ITC) and the Swiss State Secretariat for Economic Affairs (SECO) under the project “T4SD Global Platform for Market Data on Organic Agriculture and Sustainability Standards”. For more information on this project, see www.vss.fibl.org 4 The organisers of BIOFACH, the World Organic Trade Fair in Nuremberg, Germany (today: NürnbergMesse), have supported data collection on organic agriculture worldwide and the production of the yearbook “The World of Organic Agriculture” since 2000.
Statistics › Introduction
FiBL & IFOAM – Organics International (2018): The World of Organic Agriculture. Frick and Bonn 35
Table 1: Countries and territories covered by the global survey on organic agriculture 2016
Region Countries* with data on organic agriculture
Countries per region1
Share of countries that provided data (%)
Africa 40 56 71% Asia 41 49 84% Europe 48 49 98% Latin America and Caribbean 33 46 72% North America 3 5 60% Oceania 13 25 52% World 178 230 77%
Source: FiBL survey 2018 *Where the designation "country" appears in this book, it covers countries or territories.2
Data on the following indicators was collected: • Organic area in hectares, by country and country groups, including breakdown
by crop; • Livestock numbers; • Production data (volumes and values); • Producers and further operator types; • Domestic market data (total retail sales value and volumes, per capita
consumption, share of the total market, and breakdown by product); • International trade data (total import and export values and volumes, and
breakdown by product).
Not all data that was collected is published in this book (e.g., production, livestock numbers, breakdown by product for domestic market and international trade data) because it was not possible to draw a complete global picture for these indicators. More information about the data collection and analysis process is available in our metadata, which can be found on Organic Eprints at http://orgprints.org/31359.
More information on statistics.fibl.org
Tables with more details on crops, markets, and international trade, as well as explanations for certain data can be found on FiBL’s new statistics website statistics.fibl.org.
Contact: Enquiries related to the data should be sent to Julia Lernoud and Helga Willer, Research Institute of Organic Agriculture FiBL, Frick, Switzerland, e-mail [email protected] and [email protected].
1 Number of countries and areas are mostly based on countries as listed in the FAO database at http://www.fao.org/faostat/en/#data/RL as well as some additional countries such as Kosovo. 2 For more information on countries, territories and regions see the UNSTAT website at http://unstats.un.org/unsd/methods/m49/m49.htm.

Statistics › General Notes
36 FiBL & IFOAM – Organics International (2018): The World of Organic Agriculture. Frick and Bonn
General notes on the data Organic areas: Data represents certified organic land/areas that are already fully converted as well as land under conversion because many data sources do not separate or include the latter (for instance, Austria, Germany, and Switzerland) and also because land under conversion is under organic management. For a definition of organic agriculture, see the IFOAM – Organics International website.1 Data on conversion status: For some countries, data is collated from several certifiers, some of which provided information on the conversion status while others did not. Therefore, the sum of land under conversion and the fully converted land is not necessarily the same as the total land under organic agricultural management. Share of total agricultural land: In some cases, the calculation of the organic share of the total agricultural land or that of individual crops, based on FAOSTAT and in some cases the Eurostat data, might differ from the organic shares obtained from ministries or local experts. PGS: Since 2011, for some countries, areas certified by Participatory Guarantee Systems (PGS) have been included. (For more information about PGS, see the article by Flávia Moura e Castro and Federica Varini on page 161). Countries: For countries and territories, the FAO country list is used. Where the designation "country" appears in this report, it covers countries or territories. As to the countries’ grouping by region, the Standard Country and Area Classifications as defined by the United Nations Statistics Division,2 is used in most cases. Data sources: Data was gathered from organizations of the private sector, governments, and certification bodies. For detailed information on the data sources, please check the annex at the end of this volume (page 330). Direct year-to-year comparison: A direct year-to-year comparison is not possible for all data as the data sources may change, data may not be provided on an annual base, data access may improve, or exchange rates might change. Completeness of data: > Producers: Some countries report the number of smallholders while others report only the number of companies, projects, or grower groups, which may each comprise a number of producers. This applies in particular to many African countries. The number of producers is, therefore, probably higher than the number communicated in this report. > Domestic market data: It should be noted that for market and trade data, comparing country statistics remains very problematic due to differing methods of data collection. Data revisions: Data revisions and corrections are communicated at www.organic-world.net/statistics. Metadata: Metadata for the FiBL survey on organic agriculture worldwide are available on Organic Eprints at http://orgprints.org/31359.
1 The definition of organic agriculture is available at the website of IFOAM – Organics International www.ifoam.bio/en/organic-landmarks/definition-organic-agriculture 2 For the composition of macro geographical (continental) regions, geographical sub-regions, and selected economic and other groupings, see the UNSTAT website at http://unstats.un.org/unsd/methods/m49/m49regin.htm

FiBL & IFOAM – Organics International (2018): The World of Organic Agriculture. Frick and Bonn 37
Info
grap
hic
2: O
rgan
ic fa
rmla
nd 2
016
Sour
ce: F
iBL
surv
ey 2
018

Statistics › Organic Agricultural Land
38 FiBL & IFOAM – Organics International (2018): The World of Organic Agriculture. Frick and Bonn
Organic land
Organic agricultural land
In 2016, 57.8 million hectares were under organic agricultural management worldwide.1
The region with the most organic agricultural land is Oceania, with 27.3 million hectares, followed by Europe with 13.5 million hectares, Latin America (7.1 million hectares), Asia (almost 4.9 million hectares), North America (3.1 million hectares), and Africa (1.8 million hectares).
Oceania has 47 percent of the global organic agricultural land. Europe, a region that has had a very constant growth of organic land over the years, has almost a quarter of the world’s organic agricultural land followed by Latin America with 12 percent (Table 2, Figure 1).
Australia, which experienced a major growth of organic land in 2016 (+5 million hectares), is the country with the most organic agricultural land; it is estimated that 97 percent of the farmland are extensive grazing areas. Argentina is second followed by the United States in third place (Table 2, Figure 2). The 10 countries with the largest organic agricultural areas have a combined total of 44.2 million hectares and constitute three-quarters of the world’s organic agricultural land. Apart from the organic agricultural land, there are further organic areas such as wild collection areas. These areas constitute more than 39.7 million hectares.
Table 2: World: Organic agricultural land (including in-conversion areas) and regions’ shares of the global organic agricultural land 2016
Region Organic agricultural land [hectares]
Regions’ shares of the global organic agricultural land
Africa 1’801’699 3% Asia 4’897’837 8% Europe 13’509’146 23% Latin America 7’135’155 12% North America 3’130’332 5% Oceania 27’346’986 47% World 57’816’759 100%
Source: FiBL survey 2018. Note: Agricultural land includes in-conversion areas and excludes wild collection, aquaculture, forest, and non-agricultural grazing areas. *Includes correction value for French overseas departments.
1 Data provided both for the fully converted and in conversion area are included in this work. However, some countries provided only data on the fully converted area, others only on the total organic agricultural land, and thus the conversion area is not known for many countries.
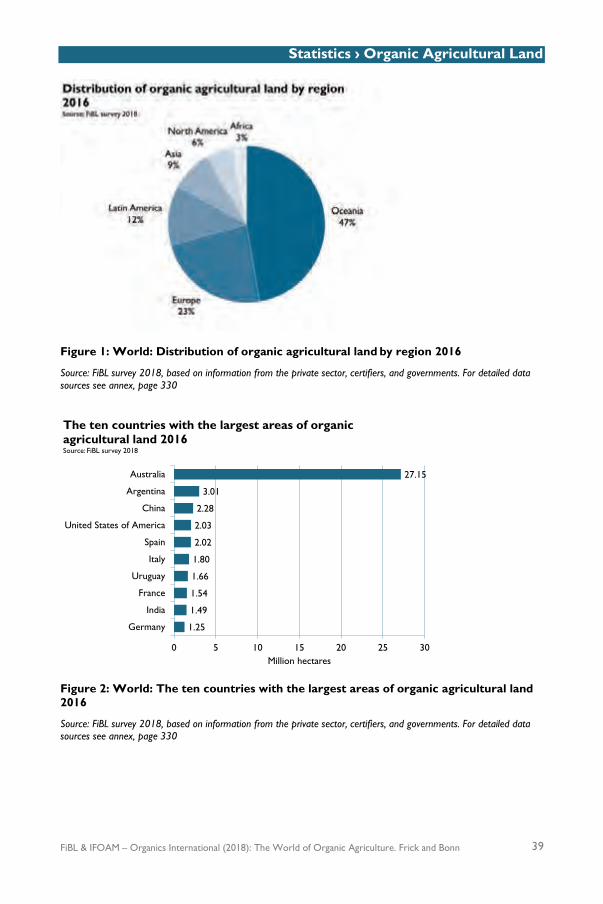
Statistics › Organic Agricultural Land
FiBL & IFOAM – Organics International (2018): The World of Organic Agriculture. Frick and Bonn 39
Figure 1: World: Distribution of organic agricultural land by region 2016
Source: FiBL survey 2018, based on information from the private sector, certifiers, and governments. For detailed data sources see annex, page 330
Figure 2: World: The ten countries with the largest areas of organic agricultural land
2016
Source: FiBL survey 2018, based on information from the private sector, certifiers, and governments. For detailed data sources see annex, page 330
1.25
1.49
1.54
1.66
1.80
2.02
2.03
2.28
3.01
27.15
0 5 10 15 20 25 30
Germany
India
France
Uruguay
Italy
Spain
United States of America
China
Argentina
Australia
Million hectares
The ten countries with the largest areas of organic agricultural land 2016Source: FiBL survey 2018

Statistics › Organic Agricultural Land
40 FiBL & IFOAM – Organics International (2018): The World of Organic Agriculture. Frick and Bonn
Table 3: World: Organic agricultural land (including in-conversion areas) by country 2016 (sorted)
For an alphabetical country list (including information on data year), see page 330. Country Hectares Australia 27’145’021 Argentina 3’011’794 China 2’281’215 United States of America 2’031’318 Spain 2’018’802 Italy 1’796’363 Uruguay 1’656’952 France 1’538’047 India 1’490’000 Germany 1’251’320 Canada 1’099’014 Brazil 750’000 Mexico 673’968 Austria 571’585 Sweden 552’695 Poland 536’579 Turkey 523’777 United Kingdom 490’205 Czech Republic 488’591 Ukraine 381’173 Greece 342’584 Peru 323’578 Kazakhstan 303’381 Russian Federation 289’890 Tanzania, United Republic of 268’729 Uganda 262’282 Latvia 259’146 Portugal 245’052 Finland 238’240 Romania 226’309 Lithuania 221’665 Dominican Republic 205’258 Denmark 201’476 Philippines 198’309 Slovakia 187’024 Hungary 186’347 Ethiopia 186’155 Tunisia 181’076 Estonia 180’852 Bulgaria 160’620 Kenya 154’488 Switzerland 141’249 Falkland Islands (Malvinas) 135’596 Sudan 130’000 Indonesia 126’014 Bolivia 114’306 Egypt 105’908 Sri Lanka 96’318 Congo, D.R. 94’386 Croatia 93’593
Country Hectares Belgium 78’452 Ireland 76’701 New Zealand 74’134 Sierra Leone 69’686 Paraguay 64’097 Samoa 63’393 Madagascar 60’023 Thailand 57’189 Viet Nam 53’348 Nigeria 52’421 Netherlands 52’204 Norway 47’621 Pakistan 45’299 Slovenia 43’579 Côte d’Ivoire 42’004 Ecuador 39’824 Azerbaijan 37’630 Nicaragua 33’621 Colombia 31’621 Moldova 30’142 Namibia 30’127 Honduras 28’689 Timor-Leste 28’259 Burkina Faso 27’268 Iceland 22’710 Togo 21’572 Ghana 21’326 Republic of Korea 20’165 Syrian Arab Republic 19’987 Iran 18’871 Saudi Arabia 17’212 Chile 15’838 Papua New Guinea 15’632 Panama 15’183 Serbia 14’358 French Polynesia 14’229 South Africa 14’196 Guatemala 13’380 Fiji 13’347 Tajikistan 12’659 Malawi 12’239 Mali 11’919 Vanuatu 11’794 Morocco 10’000 Japan 9’956 Cambodia 9’717 Nepal 9’361 Kyrgyzstan 7’974 Costa Rica 7’908 Zambia 7’738

Statistics › Organic Agricultural Land
FiBL & IFOAM – Organics International (2018): The World of Organic Agriculture. Frick and Bonn 41
Country Hectares Lao P.D.R. 7’668 Mozambique 7’412 Senegal 7’172 Bangladesh 6’860 Sao Tome and Principe 6’706 Bhutan 6’632 Taiwan 6’490 Haiti 6’112 Palestine, State of 5’993 Israel 5’758 Solomon Islands 5’723 Benin 5’679 Cyprus 5’550 United Arab Emirates 4’590 Myanmar 4’568 Luxembourg 4’274 Montenegro 3’470 Macedonia, FYROM 3’245 Zimbabwe 3’179 French Guiana (France) 3’051 Comoros 2’577 Kiribati 1’600 Jordan 1’517 Tonga 1’502 Georgia 1’452 El Salvador 1’426 Liechtenstein 1’383 Rwanda 1’284 Cuba 1’282 Armenia 1’240 Lebanon 1’079 Bosnia and Herzegovina 992 Réunion (France) 881 Algeria 772 Guinea-Bissau 689 Albania 662 Malaysia 603 Lesotho 548 Cape Verde 495 New Caledonia 438 Afghanistan 408 Belize 380 Cameroon 380 Jamaica 374 Martinique (France) 297 Niger 262 Faroe Islands 253 Dominica 240 Channel Islands 180 Guadeloupe (France) 168 Niue 164 Kosovo 160 Burundi 103 Grenada 85 Iraq 60 Bahamas 49
Country Hectares Suriname 39 Oman 38 United States Virgin Islands 26 Malta 24 Kuwait 20 Puerto Rico 14 Mauritius 13 Cook Islands 10 Swaziland 5 Andorra 4 Belarus (Wild collection) Bermuda (Processing) Brunei Darussalam (Aquaculture) Chad (Wild collection) Guyana (Wild collection) Hong Kong (Processing) Monaco (Processing) San Marino (Processing) Singapore (Processing) Somalia (Wild collection) Uzbekistan (Wild collection) Venezuela (Processing) World* 57’816’759
Source: FiBL survey 2018, based on information from the private sector, certifiers, and governments. For detailed data sources see annex, page 330 *Total includes correction value for French overseas departments

Statistics › Organic Agricultural Land › Organic Share
42 FiBL & IFOAM – Organics International (2018): The World of Organic Agriculture. Frick and Bonn
Organic share of total agricultural land
The share of the world’s agricultural land that is organic is 1.2 percent.
The highest organic share of total agricultural land, by region, is in Oceania (6.5 percent) followed by Europe with 2.7 percent. In the European Union, the organic share of the total agricultural land is 6.7 percent. In the other regions, the share is less than one percent (Table 4).
Many individual countries, however, have a much higher organic share (Figure 3), and, in 15 countries, 10 percent or more of the agricultural land is used for organic production (2011: 11 countries). Most of these countries are in Europe.
The country with the highest organic share of agricultural land is Liechtenstein, with almost 38 percent of its agricultural land under organic management. It is interesting to note that many island states have high shares of agricultural land under organic management, such as French Polynesia and Samoa. However, 60 percent of the countries for which data is available have less than one percent of their agricultural land under organic management (Figure 4).
Table 4: World: Organic agricultural land (including in-conversion areas) and organic share of total agricultural land by region 2016
Region Organic agr. land [ha] Share of total agri. land Africa 1’801’699 0.2% Asia 4’897’837 0.3% Europe 13’509’146 2.7% Latin America 7’135’155 0.9% North America 3’130’332 0.8% Oceania 27’346’986 6.5% World* 57’816’759 1.2%
Source: FiBL survey 2018. * Total includes correction value for French overseas departments.
To calculate the percentages, the data on the total agricultural land for most countries was taken from the FAO’s Statistical database on the FAOSTAT website.1 For the European Union, most data was obtained from Eurostat. Where available, data from national sources was used for the total agricultural land (for instance, Austria, Switzerland, and the United States), which sometimes differs from that published by Eurostat or FAOSTAT.
Please note that the calculation of the organic shares based on Eurostat and FAOSTAT data may differ in some cases from the data published by ministries and experts.
1 FAOSTAT, the FAO Homepage, FAO, Rome at faostat3.fao.org > Agri-Environmental Indicators > Download http://www.fao.org/faostat/en/#data/RL

Statistics › Organic Agricultural Land › Organic Share
FiBL & IFOAM – Organics International (2018): The World of Organic Agriculture. Frick and Bonn 43
Figure 3: World: Countries with an organic share of the total agricultural land of at least 10 percent 2016
Source: FiBL survey 2018, based on information from the private sector, certifiers, and governments. Calculation of organic shares based on FAOSTAT, Eurostat, and national sources. For detailed data sources see annex, page 330
Figure 4: World: Distribution of the organic shares of the agricultural land 2016
Source: FiBL survey 2018, based on information from the private sector, certifiers, and governments. Calculation of organic shares based on FAOSTAT, Eurostat, and national sources. For detailed data sources see annex, page 330
10.0%10.4%
11.5%11.5%12.2%
13.5%13.8%14.3%14.5%
18.0%18.9%
21.9%22.4%
31.3%37.7%
0% 10% 20% 30% 40%
French Guiana (France)Finland
UruguayCzech Republic
Falkland Islands (Malvinas)Switzerland
Sao Tome and PrincipeLatvia
ItalySwedenEstoniaAustriaSamoa
French PolynesiaLiechtenstein
Share of total agricultural land
Countries with an organic share of at least 10 percent 2016Source: FiBL survey 2018

Statistics › Organic Agricultural Land › Organic Share
44 FiBL & IFOAM – Organics International (2018): The World of Organic Agriculture. Frick and Bonn
Table 5: World: Organic shares of total agricultural land by country 2016 (sorted)
For an alphabetical country list (including information on data year), see page 326.
Country Organic share Liechtenstein 37.7% French Polynesia 31.3% Samoa 22.4% Austria 21.9% Estonia 18.9% Sweden 18.0% Italy 14.5% Latvia 14.3% Sao Tome and Principe 13.8% Switzerland 13.5% Falkland Islands (Malvinas) 12.2% Czech Republic 11.5% Uruguay 11.5% Finland 10.4% French Guiana (France) 10.0% Slovakia 9.9% Slovenia 9.0% Dominican Republic 8.7% Spain 8.7% Faroe Islands 8.4% Denmark 7.7% Lithuania 7.6% Germany 7.5% Timor-Leste 7.4% Portugal 6.7% Australia 6.7% Vanuatu 6.3% Belgium 6.0% Croatia 6.0% France 5.5% Solomon Islands 5.3% Cyprus 5.1% Norway 4.8% Kiribati 4.7% Tonga 4.6% Greece 4.2% Hungary 4.0% Poland 3.7% Sri Lanka 3.5% Bulgaria 3.5% Niue 3.3% Luxembourg 3.3% Fiji 3.1% United Kingdom 2.9% Egypt 2.8% Netherlands 2.8% Argentina 2.0% Palestine, State of 2.0% Comoros 1.9% Channel Islands 1.9% Uganda 1.8% Tunisia 1.8%
Country Organic share Réunion (France) 1.8% Sierra Leone 1.8% Romania 1.7% Canada 1.7% Philippines 1.6% Ireland 1.5% Montenegro 1.5% Turkey 1.4% Peru 1.3% Papua New Guinea 1.3% Bhutan 1.3% Moldova 1.2% Iceland 1.2% United Arab Emirates 1.2% Republic of Korea 1.2% Israel 1.1% Grenada 1.1% Dominica 1.0% Martinique (France) 0.9% Ukraine 0.9% Honduras 0.9% India 0.8% Taiwan 0.8% Azerbaijan 0.8% Ecuador 0.7% Tanzania, United Republic of 0.7% Panama 0.7% New Zealand 0.7% Cook Islands 0.7% Nicaragua 0.7% United States Virgin Islands 0.7% Mexico 0.6% United States of America 0.6% Cape Verde 0.6% Togo 0.6% Kenya 0.6% Ethiopia 0.5% Viet Nam 0.5% China 0.4% Costa Rica 0.4% Serbia 0.4% Congo, D.R. 0.4% Guatemala 0.4% Bahamas 0.3% Haiti 0.3% Lao, P.D.R. 0.3% Guadeloupe (France) 0.3% Bolivia 0.3% Paraguay 0.3% Tajikistan 0.3% Brazil 0.3% Thailand 0.3%

Statistics > Organic Agricultural Land > Organic Share
FiBL & IFOAM – Organics International (2018): The World of Organic Agriculture. Frick and Bonn 45
Country Organic share Macedonia, FYROM 0.3% New Caledonia 0.2% Belize 0.2% Malta 0.2% Nepal 0.2% Burkina Faso 0.2% Indonesia 0.2% Japan 0.2% Malawi 0.2% Côte d’Ivoire 0.2% Sudan 0.2% Cambodia 0.2% Lebanon 0.2% Benin 0.2% Madagascar 0.1% Syrian Arab Republic 0.1% Jordan 0.1% Kazakhstan 0.1% Ghana 0.1% Russian Federation 0.1% Pakistan 0.1% Chile 0.1% El Salvador 0.1% Jamaica 0.1% Senegal 0.1% Namibia 0.1% Kyrgyzstan 0.1% Bangladesh 0.1% Nigeria 0.1% Armenia 0.1% Rwanda 0.1% Colombia 0.1% Georgia 0.1% Albania 0.1% Bosnia and Herzegovina 0.05% Kosovo 0.04% Suriname 0.04% Guinea-Bissau 0.04% Iran 0.04% Myanmar 0.04% Morocco 0.03% Zambia 0.03% Mali 0.03% Lesotho 0.02% Cuba 0.02% Zimbabwe 0.02% Andorra 0.02% Mozambique 0.02% Mauritius 0.01% South Africa 0.01% Kuwait 0.01% Saudi Arabia 0.01% Malaysia 0.01% Puerto Rico 0.01% Burundi 0.01% Cameroon 0.004%
Country Organic share Oman 0.003% Algeria 0.002% Afghanistan 0.001% Iraq 0.001% Niger 0.001% Swaziland 0.0004% Belarus (Wild collection)
Bermuda (Processing) Brunei Darussalam (Aquaculture) Chad (Wild collection) Guyana (Wild collection) Hong Kong (Processing) Monaco (Processing) San Marino (Processing) Singapore (Processing) Somalia (Wild collection) Uzbekistan (Wild collection) Venezuela (Processing) World 1.2%
Source: FiBL survey 2018, based on information from the private sector, certifiers, and governments. Calculation of organic shares based on FAOSTAT, Eurostat, and national sources. For detailed data sources see annex, page 330

Statistics › Organic Agricultural Land › Development
46 FiBL & IFOAM – Organics International (2018): The World of Organic Agriculture. Frick and Bonn
Growth of the organic agricultural land
Compared with 1999, when 11 million hectares were organic, organic agricultural land has increased five-fold. In 2016, 7.5 million hectares, or almost 15 percent, more were reported compared with 2015. This is mainly due to the fact that 5 million additional hectares were reported from Australia. However, many other countries reported an important increase, thus contributing to the global increase of the organic land, like China (42 percent increase; over 0.67 million hectares more) and Uruguay (27 percent increase; almost 0.35 million hectares more), and India and Italy, both with an additional 0.3 million hectares.
In 2016, the area of organic agricultural land increased in all regions (Table 6). The highest absolute growth was in Oceania (+22.9 percent, +5.1 million hectares), followed by Asia (+23.5 percent, over +0.9 million hectares) and Europe (+6.7 percent, +0.8 million hectares). In 2016, Latin America reported the first regional growth after several years of drops (+6 percent, almost 0.4 million hectares).
Eighty-three countries experienced an increase in the area of their organic agricultural land, while a decrease was reported in 39 countries. In 51 countries, the organic agricultural area either did not change or no new data was received. The figures shown in the following tables and graphs with historical figures may differ from what was previously communicated, as data revisions were received and included in the FiBL database.
Table 6: World: Organic agricultural land (including in-conversion areas) by region: growth 2015-2016
Region Organic agr. land 2015
[ha]
Organic agr. land 2016
[ha]
1 year growth
[ha]
1 year growth
[%]
10 years growth
[ha]
10 years growth
[%] Africa 1’682’788 1’801’699 +118’911 +7.1% +939’348 +108.9% Asia 3’965’289 4’897’837 +932’549 +23.5% +1’995’140 +68.7% Europe 12’663’914 13’509’146 +845’232 +6.7% +5’717’098 +73.4% Latin America 6’737’231 7’135’155 +397’924 +5.9% +1’549’488 +27.7% North America 2’973’885 3’130’332 +156’446 +5.3% +837’975 +36.6% Oceania 22’257’008 27’346’986 +5’089’977 +22.9% +15’272’436 +126.5% World* 50’276’260 57’816’759 +7’540’499 +15.0% +26’307’088 +83.5%
Source: FiBL survey 2018, based on data from government bodies, the private sector, and certifiers. For detailed data sources see annex, page 330 * Total includes correction value for French Overseas Departments.

Statistics › Organic Agricultural Land › Development
FiBL & IFOAM – Organics International (2018): The World of Organic Agriculture. Frick and Bonn 47
Figure 5: World: Growth of the organic agricultural land and organic share 1999-2016
Source: FiBL-IFOAM-SOEL surveys 2000-2018
Figure 6: World: Growth of the organic agricultural land by continent 2008 to 2016
Source: FiBL-IFOAM-SOEL surveys 2010-2018

Statistics › Organic Agricultural Land › Development
48 FiBL & IFOAM – Organics International (2018): The World of Organic Agriculture. Frick and Bonn
Figure 7: World: The ten countries with the highest increase of organic agricultural land 2016 Source: FiBL survey 2018, based on data from government bodies, the private sector, and certifiers. For detailed data sources see annex, page 330
Table 7: World: Development of organic agricultural land by country 2013-2016
Important note: A direct year-to-year comparison is not always possible for many countries, because the data sources may have changed over the years, or data access may have improved. The figures published here may differ from previously published data due to data revisions. Data are not available for all countries for every year and; in these cases, the figure for the previous year is used (see also page 330). At statistics.fibl.org data back to 2000 is available.1
Country 2013 [ha] 2014 [ha] 2015 [ha] 2016 [ha] 1 year
growth [ha]
10 years growth
[ha] Afghanistan 61
81 408 +327 +386
Albania 515 662 662 662 - +479 Algeria 700 700 706 772 +66 -778 Andorra 1 4 2 4 +2 +4 Angola 2’486
- -
Argentina 3’281’193 3’061’965 3’073’412 3’011’794 -61’618 +233’835 Armenia 1’000 1’000 1’832 1’240 -592 +904
Australia 17’150’000 18’340’000 22’108’495 27’145’021 +5’036’526 +15’156’977
Austria 558’623 551’062 553’570 571’585 +18’015 +51’515 Azerbaijan 23’331 23’331 37’630 37’630 - +16’390 Bahamas 49 49 49 49 - +49 Bangladesh 6’860 6’860 6’860 6’860 - +6’860 Belarus Wild collection only Belgium 62’529 66’704 68’818 78’452 +9’634 +45’824
1 The data is available at http://www.organic-world.net/statistics/statistics-data-tables.html.
+56'612
+89'875
+154'455
+162'482
+215'845
+303'071
+310'000
+349'531
+671'287
+5'036'526
0 1'000'000 2'000'000 3'000'000 4'000'000 5'000'000 6'000'000
Hungary
Mexico
Canada
Germany
France
Italy
India
Uruguay
China
Australia
Hectares
The ten countries with the highest increase of organic land 2016Source: FiBL survey 2018

Statistics › Organic Agricultural Land › Development
FiBL & IFOAM – Organics International (2018): The World of Organic Agriculture. Frick and Bonn 49
Country 2013 [ha] 2014 [ha] 2015 [ha] 2016 [ha] 1 year
growth [ha]
10 years growth
[ha] Belize 802 892 840 380 -460 -352 Benin 1’987 2’344 2’364 5’679 +3’315 +4’191 Bermuda Processing only Bhutan 6’726 6’829 6’950 6’632 -318 +6’573 Bolivia 145’894 114’306 114’306 114’306 - +73’302 Bosnia and Herzegovina 292 353 576 992 +416 +301
Brazil 705’233 750’000 750’000 750’000 - -182’120 Brunei Darussalam Wild collection only
Bulgaria 56’287 74’351 118’552 160’620 +42’068 +146’974 Burkina Faso 16’689 20’110 23’923 27’268 +3’345 +20’001 Burundi 550 148 184 103 -80 +103 Cambodia 9’889 9’889 12’058 9’717 -2’342 +5’397 Cameroon 663 380 380 380 - +44 Canada 869’239 903’948 944’558 1’099’014 +154’455 +542’741 Cape Verde
495 495 - +495
Chad Wild collection only Channel Islands 240 180 180 180 - +180 Chile 23’469 19’932 19’932 15’838 -4’094 +3’270 China 2’094’000 1’925’000 1’609’928 2’281’215 +671’287 +728’215 Colombia 31’621 31’621 31’621 31’621 - -12’675 Comoros 2’642 1’723 1’534 2’577 +1’043 +2’577 Congo, D.R. 51’838 89’058 94’386 94’386 - +88’318 Cook Islands 20 10 10 10 - +10 Costa Rica 7’449 7’832 7’819 7’908 +89 +34 Côte d’Ivoire 19’263 19’548 40’078 42’004 +1’926 +41’062 Croatia 40’641 50’054 75’883 93’593 +17’710 +86’032 Cuba 7’389 2’979 4’338 1’282 -3’056 -13’032 Cyprus 4’303 3’887 4’699 5’550 +851 +3’228 Czech Republic 474’231 472’663 478’033 488’591 +10’558 +175’701 Denmark 169’298 165’773 166’788 201’476 +34’688 +56’083 Dominica 240 240 240 240 - +240 Dominican Republic 180’609 166’220 163’936 205’258 +41’323 +82’169
Ecuador 42’781 45’818 45’818 39’824 -5’994 -9’372 Egypt 85’801 85’801 85’000 105’908 +20’908 +86’702 El Salvador 6’736 6’736 13’728 1’426 -12’302 -6’052 Estonia 151’256 155’560 155’806 180’852 +25’046 +101’322 Ethiopia 160’987 160’987 186’155 186’155 - +45’850 Falkland Islands (Malvinas) 403’212 403’212 135’596 135’596 - +135’596
Faroe Islands 253 253 253 253 - +241 Fiji 2’164 9’218 10’939 13’347 +2’408 +13’247 Finland 206’170 212’653 225’235 238’240 +13’005 +89’480 France 1’060’756 1’118’845 1’322’202 1’538’047 +215’845 +980’914 French Guiana (France) 2’702 2’014 2’746 3’051 +305 +3’051
French Polynesia 2’469 93 167 14’229 +14’062 +14’229
Gambia
- -86 Georgia 1’999 1’292 1’452 1’452 - +1’201 Germany 1’044’955 1’047’633 1’088’838 1’251’320 +162’482 +385’984 Ghana 28’201 15’563 23’380 21’326 -2’053 -3’123 Greece 383’606 362’826 407’069 342’584 -64’485 +62’689

Statistics › Organic Agricultural Land › Development
50 FiBL & IFOAM – Organics International (2018): The World of Organic Agriculture. Frick and Bonn
Country 2013 [ha] 2014 [ha] 2015 [ha] 2016 [ha] 1 year
growth [ha]
10 years growth
[ha] Grenada 85 85 85 85 - +85 Guadeloupe (France) 193 69 104 168 +64 +168
Guatemala 13’380 13’380 13’380 13’380 - +6’095 Guinea-Bissau 1’843 1’843 3’403 689 -2’714 -4’911 Guyana Wild collection only Haiti 2’878 2’878 4’250 6’112 +1’862 +6’112 Honduras 24’950 24’950 22’846 28’689 +5’843 +20’511 Hong Kong Processing only Hungary 131’018 124’841 129’735 186’347 +56’612 +64’077 Iceland 9’710 11’174 9’797 22’710 +12’913 +16’481 India 510’000 720’000 1’180’000 1’490’000 +310’000 +459’689 Indonesia 65’688 113’638 130’384 126’014 -4’370 +56’408 Iran 12’156 11’601 14’574 18’871 +4’297 +17’958 Iraq 40 51 58 60 +3 +60 Ireland 53’565 51’871 73’037 76’701 +3’664 +35’579 Israel 6’289 6’640 5’758 5’758 - +65 Italy 1’317’177 1’387’913 1’492’579 1’796’363 +303’784 +646’110 Jamaica 542 27 167 374 +207 -63 Japan 9’889 9’937 10’043 9’956 -87 +3’330 Jordan 2’898 2’371 1’706 1’517 -190 +470 Kazakhstan 291’203 291’203 303’381 303’381 - +300’988 Kenya 4’894 4’894 150’479 154’488 4’009 +149’852 Kiribati
1’600 1’600 1’600 - +1’600
Kosovo 114 114 160 160 - +160 Kuwait
20 20 - +20
Kyrgyzstan 2’856 6’929 7’565 7’974 +408 -7’174 Lao, P.D.R. 6’442 6’275 1’445 7’668 +6’223 +7’668 Latvia 200’433 203’443 231’608 259’146 +27’538 +108’641 Lebanon 2’571 1’079 1’222 1’079 -143 -867 Lesotho 560 560 548 548 - +548 Liechtenstein 1’137 1’135 1’107 1’383 +276 +335 Lithuania 166’330 164’390 213’579 221’665 +8’086 +101’247 Luxembourg 4’447 4’490 4’216 4’274 +58 +894 Macedonia, FYROM 3’146 3’146 2’174 3’245 +1’071 +1’912
Madagascar 30’265 30’265 121’011 60’023 -60’988 +50’567 Malawi 265 102 207 12’239 +12’032 +11’914 Malaysia 603 603 603 603 - -937 Mali 3’727 11’919 11’919 11’919 - +8’517 Malta 7 34 30 24 -6 +12 Martinique (France) 269 248 279 297 +18 +297
Mauritius 16 6 1 13 +11 +13 Mayotte 5 5 9
-9 -
Mexico 501’364 501’364 584’093 673’968 +89’875 +280’507 Moldova 22’102 22’102 28’729 30’142 +1’413 +18’447 Monaco Processing only Mongolia 12’922 - - - - - Montenegro 3’068 3’289 3’213 3’470 +257 -21’581 Morocco 8’660 8’660 9’330 10’000 +670 +6’410 Mozambique 13’998 15’421 16’176 7’412 -8’764 +6’684 Myanmar 897 5’320 5’626 4’568 -1’059 +4’568 Namibia 23’086 30’082 30’127 30’127 - +30’047

Statistics › Organic Agricultural Land › Development
FiBL & IFOAM – Organics International (2018): The World of Organic Agriculture. Frick and Bonn 51
Country 2013 [ha] 2014 [ha] 2015 [ha] 2016 [ha] 1 year
growth [ha]
10 years growth
[ha] Nepal 9’361 9’361 9’361 9’361 - +1’167 Netherlands 49’394 49’159 49’273 52’204 +2’931 +5’185 New Caledonia
411 411 438 +27 +438
New Zealand 106’753 106’753 74’134 74’134 - +10’251 Nicaragua 33’621 33’621 33’621 33’621 - -37’351 Niger 106 262 262 262 - +131 Nigeria 250 5’021 5’021 52’421 +47’400 +49’267 Niue 61 164 52 164 +112 +5 Norway 51’662 49’827 47’640 47’621 -19 -1’242 Oman 38 38 38 38 - +38 Pakistan 22’397 23’828 34’209 45’299 +11’089 +20’298 Palestine, State of 6’354 6’896 6’014 5’993 -21 +2’627
Panama 15’183 15’183 15’183 15’183 - +9’939 Papua New Guinea 20’939 19’796 15’829 15’632 -197 +13’135
Paraguay 62’274 54’444 64’097 64’097 - +12’907 Peru 388’448 263’012 327’245 323’578 -3’667 +218’864 Philippines 86’155 110’084 234’642 198’309 -36’333 +182’965 Poland 669’863 657’902 580’731 536’579 -44’152 +250’701 Portugal 197’295 212’346 241’375 245’052 +3’677 +11’577 Puerto Rico
14 14 14 - +14
Republic of Korea 21’210 18’306 18’136 20’165 +2’029 +10’436
Réunion (France) 595 659 718 881 +163 +881
Romania 301’148 289’252 245’924 226’309 -19’615 +94’853 Russian Federation 144’254 245’846 385’140 289’890 -95’250 +256’089
Rwanda 3’705 2’248 1’169 1’284 +115 +772 Samoa 33’515 40’477 27’656 63’393 +35’737 +56’150 San Marino Processing only Sao Tome and Principe 4’051 6’706 6’706 6’706 - +3’845
Saudi Arabia 36’595 37’563 36’487 17’212 -19’275 -5’003 Senegal 6’929 6’929 7’047 7’172 +125 +5’583 Serbia 8’228 9’548 15’298 14’358 -940 +13’528 Sierra Leone
15’347 69’686 +54’339 +69’686
Singapore Processing only Slovakia 157’848 180’307 181’882 187’024 +5’142 +69’118 Slovenia 38’665 41’237 42’188 43’579 +1’391 +14’257 Solomon Islands 1’307 5’302 5’612 5’723 +111 +2’095
Somalia Wild collection only South Africa 37’466 19’501 34’203 14’196 -20’007 -35’816 Spain 1’610’129 1’710’475 1’968’570 2’018’802 +50’232 +1’213’918 Sri Lanka 19’517 62’560 96’318 96’318 - +79’318 Sudan 130’000 130’000 130’000 130’000 - +73’676 Suriname
39 39 39 - -1
Swaziland 3 8 571 5 -566 2 Sweden 500’996 501’831 518’983 552’695 +33’712 +244’422 Switzerland 128’140 133’973 137’234 141’249 +4’015 +24’608 Syrian Arab Republic 19’987 19’987 19’987 19’987 - -8’474
Taiwan 5’937 5’993 6’490 6’490 - +4’477

Statistics › Organic Agricultural Land › Development
52 FiBL & IFOAM – Organics International (2018): The World of Organic Agriculture. Frick and Bonn
Country 2013 [ha] 2014 [ha] 2015 [ha] 2016 [ha] 1 year
growth [ha]
10 years growth
[ha] Tajikistan 12’659 12’659 12’659 12’659 - +12’659 Tanzania 186’537 186’537 268’729 268’729 - +206’548 Thailand 33’840 37’684 45’587 57’189 +11’602 +38’033 Timor-Leste 24’690 25’479 25’232 28’259 +3’027 +4’469 Togo 4’638 15’321 15’324 21’572 +6’248 +19’027 Tonga 398 1’997 2’629 1’502 -1’128 +1’502 Tunisia 139’087 139’087 145’629 181’076 +35’447 +26’283 Turkey 461’396 491’977 486’069 523’777 +37’708 +399’514 Uganda 230’232 240’197 241’150 262’282 +21’132 -33’921 Ukraine 393’400 400’764 410’550 381’173 -29’377 +131’301 United Arab Emirates 4’150 4’286 4’286 4’590 +304 +4’585
United Kingdom 558’718 521’475 495’929 490’205 -5’724 -169’995
United States 2’178’471 1’554’517 2’029’327 2’031’318 +1’991 +295’234
US Virgin Islands
26 26 26 - +26
Uruguay 930’965 1’307’421 1’307’421 1’656’952 +349’531 +725’987 Uzbekistan 213 Wild collection only - -1’854 Vanuatu 4’106 6’594 9’474 11’794 +2’320 +2’798 Venezuela 47 Processing only - -2’441 Viet Nam 37’490 43’007 76’666 53’348 -23’318 +41’228 Zambia 7’552 7’552 8’138 7’738 -400 +5’208 Zimbabwe 374 474 980 3’179 +2’199 +3’179 World 43’196’160 44’403’982 50’276’260 57’816’759 +7’540’499 +26’307’088
Source: FiBL survey 2018, based on information from the private sector, certifiers, and governments. For detailed data sources see previous editions of “The World of Organic Agriculture” and annex, page 330 *Total includes correction value for French overseas departments.
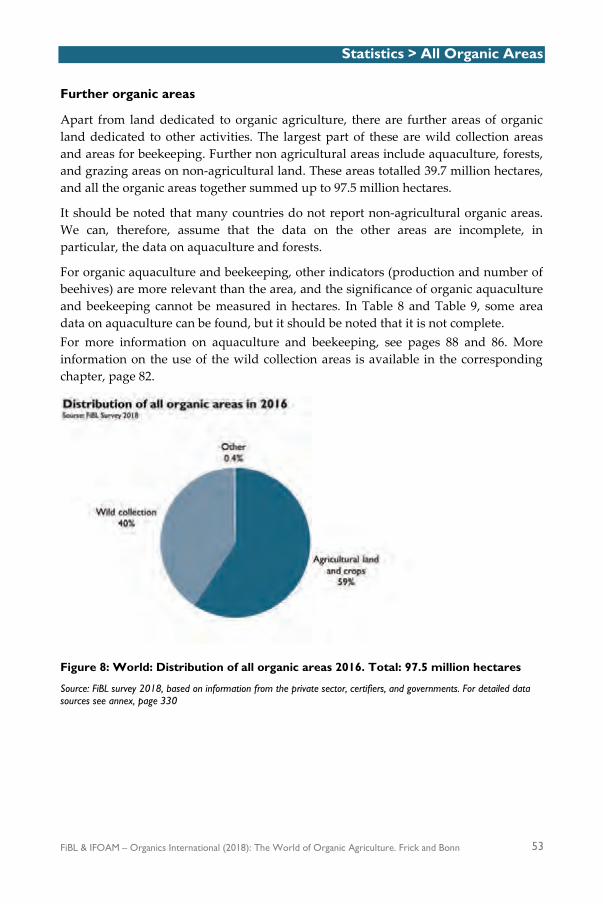
Statistics > All Organic Areas
FiBL & IFOAM – Organics International (2018): The World of Organic Agriculture. Frick and Bonn 53
Further organic areas
Apart from land dedicated to organic agriculture, there are further areas of organic land dedicated to other activities. The largest part of these are wild collection areas and areas for beekeeping. Further non agricultural areas include aquaculture, forests, and grazing areas on non-agricultural land. These areas totalled 39.7 million hectares, and all the organic areas together summed up to 97.5 million hectares.
It should be noted that many countries do not report non-agricultural organic areas. We can, therefore, assume that the data on the other areas are incomplete, in particular, the data on aquaculture and forests.
For organic aquaculture and beekeeping, other indicators (production and number of beehives) are more relevant than the area, and the significance of organic aquaculture and beekeeping cannot be measured in hectares. In Table 8 and Table 9, some area data on aquaculture can be found, but it should be noted that it is not complete. For more information on aquaculture and beekeeping, see pages 88 and 86. More information on the use of the wild collection areas is available in the corresponding chapter, page 82.
Figure 8: World: Distribution of all organic areas 2016. Total: 97.5 million hectares
Source: FiBL survey 2018, based on information from the private sector, certifiers, and governments. For detailed data sources see annex, page 330

Statistics › All Organic Areas
54 FiBL & IFOAM – Organics International (2018): The World of Organic Agriculture. Frick and Bonn
Table 8: World: Organic areas: Agricultural land (including conversion areas) and further organic areas by region in 2016
Region Agriculture [ha]
Aqua-culture
[ha]
Forest [ha]
Grazed non agri. land [ha]
Wild collection
[ha]*
Other non agri.
land [ha]
Total [ha]
Africa 1’801’699
13’723 20’000 12’119’609
13’955’031 Asia 4’897’837 68’181 123
6’259’421 1’507 11’227’069
Europe 13’509’146
19’533
16’665’097
30’193’776 Latin America 7’135’155 3’791
4’194’720 11’930 11’345’597
North America 3’130’332
254’655
79’855
3’464’842
Oceania 27’346’986
765
27’347’751 World** 57’816’759 71’972 288’034 20’000 39’319’467 13’437 97’529’669
Source: FiBL survey 2018, based on information from the private sector, certifiers, and governments. For detailed data sources see annex, page 330 Blank cells: No data available. *Wild collection and beekeeping areas **Total includes correction value for French overseas departments.
Table 9: World: Organic areas: Agricultural land (including conversion areas) and further organic areas by country 2016
Country Agriculture [ha]
Aqua-culture
[ha]
Forest [ha]
Grazed non
agri. land [ha]
Wild collection
[ha]*
Other non
agri. land [ha]
Total [ha]
Afghanistan 408 408 Albania 662
467’783
468’445
Algeria 772
628
1’400 Andorra 4
4
Argentina 3’011’794
319’370 11’930 3’343’094 Armenia 1’240
6’000
7’240
Australia 27’145’021
27’145’021 Austria 571’585
571’585
Azerbaijan 37’630 123 123
1’063
38’939 Bahamas 49
49
Bangladesh 6’860 5’848
12’708 Belarus
2’742
2’742
Belgium 78’452
3
78’454 Belize 380
380
Benin 5’679
4’505
10’184 Bermuda Processing only Bhutan 6’632
15’787
22’419
Bolivia 114’306
922’991
1’037’297 Bosnia and Herzegovina 992
69’310
70’302
Brazil 750’000
1’213’351
1’963’351 Brunei Darussalam 29
29
Bulgaria 160’620
307’020
467’640 Burkina Faso 27’268
80’068
107’336
Burundi 103
103

Statistics › All Organic Areas
FiBL & IFOAM – Organics International (2018): The World of Organic Agriculture. Frick and Bonn 55
Country Agriculture [ha]
Aqua-culture
[ha]
Forest [ha]
Grazed non
agri. land [ha]
Wild collection
[ha]*
Other non
agri. land [ha]
Total [ha]
Cambodia 9’717
9’717 Cameroon 380
380
Canada 1’099’014
49’459
79’517
1’227’990 Cape Verde 495
495
Chad
124’130
124’130 Channel Islands 180
180
Chile 15’838
116’137
131’975 China 2’281’215
811’680
3’092’895
Colombia 31’621
7’320
38’941 Comoros 2’577
63
2’641
Congo, D.R. 94’386
94’386 Cook Islands 10
10
Costa Rica 7’908 664
8’571 Côte d’Ivoire 42’004
344
42’348
Croatia 93’593
8
93’601 Cuba 1’282
1’282
Cyprus 5’550
5’550 Czech Republic 488’591
488’591
Denmark 201’476
2’648
204’124 Dominica 240
240
Dominican Republic 205’258
205’258
Ecuador 39’824 3’123
1’260
44’207 Egypt 105’908
60’000
165’908
El Salvador 1’426
1’426 Estonia 180’852
40’579
221’431
Ethiopia 186’155
9’033
195’188 Falkland Islands (Malvinas)
135’596
135’596
Faroe Islands 253
253 Fiji 13’347
653
14’000
Finland 238’240
11’628’576
11’866’816 France 1’538’047
1’538’047
French Guiana (France)
3’051
3’051
French Polynesia 14’229
14’229
Georgia 1’452
215 1’507 3’174 Germany 1’251’320
1’251’320
Ghana 21’326
33’592
54’918 Greece 342’584
317’053
659’637
Grenada 85
85 Guadeloupe (France) 168
168
Guatemala 13’380
5
13’385 Guinea-Bissau 689
689
Guyana
58’000
58’000 Haiti 6’112
6’112
Honduras 28’689
28’689

Statistics › All Organic Areas
56 FiBL & IFOAM – Organics International (2018): The World of Organic Agriculture. Frick and Bonn
Country Agriculture [ha]
Aqua-culture
[ha]
Forest [ha]
Grazed non
agri. land [ha]
Wild collection
[ha]*
Other non
agri. land [ha]
Total [ha]
Hong Kong Processing only Hungary 186’347
186’347
Iceland 22’710
212’468
235’178 India 1’490’000
4’220’000
5’710’000
Indonesia 126’014 3’320
10’700
140’034 Iran 18’871
30’502
49’373
Iraq 60
60 Ireland 76’701
76’701
Israel 5’758
5’758 Italy 1’796’363
176’628
1’972’991
Jamaica 374
36
410 Japan 9’956
9’956
Jordan 1’517
1’517 Kazakhstan 303’381
863
304’244
Kenya 154’488
121’625
276’113 Kiribati 1’600
1’600
Kosovo 160
179’580
179’740 Kuwait 20
20
Kyrgyzstan 7’974
10
7’983 Lao, P.D.R. 7’668
17’068
24’736
Latvia 259’146
259’146 Lebanon 1’079
393
1’472
Lesotho 548
50’000
50’548 Liechtenstein 1’383
1’383
Lithuania 221’665
221’665 Luxembourg 4’274
4’274
Macedonia, FYROM 3’245
556’600
559’845
Madagascar 60’023
10’897
70’920 Malawi 12’239
6’319
18’558
Malaysia 603
603 Mali 11’919
8’146
20’065
Malta 24
24 Martinique (France) 297
297
Mauritius 13
13 Mexico 673’968
1’292’306
1’966’274
Moldova 30’142
30’142 Monaco Processing only Montenegro 3’470
143’410
146’880
Morocco 10’000
35
170’035
180’070 Mozambique 7’412
147’930
155’342
Myanmar 4’568
4’568 Namibia 30’127
2’041’901
2’072’028
Nepal 9’361
24’422
33’783 Netherlands 52’204
52’204
New Caledonia 438
438
New Zealand 74’134
74’134 Nicaragua 33’621
11’463
45’084
Niger 262
262 Nigeria 52’421
150
1’000
53’571
Niue 164
112
276

Statistics › All Organic Areas
FiBL & IFOAM – Organics International (2018): The World of Organic Agriculture. Frick and Bonn 57
Country Agriculture [ha]
Aqua-culture
[ha]
Forest [ha]
Grazed non
agri. land [ha]
Wild collection
[ha]*
Other non
agri. land [ha]
Total [ha]
Norway 47’621
47’621 Oman 38
38
Pakistan 45’299
44’620
89’919 Palestine, State of 5’993
5’993
Panama 15’183
15’183 Papua New Guinea 15’632
15’632
Paraguay 64’097
3’067
67’164 Peru 323’578 4
249’413
572’995
Philippines 198’309
198’309 Poland 536’579
536’579
Portugal 245’052
19’533
40’000
304’585 Puerto Rico 14
14
Republic of Korea 20’165
20’165
Réunion (France) 881
881
Romania 226’309
1’787’548
2’013’857 Russian Federation 289’890
30’921
320’811
Rwanda 1’284
12
1’296 Samoa 63’393
63’393
San Marino Processing only Sao Tome and Principe 6’706
6’706
Saudi Arabia 17’212
17’212 Senegal 7’172
22’000
29’172
Serbia 14’358
1’550
15’908 Sierra Leone 69’686
69’686
Singapore Processing only Slovakia 187’024
187’024
Slovenia 43’579
13’238
56’817 Solomon Islands 5’723
5’723
Somalia
849’482
849’482 South Africa 14’196
1’092’563
1’106’758
Spain 2’018’802
2’018’802 Sri Lanka 96’318
96’318
Sudan 130’000
84’960
214’960 Suriname 39
39
Swaziland 5
5 Sweden 552’695
552’695
Switzerland 141’249
141’249 Syrian Arab Republic 19’987
8’000
27’987
Taiwan 6’490
6’490 Tajikistan 12’659
1’055’890
1’068’549
Tanzania 268’729
15’040
283’769 Thailand 57’189 662
57’851
Timor-Leste 28’259
28’259 Togo 21’572
242
21’814
Tonga 1’502
1’502

Statistics › All Organic Areas
58 FiBL & IFOAM – Organics International (2018): The World of Organic Agriculture. Frick and Bonn
Country Agriculture [ha]
Aqua-culture
[ha]
Forest [ha]
Grazed non
agri. land [ha]
Wild collection
[ha]*
Other non
agri. land [ha]
Total [ha]
Tunisia 181’076
13’538 20’000 25’486
240’100 Turkey 523’777
137’433
661’210
Uganda 262’282
158’328
420’610 Ukraine 381’173
550’000
931’173
United Arab Emirates 4’590
4’590
United Kingdom 490’205
490’205
United States 2’031’318
205’196
338
2’236’852 Uruguay 1’656’952
1’656’952
US Virgin Islands 26
26
Uzbekistan
5’000
5’000 Vanuatu 11’794
11’794
Venezuela Processing only Viet Nam 53’348 58’199
7’208
118’755
Zambia 7’738
6’700’680
6’708’418 Zimbabwe 3’179
300’600
303’779
World** 57’816’759 71’972 288’034 20’000 39’319’467 13’437 97’529’669
Source: FiBL survey 2018, based on information from the private sector, certifiers, and governments. For detailed data sources see annex, page 330 Blank cells: No data available. *Wild collection and beekeeping areas **Total includes correction value for French overseas departments.

FiBL & IFOAM – Organics International (2018): The World of Organic Agriculture. Frick and Bonn 59
Info
grap
hic
3: O
rgan
ic p
rodu
cers
201
6
Sour
ce: F
iBL
surv
ey 2
018

Statistics › Producers and Other Operators
60 FiBL & IFOAM – Organics International (2018): The World of Organic Agriculture. Frick and Bonn
Organic producers and other operator types
Producers
There were over 2.7 million organic producers worldwide. According to the data obtained, over 80 percent of the producers are in Asia, Africa, and Latin America (Figure 9). The country with the most organic producers is India, followed by Uganda and Mexico (Figure 10).
There has been an increase in the number of producers of over 300’000, or over 13 percent, compared with 2015. In 2016, India, Uganda, Italy, Mexico, and Viet Nam reported significant increases. These five countries represent most of the total global increase.
Reporting precise figures on the number of organic farms remains difficult as some countries: • report only the numbers of companies, projects, or grower groups, which may
each comprise a number of individual producers; • do not provide data on the number of producers at all; • include collectors in case there are wild collection areas, and • provide the number of producers per crop, and there may be overlaps for those
growers who grow several crops. The number of producers should, therefore, be treated with caution, and it may be assumed that the total number of organic producers is higher than that reported here.
Table 10: World: Development of the numbers of producers by region 2015 to 2016
Region 2015 [no.] 2016 [no.] 1 year
growth [no.]
1 year growth
[%.]
10 years growth
[no.]
10 years growth
[%.] Africa 719’710 741’367 +21’657 +3.0% +213’930 +40.6% Asia 851’016 1’108’040 +257’024 +30.2% +872’599 +370.6% Europe 348’986 373’240 +24’254 +6.9% +161’031 +75.9% Latin America 456’806 458’532 +1’726 +0.4% +218’586 +91.1% North America 19’356 18’422 -934 -4.8% +3’126 +20.4% Oceania 22’009 27’366 +5’357 +24.3% +19’806 +262.0% Total 2’417’883 2’726’967 +309’084 +12.8% +1’489’078 +120.3%
Source: FiBL survey 2016, based on information from the private sector, certifiers, and governments. For detailed data sources see annex, page 330

Statistics › Producers and Other Operators
FiBL & IFOAM – Organics International (2018): The World of Organic Agriculture. Frick and Bonn 61
Figure 9: World: Distribution of organic producers by region 2016 (Total: 2.7 million producers)
Source: FiBL survey 2018, based on information from the private sector, certifiers, and governments. For detailed data sources see annex, page 330
Figure 10: World: The ten countries with the largest numbers of organic producers 2016
Source: FiBL survey 2018, based on information from the private sector, certifiers, and governments. For detailed data sources see annex, page 330
58'258
64'210
67'879
91'771
148'610
165'994
203'602
210'000
210'352
835'000
0 200'000 400'000 600'000 800'000 1'000'000
Paraguay
Italy
Turkey
Peru
Tanzania
Philippines
Ethiopia
Mexico
Uganda
India
Number of producers
The ten countries with the largest numbers of organic producers 2016Source: FiBL survey 2018

Statistics › Producers and Other Operators
62 FiBL & IFOAM – Organics International (2018): The World of Organic Agriculture. Frick and Bonn
Further operator types
Regarding data on further operator types, there are over 81’000 processors and at least 5’100 importers, most of them in Europe. However, not all countries reported the number of processors, exporters, importers, or other operator types. For instance, data for the United States is missing, and it can be assumed that the number of processors, importers, and exporters is far higher than what is indicated in the table below.
Further operator types reported were beekeepers, exporters, importers, smallholder groups, and aquaculture enterprises as well as the number of collectors (wild collection).
Table 11: World: Organic producers and other operator types by country 2016
For many countries (particularly those with no private or governmental data collection system), data on the various operator types is missing or incomplete, and only the number of producers or the total number of all operators is available.
Country Producers1 Processors Importers Exporters Albania (2014) 51 22 4 25 Algeria 64 3
Andorra
3
Argentina 1’148 340
99 Armenia 16 14
Australia 2’075 1’163 92 169 Austria 24’213 1’683 57 10 Azerbaijan (2015) 305 50 50 Bangladesh (2011) 9’335
Belgium 1’946 1’116 183 84 Belize 820 820
3
Benin 3’153 9
8 Bhutan 4’293
Bolivia (2014) 12’114 273
Bosnia and Herzegovina 45 17
13 Brazil (2015) 10’336 23
24
Brunei Darussalam Aquaculture only Bulgaria 6’964 175 13 9 Burkina Faso 9’036 36
35
Burundi (2015) 35
Cambodia (2013) 6’753
Cameroon (2014) 193 6
17 Canada 4’205 1’739
Chile (2013) 446 197
88 China 6’308 3’865 66 1’198 Colombia (2011) 4’775 47
45
Comoros (2015) 1’540 5
5 Congo, D.R. 36’571 6
7
Cook Islands 50
Costa Rica (2009) 3’000 61
12
Côte d’Ivoire 494 10
10 Croatia 3’546 312 8
1 Some countries report only the numbers of companies, projects or growers groups, which my each compromise a number of producers. See also explanation on page 60.

Statistics › Producers and Other Operators
FiBL & IFOAM – Organics International (2018): The World of Organic Agriculture. Frick and Bonn 63
Country Producers1 Processors Importers Exporters Cuba 508 6
3
Cyprus 1’174 57 4 4 Czech Republic 4’271 616 190 96 Denmark 3’306 972 78 80 Dominican Republic 29’311 152
14
Ecuador 12’483 22
Egypt 970 242
242
El Salvador (2007) 2’000 9
Estonia 1’753 135 26
Ethiopia (2015) 203’602 23
40
Falkland Islands (Malvinas) 5
5 Fiji 1’547 12
Finland 4’493 535 80 11 France 32’264 12’826 223 French Guiana (France) 62 6
French Polynesia 140 6
Georgia (2015) 1’075
Germany 27’132 14’501 1’598 787 Ghana 2’673 26
16
Greece 20’197 1’495 20 69 Grenada (2010) 3
Guadeloupe (France) 37 7
Guatemala (2010) 3’008 23
92 Haiti (2013) 1’210
Honduras 5’686
25 Hungary 3’414 442 34 Iceland 28 30
India 835’000 699
669
Indonesia 5’810 283
Iran 3’879 25
33
Ireland 1’767 277 24
Israel (2015) 303 303 41 40 Italy 64’210 16’578 363 518 Jamaica 127
Japan (2012) 2’130 1’805 193 Jordan 19 4
4
Kazakhstan (2015) 29 29 7 7 Kenya 37’295 22 15 32 Kiribati 900
Kosovo (2015) 100 5
Kyrgyzstan 1’427 4
Lao, P.D.R. (2011) 1’342
Latvia 4’145 48 9
Lebanon 101 51 5 3 Lesotho (2015) 4 4
3
Liechtenstein 43
Lithuania 2’539 65 11
Luxembourg 93 82 4
Macedonia, FYROM 509 17
6
Madagascar 20’210 115
111 Malawi 7 7
5
Malaysia (2013) 119
Mali (2014) 12’619 6
8
Malta 14 7 13
Martinique (France) 50 8
Mauritius 22

Statistics › Producers and Other Operators
64 FiBL & IFOAM – Organics International (2018): The World of Organic Agriculture. Frick and Bonn
Country Producers1 Processors Importers Exporters Mexico 210’000 154
44
Moldova 114
72 Montenegro 280 12
Morocco 80 75
Mozambique 3 7
7 Myanmar 12 12
Namibia (2015) 25 10
Nepal (2013) 687
Netherlands 1’557 990 364 81 New Caledonia 94
New Zealand (2015) 842 285 17 88 Nicaragua (2009) 10’060 30
4
Nigeria 102 81
80 Niue 51
Norway 2’083 399 79
Oman (2013) 4
Pakistan (2015) 111 26
Palestine, State of 1’553 46
4
Panama (2013) 1’300
Papua New Guinea 14’914 13
Paraguay (2014) 58’258 22
23 Peru 91’771
153
Philippines (2015) 165’994 66
31 Poland 22’435 705 120 180 Portugal 4’313 616 9 7 Puerto Rico 5
Republic of Korea 12’896 729
Réunion (France) 203 29
Romania 10’083 150 5 5 Russian Federation 55 35
9
Rwanda 4’013 5
Samoa 1’614 3
Sao Tome and Principe (2014) 3’738 5
5
Saudi Arabia (2015) 151
Senegal (2015) 18’398 12
Serbia 286 44 39 8 Sierra Leone 1’400 8
Singapore 5
Slovakia 431 36 13
Slovenia 3’513 310 14
Solomon Islands 1’510
South Africa 196 156
72 Spain 36’207 3’810 205 92 Sri Lanka 8’713 237
311
Sudan (2015) 354 3
3 Sweden 5’741 1’144 165 10 Switzerland 6’348 1’224 501 Syrian Arab Republic (2010) 2’458 9
Taiwan (2015) 2’598
Tajikistan (2012) 10’486 15
Tanzania (2013) 148’610
28 Thailand 15’670 291
51
Timor-Leste 4 4
3 Togo 9’934 15
20
Tonga 1’146
Tunisia 3’400 191 20 79 Turkey 67’879 1’422 61 46

Statistics › Producers and Other Operators
FiBL & IFOAM – Organics International (2018): The World of Organic Agriculture. Frick and Bonn 65
Country Producers1 Processors Importers Exporters Uganda 210’352
Ukraine 294
United Arab Emirates 92 6
7
United Kingdom 3’402 2’969 135
United States of America 14’217
Uruguay 6 13
3
Uzbekistan 1
Vanuatu 2’483 10
Viet Nam 8’365 50 3 29 Zambia 10’061 6
5
Zimbabwe 2’006 20
7 World* 2’726’967 81’144 5’171 6’401
Source: FiBL survey 2018, based on information from the private sector, certifiers, and governments. For detailed data sources see annex, page 330 Blank cells: No data available. *Total number includes data for countries with less than three operators.

66 FiBL & IFOAM – Organics International (2018): The World of Organic Agriculture. Frick and Bonn
Info
grap
hic
4: O
rgan
ic r
etai
l sal
es 2
016
Sour
ce: F
iBL
surv
ey 2
018

Statistics › Retail Sales and International Trade
FiBL & IFOAM – Organics International (2018): The World of Organic Agriculture. Frick and Bonn 67
Retail sales and international trade data1
Retail sales
Whereas Amarjit Sahota presents global trends for the organic market along with much background information (page 146), in this chapter, we show the country-related market data that was compiled under the framework of the FiBL survey on organic agriculture. Data on total retail sales value was available for more than 55 countries, which means that for many countries with organic farming activities such data is missing.2
The country with the largest market for organic food is the United States (38.9 billion euros), followed by Germany (9.5 billion euros), France (6.7 billion euros) and China (5.9 billion euros). The largest single market is the United States followed by the European Union (30.7 billion euros) and China (Figure 85). By region, North America has the lead (41.9 billion euros), followed by Europe (33.5 billion euros) and Asia (Table 12).
Market growth was noted in all countries for which 2016 data was available, and in many cases, it was in the double digits. In Ireland and France, were the countries that registered the biggest growth, their market increased by 22 percent each. In Denmark and Norway, the market increased by 20 percent each.
Whereas the highest per capita consumption by continent is in North America (117 euros), by country it is highest in European countries. In 2016, Switzerland had the highest per capita consumption (274 euros) worldwide, followed by Denmark (227 euros), and Sweden (197 euros) (Table 13).
Looking at the shares the organic market has of the total market, the leader is Denmark (9.7 percent), followed by Luxembourg (8.7 percent), Switzerland (8.4 percent), Austria (7.9 percent), and Sweden (7.9 percent) (Table 13).
Export data
International trade data is becoming available for more and more countries. These can be expressed as total export/import volumes in metric tons or as values. Some countries also provide breakdowns by crop and product. Table 13 shows the values of total exports where available. More than 53 countries provided data on export values.
1 Please note that due to differences in the methodology, some of the figures presented in this chapter differ from those collected in by Ecovia Intelligence (see chapter by Amarjit Sahota on page 150). 2 Some countries also provide a breakdown by product, be it in value (euros) or volume (tons), and the European OrganicDataNetwork project has made these data accessible (for Europe) on its website at www.organicdatanetwork.net.

Statistics › Retail Sales and International Trade
68 FiBL & IFOAM – Organics International (2018): The World of Organic Agriculture. Frick and Bonn
Table 12: Global market data: Retail sales and per capita consumption by region 2016
Region Retail sales [Million €] Per capita consumption [€] Africa* 16 - Asia 7’343 1.7 Europe 33’526 40.8 Latin America** 810 1.3 North America 41’939 117.0 Oceania 1’065 26.5 World 84’698 11.3
Source: FiBL-AMI survey 2018, based on data from government bodies, the private sector, and market research companies. For data sources see annex, page 330. * Data from Ethiopia and Kenya. ** Data from Belize, Brazil, Chile, Costa Rica, Jamaica, Mexico, and Peru.
Figure 11: Global market for organic food: Distribution of retail sales by country 2016
Figure 12: Global market for organic food: Distribution of retail sales by region 2016
Source: FiBL-AMI survey 2018, based on data from government bodies, the private sector, and market research companies. For data sources see annex, page 330
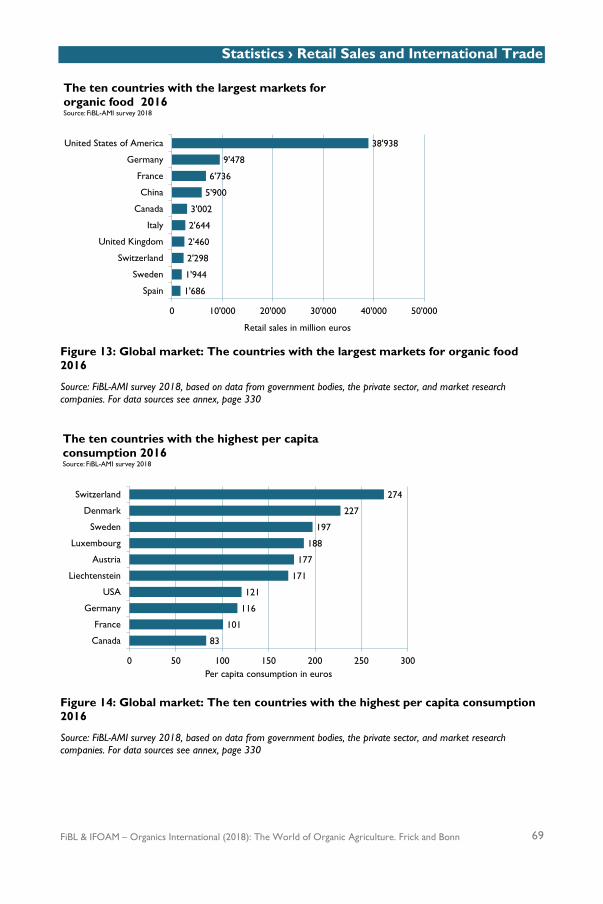
Statistics › Retail Sales and International Trade
FiBL & IFOAM – Organics International (2018): The World of Organic Agriculture. Frick and Bonn 69
Figure 13: Global market: The countries with the largest markets for organic food 2016
Source: FiBL-AMI survey 2018, based on data from government bodies, the private sector, and market research companies. For data sources see annex, page 330
Figure 14: Global market: The ten countries with the highest per capita consumption 2016
Source: FiBL-AMI survey 2018, based on data from government bodies, the private sector, and market research companies. For data sources see annex, page 330
1'686
1'944
2'298
2'460
2'644
3'002
5'900
6'736
9'478
38'938
0 10'000 20'000 30'000 40'000 50'000
Spain
Sweden
Switzerland
United Kingdom
Italy
Canada
China
France
Germany
United States of America
Retail sales in million euros
The ten countries with the largest markets for organic food 2016Source: FiBL-AMI survey 2018
83
101
116
121
171
177
188
197
227
274
0 50 100 150 200 250 300
Canada
France
Germany
USA
Liechtenstein
Austria
Luxembourg
Sweden
Denmark
Switzerland
Per capita consumption in euros
The ten countries with the highest per capita consumption 2016Source: FiBL-AMI survey 2018

Statistics › Retail Sales and International Trade
70 FiBL & IFOAM – Organics International (2018): The World of Organic Agriculture. Frick and Bonn
Table 13: Global market data: Retail sales, organic share of all retail sales, per capita consumption, and exports by country 2016
It should be noted that for market and trade data, comparing country statistics remains very problematic, due to differing methods of data collection. Comments on this table should be sent to [email protected]. Revisions will be posted at http://www.organic-world.net/statistics/statistics-data-revisions.html and included into the FiBL database.
Country Data year
Retail sales [Million €]
Organic share [%] €/person Exports
[Million €] Argentina 2009 122 Australia 2013 248 2015 941 40
Austria 2011
80
2016 1’542 7.9 177 Azerbaijan 2011 3
0.3
Belgium 2016 586 3.2 52 Belize 2015 0.1 0.2 0.3 Bhutan 2011 0.02 Bolivia 2011 179 Bosnia and Herzegovina 2015 2 2016 0.4 0.1 Brazil 2016 778 4 126 Bulgaria 2010 7 1 Cambodia 2009
1
Canada 2016 3’002 2.6 83 434 Chile 2009 2 0.1 2016
241
China 2016 5’900 4 1’049 Colombia 2007
13
Costa Rica 2008 1 0.3
2009
19 Croatia 2011
3
2014 99 2.2 24 Cyprus 2006 2
2
Czech Republic 2015 79 0.8 7 53 Denmark 2016 1’298 9.7 227 329 Dominican Republic 2016 191 Ecuador 2014 43 Ethiopia 2015 13 0.1 181 Falkland Islands (Malvinas) 2013 2
Finland 2014 10 2016 273 2.0 50
France 2016 6’736 3.5 101 629 Germany 2016 9’478 5.1 116 Greece 2010 60
5
Hungary 2009
20 2015 30
3
India 2012 130
0.1 2015
269
Ireland 2011 0.7 2016 150
32
Italy 2016 2’644 3.0 44 1’915 Jamaica 2016 1
0.3
Japan 2009 1’000
8 2010
1.0

Statistics › Retail Sales and International Trade
FiBL & IFOAM – Organics International (2018): The World of Organic Agriculture. Frick and Bonn 71
Country Data year
Retail sales [Million €]
Organic share [%] €/person Exports
[Million €] Kazakhstan 2015 9 Kenya 2016 3 0.1 24 Kosovo 2015 6 Kyrgyzstan 2016 370 Latvia 2011 4 0.2 2 Liechtenstein 2016 6
171
Lithuania 2011 6 0.2 2 Luxembourg 2016 108 8.6 188 Mexico 2013 14 0.1 373 Moldova 2011 15 Montenegro 2010 0.1 0.2 Netherlands 2016 1’171 4.4 69 1’200 New Zealand 2015 124 27 151 Norway 2016 394 1.7 76 Paraguay 2011 71 Peru 2010 14 0.5 2015
347
Poland 2015 167 4 Portugal 2011 21 0.2 2 Republic of Korea 2015 281 6 Romania 2011 80 0.7 4 200 Russian Federation 2009 4 2012 120 1 Samoa 2010 0.1 Senegal 2012 1 Serbia 2016 19 Slovakia 2010 4 0.2 1 Slovenia 2009 0.1 2013 49 1.8 27 Spain 2016 1’686 1.7 36 891 Sri Lanka 2015 259 Sweden 2016 1’944 7.9 197 84 Switzerland 2016 2’298 8.4 274 Thailand 2014 12 0.2 28 Tunisia 2015 170 Turkey 2009 4 0.1 2016
78
Uganda 2015 50 Ukraine 2016 21 0.5 59 United Kingdom 2016 2’460 1.5 38 United States 2016 38’938 5.3 121 2’981 Viet Nam 2016 18 0.2 77 Zimbabwe 2016 0.2 0.01 1
Source: FiBL-AMI survey 2018, based on data from government bodies, the private sector, and market research companies. For data sources see annex, page 330 Blank cells: No data available

Statistics › DAC Countries
72 FiBL & IFOAM – Organics International (2018): The World of Organic Agriculture. Frick and Bonn
Organic farming in developing countries and emerging markets The Development Assistance Committee (DAC) of the Organisation for Economic Co-operation and Development (OECD) is a forum to discuss issues surrounding aid, development and poverty reduction in developing countries. The recipients of Official Development Assistance (ODA) according to DAC are studied in this section.
More than 2.4 million organic producers from the countries on the DAC list1 were counted (87 percent of all organic producers). A quarter of the world’s organic agricultural land, 14.3 million hectares, is located in countries listed on the DAC list.
If wild collection and beekeeping areas are included, the total area is 38.5 million hectares. Almost half of the agricultural land of the countries on the DAC list is located in Latin American countries (almost 7 million hectares), with Asia (4.8 million) and Africa (1.8 million) in second and third place. The countries with the largest areas of organic agricultural land are Argentina, China, Uruguay, India, and Brazil, in that order. Not surprisingly, most of them are large countries (Figure 15).
However, when it comes to organic agricultural land as a percentage of the total area under cultivation, the order is different. The countries on the DAC list with the highest percentages of organic agricultural land are Samoa (22.4 percent), Sao Tome and Principe (13.8 percent), and Uruguay (11.5 percent). Argentina, with by far the largest area under organic cultivation (with 3 million hectares), is ranked fourteen when the organic agricultural area is expressed as a share of the total agricultural area.
The organic share of the total agricultural land of the top 10 countries on the DAC list is comparable to that of many European countries, and they can be attributed in part to a high production potential for, and focus on, exports. Support activities may also play a role. However, out of all the countries on the DAC list, only 26 percent of them have an organic share higher than one percent of the total agricultural area (Figure 16).
Land use details were available for more than 80 percent of the agricultural land of the countries on the DAC list; crop data is missing for some of the world’s largest producing countries (India and Brazil). Available statistics show that organic grassland/grazing areas constitutes over 30 percent of the organic agricultural land, organic arable land 26 percent, and organic permanent crops 22 percent. Exports play an important role, either for meat products (mainly from Argentina and Uruguay) or for unprocessed permanent and arable crops. The most important crops are export crops, such as cereals, coffee, oilseeds, textile crops (mainly cotton), cocoa, coconut,
1 The country list of the Development Assistance Committee DAC is available on the OECD website at http://www.oecd.org/dac/stats/daclist.htm

Statistics › DAC Countries
FiBL & IFOAM – Organics International (2018): The World of Organic Agriculture. Frick and Bonn 73
etc. For Africa, coffee and olives, for Asia, cereals and oilseeds, for Latin America, coffee and cocoa, are the most important crops.
Table 14: Countries on the DAC list: Development of organic agricultural land 2011-2016
Region 2011 [ha] 2012 [ha] 2013 [ha] 2014 [ha] 2015 [ha] 2016[ha]
Africa 1’072’877 1’148’896 1’208’254 1’259’984 1’682’061 1’800’818 Asia 3’629’475 3’150’217 3’321’988 3’482’482 3’882’363 4’832’130 Europe 479’120 546’781 476’759 509’089 508’151 546’663 Latin America 6’565’823 6’543’377 6’407’605 6’424’945 6’598’417 6’995’954 Oceania 50’691 53’370 62’511 85’159 73’802 113’164 Total DAC countries 11’797’985 11’442’641 11’477’118 11’761’659 12’744’795 14’288’730
Source: FiBL surveys 2012-2018, based on information from the private sector, certifiers, and governments. For detailed data sources see annex, page 330
Figure 15 (left): Countries on the DAC list: The ten countries with the largest areas of organic agricultural land in 2016
Figure 16 (right): Countries on the DAC list: The ten countries with the highest organic shares of the total agricultural land in 2016
Source: FiBL survey 2018, based on information from the private sector, certifiers, and governments. For detailed data sources see annex, page 330
0.27
0.30
0.32
0.52
0.67
0.75
1.49
1.66
2.28
3.01
0 2 4
Tanzania
Kazakhstan
Peru
Turkey
Mexico
Brazil
India
Uruguay
China
Argentina
Million hectares
The ten countries on the DAC list with the largest areas of organic agricultural land 2016Source: FiBL survey 2018
3.5%
4.6%
4.7%
5.3%
6.3%
7.4%
8.7%
11.5%
13.8%
22.4%
0% 10% 20% 30%
Sri Lanka
Tonga
Kiribati
Solomon Islands
Vanuatu
Timor-Leste
Dominican Republic
Uruguay
Sao Tome and Principe
Samoa
Organic share
The ten countries on the DAC list with the highest organic shares of the total agricultural land 2016Source: FiBL survey 2018

Statistics › Land Use
74 FiBL & IFOAM – Organics International (2018): The World of Organic Agriculture. Frick and Bonn
Land use and key commodities in organic agriculture
Land use
Over two-thirds of the 57.8 million hectares of organic agricultural land in 2016 were grassland/grazing areas (almost 38 million hectares). The cropland area (arable land with 10.6 million hectares and permanent crops with 4.5 million hectares) constituted 15 million hectares, and over a quarter of the organic agricultural land. The cropland area is probably much higher because details on land use are not available for some countries with large organic agricultural areas such as Brazil and India. General land use information was available for 92 percent of the organic agricultural land; however, this does not mean that detailed crop information is available for all areas as not all countries provided detailed crop data.1 The FAO classification2 of land use was utilized for this survey with slight modifications. A system similar to that of Eurostat was used for the classification of crops. The following main levels were used to classify the land use data: arable land, permanent crops, cropland for which no further details were available (cropland = arable land + permanent cropland), permanent grassland/grazing areas, other agricultural areas (such as for instance hedges), and agricultural land for which no details were available at all. For crop groups by land use type, see Table 16. Aquaculture, forest, and grazed non-agricultural land were distinguished from “agricultural land” with a separate category, as were organic wild collection areas and beekeeping areas. The land use information can be summarized by geographical region, as follows: − Africa: Land use information was available for about 90 percent of the organic
agricultural land in Africa. Almost two-thirds of the agricultural land is used for permanent crops. The main permanent crops are cash crops, such as coffee and olives; among the main arable crops are cotton and oilseeds (sesame and peanuts). For land use details in Africa, see page 177.
− Asia: Land use details are known for over two-thirds of the organic agricultural land in Asia. Arable land is mainly used for cereals, including rice. Furthermore, oilseeds are important. For land use details in Asia, see page 200.
1 For some countries, only information on the main uses (arable crops, permanent crops, and permanent grassland) was available. For other countries, very detailed statistical land use information can be found. 2 For more details, see the FAOSTAT homepage, faostat.fao.org: Home > Concepts and Definitions > Glossary, or http://faostat.fao.org/site/379/DesktopDefault.aspx?PageID=379

Statistics › Land Use
FiBL & IFOAM – Organics International (2018): The World of Organic Agriculture. Frick and Bonn 75
− Europe: In Europe, the agricultural land use is well known, and the main crop categories are well documented. Permanent pastures and arable land have approximately equal shares of the organic agricultural area. Arable land is mainly used for the cultivation of cereals, and by green fodder (almost 2.3 million hectares each). Permanent crops account for eleven percent of the organic agricultural land. More than one-third of this land was used for olives, followed by grapes, nuts, and temperate fruits. For land use details, see page 218.
− Latin America and the Caribbean: Nearly 60 percent of the organic agricultural land in Latin America is permanent pasture. Permanent crops account for 14 percent of the total organic agricultural area. More than 40 percent of the permanent cropland is used for coffee, followed by cocoa and tropical fruits. For details on land use in Latin America and the Caribbean, 275.
− North America: As in Europe, arable land and permanent grassland/grazing areas have almost equal shares. A major proportion of the arable land is used for cereal production and cultivation of green fodder. For details on land use in North America, see page 296.
− Oceania: Most of the land in Australia is used for extensive grassland/grazing, and a minimal amount of information is available on the remaining land. A wide range of permanent crops are grown in the Pacific region. For details, see page 314.
Figure 17: World: Distribution of main land use types by region 2016
Source: FiBL survey 2018, based on information from the private sector, certifiers, and governments. For detailed data sources see annex, page 330

Statistics › Land Use
76 FiBL & IFOAM – Organics International (2018): The World of Organic Agriculture. Frick and Bonn
Figure 18: World: Distribution of main land use types and key crop categories 2016
Source: FiBL survey 2018, based on information from the private sector, certifiers, and governments. For detailed data sources see annex, page 330
Figure 19: World: Development of organic arable land, permanent cropland and permanent grassland/grazing areas 2004-2016
Source: FiBL survey 2018, based on information from the private sector, certifiers, and governments. For detailed data sources see annex, page 330

Statistics › Land Use
FiBL & IFOAM – Organics International (2018): The World of Organic Agriculture. Frick and Bonn 77
Table 15: World: Land use in organic agriculture by region (including in-conversion areas) 2016
Land use Africa [ha]
Asia [ha]
Europe [ha]
Latin America
[ha]
North America
[ha]
Oceania [ha]
Total [ha]
Arable crops 525’649 2’398’867 6’036’893 474’776 1’174’489 1’676 10’612’350
Permanent crops 1’046’832 775’494 1’508’016 993’050 103’781 117’099 4’544’273
Permanent grassland 38’168 32’144 5’648’692 4’424’021 1’438’474 26’376’507 37’958’006
Total* 1’801’699 4’897’837 13’509’146 7’135’155 3’130’332 27’346’986 57’816’759
Source: FiBL survey 2018, based on information from the private sector, certifiers, and governments. For detailed data sources see annex, page 330 *Totals include other agricultural areas, land for which no details were available, and correction values for some countries for land with double cropping during one year.
Table 16: World: Land use and crop categories in organic agriculture worldwide 2016
Land use Crop group Area [ha] Agricultural land and crops, no details 4’261’042 Arable land crops Arable crops, no details 97’008 Cereals 4’091’183 Dry pulses 529’138 Flowers and ornamental plants 13’967 Green fodders from arable land 2’760’550 Industrial crops 16’205 Medicinal and aromatic plants 182’579 Mushrooms and truffles 22’962 Oilseeds 1’286’588 Root crops 90’287 Strawberries 9’196 Sugarcane 82’983 Textile crops 495’773 Tobacco 5’975 Vegetables 437’443 Arable land crops total 10’612’350 Permanent crops Berries 56’443 Citrus fruit 90’694 Cocoa 344’666 Coconut 349’355 Coffee 933’950 Flowers and ornamental plants 71 Fruit, no details 344 Fruit, temperate 254’600 Fruit, tropical and subtropical 356’119 Grapes 379’555 Medicinal and aromatic plants, permanent 101’005 Nurseries 26’694 Nuts 574’069 Olives 747’640 Tea/mate, etc. 107’910 Permanent crops total 4’544’273 Permanent grassland 37’958’006 World 57’816’759
Source: FiBL survey 2018, based on information from the private sector, certifiers, and governments. For detailed data sources see annex, page 330. Total and subtotals include data for fallow land, some minor or not specified crop groups.

Statistics › Land Use › Arable Land
78 FiBL & IFOAM – Organics International (2018): The World of Organic Agriculture. Frick and Bonn
Arable land
With a total of almost 10.6 million hectares, organic arable land constitutes almost 20 percent of the world’s organic agricultural land and 0.7 of the world’s arable cropland.1
An increase of 6.3 percent over 2015 was reported, and there was an increase in almost all crop categories with the exception of sugarcane, which decreased by 10 percent (Table 17).
Almost 60 percent of the arable land is located in Europe, followed by Asia (23 percent), and North America (11 percent) (Figure 20). Most of the arable cropland is used for cereals including rice (4.1 million hectares), green fodder (2.8 million hectares), and oilseeds (1.3 million hectares) (Figure 21 and Table 17).
Table 17: Use of organic arable land (including in-conversion areas), 2015 and 2016 compared
Crop group 2015 [ha] 2016 [ha] Change 2015-2016[ha]
Organic share [%]*
Cereals 3’889’488 4’091’183 +201’695 0.6% Dry pulses 442’084 529’138 +87’054 0.6% Flowers and ornamental plants 6’547 13’967 +7’420 - Green fodders from arable land 2’506’919 2’760’550 +253’631 - Hops 327 617 +290 0.7% Industrial crops 9’877 16’205 +6’328 - Medicinal and aromatic plants 110’436 182’579 +72’143 10.1% Mushrooms and truffles 1’250 22’962 +21’712 - Oilseeds 1’235’880 1’286’588 +50’708 0.6% Root crops 49’079 90’287 +41’207 0.1% Strawberries 5’985 9’196 +3’211 2.3% Sugarcane 91’734 82’983 -8’751 0.3% Textile crops 449’390 495’773 +46’383 1.5% Tobacco 1’167 5’975 +4’808 0.2% Vegetables 319’995 437’443 +117’447 0.7% Total** 9’985’785 10’612’350 +626’565 0.7%
Source: FiBL survey 2018, based on information from the private sector, certifiers, and governments. For detailed data sources see annex, page 330 Not all countries included in the FiBL survey provided data on land use or crop areas. *The organic crop group share is calculated with 2016 FAO data, while the organic share of total arable crops is calculated with 2015 FAO data. **Total includes arable crop groups for which no further details were available.
1 There were 1’425’918’770 hectares of arable cropland in 2015, according to FAOSTAT, FAO, Rome. See the FAO Homepage at www.fao.org/faostat/en/#data > Inputs > Land > www.fao.org/faostat/en/#data/RL
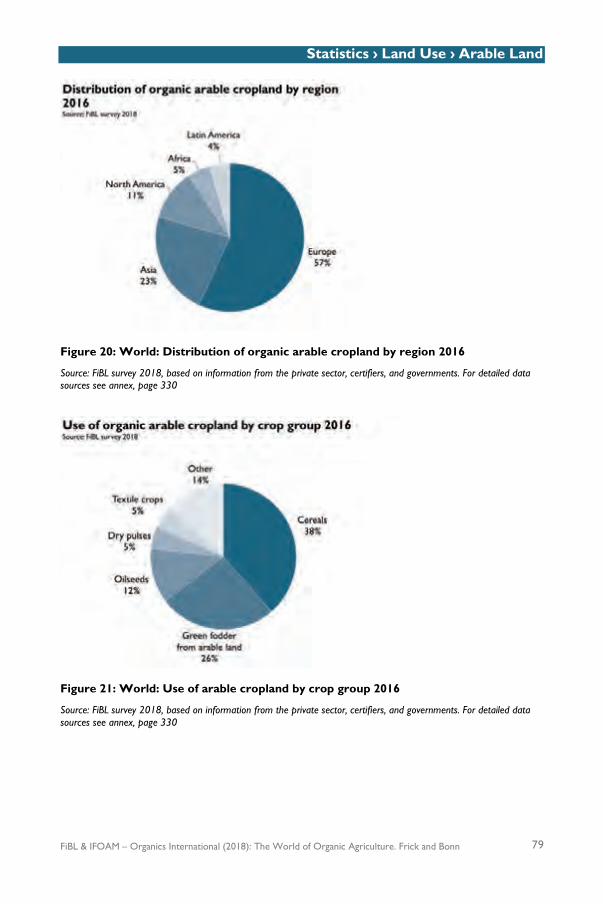
Statistics › Land Use › Arable Land
FiBL & IFOAM – Organics International (2018): The World of Organic Agriculture. Frick and Bonn 79
Figure 20: World: Distribution of organic arable cropland by region 2016
Source: FiBL survey 2018, based on information from the private sector, certifiers, and governments. For detailed data sources see annex, page 330
Figure 21: World: Use of arable cropland by crop group 2016
Source: FiBL survey 2018, based on information from the private sector, certifiers, and governments. For detailed data sources see annex, page 330
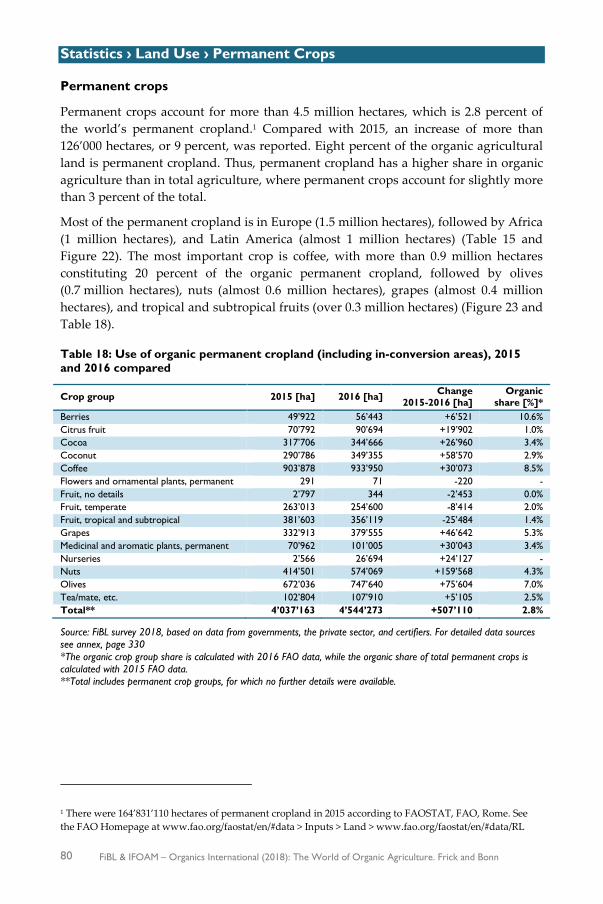
Statistics › Land Use › Permanent Crops
80 FiBL & IFOAM – Organics International (2018): The World of Organic Agriculture. Frick and Bonn
Permanent crops
Permanent crops account for more than 4.5 million hectares, which is 2.8 percent of the world’s permanent cropland.1 Compared with 2015, an increase of more than 126’000 hectares, or 9 percent, was reported. Eight percent of the organic agricultural land is permanent cropland. Thus, permanent cropland has a higher share in organic agriculture than in total agriculture, where permanent crops account for slightly more than 3 percent of the total.
Most of the permanent cropland is in Europe (1.5 million hectares), followed by Africa (1 million hectares), and Latin America (almost 1 million hectares) (Table 15 and Figure 22). The most important crop is coffee, with more than 0.9 million hectares constituting 20 percent of the organic permanent cropland, followed by olives (0.7 million hectares), nuts (almost 0.6 million hectares), grapes (almost 0.4 million hectares), and tropical and subtropical fruits (over 0.3 million hectares) (Figure 23 and Table 18).
Table 18: Use of organic permanent cropland (including in-conversion areas), 2015 and 2016 compared
Crop group 2015 [ha] 2016 [ha] Change 2015-2016 [ha]
Organic share [%]*
Berries 49’922 56’443 +6’521 10.6% Citrus fruit 70’792 90’694 +19’902 1.0% Cocoa 317’706 344’666 +26’960 3.4% Coconut 290’786 349’355 +58’570 2.9% Coffee 903’878 933’950 +30’073 8.5% Flowers and ornamental plants, permanent 291 71 -220 - Fruit, no details 2’797 344 -2’453 0.0% Fruit, temperate 263’013 254’600 -8’414 2.0% Fruit, tropical and subtropical 381’603 356’119 -25’484 1.4% Grapes 332’913 379’555 +46’642 5.3% Medicinal and aromatic plants, permanent 70’962 101’005 +30’043 3.4% Nurseries 2’566 26’694 +24’127 - Nuts 414’501 574’069 +159’568 4.3% Olives 672’036 747’640 +75’604 7.0% Tea/mate, etc. 102’804 107’910 +5’105 2.5% Total** 4’037’163 4’544’273 +507’110 2.8%
Source: FiBL survey 2018, based on data from governments, the private sector, and certifiers. For detailed data sources see annex, page 330 *The organic crop group share is calculated with 2016 FAO data, while the organic share of total permanent crops is calculated with 2015 FAO data. **Total includes permanent crop groups, for which no further details were available.
1 There were 164’831’110 hectares of permanent cropland in 2015 according to FAOSTAT, FAO, Rome. See the FAO Homepage at www.fao.org/faostat/en/#data > Inputs > Land > www.fao.org/faostat/en/#data/RL

Statistics › Land Use › Permanent Crops
FiBL & IFOAM – Organics International (2018): The World of Organic Agriculture. Frick and Bonn 81
Figure 22: World: Distribution of permanent cropland by region 2016
Source: FiBL survey 2018, based on information from the private sector, certifiers, and governments. For detailed data sources see annex, page 330
Figure 23: World: Use of permanent cropland by crop group 2016
Source: FiBL survey 2018, based on information from the private sector, certifiers, and governments. For detailed data sources see annex, page 330

Statistics › Land Use › Wild Collection
82 FiBL & IFOAM – Organics International (2018): The World of Organic Agriculture. Frick and Bonn
Wild collection and beekeeping areas
The collection of wild harvested crops is defined in the IFOAM Norms (IFOAM 2014), and wild collection activities are regulated by organic laws. A collection area (including beekeeping) of 39.3 million hectares was reported in 2016. The organic wild collection areas are concentrated in Europe, Africa, Asia, and Latin America (Figure 24 and Table 19); the distribution is thus quite different from that of the organic agricultural land.
The countries with the largest areas are Finland (mainly berries), followed by Zambia (beekeeping), and India (Figure 25). Wild berries, apiculture, and medicinal and aromatic plants, as well as shea nuts in Africa and Brazil nuts in Latin America, play the most important roles (Table 20). Unfortunately, for most of the wild collection areas, no details are available.
Table 19: Wild collection and beekeeping areas by region 2015 and 2016 compared
Region 2015 [ha] 2016 [ha] Change 2015-2016 [ha]
Change 2015-2016 [%]
Africa 11’905’711 12’119’609 +213’898 +1.8% Asia 5’522’891 6’259’421 +736’530 +13.3% Europe 17’624’174 16’665’097 -959’077 -5.4% Latin America 4’221’072 4’194’720 -26’351 -0.6% North America 54’551 79’855 +25’304 +46.4% Oceania 765 765 - - Total 39’329’163 39’319’467 -9’696 -0.02%
Source: FiBL survey 2018, based on data from governments, the private sector, and certifiers. For detailed data sources see annex, page 330
Table 20: Wild collection and beekeeping areas by crop group 2016 Land use Area [ha] Apiculture 6’488’207 Berries, wild 37’143 Fruit, wild 1’293’452 Medicinal and aromatic plants, wild 3’634’192 Mushrooms, wild 213’874 Nuts, wild 1’260’416 Oil plants, wild 885’598 Palm sugar 1’087 Palmito, wild 147’867 Rose hips, wild 179’509 Seaweed 200’852 World 39’319’467
Source: FiBL survey 2018, based on information from the private sector, certifiers, and governments. Total includes areas, for which no details were available. For detailed data sources see annex, page 330

Statistics › Land Use › Wild Collection
FiBL & IFOAM – Organics International (2018): The World of Organic Agriculture. Frick and Bonn 83
Figure 24: World: Distribution of organic wild collection and beekeeping areas by region in 2016
Source: FiBL survey 2018, based on data from government bodies, the private sector, and certifiers. For detailed data sources see annex, page 330
Figure 25: World: The ten countries with the largest organic wild collection and beekeeping areas in 2016
Source: FiBL survey 2018, based on data from government bodies, the private sector, and certifiers. For detailed data sources see annex, page 330
0.9
1.1
1.1
1.2
1.3
1.8
2.0
4.2
6.7
11.6
0 5 10 15
Bolivia (2014)
Tajikistan (2012)
South Africa
Brazil (2012)
Mexico
Romania (2014)
Namibia
India
Zambia
Finland
Million hectares
The ten countries with the largest wild collection and beekeeping areas 2016Source: FiBL survey 2018

Statistics › Land Use › Wild Collection
84 FiBL & IFOAM – Organics International (2018): The World of Organic Agriculture. Frick and Bonn
Table 21: Wild collection and beekeeping areas by country 2016
Country Land use Area [ha]
Albania Medicinal and aromatic plants, wild 467’783
Algeria No details 628 Argentina Apiculture 318’369 No details 1’001 Armenia No details 6’000 Azerbaijan Berries, wild 161 Fruit, wild 541
Medicinal and aromatic plants, wild 56
Nuts, wild 179 No details 126 Belarus Berries, wild 100 Mushrooms, wild 2’642 Belgium No details 3 Benin Nuts, wild 500 No details 4’005
Bhutan Medicinal and aromatic plants, wild 15’787
Bolivia Nuts, wild 922’991 Bosnia and Herzegovina No details 69’310
Brazil No details 1’213’351 Bulgaria No details 307’020 Burkina Faso Nuts, wild 65’581 No details 14’487 Canada Mushrooms, wild 11’266 No details 68’250 Chad No details 124’130 Chile Berries, wild 36’243 Rose hips, wild 70’799 No details 9’095 China Fruit, wild 48’446
Medicinal and aromatic plants, wild 41’920
Mushrooms, wild 197’104 Nuts, wild 4’000 Nuts, wild, other 21’239 Oil plants, wild 118’798 Seaweed 320 No details 379’853 Colombia Palmito, wild 6’800 No details 520 Comoros Oil plants, wild 63 Côte d’Ivoire Nuts, wild 344
Croatia No details 7 Denmark No details 2’648 Ecuador Mushrooms, wild 1’260 Egypt No details 60’000 Estonia No details 40’579 Ethiopia Apiculture 116 No details 8’917
Country Land use Area [ha]
Fiji Fruit, wild 653 Finland No details 11’628’576 Georgia No details 215 Ghana Nuts, wild 31’631 No details 1’961 Greece No details 317’053 Guatemala Apiculture 5 Guyana Palmito, wild 58’000
Iceland Medicinal and aromatic plants, wild 12’216
Seaweed 200’032 No details 221 India No details 4’220’000 Indonesia Apiculture 9’007 Oil plants, wild 137 Palm sugar 1’087 No details 469 Iran Apiculture 5’482 No details 25’020 Italy No details 176’628 Jamaica No details 36
Kazakhstan Medicinal and aromatic plants, wild 863
Kenya Apiculture 121’625 Kosovo No details 179’580 Kyrgyzstan Rose hips, wild 10 Lao, P.D.R. No details 17’068 Lebanon No details 393 Lesotho No details 50’000 Macedonia, FYROM No details 556’600
Madagascar No details 10’897 Malawi No details 6’319 Mali Nuts, wild 1’446 No details 6’700 Mexico Apiculture 90’000 Fruit, wild 1’200’000 Mushrooms, wild 1’602 Seaweed 500 Wild collection, other 204 Montenegro No details 143’410 Morocco Fruit, wild 40’700
Medicinal and aromatic plants, wild 56’670
Oil plants, wild 66’600 No details 6’065
Mozambique Medicinal and aromatic plants, wild 10’000
No details 137’930
Namibia Medicinal and aromatic plants, wild 2’041’901
Nepal No details 24’422 Nicaragua Apiculture 11’463

Statistics › Land Use › Wild Collection
FiBL & IFOAM – Organics International (2018): The World of Organic Agriculture. Frick and Bonn 85
Country Land use Area [ha]
Nigeria Apiculture 1’000 Niue Fruit, wild 112 Pakistan Nuts, wild 44’620 Paraguay Palmito, wild 3’067 Peru Nuts, wild 167’843 Palmito, wild 80’000 No details 1’570 Portugal No details 40’000 Romania No details 1’787’548 Russian Federation No details 30’921
Rwanda No details 12 Senegal No details 22’000 Serbia No details 1’550 Slovenia No details 13’238 Somalia No details 849’482 South Africa Apiculture 1’000
Medicinal and aromatic plants, wild 966’971
Rose hips, wild 108’700 No details 15’891 Sudan No details 84’960 Syrian Arab Republic No details 8’000
Tajikistan No details 1’055’890
Country Land use Area [ha]
Tanzania No details 15’040 Togo No details 242 Tunisia No details 25’486 Turkey Berries, wild 300 Fruit, wild 2’550
Medicinal and aromatic plants, wild 25
Nuts, wild 41 No details 134’517 Uganda No details 158’328 Ukraine No details 550’000 United States Berries, wild 338
Uzbekistan No details 5’000 Viet Nam No details 7’208 Zambia Apiculture 5’930’000 Oil plants, wild 700’000 No details 70’680 Zimbabwe Apiculture 140 Fruit, wild 450
Medicinal and aromatic plants, wild 20’000
No details 280’010 World 39’319’467
Source: FiBL survey 2018, based on information from the private sector, certifiers, and governments. For detailed data sources see annex, page 330

Statistics › Beehives
86 FiBL & IFOAM – Organics International (2018): The World of Organic Agriculture. Frick and Bonn
Beehives There were over 2.1 million organic beehives in 2016, representing almost 2.4 percent of the world’s beehives.1 Organic beehives are concentrated in Latin America (46 percent) and Europe (42 percent) (Figure 26). The country with the largest number of organic beehives is Brazil (537’014), followed by Mexico (368’000), and Bulgaria (236’462). Their numbers have increased four-fold since 2007, when over 535’000 beehives were reported (Figure 27). However, it is important to note that some of the increases can be attributed to the continually improving data availability. The increase from 2014 to 2015 is due to the fact that data for some countries such as Brazil was available for the first time.
It is expected that organic beekeeping will continue to grow worldwide thanks to the increasing demand for organic honey and bee products. One of the main challenges for new organic beekeepers is the conversion process due to the lack of access to knowledge on organic beekeeping practices and the organic certification process. Furthermore, the production of good quality organic honey and the control of the Varroa parasite with organic methods are major obstacles for organic beekeepers.
In 2015, FiBL, Naturland, Demeter, and Apicon created a new beekeeping platform, the IFOAM Apiculture Forum (IAF). The IFOAM Apiculture Forum is a self-organised structure of IFOAM - Organics International with the aim to advance the development of organic beekeeping and to encourage the traditional practices employed by sustainable beekeeping.2 IAF will organize the World Organic Beekeeping Conference in Germany.
Figure 26: World: Distribution of organic beehives by region in 2016
Source: FiBL survey 2018, based on data from government bodies, the private sector, and certifiers. For detailed data sources see annex, page 330
1 According to FAO, there were 90’564’654 beehives in 2016. The FAOSTAT website > Production > Live animals at http://www.fao.org/faostat/en/#data/QA 2 For more information about the IFOAM Apiculture Forum, please visit http://www.organicbeekeeping.info

Statistics › Beehives
FiBL & IFOAM – Organics International (2018): The World of Organic Agriculture. Frick and Bonn 87
Figure 27: World: Development of the organic beehives 2007-2016
Source: FiBL-IFOAM-SOEL surveys 2006-2018. For detailed data sources see annex, page 330
Table 22: Number of organic beehives by country 2016
Country Beehives [no.] Argentina 13’362 Armenia 881 Australia 6’475 Austria 19’146 Azerbaijan 932 Belgium 21 Bhutan 177 Bosnia and Herzegovina 291 Brazil 537’014 Bulgaria 236’462 Burkina Faso 11 Canada 10’199 Chile 25’882 China 22’000 Croatia 2’065 Cuba 2’342 Czech Republic 80 Denmark 59 Dominican Republic 10’709 Estonia 2’189 Ethiopia 122’726 Finland 4’456 France 102’767 French Guiana (France) 21 Georgia 570 Germany 35’000 Guadeloupe (France) 36 Iran (Islamic Republic of) 4’120 Iraq 2’000 Italy 195’341 Kosovo 40 Latvia 27’482 Lebanon 446 Lithuania 790
Country Beehives [no.] Luxembourg 44 Macedonia, FYROM 6’104 Madagascar 942 Martinique (France) 120 Mexico 368’000 Montenegro 1’851 Morocco 1’242 Nicaragua 18’620 Norway 1’507 Poland 1’948 Portugal 55’167 Réunion (France) 550 Romania 86’195 Saudi Arabia 2’363 Senegal 32 Serbia 1’735 Slovakia 456 Slovenia 1’814 South Africa 257 Spain 69’126 Sweden 2’182 Switzerland 3’014 Thailand 25’955 Tunisia 1’216 Turkey 40’371 Ukraine 300 Uruguay 2’550 Zambia 51’978 Zimbabwe 700 World 2’132’432
Source: FiBL survey 2018, based on information from the private sector, certifiers, and governments. For detailed data sources see annex, page 330
535'
117
527'
763
889'
913
897'
836
939'
310
1'06
4'05
7
1'12
9'37
1
1'06
8'92
5
2'05
7'39
3
2'13
2'43
2
0
500'000
1'000'000
1'500'000
2'000'000
2'500'000
2007 2008 2009 2010 2011 2012 2013 2014 2015 2016
Beeh
ives
Development of the organic beehives 2007-2016Source: FiBL-IFOAM-SOEL-Surveys 2006-2018

Statistics › Aquaculture
88 FiBL & IFOAM – Organics International (2018): The World of Organic Agriculture. Frick and Bonn
Aquaculture
Naturland, a German organic certifier, first certified carp in Germany in 1995, and organic was the first Voluntary Sustainability Standard (VSS) to cover aquaculture production (Potts et al. 2016). In 2005, IFOAM – Organics International approved the final version of its aquaculture standard.
A production volume of over 400’000 metric tons of organic aquaculture was reported in 2016. According to the available data, aquaculture production is concentrated in Asia (77 percent, mainly China) and Europe (22 percent). The largest production volume was found in China (over 300’000 metric tons), followed by Ireland (almost 41’000 metric tons, mainly blue mussel, salmon and oysters), and Norway (17’200 metric tons, mainly salmon) (Table 24 and Figure 28). The aquaculture production volume has increased by 8 percent compared to 2015.
Unfortunately, some of the countries with a large aquaculture production, such as Brazil, Indonesia, Thailand, and Viet Nam, did not provide data on organic aquaculture; so, it can be assumed that the organic aquaculture production volume is higher.
A breakdown by species was only available for less than 20 percent of the total production. According to the available data, organic salmon is the most produced species (almost 40’000 metric tons), followed by mussels (19’000 metric tons), carp (almost 6’000 metric tons), and shrimps (over 3’000 metric tons).
Table 23: Organic aquaculture: Production volume by species 2016
Main species Production [MT] Aquaculture, no details 334’270 Aquatic plants 9’195 Carps 5’645 Mussels 19’232 Rainbow trout 1’357 Salmon 39’735 Sea bass 55 Sea trout 150 Seabream 317 Shrimps 3’463 Sturgeon 1’751 Trout 385 Total 415’554
Source: FiBL survey 2018, based on information from the private sector, certifiers, and governments. For detailed data sources see annex, page 330
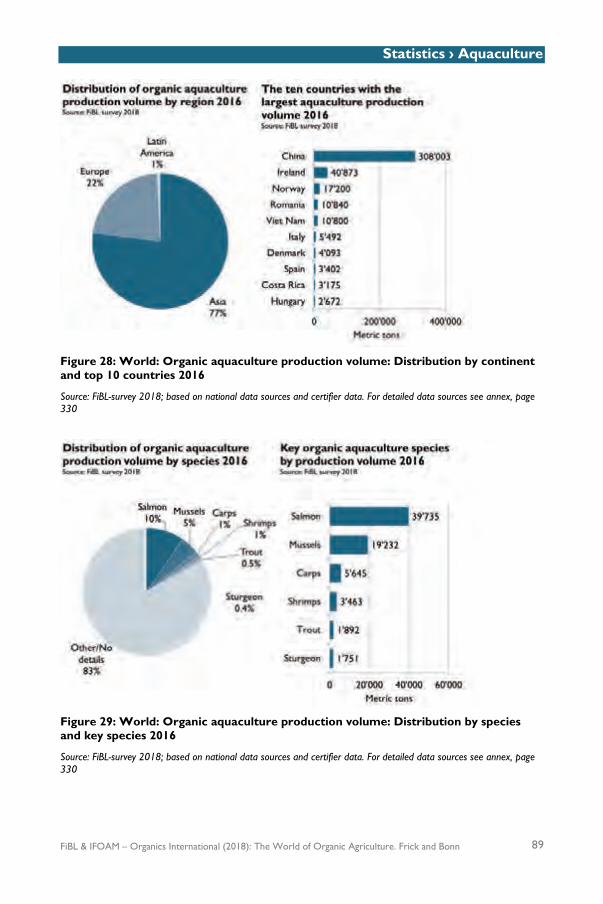
Statistics › Aquaculture
FiBL & IFOAM – Organics International (2018): The World of Organic Agriculture. Frick and Bonn 89
Figure 28: World: Organic aquaculture production volume: Distribution by continent and top 10 countries 2016
Source: FiBL-survey 2018; based on national data sources and certifier data. For detailed data sources see annex, page 330
Figure 29: World: Organic aquaculture production volume: Distribution by species and key species 2016
Source: FiBL-survey 2018; based on national data sources and certifier data. For detailed data sources see annex, page 330

Statistics › Aquaculture
90 FiBL & IFOAM – Organics International (2018): The World of Organic Agriculture. Frick and Bonn
Table 24: Organic aquaculture: Production volume by country 2016
Country Production [MT] Austria 9 Brunei Darussalam 79 Bulgaria 1’400 China 308’003 Costa Rica 3’175 Croatia 100 Czech Republic 1 Denmark 4’093 Ecuador 3 Estonia 156 Germany 1’758 Greece 1’130 Hungary 2’672 Ireland 40’873 Italy 5’492 Latvia 9 Lithuania 734 Norway 17’200 Poland 19 Portugal 1’100 Romania 10’840 Slovenia 65 Spain 3’402 Switzerland 370 Thailand 1’512 Turkey 559 Viet Nam 10’800 Total 415’554
Source: FiBL survey 2018, based on information from the private sector, certifiers, and governments. For detailed data sources see annex, page 330
References and further reading Bergleiter, S., Berner, N., Censkowsky, U. & Julià-Camprodon, G. (2009): Organic aquaculture 2009 –
production and markets. Munich, Organic Services GmbH and Gräfelfing, Naturland e.V. 120 pp. Food and Agriculture Organization of the United Nations (FAO) (2010): Organic aquaculture: The future of
expanding niche markets. Available at http://www.fao.org/docrep/015/i2734e/i2734e04c.pdf Potts, Jason; Wilkings, Ann; Lynch, Matthew; and McFatridge, Scott (Eds.) (2016): State of Sustainability
Initiatives Review: Standards and The Blue Economy. International Institute for Sustainable Development, Manitoba, Canada. Available at http://www.iisd.org/ssi/standards-and-the-blue-economy/

Statistics › Selected Crops
FiBL & IFOAM – Organics International (2018): The World of Organic Agriculture. Frick and Bonn 91
Statistics on selected crops
In this section, some of the data on key crops and crop groups is presented, including area under organic management compared with the total area of the crops. FiBL collected land use and crop data for the first time in 2004; hence, the development graphs show the growth since that year.
It should be noted that the organic areas are mainly compared with the area harvested in 2016 as provided by FAO. The data may not necessarily be directly comparable to the areas sown or planted as registered by the certification bodies.
In some cases, the area data may refer to mixed cropping areas or to agroforestry areas in the case of tropical fruit, where the provided crop surfaces are the total surface of the agroforestry system, including shade trees and other crops. This should be kept in mind when comparing the organic crop area to the overall area for a certain crop, particularly in the case of tropical crops.
Data on conversion status: For some countries, data were collated from several certifiers, some of which provided information on the conversion status while others did not. Therefore, the sum of land under conversion and the fully converted land is not necessarily the same as the total land under organic agricultural management.
The tables presented in this section are only part of the information available in the FiBL database, which is available at statistics.fibl.org.
Furthermore, at www.organic-world.net additional slides on key crops with more graphs than shown here are available.
Table 25: World: Selected key crop groups and crops in organic agriculture 2016 (overview): Land under organic management (including conversion areas)
Crop Africa [ha]
Asia [ha]
Europe [ha]
Latin America
[ha]
North America
[ha]
Oceania [ha]
Total [ha]
Cereals 66’765 1’039’718 2’279’155 163’573 541’971
4’091’183 Citrus fruit 7’532 14’853 48’967 14’425 4’919
90’694
Cocoa 111’328 2’765
229’917
657 344’666 Coffee 381’090 113’901
423’604 87 15’268 933’950
Dry pulses 1’955 18’545 418’520 17’879 72’239
529’138 Fruit, temperate 5’270 99’776 127’749 8’227 12’578 1’000 254’600 Fruit, tropical and subtropical 58’448 70’308 30’433 189’527 3’520 3’883 356’119
Grapes 2’915 22’596 328’492 11’458 12’072 2’022 379’555 Oilseeds 195’532 582’069 339’630 67’282 102’075
1’286’588
Olives 140’022 7’233 574’826 24’839 719
747’640 Vegetables 37’622 71’442 148’088 102’599 77’691
437’443
Source: FiBL survey 2018, based on information from the private sector, certifiers, and governments. For detailed data sources see annex, page 330

Statistics › Crops › Cereals
92 FiBL & IFOAM – Organics International (2018): The World of Organic Agriculture. Frick and Bonn
› Cereals
Table 26 shows that at least 4.1 million hectares of cereals were under organic management in 2016. Comparing the organic figure with FAO’s figure for the world’s harvested cereal area of 718 million hectares in 2016 (FAOSTAT),1 0.6 percent of the total cereal area is under organic management.
Cereals include wheat, spelt, barley, oats, grain maize, rice, rye, and triticale (Figure 31).
The key cereal producers worldwide, according to FAO, are India (98.5 million hectares), China (96.3 million hectares), the United States (58.5 million hectares), and the Russian Federation (44.4 million hectares).
Of these four countries, information on the organic cereal area was available for all except India, and for the Russian Federation data is not complete. China (over 811’000 hectares), Italy (almost 300’000 hectares), and the United States (over 281’000 hectares) are the largest organic cereal producers. In China, 0.8 percent of the total cereal area was organic, and in Italy, the organic cereal area represented 9.2 percent of the total cereal area, one of the highest organic shares.
Some countries reach organic shares that are far higher than the global organic cereal share of 0.6 percent. For example, Austria (13 percent), Sweden (10.5 percent), Estonia (9.8 percent), Italy (9.2 percent), and Lithuania (7.6 percent) greatly exceed the global share.
As some of the world’s large cereal producers (such as India and the Russian Federation) provided little or no land use and crop details, it can be assumed that the cereal area is larger than what is shown here.
The organic cereal area has more than trebled since 2004 (1.3 million hectares), and in 2016, it increased by 200’000 hectares or 5 percent.
The available data on the conversion status indicates that 20 percent of the organic cereal area was in conversion in 2016 (over 800’000 hectares). Thus, there could be a considerable increase in the supply of organic cereals in the near future.
1 FAOSTAT, the FAO Homepage, FAO, Rome at fao.org/faostat > Data > Crops > http://www.fao.org/faostat/en/#data/QC

Statistics › Crops › Cereals
FiBL & IFOAM – Organics International (2018): The World of Organic Agriculture. Frick and Bonn 93
Figure 30: Cereals: Development of the global organic area 2004-2016
Source: FiBL-IFOAM-SOEL 2006-2018
Figure 31: Cereals: Distribution of global organic area by cereal type 2016
Source: FiBL survey 2018
1'32
5'38
6
1'58
2'39
5
1'77
0'73
6
1'87
6'61
7
2'21
2'33
8
2'43
0'30
0
2'45
5'52
8
2'62
8'19
1
2'78
8'39
6
3'43
5'68
2
3'28
8'99
1
3'88
9'48
8
4'09
1'18
3
0
500'000
1'000'000
1'500'000
2'000'000
2'500'000
3'000'000
3'500'000
4'000'000
4'500'000
2004 2005 2006 2007 2008 2009 2010 2011 2012 2013 2014 2015 2016
Hec
tare
s
Cereals: Development of the global organic area 2004-2016Source: FiBL-IFOAM-SOEL-Surveys 2006-2018

Statistics › Crops › Cereals
94 FiBL & IFOAM – Organics International (2018): The World of Organic Agriculture. Frick and Bonn
Table 26: Cereals: Organic area by country 2016
Country Organic area [ha]
Organic share [%]
Area fully converted [ha]
Area under conversion [ha]
Argentina 25’880 0.2% 25’880
Austria 102’336 13.0%
Azerbaijan 1’598 0.2%
1’598 Bangladesh 101 0.001%
Belgium 10’314 3.1% 6’448 3’866 Bhutan 493 1.0% 493
Bolivia 87’545 6.9% 72’981 14’564 Bosnia and Herzegovina 20 0.01% 20
Bulgaria 31’235 1.7% 8’921 22’312 Burkina Faso 57 0.001% 57
Cambodia 9’361 0.3% 5’175 4’187 Canada 260’756 1.8% 244’421
Chile 180 0.03% 180
China 811’839 0.8% 584’317 227’522 Colombia 100 0.01% 98 2 Costa Rica 55 0.1%
Croatia 12’619 2.4% 5’529 7’088 Cyprus 957 3.9% 407 550 Czech Republic 27’633 2.0% 22’455 5’178 Denmark 58’318 4.0% 48’909 9’410 Ecuador 3’261 0.4% 2’899 362 Egypt 8’170 0.2%
El Salvador 0 0.0001%
0
Estonia 34’318 9.8% 29’022 5’296 Finland 54’193 5.4% 46’438 7’755 France 217’375 2.3% 130’075 87’300 Germany 242’000 3.8%
Greece 50’131 4.7% 44’343 5’788 Hungary 33’109 1.2% 20’154 12’954 Iceland 45 - 45
Indonesia 1’401 0.01% 1’392 9 Iran 176 0.002% 165 11 Ireland 1’491 0.5% 1’256 235 Israel 556 0.9% 527 29 Italy 299’640 9.2% 195’463 104’177 Japan 2’825 0.2% 2’825
Kazakhstan 130’882 0.9% 101’210 25’000 Kenya 486 0.02%
Kyrgyzstan 904 0.2% 588 315 Lao, P.D.R. 4’598 0.4%
Latvia 47’820 6.8% 31’353 16’466 Lebanon 5 0.01% 5
Liechtenstein 81 - 62 19 Lithuania 99’807 7.6% 63’560 36’247 Luxembourg 929 3.3% 806 122 Macedonia, FYROM 1’014 0.6% 624 391 Madagascar 257 0.02% 257
Malawi 20 0.001% 17 3 Mali 43 0.001% 43
Malta 1 0.03% 1
Mexico 40’105 0.4% 40’055 50 Moldova 20’097 2.2% 15’445 4’652 Montenegro 131 6.1% 71 60

Statistics › Crops › Cereals
FiBL & IFOAM – Organics International (2018): The World of Organic Agriculture. Frick and Bonn 95
Country Organic area [ha]
Organic share [%]
Area fully converted [ha]
Area under conversion [ha]
Namibia 177 0.1% 144 33 Netherlands 3’474 2.0% 3’054 419 Nigeria 1’012 0.01%
Norway 6’732 2.4% 6’266 466 Pakistan 26’269 0.2% 24’796 1’473 Palestine, State of 65 0.3% 21 44 Paraguay 427 0.03%
Peru 6’019 0.5% 8
Philippines 554 0.01% 508
Poland 101’148 1.4% 81’182 19’966 Portugal 5’285 2.1% 1’648 3’637 Republic of Korea 1’686 0.2%
Romania 75’198 1.4% 49’542 25’656 Russian Federation 12’836 0.03% 2’342 329 Saudi Arabia 351 0.2% 335 16 Senegal 3’689 0.3% 113 3’576 Serbia 4’607 0.3% 2’190 2’416 Slovakia 18’106 2.4% 14’347 3’759 Slovenia 2’181 2.2% 1’679 501 South Africa 524 0.02% 318 206 Spain 216’481 3.5% 134’890 81’592 Sweden 104’976 10.5% 89’595 15’381 Switzerland 9’076 6.3%
Taiwan 1’780 0.6% 1’780
Tanzania 50’850 0.8% 50’850
Thailand 32’774 0.3%
Tunisia 568 0.1%
Turkey 162’109 1.4% 129’962 32’148 Ukraine 173’000 1.2%
United Kingdom 38’333 1.2% 36’748 1’583 United States 281’215 0.5%
Viet Nam 11’499 0.1% 1’359 10’140 Zambia 223 0.02% 95
Zimbabwe 689 0.04% 280 409 Total 4’091’183 0.6% 2’389’043 807’268
Source: FiBL survey 2018, based on information from the private sector, certifiers, and governments. For detailed data sources see annex, page 330 Blank cells: No data available.

Statistics › Crops › Citrus Fruit
96 FiBL & IFOAM – Organics International (2018): The World of Organic Agriculture. Frick and Bonn
› Citrus fruit
Almost 91’000 hectares of citrus fruits were grown organically worldwide in 2016. This constitutes 1 percent of the world’s total citrus area of 9.4 million hectares in 2016 (FAOSTAT).1 As no crop details for the organic area were available for some of the world’s leading citrus producers - India (0.9 million hectares) and Brazil (0.8 million hectares according to FAOSTAT), it can be assumed that the global figure for the organic citrus area is higher.
In organic agriculture, the largest producer is Italy with over 36’000 hectares, constituting 24.6 percent of Italy’s harvested citrus fruit area, followed by China (14’400 hectares, 0.6 percent), Mexico (almost 13’000 hectares, 2.2 percent), and Spain (over 10’000 hectares, 2.8 percent). Since 2004, when 28’500 hectares of organic citrus were grown, the area more than trebled. In 2016, the organic citrus area increased by 28 percent after the drop registered between 2013 and 2015 (Figure 32). Burkina Faso has the highest organic share of citrus fruit with 33.5 percent of the harvested citrus fruit area being organic. It is followed by Italy and Ghana (16.4 percent).
The area of organic citrus fruits shown in
Table 27 includes oranges (almost 40 percent of the organic citrus fruit), lemons and limes (16 percent), grapefruit and pomelos (13 percent), and tangerines (4 percent); for 28 percent of the organic citrus area, no crop detail was available.
The available data on the conversion status indicates that at least 30 percent of the organic citrus area was in-conversion in 2016 (more than 28’000 hectares).
Between 2013 and 2015, a drop of 13 percent of organic citrus fruit area was registered (Figure 32). This drop can be attributed to the spread of the Citrus Greening Disease that is transmitted by the vector Asian Citrus Psyllid, Diaphorina citri, and the African Citrus Psyllid, Trioza erytreae. In Latin America and the United States, the Greening Disease has caused strong losses. In the case of Cuba, a high percentage of the citrus fruit is infected with the Greening Disease, and it has provoked a strong decrease in production. Some Caribbean countries have decided to abandon producing organic citrus fruit and revert to conventional farming, where chemical pesticides are used to control the disease. Currently the African Citrus Psyllid, Trioza erytreae, vector is spreading in Portugal (Lisboa Region) and Spain (Galicia). It will only be a matter of time until the Greening Disease will be found in the Iberian Peninsula. In Mexico, which is a key organic citrus producer, FiBL has been developing an integrated organic management strategy to control the vector and regulate the greening since 2011.
1 FAOSTAT, the FAO Homepage, FAO, Rome at fao.org/faostat > Data > Crops > http://www.fao.org/faostat/en/#data/QC
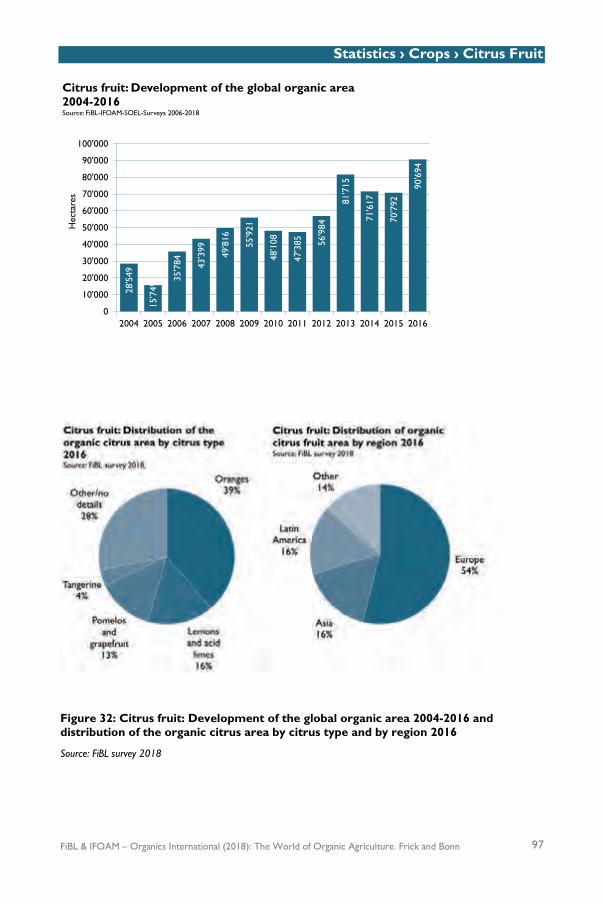
Statistics › Crops › Citrus Fruit
FiBL & IFOAM – Organics International (2018): The World of Organic Agriculture. Frick and Bonn 97
Figure 32: Citrus fruit: Development of the global organic area 2004-2016 and distribution of the organic citrus area by citrus type and by region 2016
Source: FiBL survey 2018
28'5
49
15'7
49
35'7
84 43'3
99 49'8
16
55'9
21
48'1
08
47'3
85 56'9
84
81'7
15
71'6
17
70'7
92
90'6
94
0
10'000
20'000
30'000
40'000
50'000
60'000
70'000
80'000
90'000
100'000
2004 2005 2006 2007 2008 2009 2010 2011 2012 2013 2014 2015 2016
Hec
tare
s
Citrus fruit: Development of the global organic area 2004-2016Source: FiBL-IFOAM-SOEL-Surveys 2006-2018

Statistics › Crops › Citrus Fruit
98 FiBL & IFOAM – Organics International (2018): The World of Organic Agriculture. Frick and Bonn
Table 27: Citrus fruit: Organic area by country 2016
Country Organic area
[ha] Organic share
[%] Area fully
converted [ha] Area under
conversion [ha]
Argentina 1’011 0.7% 1’011
Azerbaijan 21 0.7% 2 19 Burkina Faso 77 33.5% 49 28 Chile 92 0.5% 92
China 14’403 0.6% 6’623 7’780 Colombia 3 0.004% 2 1 Comoros 55 - 55
Costa Rica 24 0.1%
Côte d’Ivoire 3 0.03% 3
Croatia 15 0.7% 2 13 Cyprus 85 3.4% 38 47 Dominican Republic 262 1.6% 237 25 Egypt 1’190 0.6%
France 320 6.8% 253 67 Ghana 4’105 16.4% 4’105
Greece 1’476 2.7% 1’152 325 Indonesia 49 0.1% 49
Iran 37 0.02% 2 35 Israel 220 1.1% 160 59 Italy 36’125 24.6% 25’642 10’483 Jordan 46 0.7%
Lebanon 16 0.1% Madagascar 17 0.1% 17
Mexico 12’570 2.2% 7’900 4’670 Morocco 1’526 1.2% 1’327 199 Nigeria 2 0.0002%
Palestine, State of 1 0.1% 1
Paraguay 386 3.5%
Peru 75 0.1% 56
Portugal 282 1.4% 74 208 Republic of Korea 60 0.3%
Senegal 16 0.2% 3 13 South Africa 541 0.8% 531 5 Spain 10’183 2.8% 6’160 4’023 Turkey 481 0.4% 252 228 United States 4’919 1.6%
Total 90’694 1.0% 55’805 28’239
Source: FiBL survey 2018, based on information from the private sector, certifiers, and governments. For detailed data sources see annex, page 330. Blank cells: No data available.

Statistics › Crops › Cocoa
FiBL & IFOAM – Organics International (2018): The World of Organic Agriculture. Frick and Bonn 99
› Cocoa beans
Almost 345’000 hectares of cocoa were under organic management in 2016. This constitutes 3.4 percent of the world’s harvested cocoa bean area of 10 million hectares 2016 (FAOSTAT).1
The world’s leading producers are Côte d’Ivoire (2.8 million hectares), Indonesia (1.7 million hectares), Ghana (1.7 million hectares), and Nigeria (0.8 million hectares). The largest organic cocoa areas are found in the Dominican Republic (159’178 hectares), the Democratic Republic of Congo (37’039 hectares), and the United Republic of Tanzania (29’013 hectares). Almost 70 percent of the world’s organic cocoa area is in Latin America, and over 30 percent is in Africa.
Some countries have when compared with the FAO data on harvested area, very high organic shares. This can probably be attributed to the fact that FAO data might be incomplete. The organic cocoa area has grown almost seven-fold since 2004 and thus faster than most other crops/crop groups. However, part of the increase can be attributed to the continually improving data availability. In 2016, almost 27’000 hectares more were reported, an increase of 8.5 percent compared to 2015. The available data on the conversion status indicates that almost eight percent of the organic cocoa area was in conversion in 2016 (over 26’000 hectares). Thus, a slight increase in the supply of organic cocoa may be expected in the near future.
Figure 33: Cocoa beans: Development of the global organic area 2004-2016
Source: FiBL survey 2018
1 FAOSTAT, the FAO Homepage, FAO, Rome at fao.org/faostat > Data > Crops > http://www.fao.org/faostat/en/#data/QC
46'3
45
71'8
76
88'4
58 150'
366
169'
103
213'
826
233'
517
225'
802
201'
800
222'
597
249'
194 31
7'70
6
344'
666
0
50'000
100'000
150'000
200'000
250'000
300'000
350'000
400'000
2004 2005 2006 2007 2008 2009 2010 2011 2012 2013 2014 2015 2016
Hec
tare
s
Cocoa beans: Development of the global organic area 2004-2016Source: FiBL-IFOAM-SOEL-Surveys 2006-2018

Statistics › Crops › Cocoa
100 FiBL & IFOAM – Organics International (2018): The World of Organic Agriculture. Frick and Bonn
Table 28: Cocoa beans: Organic area by country 2016
Country Organic area
[ha] Organic share
[%] Area fully
converted [ha] Area under
conversion [ha]
Belize 380 40.1% 340 40 Bolivia 4’595 44.6% 3’976 619 Colombia 381 0.2% 370 11 Congo, D.R. 37’039 - 30’620 6’419 Costa Rica 1’682 42.0%
Côte d’Ivoire 111 0.004% 107 4 Dominican Republic 159’178 - 153’178 6’000 Ecuador 13’643 3.0% 12’667 976 El Salvador 2 0.2%
2
Ghana 4’748 0.3% 4’695 53 Grenada 65 5.2%
Haiti 5’186 19.2% 5’186
Honduras 753 39.9%
Indonesia 2’765 0.2% 2’695 70 Madagascar 3’089 23.4% 3’087 2 Mexico 779 1.3% 779
Nicaragua 3’666 39.4% 1’521 2’146 Nigeria 500 0.1%
Panama 14’021 - 4’224 436 Papua New Guinea 657 0.6% 647 10 Peru 25’587 20.4%
Sao Tome and Principe 6’401 24.8% 6’383 18 Sierra Leone 20’305 50.0% 20’305
Tanzania 29’013 - 19’748 9’266 Togo 2’249 4.2% 1’736 513 Uganda 7’872 13.5%
Total 344’666 3.4% 272’263 26’583
Source: FiBL survey 2018, based on information from the private sector, certifiers, and governments. For detailed data sources see annex, page 330 Blank cells: No data available.
For more information on cocoa production (organic and other Voluntary Sustainability Standards - VSS), please see the report “The State of Sustainable Markets – Statistics and Emerging Trends 2017.”1
1 Julia Lernoud, Jason Potts, Gregory Sampson, Salvador Garibay, Matthew Lynch, Vivek Voora, Helga Willer and Joseph Wozniak (2017), The State of Sustainable Markets – Statistics and Emerging Trends 2017. ITC, Geneva. Available at: http://www.vss.fibl.org/de/vss.html

Statistics › Crops › Coffee
FiBL & IFOAM – Organics International (2018): The World of Organic Agriculture. Frick and Bonn 101
› Coffee
Almost 934’000 hectares of coffee were grown organically in 2016. This constituted 8.5 percent of the world’s harvested coffee area of almost 11 million hectares in 2016, according to FAOSTAT.1
The world’s leading producers are Brazil (2 million hectares), Indonesia (1.2 million hectares), Côte d’Ivoire (1 million hectares), Colombia (0.9 million hectares), and Ethiopia (0.7 million hectares). Data on organic production was available for all of these countries with the exception of Brazil. Slightly more than 45 percent of the world’s organic coffee area is in Latin America, and 41 percent is in Africa.
In organic farming, the largest areas were in Mexico (231’000 hectares), Ethiopia (161’000 hectares), and Peru (110’000 hectares). Timor-Leste had the highest organic share, with almost 53 percent organic coffee, followed by Bolivia (48 percent), the United Republic of Tanzania (42 percent), and the Democratic Republic of Congo (almost 38 percent). The organic coffee area has increased more than five-fold since 2004. Compared with 2015, the organic coffee area grew by 3 percent or more than 30’000 hectares in 2016.
Figure 34: Coffee: Development of the global organic area 2004-2016
Source: FiBL-IFOAM-SOEL surveys 2006-2018; based on information from the private sector, certifiers, and governments. For detailed data sources see annex, page 330
1 FAOSTAT, the FAO Homepage, FAO, Rome at fao.org/faostat > Data > Crops > http://www.fao.org/faostat/en/#data/QC
176'
139
311'
469
339'
464
546'
541
481'
580
545'
902
626'
547
627'
333
670'
092
705'
964
761'
178 90
3'87
8
933'
950
0
100'000
200'000
300'000
400'000
500'000
600'000
700'000
800'000
900'000
1'000'000
2004 2005 2006 2007 2008 2009 2010 2011 2012 2013 2014 2015 2016
Hec
tare
s
Coffee: Development of the global organic area 2004-2016Source: FiBL-IFOAM-SOEL-Surveys 2006-2018

Statistics › Crops › Coffee
102 FiBL & IFOAM – Organics International (2018): The World of Organic Agriculture. Frick and Bonn
Table 29: Coffee: Organic area by country 2016
Country Organic area [ha]
Organic share [%]
Area fully converted [ha]
Area under conversion [ha]
Bolivia 11’185 48.0% 9’709 1’476 Brazil 271 0.01%
Cameroon 70 0.1% 70
Cape Verde 495 - 495
Colombia 10’495 1.2% 7’973 2’523 Congo, D.R. 28’626 37.6% 22’620 6’006 Costa Rica 696 0.8%
Dominican Republic 10’419 13.2% 9’400 1’019 Ecuador 3’092 10.3% 2’747 345 El Salvador 1’240 0.9% 1’187 53 Ethiopia 161’113 23.0% 159’866 1’247 Fiji 300 - 300
Guatemala 8’425 3.1% 6’925 1’500 Honduras 23’500 6.1%
Indonesia 82’069 6.7% 81’746 323 Jamaica 2 0.03%
2
Kenya 1’262 1.1%
Lao, P.D.R. 1’363 1.7%
Madagascar 629 0.8% 629
Malawi 101 2.4% 72 28 Mexico 231’000 35.8% 231’000
Myanmar 31 0.2% 31
Nepal 804 30.7% 804
Nicaragua 12’257 10.2% 10’433 1’824 Panama 953 5.7% 227
Papua New Guinea 14’968 27.5% 14’097 871 Peru 110’070 28.7%
Philippines 250 0.2% 250
Rwanda 203 0.6%
Sao Tome and Principe 245 24.5% 245
Sierra Leone 29’236 - 29’236
Tanzania 93’539 42.3% 79’270 14’270 Thailand 1’372 3.1%
Timor-Leste 28’012 52.6% 28’012
Uganda 65’570 17.1% United States 87 2.3% Total 933’950 8.5% 697’343 31’487
Source: FiBL survey 2018, based on information from the private sector, certifiers, and governments. For detailed data sources see annex, page 330 Blank cells: No data available.
For more information on coffee production (organic and other Voluntary Sustainability Standards - VSS), please see the report “The State of Sustainable Markets – Statistics and Emerging Trends 2017.”1
1 Julia Lernoud, Jason Potts, Gregory Sampson, Salvador Garibay, Matthew Lynch, Vivek Voora, Helga Willer and Joseph Wozniak (2017), The State of Sustainable Markets – Statistics and Emerging Trends 2017. ITC, Geneva. Available at: http://www.vss.fibl.org/de/vss.html

Statistics › Crops › Dry Pulses
FiBL & IFOAM – Organics International (2018): The World of Organic Agriculture. Frick and Bonn 103
› Dry pulses1
The total area under organic dry pulses is almost 530’000 hectares, which is 0.6 percent of the total area of dry pulses grown in the world (almost 82.4 million hectares in 2016, according to FAOSTAT).2
No current data on the organic area was available from the three most important dry pulse-growing countries in the world: India, Niger, and Myanmar. India (26 million hectares) was by far the largest grower, representing over 32 percent of the global area used to grow dry pulses.
The countries with the largest organic dry pulses areas are France (almost 86’000 hectares), Canada (almost 57’000 hectares), Poland (almost (56’000 hectares), Italy (almost 44’000 hectares), Germany (39’000 hectares), and Spain (38’000 hectares). Overall, organic shares can be high as dry pulses play an important role in organic farming, particularly in Europe.
The dry pulses area has increased six-fold from 79’000 to 530’000 hectares since 2004. However, some of the increase can be attributed to the continually improving availability of crop data. In 2016, the dry pulses area grew - compared to 2015 - by more than 87’000 hectares, or by almost 20 percent. A breakdown by crop is not available for many countries; for instance, Eurostat - the statistical office of the European Union - publishes only one figure for “dry pulses,” without breaking that figure down by crop.
The data available for a breakdown of the total fully converted and in-conversion area shows that at least 20 percent is in conversion, and will be fully converted in the next few years. This has implications for the availability of organic dry pulses in the near future.
1 In past editions of “The World of Organic Agriculture”, this category was called “Protein crops”. In order to harmonize nomenclature with Eurostat, we changed this to “Dry pulses.” 2 FAOSTAT, the FAO Homepage, FAO, Rome at fao.org/faostat > Data > Crops > http://www.fao.org/faostat/en/#data/QC

Statistics › Crops › Dry Pulses
104 FiBL & IFOAM – Organics International (2018): The World of Organic Agriculture. Frick and Bonn
Figure 35: Dry pulses: Development of the global organic area 2004-2016
Source: FiBL-IFOAM-SOEL surveys 2006-2018
Table 30: Dry pulses: Organic area by country 2016
Country Organic area [ha]
Organic share [%]
Area fully converted [ha]
Area under conversion [ha]
Argentina 1’248 0.3% 1’248
Austria 14’274 57.6%
Azerbaijan 6 0.1% 2 4 Belgium 441 25.3% 308 133 Bosnia and Herzegovina 3 0.03% 3
Bulgaria 523 1.7% 46 478 Canada 56’658 1.4% 38’343
Colombia 1 0.001% 1
Costa Rica 5 0.02%
Croatia 95 2.9% 54 41 Czech Republic 2’633 7.0% 2’363 270 Denmark 6’274 40.0% 4’432 1’841 Estonia 7’206 13.0% 5’377 1’829 Finland 15’526 - 12’360 3’166 France 85’827 26.5% 58’239 27’588 Germany 39’000 24.6%
Greece 8’502 30.6% 7’551 951 Hungary 3’047 9.9% 2’326 720 Ireland 156 1.2% 128 28 Israel 60 1.4% 60
Italy 43’986 44.1% 32’161 11’825 Kazakhstan 18’399 5.4% 14’099 4’300 Kenya 215 0.01%
Kyrgyzstan 15 0.03% 14 1 Latvia 7’159 17.5% 4’616 2’543 Lebanon 1 0.03% 1
79'0
41
118'
022
161'
302
150'
580
180'
536
206'
229
275'
563
298'
552
324'
282
320'
390
365'
577
442'
084 52
9'13
8
0
100'000
200'000
300'000
400'000
500'000
600'000
2004200520062007200820092010201120122013201420152016
Hec
tare
s
Dry pulses: Development 2004-2016Source: FiBL-IFOAM-SOEL-Surveys 2006-2018
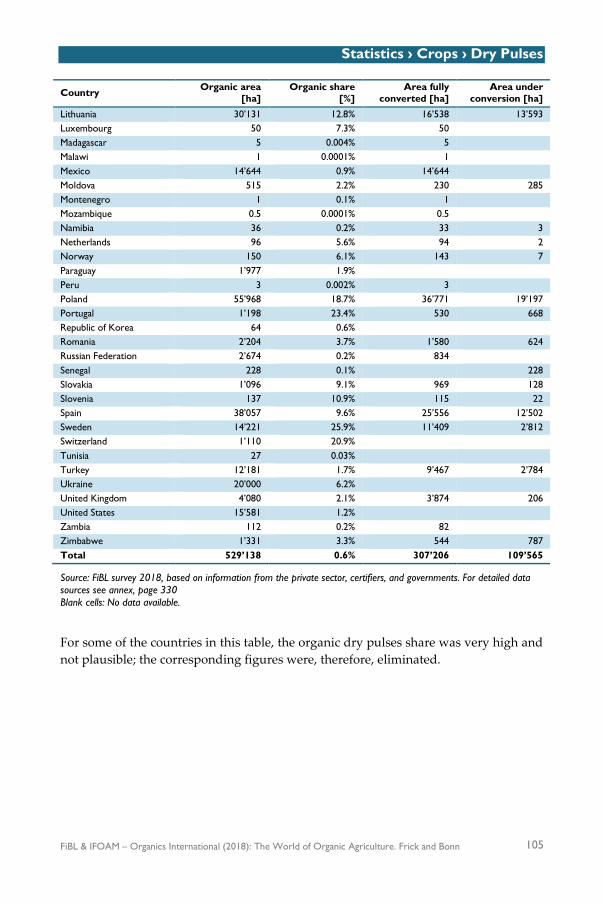
Statistics › Crops › Dry Pulses
FiBL & IFOAM – Organics International (2018): The World of Organic Agriculture. Frick and Bonn 105
Country Organic area [ha]
Organic share [%]
Area fully converted [ha]
Area under conversion [ha]
Lithuania 30’131 12.8% 16’538 13’593 Luxembourg 50 7.3% 50
Madagascar 5 0.004% 5
Malawi 1 0.0001% 1
Mexico 14’644 0.9% 14’644
Moldova 515 2.2% 230 285 Montenegro 1 0.1% 1
Mozambique 0.5 0.0001% 0.5
Namibia 36 0.2% 33 3 Netherlands 96 5.6% 94 2 Norway 150 6.1% 143 7 Paraguay 1’977 1.9%
Peru 3 0.002% 3
Poland 55’968 18.7% 36’771 19’197 Portugal 1’198 23.4% 530 668 Republic of Korea 64 0.6%
Romania 2’204 3.7% 1’580 624 Russian Federation 2’674 0.2% 834
Senegal 228 0.1%
228
Slovakia 1’096 9.1% 969 128 Slovenia 137 10.9% 115 22 Spain 38’057 9.6% 25’556 12’502 Sweden 14’221 25.9% 11’409 2’812 Switzerland 1’110 20.9%
Tunisia 27 0.03%
Turkey 12’181 1.7% 9’467 2’784 Ukraine 20’000 6.2% United Kingdom 4’080 2.1% 3’874 206 United States 15’581 1.2% Zambia 112 0.2% 82 Zimbabwe 1’331 3.3% 544 787 Total 529’138 0.6% 307’206 109’565
Source: FiBL survey 2018, based on information from the private sector, certifiers, and governments. For detailed data sources see annex, page 330 Blank cells: No data available.
For some of the countries in this table, the organic dry pulses share was very high and not plausible; the corresponding figures were, therefore, eliminated.

Statistics › Crops › Temperate Fruit
106 FiBL & IFOAM – Organics International (2018): The World of Organic Agriculture. Frick and Bonn
› Fruit: Temperate fruit
The total area under organic temperate fruit production recorded here (almost 255’000 hectares), is 2 percent of the total area of temperate fruit grown in the world (12.6 million hectares in 2016, according to FAOSTAT).1
Of the seven most important temperate fruit growing countries in the world (China, Turkey, Iran, India, Russia, the United States, and Uzbekistan), five countries (China, Turkey, Iran, Russia,2 and the United States) provided data on the area of organic temperate fruits in 2016. It can, therefore, be assumed that the organic temperate fruit area is higher.
The countries with the largest organic temperate fruit areas are China (almost 98’000 hectares), Italy (22’400 hectares), Poland (almost 19’000 hectares), Turkey (16’000 hectares), France (almost 14’000 hectares), and the United States (almost 12’000 hectares) (Table 32).
Since 2004, when data on land use and crops were collected for the first time, the temperate fruit area has almost trebled. However, some of the increase can be attributed to the continually improving crop data availability. In 2016, a drop of over 8’000 hectares occurred, this was mainly due to a decrease in China.
The key temperate fruits are apples, with one-third of the temperate fruit area, followed by apricots, cherries, plums, and pears (Table 31). Poland has one-third of the total organic apple area. The available data on the conversion status indicates that more than 30 percent of the total temperate fruit area is in conversion. Thus, a considerable increase in the supply of organic temperate fruit in the near future.
Table 31: Temperate fruit: Organic area by crop 2016
Main crop 2016 [ha] Change 2015-2016 [ha] Organic share [%] Apples 82’983 2’038 1.6% Apricots 22’940 4’723 4.0% Cherries 15’924 3’671 2.4% Peaches and nectarines, no details 10’877 1’023 0.7% Pears 15’376 5’264 1.0% Plums 15’871 2’679 0.6% Pome fruit, no details 1190 -2751 - Quinces 81 30 0.1% Stone fruit, no details 5096 -5186.3 - Total* 254’600 -8’414 2.0%
Source: FiBL survey 2018 *Total includes temperate fruit areas for which no details were available
1 FAOSTAT, the FAO Homepage, FAO, Rome at fao.org/faostat > Data > Crops > http://www.fao.org/faostat/en/#data/QC 2 Please note that for Russia the data is incomplete as not all certifiers provided data on the crops.

Statistics › Crops › Temperate Fruit
FiBL & IFOAM – Organics International (2018): The World of Organic Agriculture. Frick and Bonn 107
Figure 36: Temperate fruit: Use of organic temperate fruit area 2016
Source: FiBL survey 2018
Figure 37: Temperate fruit: Development of the global organic area 2004-2016
Source: FiBL-IFOAM-SOEL surveys 2006-2018
97'2
46 62'4
07
124'
090
101'
560
101'
689
95'4
25
119'
934
154'
861
165'
356 21
2'89
3
186'
486
263'
013
254'
600
0
50'000
100'000
150'000
200'000
250'000
300'000
2004 2005 2006 2007 2008 2009 2010 2011 2012 2013 2014 2015 2016
Hec
tare
s
Temperate Fruit: Development of the global organic area 2004-2016Source: FiBL-IFOAM-SOEL-Surveys 2006-2018

Statistics › Crops › Temperate Fruit
108 FiBL & IFOAM – Organics International (2018): The World of Organic Agriculture. Frick and Bonn
Table 32: Temperate fruit: Organic area by country 2016
Country Organic area [ha]
Organic share [%]
Area fully converted [ha]
Area under conversion [ha]
Albania 123 0.8%
Argentina 4’818 4.7% 4’818
Austria 4’938 53.2%
Azerbaijan 754 1.4% 112 642 Belgium 384 2.1% 292 92 Bulgaria 7’657 28.0% 2’709 4’948 Burundi 83 -
Canada 908 4.4%
Chile 1’291 1.2% 1’291
China 97’880 1.5% 62’294 35’586 Colombia 1 0.02%
1
Croatia 1’908 12.0% 814 1’093 Cyprus 149 8.5% 79 70 Czech Republic 4’106 29.7% 3’345 760 Denmark 412 14.8% 344 68 Estonia 512 17.0% 458 54 Finland 67 9.3% 64 3 France 13’544 13.4% 10’016 3’528 Georgia 855 2.6% 855
Germany1 7’472 16.7%
Greece 637 0.7% 476 161 Hungary 3’839 5.8% 1’102 2’737 Iran 2 0.0004% 0 2 Ireland 46 6.6% 41 4 Israel 65 0.6% 65
Italy 22’378 10.1% 14’617 7’761 Jordan 0.3 0.004%
Kyrgyzstan 19 0.04% 19
Latvia 1’184 39.2% 534 650 Lebanon 67 0.2% 47 20 Lesotho 543 - 543
Liechtenstein 2 - 2
Lithuania 1’231 7.4% 814 418 Luxembourg 14 4.7% 13 2 Macedonia, FYROM 194 0.7% 104 90 Mexico 1’349 1.3% 1’348
Moldova 279 0.3% 279
Montenegro 354 30.6% 97 257 Morocco 455 0.5% 83 372 Netherlands 426 2.4% 403 24 New Zealand 1’000 9.2%
Norway 201 9.8% 162 39 Oman 4 -
Peru 768 4.1% 692
Poland 18’616 7.6% 16’655 1’961 Portugal 1’441 3.6% 602 839 Republic of Korea 130 0.2%
Romania 6’353 4.7% 4’205 2’147
1 Please note that for Germany, extensive fruit areas were included.

Statistics › Crops › Temperate Fruit
FiBL & IFOAM – Organics International (2018): The World of Organic Agriculture. Frick and Bonn 109
Country Organic area [ha]
Organic share [%]
Area fully converted [ha]
Area under conversion [ha]
Russian Federation 31 0.01%
31 Serbia 1’945 1.4% 1’325 620 Slovakia 674 18.3% 480 194 Slovenia 178 5.5% 134 44 South Africa 296 0.5% 296
Spain 5’648 2.8% 3’451 2’197 Sweden 235 13.5% 210 25 Switzerland 564 9.0%
Tunisia 3’893 7.4%
Turkey 16’260 3.2% 6’272 9’988 Ukraine 2’500 1.5% United Kingdom 1’248 6.4% 1’236 12 United States 11’670 4.1% Total 254’600 2.0% 145’089 77’438
Source: FiBL survey 2018, based on information from the private sector, certifiers, and governments. For detailed data sources see annex, page 330 Blank cells: No data available.
Further reading Granatstein, David, Elizabeth Kirby, Harold Ostenson, and Helga Willer (2015) Global situation for organic
tree fruits. Scientia Horticulturae. Available online 18 December 2015 doi:10.1016/j.scienta.2015.12.008

Statistics › Crops › Tropical and Subtropical Fruit
110 FiBL & IFOAM – Organics International (2018): The World of Organic Agriculture. Frick and Bonn
› Fruit: Tropical and subtropical fruit
The total area under organic tropical and subtropical fruit production recorded here (over 356’000 hectares) is 1.4 percent of the total area of tropical and subtropical fruit grown in the world (24.8 million hectares in 2016, according to FAOSTAT data).1
Of the five most important tropical and subtropical fruit growing countries in the world (India, China, Philippines, Brazil, and Thailand, all with more than one million hectares), only China, the Philippines, and Thailand provided data on the area used for growing organic tropical and subtropical fruit in 2016.
The largest organic growers for which data on the organic area was available were Mexico (almost 131’000 hectares), China (over 28’000 hectares), the Dominican Republic (almost 26’000 hectares), and Madagascar (19’000 hectares). Some of these countries also report very high organic shares of tropical and subtropical fruit, more than the ten percent of their countries’ total area for these crops: In the case of the Dominican Republic, bananas; and in the case of Mexico, mangos and avocados. The largest organic shares of tropical and subtropical fruit area are in Burkina Faso (46.8 percent), Niue (43.6 percent), Turkey (28.6 percent), and the Dominican Republic (24.6 percent). By area, the key tropical and subtropical fruits are avocados, bananas, and dates (Figure 38).
Since 2004, when data on land use and crops was collected for the first time, the tropical fruit area has increased eight-fold (Figure 39). Some of the increase can be attributed to the continually improving data availability. In 2016, a drop of the area was noticed compared to 2015; this can be attributed to a decrease of the organic area in Samoa, Kenya, and Madagascar.
The available data on the conversion status indicates that at least 13 percent of the total tropical and subtropical fruit area is in conversion. This suggests that a slight increase in supply in the near future may be expected.
For more information on banana production (organic and other Voluntary Sustainability Standards - VSS), please see the report “The State of Sustainable Markets – Statistics and Emerging Trends 2017.”2
1 FAOSTAT, the FAO Homepage, FAO, Rome at fao.org/faostat > Data > Crops > http://www.fao.org/faostat/en/#data/QC 2 Julia Lernoud, Jason Potts, Gregory Sampson, Salvador Garibay, Matthew Lynch, Vivek Voora, Helga Willer and Joseph Wozniak (2017), The State of Sustainable Markets – Statistics and Emerging Trends 2017. ITC, Geneva. Available at: http://www.vss.fibl.org/de/vss.html

Statistics › Crops › Tropical and Subtropical Fruit
FiBL & IFOAM – Organics International (2018): The World of Organic Agriculture. Frick and Bonn 111
Table 33: Tropical and subtropical fruit: Organic area by crop 2016
Main crop Area [ha] Organic share [%] Avocados 62’352 11.1% Bananas 58’407 0.6% Camu camu 140 - Carobs 846 1.3% Dates 38’744 2.9% Figs 17’092 5.5% Guava 11’102 - Kiwis 5’735 2.1% Litchi 986 - Mangos 21’442 0.4% Noni 427 - Opuntia 2’416 - Papayas 729 0.2% Passion fruit 190 - Persimmons 263 0.03% Pineapples 7’167 0.7% Pitaya 306 - Pomegranate 3’145 - Total* 356’119 1.4%
Source: FiBL survey 2018 * Total includes tropical and subtropical fruit areas for which no details were available
Figure 38: Tropical and subtropical fruit: Distribution of global organic area by crop 2016
Source: FiBL survey 2018

Statistics › Crops › Tropical and Subtropical Fruit
112 FiBL & IFOAM – Organics International (2018): The World of Organic Agriculture. Frick and Bonn
Figure 39: Tropical and subtropical fruit: Development of the global organic area 2004-2016
Source: FiBL-IFOAM-SOEL surveys 2006-2018
Table 34: Tropical and subtropical fruit: Organic area by country 2016
Country Organic area [ha]
Organic share [%]
Area fully converted [ha]
Area under conversion [ha]
Algeria 502 0.2% 502 Argentina 81 0.8% 81 Azerbaijan 495 4.4% 180 315 Bangladesh 10 0.003% Bolivia 40 0.1% 38 2 Bulgaria 65 - 8 57 Burkina Faso 7’165 46.8% 7’063 73 Cambodia 38 0.1% Cameroon 304 0.1% 304 Chile 476 1.2% 476 China 28’403 0.8% 19’094 9’309 Colombia 1’746 0.3% 1’723 22 Cook Islands 10 9.2% 10 Costa Rica 4’445 4.2% Côte d’Ivoire 606 0.1% 606 Croatia 99 9.9% 76 23 Cyprus 63 3.1% 38 25 Dominican Republic 25’835 24.6% 22’579 3’256 Ecuador 18’650 5.9% 14’512 4’139 Egypt 375 0.2% El Salvador 14 0.2% 14 Fiji 3’086 - 3’086 France 101 2.3% 58 43 French Guiana (France) 127 5.9% 53 74 French Polynesia 57 12.4% 57 Ghana 188 0.05% 188 Greece 790 6.1% 524 266 Grenada 19 1.4%
40'5
00
55'8
83
64'9
59
94'6
80
138'
512
165'
879
171'
304
207'
140
220'
862
214'
840
226'
283
381'
603
356'
119
0
50'000
100'000
150'000
200'000
250'000
300'000
350'000
400'000
450'000
2004 2005 2006 2007 2008 2009 2010 2011 2012 2013 2014 2015 2016
Hec
tare
s
Tropical and subtropical fruit: Development 2004-2016Source: FiBL-IFOAM-SOEL-Surveys 2006-2018
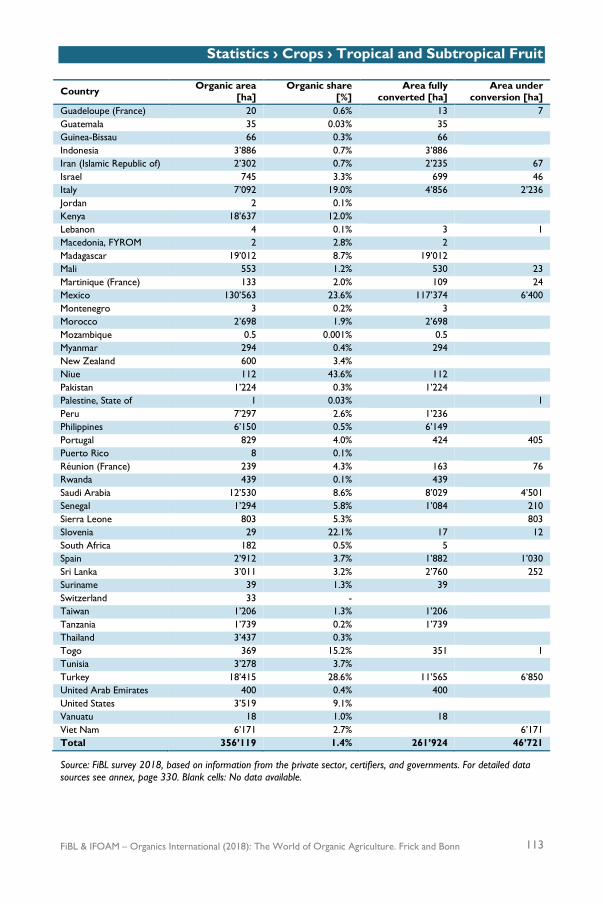
Statistics › Crops › Tropical and Subtropical Fruit
FiBL & IFOAM – Organics International (2018): The World of Organic Agriculture. Frick and Bonn 113
Country Organic area [ha]
Organic share [%]
Area fully converted [ha]
Area under conversion [ha]
Guadeloupe (France) 20 0.6% 13 7 Guatemala 35 0.03% 35 Guinea-Bissau 66 0.3% 66 Indonesia 3’886 0.7% 3’886 Iran (Islamic Republic of) 2’302 0.7% 2’235 67 Israel 745 3.3% 699 46 Italy 7’092 19.0% 4’856 2’236 Jordan 2 0.1% Kenya 18’637 12.0% Lebanon 4 0.1% 3 1 Macedonia, FYROM 2 2.8% 2 Madagascar 19’012 8.7% 19’012 Mali 553 1.2% 530 23 Martinique (France) 133 2.0% 109 24 Mexico 130’563 23.6% 117’374 6’400 Montenegro 3 0.2% 3 Morocco 2’698 1.9% 2’698 Mozambique 0.5 0.001% 0.5 Myanmar 294 0.4% 294 New Zealand 600 3.4% Niue 112 43.6% 112 Pakistan 1’224 0.3% 1’224 Palestine, State of 1 0.03% 1 Peru 7’297 2.6% 1’236 Philippines 6’150 0.5% 6’149 Portugal 829 4.0% 424 405 Puerto Rico 8 0.1% Réunion (France) 239 4.3% 163 76 Rwanda 439 0.1% 439 Saudi Arabia 12’530 8.6% 8’029 4’501 Senegal 1’294 5.8% 1’084 210 Sierra Leone 803 5.3% 803 Slovenia 29 22.1% 17 12 South Africa 182 0.5% 5 Spain 2’912 3.7% 1’882 1’030 Sri Lanka 3’011 3.2% 2’760 252 Suriname 39 1.3% 39 Switzerland 33 - Taiwan 1’206 1.3% 1’206 Tanzania 1’739 0.2% 1’739 Thailand 3’437 0.3% Togo 369 15.2% 351 1 Tunisia 3’278 3.7% Turkey 18’415 28.6% 11’565 6’850 United Arab Emirates 400 0.4% 400 United States 3’519 9.1% Vanuatu 18 1.0% 18 Viet Nam 6’171 2.7% 6’171 Total 356’119 1.4% 261’924 46’721
Source: FiBL survey 2018, based on information from the private sector, certifiers, and governments. For detailed data sources see annex, page 330. Blank cells: No data available.

Statistics › Crops › Grapes
114 FiBL & IFOAM – Organics International (2018): The World of Organic Agriculture. Frick and Bonn
› Grapes
Almost 380’000 hectares of organic grapes are grown, constituting 5.3 percent of the world’s grape-growing area (7.1 million hectares in 2016, according to FAOSTAT).1 In Europe, over 328’000 hectares (8.4 percent of the harvested grape area) are organic. Not all of the grape area listed in the table is used for wine. The production of table grapes and raisins is important in many countries, such as Turkey. All of the five most important grape-growing countries in the world (Spain, China, France, Italy, and Turkey) provided data on the area under organic grape production in 2016.
The countries with the largest organic grape areas are Spain and Italy, each with more than 100’000 hectares of organic grapes, followed by France with over 70’000 hectares. Some of the highest organic shares of the total grape area are also found in these countries (Table 35). Almost 90 percent of the world’s organic grape area is in Europe. The rest is distributed almost equally among Asia, North America, and Latin America.
Since 2004, when data on land use and crops were collected for the first time, the organic grape area has increased four-fold. However, some of the increase can be attributed to the continually improving availability of crop data.
The available data indicates that a large part of the organic grape area (at least 28 percent) is in conversion. Thus, a considerable increase in the supply of organic grapes may be expected, particularly from Spain, Italy, and France.
Figure 40: Grapes: Development of the global organic area 2004-2016
Source: FiBL-IFOAM-SOEL surveys 2006-2018
1 FAOSTAT, the FAO Homepage, FAO, Rome at fao.org/faostat > Data > Crops > http://www.fao.org/faostat/en/#data/QC
87'6
55
101'
263
113'
970
122'
420
150'
756
190'
450
217'
953
264'
711
284'
230
312'
577
311'
866
332'
913
379'
555
0
50'000
100'000
150'000
200'000
250'000
300'000
350'000
400'000
2004 2005 2006 2007 2008 2009 2010 2011 2012 2013 2014 2015 2016
Hec
tare
s
Grapes: Development 2004-2016Source: FiBL-IFOAM-SOEL-Surveys 2006-2018

Statistics › Crops › Grapes
FiBL & IFOAM – Organics International (2018): The World of Organic Agriculture. Frick and Bonn 115
Table 35: Grapes: Organic area by country 2016
Country Organic area [ha]
Organic area [%]
Area fully converted [ha]
Area under conversion [ha]
Albania 14 0.1% Algeria 208 0.3% 208 Andorra 4 - 4 Argentina 6’240 2.8% 6’240 Austria 5’088 10.9% Azerbaijan 41 0.3% 1 40 Belgium 28 11.9% 16 12 Bulgaria 5’390 14.7% 1’622 3’768 Canada 1’000 8.4% 1’000 Chile 3’063 1.5% 3’063 China 20’025 2.4% 12’425 7’600 Croatia 1’119 4.8% 589 530 Cyprus 261 4.3% 182 78 Czech Republic 885 5.6% 738 147 Denmark 29 - 18 10 Egypt 1’890 2.5% Estonia 2 - Finland 4 - 4 France 70’732 9.3% 58’637 12’095 Georgia 130 0.3% 55 75 Germany 8’000 8.0% Greece 4’033 3.6% 3’484 549 Hungary 1’637 2.4% 894 743 Iran 1’854 0.9% 1’854 Israel 29 0.4% 27 2 Italy 103’545 15.5% 66’133 37’412 Jordan 10 0.2% Kazakhstan 20 0.1% 20 Lebanon 417 5.3% 415 2 Liechtenstein 4 - 4 Luxembourg 62 4.9% 32 30 Macedonia, FYROM 18 0.1% 6 11 Malta 8 0.5% 5 2 Mexico 2’155 7.3% 2’155 Moldova 7 0.01% 7 Montenegro 1 0.1% 1 Morocco 34 0.1% 32 2 Netherlands 7 0.8% 7 New Zealand 2’022 5.0% Poland 258 - 196 62 Portugal 3’074 1.8% 1’109 1’965 Republic of Korea 70 0.5% Romania 2’024 1.2% 1’684 340 Russian Federation 16 0.02% 16 Serbia 36 0.2% 6 30 Slovakia 110 1.3% 71 39 Slovenia 536 3.4% 342 194 South Africa 783 0.6% 738 45 Spain 106’720 11.6% 73’579 33’141 Switzerland 789 5.3% Turkey 13’961 3.2% 5’534 8’427 United Kingdom 90 23.6 80 10 United States 11’071 2.7 Total 379’555 5.3 243’221 107’378
Source: FiBL survey 2018, based on information from the private sector, certifiers, and governments. For detailed data sources see annex, page 330 Blank cells: Not data

Statistics › Crops › Oilseeds
116 FiBL & IFOAM – Organics International (2018): The World of Organic Agriculture. Frick and Bonn
› Oilseeds
Almost 1.3 million hectares were used for growing organic oilseeds in 2016. This is 0.6 percent of the world’s total harvested oilseed area (almost 230 million hectares according to FAOSTAT).1
The main countries in which oilseeds are grown are the United States, Brazil, India, Argentina, and China (each with more than 20 million hectares). Data on organic production was available for all of these countries but Brazil. The countries with the largest organic oilseed area are China, India, Sudan, the United States, and Kazakhstan.
The highest organic shares are in Togo (27 percent, mainly soybeans), Peru (23 percent, mainly sesame), and Austria (almost 16 percent, mainly soybeans).
Since 2004, when data on land use and crops was collected for the first time, the oilseed area (2004: almost 144’000 hectares) has increased more than nine-fold. However, some of the increase can be attributed to the continually improving availability of crop data. In 2016, the organic oilseed area increased by 4 percent (almost 51’000 hectares). Over forty percent of the organic oilseed area is for soybeans, and another twenty percent is for sunflower seeds and sesame (Figure 42).
The data available for a breakdown of the total fully converted and in conversion area shows that at least 19 percent is in conversion and will be fully converted in the next few years. This has implications for the availability of organic oilseeds in the near future.
Table 36: Oilseeds: Organic area by crop 2016
Main crop Area [ha] Organic share [%] Jojoba 294 - Linseed (oil flax) 35’159 1.3% Mustard 3’011 0.4% Oil pumpkin 5’688 - Peanuts 86’901 0.3% Rape and turnip rape 85’960 0.3% Sacha inchi 295 - Safflower 12’269 1.1% Sesame 116’861 1.1% Soybeans 560’457 0.5% Sunflower seed 104’032 0.4% Total* 1’286’588 0.6%
Source: FiBL survey 2019. *Total includes oilseed areas for which no details were available
1 FAOSTAT, the FAO Homepage, FAO, Rome at fao.org/faostat > Data > Crops > http://www.fao.org/faostat/en/#data/QC

Statistics › Crops › Oilseeds
FiBL & IFOAM – Organics International (2018): The World of Organic Agriculture. Frick and Bonn 117
Figure 41: Oilseeds: Development of the global organic oilseed area 2004-2016
Source: FiBL-IFOAM-SOEL surveys 2006-2018
Figure 42: Oilseeds: Use of organic oilseed area by crop 2016
Source: FiBL survey 2018
143'
956
154'
859
237'
955
252'
745
340'
887
446'
056
742'
114
744'
969
681'
219 86
7'00
2
953'
077 1'
235'
880
1'28
6'58
8
0
200'000
400'000
600'000
800'000
1'000'000
1'200'000
1'400'000
2004 2005 2006 2007 2008 2009 2010 2011 2012 2013 2014 2015 2016
Hec
tare
s
Oilseeds: Development of the global organic area 2004-2016Source: FiBL-IFOAM-SOEL-Surveys 2006-2018

Statistics › Crops › Oilseeds
118 FiBL & IFOAM – Organics International (2018): The World of Organic Agriculture. Frick and Bonn
Table 37: Oilseeds: Organic area by country 2016
Country Organic area [ha] Organic area [%] Area fully converted [ha]
Area under conversion [ha]
Argentina 23’646 0.1% 23’646
Austria 24’072 15.7%
Azerbaijan 126 0.6% 50 76 Belgium 157 0.6% 78 79 Benin 239 0.1%
Bolivia 4’038 0.3% 4’038
Bosnia and Herzegovina 82 0.9% 82
Bulgaria 12’391 1.2% 1’430 10’961 Burkina Faso 7’281 0.9% 7’075
Canada 40’911 0.4%
Chile 11 0.02% 11
China 393’500 1.9% 326’400 67’100 Colombia 0.2 0.001% 0.2
Côte d’Ivoire 14 0.01% 14
Croatia 7’800 4.7% 3’886 3’914 Czech Republic 2’000 0.4% 1’489 511 Denmark 1’385 0.8% 1’254 130 Egypt 1’589 1.4%
Estonia 4’059 5.8% 2’749 1’310 Ethiopia 24’936 2.9% 24’936
Finland 2’127 3.5% 1’738 389 France 53’709 2.4% 29’267 24’442 Germany 11’900 0.9%
Greece 1’530 1.3% 1’327 203 Guatemala 342 0.6%
342
Guinea-Bissau 43 0.1% 43
Hungary 7’649 0.8% 4’095 3’554 Iceland 6 - 6
India 130’000 0.5%
Iran 650 0.2% 650
Ireland 88 0.9% 72 16 Israel 336 4.1% 336
Italy 16’133 3.9% 11’234 4’899 Kazakhstan 57’320 2.9% 49’654 7’666 Kenya 715 0.5%
Kyrgyzstan 14 0.04% Latvia 1’315 1.3% 606 709 Liechtenstein 7 - 7
Lithuania 3’112 2.0% 1’743 1’369 Luxembourg 17 0.5% 8 9 Macedonia, FYROM 44 0.9% 34 10 Mali 9’945 1.8% 9’940 5 Mexico 23’543 4.5% 22’885
Moldova 4’183 1.0% 2’243 1’940 Namibia 33 4.5% 33
Nepal 122 0.03%
122
Netherlands 24 0.5% 24
Nicaragua 2’500 5.0% 2’500

Statistics › Crops › Oilseeds
FiBL & IFOAM – Organics International (2018): The World of Organic Agriculture. Frick and Bonn 119
Country Organic area [ha] Organic area [%] Area fully converted [ha]
Area under conversion [ha]
Norway 9 0.2% 9
Paraguay 11’760 0.3%
Peru 1’442 23.3% 1’419
Poland 2’802 0.3% 1’956 845 Portugal 108 0.6% 63 45 Romania 51’571 3.2% 34’745 16’826 Russian Federation 31’680 0.3% 7’048 166 Senegal 1’312 0.1% 925 387 Serbia 2’857 0.7% 1’576 1’281 Slovakia 3’042 1.2% 2’548 493 Slovenia 395 6.7% 283 112 Spain 10’098 1.3% 5’710 4’389 Sudan 86’000 1.7% 3’000 83’000 Sweden 6’649 6.6% 6’284 365 Switzerland 948 3.4%
Togo 18’754 27.0% 17’417 1’337 Turkey 5’622 0.6% 4’138 1’485 Uganda 44’587 4.2%
Ukraine 70’000 0.8%
United Kingdom 60 0.01% 39 21 United States 61’164 0.2%
Zambia 76 0.02% 6
Zimbabwe 8 0.003% 3 5 Total 1’286’588 0.6% 667’070 240’519
Source: FiBL survey 2018, based on information from the private sector, certifiers, and governments. For detailed data sources see annex, page 330 Blank cells: no data.
For more information on soybean production (organic and other Voluntary Sustainability Standards (VSS)), please see the report “The State of Sustainable Markets – Statistics and Emerging Trends 2017.”1
1 Julia Lernoud, Jason Potts, Gregory Sampson, Salvador Garibay, Matthew Lynch, Vivek Voora, Helga Willer and Joseph Wozniak (2017), The State of Sustainable Markets – Statistics and Emerging Trends 2017. ITC, Geneva. Available at: http://www.vss.fibl.org/de/vss.html

Statistics › Crops › Olives
120 FiBL & IFOAM – Organics International (2018): The World of Organic Agriculture. Frick and Bonn
› Olives
Almost 748’000 hectares of olives were reported to be under organic production in 2016. This represents 7 percent of the world’s total harvested olive area (10.7 million hectares according to FAOSTAT).
The main countries in which olives are grown are around the Mediterranean. Spain is by far the largest grower with 2.6 million hectares, followed by Tunisia (1.6 million hectares) and Italy (1.2 million hectares). Greece and Morocco are also important producers. For all these countries, data for the organic area was available.
Italy has the largest area of organic olives (more than 222’000 hectares), followed by Spain (almost 198’000 hectares), and Tunisia (almost 138’000 hectares). Almost 80 percent of the world’s organic olive area is in Europe, followed by northern Africa with 20 percent of the world’s organic olive area. In Italy, the percentage of area under organic production is relatively high (over 19 percent).
In Spain, almost 8 percent of the olive area is organic, and in Tunisia 8.4 percent. France has the highest organic share with 27.6 percent of the olive area being organic. Since 2004, when data on land use and crops were collected for the first time, the olive area more than doubled. The available data indicates that a large part of the total olive area, 24 percent, is in conversion. Thus, an increase in the supply of organic olives may be expected.
Figure 43: Organic olive area: Distribution by region and top 10 producing countries 2016
Source: FiBL-survey 2018; based on national data sources and certifier data. For detailed data sources see annex, page 330

Statistics › Crops › Olives
FiBL & IFOAM – Organics International (2018): The World of Organic Agriculture. Frick and Bonn 121
Figure 44: Olives: Development of the global organic area 2004-2016
Source: FiBL-IFOAM-SOEL surveys 2006-2018; based on national data sources and certifier data. For detailed data sources see annex, page 330
Table 38: Olives: Organic area by country 2016
Country Organic area [ha]
Organic area [%]
Area fully converted [ha]
Area under conversion [ha]
Albania 198 0.5% Argentina 4’744 7.7% 4’744 Azerbaijan 13 0.4% 5 8 Croatia 1’536 8.4% 978 558 Cyprus 1’527 14.4% 960 567 Egypt 1’008 1.5% France 4’689 27.0% 3’905 784 Georgia 70 - 70 Greece 44’752 5.0% 37’945 6’807 Iran 210 0.3% 120 90 Israel 557 1.7% 503 54 Italy 222’453 19.1% 150’400 72’053 Jordan 410 0.6% Lebanon 229 0.4% 192 37 Malta 7 25.0% 7 Mexico 20’000 - 20’000 Montenegro 5 5.9% 4 1 Morocco 1’279 0.1% 1’035 244 Palestine, State of 5’744 8.6% 5’008 736 Peru 95 0.6% 89 Portugal 21’797 6.1% 6’321 15’476 Slovenia 240 20.5% 185 55 South Africa 23 - 23 Spain 196’567 7.6% 146’762 49’805 Tunisia 137’713 8.4% Turkey 81’055 9.6% 50’247 30’808 United States 719 5.1% Total 747’640 7.0% 429’434 178’152
Source: FiBL survey 2018, based on information from the private sector, certifiers, and governments. For detailed data sources see annex, page 330 Blank cells: No data available.
314'
809
345'
657
380'
575
401'
524
432'
116
491'
400
495'
480
538'
592
576'
036
612'
737
627'
008
672'
036
747'
640
0
100'000
200'000
300'000
400'000
500'000
600'000
700'000
800'000
2004 2005 2006 2007 2008 2009 2010 2011 2012 2013 2014 2015 2016
Hec
tare
s
Olives: Development of the global organic area 2004-2016Source: FiBL-IFOAM-SOEL-Surveys 2006-2018

Statistics › Crops › Vegetables
122 FiBL & IFOAM – Organics International (2018): The World of Organic Agriculture. Frick and Bonn
› Vegetables
The total area under organic vegetable production (more than 437’000 hectares) is 0.7 percent of the total area of vegetables grown in the world (62 million hectares in 2016, according to FAOSTAT).1
Of the four most important vegetable-growing countries in the world (China, India, Nigeria, and Viet Nam), data on the organic area was only available for China and Viet Nam.
The countries with the largest organic vegetable areas are Mexico, the United States, China, Poland, and Egypt (each with areas over 20’000 hectares).
The highest organic shares of the total vegetable areas are in Denmark, Austria, Canada, Switzerland, and Mexico. These are also the countries in Europe that, with the exception of Mexico and Canada, have the largest organic market shares for organic food. Furthermore, Sweden and Bulgaria reported high organic shares of the total vegetable area.
Since 2004, when data on organic land use and crops was collected for the first time, the vegetable area increased by four-fold, from 105’000 hectares to the current 437’000 hectares. The major increase in 2016 is mainly due to a substantial increase of the vegetable area in Mexico.
A large part (120’000 hectares) is for fruit vegetables, followed by leafy and stalked vegetables (salads). For most countries, however, no crop details for the vegetable area are available.
The available data on the breakdown of the fully converted and in conversion area at least 50’000 hectares of a large part of the organic vegetable area is under conversion. Thus, it can be concluded that not a big increase of the organic vegetable supply can be expected.
1 FAOSTAT, the FAO Homepage, FAO, Rome at fao.org/faostat > Data > Crops > http://www.fao.org/faostat/en/#data/QC
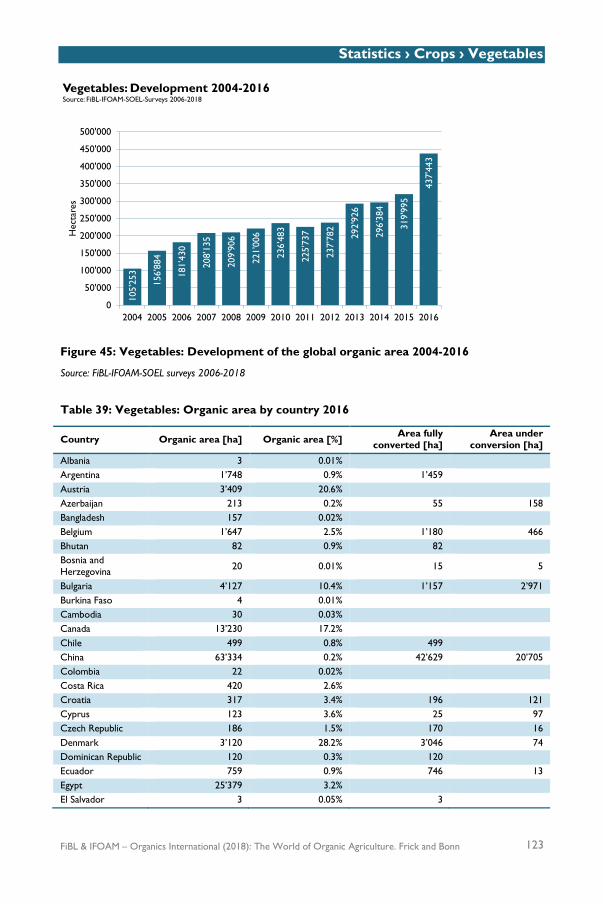
Statistics › Crops › Vegetables
FiBL & IFOAM – Organics International (2018): The World of Organic Agriculture. Frick and Bonn 123
Figure 45: Vegetables: Development of the global organic area 2004-2016
Source: FiBL-IFOAM-SOEL surveys 2006-2018
Table 39: Vegetables: Organic area by country 2016
Country Organic area [ha] Organic area [%] Area fully converted [ha]
Area under conversion [ha]
Albania 3 0.01%
Argentina 1’748 0.9% 1’459
Austria 3’409 20.6%
Azerbaijan 213 0.2% 55 158 Bangladesh 157 0.02%
Belgium 1’647 2.5% 1’180 466 Bhutan 82 0.9% 82
Bosnia and Herzegovina 20 0.01% 15 5
Bulgaria 4’127 10.4% 1’157 2’971 Burkina Faso 4 0.01%
Cambodia 30 0.03%
Canada 13’230 17.2%
Chile 499 0.8% 499
China 63’334 0.2% 42’629 20’705 Colombia 22 0.02% Costa Rica 420 2.6%
Croatia 317 3.4% 196 121 Cyprus 123 3.6% 25 97 Czech Republic 186 1.5% 170 16 Denmark 3’120 28.2% 3’046 74 Dominican Republic 120 0.3% 120
Ecuador 759 0.9% 746 13 Egypt 25’379 3.2%
El Salvador 3 0.05% 3
105'
253
156'
884
181'
430
208'
135
209'
906
221'
006
236'
483
225'
737
237'
782
292'
926
296'
384
319'
995
437'
443
0
50'000
100'000
150'000
200'000
250'000
300'000
350'000
400'000
450'000
500'000
2004 2005 2006 2007 2008 2009 2010 2011 2012 2013 2014 2015 2016
Hec
tare
s
Vegetables: Development 2004-2016Source: FiBL-IFOAM-SOEL-Surveys 2006-2018

Statistics › Crops › Vegetables
124 FiBL & IFOAM – Organics International (2018): The World of Organic Agriculture. Frick and Bonn
Country Organic area [ha] Organic area [%] Area fully converted [ha]
Area under conversion [ha]
Estonia 94 2.8% 82 12 Finland 197 1.7% 153 44 France 18’064 8.1% 16’650 1’414 French Guiana (France) 21 1.4% 17 4
Georgia 8 0.04% 8
Germany 12’399 8.4%
Greece 1’251 1.3% 1’049 202 Guadeloupe (France) 8 0.2% 4 4
Guatemala 565 0.5% 485 80 Hungary 2’765 5.3% 1’722 1’043 Iceland 13 34.5% 13
Indonesia 488 0.05% 488
Iran 179 0.03% 89 90 Iraq 51 0.04%
Ireland 283 4.2% 256 26 Israel 1’236 1.1% 1’204 32 Italy 43’648 8.6% 30’629 13’019 Jamaica 57 0.3% 56
Japan 1’326 0.4% 1’326
Jordan 11 0.03%
Kenya 4’786 2.7%
Kyrgyzstan 65 0.1% 40 24 Lao, P.D.R. 47 0.02%
Latvia 329 4.3% 239 90 Lebanon 42 0.1% Liechtenstein 15 - 15
Lithuania 135 1.3% 95 40 Luxembourg 43 57.3% 40 3 Macedonia, FYROM 81 0.2% 31 50 Madagascar 132 0.3% 132
Malta 5 0.1% 4 1 Martinique (France) 17 0.8% 15 2 Mauritius 13 0.2% 4 8 Mexico 97’149 13.2% 97’149
Moldova 109 0.3% 109
Montenegro 3 0.2% 2 1 Morocco 490 0.3% 440 50 Mozambique 1 0.001% 1
Myanmar 58 0.01% 58
Namibia 114 1.6% 103 11 Netherlands 6’792 7.4% 6’746 46 Nicaragua 1 0.02% 1
Norway 437 6.0% 376 61 Oman 16 0.1%
Palestine, State of 2 0.01% 2
Panama 209 1.9% 20
Paraguay 0.2 0.0004%
Peru 1’001 0.5%
Philippines 6 0.001% 6

Statistics › Crops › Vegetables
FiBL & IFOAM – Organics International (2018): The World of Organic Agriculture. Frick and Bonn 125
Country Organic area [ha] Organic area [%] Area fully converted [ha]
Area under conversion [ha]
Poland 8’071 4.1% 6’153 1’918 Portugal 1’790 3.3% 327 1’463 Republic of Korea 310 0.1%
Réunion (France) 131 2.2% 123 8 Romania 1’161 0.4% 803 358 Russian Federation 146 0.02% 137 5 Saudi Arabia 417 0.5% 354 63 Senegal 168 0.3% 43 125 Serbia 139 0.2% 100 39 Slovakia 278 3.7% 232 46 Slovenia 259 4.6% 225 34 South Africa 192 0.2% 148 37 Spain 17’013 4.9% 11’576 5’436 Sweden 1’860 10.6% 1’760 100 Switzerland 2’266 14.3%
Taiwan 2’439 1.8% 2’439
Thailand 735 0.2%
Tunisia 90 0.1%
Turkey 3’172 0.3% 1’907 1’265 Uganda 5’245 2.1%
Ukraine 6’000 1.2%
United Kingdom 6’318 5.8% 6’044 273 United States 64’461 7.5%
Viet Nam 192 0.02% Zambia 525 1.0% 225 300 Zimbabwe 352 1.1% 280 72 Total 437’443 0.7% 258’822 52’618
Source: FiBL survey 2018, based on information from the private sector, certifiers, and governments. For detailed data sources see annex, page 330


FiBL & IFOAM – Organics International (2018): The World of Organic Agriculture. Frick and Bonn 127
Commodity Case Studies

The State of Sustainable Markets
128 FiBL & IFOAM – Organics International (2018): The World of Organic Agriculture. Frick and Bonn
The State of Sustainable Markets: Statistics and Emerging Trends – 2017
JULIA LERNOUD,1 JASON POTTS,2 GREGORY SAMPSON,3 SALVADOR GARIBAY,4 MATTHEW LYNCH,5 VIVEK VOORA,6 HELGA WILLER7 AND JOSEPH WOZNIAK8
The “State of Sustainable Markets: Statistics and Emerging Trends – 2017” report (Lernoud et al. 2017) offers a snapshot of production-related data (area, production, and producers) for key global sustainability standards across eight commodity sectors (bananas, cocoa, coffee, cotton, palm oil, soybeans, sugarcane, and tea) and forestry. It also gives an overview of each of the 14 Voluntary Sustainability Standards (VSS) covered: 4C Association, Better Cotton Initiative (BCI), Bonsucro, Cotton Made in Africa (CmiA), GLOBALG.A.P., Fairtrade International, Forest Stewardship Council (FSC), IFOAM – Organics International, the Programme for the Endorsement of Forest Certification (PEFC), ProTerra Foundation, the Roundtable on Sustainable Palm Oil (RSPO), the Round Table on Responsible Soy (RTRS), Rainforest Alliance/Sustainable Agriculture Network (RA/SAN), and UTZ.
The report is the second product of a partnership between the Research Institute of Organic Agriculture (FiBL), the International Institute for Sustainable Development (IISD) and the International Trade Centre (ITC) funded by the Swiss State Secretariat for Economic Affairs (SECO). Currently, the data collection of the 2016 data is in progress.
Growth continues
All standards covered have experienced growth in their compliant areas since 2011, and currently at least 14 million hectares are certified according to these standards for eight selected crops (Figure 46).9 Better Cotton Initiative (BCI) underwent the greatest jump, with the certified area expanding almost nine-fold between 2011 and 2015. The Round Table on Responsible Soy (RTRS) area increased nearly five times over the same period, while those of Cotton Made in Africa (CmiA) and the Roundtable on
1 Julia Lernoud, Research Institute of Organic Agriculture (FiBL), Frick, Switzerland, www.fibl.org 2 Jason Potts, International Institute for Sustainable Development, Manitoba, Canada, www.iisd.org 3 Gregory Sampson, International Trade Centre, Geneva, Switzerland, www.intracen.org 4 Salvador Garibay, Research Institute of Organic Agriculture (FiBL), Frick, Switzerland, www.fibl.org 5 Matthew Lynch, International Institute for Sustainable Development, Manitoba, Canada, www.iisd.org 6 Vivek Voora, International Institute for Sustainable Development, Budapest, Hungary, www.iisd.org 7 Dr. Helga Willer, Research Institute of Organic Agriculture (FiBL), Frick, Switzerland, www.fibl.org 8 Joseph Wozniak, International Trade Centre, Geneva, Switzerland, www.intracen.org 9 2011 is the first year for which data is available for all voluntary sustainability standards covered in the report.

The State of Sustainable Markets
FiBL & IFOAM – Organics International (2018): The World of Organic Agriculture. Frick and Bonn 129
Sustainable Palm Oil (RSPO) trebled. Similarly, significant growth of their certified area was also reported by 4C and UTZ.
Figure 46: Development of the VSS compliant area worldwide, 2008-2015 (eight selected commodities, minimum possible)
Sources: FiBL-ITC-SSI survey 2017: 4C 2014, 2015 and 2016; Better Cotton Initiative 2014, 2015 and 2017; Bonsucro 2014, 2015 and 2016; Cotton Made in Africa 2014, 2015 and 2016; Fairtrade International 2017; GLOBALG.A.P. 2015 and 2016; FiBL survey 2017; ProTerra Foundation 2014, 2015 and 2016; Rainforest Alliance/SAN 2014, 2015 and 2016; Roundtable of Sustainable Palm Oil 2014, 2015 and 2016; Round Table for Responsible Soy 2014, 2015 and 2016; UTZ 2014, 2015 and 2016 For purposes of the figure, it is assumed that there is a maximum amount of multiple certification occurring within each commodity, corresponding to the minimum VSS-compliant area per commodity. Therefore, the VSS-compliant area shown in this figure corresponds to the VSS with the largest compliant area operating within a given sector.
Looking at individual agricultural sectors, the certified area for cotton experienced the highest growth rate, increasing at least threefold between 2011 and 2015.1 This was followed by bananas, which almost trebled in area, and tea, which more than doubled over the period. Between 2014 and 2015, soybeans grew the most (48 percent), followed by cotton (46 percent) and tea (25 percent).
Standards are expanding their agricultural land coverage
In 2015, more than 50.2 million hectares were organic certified, representing 1.1 percent of all agricultural land worldwide. Organic is the biggest sustainability standard in terms of area, and it is the one with the largest variety of agricultural products. RSPO certified almost 3.5 million hectares, of which 2.8 million hectares 1 These growth rates are calculated by taking the minimum area possible as the reference. Therefore, the total VSS-compliant area corresponds to the VSS with the largest compliant area operating within a given sector.

The State of Sustainable Markets
130 FiBL & IFOAM – Organics International (2018): The World of Organic Agriculture. Frick and Bonn
were cultivated, making it the standard with the second-largest area, representing 0.07 percent of the global agricultural area.
Figure 47: Total certified area per VSS, 2015 (only agriculture)
Sources: FiBL-ITC-SSI survey 2017: 4C 2016; Better Cotton Initiative (BCI) 2017; Bonsucro 2016; Cotton Made in Africa (CmiA) 2016; Fairtrade International 2017; GLOBALG.A.P. 2016; FiBL survey 2017; ProTerra Foundation 2016; Rainforest Alliance/SAN (RA/SAN) 2016; Roundtable of Sustainable Palm Oil (RSPO) 2016; Round Table for Responsible Soy (RTRS) 2016; UTZ 2016:
Sector-specific highlights1
In the following section we present an overview of the key statistics for each of the selected sectors (bananas, cocoa, coffee, cotton, palm oil, soy, sugarcane, tea, and forestry products). There is little information available from on multiple certification,2 and it has thus been decided to provide the minimum possible area of production, assuming that everything is 100 percent multiple-certified, and the maximum possible (no multiple certification), along with the average between both.
1 Please note that the organic area is the area harvested estimated by FiBL, assuming that 90 percent of the fully converted area is actually harvested. This was done in order to make the organic data comparable with the data of the other VSS, which reported data on the harvested area. For the Rainforest Alliance/SAN, the area cultivated is shown. 2 Multiple certification: It should be noted that many of the areas certified by VSS are multiple-certified. In our survey, we asked for the extent of multiple certification by country and VSS. The maximum would be the sum of the total area/production provided by the individual VSSs, and the minimum would be the area of the VSS with the largest area. An average between the maximum and minimum area gives us an estimate of the possible certified area for a given commodity.
0.720.910.981.591.812.132.222.482.903.113.46
50.28
0 20 40 60
RTRSBonsucro
CmiA4C
ProTerraUTZBCI
FairtradeRA/SAN
Global GAPRSPO
Organic
Million hectares
Total certified area per VSS 2015Source: FiBL-IISD-ITC survey 2017

The State of Sustainable Markets
FiBL & IFOAM – Organics International (2018): The World of Organic Agriculture. Frick and Bonn 131
• Bananas: Four of the VSS – Fairtrade International, GLOBALG.A.P., Organic and Rainforest Alliance/SAN (RA/SAN) – certified banana production in 2015. Combined, they certified a minimum of 290’000 hectares and a maximum of 451’000 (for an average of 371’000 hectares). In terms of the proportion of the VSS-certified area of the global banana area, the minimum represents 5.4 percent, the maximum 8.4 percent, and the average, 6.9 percent. With more than 248’000 hectares, GLOBALG.A.P. had by far the largest VSS-certified banana area in 2015; the area with the highest growth (42 percent) in 2012–2015 was that of RA/SAN. (See also chapter on tropical and subtropical fruits, page 110).
• Cocoa: Four of the standards – Fairtrade International, Organic, RA/SAN and UTZ – certified cocoa production. Combined, they certified a minimum of 1.7 million hectares and a maximum of 3.1 million hectares in 2015 (an average of 2.4 million hectares). In terms of the proportion of the VSS-certified area of the global cocoa area, the minimum represents 16.2 percent, the maximum 29.8 percent, and the average, 23.0 percent. UTZ reported the largest VSS-certified cocoa area (1.5 million hectares), while the RA/SAN area grew the fastest (five-fold between 2011 and 2015). (See also chapter on organic cocoa, page 99).
• Coffee: Five of the standards combined – 4C, Fairtrade International, Organic, RA/SAN and UTZ - certified coffee production – certified a minimum of 2.6 million hectares and a maximum of 4.6 million hectares in 2015 (average: 3.6 million hectares). In terms of the proportion of the VSS-certified area of the global coffee area, the minimum represents 24.8 percent, the maximum 44.3 percent, and the average, 34.5 percent. 4C had the largest VSS-certified coffee area, 1.6 million hectares, and registered the largest growth in area (a three-fold increase between 2011 and 2015). (See also chapter on organic coffee, page 101).
• Cotton: Four of the standards – BCI, CmiA, Fairtrade International and Organic – certified cotton production. Combined, they certified a minimum of 3.2 million hectares and a maximum of 3.6 million hectares in 2015 (average: 3.4 million hectares). In terms of the proportion of the VSS-certified area of the global cotton area, the minimum represents 9.1 percent, the maximum 10.3 percent, and the average, 9.7 percent. BCI had the largest VSS-certified cotton area (2.2 million hectares) and showed the largest growth, a nine-fold increase (2011–2015). (See also chapter on organic cotton, page 137).
• Oil palm: Three of the standards – Organic, RA/SAN and RSPO – certified oil palm production. Combined, they certified a minimum of 2’784’000 hectares and a maximum of almost 2’828’000 hectares in 2015 (average: 2’806’000 hectares). In terms of the proportion of the VSS-certified area of the global oil palm area, the minimum represents 14.9 percent, the maximum 15.1 percent, and the average, 15 percent. RSPO had the largest VSS-certified oil palm area (3.5 million hectares), while RA/SAN showed the largest growth: 36 percent between 2013 and 2015.

The State of Sustainable Markets
132 FiBL & IFOAM – Organics International (2018): The World of Organic Agriculture. Frick and Bonn
• Soy: Three of the standards – Organic, ProTerra Foundation and RTRS – certified soybean production. Combined, they certified a minimum of 2.5 million hectares and a maximum of almost 3.1 million hectares in 2015 (average: 2.8 million hectares). In terms of the proportion of the VSS-certified area of the global soybean area, the minimum represents 2.2 percent, the maximum 2.6 percent, and the average, 2.4 percent. With 1.8 million hectares, ProTerra Foundation had the largest VSS-certified soybean area; the largest growth (a five-fold increase in 2011–2015) was noted for RTRS. (See also chapter on organic oilseeds, page 116).
• Sugarcane: Three of the standards – Bonsucro, Fairtrade International and Organic – certified sugarcane production. Combined, they certified a minimum of 1.1 million hectares and a maximum of 1.2 million hectares in 2015. In terms of the proportion of the VSS-certified area of the global sugarcane area, the average represents 4.3 percent. With 0.9 million hectares, Bonsucro had the largest VSS-certified sugarcane area; the largest growth was noted for Fairtrade International, whose area doubled between 2011 and 2015.
• Tea: Four of the standards – Fairtrade International, Organic, RA/SAN and UTZ – certified tea production. Combined, they certified a minimum of more than 538’000 hectares and a maximum of 717’000 hectares in 2015 (average: 628’000 hectares). In terms of the proportion of the VSS-certified area of the global tea area, the average represents 16.5 percent. RA/SAN had the largest VSS-certified tea area, almost 0.5 million hectares, and showed the largest growth in area, a four-fold increase between 2011 and 2015.
• Forestry: In 2015, an estimated 396 million hectares of certified forest were reported, representing almost 10 percent of the global forest area. There is an estimated certification overlap in the forestry sector of 15 percent between FSC and PEFC.
More information › The State of Sustainability Initiatives website: www.iisd.org/ssi/ › FiBL’s online database on organic agriculture worldwide: www.organic-world.net › ITC online database on Voluntary Sustainability Standards: www.standardsmap.org › FiBL’s VSS website: www.vss.fibl.org/de/vss.html
References Lernoud, Julia, Jason Potts, Gregory Sampson, Salvador Garibay, Matthew Lynch, Vivek Voora, Helga Willer
and Joseph Wozniak (2017), The State of Sustainable Markets – Statistics and Emerging Trends 2017. ITC, Geneva.
Potts, Jason; Lynch, Matthew; Wilkings, Ann; Huppé, Gabriel; Cunningham, Maxine and Voora, Vivek (Eds.) (2014): The State of Sustainability Initiatives Review 2014. Standards and the Green Economy. 1st edition. International Institute for Sustainable Development (IISD) and International Institute for Environment and Development (IIED), Winnipeg and London.

The State of Sustainable Markets
FiBL & IFOAM – Organics International (2018): The World of Organic Agriculture. Frick and Bonn 133
Figure 48: Bananas: Development of the area by VSS, 2008–2015
Source: Fairtrade International, 2017; GLOBALG.A.P., 2015 and 2016; FiBL, 2017; Rainforest Alliance/SAN, 2014, 2015, and 2016
Figure 49: Cocoa: Development of the area by VSS 2008–2015
Sources: Fairtrade International, 2017; FiBL, 2017; Rainforest Alliance/SAN, 2014, 2015, and 2016; UTZ, 2014, 2015, and 2016

The State of Sustainable Markets
134 FiBL & IFOAM – Organics International (2018): The World of Organic Agriculture. Frick and Bonn
Figure 50: Coffee: Development of the area by VSS, 2008–2015
Sources: 4C Association, 2014, 2015, and 2016; Fairtrade International, 2017; FiBL, 2017; Rainforest Alliance/SAN, 2014, 2015, and 2016; UTZ, 2014, 2015, and 2016
Figure 51: Cotton: Development of the area by VSS, 2008–2015
Sources: Better Cotton Initiative, 2014, 2015, and 2016; Cotton Made in Africa, 2014, 2015, and 2016; Fairtrade International, 2017; Textile Exchange, 2014, 2015, and 2016

The State of Sustainable Markets
FiBL & IFOAM – Organics International (2018): The World of Organic Agriculture. Frick and Bonn 135
Figure 52: Oil palm: Development of the area by VSS, 2008–2015
Sources: FiBL, 2017; Rainforest Alliance/SAN, 2015 and 2016; Roundtable on Sustainable Palm Oil (RSPO), 2014, 2015, and 2016
Figure 53: Soybeans: Development of the area by VSS, 2008–2015
Sources: FiBL, 2017; ProTerra Foundation, 2015 and 2016; Round Table on Responsible Soy (RTRS), 2014, 2015, and 2016

The State of Sustainable Markets
136 FiBL & IFOAM – Organics International (2018): The World of Organic Agriculture. Frick and Bonn
Figure 54: Sugarcane: Development of the area by VSS, 2008–2015
Sources: Bonsucro, 2014, 2015, and 2016; Fairtrade International, 2017; FiBL, 2017
Figure 55: Tea: Development of the area by VSS, 2008–2015
Sources: Fairtrade International, 2017; FiBL, 2015; Rainforest Alliance/SAN, 2014, 2015, and 2016; UTZ, 2014, 2015, and 2016

Organic Cotton
FiBL & IFOAM – Organics International (2018): The World of Organic Agriculture. Frick and Bonn 137
Organic Cotton1
LIESL TRUSCOTT,2 EVONNE TAN,3 LISA EMBERSON4, NICOLE LAMBERT,5 AND AMISH GOSAI6
Global Trends
In the 2015/16 growing season7, 107’980 metric tons of organic cotton fibre were produced globally by 219’947 farmers on 302’562 hectares of land. This represents a 4 percent decrease in global fibre production compared to the previous year. At the same time, a total of 262’975 hectares of cotton growing land were in conversion to organic, indicating new and continued interest in organic cotton.
Certified organic cotton was grown in 18 countries in 2015/16, though 97 percent of global supply came from just seven countries (India, China, Kyrgyzstan, Turkey, Tajikistan, the United States and Tanzania). India remained by far the largest producer, though its share of the global total dropped from 67 percent to 56 percent, as organic farmers continued to move away from cotton in favour of more lucrative crops. This global trend was partly offset by significant growth in Central Asia in response to demand from Turkish mills and the wider European market.
Figure 56 illustrates the global trend in organic cotton production over the past elven years. Between 2004/05 and 2009/10, growth in production was nine-fold, as interest in more sustainable textile production accelerated.
However, in 2010/11, in connection with the financial crisis, production fell significantly and is yet to make a full recovery. Many factors contribute to the no-growth/low-growth scenario that organic cotton is experiencing, but primary causes include: difficulty sourcing good quality, non-GMO seed; the continued complexities of supply chain management; volatile and uncertain cotton prices and trade
1 This article is a condensed version of the Organic Cotton Market Report 2017 produced by Liesl Truscott, Evonne Tan, Lisa Emberson, Nicole Lambert and Amish Gosai, with production data collected by the following Textile Exchange Regional Ambassadors: Atila Ertem (Turkey and Central Asia), Amish Gosai (India), Silvio Moraes (Latin America), Leonard Mtama (East Africa), Silvère Tovignan (West Africa), Lazare Yombi (West Africa), and Allen You (China). More information about Textile Exchange’s 2017 Market Reports is available here: www.textileexchange.org/2017-market-reports More information about Textile Exchange is available here: www.textileexchange.org More information about organic cotton is available here: www.aboutorganiccotton.org 2 Liesl Truscott, Materials Strategy Director, Textile Exchange, Bath, UK 3 Evonne Tan, Data Management & China Strategy Director, Textile Exchange, Kuala Lumper, Malaysia 4 Lisa Emberson, Materials Platform Coordinator, Textile Exchange, London, UK 5 Nicole Lambert, Data Manager, Textile Exchange, Paris, France 6 Amish Gosai, Country Program Manager for India, Textile Exchange, Bangalore, India 7 The International Cotton Advisory Council (ICAC) set the cotton-growing year from August, 1 to July, 31.
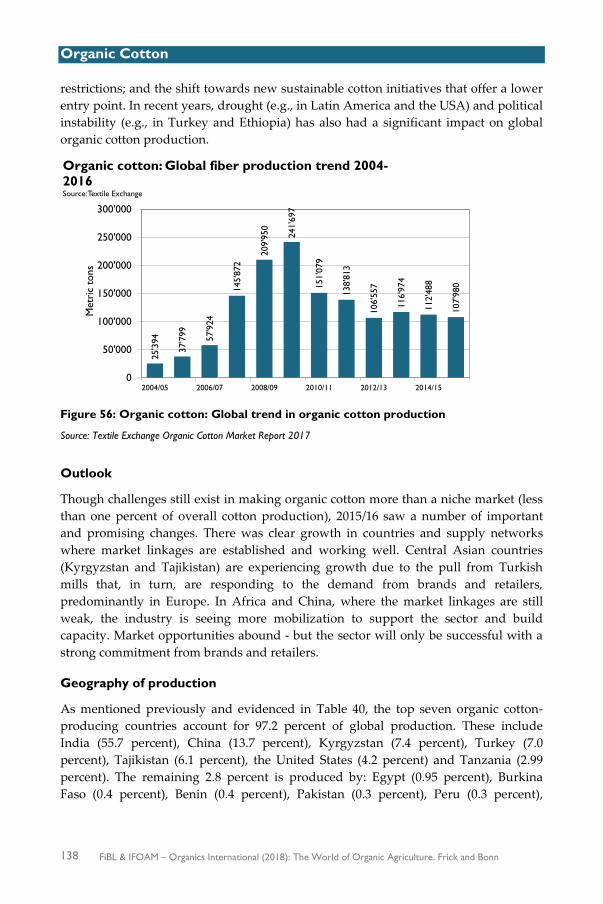
Organic Cotton
138 FiBL & IFOAM – Organics International (2018): The World of Organic Agriculture. Frick and Bonn
restrictions; and the shift towards new sustainable cotton initiatives that offer a lower entry point. In recent years, drought (e.g., in Latin America and the USA) and political instability (e.g., in Turkey and Ethiopia) has also had a significant impact on global organic cotton production.
Figure 56: Organic cotton: Global trend in organic cotton production
Source: Textile Exchange Organic Cotton Market Report 2017
Outlook
Though challenges still exist in making organic cotton more than a niche market (less than one percent of overall cotton production), 2015/16 saw a number of important and promising changes. There was clear growth in countries and supply networks where market linkages are established and working well. Central Asian countries (Kyrgyzstan and Tajikistan) are experiencing growth due to the pull from Turkish mills that, in turn, are responding to the demand from brands and retailers, predominantly in Europe. In Africa and China, where the market linkages are still weak, the industry is seeing more mobilization to support the sector and build capacity. Market opportunities abound - but the sector will only be successful with a strong commitment from brands and retailers.
Geography of production
As mentioned previously and evidenced in Table 40, the top seven organic cotton-producing countries account for 97.2 percent of global production. These include India (55.7 percent), China (13.7 percent), Kyrgyzstan (7.4 percent), Turkey (7.0 percent), Tajikistan (6.1 percent), the United States (4.2 percent) and Tanzania (2.99 percent). The remaining 2.8 percent is produced by: Egypt (0.95 percent), Burkina Faso (0.4 percent), Benin (0.4 percent), Pakistan (0.3 percent), Peru (0.3 percent),
25'3
94
37'7
99 57'9
24
145'
872
209'
950
241'
697
151'
079
138'
813
106'
557
116'
974
112'
488
107'
980
0
50'000
100'000
150'000
200'000
250'000
300'000
2004/05 2006/07 2008/09 2010/11 2012/13 2014/15
Met
ric
tons
Organic cotton: Global fiber production trend 2004-2016Source: Textile Exchange

Organic Cotton
FiBL & IFOAM – Organics International (2018): The World of Organic Agriculture. Frick and Bonn 139
Uganda (0.3 percent), Mali (0.1 percent), Brazil (0.02 percent), Israel (0.01 percent), Thailand (0.003 percent), and Senegal (0.001 percent).
Table 40: Organic cotton farmers, area and production 2015/2016
Country/ Region No of farmers
Certified organic
land area [ha]*
Prod. of organic
seed cotton
[MT]
Prod. of organic cotton
fibre [MT]
Share of global
organic fibre prod.
[%]
Total in-conversio
n land area [ha]
Benin 2’237 2’507 972 407 0.38% 48 Burkina Faso 8’382 4’928 1’170 469 0.43% - Mali 1’213 1’970 326 136 0.13% - Tanzania 4’244 64’084 8’233 3’229 2.99% 10’316 Uganda 6’000 2’428 750 300 0.28% - Senegal 169 66 2 1 0.00% - Africa total 22’245 75’983 11’453 4’542 4.21% 10’364 China total 3’043 9’653 34’803 14’817 13.72% 27’477 Brazil 232 680 48 17 0.02% 122 Peru 141 337 824 312 0.29% 85 Latin America total 373 1’017 872 329 0.30% 207 Egypt 584 581 2’622 1’023 0.95% - Israel 1 100 44 14 0.01% - Kyrgyzstan 119 5’616 20’508 7’981 7.39% - Tajikistan 1’121 7’013 18’049 6’620 6.13% - Turkey 185 3’733 18’942 7’577 7.02% 2’426 Turkey, Egypt & Central Asia total 2’010 17’043 60’165 23’214 21.50% 2’426
India 192’148 189’364 176’544 60’184 55.74% 221’548 Pakistan 2 1’056 1’110 366 0.34% 457 Thailand 66 76 8 3 0.00% - South Asia total 192’216 190’496 177’662 60’553 56.08% 222’005 United States total 60 8’369 12’927 4’524 4.19% 496 Total 219’947 302’562 297’882 107’980 100% 262’975
Source: Textile Exchange Organic Cotton Market Report 2017 *NOTE: The land area figures reported by Textile Exchange refer to land certified to an organic standard by a producer group growing organic cotton. However, the same piece of land can be, and increasingly is being used to grow other organic crops in addition to cotton. Crop rotation is fundamental to organic agriculture but, with the low and falling cotton price in recent years, more and more farmers are moving away from cotton to grow other crops, such as marigold in India, which can fetch a higher price on the market. This means that reported land area figures do not necessarily reflect the land area used to grow only organic cotton, and may, therefore, seem disproportionately high compared to the organic cotton volumes harvested.

Organic Cotton
140 FiBL & IFOAM – Organics International (2018): The World of Organic Agriculture. Frick and Bonn
Africa
In West Africa, organic cotton land area and farmer numbers remained relatively unchanged from the previous year, but fibre production volumes decreased by 49 percent. This is due to a combination of factors, but primarily late rainfall in all four producing countries (Benin, Burkina Faso, Mali, and Senegal). It is expected that production will increase again in 2016/17.
In East Africa, fibre volumes increased, as Tanzania’s production somewhat (but not fully) recovered from the impact of poor rains the previous year, while Uganda’s producers experienced a yield increase and a 14 percent growth in production despite suffering from drought.
China
China’s organic market has been growing dynamically1 and, as a result, the country’s production of organic cotton rose 14 percent in 2015/16. While production for the textile market has remained relatively stable over the past year, growth in the Chinese organic dairy market has boosted demand for organic cottonseed. A number of farms have been set up for this purpose (i.e., to supply the organic dairy market with organic feed/cottonseed cake), and, for this reason, while there is an increase of organic cotton in China, a proportion of it is not entering the textile market.
Latin America
The organic cotton harvest in Latin America remained heavily affected by unfavourable climatic conditions in 2015/16 and, combined with a poor economic situation, the region’s overall organic cotton production declined. Paraguay, Nicaragua, and Colombia are yet to resume production after being severely impacted by these same trends the previous year. Peru, the region’s most significant producer, saw a decrease of 44 percent in 2015/16, while Brazil saw a production fall of 24 percent.
However, the region’s climate is forecast to normalize in the coming years, giving hope for a new cycle of regular rains. At the same time, 2015/16 saw the development of a number of new initiatives focused around organic cotton that signal growing interest from the sector in boosting the region’s production.
South Asia
Organic cotton producing countries in Southern Asia currently include India, Pakistan, and Thailand. India remains by far the largest producer, not only in the region but also globally, although its share of the global total dropped from 67 to 56 percent between 2014/15 and 2015/16. This is largely a result of farmers acting in
1 Heinze, Karin (2017): China – one of the top 4 organic markets worldwide. The Organic-market.info website, bio verlag, Aschaffenburg, Germany. Available at organic-market.info/news-in-brief-and-reports-article/china-one-of-the-top-4-organic-markets-worldwide.html

Organic Cotton
FiBL & IFOAM – Organics International (2018): The World of Organic Agriculture. Frick and Bonn 141
response to the market - staying in organic but growing a higher proportion of grains, vegetables, and flowers, which currently provide a better return than cotton.
At the same time, India’s total in-conversion land area grew 192 percent. This is partly a result of stronger audit procedures from certification bodies resulting in some previously certified organic cotton land returning to in-conversion status while issues such as contamination from genetically modified (GMO) sources are managed. There is a big drive to tackle the root causes of these issues in India, and there are a number of initiatives joining Textile Exchange’s Organic Cotton Round Table, such as the Rural Advancement Foundation (RAFI), the Organic Cotton Accelerator, Global Organic Textile Standard (GOTS) and others, galvanizing to help find solutions. For further reading on the complex situation of GMO contamination in organic cotton, please see the briefing1 published by Textile Exchange and RAFI.
In Pakistan, there is currently one certified organic farm project producing organic cotton. However, there are a number of new activities in the pipeline. In Thailand, organic cotton is produced only by a small number of Laotian-ethnic farmers living along the western side of the Mekong River.
Turkey, Egypt and Central Asia
In the coming years, it is estimated that this region will become an increasingly important player in global organic cotton production. However, Turkey’s share of the region’s total production may decline due to the recent trend of organic production, not only cotton, shifting from Turkey to Central Asia (primarily Kyrgyzstan and Tajikistan). Cotton prices and agricultural policies adopted in Turkey will play a key role in determining the extent to which this trend continues.
Turkey’s total production increased slightly in 2015/16, but there has been a lot of fluctuation over the last three years in terms of both the number and geography of producers, as well as production area and volumes. In Kyrgyzstan, production now matches that of Turkey, and it is expected to grow even further in the coming years. Tajikistan’s total production also spiked in 2015/16, as a large new producer came on board. In Egypt, production decreased, as a number of producers ceased growing organic cotton. However, Egypt’s organic cotton sector is well established, with the Government-supported “Cotton For Life” program joining the well-established biodynamic farmers who grow cotton for the Egyptian food, pharmaceuticals, and textiles company SEKEM.
1 RAFI and Textile exchange (2017): A Call to Action: Addressing the “Bigger Picture” of GMO Contamination and Other Challenges in the Organic Cotton Supply Chain. The Textile Exchange Website, Textile Exchange, Washington D.C. Available at http://textileexchange.org/wp-content/uploads/2017/11/RAFI_Textile_Exchange_GMOs_and_Organic_Cotton.pdf

Organic Cotton
142 FiBL & IFOAM – Organics International (2018): The World of Organic Agriculture. Frick and Bonn
United States
In 2016, the United States (US) witnessed robust organic cotton production, with an increasing number of farmers growing an increasing amount of organic cotton acreage, while market demand also grew.
In total, 8’369 hectares were planted with organic cotton in 2016, 96 percent of which was upland cotton. This yielded 4’524 metric tons of fibre. Texas Organic Cotton Market Cooperative (TOCMC) continued to be by far the largest producer of organic cotton in the United State, with its farmers growing 83 percent of the country’s total. It is estimated that, in 2016, the United States had 60 organic cotton farmers spread between North Carolina, New Mexico, and Texas, 35 of whom were members of TOCMC.
Organic Farm and Textile Standards
Organic cotton must be grown and certified to a standard approved in the IFOAM Family of Standards,1 which allows multilateral equivalence between organic standards and technical regulations.
Textile Exchange’s Organic Content Standard (OCS) is a chain of custody standard that verifies that the organic fibre in a product has been grown to an IFOAM-recognized organic farm standard. The Global Organic Textile Standard (GOTS) is the leading textile processing standard for organic fibres, including ecological and social criteria, backed up by independent certification of the entire textile supply chain.
Textile Exchange and Global Organic Textile Standard (GOTS) are working together to develop a Central Database that will further improve the effectiveness of supply chain certification. In addition, both standards now require risk-based testing for GMO contamination, which will add rigor to the overall certification process.
In 2016, there were 3’661 and 4’642 facilities certified to OCS and GOTS, respectively. After a nominal decrease of one percent in 2015, OCS rebounded with double-digit growth of 21 percent in 2016, whilst facilities certified by GOTS grew by 17 percent. Most of this increase is coming from India (OCS and GOTS), Bangladesh (OCS), China (OCS) and Turkey (GOTS).
1 IFOAM – Organics International (2017): IFOAM Family of Standards. The website of IFOAM – Organics International, Bonn, Germany. Available at https://www.ifoam.bio/en/organic-landmarks/ifoam-family-standards

Organic Cotton
FiBL & IFOAM – Organics International (2018): The World of Organic Agriculture. Frick and Bonn 143
Figure 57: Growth of GOTS and OCS certified facilities 2013-2016
Source: Textile Exchange Organic Cotton Market Report 2017
Conclusion
2016/17 continued to present significant challenges for the organic cotton community. Despite production volumes declining slightly, Textile Exchange believes there is growth and development in how the textile industry is engaging with the opportunities represented by organic agriculture. A shift in the discussion to regenerative (organic) agriculture and “Organic 3.0”, a deeper commitment to transparency, the rise of the Sustainable Development Goals, and the trialling of new and innovative business models designed to better reward and incentivize organic cotton farmers for their contribution to sustainability, are all evidence that times are changing.
Further reading Textile Exchange (2017): Organic Cotton Market Report 2017. Textile Exchange, Lubbock. Available at
http://textileexchange.org/downloads/2017-organic-cotton-market-report/ Textile Exchange and Kering (2017): A World Beyond Certification: A Best Practices Guide For Organic
Cotton Trade Models. Available at http://textileexchange.org/kering-textile-exchange-release-organic-cotton-guides/
Textile Exchange and Kering (2017): Organic Cotton: A Fiber Classification Guide. Available at http://textileexchange.org/kering-textile-exchange-release-organic-cotton-guides/
Textile Exchange’s Organic Cotton Round Table: http://textileexchange.org/organic-cotton-round-table/
2'516
3'170 3'126
3'661
0
500
1'000
1'500
2'000
2'500
3'000
3'500
4'000
4'500
2013 2014 2015 2016
Num
ber
offa
cilit
ies
Growth of GOTS certifiedfacilities 2013-2016Source: Textile Exchange
3'085
3'663 3'8144'104
0
500
1'000
1'500
2'000
2'500
3'000
3'500
4'000
4'500
2013 2014 2015 2016
Num
ber
offa
cilit
ies
Growth of OCS certifiedfacilities 2013-2016Source: Textile Exchange


FiBL & IFOAM – Organics International (2018): The World of Organic Agriculture. Frick and Bonn 145
Global Market

Global Market for Organic Food
146 FiBL & IFOAM – Organics International (2018): The World of Organic Agriculture. Frick and Bonn
The Global Market for Organic Food & Drink1
AMARJIT SAHOTA2
Introduction
The global market for organic foods increased by roughly 10 percent to 89.7 billion US dollars3 in 2016. All regions reported healthy growth in 2016, however North America and Europe continue as the twin engines of growth; the two regions generate about 90 percent of international sales. The market share of organic foods in the two leading country markets (United States, Germany) has reached 5 percent. It remains below 1 percent in almost all countries outside Europe and North America.4
North America
The North American market for organic foods was valued at 46.3 billion US dollars in 2016. Most sales are from the United States market, worth 43 billion US dollars.
The United States has the largest organic products market in the world. The market share of total food products is also high, at 5.3 percent. Fruit and vegetables have the highest market share, comprising almost 15 percent of fresh produce sales. Milk and dairy is the second largest category.
Demand for organic foods continues to outpace supply, with organic products imported into the United States from every continent. Imports of organic products are being facilitated by organic trade arrangements between the United States and various countries, such as Switzerland, Canada, Japan, South Korea, Taiwan, as well as the European Union.
Conventional grocery channels comprise most organic food sales in the region. All leading food retailers are marketing organic foods under their private labels. O
1 This chapter has been prepared according to ongoing research by Ecovia Intelligence (formerly known as Organic Monitor) on the ‘The Global Market for Organic Food & Drink’. No part of this chapter maybe reproduced or used in other commercial publications without written consent from Ecovia Intelligence. To request permission, write to: Ecovia Intelligence 20B The Mall, London W5 2PJ Tel. +44 20 8567 0788 Email: [email protected] 2 Amarjit Sahota, Ecovia Intelligence, London UK, http://www.ecoviaint.com/ Amarjit Sahota is the president of Ecovia Intelligence (formerly Organic Monitor), a specialist research, consulting & training firm that focuses on global sustainable product industries. More details are available at www.ecoviaint.com 3 According to the Central European Bank, I euro corresponded to 1.1069 US dollars in 2016. 4 Please note that due to differences in the methodology, some of the figures presented in this chapter differ from those collected in the framework of the FiBL survey.

Global Market for Organic Food
FiBL & IFOAM – Organics International (2018): The World of Organic Agriculture. Frick and Bonn 147
Organics (Safeway) and PC Organics (Loblaws) are the leading private labels for organic foods in the United States and Canada respectively.
The organic food industry continues to attract investment. Whole Foods Market, the leading natural and organic food retailer, was acquired by Amazon for 13.7 billion US dollars in June 2017. Within a few months, prices of many organic items were slashed as the online retailer plans to online retailer plans to make organic foods more accessible to American consumers. The previous year, the French multinational Danone acquired Whitewave Foods, the largest organic food enterprise in North America, for 12.5 billion US dollars.
Europe
The European market for organic products was worth 35 billion US dollars in 2016. Some countries, such as France and Sweden, reported double-digit growth rates.
Organic food sales are concentrated in Western Europe. Germany has the largest market, valued at 10.4 billion US dollars, followed by the French market (7.8 billion US dollars).1 The next largest markets are in the Italy, the United Kingdom, Switzerland and Sweden. Central and Eastern European (CEE) countries, such as Poland, Ukraine and Hungary, are becoming important producers of organic crops. However, they have relatively small markets for organic products.
The market share of organic foods of total food sales varies considerably between countries. As shown in this book, the highest market shares and biggest consumers of organic foods are in Scandinavian and Alpine countries (page 67 and page 242). In Denmark, organic products comprise almost 10 percent of total food sales. In many Central Eastern European countries, the market share is below 1 percent.
Mainstream retailers generate most organic food sales in Europe. All leading supermarkets are offering organic foods under their private labels. In Germany (the largest country market), supermarkets, drugstores, discounters, and organic food shops have developed private label ranges.
A large network of organic food shops characterises the European market. Most chained outlets are in Germany, France and Italy. The organic food company Dennree operates over 250 Denn’s Bio organic supermarkets in Germany and Austria. The Biocoop chain has over 430 organic food shops in France, whilst there are over 200 CuoreBio stores in Italy.
Other regions
Organic food sales in Asia, Australasia, and other regions amounted to about 8.1 billion US dollars in 2016. 1 Please note that due to differences in the methodology, some of the figures presented in this chapter differ from those collected in the framework of the FiBL survey.

Global Market for Organic Food
148 FiBL & IFOAM – Organics International (2018): The World of Organic Agriculture. Frick and Bonn
Asia has a large and expanding market for organic products. Most developments are in China and India, whereas sales have traditionally mainly been from Japan and South Korea. Organic food sales are rising in China and India partly because of growing consumer affluence stimulating demand for organic products. The spate of food scares in Asia has had a major influence. The Chinese market has shown accelerated growth partly because the country has experienced a number of food scandals; these include selling rotten meat, sewage oil in food products, contaminated pork and beef, as well as numerous incidents of adulteration and counterfeiting. The biggest food scandal was in 2008 when the industrial chemical melamine was discovered in infant formula and dairy products.
Brazil has the largest market for organic products in Latin America. The Brazilian market has shown sluggish growth in recent years because of the political and economic crises. Other Latin American countries, such as Argentina, Peru, Chile, and Colombia, have largely export-oriented organic food markets.
Australia has a large and growing market for organic products. Distribution of organic foods is increasing in supermarkets and major food retailers. Producers in Australia and New Zealand have a high export focus, with many targeting Asian countries.
The organic consumer
A large number of studies have investigated consumer behaviour towards organic food purchases. The broad factors behind consumer purchases of organic foods are health, environment, and food safety & quality.
Health issues are the main motive in most countries. Excessive exposure to pesticides is linked to a number of diseases, influencing the reproductive and nervous systems, as well as cancer. The over-use of antibiotics and growth hormones in livestock products is also linked to various health conditions. A study by the Hartman Group showed that 68 percent of people in the United States associate organic foods with absence of pesticides, whilst 64 percent associate them with absence of herbicides, and 63 percent with absence of growth hormones.
Concerns about genetically modified organisms (GMOs) are a major influence on North American purchases of organic foods. The Non-GMO Project is the fastest growing eco-label in North America, present on about 43’000 products and with retail sales of 22.3 billion US dollars.
Environmental concerns are an important factor for many consumers. A study by Statista found that most German consumers buy organic foods because they believe organic farming is less polluting of the environment. Another study by AgenceBio showed that 58 percent of French consumers buy these products because of their perceived lower environmental impact.

Global Market for Organic Food
FiBL & IFOAM – Organics International (2018): The World of Organic Agriculture. Frick and Bonn 149
Food safety and quality are an important motive in some countries, especially in China, which has experienced a number of food scandals. Health scares, such as SARS and avian flu, have also made consumers more aware of health issues and nutrition.
Although the actual motives for buying organic foods vary, a picture of the global organic consumer is emerging. The organic food consumer typically lives in a major city, has high disposable income and is discerning when buying food products. Most consumers are women and / or young parents.
Challenges & growth outlook
Organic food and drink sales have increased from less than 15 billion US dollars to almost 90 billion US dollars over two decades. Although the positive trajectory is likely to continue, there remain challenges on the horizon.
Figure 58: Growth in organic food & drinks sales and farmland, 2001-2016
Note: All figures are rounded Source: The Global Market for Organic Food & Drink (Ecovia Intelligence)
Demand concentration is the first challenge. With almost 180 countries involved in producing organic crops, production has become global. However, about 90 percent of organic food and drink sales are from North America and Europe. In many parts of Africa, Asia and Latin America, organic foods are produced exclusively for export markets. Even in Australia and New Zealand, many organic food producers have a high export orientation. There needs to be more regional – if not local – markets for organic products for the industry to more sustainable.
Another challenge is standards, the number of which is proliferating in the organic food industry. Although Europe and North America (United States and Canada) have entered trade agreements / equivalency agreements, producers outside these two “trading blocs” have to consider multiple certification to access export markets. For
Global Market for Organic Food
150 FiBL & IFOAM – Organics International (2018): The World of Organic Agriculture. Frick and Bonn
instance, an organic coffee producer in Indonesia would have to adopt EU, USDA NOP and JAS standards to access markets in Europe, the United States, and Japan respectively. The trend is most noticeable in Asia where almost all countries are developing national standards/regulations, but no harmonisation between standards.
In Europe and North America, various studies show that a small consumer base is responsible for most organic food purchases. Research conducted by Agence Bio showed that although 89 percent of French consumers buy organic foods, only 37 percent of this segment purchases them on a frequent basis (weekly or daily). The majority of organic foods are bought on an irregular basis. More consumers need to buy organic products on a regular basis if the market is to become mainstream. There are also growing concerns about supply. Organic food sales have grown exponentially over the last two decades, however supply is not keeping pace with demand. The amount of international organic farmland has increased from 17.3 million hectares to 57.8 million hectares between 2001 and 2016; a rise of over 200 percent. Over these 15 years, global organic food and drink sales have expanded by roughly 330 percent. The difference is most marked in North America where the amount of organic farmland has only doubled from 1.5 million hectares to 3 million hectares over 15 years. In comparison, organic food & drink sales have expanded over four-fold from 10.5 billion US dollars to 46.3 billion US dollars. With the growth in organic farmland slowing in parts of Europe and North America, there are concerns about supply shortfalls. Growth is expected to continue in the coming years. In the last decade, demand for organic products has taken off in countries, such as China, India, and Brazil. Just as production has become global, demand is becoming international. The question is whether supply will keep pace with demand.

FiBL & IFOAM – Organics International (2018): The World of Organic Agriculture. Frick and Bonn 151
Standards and Regulations

Standards and Regulations › Organic Regulations Update
152 FiBL & IFOAM – Organics International (2018): The World of Organic Agriculture. Frick and Bonn
Standards and Regulations
BEATE HUBER,1 OTTO SCHMID,2 AND VERENA BATLOGG3
After more than three years of intensive and controversial debates, the European Council and Parliament have agreed upon a basic text for a new organic regulation. After some final formal revisions, the new regulation is expected to be adopted in April or May 2018. In the next two years, the implementation provisions will be discussed and agreed upon. The new regulation shall enter into force on 1 January 2021. Major changes in the new rules relate to the import policies where the current principle of equivalency will be replaced by compliance. Similar to the United States (US) system, products imported by the European Union (EU) will have to comply with the EU rules. Equivalent standards will only be recognized within bilateral trade arrangements or other existing agreements, for example, between the EU, the US, and Canada. Within a provisional period of five years, the EU will negotiate such reciprocal trade agreements with its partners.
In the United States, the revision of the organic livestock and poultry practices has been slowed down. At the end of 2017, the United States Department of Agriculture USDA announced its intent to withdraw the organic livestock rules (Organic Livestock and Poultry Practices OLPP). The United States Department of Agriculture (USDA) argued that the proposed OLPP final rule would exceed USDA’s statutory authority beyond the intent of the Organic Foods Production Act. The USDA further strengthened its measures to maintain organic integrity and published, for example, “Interim Instruction on Maintaining the Integrity of Organic Imports.”4
Organic legislation worldwide: current situation
According to the FiBL survey on organic rules and regulations, 87 countries had organic standards in 2017. Eighteen countries are in the process of drafting legislation. Data on regulations around the world were collected from various authorities and experts. The categorization of regulations as being “not fully implemented” or “fully implemented” was based directly on the feedback from the persons interviewed, and the information was not subject to verification. We received responses from experts and authorities from the majority of the countries. It is assumed that the non-responding countries had not passed legislation on organic production. It should be noted that some countries listed below have regulations, but do not enforce them. The indication “not fully implemented” therefore relates to countries that have only
1 Beate Huber, Research Institute of Organic Agriculture (FiBL), 5070 Frick, Switzerland, www.fibl.org 2 Otto Schmid, Research Institute of Organic Agriculture (FiBL), 5070 Frick, Switzerland, www.fibl.org 3 Verena Batlogg, Research Institute of Organic Agriculture (FiBL), 5070 Frick, Switzerland, www.fibl.org 4 More information is available on the USDA website at https://www.ams.usda.gov/rules-regulations/national-organic-program-notice-interim-instruction-maintaining-integrity-organic

Standards and Regulations › Organic Regulations Update
FiBL & IFOAM – Organics International (2018): The World of Organic Agriculture. Frick and Bonn 153
recently adopted legislation and are still in the process of finalizing its implementation, as well as to countries that have adopted legislation but are not providing the resources necessary for its implementation.
Table 41 shows the list of countries that have regulations for organic agriculture, and Table 42 show the countries that are in the process of drafting them. Please send comments or information about countries that are not listed to Beate Huber ([email protected]).
Some countries have no organic legislation but have national production standards. Such standards provide a national definition of organic products and are a reference point for certification activities. They do not necessarily lead to the adoption of a national inspection and certification system, which would be supervised by the government. * Standards officially endorsed as organic by IFOAM – Organics International Source: Survey by Verena Batlogg and Beate Huber, FiBL, January 2018
Table 43 shows that at least 33 countries, mostly in Asia and Africa, have adopted national standards for organic agriculture.
A list of organic regulations is available on the Organic Trade Association (OTA) website at http://www.globalorganictrade.com/country_list.php.
In the three following tables, countries marked with an asterisk have standards officially endorsed as organic by IFOAM – Organics International, based on their equivalence with the Common Objectives and Requirements of Organic Standards (COROS).1 Both private standards and government regulations are admissible for the IFOAM Family of Standards.2
1 Information on the Common Objectives and Requirements of Organic Standards (COROS) is available at www.ifoam.org/en/coros. 2 Information on the IFOAM Family of Standards is available at www.ifoam.org/ogs.

Standards and Regulations › Organic Regulations Update
154 FiBL & IFOAM – Organics International (2018): The World of Organic Agriculture. Frick and Bonn
Table 41: Countries with regulations on organic agriculture 2017
Region Country Remark European Union (28)1 Austria* Fully implemented Belgium* Fully implemented Bulgaria* Fully implemented Croatia* Fully implemented Cyprus* Fully implemented Czech Republic* Fully implemented Denmark* Fully implemented Estonia* Fully implemented Finland * Fully implemented France* Fully implemented Germany* Fully implemented Greece* Fully implemented Hungary* Fully implemented Ireland* Fully implemented Italy* Fully implemented Latvia* Fully implemented Lithuania* Fully implemented Luxemburg* Fully implemented Malta* Fully implemented Poland* Fully implemented Portugal* Fully implemented Romania* Fully implemented Slovak Republic* Fully implemented Slovenia* Fully implemented Spain* Fully implemented Sweden* Fully implemented The Netherlands* Fully implemented United Kingdom* Fully implemented Non-EU Europe (11) Albania Fully implemented Iceland Fully implemented Kosovo Not fully implemented Macedonia, FYROM Fully implemented Moldova Fully implemented Montenegro Fully implemented Norway Fully implemented Serbia Fully implemented Switzerland*2 Fully implemented Turkey* Fully implemented Ukraine Not fully implemented Asia & Pacific Region (25) Armenia Fully implemented Australia* Fully implemented Azerbaijan Not fully implemented China* Fully implemented French Polynesia Fully implemented Georgia Fully implemented India3* Fully implemented Indonesia Fully implemented Iran Fully implemented Israel* Fully implemented Japan1* Fully implemented
1 Official Journal of the European Union (2007). REGULATIONS Council Regulation (EC) No 834/2007 of 28 June 2007 on organic production and labelling of organic products and repealing Regulation (EEC) No 2092/91. Available at eur-lex.europa.eu/LexUriServ/LexUriServ.do?uri=OJ:L:2007:189:0001:0023:EN:PDF 2 Swiss legislation, available at www.admin.ch/ch/d/sr/c910_18.html 3 Information on the National programme for Organic Production (NPOP) in India is available at www.apeda.gov.in/apedawebsite/organic/index.htm
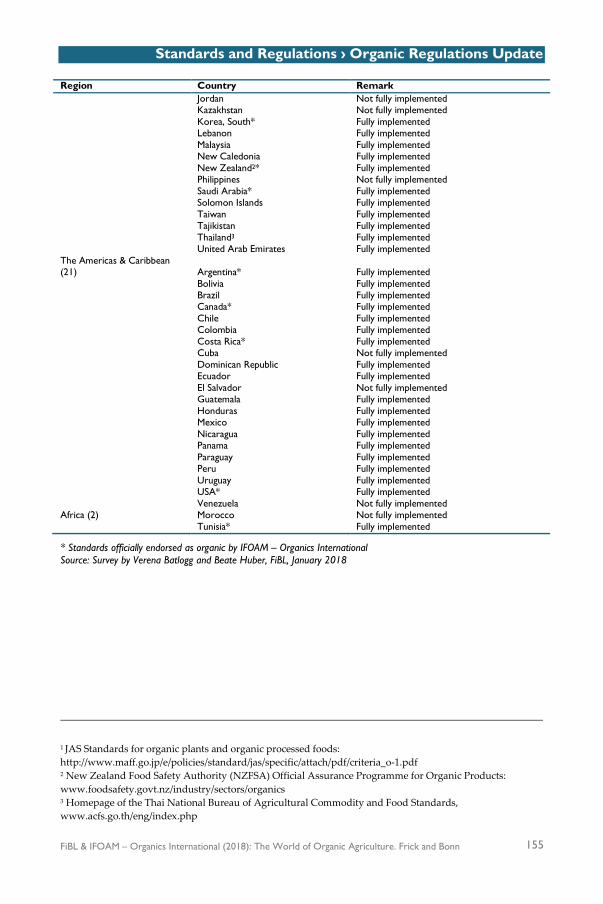
Standards and Regulations › Organic Regulations Update
FiBL & IFOAM – Organics International (2018): The World of Organic Agriculture. Frick and Bonn 155
Region Country Remark Jordan Not fully implemented Kazakhstan Not fully implemented Korea, South* Fully implemented Lebanon Fully implemented Malaysia Fully implemented New Caledonia Fully implemented New Zealand2* Fully implemented Philippines Not fully implemented Saudi Arabia* Fully implemented Solomon Islands Fully implemented Taiwan Fully implemented Tajikistan Fully implemented Thailand3 Fully implemented United Arab Emirates Fully implemented The Americas & Caribbean (21)
Argentina*
Fully implemented
Bolivia Fully implemented Brazil Fully implemented Canada* Fully implemented Chile Fully implemented Colombia Fully implemented Costa Rica* Fully implemented Cuba Not fully implemented Dominican Republic Fully implemented Ecuador Fully implemented El Salvador Not fully implemented Guatemala Fully implemented Honduras Fully implemented Mexico Fully implemented Nicaragua Fully implemented Panama Fully implemented Paraguay Fully implemented Peru Fully implemented Uruguay Fully implemented USA* Fully implemented Venezuela Not fully implemented Africa (2) Morocco Not fully implemented Tunisia* Fully implemented
* Standards officially endorsed as organic by IFOAM – Organics International Source: Survey by Verena Batlogg and Beate Huber, FiBL, January 2018
1 JAS Standards for organic plants and organic processed foods: http://www.maff.go.jp/e/policies/standard/jas/specific/attach/pdf/criteria_o-1.pdf 2 New Zealand Food Safety Authority (NZFSA) Official Assurance Programme for Organic Products: www.foodsafety.govt.nz/industry/sectors/organics 3 Homepage of the Thai National Bureau of Agricultural Commodity and Food Standards, www.acfs.go.th/eng/index.php

Standards and Regulations › Organic Regulations Update
156 FiBL & IFOAM – Organics International (2018): The World of Organic Agriculture. Frick and Bonn
Table 42: Countries in the process of drafting regulations 2017 Region Country Europe (3) Belarus* Bosnia & Herzegovina* Russia* Asia and Pacific Region (6) Bangladesh* Bhutan Jordan* Kyrgyzstan* Nepal* Pakistan* The Americas & Caribbean (2) Jamaica* St. Lucia* Africa (7) Algeria* Burundi Egypt* Kenya* South Africa* Sudan* Uganda
* Standards officially endorsed as organic by IFOAM – Organics International Source: Survey by Verena Batlogg and Beate Huber, FiBL, January 2018
Table 43: Countries with a national standard but without a national legislation 2017 Region Country Asia and Pacific Region (22) Bahrein* Bhutan* Brunei Darussalam* Fiji Hong Kong* Kiribati (Micronesia) Kuwait* Kyrgyzstan Laos* Marshall Islands (Micronesia) Micronesia Nauru (Micronesia) Nepal Oman* Palau (Micronesia) Papua New Guinea Qatar* Samoa Tonga Tuvalu Vanuatu (Melanesia) Vietnam* Africa (11) Burkina Faso* Burundi* Egypt* Ghana* Kenya* Rwanda* South Africa* Tanzania* Uganda* Zambia* Zimbabwe* * Standards officially endorsed as organic by IFOAM – Organics International Source: Survey by Verena Batlogg and Beate Huber, FiBL, January 2018

Standards and Regulations › Organic Regulations Update
FiBL & IFOAM – Organics International (2018): The World of Organic Agriculture. Frick and Bonn 157
The Codex Alimentarius Guidelines: Recent developments1
The need for clear and harmonized rules has not only been taken up by private bodies, such as IFOAM – Organics International, and state authorities, but also by United Nations organizations, including the Food and Agriculture Organization (FAO), the World Health Organization (WHO), and the United Nations Conference on Trade and Development (UNCTAD). The Codex Alimentarius Commission approved plant production guidelines in June 1999 and animal production guidelines in July 2001. They also provide guidance to governments on developing national regulations for organic food. The latest update of the guidelines was done in 2013.2
The annex lists of the Codex Alimentarius Guidelines, which define the substances that can be used in organic food and farming systems and have been under revision since 2005, mainly focus on substances for food processing and criteria for the use of new substances. The Codex Commission adopted several amendments to the annex lists that were proposed by the Codex Committee for Food Labelling in July 2009. Other substances discussed, such as nitrites and nitrates, ascorbates for meat processing, and phosphates as food additives, were not approved in the Codex Guidelines for organic food. In 2010, an amendment was made to increase restrictions on the use of rotenone for pest control: the substance should be used in such a way as to prevent it from flowing into waterways.
In 2011, the Codex Committee for Food Labelling (CCFL) agreed (as proposed by the European Union) on the inclusion of spinosad, copper octanoate, potassium bicarbonate, and uses of ethylene for the degreening of citrus for fruit fly prevention, and flowering induction in pineapples. In May 2012, the committee decided that “Spinosad should only be used where measures are taken to minimize the risk to non-target species and to minimize the risk of development of resistance.” Potassium hydrogen carbonate, copper octanoate (with the same conditions as other copper products), and ethylene for the degreening of citrus for fruit fly prevention and as a flowering agent for pineapples were included in the Annex 2 list of the Codex Guidelines of organically produced food. In 2012, the Codex Committee for Food Labelling decided that a structured approach with a two-year cycle would be followed for the revision of the regulation and the list of substances. Furthermore, in 2011 it was agreed that organic aquaculture and seaweed production would be taken up as a new area. However, after discussions at several draft working paper meetings, the Codex Committee for Food Labelling proposed, in 2016, to either discontinue the work on organic aquaculture guidelines or identify a different subsidiary body to continue the work. No compromise could be found on the most controversial issues, such as the use of juveniles, the use or non-use of recirculation or containment systems, breeding techniques, feeding sources, the ban or restriction of hormones, and
1 Information about Codex Alimentarius is available at http://www.codexalimentarius.org/codex-home/en/ 2 http://www.fao.org/docrep/005/Y2772E/Y2772E00.HTM

Standards and Regulations › Organic Regulations Update
158 FiBL & IFOAM – Organics International (2018): The World of Organic Agriculture. Frick and Bonn
conversion periods. Therefore no further work will be done on aquaculture rules in the Codex. At the CCFL Meeting in October 2017, the organic guidelines were not on the agenda. In November 2017, the General Assembly of IFOAM – Organics International passed a motion that organic aquaculture may include environmentally integrated types of recirculation systems with additional restrictions.
Import requirements of major economies
The major import markets for organic products are the European Union, the United States, Canada, and Japan. All of these markets have strict regimes for the importation of organic products. In the European Union, the United States, and Japan, products may only be imported if the certifying agency has been approved by the respective competent authority. The approval of certification bodies requires compliance or equivalency with the requirements of the importing countries, which can be achieved through (a) bilateral agreements between the exporting country and the target import country, or (b) direct acceptance of the certifying agency by the target import country.
Bilateral agreements between the exporting and the target import country
Most importing countries, including the United States, the European Union, and Japan have options for bilateral recognition (i.e., the option to confirm that another country’s control system and its standards are in line with domestic requirements and that the products certified in those countries can be sold on the national market). Bilateral agreements are largely political agreements that depend on political will and negotiations between the governments, but they are also based on technical assessments.
The United States and the European Union have also recognized each other’s national organic standards and control systems, except for animal products from the European Union and apples and pears from the United States, which require extra verification. Additional specifications are agreed upon for wine. In addition, products from aquaculture production are not yet included in this agreement.
In 2009, the United States and Canada concluded their first bilateral agreement. Under a determination of equivalence, producers and processors, who are certified according to the US National Organic Program (NOP)1 standards by a certifying agent accredited by the United States Department of Agriculture (USDA), do not have to be certified by the Canada Organic Product Regulation (COPR) standards in order for their products to be represented as organic in Canada. Likewise, Canadian organic products certified to COPR standards may be sold or labelled in the United States as organically produced.2 The United States has further concluded bilateral agreements with Japan, South Korea, and Switzerland and is currently assessing the Mexican
1 National Organic Program (NOP) www.ams.usda.gov/AMSv1.0/NOP 2 There are exemptions to the United States COR agreements relating to sodium nitrate, hydroponics and livestock for the United States and antibiotics for livestock in Canada.

Standards and Regulations › Organic Regulations Update
FiBL & IFOAM – Organics International (2018): The World of Organic Agriculture. Frick and Bonn 159
organic control system. In October 2016, the United States Department of Agriculture (USDA) and Mexico established an agreement to require import certificates for all organic products traded between the United States and Mexico. The USDA and Mexico’s National Service for Animal and Plant Health, Food Safety and Quality (SENASICA) are evaluating each other’s systems to determine whether an organic equivalency arrangement could be established between the United States and Mexico.
Canada has signed equivalency agreements with the European Union, Costa Rica, Japan, and Switzerland.
The European Union currently recognizes twelve countries1 as being equivalent to the European Union’s system (known as the Third Country list). Furthermore, a trade agreement was established in 2017 with Chile. Subsequently, Chile will soon be listed in the Third Country list (for more information on the agreement between Chile and the EU, please see page 269).
The United States has accepted several foreign governments’ accreditation procedures. Certification bodies accredited according to the United States requirements in India, Israel, and New Zealand are accepted by the United States Department of Agriculture (USDA) for certification according to the US National Organic Program (NOP), even though they are not directly accredited by the USDA. This level of recognition only covers accreditation procedures; the respective certification bodies still have to meet the requirements of NOP to issue certificates accepted by the United States.
Acceptance of the certifying agency by the target importing country
The United States, the European Union, and Japan have options for recognizing certification bodies operating outside of their countries. The technical requirements for achieving such recognition are difficult to meet, and the associated fees are high. Maintaining recognition and/or the necessary accreditation requires substantial financial capacity and personnel from the certification agency.
Products are only granted import into the European Union if they have been certified by an inspection body or authority recognized by the European Commission. In updates to EU regulation 1235/2008, the European Union published the list of approved control bodies and authorities recognized for applying equivalent standards and control schemes in non-EU countries. Certification from recognized control bodies has been accepted for imports to the European Union since July 1, 2012. The US system allows certification bodies to be approved to operate a US certification program. Inspections have to be conducted by inspectors trained in NOP requirements using NOP-based questionnaires, and only certificates issued by certification bodies accredited by the United States Department of Agriculture 1 Argentina, Australia, Canada, Costa Rica, India, Israel, Japan, New Zealand, Republic of Korea, Switzerland, Tunisia and the United States.

Standards and Regulations › Organic Regulations Update
160 FiBL & IFOAM – Organics International (2018): The World of Organic Agriculture. Frick and Bonn
(USDA) are accepted. It is not relevant whether the certification body is based in the United States or elsewhere. Approximately 80 agents are currently authorized to certify farms and businesses under the USDA organic regulations. Most USDA-accredited certifying agents are allowed to certify farms and businesses anywhere in the world.
Literature Codex Alimentarius (2013): Guidelines for the Production, Processing, Labelling and Marketing of
Organically Produced Foods. (GL 32 – 1999, Rev. 1 – 2001, Rev. 2013). Rome. https://tinyurl.com/y8mpxqmw
Commission Regulation (EC) No 1235/2008 of 8 December 2008 laying down detailed rules for implementation of Council Regulation (EC) No 834/2007 as regards the arrangements for imports of organic products from third countries; Consolidated version: http://eur-lex.europa.eu/legal-content/EN/TXT/?uri=CELEX:02008R1235-20171024
Commission Regulation (EC) No 889/2008 of 5 September 2008 laying down detailed rules for the implementation of Council Regulation (EC) No 834/2007 on organic production and labelling of organic products with regard to organic production, labelling and control; Consolidated Version: http://eur-lex.europa.eu/legal-content/EN/TXT/?uri=CELEX:02008R0889-20170521
Council Regulation (EC) No 834/2007 of 28 June 2007 on organic production and labelling of organic products and repealing Regulation (EEC) No 2092/91; Consolidated version: http://eur-lex.europa.eu/legal-content/EN/TXT/?uri=CELEX:02007R0834-20130701
European Commission (2008) Guidelines on imports of organic products into the European Union. 15.12.2008. Rev.1. European Commission, Brussels. Available at https://ec.europa.eu/agriculture/organic/sites/orgfarming/files/docs/body/guidelines_for_imports_en.pdf
European Commission (2017): Fact Sheet The new organic regulation. European Commission, Press release database. Available at http://europa.eu/rapid/press-release_MEMO-17-4686_en.htm
USDA (2018): Organic Regulations. The USDA website, USDA, Washington DC. Available at https://www.ams.usda.gov/rules-regulations/organic

Standards and Regulations › PGS
FiBL & IFOAM – Organics International (2018): The World of Organic Agriculture. Frick and Bonn 161
PGS in 2017 – Trends and Latest Figures
FLÁVIA MOURA E CASTRO1 AND FEDERICA VARINI2
Participatory Guarantee Systems (PGS) are locally-focused quality assurance systems. They certify producers, based on the active participation of stakeholders and are built on a foundation of trust, social networks and knowledge exchange (IFOAM definition, 2008).3 PGS have proven to be an affordable alternative to third-party certification, an effective tool to develop local markets for organic produce, and they are particularly appropriate for small-scale farmers. IFOAM – Organics International is the only organization collecting data about PGS on a global level.
Government recognition and support
In 2004, when IFOAM – Organics International organized the first international workshop on alternative certification, in cooperation with the Latin American Agroecology Movement (MAELA), PGS were bottom-up initiatives developed mainly by farmer groups, often supported by NGOs, without government involvement. Back then, there was a strong need to legitimize and get recognition for these alternative certification strategies. In the last ten years, however, a new trend is emerging, which sees governments increasingly interested in playing a central role in supporting, recognizing, as well as regulating PGS. PGS are mainly for national markets. In a few cases, there have been instances of exports of PGS products to countries where the organic market is not regulated, but these are rather exceptions. There is an increasing number of countries that include PGS as a guarantee system for the national organic market in their National Organic Regulation. In general, it means that third party certification and PGS are considered as equal guarantee systems for the national market, while products for export need to be certified by third-party certification bodies. The pace and the dynamics of PGS development and their governmental recognition vary. Latin American governments have been pioneers in including PGS in their organic policies. In 2007, Brazil became the first country to recognise PGS at the same level as third party certification for organic quality assurance. Other countries followed: Costa Rica (2008), Uruguay (2008), Paraguay (2008), Mexico (2010), French Polynesia (2011), Bolivia (2012), New Caledonia (2017), Chile (2017) and India (2017).
1 Flávia Moura e Castro, IFOAM – Organics International, Charles-de-Gaulle-Str. 5, 53113 Bonn, Germany, [email protected], www.ifoam.bio 2 Federica Varini, IFOAM – Organics International, Charles-de-Gaulle-Str. 5, 53113 Bonn, Germany, [email protected], www.ifoam.bio 3 More information about PGS can be found on the website of IFOAM – Organics International at https://www.ifoam.bio/en/organic-policy-guarantee/participatory-guarantee-systems-pgs,

Standards and Regulations › PGS
162 FiBL & IFOAM – Organics International (2018): The World of Organic Agriculture. Frick and Bonn
In recent years, a particular momentum for PGS development can be observed in India and Southeast Asia. During the last six years, India has been increasingly supporting PGS for its national market, developing a unique example of a large-scale government-facilitated PGS program, coordinated by its National Centre for Organic Farming, under the Ministry of Agriculture. Additionally, the government has allocated a significant amount of money to promoting conversion to organic farming and adoption of PGS through various programs. This has happened in the context of a non-regulated domestic organic market. At the end of 2017, the Indian government extended the organic regulation to its national market, recognizing the government-run PGS. Even in countries with an unfavourable national legal framework, where only producers certified by third party certification bodies can make organic claims, there are some cases of local authorities having developed schemes to support PGS at the regional or municipal level. This has been happening, for example, in the Philippines and Peru. In the European Union countries and the United States, PGS initiatives continue to exist despite the fact that they cannot make organic claims. It is crucial that a country deciding to regulate its organic sector does so without hindering PGS development by deliberately or inadvertently excluding PGS in the law. To promote organic regulations that enable PGS, IFOAM - Organics International (2017) has developed specific recommendations, available in the Organic Regulation Toolkit.1 While including PGS as one of the conformity assessment systems permitted under the regulation is certainly the best way to promote PGS, increasing institutionalization may also have adverse impacts on PGS development. In some countries, PGS are currently facing some fundamental challenges due to hierarchical structures and demanding bureaucratic procedures that come with government recognition, which might clash with the original values of PGS, such as participation and horizontality.2 The risk caused by a top-down approach can be mitigated through consultation with stakeholders during the development of policies and regulations, especially grassroots organizations, which are usually involved in PGS implementation. Besides creating an enabling legal framework, governments can show support to PGS in other ways, for example by including PGS in trainings on organic agriculture systems, and through the endorsements of PGS by government officials at events and in general communications. Governments might be interested in supporting alternative certification approaches to third-party certification, such as PGS, as a way to promote organic agriculture adoption, livelihood improvements through market access, and empowerment of smaller farmers. Supporting PGS is suitable for all stages of development of the organic sector, whether or not there is a regulation, and whatever the size of the domestic organic market. 1 The IFOAM Organic Regulation Toolkit is available at www.ifoam.bio/en/organic-regulation-toolkit 2 This was indicated as a challenge faced by various PGS practitioners, who provided information to the IFOAM PGS survey conducted in 2015 and 2017.
Standards and Regulations › PGS
FiBL & IFOAM – Organics International (2018): The World of Organic Agriculture. Frick and Bonn 163
Interesting examples can be found in Costa Rica, Mexico, Brazil and Argentina. More information with detailed examples of policy support for PGS development is available in the recently published “Global Policy Toolkit on Public Support to Organic Agriculture” (IFOAM – Organics International 2017). More information about this toolkit is available at page 170. PGS worldwide: latest figures
Based on the data collected through the Global PGS Survey 2017 conducted by IFOAM – Organics International, PGS initiatives are established in 66 countries, with at least 311’449 farmers involved in PGS initiatives worldwide. This includes mostly small farmers and small processors. We estimate that there are currently at least 241 PGS initiatives, of which 127 are fully operational, and 115 are under development, with a total of 76’750 producers certified.
Some of these operational PGS initiatives consist of several local groups, that organise themselves under a local or national network or scheme. Thus, they have been considered as a single entry. Compared to 2015 (date of our previous survey) the number of producers certified through PGS had a growth rate of 74 percent, while the number of producers involved has increased by more than four times. The country with the most producers involved in PGS is undoubtedly India. The figures have risen from 6’000 producers involved in 2015 to 250’856 in 2017. Among these, a total of 46’598 have already obtained PGS certification. Regional development
Asia has more PGS than any other region with 260’366 producers involved, 49’559 of which are certified. This development is related to the expansion of PGS in the whole region in the past years. After India, the Philippines have the highest amount of producers involved (1’995), whereas Thailand has the highest amount of producers certified (1’116). In South East Asia in general, PGS development has taken a big step forward in the last years, thanks to the support of the Asian Development Bank and FAO, and PGS training organised by IFOAM – Organics International. In Latin and Central America, 22’726 producers are involved in PGS, out of which 16’756 are certified. Bolivia has the most PGS, with 9’284 producers involved and 8’164 certified. It is followed by Brazil (4’935 producers involved, 4’167 producers certified) and Peru (3’244 producers involved, 3’014 producers certified). In Africa, it is estimated that there are 22’699 producers involved, 7’304 of whom are certified. For instance, there are well-established PGS initiatives in Tanzania with 515 farmers certified, in Kenya with 178 farmers certified and in Burkina Faso with 104 farmers certified. However, data collection in this region has been problematic. In Oceania, there are more than 2’671 producers involved. Of these, 1’385 are certified. In the Pacific Islands, PGS certification is well accepted, and most PGS farmers in this region are based in Fiji, with 1’120 producers certified.

Standards and Regulations › PGS
164 FiBL & IFOAM – Organics International (2018): The World of Organic Agriculture. Frick and Bonn
Due to an unfavourable legal framework, PGS initiatives are less widespread In North America and in Europe, where the figures tend to be relatively stable over the years. In North America, a total of 1’767 producers are involved in PGS, the majority of which are in the USA, where we find 776 certified producers. In Europe, we have seen a modest increase compared to 2015, with 1’220 producers involved, the majority of which are located in France (881 PGS-certified producers).
General notes on the PGS data Every two years IFOAM – Organics International conducts a global PGS survey. In 2017, the survey was conducted from June to November; therefore, the figures for most of the PGS are from November 2017. Additional data were collected through bilateral communication with PGS initiatives, competent authorities and PGS experts. If new data is not received, data from the previous year or older data is used. When PGS are recognised under a national organic regulation, we collect the data from the census conducted by competent authorities. This is the case in Brazil1, Chile2, Bolivia3, Costa Rica4, Mexico5 and India.6 PGS initiative: A PGS initiative is understood as a group of producers (farmers and/or processors), who are committed to producing according to a mutually agreed organic standard and who decided to guarantee the organic quality of their products through a participatory approach. The PGS initiative may also include other stakeholders such as consumers, extension workers, NGOs or local authorities. Many PGS initiatives are composed of multiple local groups. PGS status: Setting up a PGS is a long process and requires one or more years before the producers involved can be fully certified. In our data collection, we distinguish between two situations: › Operational, when the initiative is fully working and has put into place all the necessary procedures to
manage the guarantee system, and thus at least some farmers involved have received the certification; and
› Under development, when the initiative has started to set up the PGS, but still requires some time to develop and consolidate the system. Thus farmers are not yet certified.
Number of producers: Within a PGS initiative we distinguish between › the number of producers certified, that is, the number of producers who are currently holding a valid
certificate issued by the PGS initiative; and › the number of producers involved, which includes the producers already certified and those who have
not yet received a certificate, but who are nevertheless involved in the PGS operations.
1 Ministério da Agricultura, Pecuária e Abastecimento, Brasil, Cadastro Nacional de Produtores Orgânicos. Available at http://www.agricultura.gov.br/assuntos/sustentabilidade/organicos/cadastro-nacional-produtores-organicos 2 Servicio Agrícola y Ganadero, Chile: Certificación de Productos orgánicos. Available at http://www.sag.cl/ambitos-de-accion/certificacion-de-productos-organicos/132/registros 3 Consejo Nacional de Producción Ecológica (UC-CNAPE), email communication, data for 2016. 4 Servicio Fitosanitario del Estado, MAG, Costa Rica: Lista Oficial de Grupos en Certificación Participativa. Available at https://www.sfe.go.cr/DocsARAO/Lista_inscritos_Certificacion_Participativa.pdf 5 Servicio Nacional de Sanidad, Inocuidad y Calidad Agroalimentaria, Mexico: Padrón de Organismos de Certificación Participativa de productos orgánicos a pequeños productores y producción familiar. Available at https://www.gob.mx/senasica/documentos/padron-de-organismos-reconocidos-para-otorgar-certificacion-participativa-de-productos-organicos-a-pequenos-productores 6 Department of Agriculture & Cooperation, India: Participatory Guarantee System for India. Available at http://pgsindia-ncof.gov.in
Standards and Regulations › Organic Processing
FiBL & IFOAM – Organics International (2018): The World of Organic Agriculture. Frick and Bonn 165
Processed with care? Comparing Different Organic Regulations and Standards for Major Markets
VERENA BATLOGG,1 OTTO SCHMID,2 AND BEATE HUBER3
Background
As the organic food sector continues to expand, the variety and complexity of food on the market is also rapidly increasing, particularly for processed foods. Consumers of organic food have particularly high expectations regarding the quality of processed food that go beyond aspects of food safety and sensory attributes. Organic standards represent important regulatory frameworks for guiding and controlling food processing activities for organic food.
This article compares various standards in order to understand the differences between private standards, governmental rules and regulations, as well as international norms, and the extent to which they provide guidance for the practical implementation of organic agriculture principles. For simplicity, the term “standards” will hereafter be used to refer to all types of standards, rules, regulations, norms, and guidelines. For this article, the IFOAM Norms for Organic Production and Processing, the standards of the European Union (EU), the United States (US), Japan, and China, as well three examples of European private standards (Demeter, Bio Suisse, and Soil Association) are compared. These are just three examples of private standards, though there are many more. Approximately 90 percent of the global organic food market (in monetary value) is certified under these eight standards. The US market alone comprises 47 percent of the global market and the European Union, the second-biggest single market 37 percent.4
General principles outlining organic food processing
IFOAM’s “Norms for Organic Production and Processing” (2014) provide an important reference point for understanding how the principles of organic agriculture relate to processing: “Organic processing and handling provide the consumer with high-quality supplies of organic products without compromising the integrity of the products and protects the environment.” Other standards formulate the general principles slightly differently. For example, the European Union (EU) regulation (EC) No 834/2007 states: “Organic processed products should be produced by the use of processing methods which guarantee that the organic integrity and vital qualities of
1 Verena Batlogg, Research Institute of Organic Agriculture (FiBL), 5070 Frick, Switzerland, www.fibl.org 2 Otto Schmid, Research Institute of Organic Agriculture (FiBL), 5070 Frick, Switzerland, www.fibl.org 3 Beate Huber, Research Institute of Organic Agriculture (FiBL), 5070 Frick, Switzerland, www.fibl.org 4 Based on figures published by FiBL in this volume (see chapter on organic statistics by Lernoud and Willer).

Standards and Regulations › Organic Processing
166 FiBL & IFOAM – Organics International (2018): The World of Organic Agriculture. Frick and Bonn
the product are maintained through all stages of the production chain.” The Chinese standard states that “the processing stage shall maintain the nutrition and original nature of the product at the highest extent.” The Soil Association standard defines organic foods as being “wholesome, authentic, unadulterated and of high quality.”
Overall, organic standards regulate food processing through two main concepts:
(a) the authorization or prohibition of specific processing methods, and (b) the authorization of ingredients and substances specifically allowed during
processing (usually distinguishing between food additives and processing aids).
Rules relating to processing techniques and technologies
All eight standards contain some basic principles and specific restrictions for organic food processing, which can be translated into concrete, technical guidelines as to which processing techniques and technologies are allowed and which are not. However, the regulatory frameworks relating to food processing offer less specific guidance and receive less attention compared to those relating to crop and livestock production.
All standards studied prohibit the use of recombinant DNA technology (GMOs) during food processing as well as in the manufacturing of its components, such as ingredients, additives, processing aids or microorganisms (except veterinary products in the EU regulation on organic production).
In all standards covered, the use of ionizing radiation (irradiation), synthetic solvents, and asbestos filtrating materials is explicitly prohibited.
One notable difference between the standards covered relates to the degree to which processing techniques are allowed, restricted, or forbidden. For instance, the IFOAM norms, the Soil Association standards, and the EU regulations No 834/2007 and No 889/2008 state that processing techniques should be mechanical, physical, or biological.
The United States National Organic Program (NOP) lists 21 and the Chinese standard 10 specific processing techniques. However, they state that these lists are not limited to these methods, which include, for example, dehydrating, canning, fermenting, filtration, refrigeration.
Private standards are more restrictive concerning production techniques and technologies, and they often define certain techniques that are specifically allowed for certain product groups. For example, Bio Suisse permits seven processing methods for treating ready-to-consume cow’s milk while explicitly prohibiting four others. Also, it defines the minimum β-lactoglobulin levels that should be present in the milk after microfiltration and UHT treatment. Furthermore, it sets out maximum pressure values allowed during homogenization.

Standards and Regulations › Organic Processing
FiBL & IFOAM – Organics International (2018): The World of Organic Agriculture. Frick and Bonn 167
All standards studied offer little specific guidance regarding the evaluation or use of new processing techniques or technologies for organic food.
Rules relating to additives and processing aids
All standards studied require that the use of additives should be kept to a minimum. Artificial flavours and colours are generally excluded. However, many governmental regulation and the Codex Alimentarius1 rules allow nature-identical flavours, which are chemically synthesised, whereas the private organic standards analysed exclude these.
When compared with laws in the non-organic food industry, organic food processing standards are generally stricter regarding the use of additives and processing aids (for definition see below). All organic standards include lists of substances that are permitted for processing, so called positive lists. The standards, except the NOP national list, place the majority of these substances into one of two main categories: food additives and processing aids. Most standards also regulate the use of water, salt, flavourings, microorganisms, and enzymes as well as cleaning agents.
Additives are substances added to improve the colour, fragrance, taste, shape, and nutrition, as well as to satisfy the requirements of preserving and processing. They must be included in the ingredients list of a product.
By contrast, processing aids are substances used for certain technological purposes during treatment, processing, or handling and are not declared in the ingredient list2, even though unintentional but technically unavoidable traces of these or their residues can be found in the final product.
The so-called “positive lists” in the eight standards are exclusive, meaning that any substance that is not explicitly mentioned on the list cannot be used in organic food processing. As in the rest of the food industry, it is regarded as a best practice to use these substances only if necessary from a processing or product quality point of view, and then only in the minimal dose necessary.
Overall, the number of substances allowed in the different organic standards (e.g., the European Union has 71, and the US has 89) is significantly less than the approximately 430 substances appearing on the list of the International Numbering System for Food Additives (INS) of Codex Alimentarius.
Among the standards compared, governmental rules are the least specific when regulating the use of these substances, whereas the private standards, particularly the Demeter and Bio Suisse standards, are the most specific in this regard.
1 The Codex Alimentarius is the international food standards organization of the WHO and FAO of the United Nations. 2 With some exceptions such as baking enzymes which need to be declared in some countries and under some standards

Standards and Regulations › Organic Processing
168 FiBL & IFOAM – Organics International (2018): The World of Organic Agriculture. Frick and Bonn
Conclusions and outlook
The comparison of eight organic standards shows that the standards guiding and defining processing activities is complex. Overall, governmental standards are more general than private ones, with private ones offering more specific guidance as to what additives and processing aids, as well as processing methods, are allowed or not allowed.
Positive lists of permitted food additives and processing aids give clear guidance for the industry, but each standard uses a different categorisation, which makes comparisons difficult. The wording used in international standards (IFOAM Norms, Codex Alimentarius organic guidelines, and the EU regulations) is comparable.
For example, any substance added should be found in nature and may have undergone only mechanical/physical processes (e.g., extraction, precipitation), biological/ enzymatic processes, and microbial processes (e.g., fermentation). Chemically synthesized substances are allowed only in certain exceptions (e.g. nature-identical flavours). All standards require that the consumer will not be deceived concerning the nature, substance, and quality of the food.
It will be important for the organic industry to discuss whether it is desirable or even necessary to aim for a more uniform set of standards for food processing and, if yes, how this can best be achieved (Kahl et al., 2014). An interesting question is also how processing standards affect sensory properties of food (Schmid, 2009), environmental impact, and sustainability (Beck and Henkel, 2012). Furthermore, the consequences of the current differences between the standards on topics such as market distortions, consumer perception, or equivalencies between the standards remains an interesting topic of study.
Literature Beck, A. and Henkel, Y. (2012), European Organic Regulations(EC) No 834/2007, 889/2008 and 1235/2008 An
Evaluation of the First Three Years Looking for Further Development pp.44-46. Available, at http://www.ifoam-eu.org/sites/default/files/page/files/ifoameu_reg_regulation_dossier_201204_en.pdf
Bio Suisse (2017) Standards: Part III - Standards for Processing and Trade, 2017. Bio Suisse, Basel. Available at www.bio-suisse.ch/media/VundH/Regelwerk/2017/EN/pf_rl_2017_1.6_e_gesamt_28.09.2017.pdf and www.bio-suisse.ch/media/VundH/zusatzstoffe_d.pdf
China (2015) National Standard of the People’s Republic of China, Organic Products, Part 2: Processing. Available at http://aco.net.au/wp-content/uploads/2015/08/GBT19630_2_en.pdf
Codex Alimentarius Commission (1999/2001/2004/2008/2013): Guidelines for the Production, Processing, Labelling and Marketing of Organically Produced Foods. Rome. Available at: http://www.fao.org/fao-who-codexalimentarius/sh-proxy/en/?lnk=1&url=https%253A%252F%252Fworkspace.fao.org%252Fsites%252Fcodex%252FStandards%252FCAC%2BGL%2B32-1999%252Fcxg_032e.pdf
Demeter (2017) Processing Standards for the Use of Demeter, Biodynamic and related trademarks from June 2017: Available at www.demeter.net/sites/default/files/di_processing_stds_demeter_biodynamic_17_-_e.pdf
European Commission Regulation No 889/2008 of 5 September 2008 laying down detailed rules for the implementation of Council Regulation (EC) No 834/2007 on organic production and …: Available at http://eur-lex.europa.eu/legal-content/EN/TXT/?uri=celex%3A32007R0834

Standards and Regulations › Organic Processing
FiBL & IFOAM – Organics International (2018): The World of Organic Agriculture. Frick and Bonn 169
European Council Regulation (EC) No 834/2007 of June 2007 on organic production and labelling of organic products and repealing Regulation (EEC) No 2092/91: http://eur-lex.europa.eu/LexUriServ/LexUriServ.do?uri=OJ:L:2008:250:0001:0084:en:PDF
FAO, Codex Alimentarius. “Class names and the international numbering system for food additives CAC/GL 36-1989”, last amended in 2017. FAO, Rome. Available at http://www.fao.org/fao-who-codexalimentarius/sh-proxy/en/?lnk=1&url=https%253A%252F%252Fworkspace.fao.org%252Fsites%252Fcodex%252FStandards%252FCAC%2BGL%2B36-1989%252FCXG_036e.pdf
FAO, Codex Alimentarius GL-32-1999 “Guidelines for the Production, Processing, Labelling and Marketing of Organically Processed Foods“ last amended 2013: http://www.fao.org/fao-who-codexalimentarius/sh-proxy/en/?lnk=1&url=https%253A%252F%252Fworkspace.fao.org%252Fsites%252Fcodex%252FStandards%252FCAC%2BGL%2B32-1999%252Fcxg_032e.pdf
IFOAM – Organics International (2017): IFOAM Norms for Organic Production and Processing. IFOAM – Organics International, Bonn. Available at https://www.ifoam.bio/en/ifoam-norms
Kahl J, Alborzi F, Beck A, Bügel S, Busscher N, Geier U, Matt D, Meischner T, Paoletti F, Pehme S, Ploeger A, Rembiałkowska E, Schmid O, Strassner C, Taupier-Letage B, Załęcka A. 2014 Organic food processing: a framework for concept, starting definitions and evaluation. J Sci Food Agric. 2014 Oct;94(13):2582-94.
Ministry of Agriculture, Forestry and Fisheries (2005) Japanese Agricultural Standard for Organic Plants (Notification No. 1605) of October 27, 2005) Partial revision: Notification No.443 of March 27, 2017: Available at: www.maff.go.jp/e/policies/standard/jas/specific/attach/pdf/criteria_o-1.pdf
Schmid, O. (2009): Analysis of regulatory framework affecting sensory properties. Comparative report on specific sensory related requirements in regulations and standards for organic production. Deliverable No. 1.1 of ECROPOLIS Project. Research Institute of Organic Agriculture FiBL, Frick, Switzerland. Available at: http://orgprints.org/17256/1/deliverable_1.1_regulatory_framework.pdf
Soil Association (2016) Organic standards food and drink Revision 17.5 August 2016. Soil Association, Bristol. Available at www.soilassociation.org/media/7207/food-and-drink-v17-5-august-2016.pdf
USDA (2017): Organic Regulations. The USDA website, Washington. Available at www.ams.usda.gov/rules-regulations/organic

Standards and Regulations › Policy Support
170 FiBL & IFOAM – Organics International (2018): The World of Organic Agriculture. Frick and Bonn
The First Global Compilation of Policies Supporting Organic Agriculture
JOELLE KATTO-ANDRIGHETTO1
For the first time, a complete global overview of policies supporting organic agriculture has been compiled, and tools for advocates and policymakers are now available in the “Global Policy Toolkit on Public Support to Organic Agriculture.” The toolkit was published by IFOAM - Organics International in September 2017.
The toolkit is a result of a two-year long study, during which the IFOAM - Organics International policy team looked at examples of public support provided to organic agriculture in over 80 countries. The team gathered and compared information from various sources including policymakers, academia, consultants, and organic stakeholders. The results of this one-of-a-kind study are designed to serve the needs of organic advocates, policymakers and others who wish to advance agricultural sustainability in their countries.
There is increasing recognition from consumers, civil society and governments of the environmental, social and economic benefits of sustainable agricultural practices such as organic farming. Various governments now provide public support for organic agriculture, which are reflected in the stories, outcomes, lessons learned and policy recommendations published in a toolkit format. The toolkit aims to fill a knowledge gap in the area of organic advocacy and policy-making: now policy-makers can learn more about not only why we should support organic agriculture, but also how it can be done. The toolkit contains hundreds of examples of policy measures taken by local or national governments to support organic agriculture in various ways. The examples are organized by types of measures, which are in turn organized according to three broad categories:
• push measures (to support conversion to organic), • pull measures (to support consumption/purchases of organic) and • enabling measures (that combine push and pull elements).
The Global Policy Toolkit on Public Support to Organic Agriculture includes:
• The main study report, which presents a comprehensive overview of measures that can be taken by governments at various levels (municipal, regional, national) to promote and support organic agriculture, with country examples and advice related to each type of support.
1 Joelle Katto-Andrighetto, Organic Policy & Guarantee Manager at IFOAM - Organics International, Charles-de-Gaulle-Str. 5, 53113 Bonn, Germany, www.ifoam.bio

Standards and Regulations › Policy Support
FiBL & IFOAM – Organics International (2018): The World of Organic Agriculture. Frick and Bonn 171
• Policy summaries, which are policy briefs on various topics that can be taken to meetings with policymakers.
• PowerPoint presentations that help break down the main arguments and successful examples from countries that have effectively implemented policy support measures.
• Tips for organic advocates on "How to raise political awareness of the need for support to organic agriculture".
• A decision aid to help users select the most appropriate support measures depending on their country situation.
• A policy template for countries with an emerging organic sector, which can serve as an inspiration for policy formulation covering the most common policy measures that will be relevant to such countries.
Link
The policy toolkit can be downloaded free of charge on the IFOAM - Organics International website at www.ifoam.bio/policy-toolkits.
Acknowledgment
The development of the policy toolkit was supported by the Swiss Agency for Development and Cooperation (SDC) and received co-funding from the Swedish International Development Cooperation (SIDA), Hivos, and Bio.inspecta.


FiBL & IFOAM – Organics International (2018): The World of Organic Agriculture. Frick and Bonn 173
Africa
Map 2: Organic agricultural land in the countries of Africa 2016 (in hectares)
Source: FiBL survey 2018, based on information from the private sector, certifiers, governments, and for North Africa, the Mediterranean Organic Agricultural Network (MOAN) For detailed data sources see annex, page 330.

Africa › Overview
174 FiBL & IFOAM – Organics International (2018): The World of Organic Agriculture. Frick and Bonn
Latest Developments in Organic Agriculture in Africa
JORDAN GAMA1
The year 2017 continued to see growing recognition among policymakers that organic agriculture has a significant role to play in addressing food insecurity, land degradation, poverty, and climate change in Africa. Organic agriculture offers a valuable tool-kit of affordable and people-centered production practices, as well as high-yielding systems and both local- and export-focused marketing models. In the context of low carbon, resilient, and inclusive sustainable development, organic agriculture is an increasingly relevant and attractive proposition for many stakeholders.
The African Organic Network (AfrONet)
AfrONet2 is the African organic umbrella organization, which was established during the Second African Organic Conference in 2012, in Lusaka, Zambia. It unites and represents African ecological/organic stakeholders. In terms of achievements, AfrONet stands out as an important body for the future of the African organic movement and sector. AfrONet aims to strengthen and support regional networks and the Ecological Organic Agriculture Initiative for Africa.3 Active regional networks include the Southern African Network for Organic Development (SANOD), IFOAM’s Southern African Network (ISAN) and those from West, Central, and East Africa. Furthermore, it supports the African conferences (see next sections) and actively participates in the events of the Forum for Agricultural Research in Africa (FARA, www.fara-africa.org) and the Organic World Congresses of IFOAM - Organics International. It is also a partner in projects such as the Productivity and Profitability of Organic and Conventional Farming Systems (ProEcoOrganicAfrica),4 PROGROV,5 the Ecological Organic Agriculture Initiative, and Organic Trade Development in East Africa (OTEA).6 AfrONet has a permanent seat on the Continental Steering
1 Jordan Gama, President AfrONet and CEO Tanzanian Organic Network (TOAM), Dar es Salaam, Tanzania. www.afronet.bio and www.kilimohai.org/TOAM 2 Information about AfrONet is available at www.afronet.bio. 3 The aim of EOAI, the Ecological Organic Agriculture Initiative for Africa, is to promote ecologically sound strategies and practices among diverse stakeholders in production, processing, marketing and policy making to safeguard the environment, improve livelihoods, alleviate poverty and guarantee food security. 4 Information about the ProEcoOrganicAfrica is available at www.ProEcoAfrica.net 5 Productivity and Growth in Organic Value-chains (ProGrOV) is led by the International Centre for Research in Organic Food Systems (ICROFS), Denmark. More information is available at http://drp.dfcentre.com/project/productivity-and-growth-organic-value-chains-progrov. 6 OTEA is the Organic Trade and Value Chain Development project-run by IFOAM – Organics International http://www.ifoam.bio/en/organic-trade-and-value-chain-development-otea

Africa › Overview
FiBL & IFOAM – Organics International (2018): The World of Organic Agriculture. Frick and Bonn 175
Committee (headed by the African Union) and Regional/Cluster Steering Committees of the Ecological Organic active regional networks Agriculture Initiative (EOAI). In collaboration with the African Union Commission (AUC), training on organic standards and certification is provided to stakeholders in the member countries of the Common Market for Eastern and Southern Africa (COMESA), the Economic Community of West African States (ECOWAS), and the East African Community (EAC). Furthermore, the Kasisi training centre in Zambia was identified by the AUC as one of the satellite centres for organic training on the continent, and the African Union Commission has approved the continent-wide Organic Product Standard for Africa.
Organic agriculture conferences
Organic conferences in Eastern, Western, Central and Southern Africa have become a success. Several West African organic conferences have been held, and the next East African Organic Conference is scheduled for May 2018. The Fourth African Organic Conference will take place in November 2018, in Yaoundé, Cameroon. These conferences mark significant milestones for mainstreaming Ecological Organic Agriculture (EOA)1 in the regions and for member countries’ policies, strategies, and programmes. Furthermore, in June 2017, AfrONet organized a policy forum for the East African region and continued to support NOARA, the Network of Organic Agriculture Research in Africa, to stage a conference in December 2017, in Uganda. Bringing strong African representation to the Organic World Congress in November 2017, in India, Morocco bid to host the next Organic World Congress in 2020, in Marrakech. However, the voting process placed Morocco second after France, which was still a big milestone.2
Strategic Plan (2015-2025) for the Ecological Organic Agriculture Initiative (EOAI) for Africa
The Continental Steering Committee of the Ecological Organic Agriculture Initiative (EOAI-CSC) endorsed the Ecological Organic Agriculture (EOA) Continental Strategic Plan, which was unanimously approved by the African Union Ministerial Council at its special meeting held on October 5 and 6, 2015 in Addis Ababa, Ethiopia. The Strategic Plan (2015-2025) provides a visionary direction for the development of Ecological Organic Agriculture on the African continent and serves as a tool for fundraising. This is a significant milestone towards implementing the decision made by African heads of state and governments on organic farming.
1 According to the EAO Initiative (2015), Ecological Organic Agriculture is a “holistic system that sustains the health of ecosystems and relies on functional cycles adapted to local conditions, rather than the use of synthetic inputs which have adverse effects on total health (human, animal, plant and environmental). 2 Editors’ note: The 7th IFOAM International Scientific Conference took place in 1988 in Ouagadougou, Burkina Faso, entitled “Agriculture alternatives and nutritional self sufficiency.”

Africa › Overview
176 FiBL & IFOAM – Organics International (2018): The World of Organic Agriculture. Frick and Bonn
The Ecological Organic Agriculture Initiative, which started as a pilot programme in 2012, was launched as a full-fledged programme in 2014 and will end in 2018. It experienced encouraging growth over the past few years. According to the statistics in this book, organic land continues to increase, as the eating habits of our populations are changing, and health consciousness is growing. The demand for healthy organic products on the national, regional and continental markets has grown and surpassed the supply. The voices of EOA stakeholders are being heard in Africa and beyond, and international support is steadily increasing. Approval of the EOA Strategic Plan by the African Union Ministerial Council has come at the very right moment, as there could not be a better time to plan and develop strategies to guide this growth and reap the maximum impact and benefits from organic farming in a sustainable way.
Outlook
Organic growth projections show a substantial increase in organic production in Africa, with the potential for millions of smallholder farmers and their families to move out of poverty, gain food security, and enjoy a better quality of life. The fact that traditional African agriculture is based on low external inputs provides an excellent foundation upon which organic agriculture can enhance productivity, resilience, and the profitability of smallholder farming in Africa. It is, therefore, an ideal development option for Africa. Organic farming practices integrate traditional farming methods and the use of affordable, locally available resources. As such, they are highly relevant to a majority of African farmers. Therefore, the necessary intensification of agricultural production in Africa can and should be ecological, maintain ecosystem services, and be based on restoring, building, and maintaining the natural resource base, particularly soil, water, and biodiversity. Therefore, local communities, farmers, and their sustainable practices need to be supported and enhanced so that the potential benefits of improved agricultural systems, based on the principles of organic agriculture, can be unleashed and disseminated throughout the continent.
References and further reading African Union, Executive Council (2011): Decision on organic farming. Doc. EX.CL/631 (XVIII). Eighteenth
Ordinary Session. 24 - 28 January 2011, Addis Ababa, Ethiopia. Available at http://www.au.int/en/sites/default/files/decisions/9646 council_en_24_28_january_2011_executive_council_eighteenth_ordinary_session.pdf
Ecological Organic Agriculture (EOA) initiative, Continental Steering Committee (2015): The Ecological Organic Agriculture (EOA) Initiative in Africa. Action Plan 2015-2020. EOA Continental Steering Committee
Ecological Organic Agriculture (EOA) Initiative, Continental Steering Committee (2015): The Ecological Organic Agriculture (EOA)-Initiative. 2015-2025 Strategic Plan. EOA Continental Steering Committee, African Union Commission

Africa › Statistics
FiBL & IFOAM – Organics International (2018): The World of Organic Agriculture. Frick and Bonn 177
Africa: Current Statistics
JULIA LERNOUD,1 HELGA WILLER2 AND BERNHARD SCHLATTER3
There were over 1.8 million hectares of agricultural land in 2016, which is 0.2 percent of the continent’s total agricultural area and 3 percent of the global organic agricultural area. The organic agricultural land in Africa has increased by almost 119’000 hectares or 7 percent compared to 2015, and it increased by more than 1.7 million hectares from the 52’000 hectares in 2000. In 2016, 40 countries reported data on organic farming. Tanzania is the country with the largest organic area, with almost 270’000 hectares, and Uganda is the country with the highest number of organic producers, with over 210’000. The country with the highest organic share of the total agricultural land is the island state of Sao Tome and Principe, with 13.8 percent of its agricultural area being organic, followed by Egypt with 2.8 percent and Comoros with 1.9 percent.
Land use
In 2016, over half of all organic agricultural land was used for permanent crops (more than 1 million hectares) in Africa. Almost 30 percent was used for arable crops (over 525’000 hectares), and almost two percent (over 38’000 hectares) was grassland/grazing area. For 11 percent of the organic agricultural land no details were available.
Tunisia (almost 176’000 hectares, mainly olives), Ethiopia (161’000 hectares, mainly coffee), Uganda (157’000 hectares mainly nuts and coffee,), the United Republic of Tanzania (over 124’000 hectares, mainly coffee and cocoa), and Kenya (112’000 hectares, mainly nuts) had the largest organic permanent crop areas. The key organic permanent crop is coffee, with over 380’000 hectares reported, 12.7 percent of the total coffee area of the region. The largest organic coffee areas are in Ethiopia (over 160’000 hectares) and Tanzania (almost 94’000 hectares). The organic coffee area has increased 21-fold since 2004; some of the increase can be attributed to the continually improving data availability. Cocoa was grown on almost 111’000 hectares, and it has grown 48-fold since 2004, representing 1.7 percent of the continent’s cocoa area. The largest areas of organic cocoa are found in the Democratic Republic of Congo (37’000 hectares), Tanzania (29’000 hectares), and Sierra Leone (over 20’300 hectares).
Almost thirty percent of the organic farmland was used for arable crops, most of which are oilseeds (almost 196’000 hectares, 0.7 percent of the total oilseed area; mainly sesame), textile crops (136’000 hectares, 2.7 percent of the region’s total cotton 1 Julia Lernoud, Research Institute of Organic Agriculture (FiBL), Frick, Switzerland, www.fibl.org 2 Helga Willer, Research Institute of Organic Agriculture (FiBL), Frick, Switzerland, www.fibl.org 3 Bernhard Schlatter, Research Institute of Organic Agriculture (FiBL), Frick, Switzerland, www.fibl.org

Africa › Statistics
178 FiBL & IFOAM – Organics International (2018): The World of Organic Agriculture. Frick and Bonn
area), and cereals. Almost 63 percent of the region’s cotton is found in the United Republic of Tanzania (almost 85’000 hectares), followed by Sudan (15’000 hectares).1 Since 2004, the organic cotton area grew 14-fold. Cereals were grown on almost 67’000 hectares in 2016; the key producing countries were the United Republic of Tanzania (almost 51’000 hectares), Egypt (over 8’000 hectares), and Senegal (almost 4’000 hectares).
Producers
There were at least 741’000 organic producers in Africa. The countries with the most organic producers are Uganda (over 210’000), Ethiopia (over 203’000), and the United Republic of Tanzania (148’000). It can be assumed that the number of producers is higher because some countries only report the number of farm enterprises/companies.
Wild collection
Wild collection has an important role in Africa with over 12 million hectares certified as organic in 2016. Zambia is the country with the largest area (6.7 million hectares, mainly beekeeping), followed by Namibia (2 million hectares, medicinal plants), South Africa (1 million hectares, mainly devil’s claw), Somalia (almost 850’000 hectares, mainly natural gums), and Zimbabwe (300’000 hectares, mainly baobab). Medicinal plants, such as devil’s claw (Harpagophytum procumbens) are the commodities that have the largest wild collection area (over 3 million hectares), followed by oil plants (over 766’000 hectares), such as argan (with almost 67’000 hectares). Beekeeping is the key activity in organic wild collection in Africa with almost 6 million hectares. Zambia is the country with the largest wild collection area used for organic beekeeping with 5.9 million hectares, representing 99 percent of the total beekeeping area.
For more information about the African figures, see data tables for Africa, page 182.
1 Please note that due to differences in the methodology, the cotton figures presented in this chapter differ from those from the Textile Exchange.

Africa › Statistics › Graphs
FiBL & IFOAM – Organics International (2018): The World of Organic Agriculture. Frick and Bonn 179
Organic Agriculture in Africa: Graphs
Figure 59: Africa: The ten countries with the largest organic agricultural area 2016
Source: FiBL survey 2018, based on information from the private sector, certifiers, and governments. For detailed data sources see annex, page 330
Figure 60: Africa: The countries with the highest organic share of total agricultural land 2016
Source: FiBL survey 2018, based on information from the private sector, certifiers, and governments. For detailed data sources see annex, page 330
60'023
69'686
94'386
105'908
130'000
154'488
181'076
186'155
262'282
268'729
0 50'000 100'000 150'000 200'000 250'000 300'000
Madagascar
Sierra Leone
Congo, D.R.
Egypt
Sudan (2014)
Kenya
Tunisia
Ethiopia
Uganda
Tanzania
Hectares
Africa: The ten countries with the largest organic area 2016Source: FiBL survey 2018
0.6%
0.6%
0.7%
1.8%
1.8%
1.8%
1.8%
1.9%
2.8%
13.8%
0% 5% 10% 15%
Togo
Cape Verde
Tanzania
Sierra Leone
Réunion (France)
Tunisia
Uganda
Comoros
Egypt
Sao Tome and Principe
Share of total agricultural land
Africa: The countries with the highest organic share of total agricultural land 2016Source: FiBL survey 2018

Africa › Statistics › Graphs
180 FiBL & IFOAM – Organics International (2018): The World of Organic Agriculture. Frick and Bonn
Figure 61: Africa: Development of organic agricultural land 2000 to 2016
Source: FiBL-IFOAM-SOEL-surveys 2000-2018
Figure 62: Africa: Use of organic agricultural land 2016
Source: FiBL survey 2018, based on information from the private sector, certifiers, and governments. For detailed data sources see annex, page 330
0.05
0.230.32 0.36
0.51 0.49
0.68
0.86 0.891.00
1.08 1.071.15 1.21 1.26
1.681.80
0.0
0.2
0.4
0.6
0.8
1.0
1.2
1.4
1.6
1.8
2.0
2000
2001
2002
2003
2004
2005
2006
2007
2008
2009
2010
2011
2012
2013
2014
2015
2016
Mill
ion
hect
ares
Africa: Development of organic agricultural land 2000 to 2016Source: FiBL-IFOAM-SOEL-Surveys 2001-2018

Africa › Statistics › Graphs
FiBL & IFOAM – Organics International (2018): The World of Organic Agriculture. Frick and Bonn 181
Figure 63: Africa: The ten countries with the largest number of organic producers 2016
Source: FiBL survey 2018, based on information from the private sector, certifiers, and governments. For detailed data sources see annex, page 330
9'934
10'061
12'619
18'398
20'210
36'571
37'295
148'610
203'602
210'352
0 50'000 100'000 150'000 200'000 250'000
Togo
Zambia
Mali (2014)
Senegal
Madagascar
Congo, D.R.
Kenya
Tanzania (2014)
Ethiopia
Uganda
Producers
Africa: The ten countries with the largest number of organic producers 2016Source: FiBL survey 2018

Africa › Statistics › Tables
182 FiBL & IFOAM – Organics International (2018): The World of Organic Agriculture. Frick and Bonn
Organic Agriculture in Africa: Tables
Table 44: Africa: Organic agricultural land, organic share of total agricultural land and number of organic producers 2016
For information on data year, see page 330.
Country Area [ha] Share of total agr. land [%] Producers [no.]
Algeria 772 0.002% 64 Benin 5’679 0.2% 3’153 Burkina Faso 27’268 0.2% 9’036 Burundi 103 0.0% 35 Cameroon 380 0.004% 193 Cape Verde 495 0.6%
Chad Wild collection only Comoros 2’577 1.9% 1’540 Congo, D.R. 94’386 0.4% 36’571 Côte d’Ivoire 42’004 0.2% 494 Egypt 105’908 2.8% 970 Ethiopia 186’155 0.5% 203’602 Ghana 21’326 0.1% 2’673 Guinea-Bissau 689 0.04%
Kenya 154’488 0.6% 37’295 Lesotho 548 0.02% 4 Madagascar 60’023 0.1% 20’210 Malawi 12’239 0.2% 7 Mali 11’919 0.03% 12’619 Mauritius 13 0.01% 22 Morocco 10’000 0.03% 80 Mozambique 7’412 0.01% 3 Namibia 30’127 0.1% 25 Niger 262 0.001%
Nigeria 52’421 0.1% 102 Réunion (France) 881 1.8% 203 Rwanda 1’284 0.1% 4’013 Sao Tome and Principe 6’706 13.8% 3’738 Senegal 7’172 0.1% 18’398 Sierra Leone 69’686 1.8% 1’400 Somalia Wild collection only South Africa 14’196 0.01% 196 Sudan 130’000 0.2% 354 Swaziland 5 0.0004%
Tanzania, United Republic of 268’729 0.7% 148’610 Togo 21’572 0.6% 9’934 Tunisia 181’076 1.8% 3’400 Uganda 262’282 1.8% 210’352 Zambia 7’738 0.003% 10’061 Zimbabwe 3’179 0.0% 2’006 Total* 1’801’699 0.2% 741’367
Source: FiBL survey 2018, based on information from the private sector, certifiers, and governments. For detailed data sources see annex, page 330 *Total number includes data for countries with less than three operators.

Africa › Statistics › Table
FiBL & IFOAM – Organics International (2018): The World of Organic Agriculture. Frick and Bonn 183
Table 45: Africa: All organic areas 2016
Country Agriculture [ha] Forest [ha] Wild collection
[ha] Total [ha]
Algeria 772
628 1’400 Benin 5’679
4’505 10’184
Burkina Faso 27’268
80’068 107’336 Burundi 103
103
Cameroon 380
380 Cape Verde 495
495
Chad
124’130 124’130 Comoros 2’577
63 2’641
Congo, D. R. 94’386 94’386 Côte d’Ivoire 42’004
344 42’348
Egypt 105’908
60’000 165’908 Ethiopia 186’155
9’033 195’188
Ghana 21’326
33’592 54’918 Guinea-Bissau 689
689
Kenya 154’488
121’625 276’113 Lesotho 548
50’000 50’548
Madagascar 60’023
10’897 70’920 Malawi 12’239
6’319 18’558
Mali 11’919
8’146 20’065 Mauritius 13
13
Morocco 10’000 35 170’035 180’070 Mozambique 7’412
147’930 155’342
Namibia 30’127
2’041’901 2’072’028 Niger 262
262
Nigeria 52’421 150 1’000 53’571 Réunion (France) 881
881
Rwanda 1’284
12 1’296 Sao Tome and Principe 6’706
6’706
Senegal 7’172
22’000 29’172 Sierra Leone 69’686
69’686
Somalia
849’482 849’482 South Africa 14’196
1’092’563 1’106’758
Sudan 130’000
84’960 214’960 Swaziland 5
5
Tanzania 268’729
15’040 283’769 Togo 21’572
242 21’814
Tunisia 181’076 13’538 45’486 240’100 Uganda 262’282
158’328 420’610
Zambia 7’738
6’700’680 6’708’418 Zimbabwe 3’179
300’600 303’779
Total 1’801’699 13’723 12’119’609 13’955’031
Source: FiBL survey 2018, based on information from the private sector, certifiers, and governments. For detailed data sources see annex, page 330

Africa › Statistics › Tables
184 FiBL & IFOAM – Organics International (2018): The World of Organic Agriculture. Frick and Bonn
Table 46: Africa: Land use in organic agriculture 2016
Land use Crop group Area [ha] Agricultural land, no details 65’020 Arable land crops Arable crops, no details 11’801 Cereals 66’765 Dry pulses 1’955 Fallow land, crop rotation 227 Flowers and ornamental plants 159 Green fodders from arable land 5’323 Industrial crops 84 Medicinal and aromatic plants 36’470 Mushrooms and truffles 1 Oilseeds 195’532 Root crops 19’509 Seeds and seedlings 4 Strawberries 510 Sugarcane 7’480 Textile crops 136’033 Tobacco 5 Vegetables 37’622 Arable crops, other 6’170 Arable land crops total 525’649 Cropland, no details 121’055 Other agricultural land Home gardens 2 Unutilised land 4’490 Other agricultural land, no details 483 Other agricultural land total 4’975 Permanent crops Berries 23 Citrus fruit 7’532 Cocoa 111’328 Coconut 22’391 Coffee 381’090 Flowers and ornamental plants, permanent 2 Fruit, no details 333 Fruit, temperate 5’270 Fruit, tropical and subtropical 58’448 Grapes 2’915 Medicinal and aromatic plants, permanent 71’402 Nurseries 2 Nuts 197’890 Olives 140’022 Tea/mate, etc. 9’113 Permanent crops, other 39’072 Permanent crops total 1’046’832 Permanent grassland 38’168 Total 1’801’699
Source: FiBL survey 2018, based on information from the private sector, certifiers, and governments. For detailed data sources see annex, page 330

Africa › Statistics › Table
FiBL & IFOAM – Organics International (2018): The World of Organic Agriculture. Frick and Bonn 185
Table 47: Africa: Use of wild collection areas 2016
Land use Area [ha] Apiculture 6’053’881 Fruit, wild 41’150 Medicinal and aromatic plants, wild 3’095’542 Nuts, wild 99’502 Oil plants, wild 766’663 Rose hips, wild 108’700 Wild collection, no details 1’954’171 Total 12’119’609
Source: FiBL survey 2018, based on information from the private sector, certifiers, and governments. For detailed data sources see annex, page 330


FiBL & IFOAM – Organics International (2018): The World of Organic Agriculture. Frick and Bonn 187
Asia
Map 3: Organic agricultural land in the countries of Asia 2016 (in hectares)
Source: FiBL survey 2018 based on information from the private sector, certifiers, governments, and, the Mediterranean Organic Agricultural Network (MOAN) for the Mediterranean countries For detailed data sources see annex, page 330.

Asia › Overview
188 FiBL & IFOAM – Organics International (2018): The World of Organic Agriculture. Frick and Bonn
Asia Sector Report
COMPILED BY IFOAM ASIA1
Summary
In 2017, there was an overall increase in organic production in all countries that submitted their contributions to the Asia sector report for this book. Exports of organic products are also increasing as seen in the example of Bangladesh. An interesting development was the significant increase of national and local organic groups in China, such as organic marketing clubs or organic marketing alliances as market platforms. Community Supported Agriculture (CSA) and Participatory Guarantee Systems (PGS) are also attracting much interest. A mutual recognition of certified organic products between China and New Zealand was signed at the end of 2016. The authorities in India introduced a common logo for organic foods – “Jaivik Bharat.” The relevant information to verify the authenticity of third-party and PGS certified organic produce is recorded in a database and the associated portal. The PGS certification provides small and marginal farmers with better access to certified organic markets. The Philippines saw an increase in active involvement of more than 120 local municipal mayors in the development of organic agriculture. Some municipalities such as Dumingag, Kasuwagan, and Bislig are now recognized internationally for their exemplary development of organic agriculture as a tool for poverty alleviation, peace-building and overall sustainable development of a city, which has mainstreamed organic farming in all its policies.
Bangladesh
The Bangladesh government approved its “National Organic Agricultural Policy 2016” on November 7, 2016 with the objective of setting up a National Organic Standard Board (NOSB) under the Ministry of Agriculture. It aims to oversee activities such as developing and updating standards and a certification system, and facilitating the export of organic products. Although the NOSB has not yet been formally launched, there has been a boost in the expansion of organic farming in the private sector.
Organic area and production are gradually increasing in Bangladesh. Tea is a major organic product that has been exported to the global market by Kazi & Kazi since 2010. The company registered a 10 percent increase in export volume in 2017 over the previous year, although the area under organic cultivation remains the same.
1 Contact: Jennifer Chang, Vice President of IFOAM - Organics International and Executive Director of IFOAM Asia, Seoul, South Korea, e-mail [email protected]

Asia › Overview
FiBL & IFOAM – Organics International (2018): The World of Organic Agriculture. Frick and Bonn 189
Another tea company, Sabazpur Tea Ltd., started producing organic tea in 2017. They produced 12.4 tonnes of organic black tea and 2.4 tonnes of organic green tea on an area of 67.2 hectares; in total, they manage 205 hectares organically. Their products are being third-party certified and currently are more focused on local markets rather than export markets. The company plans to begin exporting their products in 2018.
The cashew nut is another organic product that is planned to be exported from Bangladesh. Approximately 800 tonnes of cashew nuts were produced in an area of about 3’000 hectares with the facilitation of the country’s Ministry of Commerce and the Bangladesh Organic Products Manufacturer’s Association (BOPMA). Production is expected to exceed 1’200 tonnes in 2018.
Furthermore, activists and entrepreneurs that are engaged in organic production in Bangladesh are currently focusing on the development of the local market. Supermarkets in Dhaka are now selling organic products. Some young entrepreneurs have come forward to start online marketing systems based on contract farming with the local farmers. Agricultural research organizations have adopted programs to develop organic techniques for producing high-value products like tomatoes, mangos, bananas, and even potatoes for export purposes. There are also programs for rice, which remains the major crop in Bangladesh.
China
The national government of China has declared “Green Development” as one of its development strategies, and the development of organic agriculture is among the actions adopted to this effect.
The Chinese Certification and Accreditation Administration (CNCA) has implemented a new policy to make the registration of organic certification bodies (CB) easier. At the same time, it has enforced stricter supervision on the operation of the CBs. Toward the end of 2017, more than 60 CBs were registered under CNCA for organic certification – twice as many as in the previous year.
Efforts to establish national and local organic groups, such as organic marketing clubs or organic marketing alliances, significantly increased in 2017, and interest in organic products has been increasing through the establishment of organic market platforms.
An alliance of local organic associations, mainly provincial associations, has been established, and actively promotes the exchange of experiences and information, the discussion of development strategies, and the promotion of market platforms.
Based on the expansion of Community Supported Agriculture (CSA) in China, participatory guarantee systems (PGS) have become a hot topic within the organic sector. More and more people are becoming interested in the organization and the implementation of the different kinds of PGS groups, although PGS is not yet officially recognized in China. The government authority has, however, been showing interest in the progress of such systems.

Asia › Overview
190 FiBL & IFOAM – Organics International (2018): The World of Organic Agriculture. Frick and Bonn
As the world’s third largest organic single market (accounting for 7 percent of the global organic sales value in 2016), the organic market in China continued to grow in 2017. More and more countries are showing interest in exporting their organic products to China. After the signing of a bilateral agreement on mutual recognition of certified organic products between China and New Zealand at the end of 2016, an increasing number of countries are seeking the possibility of developing the same relationship with China, aiming at the Chinese organic market. The number of organic inspections and certifications conducted by Chinese organic CBs in other countries has seen a big increase in 2017.
Hong Kong SAR, China
With growing public concerns over food safety and environmental protection, the Hong Kong government has begun to promote organic farming. While organic farming can produce food in an environmentally friendly and sustainable manner and better protect our farmlands and countryside, it can also open up a niche market that can generate premium prices for local farmers. Moreover, it can offer a wider and better choice of fresh vegetables to residents.
In December 2000, the Agriculture, Fisheries and Conservation Department (AFCD) launched the Organic Farming Support Service (OFSS) to provide support to farmers engaged in organic farming. In 2002, the Hong Kong Organic Resource Centre (HKORC) was established to set up the organic standards for crop production and processing. An independent third-party certification body, the Hong Kong Organic Resource Centre Certification Ltd. (HKORC-Cert), was established in late 2004 to provide independent certification services to local organic farmers and organic processors. HKORC-Cert has been IFOAM-accredited since March 2012.
As at the end of 2016, 297 vegetable farms, with a total of 107 hectares, have made use of the Organic Farming Support Service. At the same time, 146 local farms, covering an area of 85 hectares, is certified under HKORC-Cert’s certification service.
Currently, there is no regulatory control or legal definition of organic farming/organic produce in Hong Kong, and consumers have to rely on the certification service of HKORC-Cert for local organic produce.
Local organic farmers produce an average of approximately 6 tonnes of over 30 varieties of organic vegetables per day. Organic vegetables constitute less than 0.3 percent of the fresh vegetables sold. Currently, organic produce is mainly sold through wholesale vegetable markets, farmers’ markets, direct sales to hotels or restaurants, “pick-your-own” farms, wet markets, health food stores and on-line orders.
Consumer survey results from HKORC show that almost 3 percent of the population bought organic products daily in 2016, and there was an increase in total sales of 12 percent as compared to 2015. A double-digit increase in organic sales is expected in
Asia › Overview
FiBL & IFOAM – Organics International (2018): The World of Organic Agriculture. Frick and Bonn 191
the coming year. The organic sector of Hong Kong expects continued steady growth in the future.
India
One of the significant developments in the Indian organic sector during the past year has been the recognition of Participatory Guarantee Systems (PGS) by the government at the policy and implementation levels. Recently, the Food Safety and Standards Authority of India (FSSAI) launched an “Indian Organic Integrity Database” to help consumers verify the authenticity of organic food. It has also introduced a common logo for organic foods with the tagline “Jaivik Bharat.” The database and the associated portal verify the authenticity of the organic produce – certified by either third-party systems or Participatory Guarantee Systems (PGS). This development brings more small and marginal farmers within the ambit of certified organic markets. In addition to the 1.5 million organic hectares certified through the third-party systems, there are over 200’000 hectares certified under PGS.
The scope for certification of organic farm produce is far beyond this. It is estimated that at least 18 million hectares in the North-eastern region of India are traditionally organic, and so are many other farms managed by tribal populations and those in totally rain-fed areas. For instance, Sikkim, in the Northeast of India, is heavily mountainous and there is little farmland. Because most of these areas are very poor, farmers have little access to chemical inputs. It has therefore been easy for Sikkim to become fully organic.
The challenge is to recognize these products, which do not have any certification, as organic in the markets. PGS is one step in this direction.
The other major step is the declaration of entire states and districts as organic by prohibiting the use of chemicals through effective regulations. Sikkim, a state in Northeast India, with a cultivated area of 56’000 hectares, has been declared as organic. Arunachal Pradesh and Mizoram, two other states of Northeast India, are on the path to follow this suit. Similarly, Kasargode, a district of Kerala state in Southern India, has drafted a roadmap leading to become an organic district.
There is a rising demand for organic produce in the domestic and international markets. The export of organic products is estimated to triple by 2020, and the domestic market is also showing a similar trend. Presently, about one fifth of the total third-party certified organic produce is exported, while the rest is sold mainly in large cities in India. The PGS-certified products are sold almost entirely within the country. India is among the key players in the organic sector globally, with the largest number of certified organic producers in the world and an ever-growing market for organic produce.

Asia › Overview
192 FiBL & IFOAM – Organics International (2018): The World of Organic Agriculture. Frick and Bonn
Iran
Organic production has attracted significant attention in Iran. Positive measures have been taken, although further steps are required to catch up with the global pace of organic production, mainly through filling existing information gaps.
For the Iranian Organic Movement 2017 was a fruitful year:
• Policy & Action Plan: The Ministry of Agriculture established a “Committee on Organic Agriculture” to provide relevant policies and an action plan for the development of organic agriculture in Iran.
• Production: The future for organic agriculture in Iran is very positive. The growth rate experienced over the last few years suggests a fast and considerable development of the sector. Iran may become a central area for producing high-value organic products with a world-wide demand, such as saffron, pistachio, pomegranate, and medical plants.
• Market Development: The Iran Organic Association and IFOAM-IRAN in cooperation with the Management of Fruit and Vegetable Organization of Municipality of Tehran hosted the “Tehran Organic Week Festival” (31 December 2016 to 6 January 2017), which plays an important role in developing and promoting the marketing of organic products. Currently, there are 67 recognized organic shops, which also supply organic products to hypermarkets across the country.
• Membership of IFOAM Asia and the Asian Local Governments of Organic Agriculture (ALGOA): IFOAM-IRAN joined IFOAM Asia as a member for regional cooperation. Together with the Management of Fruit and Vegetable Organization of the Municipality of Tehran, IFOAM-IRAN signed a Memorandum of Understanding as a partner of ALGOA at the third ALGOA summit in South Korea. (See article by Jennifer Chang, page 198).
• Workshops: in addition to several local workshops, IFOAM-IRAN, in cooperation with the IFOAM Apiculture Forum, hosted the “Organic Apiculture” workshop in Tehran in July 2017. This workshop aimed at supporting the development of production and marketing of organic honey products and beekeeping. More than 120 participants from different disciplines, such as beekeepers (individual or from cooperatives), postgraduate students, faculty members, scientists, traders, stakeholders, and private and governmental authorities attended this 2-day workshop.
• IFOAM Academy: Two participants from Iran attended the Organic Leadership Course held in Croatia in May 2017.
Japan
The organic market is showing stable growth in Japan. Not only have imports increased, but the number of exported organic products, such as green tea, have also increased (up to 34 percent) after the agreement of equivalency with other countries (see also article by Beate Huber in this report, page 152).

Asia › Overview
FiBL & IFOAM – Organics International (2018): The World of Organic Agriculture. Frick and Bonn 193
The consumer demand for organic food as well as non-food products, like organic cosmetics and organic textiles, is growing. Today, organic does not only mean “safe and healthy food,” but it is understood as a form of sustainable lifestyle.
Following this trend, a new trade fair called “Organic Lifestyle Expo” was organized for the first time in 2016, and in 2017, more than 22’000 visitors came to the fair. Another international organic fair in Yokohama city brought 181 exhibitors and 14’000 visitors.
A gathering of local government officers, who aim to promote and support organic agriculture, was held in July with about 100 people participating. This demonstrates the high interest of local governments to promote organic agriculture.
Although the number of certified organic farmers has slightly increased, the amount of certified organic land has decreased. The percentage of certified organic land remains at 0.2 percent.
The organic regulation of the Japanese Agricultural Standard (JAS) was revised, and minor changes were implemented in April 2017.
The Japanese Diet, Japan’s bicameral legislature, passed a bill to abolish the “Main Crops Seed Law of Japan” in the spring of 2017, which will be carried out in April 2018. Under this law, seed production has been protected and supported by the government. There are concerns that this change will lead to the privatization of seeds, increase in seed price, and the loss of seed diversity.
Korea
2017 was a year of confusion in Korean society over pesticide-contaminated eggs. Pesticide contamination was found in eggs from farms certified under environmentally friendly standards (antibiotic-free certification). Traces of DDT were also found in some certified organic eggs. This led to a decrease in the consumption of environmentally-friendly certified agricultural products and deep distrust among consumers.
The government has announced stronger measures to strengthen the certification system, but without the resolution of structural problems, similar problems are bound to continue in future. Organic groups voiced their concerns that the government is only concerned about food safety (absence of chemicals) and does not have a broad understanding of organic agriculture as a holistic production system with health, environmental, economic and social impacts. Some groups have voiced their wish to move away from third-party certification and toward “self-certification” (PGS).
With the appointment of the new government in May 2017, due to early presidential elections caused by the impeachment of the former President, it was hoped that changes in the agricultural sector would take place. So far, the new government has not carried out any new changes but has been following the policies set in place by the former administration.
Asia › Overview
194 FiBL & IFOAM – Organics International (2018): The World of Organic Agriculture. Frick and Bonn
However, one expected positive step is the implementation of the direct payment system for “environmental preservation services” announced in the fourth “5-Year Plan of the Environmentally-Friendly Agriculture Promotion Law” in March 2016.
At the private sector level, organic farming groups (including farmer groups and consumer cooperatives) have been calling on the government to increase direct payments to preserve farm incomes, to implement full labelling of GMO, to stop research on GMO commercialization, and to increase environmentally friendly food for both schools and public food procurement.
Philippines
The League of Organic Agriculture Municipalities and Cities in the Philippines (LOAMC-PH) is the only national organization within the governance structures of municipalities, cities, and the national government departments, in which Local Chief Executives (LCEs) or mayors pro-actively engage in the institutionalization of organic agriculture in the Philippines.
Although the Philippines approved the National Organic Agriculture Law in 2010 with corresponding implementation through the National Organic Agriculture Program (NOAP), the results are not convincing. The NOAP 2012-2016 target that 5 percent of the Philippine’s agricultural land should be converted to organic systems has not yet been achieved; currently only about two percent of the agricultural land is organic. The NOAP implementation by the Department of Agriculture (DA) is constrained by the capacities of its personnel in terms of medium to long-term strategic interventions and approaches. Organic agriculture is viewed as technology-related and not based on the foundational principles and philosophies that would guide the department and its personnel on the sustainability approaches together with farmers and other key stakeholders.
To fill this gap and to align with the implementation of the NOAP, the LOAMC-PH organized a systematic, sustainable organic agriculture development approach, which addresses:
• Proactive recruitment of municipal mayors to become LOAMC-PH members: By the end of the 3rd quarter of 2017, over 120 mayors were members, representing at least 8 percent of the 1’489 municipalities and component cities (46) in the Philippines (in total 1’535). Their commitment corresponds to a potential conversion of 1.2 million hectares of farmland in these municipalities/cities. The minimum municipal agricultural land amounts to 10’000 hectares.

Asia › Overview
FiBL & IFOAM – Organics International (2018): The World of Organic Agriculture. Frick and Bonn 195
• Institutionalization of the development approaches in family farms and municipalities/cities: LOAMC-PH started to formally support the systematic conversion of family farms and municipalities/cities by offering a four-week training course entitled “Bridging Leadership and Governance in Asset Based Sustainable Organic Agriculture Development” (BLG-ABSOA). This course was held in cooperation/partnership with the SEAOIL Foundation Inc. (SFI) and the Agricultural Training Institute of the Department of Agriculture (DA-ATI). The development of the course is based on the experiences of Dumingag in the province of Zamboanga del Sur, Kauswagan in the province of Lanao del Norte, and Bislig City in the province of Surigao del Sur, which are all are aiming to be a “Model City for Organic Agriculture in the Philippines” by 2020.
As mentioned above, one of the major constraints is the mind-set that views organic agriculture as technology and not as a sustainable development solution. Hence, the national government’s intervention is mostly targeted toward input substitution, e.g., replacing chemical fertilizers with organic fertilizers, while organic seeds and organic feed is not immediately accessible. The national program is more focused on business as usual, especially when it comes to the use of hybrid seeds that require synthetic chemicals, or seeds generally used in conventional agriculture. There is a lack of financial support for organic agriculture, and the budget for organic agriculture constitutes only 2 percent of the annual budget of the Department of Agriculture.
Thailand
Organic agriculture continues to develop, with stable expansion of organic farms with both third-party certification and participatory guarantee systems (PGS). PGS appears to be the exciting word for many local producers, who are left out of third-party certification schemes, and a large expansion of organic farms is likely to take place in the coming years with PGS. Also, more processors, handlers, and traders began organic businesses. Even though primary organic products (e.g., rice, fresh vegetables) still dominate markets, both for exports and domestic consumption, a larger variety of processed organic products can be found in Thai markets.
Thai organic trade is very much export oriented, but domestic markets are expanding fast. Imports of processed products, mainly from the United States and the European Union, helped to enlarge product assortments. The Thai organic market is dominated by conventional modern trade and independent green/health shops. Lemon Farm, a dedicated health and organic supermarket, stands out as an exception. In 2016, Thai consumers started to hear more and more about high-end restaurants offering organic food.
The Thai government has long advocated organic agriculture as part of the policy framework, but little was done in concrete terms. Also, the government was trying to introduce compulsory labelling regulations, but this was met with strong opposition by the Thai organic movements. A national action plan (so-called "National Organic Development Strategy") was being drafted for over six years and was only finalized in

Asia › Overview
196 FiBL & IFOAM – Organics International (2018): The World of Organic Agriculture. Frick and Bonn
April 2017. The introduction of the "organic rice farming subsidy scheme" in mid-2017 lead to some confusion and controversy about the role of government versus private sector for the development of the organic sector in the country.
Vietnam
In 2017, the market for organic agricultural products in Vietnam showed a stable increase, supported by increased consumption and government policy. However, there is still mistrust among consumers due to many violations in food production and processing. Imports of organic products also grew steadily.
On the policy level, Vietnam does not have any legal regulations referring to organic production and support policies (the national standards were issued in 2015 but were not implemented). However, at the beginning of 2017, with the active policy advocacy of the Vietnam Organic Agriculture Association and the increasing demand for organic products, government and state agencies started to pay attention to the promotion of organic agriculture development. The government has requested the development of several policy documents, including: a decree on state management of organic agriculture, an action plan on the development of organic agriculture in Vietnam for 2018-2025, and the amendment and enhancement of the national standards on organic agriculture, suited to local and international conditions.
The decree on organic agriculture is under development with hopes of implementation in early 2018. Two organic certification schemes are being developed: a third-party certification system and a PGS certification system within the government system.
Achievements of IFOAM Asia in 2017
In 2017, IFOAM Asia focused on the expansion of activities in Asia, including Central Asia. Membership grew to 220 members (from 80 members in 2014 when it was legally established).
Great growth was seen in the Asian Local Governments of Organic Agriculture (ALGOA) project, where membership expanded to 55 members in 16 countries in Asia. There has been increasing interest and participation in the project from the local governments in Asia with some local governments expressing interest in the formation of local chapters of ALGOA in their respective countries. For more information see separate chapter on page 198.
About 500 local and foreign participants attended the 2nd IFOAM Asia Organic Congress in May 2017 in Xichong County, Sichuan Province, China, under the theme “Manifesting Local Organic Systems in Asia in the Era of Organic 3.0”.
The Vietnam Organic Agriculture Association became the first IFOAM member in Asia to officially celebrate September 19 as “Organic Day”, as adopted by the participants of the 2nd ALGOA Summit in 2016. The event was officially endorsed by the Ministry of Agriculture and Rural Development of Vietnam.

Asia › Overview
FiBL & IFOAM – Organics International (2018): The World of Organic Agriculture. Frick and Bonn 197
In September 2018, the 3rd IFOAM Asia Organic Congress will take place with the generous financial support of the city of Bislig and the central government of the Philippines. It will be a week-long celebration with international conferences, cultural events, trade fairs, organic trainings, etc. It will be the largest gathering of the organic sector in Asia in 2018.
Contributors by country
Bangladesh • Dr. Shaikh Tanveer Hossain, Program Officer, Agriculture Department, Asian
Productivity Organization, Japan, e-mail: [email protected] • Dr. Md. Khurshid Alam, Bangladesh Agricultural Research Institute (BARI), e-
mail [email protected] Bhutan • Pema Zangmo, Agriculture Supervisor-I, National Organic Programme E-mail:
[email protected] China • Zhou Zejiang, Senior Advisor of the Organic Farming Development Centre,
(OFDC) and-Ministry of Environmental Protection, e-mail: [email protected] Hong Kong • Wendy W. C. KO, Senior Agricultural Officer (Crop Development), Agriculture,
Fisheries and Conservation Department, e-mail [email protected] • Prof. Jonathan Wong, PhD, Medal of Honour, Justice of the Peace, Director, Hong
Kong Organic Resource Centre, e-mail: [email protected] India • Joy Daniel, Director, Institute of Integrated Rural Development, e-mail:
[email protected] Iran • Dr. M. Reza Ardakani, Director, IFOAM-IRAN email: [email protected] Japan • Miyoshi Satoko, Global Organic Textile Standard (GOTS) Representative in Japan,
e-mail: [email protected] Korea • Manchul Jung, Deputy director, Korea Institute of Rural Social Affairs, e-mail:
[email protected] Philippines • Vic Tagupa, Technical officer, League of Organic Agriculture Municipalities &
Cities (LOAMC), e-mail: [email protected] Thailand • Vitoon Panyakul, Green net, e-mail: [email protected] Vietnam • Dang Thi Bich Huong – Officer of Vietnam Organic Agriculture Association, e-
mail [email protected]

Asia › ALGOA Project
198 FiBL & IFOAM – Organics International (2018): The World of Organic Agriculture. Frick and Bonn
Working in Partnership with Local Governments - the ALGOA Project
JENNIFER CHANG1
Asian Local Governments for Organic Agriculture (ALGOA) is a special project initiated by IFOAM Asia in 2014 in efforts to connect eco-villages in India, Philippines, and South Korea. IFOAM Asia members in these countries have been working with local governments to develop a more holistic and integrated form of organic agriculture development, focusing on the “village” as a whole rather than on individual farmers.
The project was boosted with the financial support of Goesan County, South Korea and with the active participation of a visionary group of local municipal leaders from the Philippines under the “League of Organic Agriculture Municipalities and Cities (LOAMC)”. At that time, it was headed by the 2012 One World Award Winner, the Honourable Mayor Jun Pacalioga of Dumingag (Philippines). ALGOA was officially launched on September 19, 2015 in Goesan County, South Korea.
ALGOA is unique as it is an alliance built on cooperation between IFOAM Asia members and local governments in Asia. Any level of government below the central government, which promotes organic agriculture, is eligible to join ALGOA. Central governments or any IFOAM member outside Asia can join as “special members”.
Due to the emphasis on mutual collaboration between local governments and IFOAM Asia members, “full membership” (with voting rights) is given, when a local government joins with an IFOAM Asia member or if a local government is endorsed for membership by an IFOAM Asia member who is already an ALGOA member. “Associate membership” is given when a local government or an IFOAM Asia member join on their own.
As of August 2017, membership in ALGOA has increased to 55 members in 16 countries in Asia, including Iran and Kyrgyzstan.
Annual summit The most important activity of ALGOA is the annual summit, where local governments and IFOAM Asia members meet to learn about the major issues relevant to organic agriculture and share their best practices. Members learn about the diversity of the organic movements, get connected to the bigger international issues, and build relationships.
1 Jennifer Chang, Vice President of IFOAM Organics International and Executive Director of IFOAM Asia, e-mail [email protected]

Asia › ALGOA Project
FiBL & IFOAM – Organics International (2018): The World of Organic Agriculture. Frick and Bonn 199
For example, members learn how organic farming was successful in building peace in rebel-controlled areas (the “Arms to Farms” project of the municipality of Kasuwagan, Philippines), how a local government manifested policies to mainstream organic farming (Sikkim, India), how a central government aims to create “1000 Organic Villages” (Indonesia), or how a local school meal center was set up (Hongseong County, South Korea).
Memoranda of Understanding (MoU) between ALGOA members Memoranda of Understanding (MoU) were signed between the ALGOA members, and mutual visits took place, solidifying their networks and relationships. Members were also integrated into international partnerships such as the “Organic Food Systems Partnerships”, which recognizes diverse and comprehensive developments of organic agriculture in ALGOA member countries.
Organic agriculture training Another major activity of ALGOA is the fully-sponsored training in organic agriculture for local government officials and IFOAM Asia members. More than a hundred people in Asia from local governments and IFOAM Asia members have been trained under the ALGOA Organic Foundation Course (OFC) carried out in collaboration with the IFOAM Organic Academy.
IFOAM Asia Organic Youth Forum An interesting development of the first ALGOA Organic Foundation Course was that the trainees spontaneously decided to group themselves into the IFOAM Asia Organic Youth Forum and since then have been self-organizing and financing their trainings. One thing that was particularly noteworthy about these trainings was their efforts to connect organic pioneers with the younger generation in Asia. Organic pioneers from China, India, Japan, and Korea were invited to give special lectures and testimonials, and these events were very successful in inspiring the younger generation to join the organic movements. Many members of the Youth Forum were also present at the Organic World Congress in Delhi in November 2017.
Asia Organic Day In 2016, the participants of the 2nd ALGOA Summit adopted September 19th as “Asia Organic Day”. Vietnam was the first country to celebrate this day in 2017 with an organic conference and trade fair. In 2018, “Asia Organic Day” will be celebrated in the Philippines with the start of the 3rd IFOAM Asia Organic Congress in Bislig City.
Outlook 2018 From 2018 onwards, ALGOA will also focus on developing policies in support of small and marginal farmers in line with the recent UN Declaration of the “Decade of Family Farming (2019 - 2028)”.

Asia › Statistics
200 FiBL & IFOAM – Organics International (2018): The World of Organic Agriculture. Frick and Bonn
Asia: Current statistics
JULIA LERNOUD,1 HELGA WILLER,2 AND BERNHARD SCHLATTER3
Overview The area of organic agricultural land in Asia is almost 4.9 million hectares, which is 0.3 percent of the total agricultural area in the region. Nine percent of the global organic agricultural land is in Asia. Since 2001 (420’000 hectares), the organic land has grown over eleven-fold. Between 2015 and 2016, the organic area in Asia increased by over 900’000 hectares or 24 percent. The country with the largest organic agricultural area is China (2.3 million hectares), and the country with the most producers is India (835’000 producers). The countries with the highest organic shares of the total agricultural land are Timor-Leste (7.4 percent) and Sri Lanka (3.5 percent).
Land use
In Asia, 49 percent of all organic farmland was used for arable crops (2.4 million hectares) in 2016, 16 percent (775’500 hectares) for permanent crops, and one percent for grassland/grazing areas (over 32’000 hectares). Land use information was not available for 34 percent of the agricultural land, so we can assume that each category has a larger share of the total organic land. Cereals comprise the key organic arable crop group (mainly wheat and rice), with over 1 million hectares, representing 0.3 percent of the total cereal area in Asia. Most organic cereals were grown in China (over 811’000 hectares) and Kazakhstan (130’000 hectares, 2012 data). Oilseeds (mainly soybeans) are also an important crop group grown on at least 582’000 hectares (mainly in China and India) and represented 1 percent of the total oilseed area in Asia. The key organic cereals were rice, wheat and grain maize. Organic rice represented almost 36 percent of the total organic cereal area and, together with wheat (26 percent) and grain maize (18 percent), represented almost 80 percent of the total organic cereal area in Asia. Organic rice was mainly grown in China (almost 276’000 hectares), constituting 75 percent of the total organic rice in the region. The largest organic wheat areas were in China (147’000 hectares) followed by Kazakhstan (almost 120’000 hectares), representing almost all of the total organic wheat area in Asia. Most of the organic permanent crop land was used for coconuts (over 199’000 hectares), coffee (almost 112’000 hectares), temperate fruit (almost 100’000 hectares), and tea (93’000 hectares). The Philippines had the largest organic coconut area, with almost 150’000 hectares, representing over 75 percent of the total organic coconut area of the region. Most of the organic coffee in Asia was grown in Indonesia, where over 1 Julia Lernoud, Research Institute of Organic Agriculture (FiBL), Frick, Switzerland, www.fibl.org 2 Helga Willer, Research Institute of Organic Agriculture (FiBL), Frick, Switzerland, www.fibl.org 3 Bernhard Schlatter, Research Institute of Organic Agriculture (FiBL), Frick, Switzerland, www.fibl.org

Asia › Statistics
FiBL & IFOAM – Organics International (2018): The World of Organic Agriculture. Frick and Bonn 201
82’000 hectares were reported, followed by Timor-Leste (28’000 hectares); both countries represented 97 percent of the organic coffee area in Asia. Organic coffee represented 4.4 percent of the total coffee in Asia. Almost 2.6 percent of the total tea grown in Asia was organic; most of it was in China (79’000 hectares) followed by Myanmar (3’500 hectares).
Producers
In 2016, 1.1 million organic producers were reported in Asia. India is the country with the most organic producers (835’000), followed by the Philippines (almost 166’000). Unfortunately, many countries do not report the number of producers or only report the number of companies; thus it is assumed that the number of producers is higher. Since 2004, when there were 100’000 organic producers, the number has increased over eleven-fold.
Wild collection
In 2016, 6.3 million hectares of organic wild collection were reported in Asia. Unfortunately, detailed data is available for less than 10 percent of the reported area. From the details available, wild mushrooms (197’000 hectares) and wild oil plants (almost 119’000 hectares) are the key commodities. Furthermore, medicinal plants (almost 60’000 hectares) and wild fruits (almost 50’000 hectares) play an important role. India is the country in the region with the largest organic wild collection area, with 4.2 million hectares, followed by Tajikistan (1 million hectares), and China (0.8 million hectares).
Market
In Asia, organic market data is not available for most of the countries, but we can assume that the market is continually growing. Seven countries (less than 20 percent of the countries with organic data) provided organic retail sales values (Table 13, page 70). From the data available, we can assume that at least 7.3 billion euros of organic products were sold in Asia. For China, 5.9 billion euros were reported for 2016, making the country the world’s fourth largest market for organic products. Furthermore, Japan has a large organic domestic market valued, 1 billion euros (data 2009), and South Korea reported a market of 281 million euros (2015 data). More information about the Asian market is available in the chapter about the global market from Amarjit Sahota (page 146). For more information about the Asian figures, see data tables for Asia, page 204.
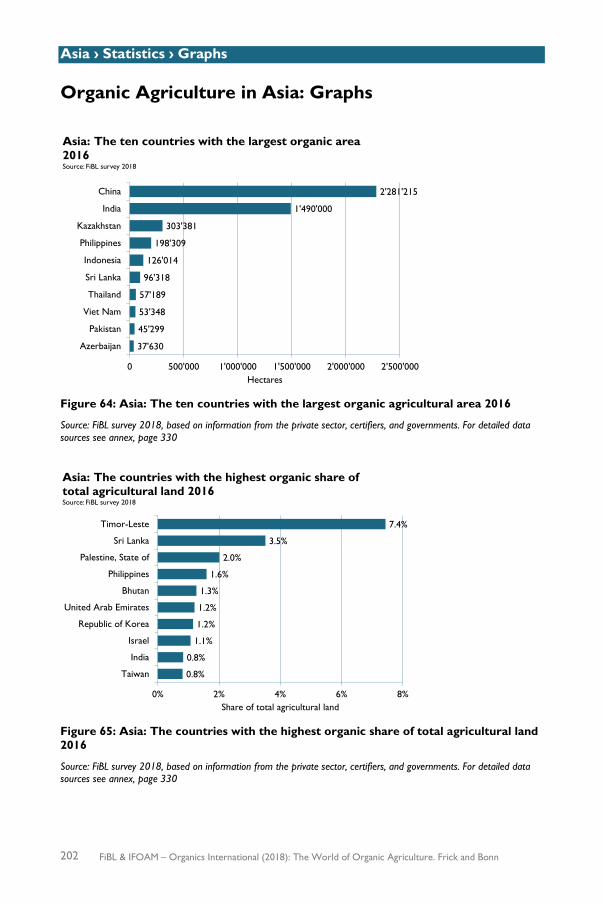
Asia › Statistics › Graphs
202 FiBL & IFOAM – Organics International (2018): The World of Organic Agriculture. Frick and Bonn
Organic Agriculture in Asia: Graphs
Figure 64: Asia: The ten countries with the largest organic agricultural area 2016
Source: FiBL survey 2018, based on information from the private sector, certifiers, and governments. For detailed data sources see annex, page 330
Figure 65: Asia: The countries with the highest organic share of total agricultural land 2016
Source: FiBL survey 2018, based on information from the private sector, certifiers, and governments. For detailed data sources see annex, page 330
37'630
45'299
53'348
57'189
96'318
126'014
198'309
303'381
1'490'000
2'281'215
0 500'000 1'000'000 1'500'000 2'000'000 2'500'000
Azerbaijan
Pakistan
Viet Nam
Thailand
Sri Lanka
Indonesia
Philippines
Kazakhstan
India
China
Hectares
Asia: The ten countries with the largest organic area 2016Source: FiBL survey 2018
0.8%
0.8%
1.1%
1.2%
1.2%
1.3%
1.6%
2.0%
3.5%
7.4%
0% 2% 4% 6% 8%
Taiwan
India
Israel
Republic of Korea
United Arab Emirates
Bhutan
Philippines
Palestine, State of
Sri Lanka
Timor-Leste
Share of total agricultural land
Asia: The countries with the highest organic share of total agricultural land 2016Source: FiBL survey 2018

Asia › Statistics › Graphs
FiBL & IFOAM – Organics International (2018): The World of Organic Agriculture. Frick and Bonn 203
Figure 66: Asia: Development of organic agricultural land 2000 to 2016
Source: FiBL-IFOAM-SOEL surveys 2002-2018; based on information from the private sector, certifiers, and governments. For detailed data sources see annex, page 330
Figure 67: Asia: Use of organic agricultural land 2016
Source: FiBL survey 2018, based on information from the private sector, certifiers, and governments. For detailed data sources see annex, page 330
0.060.42 0.43 0.49
3.78
2.683.00 2.90
3.363.58
2.46
3.693.22 3.41 3.57
3.97
4.90
0.0
1.0
2.0
3.0
4.0
5.0
6.0
2000
2001
2002
2003
2004
2005
2006
2007
2008
2009
2010
2011
2012
2013
2014
2015
2016
Mill
ion
hect
ares
Asia: Development of organic agricultural land 2000 to 2016Source: FiBL-IFOAM-SOEL-Surveys 2002-2018

Asia › Statistics › Tables
204 FiBL & IFOAM – Organics International (2018): The World of Organic Agriculture. Frick and Bonn
Organic Agriculture in Asia: Tables
Table 48: Asia: Organic agricultural land, organic share of total agricultural land, and number of producers 2016
For information on data year, see page 326.
Country Area [ha] Organic share [%] Producers [no.] Afghanistan 408 0.001%
Armenia 1’240 0.1% 16 Azerbaijan 37’630 0.8% 305 Bangladesh 6’860 0.1% 9’335 Bhutan 6’632 1.3% 4’293 Brunei Darussalam Wild collection Cambodia 9’717 0.2% 6’753 China 2’281’215 0.4% 6’308 Georgia 1’452 0.1% 1’075 Hong Kong Processing India 1’490’000 0.8% 835’000 Indonesia 126’014 0.2% 5’810 Iran 18’871 0.04% 3’879 Iraq 60 0.001%
Israel 5’758 1.1% 303 Japan 9’956 0.2% 2’130 Jordan 1’517 0.1% 19 Kazakhstan 303’381 0.1% 29 Kuwait 20 0.01%
Kyrgyzstan 7’974 0.1% 1’427 Lao, P.D.R. 7’668 0.3% 1’342 Lebanon 1’079 0.2% 101 Malaysia 603 0.01% 119 Myanmar 4’568 0.04% 12 Nepal 9’361 0.2% 687 Oman 38 0.003% 4 Pakistan 45’299 0.1% 111 Palestine, State of 5’993 2.0% 1’553 Philippines 198’309 1.6% 165’994 Republic of Korea 20’165 1.2% 12’896 Saudi Arabia 17’212 0.01% 151 Singapore Processing Sri Lanka 96’318 3.5% 8’713 Syrian Arab Republic 19’987 0.1% 2’458 Taiwan 6’490 0.8% 2’598 Tajikistan 12’659 0.3% 10’486 Thailand 57’189 0.3% 15’670 Timor-Leste 28’259 7.4% 4 United Arab Emirates 4’590 1.2% 92 Uzbekistan Wild collection Viet Nam 53’348 0.5% 8’365 Total* 4’897’837 0.3% 1’108’040
Source: FiBL survey 2018, based on information from the private sector, certifiers, and governments. For detailed data sources see annex, page 330 *Total number includes data for countries with less than three operators.

Asia › Statistics › Tables
FiBL & IFOAM – Organics International (2018): The World of Organic Agriculture. Frick and Bonn 205
Table 49: Asia: All organic areas 2016
Country Agri-
culture [ha]
Aqua-culture
[ha]
Forest [ha]
Wild collection
[ha]
Other non agri. land
[ha]
Total [ha]
Afghanistan 408
408 Armenia 1’240
6’000
7’240
Azerbaijan 37’630 123 123 1’063
38’939 Bangladesh 6’860 5’848
12’708
Bhutan 6’632
15’787
22’419 Brunei Darussalam
29
29
Cambodia 9’717
9’717 China 2’281’215
811’680
3’092’895
Georgia 1’452
215 1’507 3’174 Hong Kong Processing India 1’490’000
4’220’000
5’710’000
Indonesia 126’014 3’320
10’700
140’034 Iran 18’871
30’502
49’373
Iraq 60
60 Israel 5’758
5’758
Japan 9’956
9’956 Jordan 1’517
1’517
Kazakhstan 303’381
863
304’244 Kuwait 20
20
Kyrgyzstan 7’974
10
7’983 Lao, P. D. R. 7’668
17’068
24’736
Lebanon 1’079
393
1’472 Malaysia 603
603
Myanmar 4’568
4’568 Nepal 9’361
24’422
33’783
Oman 38
38 Pakistan 45’299
44’620
89’919
Palestine, State of 5’993
5’993 Philippines 198’309
198’309
Republic of Korea 20’165
20’165 Saudi Arabia 17’212 17’212 Singapore Processing Sri Lanka 96’318
96’318
Syrian Arab Republic 19’987
8’000
27’987 Taiwan 6’490
6’490
Tajikistan 12’659
1’055’890
1’068’549 Thailand 57’189 662
57’851
Timor-Leste 28’259
28’259 United Arab Emirates 4’590
4’590
Uzbekistan
5’000
5’000 Viet Nam 53’348 58’199
7’208
118’755
Total 4’897’837 68’181 123 6’259’421 1’507 11’227’069
Source: FiBL survey 2018, based on information from the private sector, certifiers, and governments. For detailed data sources see annex, page 330
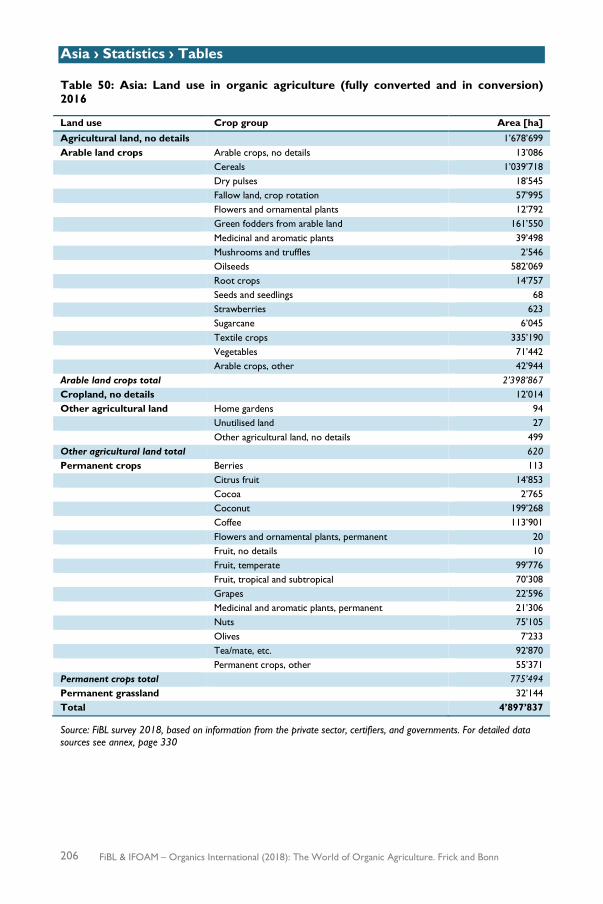
Asia › Statistics › Tables
206 FiBL & IFOAM – Organics International (2018): The World of Organic Agriculture. Frick and Bonn
Table 50: Asia: Land use in organic agriculture (fully converted and in conversion) 2016
Land use Crop group Area [ha] Agricultural land, no details
1’678’699
Arable land crops Arable crops, no details 13’086
Cereals 1’039’718
Dry pulses 18’545
Fallow land, crop rotation 57’995
Flowers and ornamental plants 12’792
Green fodders from arable land 161’550
Medicinal and aromatic plants 39’498
Mushrooms and truffles 2’546
Oilseeds 582’069
Root crops 14’757
Seeds and seedlings 68
Strawberries 623
Sugarcane 6’045
Textile crops 335’190
Vegetables 71’442
Arable crops, other 42’944
Arable land crops total
2’398’867 Cropland, no details
12’014
Other agricultural land Home gardens 94
Unutilised land 27
Other agricultural land, no details 499
Other agricultural land total
620 Permanent crops Berries 113
Citrus fruit 14’853
Cocoa 2’765
Coconut 199’268
Coffee 113’901
Flowers and ornamental plants, permanent 20
Fruit, no details 10
Fruit, temperate 99’776
Fruit, tropical and subtropical 70’308
Grapes 22’596
Medicinal and aromatic plants, permanent 21’306
Nuts 75’105
Olives 7’233
Tea/mate, etc. 92’870
Permanent crops, other 55’371
Permanent crops total
775’494 Permanent grassland
32’144
Total 4’897’837
Source: FiBL survey 2018, based on information from the private sector, certifiers, and governments. For detailed data sources see annex, page 330
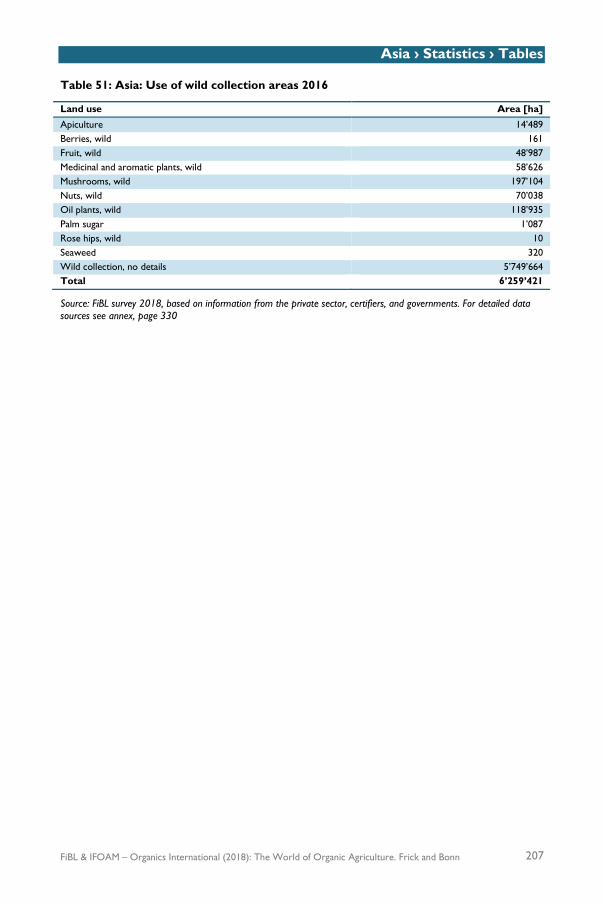
Asia › Statistics › Tables
FiBL & IFOAM – Organics International (2018): The World of Organic Agriculture. Frick and Bonn 207
Table 51: Asia: Use of wild collection areas 2016
Land use Area [ha] Apiculture 14’489 Berries, wild 161 Fruit, wild 48’987 Medicinal and aromatic plants, wild 58’626 Mushrooms, wild 197’104 Nuts, wild 70’038 Oil plants, wild 118’935 Palm sugar 1’087 Rose hips, wild 10 Seaweed 320 Wild collection, no details 5’749’664 Total 6’259’421
Source: FiBL survey 2018, based on information from the private sector, certifiers, and governments. For detailed data sources see annex, page 330

208 FiBL & IFOAM – Organics International (2018): The World of Organic Agriculture. Frick and Bonn
Info
grap
hic
5: O
rgan
ic a
gric
ultu
re in
Eur
ope:
Key
indi
cato
rs 2
016
Sour
ce: F
iBL-
AMI s
urve
y 20
18

FiBL & IFOAM – Organics International (2018): The World of Organic Agriculture. Frick and Bonn 209
Europe
Map 4: Organic agricultural land in the countries of Europe 2016 (in hectares)
Source: FiBL-AMI survey 2018; based on information from the private sector, certifiers, governments, Eurostat and the Mediterranean Organic Agriculture Network. For detailed data sources see annex, page 330.

Europe › Recent Developments
210 FiBL & IFOAM – Organics International (2018): The World of Organic Agriculture. Frick and Bonn
Organic in Europe: Prospects and Developments
HELGA WILLER,1 STEPHEN MEREDTIH,2 BRAM MOESKOPS,3 AND EMANUELE BUSACCA4
In 2016/2017 the European organic food and farming sector continued to excel both in terms of organic production and market growth as well as the latest developments in European Union (EU) food and farming policy. Data for 2016 (for full data see page 218) shows the European organic food market recording significant growth – increasing by 11.4 percent (EU: 12.0 percent). At the same time, the organic sector faces a number of challenges, notably that the growth rates in organic production continue to lag behind the dynamic growth seen within the organic food market (Figure 68). In the public policy arena at the EU level, there are some opportunities for the organic sector to capitalise on the growing awareness and interest in tackling sustainability concerns in the agri-food sector amongst policymakers, but there are also challenges. These prospects and developments for organic in Europe are explored in this chapter.
Figure 68: Europe and the European Union: Cumulative growth of organic farmland and retail sales compared 2000-2016
Source: FiBL-AMI surveys 2006-2018
1 Dr. Helga Willer, Research Institute of Organic Agriculture (FiBL), Frick, Switzerland, www.fibl.org 2 Stephen Meredith, Deputy Policy Manager, International Federation of Organic Agriculture Movements EU (IFOAM EU), Brussels, Belgium, www.ifoam-eu.org 3 Bram Moeskops, Research and Innovation Manager, International Federation of Organic Agriculture Movements EU (IFOAM EU), Brussels, Belgium, www.ifoam-eu.org 4 Emanuele Busacca, IFOAM EU, Brussels, Belgium, www.ifoam-eu.org

Europe › Recent Developments
FiBL & IFOAM – Organics International (2018): The World of Organic Agriculture. Frick and Bonn 211
EU policy and regulatory framework for the organic sector
The EU policy and regulatory framework continues to influence the development of organic food and farming across Europe with some notable developments in 2017.
Negotiations on the EU organic rules start to draw to a close
In 2017, EU negotiations on the review of the EU organic regulation started to draw to a close, four years after the European Commission launched its legislative proposals. The basic text has been approved, and will contain some changes to the rules on production, controls, and imports. Some of these include:
Production • the scope of organically certified products has been enlarged to include products
such as cotton, wool, hides but also sea salt and other salts for food and feed; • the use of “heterogeneous” plant reproductive material will be allowed; • food containing or consisting of engineered nanomaterial will be excluded.
Controls • Operators, who sell pre-packed organic products, will be exempt from
notification and certification for distribution. Operators that sell small amounts of unpacked organic products may also be exempt from certification for distribution.
• All operators will be subject to a physical on the spot inspection at least once a year. However, operators, for which previous controls have not revealed any non-compliance affecting the integrity of organic products during the last three years, and operators, which are considered as presenting a low likelihood of non-compliance, can be verified every 24 months.
Imports • The import regime will be based on two systems with a transitional period
considered for the current systems. The new system will only include Trade Agreements with Third Countries and the recognition of Control Bodies/Authorities for the purpose of compliance.
• The European Commission will have the possibility to grant specific authorisations for the use of products and substances in third countries and outermost regions of the Union, taking into account differences in the ecological balance in plant or animal production, specific climatic conditions, traditions and local conditions in these areas. Such specific authorisations may be granted for a renewable period of two years.
The new EU organic regulation will apply from 2021. It will be accompanied by more detailed requirements, which will be discussed by relevant EU institutions and subsequently, adopted over the next two years. Although many of the recommendations of the organic sector were taken up in the final text, IFOAM EU considers that the current basic text is still far from ideal. It therefore called on the EU

Europe › Recent Developments
212 FiBL & IFOAM – Organics International (2018): The World of Organic Agriculture. Frick and Bonn
Institutions to address the important weaknesses that still exist to ensure the long-term development of the organic sector in Europe (IFOAM EU, 2017a).
Debate about the future of the Common Agricultural Policy kicks-off
Discussions on the direction of the future of the Common Agricultural Policy (CAP) Post-2020 officially kicked-off in February 2017 with the launch of a public consultation by the Commission. This culminated in the publication of a Commission Communication on the Future of Food and Farming to the other EU Institutions, including the European Parliament and Council in November (European Commission, 2017a). The Communication draws on key results from the public consultation, which saw a majority of farmers and citizens expressing the need for agricultural policy to deliver more for the environment and climate change, and for farmers to continue to receive direct income support (ECORYS, 2017). In the document the Commission outlines its perspectives on the future direction of the CAP setting out three overarching objectives for the next reform: • to foster a smart and resilient agricultural sector; • to bolster environmental care and climate action and to contribute to the
environmental and climate objectives of the EU; • to strengthening the socio-economic fabric of rural areas.
The communication puts a strong emphasis on the establishment of a more results-based approach for the CAP, including a new delivery model which would place more responsibility on Member States to meet EU objectives and achieve specific targets. The Commission foresees Member States developing their individual “CAP strategic plans,” with “realistic” and “adequate” targets agreed between the Commission and Member States. The overall direction of the Communication is grounded on the Commission’s current outlook of moving the EU’s budgetary spending across different sectors towards more results-based outcomes Post-2020.
Some aspects of the document were welcomed by the organic sector as offering some possibilities for improvement on the current policy. However, the Communication was seen by the organic sector to lack a clear and common EU approach to realise the Commission’s wider intentions of shifting towards more sustainable growth models as part of next EU Budget reform. In particular, IFOAM EU highlighted that despite the increasing pressure for a more results-orientated CAP, no explicit link is made between the amount of income support farmers received an the contribution of their farm to delivering environmental and socio-economic outcomes. It also pointed out that the Commission’s outlook does not decisively prioritise the growth of sustainable farming systems, such as organic farming (IFOAM EU, 2017b). In its vision for the CAP Post-2020, IFOAM EU has called for a new deal between farmers and citizens with the concept of public money for public goods. IFOAM EU maintains that while improvements to the CAP have been made over the past decades, sustainability is still not at the core of the policy, making it ill-equipped to address the wide range of economic, social and environmental challenges facing the agri-food sector. Based on this assessment, the group points to the need to orient future CAP payments towards

Europe › Recent Developments
FiBL & IFOAM – Organics International (2018): The World of Organic Agriculture. Frick and Bonn 213
rewarding and incentivising farmers willing to deliver a wide range of environmental and socio-economic benefits that are not fully taken into account by the majority of markets (IFOAM EU, 2017c). Over the last decades, the CAP has been the key policy for the development of organic farming in Europe. Currently, Commission figures project that over 10 million hectares of farmland will be supported under the CAP 2014-2020 through the EU’s national and regional rural development programmes. Current spending for organic conversion and maintenance payments accounts for 1.5 percent of EU agricultural spending for that period. In terms of future growth, these figures suggest that there are limited opportunities under the CAP to significantly increase the organic land area by 2020 in the majority of countries (Stolze et al. 2016). Indeed it is notable that despite dynamic growth in the European organic retail market and the public consultation results showing strong interest amongst respondents for organic farming to be a new objective of a modernised CAP, prospects for the development of the organic food and farming sector are largely ignored. Discussions on the future of food and farming are also strongly linked to the debate on the future of the EU budget with the CAP representing about 40 percent of EU spending. Following the launch of a Reflection Paper on the future of EU finances by the Commission in June 2017 (European Commission, 2017b), these discussions are already in full swing with both legislative proposals of the Budget and the CAP expected in the second half of 2018. This along with a new European Commission and Parliament in 2019 means that the next years will be a critical period for the organic sector to work with policymakers and other agri-food stakeholders to use the debate on the future CAP as a means to decisively support the development of organic food and farming in Europe.
Research Organic farming research is funded under national research programs or national organic action plans as well as through European programmes.1 Several organic farming research projects have been funded under the EU framework programmes since the mid-1990s. So far, the following projects in the current framework programme (Horizon 2020), focussing on organic agriculture have started: OK-Net Arable, OK-Net EcoFeed (see more information below), and LIVESEED (organic seed and plant breeding). RELACS, which will investigate alternatives for contentious inputs used in organic farming, will start in spring 2018. A new project addressing animal welfare in organic farming is expected to start in 2019. Under CORE Organic, a new call for projects was launched in 2016. CORE Organic was initiated as a part of the Commission’s ERA-NET Scheme in 2004. It intends to step up cooperation between national research activities and aims to enhance the
1 For a list of organic farming research projects funded by the European Commission, see http://www.organic-research.org/european-projects.html

Europe › Recent Developments
214 FiBL & IFOAM – Organics International (2018): The World of Organic Agriculture. Frick and Bonn
quality, relevance, and utilisation of European research resources through coordination and collaboration.
OK-Net platforms for farmers to exchange knowledge In October 2016, the Horizon 2020-funded “OK-Net Arable” project launched the new knowledge platform farmknowledge.org, which aims to promote the exchange of information and share practical solutions among farmers across Europe. The platform is available in ten languages, and the solutions are divided according to the most relevant topics in organic arable farming: soil quality and fertility, nutrient management, pest and disease control, weed management, and solutions for specific crops. Within a new European-funded project, “OK-Net Ecofeed”, the platform will now be expanded to cover tools and solutions related to organic feed for pigs and poultry. National and international meetings of farmers, researchers, and other actors in the sector for knowledge exchange have been gaining in importance in recent years. The French “Tech and Bio” and the Swiss organic arable day (“Bioackerbautag”) have taken place for several years now. A similar event took place in 2017 in Germany: In June 2017, more than 8000 visitors attended the first nationwide Organic Field Days near Kassel in the centre of Germany. More than 200 companies, associations, and organisations presented what they have to offer in the organic agriculture arena. Most exhibitors were from the sectors of agricultural engineering, inputs, and seeds/vegetative propagation material. Eleven additional categories ranging from consultancy to research and certification all the way to animal husbandry and marketing were present. The Organic Field Days provided information about how organic farms can further develop. Central themes were organic breeding, nutrient management, and reduced tillage, as well as agriculture and nature conservation.
Science Day 2017 at Biofach On February 17, 2017, the fifth Science Day took place at BIOFACH, the World Organic Trade Fair, in Nuremberg, Germany. It was a joint event of TIPI, IFOAM’s Technology Innovation Platform and TP Organics, the European Technology Platform for Organic Food and Farming. The morning session was devoted to the review of TP Organics’ achievements in the wake of its 10th anniversary and the development of a new long-term strategy. The participants had the chance to put forward their priorities for TP Organics’ advocacy work and suggestions for improving services for members. The outcomes of the workshop were taken as a basis to develop a new long-term strategy for the platform which was presented at the Organic Innovation Days (see below). TIPI organized the afternoon session, which focussed on identifying the research gaps in organic food and farming systems in the context of international cooperation. Participants suggested several simple and cost-efficient tools to follow up on the ideas expressed at the event (TIPI 2017).

Europe › Recent Developments
FiBL & IFOAM – Organics International (2018): The World of Organic Agriculture. Frick and Bonn 215
TP Organics On 15-17 November, 2017, the third edition of the Organic Innovation Days was organised by TP Organics1 in Brussels. The event gathered actors from the organic and conventional food and farming sectors as well as policy-makers to discuss the latest innovations in agriculture and food, in organic food and farming and beyond. The 2017 edition included the final conference of the Horizon 2020 project OK-Net Arable. Best practices to improve yields in organic farming were presented, followed by a discussion on knowledge exchange and innovation support in organic farming. At the event, TP Organics launched its position paper “Research and Innovation for Sustainable Food and Farming” outlining what it would like to see in terms of the 9th EU Research & Innovation Framework Programme (FP9), which will start in 2021. TP Organics calls for the UN Sustainable Development Goals to be the basis for the next Framework Programme’s architecture. FP9 should feature a mission for the transformation of the European food and farming system towards more sustainability with at least 50 percent of EU agricultural land managed according to organic and agroecological principles by 2030. Furthermore, 10 percent of the total budget for agricultural research should be dedicated to the organic sector.
FiBL Europe
In July 2017, FiBL Europe was founded in Brussels as an umbrella organisation representing the five national institutes of the Research Institute of Organic Agriculture FiBL. Currently, FiBL Europe works on themes such as a European input list as well as the OrganicXSeeds database for organic seeds and propagation materials.
Organic Roadmap for Sustainable Food and Farming
The latest production and market trends and policy developments at the EU level demonstrate the important role that organic food and farming continues to play in helping to move European food and farming in a more sustainable direction both as an economic actor and as part of a wider social movement. As part of these efforts, the “Organic Roadmap to Sustainable Food and Farming Systems in Europe” by IFOAM EU was presented at the 11th European Organic Congress in September 2017 in Tallin, Estonia (IFOAM EU, 2017d). It sets out pathways for how the organic movement, other farming actors and policymakers can reach the Organic Vision 2030 (IFOAM EU, 2015) across three cross-cutting themes: “Organic on every table,” “Improve, inspire and deliver,” and “Fair play - fair pay.” The roadmap serves as an invitation to all agri-food actors to engage with the organic sector to actively transform food and farming in their day to day work in Europe and beyond. The launch of the roadmap was also accompanied by the establishment of a new online platform, EUORGANIC2030.bio, to promote new and exciting initiatives which can support the Organic Vision 2030.
1 TP Organics is the European Technology Platform for organic food and farming. More information is available on tporganics.eu

Europe › Recent Developments
216 FiBL & IFOAM – Organics International (2018): The World of Organic Agriculture. Frick and Bonn
References and further reading ECORYS (2017): Modernising and Simplifying the Common Agricultural Policy: Summary of the results of
the public consultation for European Commission DG AGRI, 07 July 2017, revised 06 September, Available at: ec.europa.eu/agriculture/sites/agriculture/files/consultations/cap-modernising/summary-public-consul.pdf
European Commission (2016): New rules for electronic certification of EU organic imports. News of October 19, 2016. Website of the European Commission, Brussels Available at https://ec.europa.eu/agriculture/newsroom/302_en
European Commission (2017a): The Future of Food and Farming - Communication from the Commission to the European Parliament, the Council, the European Economic and Social Committee and the Committee of the Regions - The Future of food and farming, COM (2017) 0713 final. Available at: http://eur-lex.europa.eu/legal-content/EN/ALL/?uri=COM:2017:713:FIN
European Commission (2017b): Reflection Paper on the Future of EU Finances, COM(2017) 358. Available at: ec.europa.eu/commission/sites/beta-political/files/reflection-paper-eu-finances_en.pdf
FiBL (2017): European organic farming research projects. The Organic-Research website. Research Institute of Organic Agriculture FiBL, Frick. Available at http://www.organic-research.net/transnational-projects/european-projects.html. Date given on website: January 10, 2015
IFOAM EU (2015): Transforming Food and Farming. An organic vision for Europe 2030. IFOAM EU Group, Brussels. Available at: www.ifoam-eu.org/sites/default/files/413-ifoam-vision-web.pdf
IFOAM EU (2017a): Strong Institutional commitment needed to ensure a good legislative transition. IFOAM EU Press Release. IFOAM EU, Brussels, Available at: www.ifoam-eu.org/sites/default/files/ifoameu_regulation_press_release_20171122.pdf
IFOAM EU (2017b): CAP Communication: EU agriculture needs clearer direction for long-term sustainability. IFOAM EU Press Release. IFOAM EU, Brussels, Available at: www.ifoam-eu.org/en/news/2017/11/29/press-release-cap-communication-eu-agriculture-needs-clearer-direction-long-term
IFOAM EU (2017c): A CAP for healthy farms, healthy people, healthy planet. Public money must deliver public goods. IFOAM EU, Brussels. Available at: www.ifoam-eu.org/sites/default/files/ifoameu_policy_cap_post_2020_vision_paper_201701.pdf
IFOAM EU (2017d): Transforming Food and Farming – Making it Happen: An Organic Roadmap to Sustainable Food and Farming Systems in Europe. IFOAM EU Group, Brussels. Available at: www.euorganic2030.bio
Stolze, M., Sanders, J., Kasperczyk, N., Madsen, G., (2016): CAP 2014-2020: Organic farming and the prospects for stimulating public goods. IFOAM EU Group, Brussels
TIPI – Technology Platform of IFOAM - Organics International (2017): Science Day 2017 at BIOFACH. The website of the Research Institute of Organic Agriculture, Frick. Available at http://www.fibl.org/en/service-en/news-archive/news/article/report-from-science-day-2017-at-biofach.html
Websites › ec.europa.eu/agriculture/future-cap_en : European Commission on the CAP reform › ec.europa.eu/agriculture/organic/index_en: European Commission’s organic farming website › ifoam-eu.org: International Federation of Organic Agriculture Movements EU - IFOAM EU › organic-market.info: Market News and updates: www.organic-market.info › tipi.ifoam.org: Technology Innovation Platform of IFOAM (TIPI) › tporganics.eu: European Technology Platform TP Organics › www.ok-net-arable.eu: OK-Arable Net › www.liveseed.eu: LIVESEED

Europe > Key Indicators
FiBL & IFOAM – Organics International (2018): The World of Organic Agriculture. Frick and Bonn 217
Europe and the European Union: Key indicators 2016
Table 52: Europe and the European Union: Key indicators 2016
Indicator Europe European Union Top 3 countries Europe
Organic farmland in hectares
13.5 million ha 12.1 million ha Spain (2.0 million ha) Italy (1.8 million ha) France (1.5 million ha)
Organic share of total farmland
2.7 % 6.7 % Liechtenstein (37.7%) Austria (21.9%) Estonia (18.9%)
Increase of organic farmland 2015-2016 in hectares
845’232 ha 912’746 ha Italy (+303’071.0 ha) France (+215’845 ha) Germany (+162’482 ha)
Relative increase of organic farmland 2015-2016
6.7% 8.2% Iceland (+ 132%) Bosnia and Herzegovina (+72%) Macedonia, FYROM (+49%)
Land use [in million hectares]
Arable crops: 6.0 Permanent crops: 1.5 Permanent pastures: 5.6
Arable crops: 5.2 Permanent crops 1.3 Permanent pastures: 5.5
Top arable crops Cereals: 2.3 million ha; Green fodder: 2.3 million ha Dry pules: 0.4 million ha
Green fodder: 2.1 million ha Cereals:1.9 million ha Dry pules: 0.4 million ha
Largest arable areas: France (0.8 million ha) Italy (0.8 million ha) Germany (0.5 million ha)
Top permanent crops Olives: 0.6 million ha Grapes: 0.3 million ha Nuts: 0.3 million ha
Olives: 0.5 million ha Grapes: 0.3 million ha Nuts: 0.2 million ha
Largest permanent crop areas: Spain (0.5 million ha) Italy (0.4 million ha) Turkey (0.2 million ha)
Wild collection area 16.7 million ha 14.3 million ha Finland (11.6 million ha) Romania (1.8 million ha; 2014) Bulgaria: (0.9 million ha)
Producers [no.] 373’240 295’123 Turkey: (67’879) Italy (64’210) Spain (34’673)
Processors [no.] 65’889 62’652 Italy (16’578) Germany (14’501) France (12’826)
Importers [no.] 4’657 3’968 Germany (1’598) Switzerland (501) Netherlands (364)
Retail sales 33.5 billion euros 30.7 billion euros Germany (9’478 million euros) France (6’736 million euros) Italy (2’644 million euros)
Growth of retail sales 2015-2016
11.4% 12.0% France, Ireland (22 %) Denmark (20 %)
Organic share of total market
No data No data Denmark (9.7 %) Luxembourg (8.6%) Switzerland (8.4 %)
Per capita consumption [euros]
40.8 euros 60.5 euros Switzerland (274 euros); Denmark (227 euros) Sweden (197 euros)
Source: FiBL-AMI survey 2018. For detailed data sources see annex.

Europe › Statistics
218 FiBL & IFOAM – Organics International (2018): The World of Organic Agriculture. Frick and Bonn
Organic Farming and Market Development in Europe and the European Union
HELGA WILLER,1 DIANA SCHAACK,2 AND JULIA LERNOUD3
This chapter is an update of the article “Growth trends in European organic food and farming”, published by IFOAM EU and the Research Institute of Organic Agriculture FiBL in the volume “Organic in Europe, 2016” (Willer et al. 2016). Therefore, the structure of this chapter is different from the other regional statistics chapters in this book. The article focuses on Europe as a whole4 and the 28 member states of the European Union (EU-28).5
Data collection in Europe, like in the rest of the world, is carried out using multiple information sources. We would, however, like to point out that Eurostat, the statistical office of the European Union, is constantly expanding its data collection effort in the field of organic agriculture, and most of the data on organic areas, livestock, and operators was taken from Eurostat. The Eurostat organic farming statistics are available at • ec.europa.eu/eurostat/web/agriculture > Database > Organic farming • ec.europa.eu/eurostat/statistics-explained/index.php/Organic_farming_statistics
For market data, data from the private sector, market research companies, or statistical offices are used.
The development of the European and the European Union’s organic sector in 2016 was characterized by two trends. On the one hand, the market showed a double-digit growth rate again (11.4 percent in Europe; 12 percent in the European Union). On the other hand, organic farmland growth continued to be slower than that of the market, but it was considerably faster than in the previous years, increasing by 6.7 percent in Europe and 8.2 percent in the European Union. The trend of the market growing at a faster rate than the area (Figure 68) has been occurring for several years, showing that production is still not keeping pace with consumer demand.
1 Dr. Helga Willer, Research Institute of Organic Agriculture (FiBL), Frick, Switzerland, www.fibl.org 2 Diana Schaack, Agrarmarkt Informations-Gesellschaft mbH, Bonn, Germany, www.ami-informiert.de 3 Julia Lernoud, Research Institute of Organic Agriculture (FiBL), Frick, Switzerland, www.fibl.org 4 Europe consists of the 28 countries of the European Union, the EU Candidate and Potential Candidate countries (CPC: Albania, Bosnia-Herzegovina, Kosovo, Macedonia FYROM, Montenegro, Serbia, Turkey), the members of the European Free Trade Association (EFTA: Iceland, Norway, Liechtenstein, Switzerland), as well as other European countries: Andorra, Belarus, Moldova, Russian Federation, San Marino and Ukraine. 5 The 28 member states of the European Union consist of the EU-13 countries, which became members of the European Union in or after May 2004, and of the EU-15 countries, who were member countries of the European Union prior to the accession of ten candidate countries on May 1, 2004.

Europe › Statistics
FiBL & IFOAM – Organics International (2018): The World of Organic Agriculture. Frick and Bonn 219
1 Production and market highlights • In Europe, 13.5 million hectares were organic in 2016 (European Union: 12.1
million hectares). With more than 2 million hectares, Spain continues to be the country with the largest organic area in Europe, followed by Italy (1.8 million hectares) and France (1.5 million hectares).
• The organic land increased by almost one million hectares in Europe and in the European Union, representing an increase of 6.7 percent in Europe and 8.2 percent in the European Union. Growth was higher than in 2015 and substantially higher than in the first years of the current decade. In the decade 2007-2016, organic agricultural land increased by two thirds.
• Organic farmland in Europe constitutes 2.7 percent of the total agricultural land and 6.7 percent in the European Union. In Europe (and globally), Liechtenstein has the highest organic share of all farmland (37.7 percent) followed by Austria, the country in the European Union with the highest organic share of agricultural land (21.9 percent).
• There were more than 370’000 organic producers in Europe (European Union: almost 300’000), and the largest numbers were in Turkey (almost 68’000) and Italy (more than 64’000). While the number of producers grew by 7 percent in Europe (10 percent in the European Union) in 2016, growth was 76 percent in Europe and 58 percent in the European Union during 2007-2016.
• There were almost 66’000 organic processors in Europe and almost 63’000 in the European Union. Almost 4’700 importers were counted in Europe and almost 4’000 in the European Union. Particularly strong growth was noted for importers, which increased by double digits in both Europe and the European Union. The country with the largest number of processors was Italy (almost 17’000), while Germany had the most importers (almost 1’600).
• Organic retail sales in Europe were valued at 33.5 billion euros (30.7 billion euros in the European Union). The European Union represents the second largest single market for organic products in the world after the United States.
• The European organic market recorded a growth rate of 11.4 percent (European Union: 12 percent), which is the second time retail sales have shown a double-digit growth rate since the financial crisis. Among the key markets, the highest growth was observed in France (22 percent). In the decade 2007-2016, the value of European and European Union markets has more than doubled.
• European consumers spent 41 euros on organic food per person (European Union: 61 euros). Per capita consumer spending on organic food has doubled in the last decade. The Swiss spent the most money on organic food (274 euros per capita).
• Globally, European countries account for the highest shares of organic food sales as a percentage of their respective food markets. Denmark has the highest organic market share (9.7 percent).
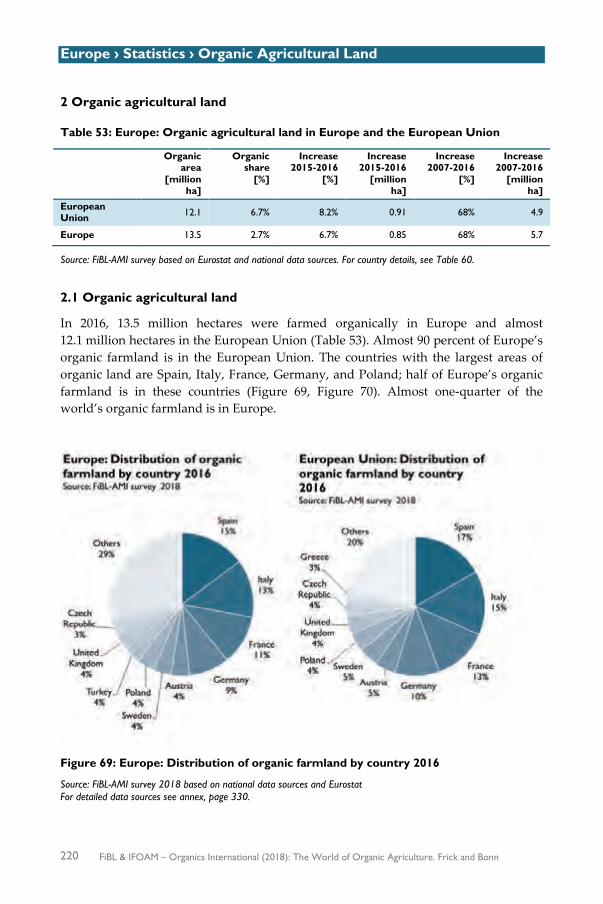
Europe › Statistics › Organic Agricultural Land
220 FiBL & IFOAM – Organics International (2018): The World of Organic Agriculture. Frick and Bonn
2 Organic agricultural land
Table 53: Europe: Organic agricultural land in Europe and the European Union
Organic area
[million ha]
Organic share
[%]
Increase 2015-2016
[%]
Increase 2015-2016
[million ha]
Increase 2007-2016
[%]
Increase 2007-2016
[million ha]
European Union 12.1 6.7% 8.2% 0.91 68% 4.9
Europe 13.5 2.7% 6.7% 0.85 68% 5.7
Source: FiBL-AMI survey based on Eurostat and national data sources. For country details, see Table 60.
2.1 Organic agricultural land
In 2016, 13.5 million hectares were farmed organically in Europe and almost 12.1 million hectares in the European Union (Table 53). Almost 90 percent of Europe’s organic farmland is in the European Union. The countries with the largest areas of organic land are Spain, Italy, France, Germany, and Poland; half of Europe’s organic farmland is in these countries (Figure 69, Figure 70). Almost one-quarter of the world’s organic farmland is in Europe.
Figure 69: Europe: Distribution of organic farmland by country 2016
Source: FiBL-AMI survey 2018 based on national data sources and Eurostat For detailed data sources see annex, page 330.

Europe › Statistics › Organic Agricultural Land
FiBL & IFOAM – Organics International (2018): The World of Organic Agriculture. Frick and Bonn 221
Figure 70: Europe: Organic agricultural land by country 2016
Source: FiBL-AMI survey 2018 based on Eurostat national data sources. For detailed data sources see annex.
4241601802536629921'3833'2453'4704'2745'55014'35822'71030'14243'57947'62152'20476'70178'45293'593141'249160'620180'852186'347187'024201'476221'665226'309238'240245'052259'146289'890342'584381'173
488'591490'205523'777536'579552'695571'585
1'251'3201'538'047
1'796'3632'018'802
0 500'000 1'000'000 1'500'000 2'000'000 2'500'000
AndorraMalta
KosovoChannel Islands
Faroe IslandsAlbania
Bosnia and HerzegovinaLiechtenstein
Macedonia, FYROMMontenegroLuxembourg
CyprusSerbia
IcelandMoldovaSloveniaNorway
NetherlandsIreland
BelgiumCroatia
SwitzerlandBulgariaEstonia
HungarySlovakia
DenmarkLithuaniaRomania
FinlandPortugal
LatviaRussian Federation
GreeceUkraine
Czech RepublicUnited Kingdom
TurkeyPoland
SwedenAustria
GermanyFrance
ItalySpain
Hectares
Europe: Organic agricultural land by country 2016Source: FiBL-AMI survey 2018

Europe › Statistics › Organic Agricultural Land
222 FiBL & IFOAM – Organics International (2018): The World of Organic Agriculture. Frick and Bonn
2.2 Organic shares of total agricultural land
In Europe, 2.7 percent of the agricultural land is organic and in the European Union, 6.7 percent (Table 53). In nine countries (European Union: seven), ten percent or more of the agricultural land is managed organically (Figure 71). The countries with the highest organic shares are Liechtenstein (37.7 percent), Austria (21.9 percent), Estonia (18.9 percent), and Sweden (18.0 percent). Liechtenstein is the country with the highest share of organic area in the world.
2.3 Growth of organic agricultural land
In 2016, the organic agricultural land in Europe increased by 845’232 hectares (EU: 912’746 hectares) or 6.7 percent (EU 8.2 percent). Growth was therefore comparable with that of 2015 and considerably faster than between 2011 and 2014 (Figure 72, Figure 73). In Europe, the absolute growth was less than in the European Union, due to a major decrease of organic farmland in the Russian Federation reported by one international certifier.
The countries that contributed the most to the growth were Italy and France with more than 500’000 hectares together (Figure 74), whereas the highest relative increases were in Iceland, Bosnia & Herzegovina, and Macedonia FYROM, which showed a growth rate of at least 50 percent. However, there were also countries that showed stagnation or only a small increase of organic land such as Luxembourg and the Czech Republic. In some countries, the organic area decreased, such as the Greece, Poland, Romania, and the Russian Federation (Table 60).

Europe › Statistics › Organic Agricultural Land
FiBL & IFOAM – Organics International (2018): The World of Organic Agriculture. Frick and Bonn 223
Figure 71: Europe: Organic shares of total agricultural land 2016
Source: FiBL-AMI survey 2018 based on national data sources and Eurostat For detailed data sources see annex of this book.

Europe › Statistics › Organic Agricultural Land
224 FiBL & IFOAM – Organics International (2018): The World of Organic Agriculture. Frick and Bonn
Figure 72: Europe and the European Union: Development of organic agricultural land 1985-2016
Source: FiBL-AMI Surveys 2006-2018 based on national data sources and Eurostat. Data from before 2000 based on surveys from Nic Lampkin. The data for the European Union cover all countries that were members of the European Union in 2016.
Figure 73: Europe: Growth rates for organic agricultural land in Europe and the European Union 1985-2016
Source: FiBL-AMI Surveys 2006-2018 based on national data sources and Eurostat. Data from before 2000 based on surveys from Nic Lampkin. For detailed data sources see annex.

Europe › Statistics › Organic Agricultural Land
FiBL & IFOAM – Organics International (2018): The World of Organic Agriculture. Frick and Bonn 225
Figure 74: Europe: The ten countries with the highest growth of organic agricultural land in hectares and percentage in 2016
Source: FiBL-AMI survey 2018 based on national data sources and Eurostat For detailed data sources see annex.
2.4 Conversion status of organic farmland
Most, but not all, countries provided data on their fully converted and under-conversion areas, but such details are not available for all countries – for instance, for Austria, Germany, and Switzerland (Table 61).
In Europe, of the 13.5 million hectares of organic agricultural land, 8.1 million hectares were fully converted (7.3 million in the European Union), and 3.2 million hectares were under conversion (2.9 million in the European Union). This reflects the fact that in the near future an increase in the supply of organic products can be expected (Figure 75).
This trend is confirmed by the fact that the in-conversion area increased by one third in Europe and the European Union. By country, the largest in-conversion areas are in the major European supplying countries, notably Spain (619’069 hectares), Italy (594’522 hectares), France (483’058 hectares), and Turkey (144’735 hectares).
Among arable and permanent crops, a major supply of cereals (approximately 500’000 hectares under conversion), olives (150’000 hectares), and dry pulses (almost 100’000 hectares) may be expected. For more information, see the crop chapters in this book, page 91.
+27'538
+33'712
+34'688
+37'708
+42'068
+50'232
+56'612
+162'482
+215'845
+303'071
0 200'000 400'000
Latvia
Sweden
Denmark
Turkey
Bulgaria
Spain
Hungary
Germany
France
Italy
Area increase in hectares
Europe: The 10 countries with the highest growth of organic farmland in 2016 (hectares)Source: FiBL-AMI survey 2018 based on Eurostat and national data sources
+18%
+20%
+21%
+23%
+25%
+35%
+44%
+49%
+72%
+132%
0% 50% 100% 150%
Cyprus
Italy
Denmark
Croatia
Liechtenstein
Bulgaria
Hungary
Macedonia, FYROM
Bosnia and Herzegovina
Iceland
Area increase in percent
Europe: The 10 countries with the highest relative growth of organic agricultural land in 2016 (%)Source: FiBL-AMI survey 2018 based on Eurostat and national data sources

Europe › Statistics › Organic Agricultural Land
226 FiBL & IFOAM – Organics International (2018): The World of Organic Agriculture. Frick and Bonn
Figure 75: Europe and the European Union: Conversion status of organic land in Europe and the European Union 2016
Source: FiBL-AMI survey 2018 based on national data sources and Eurostat For detailed data sources see annex.
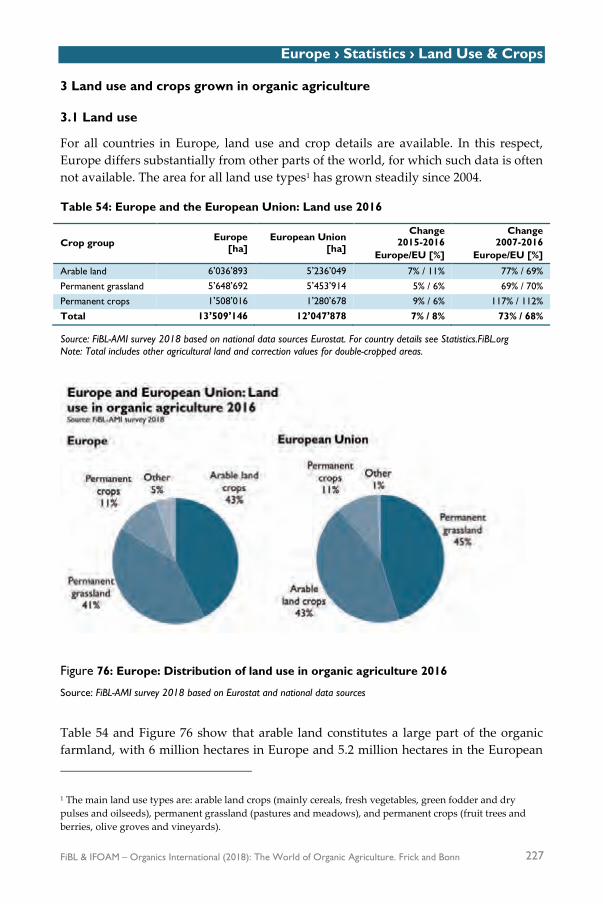
Europe › Statistics › Land Use & Crops
FiBL & IFOAM – Organics International (2018): The World of Organic Agriculture. Frick and Bonn 227
3 Land use and crops grown in organic agriculture
3.1 Land use
For all countries in Europe, land use and crop details are available. In this respect, Europe differs substantially from other parts of the world, for which such data is often not available. The area for all land use types1 has grown steadily since 2004.
Table 54: Europe and the European Union: Land use 2016
Crop group Europe [ha]
European Union [ha]
Change 2015-2016
Europe/EU [%]
Change 2007-2016
Europe/EU [%]
Arable land 6’036’893 5’236’049 7% / 11% 77% / 69% Permanent grassland 5’648’692 5’453’914 5% / 6% 69% / 70% Permanent crops 1’508’016 1’280’678 9% / 6% 117% / 112% Total 13’509’146 12’047’878 7% / 8% 73% / 68%
Source: FiBL-AMI survey 2018 based on national data sources Eurostat. For country details see Statistics.FiBL.org Note: Total includes other agricultural land and correction values for double-cropped areas.
Figure 76: Europe: Distribution of land use in organic agriculture 2016
Source: FiBL-AMI survey 2018 based on Eurostat and national data sources
Table 54 and Figure 76 show that arable land constitutes a large part of the organic farmland, with 6 million hectares in Europe and 5.2 million hectares in the European 1 The main land use types are: arable land crops (mainly cereals, fresh vegetables, green fodder and dry pulses and oilseeds), permanent grassland (pastures and meadows), and permanent crops (fruit trees and berries, olive groves and vineyards).

Europe › Statistics › Land Use & Crops
228 FiBL & IFOAM – Organics International (2018): The World of Organic Agriculture. Frick and Bonn
Union (44 and 43 percent of the organic farmland, respectively). Permanent grassland accounted for 5.6 million hectares in Europe and 5.5 million hectares in the European Union. Permanent crops constituted 11 percent of the organic farmland with 1.5 and 1.3 million hectares in Europe and the EU, respectively.
The largest increase in 2015-2016 was in permanent crops (9 percent in Europe and 6 percent the European Union), whereas arable land increased by 7 percent in Europe and by 11 percent in the European Union (Table 54, Figure 78; Figure 79).
Also, over the 2007-2016 decade, permanent crops more than doubled and thus showed a greater increase than arable land and permanent grassland, each of which grew by about two thirds (Table 54, Figure 78; Figure 79).
By country, the largest permanent grassland or grazing areas are in Spain with more than one million hectares, followed by Germany and France (Figure 77). The largest cropland areas (i.e., arable and permanent crops together) are in Italy (1.2 million hectares), Spain (1.0 million hectares), and France (0.9 million hectares) (Figure 77).
Figure 77: Europe: Land use in organic agriculture by top 10 countries 2016
Source: FiBL-AMI survey 2018 based on Eurostat and national data sources
0.1
0.2
0.2
0.3
0.4
0.4
0.5
0.6
0.7
1.1
0.0 0.5 1.0 1.5
Poland
Portugal
Greece
United Kingdom
Austria
Czech Republic
Italy
France
Germany
Spain
Million hectares
Permanent grassland
0.2
0.2
0.3
0.3
0.4
0.4
0.5
0.5
0.8
0.8
0.0 0.2 0.4 0.6 0.8 1.0
Austria
Finland
Turkey
Ukraine
Poland
Sweden
Spain
Germany
Italy
France
Million hectares
Arable crops
0.01
0.03
0.03
0.04
0.05
0.1
0.1
0.2
0.4
0.5
0.0 0.2 0.4 0.6
Romania
Bulgaria
Poland
Germany
Portugal
Greece
France
Turkey
Italy
Spain
Million hectares
Permanent crops
Europe: Land use in organic agriculture 2016Source: FiBL-AMI survey 2018

Europe › Statistics › Land Use & Crops
FiBL & IFOAM – Organics International (2018): The World of Organic Agriculture. Frick and Bonn 229
Figure 78: Europe: Growth of organic agricultural land by land use type 2004-2016
Source: FiBL-AMI Surveys 2006-2018 based on national data sources and Eurostat
Figure 79: European Union: Growth of organic agricultural land by land use type 2004-2016
Source: FiBL-AMI Surveys 2006-2018 based on national data sources and Eurostat

Europe › Statistics › Land Use & Crops
230 FiBL & IFOAM – Organics International (2018): The World of Organic Agriculture. Frick and Bonn
3.2 Crops grown in organic agriculture
Most of the key arable and permanent crops and crop groups showed growth in Europe and the European Union.
Table 55: Europe and the European Union: Key crops/crop group 2016
Crop group
Europe (ha)
European Union (ha)
Organic share (%)
Europe/EU
Change 2015-2016
Europe/EU
Change 2007-2016
Europe/EU
Ara
ble
land
cro
ps
Cereals 2’279’155 1’889’408 1.7%/3.3% 2%/12% 71%/59% Dry pulses 418’520 381’887 8.2%/17.9% 15%/14% 312%/323% Oilseeds 339’630 224’193 1.0%/1.9% 14%/6% 214%/152% Green fodder 2’255’059 2’066’861 n/a 9%/11% 68%/61% Root crops 41’901 33’401 0.5%/1.0% 4%/9% 41%/32% Vegetables 148’088 135’684 2.9%/5.8% 19%/24% 41%/38%
Per
man
ent
crop
s
Berries 35’135 32’507 12.3%/19.8% 11%/9% 360%/341% Citrus fruit 48’967 48’486 6.7%/8.1% 15%/15% 116%/136% Temperate fruit 127’749 105’296 4.6%/8.1 1%/1% 63%/71% (Sub)Tropical fruit 30’433 11’980 13.4%/7.6% 15%/30% 4700%/1822% Grapes 328’492 313’642 8.4%/10% 12%/12% 225%/246% Nuts 267’080 233’344 15.7%24% 22%/23% 134%/144% Olives 574’826 493’568 9.7%/9.8% 8%/9% 90%/79%
Source: FiBL-AMI survey 2018 based on national data sources and Eurostat Note: For crop details by country, please check crop chapter in this book from page 92.
Arable land
A large proportion of the organic arable land (6 million hectares in Europe and 5.5 million in the European Union) is used for the production of cereals and green fodder from arable land, which, together, account for more a large part of the organic arable land. Regarding the organic share, dry pulses are the most successful crop; in the European Union, they account for almost one-fifth of the total dry pulses area. Together with vegetables, they had the highest increase in land area, thus reflecting that European organic farmers are meeting the increasing market demand for vegetables and feedstuffs. Over the decade 2007-2016, the largest growth was noted for dry pulses, which more than quadrupled (Figure 80).
Cereals were the largest crop group in Europe and accounted for 2.3 million hectares or 1.7 percent in Europe, and in the European Union, they were the second largest group, accounting for 1.9 million hectares or 3.3 percent of the total cereal area. Wheat is the most important cereal (900´000 hectares), covering almost half of the cereal area. Italy (approx. 300´000 hectares, including large areas of durum wheat), Germany (approx. 242´000 hectares), and France (approx. 217´000 hectares) have the largest cereal areas. The highest organic shares of the total cereals area are in Austria (13.5 percent), Sweden (10.5 percent) and Estonia (9.8 percent). Outside the European Union, Ukraine, Turkey, and the Russian Federation are major cereal producers (see also the chapter on cereals in this volume, page 92).

Europe › Statistics › Land Use & Crops
FiBL & IFOAM – Organics International (2018): The World of Organic Agriculture. Frick and Bonn 231
In the European Union, the arable crop group with the largest area was plants harvested green (green fodder from arable land) with 2.1 million hectares (Europe: 2.3 million hectares). Clover, green maize, and grass on arable land were the main crop types.
In 2016, organic vegetables1 were grown on almost 150’000 hectares of land in Europe, and more than 135’000 hectares in the European Union, covering 2.9 percent and 5.8 percent of the vegetable area respectively. While vegetables had the largest growth in 2016, compared to the other crop groups, they did not grow as fast in the decade 2007-2016. This is because vegetables are one of the pioneer crops of organic agriculture and strong growth already occurred in the previous decades. The largest areas were in Italy (43’648 hectares), France (18’064 hectares), and Spain (17’013 hectares). High organic shares of all vegetables are found in Denmark (28 percent) and Austria (20 percent) (See also the chapter on vegetables in this volume, page 122).
With 420’000 hectares in Europe and 380´000 hectares in the European Union, organic dry pulses accounted for a large share of all dry pulses (8.2 percent in Europe; 17.9 percent in the European Union). One reason is that the conventional crop area has been decreasing for many years due to the availability of cheap protein like soybeans on the world market for both animal feed and human consumption. The strong growth of dry pulses and their high organic shares also reflects the efforts of European organic farmers to improve soil fertility and to become less dependent on imports of protein crops. The countries with the largest areas for dry pulses were France (85’827), Poland (55’968), and Italy (43’986). The highest organic shares were found in Austria (58 percent), Italy (44 percent), and Denmark (40 percent) (see also the chapter on dry pulses in this volume, page 103).
Permanent crops
A large part of the permanent cropland (1.5 million hectares in Europe and 1.3 million hectares in the European Union) is used for olives, grapes, and nuts. Olives cover one-third of the permanent crop area, and grapes one fifth. Over the decade 2007-2016, the largest growth was noted for grapes, which more than tripled (Figure 80). The organic shares for most permanent crops were higher than those for the arable crops; however, it should be noted that particularly for nuts and berries, the FAO data, with which the organic data is compared, do not include all berries or nut types grown in organic agriculture. Thus a direct comparison is not possible in all cases.
Olives (0.57 million hectares) and grapes (0.33 million hectares) cover half of the permanent cropland. Both reach an organic share of almost ten percent of their respective totals. Spain and Italy have an organic grape area of more than 100’000 hectares each, and they reach the highest organic shares (except some minor organic grape producers that reach even higher shares, such as the UK or Belgium). In Italy 15.5 percent of the grape area is organic and 11.6 percent in Spain (for details see also
1 It should be noted that for some countries, potatoes are included in the vegetable category.

Europe › Statistics › Land Use & Crops
232 FiBL & IFOAM – Organics International (2018): The World of Organic Agriculture. Frick and Bonn
chapter on organic grapes, page 114). Also for olives, Italy and Spain have the lead (222’453 hectares and 196’567 hectares, respectively). France has the highest organic share with 27 percent. The largest growth occurred in Italy, where the organic olive area increased by more than 40’000 hectares in 2016. (See also the chapter on olives in this volume, page 119).
Temperate fruits are grown on 127’749 hectares (European Union 105’296 hectares), and they cover 4.6 percent of the total temperate fruit area (8.1 percent in the European Union). The countries in the European Union have a considerable amount of land dedicated to temperate fruit (e.g., apples in Poland and berries in the Baltic countries). The most important fruits were apples (45’880 hectares), plums (12’882 hectares), and cherries (10’227 hectares). Both Polish apples (mainly for concentrate) and berries from the Baltic countries can be found in juices or yogurts all over Europe. The largest temperate fruit producers are Italy (22’378 hectares) and Poland (18’616 hectares); the highest organic area shares are found in Austria (53 percent) and Latvia (39.2 percent)1. (See also the chapter on temperate fruits in this volume, page 106).
Figure 80: Europe: Growth of selected arable and permanent crop groups in Europe 2007 to 2016
Source: FiBL-AMI survey 2018
1 With these high organic proportions of the total temperate fruit area, it should be borne in mind that the certified organic area is not necessarily comparable to the FAO total data, which show the area harvested and exclude, for instance, new plantations.
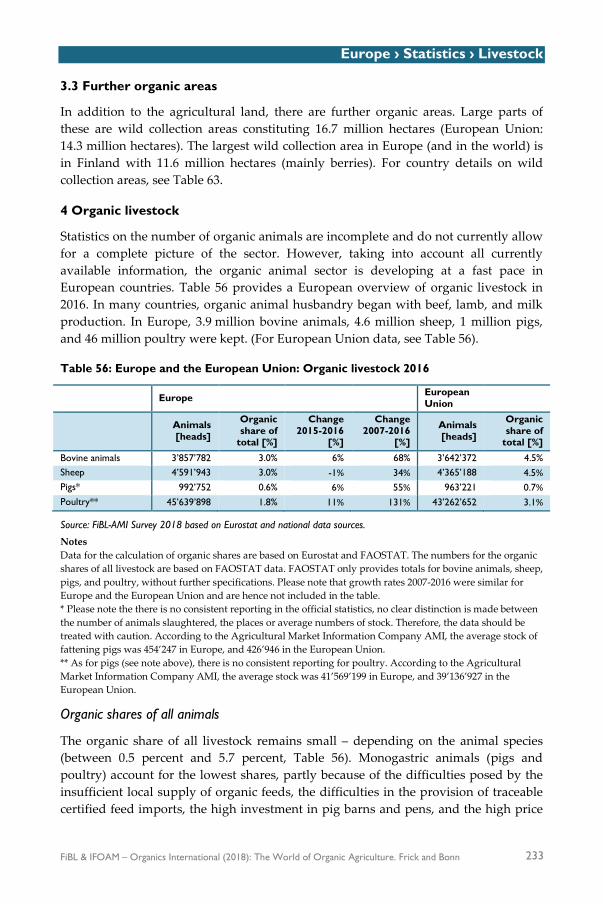
Europe › Statistics › Livestock
FiBL & IFOAM – Organics International (2018): The World of Organic Agriculture. Frick and Bonn 233
3.3 Further organic areas
In addition to the agricultural land, there are further organic areas. Large parts of these are wild collection areas constituting 16.7 million hectares (European Union: 14.3 million hectares). The largest wild collection area in Europe (and in the world) is in Finland with 11.6 million hectares (mainly berries). For country details on wild collection areas, see Table 63.
4 Organic livestock
Statistics on the number of organic animals are incomplete and do not currently allow for a complete picture of the sector. However, taking into account all currently available information, the organic animal sector is developing at a fast pace in European countries. Table 56 provides a European overview of organic livestock in 2016. In many countries, organic animal husbandry began with beef, lamb, and milk production. In Europe, 3.9 million bovine animals, 4.6 million sheep, 1 million pigs, and 46 million poultry were kept. (For European Union data, see Table 56).
Table 56: Europe and the European Union: Organic livestock 2016
Europe European Union
Animals [heads]
Organic share of
total [%]
Change 2015-2016
[%]
Change 2007-2016
[%]
Animals [heads]
Organic share of
total [%] Bovine animals 3’857’782 3.0% 6% 68% 3’642’372 4.5% Sheep 4’591’943 3.0% -1% 34% 4’365’188 4.5% Pigs* 992’752 0.6% 6% 55% 963’221 0.7% Poultry** 45’639’898 1.8% 11% 131% 43’262’652 3.1%
Source: FiBL-AMI Survey 2018 based on Eurostat and national data sources.
Notes Data for the calculation of organic shares are based on Eurostat and FAOSTAT. The numbers for the organic shares of all livestock are based on FAOSTAT data. FAOSTAT only provides totals for bovine animals, sheep, pigs, and poultry, without further specifications. Please note that growth rates 2007-2016 were similar for Europe and the European Union and are hence not included in the table. * Please note the there is no consistent reporting in the official statistics, no clear distinction is made between the number of animals slaughtered, the places or average numbers of stock. Therefore, the data should be treated with caution. According to the Agricultural Market Information Company AMI, the average stock of fattening pigs was 454’247 in Europe, and 426’946 in the European Union. ** As for pigs (see note above), there is no consistent reporting for poultry. According to the Agricultural Market Information Company AMI, the average stock was 41’569’199 in Europe, and 39’136’927 in the European Union.
Organic shares of all animals
The organic share of all livestock remains small – depending on the animal species (between 0.5 percent and 5.7 percent, Table 56). Monogastric animals (pigs and poultry) account for the lowest shares, partly because of the difficulties posed by the insufficient local supply of organic feeds, the difficulties in the provision of traceable certified feed imports, the high investment in pig barns and pens, and the high price

Europe › Statistics › Livestock
234 FiBL & IFOAM – Organics International (2018): The World of Organic Agriculture. Frick and Bonn
premiums consumers have to pay. The highest organic shares are for organic sheep and cattle as conversion of these rather extensive production schemes is easier.
Increase in numbers
Between 2007 and 2016 (and also 2015 and 2016), the greatest increase was in poultry (+131 percent), which can be partly attributed to the high demand for eggs (see the chapter on the organic market in Europe, Table 59). However, beef and dairy cattle also grew substantially in that decade (+68 percent), as did pigs (+55 percent) and sheep (+34 percent) (Table 56).
Organic livestock by livestock group − For bovine animals (3.9 million heads in Europe), the largest numbers are found
in France (573’623 heads), Germany (410’500 heads), and Austria (404’648 heads). The highest organic shares are in Liechtenstein (26 percent), Latvia (24 percent), Austria (21 percent), and Sweden (20 percent).
− For sheep (4.6 million heads in total), the largest numbers are in the United Kingdom (841’110 heads) and Italy (785’170 heads). The highest organic shares are in Estonia (47 percent) and the Czech Republic (46 percent).
− Looking at the available data for pig stocks (992’752 heads), Germany (118’000 heads), Denmark (66’000 heads) and France (63’000 heads) have the highest numbers (country data: average stock of fattening pigs only).
− For poultry, we assume that country-level data is not comparable, due to different definitions (see explanation below).
Pigs and poultry: Data remain a challenge
In the case of pigs and poultry, in the official statistics, no clear distinction is made between the number of animals slaughtered and the places or average numbers of stock over the year, and it is not always clear which of these is given when “livestock numbers” are quoted. Adding up the data for pigs and poultry over all countries, therefore, is not completely reliable and country data are not necessarily comparable. The data that are presented here should, therefore, be treated with caution and are only an approximation of the overall picture.
Organic cows’ milk
Organic cow’s milk production is one of the production-related indicators with good coverage across all European countries. Organic cows’ milk has almost doubled since 2007 to meet rising demand for milk and dairy products. Organic cows’ milk production now stands at 4.4 million metric tons (European Union: 4.1 million), constituting more than 2.8 percent of the European Union’s milk production from dairy cows in 2016. Some of this growth, however, can be attributed to improved data availability (Figure 81).

Europe › Statistics › Livestock
FiBL & IFOAM – Organics International (2018): The World of Organic Agriculture. Frick and Bonn 235
Figure 81: Europe and the European Union: Development of organic cows’ milk production 2007-20161
Source: FiBL-AMI survey 2009-2018
1 Please note that due to data revisions, the data presented here are not comparable to those published in the 2017 edition of “The World of Organic Agriculture”.

Europe › Statistics › Operators
236 FiBL & IFOAM – Organics International (2018): The World of Organic Agriculture. Frick and Bonn
5 Producers, processors, importers, and exporters
While data on organic producers are available for almost all countries, this is not the case of processors and importers and even less for exporters. While data availability is improving, it is still not possible to draw a clear picture for the latter groups over the years; hence, in the table below, a ten-year development is only shown for the number of producers.
Table 57: Europe: Organic operators by country group 2016
Producers Processors Importers Exporters
No. Growth 1 year
Growth 10 year No. Growth
1 year No. Growth 1 year No. Growth
1 year EU 295’123 10% 58% 62’652 8% 3’968 13% 2’050 5%
Europe 373’240 7% 76% 65’889 10% 4’657 25% 2’235 6%
Source: FiBL-AMI survey 2018 based on national data sources and Eurostat. For a breakdown by country, see Table 64. For detailed data sources see annex.
5.1 Organic producers
In 2016, there were more than 370’000 organic producers in Europe and almost 300’000 in the European Union (Table 57 and Table 64). In the European Union, the country with the largest number of producers is Italy (more than 64’000); in Europe, it is Turkey (almost 68’000) (Figure 84). Compared to the growth in 2015, the increase in numbers of producers was higher (+7 percent in Europe; +10 percent in the European Union). Over the decade 2007-2016, the number of producers in Europe increased by 76 percent (EU +58 percent). Fourteen percent of the world’s organic farmers are in Europe (Figure 82).
5.2 Organic processors and importers
The number of processors and importers increased in almost all European countries in 2016 (Table 57). In Europe, there were almost 66’000 processors (European Union: almost 63’000 in Europe) and almost 4’700 importers (European Union: almost 4’000 in Europe). The largest increase was noted for importers. The country with the largest number of processors is Italy (almost 15’000), and the country with the most importers is Germany (1’500) (Table 57, Figure 83).

Europe › Statistics › Operators
FiBL & IFOAM – Organics International (2018): The World of Organic Agriculture. Frick and Bonn 237
Figure 82: Europe and the European Union: Development of organic producers in 2000-2016
Source: FiBL-AMI surveys 2006-2018 based on national data sources and Eurostat
Figure 83: Europe: Distribution of organic producers and processors by country 2016
Source: FiBL-AMI survey 2018, based on national data sources and Eurostat.

Europe › Statistics › Operators
238 FiBL & IFOAM – Organics International (2018): The World of Organic Agriculture. Frick and Bonn
Figure 84: Europe: Numbers of organic producers by country 2016
Source: FiBL-AMI survey 2018 based on national data sources and Eurostat. For detailed data sources see annex.
142843455155931001142802862944315091'1741'5571'7531'7671'9462'0832'5393'3063'4023'4143'5133'5464'1454'2714'3134'4935'7416'3486'964
10'08320'197
22'43524'213
27'13232'264
36'20764'210
67'879
0 20'000 40'000 60'000 80'000
MaltaIceland
LiechtensteinBosnia and Herzegovina
AlbaniaRussian Federation
LuxembourgKosovo
MoldovaMontenegro
SerbiaUkraineSlovakia
Macedonia, FYROMCyprus
NetherlandsEstoniaIreland
BelgiumNorway
LithuaniaDenmark
United KingdomHungarySloveniaCroatia
LatviaCzech Republic
PortugalFinland
SwedenSwitzerland
BulgariaRomaniaGreecePolandAustria
GermanyFrance
SpainItaly
Turkey
Number of producers
Europe: Organic producers by country 2016Source: FiBL-AMI survey 2018
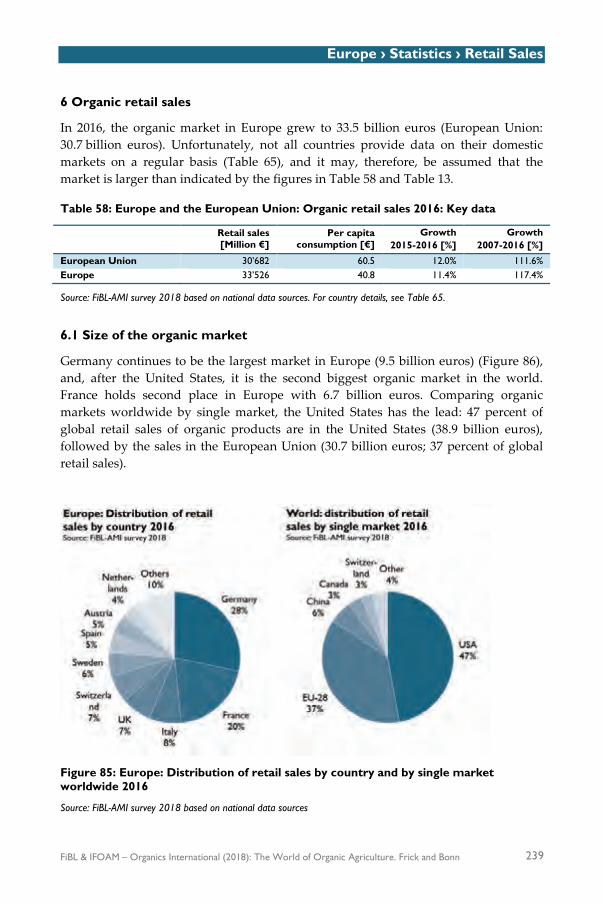
Europe › Statistics › Retail Sales
FiBL & IFOAM – Organics International (2018): The World of Organic Agriculture. Frick and Bonn 239
6 Organic retail sales
In 2016, the organic market in Europe grew to 33.5 billion euros (European Union: 30.7 billion euros). Unfortunately, not all countries provide data on their domestic markets on a regular basis (Table 65), and it may, therefore, be assumed that the market is larger than indicated by the figures in Table 58 and Table 13.
Table 58: Europe and the European Union: Organic retail sales 2016: Key data
Retail sales [Million €]
Per capita consumption [€]
Growth 2015-2016 [%]
Growth 2007-2016 [%]
European Union 30’682 60.5 12.0% 111.6% Europe 33’526 40.8 11.4% 117.4%
Source: FiBL-AMI survey 2018 based on national data sources. For country details, see Table 65.
6.1 Size of the organic market
Germany continues to be the largest market in Europe (9.5 billion euros) (Figure 86), and, after the United States, it is the second biggest organic market in the world. France holds second place in Europe with 6.7 billion euros. Comparing organic markets worldwide by single market, the United States has the lead: 47 percent of global retail sales of organic products are in the United States (38.9 billion euros), followed by the sales in the European Union (30.7 billion euros; 37 percent of global retail sales).
Figure 85: Europe: Distribution of retail sales by country and by single market worldwide 2016
Source: FiBL-AMI survey 2018 based on national data sources

Europe › Statistics › Retail Sales
240 FiBL & IFOAM – Organics International (2018): The World of Organic Agriculture. Frick and Bonn
Comparing retail sales by continent, North America is the largest market (41.9 billion euros) (Figure 12). Please note that there has been a major shift in the relative importance of single markets/continents compared to the 2014 data due to fluctuating exchange rates.
Figure 86: Europe: Retail sales by country 2016
Source: FiBL-AMI survey 2018 based on national data sources (only countries with a turnover of more than one million euros). Please note, that 2016 data were not available for all countries. For detailed data sources see annex.
24446672121304960798099108120150167273394586
1'1711'298
1'5421'686
1'9442'2982'4602'644
6'7369'478
0 2'000 4'000 6'000 8'000 10'000
CyprusTurkey
LatviaSlovakia
LithuaniaLiechtenstein
BulgariaUkrainePortugalHungarySloveniaGreece
Czech RepublicRomaniaCroatia
LuxembourgRussian Federation
IrelandPolandFinland
NorwayBelgium
NetherlandsDenmark
AustriaSpain
SwedenSwitzerland
United KingdomItaly
FranceGermany
Million euros
Europe: Organic retail sales value by country 2016Source: FiBL-AMI survey 2018

Europe › Statistics › Retail Sales
FiBL & IFOAM – Organics International (2018): The World of Organic Agriculture. Frick and Bonn 241
6.2 Growth of the organic market
The organic market grew by approximately 11.4 percent in Europe and 12 percent in the European Union in 2016. It is the second time since the financial crisis in 2008 that double-digit growth occurred in Europe. In the decade 2007 to 2016, the organic market more than doubled in size (Figure 87).
All countries for which new data was available showed growth, many double-digit, with France (the second-largest market in Europe) and Ireland leading with more than 20 percent (Figure 88). Germany, the largest market in Europe, again showed strong growth, increasing by 10 percent. Scandinavian countries also showed strong growth, with Denmark and Norway leading with a 20 percent increase (Table 65).
In the United Kingdom, where retail sales had been decreasing for several years, growth was noted (7.1 percent in 2016) for the fifth consecutive year.1
In 2017, in many European countries, the market often experienced further double-digit growth: figures are expected to be available at the beginning of 2018.
Figure 87: Europe: Growth of organic retail sales in Europe and the European Union, 2000-2016
Source: FiBL-AMI surveys 2004-2018, and OrganicDataNetwork Surveys 2013-2015
1 Note: Although the UK market grew by nearly eight percent in the national currency in 2016, if converted into Euro there has been a drop, due to the exchange rate loss of the British pound after the Brexit vote.

Europe › Statistics › Retail Sales
242 FiBL & IFOAM – Organics International (2018): The World of Organic Agriculture. Frick and Bonn
Figure 88: Europe: The countries with the highest organic market growth 2016
Source: FiBL-AMI surveys 2018
6.3 Per capita consumption of organic food
Like in the previous years, the highest per capita consumption of organic food in 2016 was in Switzerland (274 euros), followed by Denmark (227 euros), Sweden (197 euros), and Luxembourg (188 euros) (Figure 89). Eight countries had a per capita consumption of more than 100 euros in 2016 (Table 65).
The continual growth in consumer interest is well documented by the growth of per capita consumption, with specific notable growth in 2016 (Figure 90). The per capita consumption in Europe has risen to just over 40 euros per year per European citizen and to more than 60 euros in the European Union.
13%
13%
14%
14%
15%
15%
20%
20%
22%
22%
0% 5% 10% 15% 20% 25%
Spain
Austria
Finland
Italy
Luxembourg
Liechtenstein
Norway
Denmark
France
Ireland
Market growth in %
Europe: The countries with the highest growth of the organic market 2015-2016 Source: FiBL-AMI survey 2018

Europe › Statistics › Retail Sales
FiBL & IFOAM – Organics International (2018): The World of Organic Agriculture. Frick and Bonn 243
Figure 89: Europe: The countries with the highest per capita consumption 2016
Source: FiBL-AMI survey 2019based on national data sources. For detailed data sources see annex.
Figure 90: Europe: Growth of the per capita consumption 2000-2016
Source: FiBL-AMI survey 2018 based on national data sources. Calculation based on Eurostat population data. For detailed data sources see annex.
69
76
101
116
171
177
188
197
227
274
0 50 100 150 200 250 300
Netherlands
Norway
France
Germany
Liechtenstein
Austria
Luxembourg
Sweden
Denmark
Switzerland
Per capita consumption in euros
Europe: The countries with the highest per capita consumption of organic food 2016Source: FiBL-AMI survey 2018

Europe › Statistics › Retail Sales
244 FiBL & IFOAM – Organics International (2018): The World of Organic Agriculture. Frick and Bonn
6.4 Organic market shares
The organic share of overall retail sales shows the importance that the organic market has in a given country. As in the past, the highest market shares were reached in Denmark (9.7 percent), Luxembourg (8.6 percent), and Switzerland (8.4 percent) (Figure 91, Table 65). The fact that in many countries the total food market is not growing and that in many cases food prices are decreasing makes organic shares grow even faster. Market shares of individual products can be far higher; these data are provided in Table 59. As there are no retail sales data for Europe or the European Union as a whole, it is not possible to calculate overall organic market shares.
Figure 91: Europe: The countries with the highest shares of the total retail sales 2016
Source: FiBL-AMI survey 2018 based on national data sources for detailed data sources see annex.
6.5 Comparison of organic products and product groups with the total market
While the organic share of the total market is an important indicator, it is also important to look at the organic market shares that individual products can have.
In many countries, organic eggs are one of the success stories within the total retail market. Table 59 shows that Switzerland, Sweden, and France reach market shares (in value) of over 20 percent.
Organic fruit and vegetables continue to be highly popular purchases among European organic consumers. Organic vegetables have the highest market shares after eggs, representing 10 percent or more of the sales value of all vegetables sold in countries such as Switzerland, Austria, Sweden, and Germany. For example, fresh carrots or fresh pumpkins alone have a nearly 30 percent market share in Germany.
3.0
3.2
3.5
4.4
5.1
7.9
7.9
8.4
8.6
9.7
0 2 4 6 8 10 12
Italy
Belgium
France
Netherlands
Germany
Sweden
Austria
Switzerland
Luxembourg
Denmark
Market share in %
Europe: The countries with the highest organic shares of the total market 2016Source: FiBL-AMI survey 2018

Europe › Statistics › Retail Sales
FiBL & IFOAM – Organics International (2018): The World of Organic Agriculture. Frick and Bonn 245
In Sweden and Switzerland, organic dairy products are reaching organic market shares of 10 percent and higher.
Individual products can reach much higher market shares. Organic baby food (over 40 percent in Germany) or organic meat substitutes (46 percent in Germany) are good examples.
On the other hand, products like organic beverages (except wine) and meat (especially poultry), have low market shares in many countries. Often, these products are highly processed and very cheap on the conventional market. Another factor is that many organic consumers tend to eat little or no meat.
6.6 Marketing channels in organic agriculture
Some countries are in a position to break down their retail sales data by marketing channel. Some are even able to provide a breakdown by product and marketing channel. Some countries have data for catering sales, and some countries provide data for direct marketing and box schemes. Wherever possible, the figure for the catering sales was deducted from the figure for the total organic market (Table 65).
Figure 92 shows that the importance of the various marketing channels differs from country to country. In the past, countries with strong involvement by general retailers showed steady organic market growth (e.g., Austria, Denmark, Sweden, Switzerland, and the United Kingdom). However, the financial crisis showed the danger of a strong dependence on supermarkets. In those years, the market decreased in the UK, and in Germany, stagnation was noted for general retail sales, whereas the market continued to grow in specialized channels. France and Italy are good examples of countries with strong market growth, where specialized retailers play a very important role, even though their importance is decreasing.
In Germany, the market has entered into a transition period. Supermarkets have become the driving force in the market, whereas specialised retailers are facing more and more competition. While in 2014, 33 percent of all organic products were sold in organic food shops, this number decreased to 30 percent in 2016. In 2016, 58 percent of the organic food was sold by general retailers.
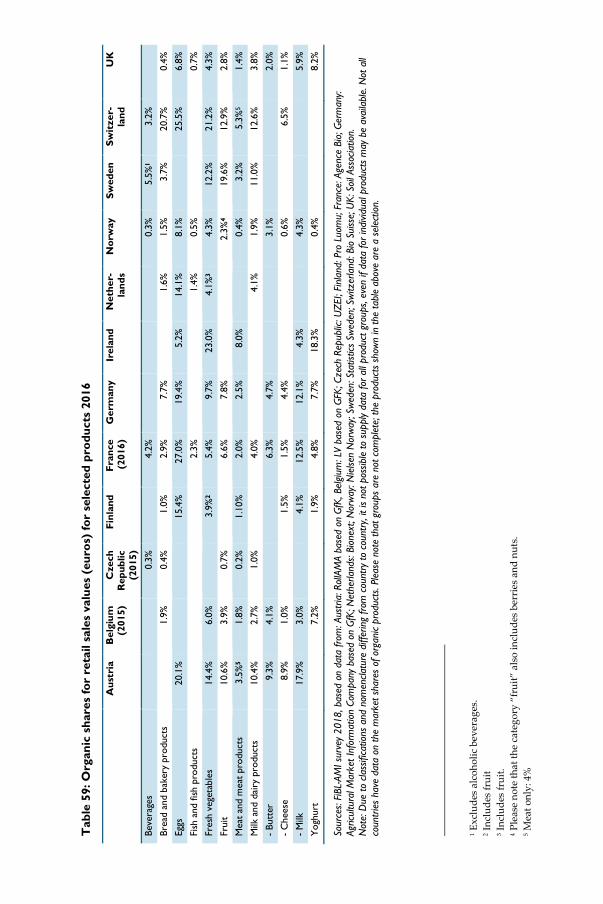
Tab
le 5
9: O
rgan
ic s
hare
s fo
r re
tail
sale
s va
lues
(eu
ros)
for
sele
cted
pro
duct
s 20
16
A
ustr
ia
Bel
gium
(2
015)
C
zech
R
epub
lic
(201
5)
Finl
and
Fran
ce
(201
6)
Ger
man
y Ir
elan
d N
ethe
r-la
nds
Nor
way
Sw
eden
Sw
itze
r-la
nd
UK
Beve
rage
s
0.
3%
4.
2%
0.
3%
5.5%
1 3.
2%
Brea
d an
d ba
kery
pro
duct
s
1.9%
0.
4%
1.0%
2.
9%
7.7%
1.6%
1.
5%
3.7%
20
.7%
0.
4%
Eggs
20
.1%
15
.4%
27
.0%
19
.4%
5.
2%
14.1
%
8.1%
25.5
%
6.8%
Fish
and
fish
pro
duct
s
2.
3%
1.4%
0.
5%
0.7%
Fr
esh
vege
tabl
es
14.4
%
6.0%
3.9%
2 5.
4%
9.7%
23
.0%
4.
1%3
4.3%
12
.2%
21
.2%
4.
3%
Frui
t 10
.6%
3.
9%
0.7%
6.6%
7.
8%
2.3%
4 19
.6%
12
.9%
2.
8%
Mea
t an
d m
eat
prod
ucts
3.
5%5
1.8%
0.
2%
1.10
%
2.0%
2.
5%
8.0%
0.4%
3.
2%
5.3%
5 1.
4%
Milk
and
dai
ry p
rodu
cts
10.4
%
2.7%
1.
0%
4.
0%
4.1%
1.
9%
11.0
%
12.6
%
3.8%
- Bu
tter
9.
3%
4.1%
6.
3%
4.7%
3.
1%
2.0%
-
Che
ese
8.9%
1.
0%
1.
5%
1.5%
4.
4%
0.6%
6.5%
1.
1%
- M
ilk
17.9
%
3.0%
4.1%
12
.5%
12
.1%
4.
3%
4.
3%
5.9%
Y
oghu
rt
7.
2%
1.
9%
4.8%
7.
7%
18.3
%
0.
4%
8.2%
Sour
ces:
FiBL-
AMI s
urve
y 20
18, b
ased
on
data
from
: Aus
tria:
Rol
lAM
A ba
sed
on G
fK, B
elgi
um: L
V ba
sed
on G
FK; C
zech
Rep
ublic
: UZE
I; Fi
nlan
d: P
ro L
uom
u; F
ranc
e: A
genc
e Bi
o; G
erm
any:
Agric
ultu
ral M
arke
t Inf
orm
atio
n Co
mpa
ny b
ased
on
GfK;
Net
herla
nds:
Bion
ext;
Nor
way
: Nie
lsen
Nor
way
; Sw
eden
: Sta
tistic
s Sw
eden
; Sw
itzer
land
: Bio
Sui
sse;
UK:
Soi
l Ass
ocia
tion.
N
ote:
Due
to c
lass
ifica
tions
and
nom
encla
ture
diff
erin
g fro
m c
ount
ry to
cou
ntry
, it i
s no
t pos
sible
to s
uppl
y da
ta fo
r all
prod
uct g
roup
s, ev
en if
dat
a fo
r ind
ividu
al p
rodu
cts
may
be
avai
labl
e. N
ot a
ll co
untri
es h
ave
data
on
the
mar
ket s
hare
s of
org
anic
prod
ucts
. Ple
ase
note
that
gro
ups
are
not c
ompl
ete;
the
prod
ucts
sho
wn
in th
e ta
ble
abov
e ar
e a
sele
ctio
n.
1 Exc
lude
s alc
ohol
ic b
ever
ages
. 2 I
nclu
des
frui
t 3 I
nclu
des
frui
t. 4 P
leas
e no
te th
at th
e ca
tego
ry “
frui
t” a
lso
incl
udes
ber
ries
and
nut
s.
5 Mea
t onl
y: 4
%

Europe › Statistics › Retail Sales
FiBL & IFOAM – Organics International (2018): The World of Organic Agriculture. Frick and Bonn 247
Figure 92: Europe: Marketing channels for organic products in selected countries 2016
Source: FiBL-AMI survey 2018 based on national data sources
For detailed data sources see annex.

Europe › Statistics › Further Reading
248 FiBL & IFOAM – Organics International (2018): The World of Organic Agriculture. Frick and Bonn
7 Conclusion
Currently available data on organic farming and the global and European market shows that, in an international context, the European organic sector is well developed. Relatively high shares of agricultural land, continual growth of the area and number of operators, as well as a fast-growing market, show the exceptional dynamics that the European organic market and sector has.
For many countries, the organic market is growing faster than production, and domestic supply cannot meet demand. Therefore, many organic organisations or market actors are calling for more farmers to convert to organic.
The data analysis provided in this report shows that there are still large discrepancies among European countries. Even though organic agricultural land in some countries in Central and Eastern Europe account for large shares of the overall agricultural land, consumer spending, although growing, remains low as a proportion of total spending on food in these countries.
Another issue that needs to be solved is data availability and quality. For instance, imports and exports play a very important role in trade within the European Union and with external partners, but almost no relevant data exists. Denmark is the only European country that consistently supplies international trade data with a breakdown by country of origin/destination and product. In order to increase the transparency of the organic market, the availability of export and import values could play an important role. Currently, it is not possible to compare production data versus international trade data, which could give important hints on potential fraud cases.
Furthermore, while the availability of domestic market data is improving, it is collected with a wide range of methods and, strictly speaking, is not accurately comparable. Diverging methods and availability remain a challenge. For many countries, particular in Central and Eastern Europe, retail sales data are not collected on a continual basis, and thus, little is known about the importance of organic product sales.
Therefore, we recommend that data availability and accessibility are increased, that classifications, nomenclature, and definitions, in particular for organic market data, are harmonized, and that data quality is improved (Willer and Schaack 2014).
8 Acknowledgements
The data compiled for this article builds on the collection activities of the OrganicDataNetwork project, which was funded by the European Union (EU) under its seventh framework programme for research, demonstration and technological

Europe › Statistics › Further Reading
FiBL & IFOAM – Organics International (2018): The World of Organic Agriculture. Frick and Bonn 249
development, which ended in 2014.1 Under this project, for the first time, detailed organic market data for all European countries was collected2 and stored in one single database, which is available online.3 To present these data, the statistical report for Europe is more comprehensive than for the other continents. The authors would like to thank all of those who have provided data and information for this report, in particular, the partners of the OrganicDataNetwork project.
9 References and further reading European Commission (2010): An Analysis of the EU Organic Sector. European Commission, Directorate-
General for Agriculture and Rural Development. An analysis of the EU organic sector. Brussels. Available at: ec.europa.eu/agriculture/analysis/markets/organic_2010_en.pdf
European Commission, DG Agriculture and Rural Development, Unit Economic Analysis of EU Agriculture (2014): Facts and figures on organic agriculture in the European Union. European Commission, Brussels. Available at: ec.europa.eu/agriculture/markets-and-prices/more-reports/pdf/organic-2013_en.pdf
Eurostat (2017): Organic farming statistics. Data extracted in November. Statistics explained. The Eurostat website, Luxembourg. Last modified December 20, 2017. Available at http://ec.europa.eu/eurostat/statistics-explained/index.php/Organic_farming_statistics
Eurostat (2017): Data tables organic agriculture. The Eurostat website eurostat.ec.europa.eu Eurostat, Luxembourg. Available at http://ec.europa.eu/eurostat/data/database
Eurostat (2016): Organic crop area on the rise in the EU. Eurostat News release of October 25, 2016. Available at http://ec.europa.eu/eurostat/documents/2995521/7709498/5-25102016-BP-EN.pdf
Meredith, S. and Willer, H. (Eds.) (2016): Organic in Europe 2016. IFOAM EU, Brussels and Research Institute of Organic Agriculture FiBL, Frick, 83 pages
Willer, H., Schaack, D., Lernoud, J. and Meredith, S. (2016): Growth trends in European organic food and farming. In: Meredith, S. and Willer, H. (Eds.) (2016): Organic in Europe 2016. IFOAM EU, Brussels and Research Institute of Organic Agriculture FiBL, Frick, pp 21-83
Willer, H. and Schaack, D. (2014) Final report on compilation of key organic market data. Research Institute of Organic Agriculture (FiBL), Frick, Switzerland.
1 The project “Data network for better European organic market information” (OrganicDataNetwork) has received funding from the European Union’s Seventh Framework Programme for Research, Technological Development and Demonstration under grant agreement no 289376. 2 The data was collected by the Research Institute of Organic Agriculture (FiBL), Switzerland, and the Agricultural Market Information Company (AMI), Germany, which are among the partners of the OrganicDataNetwork. In addition, further data sources were used. 3 This database is available at http://www.organicdatanetwork.net/odn-statistics.html

Europe › Statistics › Tables
250 FiBL & IFOAM – Organics International (2018): The World of Organic Agriculture. Frick and Bonn
Organic Agriculture in Europe: Tables
Table 60: Europe: Organic agricultural land by country 2016
Country Organic area [ha]
Organic share [%]
Increase 2015-2016
[%]
Increase 2007-2016
[%]
Increase 2015-2016
[ha] Albania 662 0.1% - +244.7% - Andorra 4 0.02% +100.0% - +2 Austria 571’585 21.9% +3.3% +19.3% +18’015 Belarus Wild collection only Belgium 78’452 6.0% +14.0% +152.7% +9’634 Bosnia & Herzegovina 992 0.05% +72.3% +42.6% +416 Bulgaria 160’620 3.5% +35.5% +672.1% +42’068 Channel Islands 180 1.9% - - - Croatia 93’593 6.0% +23.3% +846.2% +17’710 Cyprus 5’550 5.1% +18.1% +219.2% +851 Czech Republic 488’591 11.5% +2.2% +56.2% +10’558 Denmark 201’476 7.7% +20.8% +40.9% +34’688 Estonia 180’852 18.9% +16.1% +117.1% +25’046 Faroe Islands 253 8.4% - +2009.2% - Finland 238’240 10.4% +5.8% +60.8% +13’005 France 1’538’047 5.5% +16.3% +174.1% +215’845 Germany 1’251’320 7.5% +14.9% +46.5% +162’482 Greece 342’584 4.2% -15.8% +24.0% -64’485 Hungary 186’347 4.0% +43.6% +38.4% +56’612 Iceland 22’710 1.2% +131.8% +344.2% +12’913 Ireland 76’701 1.5% +5.0% +55.7% +3’664 Italy 1’796’363 14.5% +20.4% +60.5% +303’784 Kosovo 160 0.04% - - - Latvia 259’146 14.3% +11.9% +74.4% +27’538 Liechtenstein 1’383 37.7% +24.9% +34.6% +276 Lithuania 221’665 7.6% +3.8% +71.2% +8’086 Luxembourg 4’274 3.3% +1.4% +26.3% +58 Macedonia’ FYROM 3’245 0.3% +49.3% +107.4% +1’071 Malta 24 0.2% -20.0% +100.0% -6 Moldova 30’142 1.2% +4.9% +160.6% +1’413 Montenegro 3’470 1.5% +8.0% -69.1% +257 Netherlands 52’204 2.8% +5.9% +15.0% +2’931 Norway 47’621 4.8% - +1.3% -19 Poland 536’579 3.7% -7.6% +101.6% -44’152 Portugal 245’052 6.7% +1.5% +0.1% +3’677 Romania 226’309 1.7% -8.0% +79.7% -19’615 Russian Federation 289’890 0.1% -24.7% +748.7% -95’250 San Marino
Processing only
Serbia 14’358 0.4% -6.1% +2393.8% -940 Slovakia 187’024 9.9% +2.8% +62.1% +5’142 Slovenia 43’579 9.0% +3.3% +49.5% +1’391 Spain 2’018’802 8.7% +2.6% +168.0% +50’232 Sweden 552’695 18.0% +6.5% +82.3% +33’712 Switzerland 141’249 13.5% +2.9% +22.3% +4’015 Turkey 523’777 1.4% +7.8% +175.2% +37’708 Ukraine 381’173 0.9% -7.2% +47.4% -29’377 United Kingdom 490’205 2.9% -1.2% -23.4% -5’724 Europe 13’509’146 2.7% +6.7% +68.5% +845’232 European Union 12’047’878 6.7% +8.2% +69.1% +912’746
Source: FiBL-AMI survey 2018 based on Eurostat and national data sources. For data sources see annex.

Europe › Statistics › Tables
FiBL & IFOAM – Organics International (2018): The World of Organic Agriculture. Frick and Bonn 251
Table 61: Europe: Conversion status of organic agricultural land 2016
Country Area [ha] Area fully converted [ha] Area under conversion [ha] Albania 662
Andorra 4 4
Austria 571’585
Belarus Wild collection Belgium 78’452 56’055 22’397 Bosnia and Herzegovina 992 880 111 Bulgaria 160’620 36’275 124’345 Channel Islands 180 180
Croatia 93’593 29’172 64’421 Cyprus 5’550 3’083 2’467 Czech Republic 488’591 427’331 61’260 Denmark 201’476 158’796 42’680 Estonia 180’852 150’442 30’411 Faroe Islands 253 253
Finland 238’240 198’202 40’035 France 1’538’047 1’054’877 483’170 Germany 1’251’320
Greece 342’584 308’279 34’305 Hungary 186’347 91’301 95’045 Iceland 22’710 22’594 116 Ireland 76’701 46’517 30’185 Italy 1’796’363 1’201’476 594’888 Kosovo 160 160
Latvia 259’146 166’551 92’596 Liechtenstein 1’383 1’111 272 Lithuania 221’665 134’266 87’399 Luxembourg 4’274 3’746 528 Macedonia’ FYROM 3’245 2’047 1’199 Malta 24 21 3 Moldova 30’142 21’394 8’747 Montenegro 3’470 3’049 421 Netherlands 52’204 46’669 5’534 Norway 47’621 44’681 2’940 Poland 536’579 430’896 105’683 Portugal 245’052 73’308 171’743 Romania 226’309 149’613 76’696 Russian Federation 289’890 69’042 31’237 Serbia 14’358 7’391 6’967 Slovakia 187’024 140’531 46’493 Slovenia 43’579 36’353 7’226 Spain 2’018’802 1’399’734 619’069 Sweden 552’695 472’237 80’458 Switzerland 141’249
Turkey 523’777 379’042 144’735 Ukraine 381’173 289’551 91’622 United Kingdom 490’205 466’041 24’164 Europe 13’509’146 8’123’150 3’231’568 European Union 12’047’878 7’281’771 2’943’201
Source: FiBL-AMI survey 2018 based on Eurostat and national data sources. For data sources see annex.

Europe › Statistics › Tables
252 FiBL & IFOAM – Organics International (2018): The World of Organic Agriculture. Frick and Bonn
Table 62: Europe: Land use in organic agriculture by country 2016
Country Arable land crops [ha]
Permanent crops [ha]
Permanent grassland [ha] Total [ha]
Albania 93 420
662 Andorra
4
4
Austria 205’610 8’777 357’037 571’585 Belarus
Belgium 26’437 807 51’208 78’452 Bosnia and Herzegovina 408 68
992
Bulgaria 89’472 33’108 38’736 160’620 Channel Islands
180
Croatia 44’186 10’316 39’089 93’593 Cyprus 2’909 2’556 85 5’550 Czech Republic 64’995 5’608 417’987 488’591 Denmark 167’990 687 32’798 201’476 Estonia 84’023 2’007 94’821 180’852 Faroe Islands 1
252 253
Finland 235’929 445 1’863 238’240 France 830’870 104’504 601’974 1’538’047 Germany 510’000 19’000 712’000 1’251’320 Greece 104’529 52’692 185’363 342’584 Hungary 73’252 8’226 104’869 186’347 Iceland 697 280 8’227 22’710 Ireland 6’114 50 70’551 76’701 Italy 774’449 449’004 506’152 1’796’363 Kosovo 160
160
Latvia 138’247 1’919 118’979 259’146 Liechtenstein 308 7 1’069 1’383 Lithuania 144’485 6’218 70’961 221’665 Luxembourg 1’804 76 2’393 4’274 Macedonia’ FYROM 2’815 430
3’245
Malta 9 15
24 Moldova 25’982 4’160
30’142
Montenegro 263 408 2’799 3’470 Netherlands 21’888 577 29’738 52’204 Norway 38’383 282 8’956 47’621 Poland 364’440 34’642 137’497 536’579 Portugal 47’310 45’395 152’351 245’052 Romania 158’009 10’689 57’612 226’309 Russian Federation 92’303 84 725 289’890 Serbia 9’592 3’339 1’429 14’358 Slovakia 60’263 1’577 125’184 187’024 Slovenia 5’700 2’384 35’494 43’579 Spain 491’786 474’635 1’052’381 2’018’802 Sweden 430’361 543 121’790 552’695 Switzerland 28’695 1’730 110’823 141’249 Turkey 294’146 211’127 15’499 523’777 Ukraine 307’000 5’000 45’000 381’173 United Kingdom 150’982 4’221 335’001 490’205 Europe 6’036’893 1’508’016 5’648’692 13’509’146 European Union 5’236’049 1’280’678 5’453’914 12’047’878
Source: FiBL-AMI survey 2018 based on Eurostat and national data sources. For data sources see annex. Total includes other agricultural areas for which no land use details were available.

Europe › Statistics › Tables
FiBL & IFOAM – Organics International (2018): The World of Organic Agriculture. Frick and Bonn 253
Table 63: Europe: Organic agricultural land and wild collection areas by country 2016
Country Agricultural land [ha]
Wild collection [ha]
Total [ha]
Albania 662 467’783 468’445 Andorra 4
4
Austria 571’585
571’585 Belarus 2’742 2’742 Belgium 78’452 3 78’454 Bosnia and Herzegovina 992 69’310 70’302 Bulgaria 160’620 307’020 467’640 Channel Islands 180
180
Croatia 93’593 8 93’601 Cyprus 5’550
5’550
Czech Republic 488’591
488’591 Denmark 201’476 2’648 204’124 Estonia 180’852 40’579 221’431 Faroe Islands 253
253
Finland 238’240 11’628’576 11’866’816 France 1’538’047
1’538’047
Germany 1’251’320
1’251’320 Greece 342’584 317’053 659’637 Greenland
Hungary 186’347
186’347
Iceland 22’710 212’468 235’178 Ireland 76’701
76’701
Italy 1’796’363 176’628 1’972’991 Kosovo 160 179’580 179’740 Latvia 259’146
259’146
Liechtenstein 1’383
1’383 Lithuania 221’665
221’665
Luxembourg 4’274
4’274 Macedonia’ FYROM 3’245 556’600 559’845 Malta 24
24
Moldova 30’142
30’142 Montenegro 3’470 143’410 146’880 Netherlands 52’204
52’204
Norway 47’621
47’621 Poland 536’579
536’579
Portugal 245’052 40’000 285’052 Romania 226’309 1’787’548 2’013’857 Russian Federation 289’890 30’921 320’811 San Marino
Serbia 14’358 1’550 15’908 Slovakia 187’024
187’024
Slovenia 43’579 13’238 56’817 Spain 2’018’802
2’018’802
Sweden 552’695
552’695 Switzerland 141’249
141’249
Turkey 523’777 137’433 661’210 Ukraine 381’173 550’000 931’173 United Kingdom 490’205
490’205
Europe 13’509’146 16’665’097 30’174’243 European Union 12’047’878 14’313’300 26’361’178
Source: FiBL-AMI survey 2018 based on Eurostat and national data sources. For data sources see annex.

Europe › Statistics › Tables
254 FiBL & IFOAM – Organics International (2018): The World of Organic Agriculture. Frick and Bonn
Table 64: Europe: Organic producers’ processors and importers by country 2016
Country Producers Processors Importers Exporters Albania 51 22 4 25 Andorra 1 3 1
Austria 24’213 1’683 57 10 Belarus
1
1
Belgium 1’946 1’116 183 84 Bosnia and Herzegovina 45 17
13
Bulgaria 6’964 175 13 9 Croatia 3’546 312 8 0 Cyprus 1’174 57 4 4 Czech Republic 4’271 616 190 96 Denmark 3’306 972 78 80 Estonia 1’753 135 26 2 Faroe Islands 1 1
Finland 4’493 535 80 11 France 32’264 12’826 223
Germany 27’132 14’501 1’598 787 Greece 20’197 1’495 20 69 Hungary 3’414 442 34
Iceland 28 30 2 2 Ireland 1’767 277 24
Italy 64’210 16’578 363 518 Kosovo 100 5
2
Latvia 4’145 48 9 1 Liechtenstein 43
Lithuania 2’539 65 11 2 Luxembourg 93 82 4
Macedonia, FYROM 509 17 1 6 Malta 14 7 13
Moldova 114 2 1 72 Monaco
1
Montenegro 280 12 Netherlands 1’557 990 364 81
Norway 2’083 399 79 1 Poland 22’435 705 120 180 Portugal 4’313 616 9 7 Romania 10’083 150 5 5 Russian Federation 55 35
9
San Marino
2 Serbia 286 44 39 8
Slovakia 431 36 13 2 Slovenia 3’513 310 14
Spain 36’207 3’810 205 92 Sweden 5’741 1’144 165 10 Switzerland 6’348 1’224 501
Turkey 67’879 1’422 61 46 Ukraine 294
United Kingdom 3’402 2’969 135
Europe 373’240 65’889 4’657 2’235 European Union 295’123 62’652 3’968 2’050
Source: FiBL-AMI survey 2018 based on Eurostat and national data sources. For data sources see annex.

Europe › Statistics › Tables
FiBL & IFOAM – Organics International (2018): The World of Organic Agriculture. Frick and Bonn 255
Table 65: Europe: The organic food market 2016
Country Retail sales
[Million €]
€/person [€]
One year growth [%]
Organic share [%]
Exports [Million €]
Catering [Million €]
Austria 1’542 177 13% 7.9% 80 (2011) 98 Belgium 586 52 12% 3.2%
Bosnia and Herzegovina 0.4 0.1
2
Bulgaria 7 (2010) 1 (2010
Croatia 99 (2014) 24 (2014)
2.2% (2014) 3 (2011)
Cyprus 2 (2006) 2 (2006)
Czech Rep. 79 (2015) 7 (2015)
0.8% (2015) 53 (2015) 3
Denmark 1’298 227 20% 9.7% 329 271 Finland 273 50 14% 2.0% 10 (2014)
France 6’736 101 22% 3.5% 629 411 Germany 9’478 116 10% 5.1%
Greece 60 (2010) 5 (2010)
Hungary 30 (2015) 3 (2015)
20 (2009)
Ireland 150 32 22% 0.7% (2011)
Italy 2’644 44 14% 3.0% 1’915 377 Kosovo
6
Latvia 4 (2011) 2 (2011)
0.2%(2011)
Liechtenstein 6 171 15%
Lithuania 6 (2011) 2 (2011)
0.2% (2011)
Luxembourg 108 188 15% 8.6%
Moldova
15
Montenegro 0.1 0.2
Netherlands 1’171 69 9% 4.4% 1’200 230 Norway 394 76 20% 1.7%
25
Poland 167 (2015) 4 (2015)
Portugal 21 (2011) 2 (2011)
0.2%
Romania 80 (2011) 4 (2011)
0.7%(2011) 200 (2011)
Russia 120 (2009) 1
Serbia
19
Slovakia 4 1
0.2%
Slovenia 49 (2013) 27 (2013)
1.8%(2013) 0 0 Spain 1’686 36 13% 1.7% 891
Sweden 1’944 197 12% 7.9% 84 475 Switzerland 2’298 274 8% 8.4%
Turkey 4 0.05
78
Ukraine 21 0.5
59
UK 2’460 38 7% 1.5%
93
Europe 33’526 60 11%
European Union 30’682 40 12%
Source: FiBL-AMI survey 2018. For details on data sources see annex.
Note on table: Where no published data exists, best estimates from experts have been used, but new data were not available for all countries. Therefore, in some cases earlier estimates are shown. Values published in national currencies were converted to euros using the 2016 average exchange rates according to the Central European bank. Please note that due to fluctuating exchange rates it is not possible to make a year-to-year comparison for countries that do not have the Euro as their currency.

Europe › Ukraine
256 FiBL & IFOAM – Organics International (2018): The World of Organic Agriculture. Frick and Bonn
Organic in Ukraine
OLGA TROFIMTSEVA1 AND NATALIE PROKOPCHUK2
The organic market in Ukraine is constantly developing. Thanks to the country’s size (603.6 thousand km2 including 42.7 million hectares of agricultural land, according to the State Statistics Service of Ukraine), geographical location, proximity to potential international buyers, and widespread fertile black soils, Ukraine has favourable conditions for organic agriculture.
Organic area and operators
In 2017, the Reform Support Team at the Ministry of Agrarian Policy and Food of Ukraine collected data on organic agriculture among certification bodies that certified organic production and trade of organic products according to the EU organic regulation and the US National Organic Program (NOP) in Ukraine.
The data (as of December 31, 2016) show the following:
• Fully converted organic agricultural area (EU): 289’551 hectares, • Agricultural area in conversion (EU): 91’622 hectares, • Total area of agricultural land organic (fully converted and in conversion) (EU):
381’173 hectares • Total area of agricultural land: 42.7 million hectares (http://www.ukrstat.gov.ua) • Organic share of total agricultural land: 0.89% • Total number of operators (EU): There are 426 operators of which 294 are
agricultural producers • Total number of certification bodies (EU): 19
The majority of organic operators in Ukraine are certified according to the EU organic standard, i.e., equivalent to EU Regulations 834/2007 and 889/2008, which are used for both export and domestic markets.
Organic exports
In the last few years, Ukraine has become an important supplier of organic products for Western markets. The main organic export products from Ukraine are cereals, oil crops, pulses, wild collected berries, mushrooms, nuts, and herbs.
1 Olga Trofimtseva, Ministry of Agrarian Policy and Food of Ukraine, Deputy Minister on European Integration, [email protected], Khreshchatyk street, 24, Kyiv city, 01001, Ukraine; www.minagro.gov.ua 2 Natalie Prokopchuk, SECO-FiBL Project “Organic Market Development in Ukraine”, Project Manager, [email protected], Khreshchatyk street, 15, office 6, Kyiv city, 01001, Ukraine; www.ukraine.fibl.org

Europe › Ukraine
FiBL & IFOAM – Organics International (2018): The World of Organic Agriculture. Frick and Bonn 257
According to data from the leading certification body, Organic Standard, in 2017, the top organic products (by volume) exported by their clients from Ukraine were: corn, wheat, soya, barley, spelt, sunflowers, hulled millet, rapeseed, blueberries (frozen), oats, millet, lupine, apples (fresh), buckwheat, mustard, elderberries (fruits), pumpkin seeds, birch sap, flax, flakes, rye, walnuts (kernel), sea-buckthorn (frozen), blackberries (frozen), rosehip (frozen), coriander, pea, elderberries (flowers frozen), wild strawberry (frozen), cranberries (frozen), apple juice concentrate, hawthorn (frozen), sunflower cakes, durum wheat flour, cowberry fruits (frozen), black chokeberry fruits (frozen), chamomile (dried), hemp, raspberries (frozen), and sunflower oil.
More and more Ukrainian operators intend to export not only raw materials but also organic semi-processed and processed products.
In 2016, organic exports from Ukraine were about 300 thousand tons with a value of more than 65 million US dollars1 (estimated data from the survey conducted by the Organic Standard certification body with Ukrainian exporters). The organic exporters from Ukraine benefit from the Association Agreement signed in June 2014 between the EU and Ukraine, which has reduced trade barriers for Ukrainian exporters. Since January 2016, the EU and Ukraine have been applying the Deep and Comprehensive Free Trade Area (DCFTA), which forms part of the Association Agreement. At the same time, Ukrainian exporters suffer from the EU guidelines on additional official controls on products from Ukraine, which have been applied since January 2016.
According to the Organic Standard data, the top 11 importers (by volume) of Ukrainian organic products2 are the Netherlands, Germany, the UK, Italy, Austria, Poland, Switzerland, Belgium, the Czech Republic, Bulgaria, and Hungary. Ukrainian producers also export to the United States, Canada, Australia and some Asian countries.
Domestic market
The domestic market for organic products started to emerge at the end of the 2000s, and in 2008, the first Ukrainian organic labelled products appeared on the shelves of Ukrainian retailers. The main sales channels are supermarkets and specialty shops in big cities. The assortment of organic products available on the shelves is still not full. Consumers can buy the following Ukrainian organic product categories in retail shops: dairy and meat products, grocery and bakery products, flour, macaroni products, vegetable oils, beverages (juice, birch sap, herbal tea), canned products (e.g., berry paste, syrup, jam), some vegetables and fruits, etc. The biggest challenge for the domestic market is a low awareness of organic among consumers.
1 According to the Central European Bank, I euro corresponded to 1.1069 US dollars in 2016. 2 The data do not only refer to operators that were certified by Organic Standard.

Europe › Ukraine
258 FiBL & IFOAM – Organics International (2018): The World of Organic Agriculture. Frick and Bonn
Ukraine follows the global trend of “regional + organic” and already has some success stories of Ukrainian exporters with products having both organic and regional labelling (from the Ukrainian Carpathians).
Certification bodies
Fifteen internationally accredited certification bodies are included in the official list of approved organic certification bodies for Ukraine according to EU Regulation 1235/2008 (as of 16/10/2017). These are: Organic Standard, Bio.inspecta AG, Ecocert SA, CERES Certification of Environmental Standards GmbH, Control Union Certifications, Kiwa BCS Öko-Garantie GmbH, Ecoglobe, Istituto Certificazione Etica e Ambientale (ICEA), Lacon GmbH, Suolo e Salute srl, Agreco R.F. Göderz GmbH, Bioagricert S.r.l., Ekoagros, A CERT European Organization for Certification S.A. and Valsts SIA “Sertifikācijas un testēšanas centrs”. The only Ukrainian certification body is Organic Standard; all others are foreign or their local branches. Since 2015 most of the certification bodies active in Ukraine have participated in the Platform Ukraine at the European Organic Certifiers Council (EOCC).
Organic stakeholders
The Ukrainian organic sector is represented by the following organic stakeholders: QueS consultancy body, Organic Standard certification body, Information center “Green Dossier”, Organic Ukraine Public Union of Producers of Certified Organic Products, Organic Federation of Ukraine, Ecoterra Lviv NGO, VIP Group, Organic Business, Sib-Agro, Institute of Organic Production, BIOLan Ukraine Association of Organic Production Stakeholders, Natur Boutique, Ukrainian Organic Cluster, Retail Academy as well as active organic producers, processors, and traders.
International support
Ukraine had been receiving international support for the organic market development from
• Switzerland: Swiss State Secretariat for Economic Affairs (SECO), Research Institute of Organic Agriculture (FiBL), Swiss Agency for Development and Cooperation (SDC), and Bern University of Applied Science (BFH) since 2002,
• Germany: Federal Ministry of Food and Agriculture (BMEL) and AFC/IAK1 since 2016, and
• United States: USAID through the AgroInvest project in 2011-2016 and the Agriculture and Rural Development (ARDS) project since 2016.
1 AFC is the Agriculture & Finance Consultants GmbH (AFC), www.afci.de. IAK is the IAK Agrar Consulting GmbH www.iakleipzig.de.

Europe › Ukraine
FiBL & IFOAM – Organics International (2018): The World of Organic Agriculture. Frick and Bonn 259
Policy on organic
The development of the organic market in Ukraine is one of the priority areas in the reforming strategy plan for the agricultural sector “3+5”, which is based on the Strategy for Agriculture and Rural Development 2015-2020. This strategy has been initiated and elaborated by the Ministry of Agrarian Policy and Food of Ukraine in cooperation with local organic stakeholders and international partners. Experts of organic priority of the Strategy started their work in May 2017 at the Reform Support Team at the Ministry of Agrarian Policy and Food of Ukraine.
The Ukrainian Law on organic production and trade of organic products and raw materials No 425-VII was adopted on September 3, 2013 but has not been implemented. The Ministry of Agrarian Policy and Food of Ukraine has initiated a new draft of the organic law and elaborated it in partnership with key organic stakeholders and with support from international partners aiming at harmonization with the EU organic Regulation. This draft of the organic law on basic principles and requirements for organic production, circulation, and labelling of organic products is registered in the Ukrainian Parliament under No 5448 from 24.11.2016 and is now being fine-tuned by the Committee on Agricultural Policy and Land Affairs of the Verkhovna Rada of Ukraine (the Ukrainian Parliament).
The Ukrainian state logo for labelling of organic products was officially registered as a trademark owned by the Ministry of Agrarian Policy and Food of Ukraine.
Figure 93: Ukrainian state organic logo
Key organic events in 2017
The First International Congress "Organic Ukraine 2017" (January 26-28, 2017, Kyiv city) gathered more than 250 participants, including 70 speakers from nine countries, for the exchange of experience and the establishment of mutually beneficial cooperation. Both Deputy Ministers of Agrarian Policy and Food of Ukraine, who are responsible for the topic of organic agriculture, Olga Trofimtseva and Olena Kovaliova, made presentations and answered questions from Ukrainian producers, international buyers, and other participants. One of the practical results of the

Europe › Ukraine
260 FiBL & IFOAM – Organics International (2018): The World of Organic Agriculture. Frick and Bonn
Congress was the conclusion of two international agreements on the supply of organic products to Switzerland. Within the framework of the Congress, there was also an exhibition of organic products, where 36 exhibitors attracted the attention of more than 3’000 visitors.
More transparency could be achieved through verifying good organic farming practices, shorter supply chains, and traceability – these were the conclusions of the approximately 169 participants from 14 countries at the International Conference “Improving Integrity of Organic Supply Chains” held on September 22 and 23, 2017 in Odesa city.
The fourth Ukrainian National Pavilion was organized at BIOFACH 2017 (February 15-18, 2017, Nuremberg, Germany). Seventeen exhibitors of the Ukrainian National Pavilion had more than 800 business meetings. For the first time, Ukraine was presented at a high policy level. The 2nd Forum "Ukraine — Your organic sourcing Partner" at the BIOFACH 2017 gathered about 120 participants from 10 countries.
In 2018, the Ukrainian National Pavilion will celebrate its fifth anniversary at the international organic trade fair BIOFACH.

FiBL & IFOAM – Organics International (2018): The World of Organic Agriculture. Frick and Bonn 261
Mediterranean Countries

Mediterranean Countries › Overview
262 FiBL & IFOAM – Organics International (2018): The World of Organic Agriculture. Frick and Bonn
Organic Agriculture in the Mediterranean Region: Recent Data Outline
MARIE REINE BTEICH,1 PATRIZIA PUGLIESE,2 LINA AL-BITAR,3 AND SUZANA MADŽARIĆ4
The Mediterranean Organic Agriculture Network (MOAN5) pursues its commitment to collect and disseminate data on the organic sector in the Mediterranean region and plays a bridging role for institutional dialogue and exchange among member countries. Figures presented in this report refer to 2016.
Latest figures
According to the latest data, the total certified organic area in the Mediterranean region covers over 7.9 million hectares, of which 6.9 million hectares are organic agricultural area (Table 66). The largest part of the Mediterranean organic area is in the Mediterranean countries of the European Union (EU Med) totalling 79 percent of the total organic area and 87 percent of the agricultural organic area. Candidate and Potential Candidate (CPC) countries follow with 14 and 8 percent, respectively. Only 7 percent and 5 percent of these areas are located in the Southern and Eastern Mediterranean (SEM) countries, respectively.
Countries with the largest organic agricultural land areas are Spain, Italy and France, which are all EU Med countries. Turkey is by far the leader in the CPC countries. Tunisia followed by Egypt, stand out in the SEM countries in terms of organic agricultural area.
1 Marie Reine Bteich, MOAN Secretariat, CIHEAM Bari, Istituto Agronomico Mediterraneo di Bari, Via Ceglie, 9, 70010 Valenzano, Italy. www.iamb.it. 2 Patrizia Pugliese, MOAN Secretariat, CIHEAM Bari, Istituto Agronomico Mediterraneo di Bari, Via Ceglie, 9, 70010 Valenzano, Italy. www.iamb.it. 3 Lina Al-Bitar, MOAN Secretariat, CIHEAM Bari, Istituto Agronomico Mediterraneo di Bari, Via Ceglie, 9, 70010 Valenzano, Italy. www.iamb.it. 4 Suzana Madžarić, CIHEAM Bari, Istituto Agronomico Mediterraneo di Bari, Via Ceglie, 9, 70010 Valenzano, Italy. www.iamb.it. 5 MOAN is an institutional platform for representatives of Ministries in charge of agriculture to exchange data, knowledge and experience for the development of Mediterranean Organic Agriculture. MOAN is a tool to promote cooperation and policy dialogue for sustainable production and consumption patterns in changing Mediterranean communities and territories, through the diffusion of organic agriculture’s lasting values and innovative practices. Currently, the network includes 23 Euro-Mediterranean countries (http://moan.iamb.it/).

Mediterranean Countries › Overview
FiBL & IFOAM – Organics International (2018): The World of Organic Agriculture. Frick and Bonn 263
Table 66: Organic statistics in EU Med, Candidate and Potential Candidate (CPC) and Southern and Eastern Mediterranean (SEM) countries, 2016
Country Total organic area(a) [ha]
Organic agricultural area [ha]
Total number of organic
operators [no.]
EU
Med
Cou
ntri
es
Croatia 93’814 93’814 3’673 Cyprus(b) 5’550 5’550 1’239 France 1’537’351 1’537’351 47’106 Greece 342’584 342’584 21’781 Italy 1’972’991 1’796’363 72’154 Malta 24 24 37 Portugal 245’052 245’052 4’672 Slovenia 43’579 43’579 3’842 Spain 2’018’802 2’018’802 39’744
EU Med total 6’259’748 6’083120 194 ‘248
Can
dida
te a
nd
Pot
enti
al
Can
dida
te
coun
trie
s
Albania(c) 330’885 662 51 Bosnia & Herzegovina n.a. n.a. n.a. FYROM 15’192 2’818 588 Montenegro 146’880 3’470 280 Serbia 14’358 14’358 290 Turkey 576’983 523’777 69’408
CPC total 1’074’297 545’084 70’617
Sout
hern
and
Eas
tern
Med
C
ount
ries
Algeria 1’400 772 70 Egypt 165’908 105’908 1’212
Jordan 1’517 1’517 19 Lebanon 1’472 1’079 129 Libya n.a. n.a n.a. Morocco 180’035 10’000 400 PNA(d) 5’993 5’993 1’553 Syria n.a. n.a n.a. Tunisia 234’457 178’536 3’655
SEM total 590’781 303’805 7’038 Total 7’925’385 6’932’009 271’903
Source: MOAN - Mediterranean Organic Agriculture Network (a) Includes wild collection and forests; (b) Eurostat data; (c) Data from 2014; (d) Palestine National Authority Note: For some countries, FiBL and MOAN are not using the same data sources, hence the differences in the data in some cases (both for the organic agricultural area as well as the percentages).
The regional patterns change when considering non-agricultural area distribution. As noted in past years, in non-EU countries a substantial share of the total organic area is dedicated to non-agriculture land use, mainly for grazing, wild collection and forests, with almost equal in the CPC and SEM countries (49 percent). In EU Med countries, the non-agricultural organic area is by far less important (2.8 percent of the total organic area).
At the country level, Montenegro is the country with the highest share of non-agricultural organic area (97 percent) followed by Morocco (94 percent) and the Former Yugoslav Republic of Macedonia (82 percent). As of 2014, almost all of

Mediterranean Countries › Overview
264 FiBL & IFOAM – Organics International (2018): The World of Organic Agriculture. Frick and Bonn
Albania’s organic area was non-agricultural land; no recent data are available to confirm whether this is still the case.
Over 71 percent of the organic operators are concentrated in the EU Med countries, 26 percent in the CPC and 3 percent in the SEM countries.
Producers remain the most numerous category of operators in all the Mediterranean countries (89 percent) regardless of geographical sub-region or country.
Organic share of the agricultural area
In order to have a more comprehensive picture of the organic cultivated land in each country in the Mediterranean region, the organic share of the total Utilized Agricultural Area (UAA) is given.
Italy has a leading position within EU Med countries with an organic share of 14.5 percent of the total agricultural land followed by Spain (7.7 percent) and Slovenia (7.1 percent). In France, despite the 1.5 million hectares of organic agricultural area, the organic share is only 5.4 percent.
The organic share of total agricultural land is significantly lower in CPC and SEM countries, where the highest values are in Montenegro (1.5 percent) and Turkey (1.4 percent) in CPC, and Egypt (2.8 percent) and Tunisia (1.8 percent) in SEM.
A focus on processors
The distribution of processors among the three sub-regions is not much different from that of the producers. EU Med countries account for 94 percent of organic processors, while only 4 percent and 2 percent are present in the CPC and SEM countries, respectively.
At the same time, it is worth noting that in most SEM countries, an important share of organic operators are engaged in processing, particularly in Morocco (71 percent) and Lebanon (39.5 percent) (Figure 94). This is a clear indicator of the growing importance of processing activities in the organic sector of these countries. Unfortunately, detailed information about organic processors in the SEM and CPC countries is not yet regularly available.

Mediterranean Countries › Overview
FiBL & IFOAM – Organics International (2018): The World of Organic Agriculture. Frick and Bonn 265
Figure 94: Share of organic operators involved in processing in the EU Med, candidate and potential candidate (CPC), and southern and eastern Mediterranean (SEM) countries, 2016
Source: MOAN - Mediterranean Organic Agriculture Network Note: For some countries, FiBL and MOAN are not using the same data sources, hence the differences in the data in some cases (both for the organic agricultural area as well as the percentages).
A focus on data collection1
The legislative and regulatory framework in the Mediterranean area highly differs between the EU Med, CPC and SEM and among countries within the CPC and SEM sub-regions. This directly affects organic data collection and availability.
Each year, all EU countries have to send the sector figures to the European Commission. Therefore, official mechanisms for organic statistics collection are well established.
In the CPC countries, many countries, such as the Former Yugoslav Republic of Macedonia, Montenegro, Serbia and Turkey have already implemented their national organic legislation and are at a very advanced stage of harmonisation with the (EC) No. 834/2007. Consequently, the competent authority (Ministry of Agriculture) has the mandate to collect and store data on the sector. Therefore, structural data on the organic sector are officially available and communicated to the EC. In Serbia, an ad hoc software has been developed for the Ministry of Agriculture and is currently being further modified to regularly collect and organise data and information about the
1 Contents based on information from: Patrizia Pugliese, Marie Reine Bteich and Lina Al-Bitar (eds.) (8. (2014) Mediterranean Organic Agriculture key Features, recent Facts, latest Figures. REPORT 2014. Mediterranean Organic Agriculture Network (MOAN), CIHEAM Bari.
2.3%
4.6%
6.9%
8.1%
9.6%
13.1%
18.9%
22.5%
23.0%
0% 10% 20% 30%
Croatia
Cyprus
Greece
Slovenia
Spain
Portugal
Malta
France
Italy
Share of processors of all operators
EU Med
2.0%
2.5%
4.3%
n/a
0% 10% 20% 30%
Turkey
Montenegro
FYROM
Serbia
Share of processors of all operators
CPC
3.0%
4.3%
5.2%
20.0%
21.1%
39.5%
71.0%
0% 20% 40% 60% 80%
PNA
Algeria
Tunisia
Egypt
Jordan
Lebanon
Morocco
Share of processors of all operators
SEM

Mediterranean Countries › Overview
266 FiBL & IFOAM – Organics International (2018): The World of Organic Agriculture. Frick and Bonn
organic sector in the country. In Turkey, the Organic Farming Information System (OFIS) has been in operation since 2005 and allows direct data entry from the control bodies. In Albania and in Bosnia and Herzegovina, where national organic legislation is absent, data collection is not mandatory. Therefore, comprehensive data are very hard to obtain and, when available, data collection is still essentially based on direct communication with informal contacts.
Among the SEM countries, detailed data are available in Lebanon and Tunisia. In Lebanon, where the sector is regulated by a ministerial decree and there is only one control body operating in the country, data are mandatorily communicated to the Ministry of Agriculture. In Tunisia, the national law is fully implemented and data are mandatorily communicated by the control bodies to the Ministry of Agriculture. In the other SEM countries (Algeria, Egypt, Jordan, Morocco and Palestine National Authority), where no national law is fully implemented, data collection is also essentially based on direct and informal communication and contacts, which sometimes provide only partial information.
Acknowledgements Our special thanks to all MOAN contacts who shared country data: • Ms Hadjira Houria Abdellaoui, MOAN delegate. Ministry of Agriculture and Rural
Development, Algeria • Ms Darija Musulin. Ministry of Agriculture, Croatia • Mr Atef Abdel-Azziz Ragab, MOAN Delegate. Central Laboratory for Organic Agriculture,
Egypt • Ms Olivera Bicikliski, MOAN Delegate. Ministry of Agriculture, Forestry and Water
Management, Former Yugoslav Republic of Macedonia • Ms Florence Aillery, MOAN delegate. Ministry of Agriculture, Food and Forestry, France • Mr Filippos Sekkas. Ministry of Rural Development and Food, Greece • Ms Roberta Cafiero, MOAN delegate. Ministry of Agriculture and Forestry Policies, Italy • Ms Tamam Khawalda, MOAN Delegate. Ministry of Agriculture, Jordan • Ms Pauline Eid Saad, MOAN Delegate. Ministry of Agriculture, Lebanon • Mr Leo Vella, MOAN delegate. Ministry for the environment, sustainable development and
climate change, Malta • Ms Andrijana Rakočević, MOAN Delegate. Ministry of Agriculture Montenegro • Mr Allal Chibane, MOAN Delegate. Ministry of Agriculture and Fisheries, Morocco • Mr Ibrahim Abdalhamid, MOAN Delegate. Ministry of Agriculture and Rural Development,
Palestine National Authority • Ms Cristina Hagatong, MOAN delegate. Ministry of Agriculture, Forestry and Rural
Development, Portugal • Ms Jelena Milic, MOAN delegate. Ministry of Agriculture, Forestry and Water Economy, Serbia • Mr Tomaž Džuban, MOAN delegate. Ministry of Agriculture, Forestry and Food, Slovenia • Mr José Miguel González, MOAN delegate. Ministry of Agriculture, Food and Environment,
Spain • Ms Samia Maamer, MOAN Delegate. Ministry of Agriculture and Water Resources, Tunisia • Ms Elif Bayaraktar Öktem, MOAN Delegate. Ministry of Food, Agriculture and Livestock,
Turkey

FiBL & IFOAM – Organics International (2018): The World of Organic Agriculture. Frick and Bonn 267
Latin America and the Caribbean
Map 5: Organic agricultural land in the countries of Latin America and the Caribbean 2016 (in hectares)
Source: FiBL survey 2018, based on information from the private sector, certifiers, and governments. For detailed data sources see annex, page 330.

Latin America and the Caribbean › Overview
268 FiBL & IFOAM – Organics International (2018): The World of Organic Agriculture. Frick and Bonn
Latin America and the Caribbean
PATRICIA FLORES1
The region has the challenge of pursuing economic growth and development while securing wellbeing, democracy, and peace. The high inequity, which is demonstrated by the fact that seven out of the ten most inequitable countries are in Latin America, indicates that major efforts are needed to bring prosperity to a vast part of the population. These efforts should mainly target the rural population, most of whom make their living from agriculture and natural resources. Hence, the kind of growth the region needs has to do with inclusion, social equity, climate change dynamics and environmental needs.
Latin America has very prominent organic value chains in the international market, delivering tangible and growing benefits to thousands of smallholders. Some examples are organic panela and banana in north-western Peru, chocolate in Ecuador, quinoa in Bolivia, and coffee in Mexico.
Organic domestic markets have been growing steadily in the last decade. The biggest organic domestic market is in Brazil, where the National Program of School Meals, which has been a major achievement since 2009, stipulates that 30 percent of the public procurement budget should be used to buy from family farms with preference given to organic farmers. Nowadays, more than 40 million students in public schools are fed under this program, and it has resulted in a secure market for organic family farmers.
Climate change is causing severe climate events, which are becoming part of the news every year in climate vulnerable countries. Hurricane Maria (and Irma) is the worst natural disaster on record in Dominica, and caused catastrophic damage and a major humanitarian crisis in Puerto Rico. The La Niña floods in early 2017 on the Pacific coast of North and Central Peru also caused such significant damage that the Peruvian government is still struggling to restore parts of northern Peru.
In this challenging scenario, the potential of the organic sector and movement in Latin America and the Caribbean is linked to its strategy for sustainable development. Therefore, in order to reach the Sustainable Development Goals (SDG), the region definitely needs to embrace organic food systems to bring equity, prosperity and peace to the region.
Inter-American Commission for Organic Agriculture (CIAO)
The Inter-American Commission for Organic Agriculture (CIAO) was launched in 2008, embedded in the hemispheric outreach of the Inter-American Institute for 1 Patricia Flores Escudero, Latin America Coordinator of IFOAM – Organics International, Salta, Argentina
Latin America and the Caribbean › Overview
FiBL & IFOAM – Organics International (2018): The World of Organic Agriculture. Frick and Bonn 269
Cooperation on Agriculture (IICA). After nine years of meeting, discussing, developing ideas and implementing initiatives and programs, CIAO launched its new webpage and newsletter and also integrated authorities promoting organic agriculture. By doing so, CIAO is not only working together with control authorities but also with governmental staff in charge of fostering and strengthening the organic sector in each country.
CIAO works on issues in four strategic areas:
• Facilitating trade and market development of organic products (in which a lot of work is dedicated to harmonizing and developing equivalent organic regulations with the European Union, USA, Canada and Japan);
• Strengthening national control systems for organic production; • Fostering organic production; and • Information and knowledge management.
CIAO has 19 country members: Argentina, Bolivia, Brazil, Chile, Colombia, Costa Rica, Ecuador, El Salvador, United States of America, Honduras, Guatemala, Mexico, Nicaragua, Panama, Paraguay, Peru, Dominican Republic, Uruguay, and Venezuela. Spain and Canada are permanent observers. The elected Board is comprised of Ecuador (President), United States of America, Honduras, and the Dominican Republic.
Country reports
Mexico
Mexico has committed to remaining the seventh largest producer of organic food globally, and the fourth in the region, with at least 1.2 million hectares of organic land (including wild collection). With 210’000 organic producers, it also has the third most organic producers, after India and Uganda.
SAGARPA, the national authority for the organic sector, has also committed to continuing its effort to develop their domestic markets. They will allocate resources to promote and strengthen organic production and markets, as it is in Guadalajara, Oaxaca, Jalapa, Texcoco, and Guanajato among others. The social impact of the organic sector is huge as eight out of ten organic producers are indigenous people with less than one hectare of land.
Panama
The Ministry of Agricultural Development (Ministerio de Desarrrollo Agropecuario – MIDA), with the support of the Spanish Agency for International Development Cooperation (AECID), officially launched a public organic certification program in 2017. With this initiative, Panama is the first Latin-American country to have a public certification service for organic products. The Panama national organic authority (Autoridad de Control y Certificación de Productos Orgánicos - ACERT) will be in
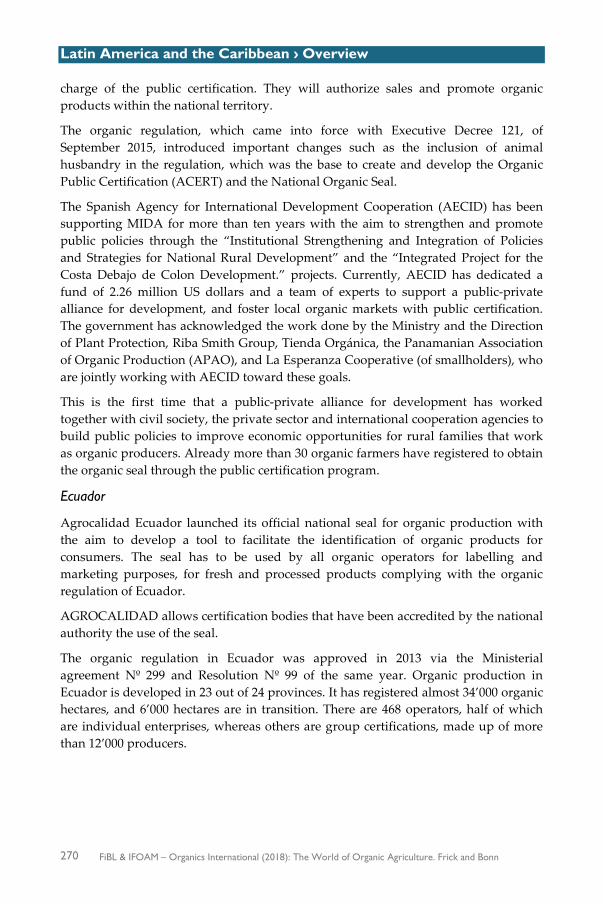
Latin America and the Caribbean › Overview
270 FiBL & IFOAM – Organics International (2018): The World of Organic Agriculture. Frick and Bonn
charge of the public certification. They will authorize sales and promote organic products within the national territory.
The organic regulation, which came into force with Executive Decree 121, of September 2015, introduced important changes such as the inclusion of animal husbandry in the regulation, which was the base to create and develop the Organic Public Certification (ACERT) and the National Organic Seal.
The Spanish Agency for International Development Cooperation (AECID) has been supporting MIDA for more than ten years with the aim to strengthen and promote public policies through the “Institutional Strengthening and Integration of Policies and Strategies for National Rural Development” and the “Integrated Project for the Costa Debajo de Colon Development.” projects. Currently, AECID has dedicated a fund of 2.26 million US dollars and a team of experts to support a public-private alliance for development, and foster local organic markets with public certification. The government has acknowledged the work done by the Ministry and the Direction of Plant Protection, Riba Smith Group, Tienda Orgánica, the Panamanian Association of Organic Production (APAO), and La Esperanza Cooperative (of smallholders), who are jointly working with AECID toward these goals.
This is the first time that a public-private alliance for development has worked together with civil society, the private sector and international cooperation agencies to build public policies to improve economic opportunities for rural families that work as organic producers. Already more than 30 organic farmers have registered to obtain the organic seal through the public certification program.
Ecuador
Agrocalidad Ecuador launched its official national seal for organic production with the aim to develop a tool to facilitate the identification of organic products for consumers. The seal has to be used by all organic operators for labelling and marketing purposes, for fresh and processed products complying with the organic regulation of Ecuador.
AGROCALIDAD allows certification bodies that have been accredited by the national authority the use of the seal.
The organic regulation in Ecuador was approved in 2013 via the Ministerial agreement Nº 299 and Resolution Nº 99 of the same year. Organic production in Ecuador is developed in 23 out of 24 provinces. It has registered almost 34’000 organic hectares, and 6’000 hectares are in transition. There are 468 operators, half of which are individual enterprises, whereas others are group certifications, made up of more than 12’000 producers.
Latin America and the Caribbean › Overview
FiBL & IFOAM – Organics International (2018): The World of Organic Agriculture. Frick and Bonn 271
Figure 95: Ecuador: Agrocalidad organic seal
Colombia
Colombia is a relevant country in the history of agroecology and organic production in the region. The organic movement is trying to reorganize with a national event gathering organic leaders and pioneers of the organic and biodynamic movement.
In 2017, the Colombian government implemented the program “Promotion for Sustainable Economic Development” (PRODES) with the German Development Organisation (GIZ). This program puts a strong focus on Participatory Guarantee Systems (PGS) with the aim to strengthen capacities to organize and implement PGS for organic domestic markets in Colombia. Furthermore, the programme includes a draft for discussion among stakeholder for policy development and a 40-hour course for interested stakeholders. Pilot areas were identified, and the program is running with high expectations from the organic sector.
Chile
In October 2017, the Republic of Chile and the European Union (EU) announced the completion of the necessary internal procedures related to the agreement on trade in organic products. The agreement entered into force on January 1, 2018.
According to the Chilean Ministry of Agriculture of Chile, the new rules are based on the mutual recognition, between the European Union and Chile, of the equivalence of their respective rules and control systems about organic production.
The agreement, which aims to encourage trade in organic products and thereby boost development in the organic sector in Chile and the European Union, also includes a system of co-operation, exchange of information and dispute settlement in organic trade.
With this agreement, organic food that is produced in the European Union and covered by the agreement can be marketed in Chile without further controls. The same will apply to a number of Chilean organic products in the European Union.
It will apply to EU organic products such as unprocessed plant products, live animals or unprocessed animal products (including honey), aquaculture products and seaweeds, processed agricultural products for use as food (including wine), processed agricultural products for use as feed, vegetative propagating material and seeds for cultivation.

Latin America and the Caribbean › Overview
272 FiBL & IFOAM – Organics International (2018): The World of Organic Agriculture. Frick and Bonn
On the other hand, the European Union will recognize the following products from Chile as equivalent: unprocessed plant products, honey, processed agricultural products for use as food (including wine), vegetative propagating material, and seeds for cultivation.
In relation to labelling, the agreement stipulates that products may bear the European Union’s organic logo, the Chilean organic logo, or both logos, as set out in the relevant laws and regulations, if they comply with the labelling requirements for the respective logo or for both logos.
The agreement with Chile is the first of the "new generation" of agreements in trade in organic products and the first bilateral recognition with a Latin American country. Chilean authorities are now working on a similar agreement with the US government.
Another major achievement of Chile in 2017 was the approval of a new national seal for organic products.
Figure 96: Chile: National organic seal
It will be compulsory to use the national organic seal for all products that are marketed or promoted as organic, ecological or biological. The seal was officially launched by the Chilean Ministry of Agriculture national authorities at Ecoferia La Reina, in Santiago de Chile, a fair organized by organic farmers. This fair has been running for ten years and gathers around 30 organic farmers. Chilean authorities are supportive of the organic sector development, offering capacity development programs and opportunities for agricultural products as well as for wild collection products. The latter products are significant and have to comply with environmental and organic regulations.
Regional meetings of the agroecological and organic movement
Bolivia: VII Latin-American and Caribbean Meeting of Organic and Ecological Agriculture (ELAEO) In May 2017, the VII Latin-American and Caribbean Meeting of Organic and Ecological Agriculture (ELEAO) took place in Rurrenabaque, Bolivia. Farmers, researchers, public sector representatives and organic movement organizations got together to discuss challenges and exchange information. This event was supported

Latin America and the Caribbean › Overview
FiBL & IFOAM – Organics International (2018): The World of Organic Agriculture. Frick and Bonn 273
and co-organized by the FAO’s Forest and Farm Facility (FFF)1 together with the national association of organic producers, AOPEB. It was also the venue for the IFOAM Latin America group to meet and renew its board of directors, resulting with Homero Blas of SOMEXPRO (Mexico) as the new elected president for the next three years (2017-2020).
Brazil: VI Latin-American Congress of Agroecology
The Latin-American Congress of Agroecology is an initiative of SOCLA (Latin-American Society of Agroecology). The congress took place in Brasilia and it was a huge event with multiple activities. IFOAM - Organics International was represented by its Executive Director, and potential partnerships were discussed to further develop agroecology in the region, with a global outreach.
Peru: First Latin-American meeting of biodynamic agriculture in the tropics (coffee, cacao, ginger) In July 2017, in Lima, Peru, 26 representatives of biodynamic projects from Mexico, Puerto Rico, Ecuador, Brazil and Peru gathered to exchange information and strengthen their capacities to further develop their biodynamic projects and initiatives in tropical and sub-tropical ecosystems. As a result, participants engaged in networking and information exchange.
Latin American Organic Leadership Course (OLC) in Brazil – IFOAM – Organics International Academy There were 200 applications for the second edition of the Latin American Organic Leadership Course (OLC), which started in September 2017 in the inspiring surroundings of the Gaia Foundation, in Porto Alegre2 (Rio Grando Do Sul). There, the legacy of Jose Lutzenberger is alive, and it was energized by the presence of 20 enthusiastic participants coming from different states of Brazil. This OLC edition was a unique experience as there were many highly qualified participants, such as professors and researchers from universities, extension services of governmental agencies, farmers and individual initiatives, embedded in a community approach. The course is scheduled to end in June 2018, on an organic farm in Campinas. The graduation ceremony will take place at BIOFACH Latin America in Sao Paulo.
Nutrition in Mountain Agroecosystems (NMA) – Peru
The project “Nutrition in Mountain Agroecosystems”, which is in its third year, managed to fulfil its objective of providing evidence of Nutrition Sensitive
1 The Forest and Farm Facility (FFF) is an initiative of the Food and Agriculture Organisation of the United Nations FAO. It provides support to forest and farm producer organizations (smallholders, rural women’s groups, local communities and indigenous peoples’ institutions) to increase their technical and business capacities so they can play their precious role in fighting against climate change and improving food security. More information is available at http://www.fao.org/partnerships/forest-farm-facility/en/. 2 The Gaia Foundation engages in environmental activities and was founded by the Brazilian Environmentalist José Lutzenberger. More information is available at http://www.fgaia.org.br.

Latin America and the Caribbean › Overview
274 FiBL & IFOAM – Organics International (2018): The World of Organic Agriculture. Frick and Bonn
Agriculture based on Agroecology by implementing micro interventions based on agroecology while monitoring the impact on the nutrition status of 450 rural families, using global indicators for healthy diversified and nutritious diets. The project also intends to strengthen a network of rural service providers (RSPs) and a virtual platform that unites and articulates RSPs for knowledge exchange and capacity development (www.maan.ifoam.bio). Five countries are involved: Peru (extending to neighbouring countries for 2018), Pakistan, Nepal, Kyrgyzstan, and Ethiopia. NMA is a project funded by the Swiss Development Cooperation (SDC) in cooperation with IFOAM - Organics International, HELVETAS Swiss Intercooperation (a development organisation based in Switzerland), and the Research Institute of Organic Agriculture (FiBL).

Latin America and the Caribbean › Statistics
FiBL & IFOAM – Organics International (2018): The World of Organic Agriculture. Frick and Bonn 275
Latin America and the Caribbean: Current statistics
JULIA LERNOUD,1 HELGA WILLER,2 AND BERNHARD SCHLATTER3
Overview In 2016, 7.1 million hectares were reported as being under organic production, which is 0.9 percent of the total agricultural land in Latin America and the Caribbean. Twelve percent of the world’s organic agricultural land is in Latin America and the Caribbean. Almost 400’000 hectares more were reported than in 2015, a significant increase for the region after six years of drops. This growth can be attributed to a major increase, mainly of grassland/grazing areas, in Uruguay (almost 350’000 hectares). However, other countries reported a big increase of organic agricultural land in 2016: In Mexico, the area increased by almost 90’000 hectares. Furthermore, the Dominican Republic showed a big growth with over 40’000 hectares. The organic area has increased by over 80 percent since 2000 (over 3.2 million hectares). The country with the largest organic agricultural area was Argentina with 3 million hectares (Figure 97), and the country with the largest number of producers is Mexico with more than 210’000 (Table 67). The highest proportion of the total agricultural area being organic was reached in the Falkland Islands (Malvinas) with 12.2 percent, closely followed by Uruguay with 11.5 percent.
Land use Land use details were available for more than 80 percent of the organic agricultural land. In 2016, only seven percent of all organic farmland was utilized for arable crops (almost 475’000 hectares); while almost 62 percent was grassland/grazing areas (4.4 million hectares). Permanent crops were grown in almost 993’000 hectares (14 percent of the organic area in the region), and for 17 percent of the reported area no details were available. Argentina (2.6 million hectares), Uruguay (almost 1.7 million hectares), and the Falkland Islands/Malvinas (almost 134’000 hectares) had the largest permanent grassland/grazing areas. The key organic arable crops are cereals, with almost 164’000 hectares, representing 34 percent of the organic arable area of Latin America and Caribbean, and 0.3 percent of the total cereal area in the region. Most of the cereals were grown in Bolivia (87’000 hectares, mainly quinoa and amaranth), Mexico (40’000 hectares, mainly wheat and grain maize) and Argentina (almost 26’000 hectares, mainly wheat). The key organic cereal in the region was quinoa (almost 87’000 hectares) representing more than 53 percent of all the quinoa grown in the region. Organic sugarcane was grown on almost 70’000 hectares in 2016, 0.5 percent of the total sugarcane in the region, with 1 Julia Lernoud, Research Institute of Organic Agriculture (FiBL), Frick, Switzerland, www.fibl.org 2 Helga Willer, Research Institute of Organic Agriculture (FiBL), Frick, Switzerland, www.fibl.org 3 Bernhard Schlatter, Research Institute of Organic Agriculture (FiBL), Frick, Switzerland, www.fibl.org

Latin America and the Caribbean › Statistics
276 FiBL & IFOAM – Organics International (2018): The World of Organic Agriculture. Frick and Bonn
the key producing countries being Paraguay (over 48’000 hectares) and Argentina (almost 13’000 hectares). The main organic permanent crops were coffee (almost 424’000 hectares), cocoa (almost 230’000 hectares), and tropical and subtropical fruits (almost 190’000 hectares). Organic coffee represented 8 percent of the total coffee area in the region and 45 percent of the world’s organic coffee. The countries with the largest organic coffee areas were Mexico (231’000 hectares), Peru (110’000 hectares), and Honduras (23’500 hectares). Furthermore, 12.5 percent of the cocoa area in Latin America is organic. Almost 70 percent of the world’s organic cocoa area and some of the countries with the largest organic cocoa areas are in Latin America. The Dominican Republic is by far the country with the largest area, with 159’000 hectares, followed by Peru (more than 25’600 hectares), and Panama (14’000 hectares). Organic bananas and avocados are the key tropical fruits grown in the region (over 51’000 hectares each), 2.4 percent of the regional banana area and avocados represent 14.3 percent of the total avocados area in the region. The countries with the largest organic banana area are the Dominican Republic (almost 22’000 hectares) and Ecuador (17’000 hectares); these two countries represent almost 76 percent of the regional organic banana area.
Producers
Almost 460’000 organic producers were recorded in Latin America and the Caribbean, in 2016. The countries with the most organic producers are Mexico (210’000), Peru (almost 92’000), and Paraguay (over 58’000). It can be assumed that the number of producers is higher because some countries only report the number of farm enterprises/companies.
Wild collection In Latin America and the Caribbean, organic wild collection plays an important role. There are almost 4.2 million hectares of organic wild collection areas. They are mainly used for the collection of fruits (1.2 million hectares) and nuts (almost 1.1 million hectares), palmito (almost 148’000 hectares), and rose hips (almost 71’000 hectares). Beekeeping areas represent almost 10 percent of the region’s organic wild collection area, almost 420’000 hectares. The countries with the largest organic wild collection areas are Mexico (almost 1.3 million hectares), Brazil (1.2 million hectares, data 2011), Bolivia (0.9 million hectares, 2014), and Argentina (0.4 million hectares). Information on wild collection is not available for many countries, so it can be assumed that the total organic wild collection area is higher than that presented here. For more information about the Latin American and the Caribbean figures, see data tables for the region, page 279.

Latin America and Caribbean › Statistics › Graphs
FiBL & IFOAM – Organics International (2018): The World of Organic Agriculture. Frick and Bonn 277
Organic Agriculture in Latin America and Caribbean: Graphs
Figure 97: Latin America and Caribbean: The ten countries with the largest areas of organic agricultural land 2016
Source: FiBL survey 2018, based on information from the private sector, certifiers, and governments. For detailed data sources see annex, page 330
Figure 98: Latin America and Caribbean: The ten countries with the highest organic share of total agricultural land 2016
Source: FiBL survey 2018, based on information from the private sector, certifiers, and governments. For detailed data sources see annex, page 330
39'824
64'097
114'306
135'596
205'258
323'578
673'968
750'000
1'656'952
3'011'794
0 1'000'000 2'000'000 3'000'000 4'000'000
Ecuador
Paraguay
Bolivia (2014)
Falkland Islands (Malvinas)
Dominican Republic
Peru
Mexico
Brazil (2014)
Uruguay
Argentina
Hectares
Latin America and Caribbean: The ten countries with the largest organic area 2016Source: FiBL survey 2018
0.9%
0.9%
1.0%
1.1%
1.3%
2.0%
8.7%
10.0%
11.5%
12.2%
0% 5% 10% 15%
Honduras
Martinique (France)
Dominica (2011)
Grenada (2010)
Peru
Argentina
Dominican Republic
French Guiana (France)
Uruguay
Falkland Islands (Malvinas)
Share of total agricultural land
Latin America and Caribbean: The countries with the highest organic share of total agricultural land 2016Source: FiBL survey 2018

Latin America and Caribbean › Statistics › Graphs
278 FiBL & IFOAM – Organics International (2018): The World of Organic Agriculture. Frick and Bonn
Figure 99: Latin America and Caribbean: Development of organic agricultural land 2000-2016
Source: FiBL-IFOAM-SOEL surveys 2000-2018
Figure 100: Latin America and Caribbean: Use of agricultural organic land 2016
Source: FiBL survey 2018, based on information from the private sector, certifiers, and governments. For detailed data sources see annex, page 330
3.914.54
5.75 5.965.22 5.06 4.95
5.59
7.247.66 7.54
6.97 6.95 6.81 6.83 6.747.14
0.0
2.5
5.0
7.5
10.0
2000
2001
2002
2003
2004
2005
2006
2007
2008
2009
2010
2011
2012
2013
2014
2015
2016
Mill
ion
hect
ares
Latin America and Caribbean: Development of organic agricultural land 2000 to 2016Source: FiBL-IFOAM-SOEL-Surveys 2002-2018

Latin America and Caribbean › Statistics › Tables
FiBL & IFOAM – Organics International (2018): The World of Organic Agriculture. Frick and Bonn 279
Organic Agriculture in Latin America and Caribbean: Tables
Table 67: Latin America: Organic agricultural land, organic share of total agricultural land, and number of producers 2016
For information on data year, see page 326.
Country Area [ha] Organic share [%] Producers [no.] Argentina 3’011’794 2.0% 1’148 Bahamas 49 0.3%
Belize 380 0.2% 820 Bolivia 114’306 0.3% 12’114 Brazil 750’000 0.3% 10’336 Chile 15’838 0.1% 446 Colombia 31’621 0.1% 4’775 Costa Rica 7’908 0.4% 3’000 Cuba 1’282 0.02% 508 Dominica 240 1.0%
Dominican Republic 205’258 8.7% 29’311 Ecuador 39’824 0.7% 12’483 El Salvador 1’426 0.1% 2’000 Falkland Islands (Malvinas) 135’596 12.2% 5 French Guiana (France) 3’051 10.0% 62 Grenada 85 1.1% 3 Guadeloupe (France) 168 0.3% 37 Guatemala 13’380 0.4% 3’008 Guyana Wild collection Haiti 6’112 0.3% 1’210 Honduras 28’689 0.9% 5’686 Jamaica 374 0.1% 127 Martinique (France) 297 0.9% 50 Mexico 673’968 0.6% 210’000 Nicaragua 33’621 0.7% 10’060 Panama 15’183 0.7% 1’300 Paraguay 64’097 0.3% 58’258 Peru 323’578 1.3% 91’771 Puerto Rico 14 0.01% 5 Suriname 39 0.04%
US Virgin Islands 26 0.7%
Uruguay 1’656’952 11.5% 6 Total 7’135’155 0.9% 458’532
Source: FiBL survey 2018, based on information from the private sector, certifiers, and governments. For detailed data sources see annex, page 330 *Total number includes data for countries with less than three operators.

Latin America and Caribbean › Statistics › Tables
280 FiBL & IFOAM – Organics International (2018): The World of Organic Agriculture. Frick and Bonn
Table 68: Latin America: All organic areas 2016
Country Agriculture [ha]
Aquaculture [ha]
Other non agri. land
[ha]
Wild collection
[ha]
Total [ha]
Argentina 3’011’794
11’930 319’370 3’343’094 Bahamas 49
49
Belize 380
380 Bolivia 114’306
922’991 1’037’297
Brazil 750’000
1’213’351 1’963’351 Chile 15’838
116’137 131’975
Colombia 31’621
7’320 38’941 Costa Rica 7’908 664
8’571
Cuba 1’282
1’282 Dominica 240
240
Dominican Republic 205’258
205’258 Ecuador 39’824 3’123
1’260 44’207
El Salvador 1’426
1’426 Falkland Islands (Malvinas) 135’596
135’596
French Guiana (France) 3’051
3’051 Grenada 85
85
Guadeloupe (France) 168
168 Guatemala 13’380
5 13’385
Guyana
58’000 58’000 Haiti 6’112
6’112
Honduras 28’689
28’689 Jamaica 374
36 410
Martinique (France) 297
297 Mexico 673’968
1’292’306 1’966’274
Nicaragua 33’621
11’463 45’084 Panama 15’183
15’183
Paraguay 64’097
3’067 67’164 Peru 323’578 4
249’413 572’995
Puerto Rico 14
14 Suriname 39
39
US Virgin Islands 26
26 Uruguay 1’656’952 1’656’952 Total 7’135’155 3’791 11’930 4’194’720 11’345’597
Source: FiBL survey 2018, based on information from the private sector, certifiers, and governments. For detailed data sources see annex, page 330
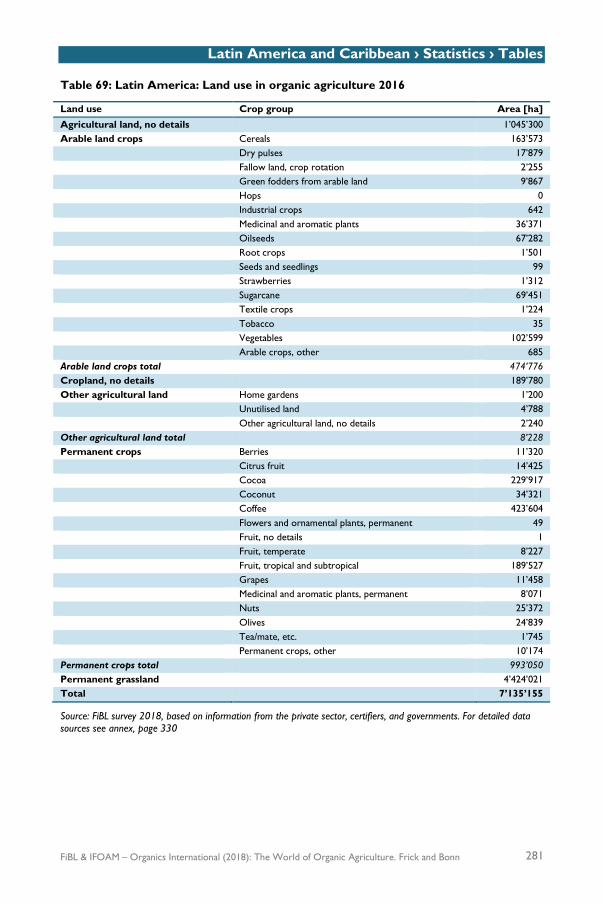
Latin America and Caribbean › Statistics › Tables
FiBL & IFOAM – Organics International (2018): The World of Organic Agriculture. Frick and Bonn 281
Table 69: Latin America: Land use in organic agriculture 2016
Land use Crop group Area [ha] Agricultural land, no details
1’045’300
Arable land crops Cereals 163’573
Dry pulses 17’879
Fallow land, crop rotation 2’255
Green fodders from arable land 9’867
Hops 0
Industrial crops 642
Medicinal and aromatic plants 36’371
Oilseeds 67’282
Root crops 1’501
Seeds and seedlings 99
Strawberries 1’312
Sugarcane 69’451
Textile crops 1’224
Tobacco 35
Vegetables 102’599
Arable crops, other 685
Arable land crops total
474’776 Cropland, no details 189’780 Other agricultural land Home gardens 1’200
Unutilised land 4’788
Other agricultural land, no details 2’240
Other agricultural land total
8’228 Permanent crops Berries 11’320
Citrus fruit 14’425
Cocoa 229’917
Coconut 34’321
Coffee 423’604
Flowers and ornamental plants, permanent 49
Fruit, no details 1
Fruit, temperate 8’227
Fruit, tropical and subtropical 189’527
Grapes 11’458
Medicinal and aromatic plants, permanent 8’071
Nuts 25’372
Olives 24’839
Tea/mate, etc. 1’745
Permanent crops, other 10’174
Permanent crops total 993’050 Permanent grassland 4’424’021 Total 7’135’155
Source: FiBL survey 2018, based on information from the private sector, certifiers, and governments. For detailed data sources see annex, page 330

Latin America and Caribbean › Statistics › Tables
282 FiBL & IFOAM – Organics International (2018): The World of Organic Agriculture. Frick and Bonn
Table 70: Latin America: Use of wild collection areas 2016
Land use Area [ha] Apiculture 419’837 Berries, wild 36’243 Fruit, wild 1’200’000 Mushrooms, wild 2’862 Nuts, wild 1’090’834 Palmito, wild 147’867 Rose hips, wild 70’799 Seaweed 500 Wild collection, no details 1’225’778 Total 4’194’720
Source: FiBL survey 2018, based on information from the private sector, certifiers, and governments. For detailed data sources see annex, page 330

FiBL & IFOAM – Organics International (2018): The World of Organic Agriculture. Frick and Bonn 283
North America
Map 6: Organic agricultural land in Canada and the United States 2016 (in hectares)
Source: Canada Organic Trade Association (COTA) and United States Department of Agriculture (USDA). For detailed data sources see annex, page 330.

North America › United States
284 FiBL & IFOAM – Organics International (2018): The World of Organic Agriculture. Frick and Bonn
U.S. organic sales set new records
BARBARA FITCH HAUMANN1
The U.S. organic sector continues its upward trajectory, gaining new market share and shattering records, as consumers across the United States ate and used more organic products than ever before. Organic sales in the U.S. totalled approximately 47 billion US dollars2 in 2016, reflecting new sales of almost 3.7 billion US dollars from the previous year. The 43 billion US dollars in organic food sales in 2016 marked the first time the American organic food market had broken through the 40-billion US dollar mark. Organic food now accounts for 5.3 percent of total food sales in the United States, another significant first. Organic food sales increased by 8.4 percent, or 3.3 billion US dollars, from the previous year, blowing past the stagnant 0.6 percent growth rate in the overall food market. Sales of organic non-food products were up 8.8 percent in 2016, also surpassing the overall non-food growth rate of 0.8 percent. The survey also showed that organic is creating jobs. More than 60 percent of all organic businesses with more than five employees reported an increase of full-time employment during 2016 and said they planned to continue boosting their full-time staff in 2017. The organic fruits and vegetables sector (15.6 billion US dollars) held on to its position as the largest of the organic food categories, accounting for almost 40 percent of all organic food sales. Posting an 8.4 percent growth rate, almost triple the 3.3 percent growth pace of total fruit and vegetable sales, organic fruits and vegetables now make up almost 15 percent of the produce that Americans eat.
Consumer trends
Consumers in recent years have sought clean products abundant in protein, and sales of organic meat and poultry shot up by more than 17 percent in 2016 to 991 million US dollars, for the category’s biggest-ever yearly gain. Continued strong growth in that category was expected to push sales across the 1-billion US dollar mark for the first time in 2017. Survey results also showed that today’s consumers are not just eating more organic, they’re also using more organic products in their wardrobes, bedrooms, bathrooms and throughout their homes. Sales of non-food organic products increased by almost 9 percent to 3.9 billion US dollars. Organic fiber, supplements and personal care
1 Barbara Fitch Haumann is Senior Writer/Editor for the Organic Trade Association, 28 Vernon St. Suite 413, Brattleboro, VT 05301, United States, www.ota.com 2 The European Central Bank reference exchange rate U.S. dollar/Euro was 1.1069 in 2016.

North America › United States
FiBL & IFOAM – Organics International (2018): The World of Organic Agriculture. Frick and Bonn 285
products accounted for the bulk of those sales. Adequate supplies of organic textiles are a continuing challenge in the organic fiber market. However, U.S. organic cotton farmers produced a record 17’000-plus bales in 2016, which should help alleviate some supply concerns. A new and expanded survey on the organic attitude of U.S. families released in September 2017 showed that Millennials are big buyers of organic and that becoming a parent will only deepen the strong affinity for organic shared by this powerful generation. This survey showed that the frequent buyer of organic is driven by a strong belief that selecting organic for their family makes them a better parent. That buyer is actively seeking out healthy, nutritious choices for themselves and their children. Concerns about the effects of pesticides, hormones and antibiotics on an individual’s health and the health of that individual’s children, along with the desire to avoid highly processed foods and artificial ingredients for the family were top reasons given for buying organic.
Production growth
U.S. farm-gate sales of organic agricultural production continued to increase in 2016, with U.S. farms producing and selling 7.6 billion US dollars in certified organic commodities, according to the farmer-based 2016 Certified Organic Survey conducted by the U.S. Department of Agriculture’s National Agricultural Statistics Service (NASS) released in September 2017. This showed that 2016 farm-gate sales were up 23 percent from 6.5 billion US dollars reported for 2015. During the same time, according to this survey, certified organic farms grew 11 percent to 14’217, with acreage increasing 15 percent to reach 5 million acres.1 It is important to note that these numbers, self-reported by farmers responding to the survey, are lower than the numbers released in December 2016 by NASS in a certified-based survey that tallied 14’861 U.S. organic farms in operation in 2015, with 5.3 million acres farmed organically. Certified organic farm acres currently comprise about 0.54 percent2 of total farm acres in the United States. To capture the bigger picture, a look at the United States Department of Agriculture (USDA) Agricultural Marketing Service’s online Organic Integrity Database in mid-December showed 25’615 certified organic operations—farms, handling and processing facilities—in the United States, and 39’509 operations recognized by the National Organic Program (NOP) worldwide.
Integrity of imports
The discovery of fraudulent grain imports from Turkey that violated federal organic regulations prompted the revocation of the organic certification for a major Turkish
1 1 acre is 0.404686 hectares; 5 million acres is approx. 2 million hectares. 2 5.3 million acres correspond to 2.14 million hectares.

North America › United States
286 FiBL & IFOAM – Organics International (2018): The World of Organic Agriculture. Frick and Bonn
grain exporter and brought a wider call for changes to improve import verification of organic products going forward. As a result, the Organic Trade Association convened a member task force, the Global Organic Supply Chain Integrity Task Force, to develop a best practices guide to use in managing and verifying global organic supply chain integrity to help brands and traders manage and mitigate the risk and occurrence of organic fraud. In addition, the organic sector worked with U.S. Representatives John Faso of New York and Michelle Lujan Grisham of New Mexico who introduced the Organic Farmer and Consumer Protection Act. This bill, if enacted by Congress, would make significant strides to improve the oversight of global organic trade, and establish a better system to ensure the integrity of organic.
Animal welfare
Another critical topic has been animal welfare standards, under development for over a decade. In defence of the integrity of the USDA organic seal and organic standards, the Organic Trade Association in September filed suit against the U.S. Department of Agriculture after the agency repeatedly delayed implementation of its final rule published in January on animal welfare standards for organic livestock and poultry. The lawsuit alleges USDA violated the Organic Foods Production Act, and unlawfully delayed the effective date of the final livestock standards developed by industry in accordance with the processes established by Congress. Also supporting the suit are groups harmed by this protracted government inaction, including organizations representing organic livestock farmers, organic certification agencies, and organic retailers and consumers. In November, USDA further delayed the final rule until May 14, 2018. Reiterating its stance, the Organic Trade Association in December filed an amended complaint and strengthened its call for the final animal welfare rule to move forward without further delay. However, USDA in mid-December published a proposed rule announcing its intentions to withdraw the final rule, and said it would take public comments until January 17, 2018, on this plan. Expressing dismay, the Organic Trade Association vowed to rally against this move, and to continue with the course of its lawsuit.
Advocating for organic
Meanwhile, Farm Bill advocacy has been a major thrust during the past year, and will continue to take center stage during 2018. The Farm Bill, updated approximately every five years, is federal legislation approved by Congress that sets and authorizes farm and nutrition programs and policy. More than 500 organic stakeholders across 45 states weighed in on issues they see as critical to the organic sector as part of a comprehensive farm bill survey conducted by the Organic Trade Association in the lead up to Congress beginning their debate on the 2018 Farm Bill. The trade association collaborated with members of its Farmers Advisory Council and other organic organizations to poll stakeholders directly on

North America › United States
FiBL & IFOAM – Organics International (2018): The World of Organic Agriculture. Frick and Bonn 287
issues. Survey respondents answered questions concerning barriers they face in their organic operations—from regulatory, research, and marketing, to production and investment barriers. They also evaluated the effectiveness of existing programs geared towards the organic sector. The findings have helped shape a well-vetted farm bill platform for organic. During 2017, the organic sector actively engaged with members of Congress and their staff to advocate for organic provisions. Events have included organized visits to D.C. by organic company CEOs, the annual Hill Visits Day activities in May organized by the Organic Trade Association, and a farmer fly-in to Washington in October organized by the trade association’s Farmers Advisory Council. Moreover, organic leaders have worked with legislators to create three bipartisan bills for consideration in deliberating the final farm bill provisions. The first is the Organic Farmer and Consumer Protection Act (mentioned above under Integrity of imports) to improve oversight over global organic trade. The second is the Organic Research Act of 2017 to increase annual funding for USDA’s Organic Agriculture Research and Extension Initiative from its current 20 million to 50 million US dollars a year. The third is the Organic Farmers Access Act, designed to expand organic agriculture’s access to, and eligibility for, rural development programs.
Rallying check-off support
In other issues, the U.S. Department of Agriculture sought public comments in January after publishing the GRO Organic Check-off proposal for a nationwide research and promotion check-off program for organic. The industry proposal, spearheaded by the Organic Trade Association, estimates the program would raise over 30 million US dollars a year to spend on research to make farmers more successful, technical services to accelerate the adoption of organic practices, and consumer education and promotion of the organic brand. The Organic Trade Association (OTA) submitted comments and named 1’358 public endorsers including over 1’230 certified organic operators. Joining these organic farmers, ranchers and business stakeholders were over 11’000 supporters who commented directly on the proposal. The trade association is now awaiting the publication of USDA’s final proposal, to be followed by a vote on the proposed program by the organic sector.
Advocating for organic research
In early March, the Organic Trade Association submitted comments to USDA’s Office of the Chief Scientist on the importance of organic in the long-term health and viability of U.S. agriculture over the next 50 years. OTA underscored that a vibrant organic industry is integral to the longevity of the U.S. agricultural systems, and cited organic as the almost 50 billion dollar-a-year bright spot in the economy that is experiencing double-digit growth, creating jobs, and for which consumer demand continues to outpace supply. OTA offered support for separate comments provided by The Organic Center underscoring that organic is an integral part of the solution for

North America › United States
288 FiBL & IFOAM – Organics International (2018): The World of Organic Agriculture. Frick and Bonn
agricultural sustainability by supporting soil health, mitigating climate change, upholding pollinator health, and contributing to a successful economy. In October, more than 60 agriculture groups and research universities asked Congress to double the funding for agriculture research in the next farm bill. The letter sent to the House of Representatives and Senate Agriculture Committees represents a consensus formed by the organizations and includes support for 50 million US dollars per year in funding for the Organic Agriculture Research and Extension Initiative. Meanwhile, the U.S. Federal Reserve Board of Governors and U.S. Department of Agriculture published a new report, Harvesting Opportunity: The Power of Regional Food System Investments to Transform Communities, recognizing organic as having significant and long-lasting economic benefits to local communities.
International trade
During 2017, the Organic Trade Association spearheaded and co-authored a second study updating international trade data for U.S. organic exports and imports for 2011 through 2016. Assisting with this study were researchers from Ohio State University and Penn State University. The U.S. remains the largest organic market in the world. Exports of U.S. grown organic produce still account for the bulk of American organic exports, and continue to gain markets around the world. In other international news, the Organic Trade Association co-hosted the Inter-American Commission on Organic Agriculture Annual meeting in Portland Oregon. The meeting gathered organic program heads from 13 different Latin American governments to exchange ideas and strengthen collaborations for organic throughout the region.
References Organic Trade Association, 2017 Organic Industry Survey, 2017 Organic Trade Association, U.S. Families’ Organic Attitudes and Behaviors, September 2017 U.S. Department of Agriculture’s National Agricultural Statistics Service (NASS), 2016 Certified Organic
Survey, September 2017. See www.nass.usda.gov/organics. U.S. Department of Agriculture’s National Agricultural Statistics Service (NASS), 2014 and 2015 Certified
Organic Surveys, December 2016. See www.nass.usda.gov/organics. U.S. Department of Agriculture’s Agricultural Marketing Service, Organic Integrity Database. Available at
https://organic.ams.usda.gov/integrity U.S. Federal Reserve Board of Governors and U.S. Department of Agriculture, Harvesting Opportunity: The
Power of Regional Food System Investments to Transform Communities, 2017.

North America › Canada
FiBL & IFOAM – Organics International (2018): The World of Organic Agriculture. Frick and Bonn 289
Canada
TIA LOFTSGARD1 AND JILL GUERRA2
Canada’s organic sector continues its steady spread across Canada’s farmland and onto Canadians’ plates. There are over 5’000 organic operations nationally offering more organic ingredients, products and services than ever before. Canada’s organic market is maturing, valued at an estimated 5.4 billion Canadian dollars in 2017, up from 4.7 billion Canadian dollars in 2015. As the market matures, organics continue to capture a greater market share in the food and beverage market. Reflecting Canadians’ increased appetite for organic products, two-thirds of Canadian organic shoppers now purchase organic items weekly. There are many reasons to celebrate the achievements of organics, yet new regulatory and trade challenges have surfaced amidst this success. The need for continuous dialogue with government and regulators is required to ensure that organic can stay competitive.
Data collection
Canada’s organic sector continues to rely on the voluntary disclosure of operator and acreage data by organic certifiers and Conformity Verification Bodies (CVBs) as the government does not collect this data. Data consistency and harmonization are the main challenges encountered in the annual collection of data about organic operators and acreage. In 2016, there was almost universal participation from certification bodies, resulting in the best estimate of operations and acreage in Canada. Some certification bodies did not provide up to date data, and thus 2015 datasets were used. Furthermore, the ability to extricate transitional and certified acreage was not possible for all datasets. These data gaps and inconsistencies will continue to be a risk to the organic sector until a national data system is prioritized and implemented by the government. Statistics Canada, after substantial lobbying efforts by the Canada Organic Trade Association (COTA), started collecting organic export values and volumes at the border for the first time in its history, providing additional insights into target markets for a handful of products. Commencing in January 2017, 17 new Harmonized System (HS) codes were created, mostly for primary commodities. These complement the 65 organic import codes that already existed, providing additional trade flow insights on organic sales occurring inside and outside of the country. Lack of data is a major limitation for the organic industry in Canada. As such, it was high on the list of recommendations outlined in the “Next Agricultural Policy Framework”, a position 1 Tia Loftsgard, Executive Director, Canada Organic Trade Association (COTA), Ottawa, Canada, www.ota.com/canada-ota 2 Jill Guerra, Data and Special Project Coordinator, Canada Organic Trade Association (COTA), Ottawa, Canada. www.ota.com/canada-ota

North America › Canada
290 FiBL & IFOAM – Organics International (2018): The World of Organic Agriculture. Frick and Bonn
paper submitted by COTA, USC Canada,1 the Canadian Organic Growers (COG) and the Organic Federation of Canada (OFC) to influence the priorities of the next agricultural budget, which is set to start April 1, 2018.
Expansion of organic operations and acreage
According to the 2016 Census of Agriculture, 2.2 percent of farms in Canada are now certified organic or in-transition, up from 2.0 percent in 2011. This development highlights the trend of declining number of farms in general alongside the steady increase of organic farms each year. Between 2011 and 2016, the number of farms across Canada declined by 5.9 percent, while the number of organic farms increased by 4.1 percent. A new generation of farmers is driving the expansion of organic production. Organic farmers tend to be younger. The average age of farm operators is 55. Only 9.1 percent of farm operators are under 35 for farms in general; this percentage rises to 14.6 percent for farm operators on organic farms (Canadian Census of Agriculture, 2016). Organic farmers also tend to be more highly educated and come from non-farming backgrounds. These demographic shifts will continue to drive the growth of organics in Canada. Canadian farmers are increasingly adopting organic practices. Organic acreage has increased from 988’000 to 1.1 million hectares between 2015 and 2016. Data shows fairly consistent growth in organic acreage across the country, with some localized jumps due to the introduction or re-introduction of large areas for cattle grazing. The majority of organic acreage is pasture and forage areas, followed by field crops. Inconsistencies in data format and the lack of data provided resulted in data gaps. One of the largest data gaps relates to transitional acreage, which could not be extricated from certified acreage in all cases. The organic manufacturing sector is also growing steadily. Processors are concentrated in Quebec, Ontario and British Columbia. Preliminary estimates reveal an increase of 200 processors over the 2016 number of 1’739 processors. Investment in innovation for processing raw organic ingredients (e.g., seed cleaning, abattoirs) and manufacturing processed finished goods is necessary to reduce cost and accessibility barriers for organic processing. Reliable access to abattoirs is a key limiting factor for the organic meat and poultry sectors. A full report investigating the limitations and opportunities for processors is presently being written, and will be available in the future to address this knowledge gap. The number of producers, processors and acreage is expanding across the country. However, domestic production still falls short of meeting consumer demand for products that could be grown or processed in Canada. For this reason, the industry is 1 USC Canada works with family farmers and seed savers in twelve countries around the world, including Canada. It supports seed savers who preserve local seeds and breed new ones, better adapted to their changing needs. Furthermore, it bolsters community initiatives that revive rural economies and empower women, youth and indigenous farmers. More information is available at www.usc-canada.org.

North America › Canada
FiBL & IFOAM – Organics International (2018): The World of Organic Agriculture. Frick and Bonn 291
recommending that the government support transition support programs to encourage more farmers to adopt organic practices. The Canadian Organic Growers (COG) launched a new federally-funded research project to identify the risks involved with transitioning from non-organic to organic production and outline key recommendations to mitigate these risks.
Research and innovation
The Organic Agriculture Centre of Canada manages the Federal Government’s Organic Science Cluster (OSC), a funding stream dedicated to scientific research on organics in Canada. The first two OSC cycles have funded projects related to animal welfare, innovative processing solutions, sustainable pest management strategies and optimizing productivity. The third funding cycle will be confirmed in 2018, determining the direction of organic research in Canada and the types of projects that will qualify.
Market growth and trends
Consumers increasingly reaching for organics
Consumers across regions, income levels, educational attainment and gender are choosing organics. Recent consumer research from the Canada Organic Trade Association shows that two-thirds of Canadian grocery shoppers are purchasing organic products weekly. Millennials are becoming a strong advocate for organics – they purchase more organic products and are much more likely than older generations to connect organics to both health and environmental benefits. The younger generation is poised to continue supporting the growth in organics across Canada’s farmlands and on the country’s plates.
COTA’s consumer research has showcased a steady increase in both trust in, and familiarity of, the Canada Organic logo (Figure 101). Nearly half of Canadians consider the Canada Organic claim to be trustworthy, up nine percentage points from 2016. Forty-one percent of Canadians report they are very familiar or somewhat familiar with the logo. As the Canadian organic logo was first launched in 2009, when the national regulation came into force, these findings indicate a positive future for Canadian organics.
Figure 101: Canada organic logo

North America › Canada
292 FiBL & IFOAM – Organics International (2018): The World of Organic Agriculture. Frick and Bonn
Domestic market
COTA’s Organic Market Report 2017 shows continued growth of the organic sector in Canada. The total market – including food and non-food items - is estimated at 5.4 billion Canadian dollars, with organic food and beverages alone valued at 4.4 billion Canadian dollars. As the market has matured, organics continue to capture a greater market share despite the growth rates not being as grand as in the early years. Between 2012 and 2017, the market share of organic food and beverages through mainstream retailers has grown from 1.7 percent to 2.6 percent. Mainstream retailers are the primary market channel for food and beverage purchasing by consumers nationwide. With the expansion of these retailers into the organic sector, organic products have become more available and more affordable. Other channels that were the birthplace of the organic food industry, such as natural health stores and farmer’s markets, continue to grow, but due to the faster growth among mainstream retailers, their market share is decreasing.
Canada organics on the global stage
According to the 65 Harmonized System (HS) import codes, Canadian organic imports were valued at 637 million Canadian dollars in 2016. Unroasted coffee, bananas and olive oil are Canada’s top imports by value. Green and red lentils and red spring wheat are the highest valued exports. In January 2017, the first organic HS export codes were introduced. These export codes include 17 organic ingredients and products. Based on data for January-May 2017, organic exports are expected to reach an estimated 607 million Canadian dollars by the end of 2017. Although the HS codes only provide a snapshot of organic trade in Canada, the figures indicate that Canada is a net-importer of organic products.
Figure 102: Canada: Tracked certified organic imports by volume and value, 2009-2016
Source: Statistics Canada and CATSNET Analytics, 2017
196.
5
183.
9
180.
5
185.
4
199.
6
195.
6
199.
8
202.
0
0
100
200
300
400
500
600
700
0
50
100
150
200
250
2009 2010 2011 2012 2013 2014 2015 2016
Impo
rt v
alue
in C
AD
Impo
rt v
olum
e in
MT
Canada: Tracked certified organic imports by volume and value, 2009-2016Source: Statistics Canada and CATSNET Analytics, 2017
Volume [MT] Value [CAD]

North America › Canada
FiBL & IFOAM – Organics International (2018): The World of Organic Agriculture. Frick and Bonn 293
Canada currently has organic equivalency arrangements with the United States, European Union (EU), Switzerland, Costa Rica and Japan. Trade between these regions and Canada account for over half of Canada’s organic imports and a little over a third of exports. Not surprisingly, the vast majority is traded between Canada and the United States. Discussions regarding equivalency arrangements with Mexico and South Korea are currently underway. The Canadian Government is in the midst of discussions with the United States, Canada’s largest trading partner, regarding the North American Free Trade Agreement (NAFTA), which affects trade between Canada, Mexico and the United States. This agreement has significantly increased trading between the United States and Canada – including trade of organic products. There are mixed reports emerging from the ongoing negotiation rounds, but on the whole, the discussions have not yet resulted in a final agreement. Given the impact a no-NAFTA landscape will have on organic trade, the outcome of these negotiations will be an important issue for the organic industry, alongside all other industries, to ensure that Canada does not lose this significant market. Canadian organic producers will now be able to take advantage of opportunities in the Canada–EU Comprehensive Economic and Trade Agreement (CETA). CETA’s date for provisional application was September 21, 2017. Under CETA, approximately 95 percent of the EU’s agricultural, fish and seafood imports will be duty-free. The government estimates indicate that CETA will increase Canada’s annual agri-food exports by up to 1.5 billion Canadian dollars.
Challenges ahead
Safe Food for Canadians
In January 2017, Gazette I of the Safe Food for Canadians Regulation (SFCR) was published, announcing a 90-day comment window in which the industry could review and comment. This new regulation added Chapter 14 on organic products, which created sweeping changes to the implementation of organic agriculture policies in Canada. Certification would have been required for any operators involved in conveying and storage. Other areas were vague and would have resulted in challenges in the audit process. Many organic associations rallied their stakeholders to write formal comments opposing these changes, resulting in over 50 percent of the comments submitted to the Canadian Food Inspection Agency (CFIA) in the overall public consultation. As Gazette II is set to be published and bring the Act into force in the spring of 2018, stakeholders in Canada are waiting for the final published Chapter 14 of the SFCR before knowing whether industries concerns were adequately heard.
Restructuring of the Canadian Organic Office within Canadian Food Inspection Agency
In the same period that the Safe Food for Canadians Regulation (SFCR) was published, the Canadian organic industry discovered that the Canadian Organic Office had been removed from the organizational chart of Canadian Food Inspection Agency (CFIA) and that a major restructuring of CFIA was occurring. This disruption

North America › Canada
294 FiBL & IFOAM – Organics International (2018): The World of Organic Agriculture. Frick and Bonn
to the industry was a significant challenge for several months as the industry tried to get answers out of the CFIA about why they would eliminate the Canadian Organic Office and to understand who was now in charge of organics in Canada. After significant lobby efforts, which are ongoing, the government of Canada revealed in December 2017 that they created a new branch that will work with both the CFIA and Agriculture and Agri-Food Canada to handle overlap areas and facilitate broader support and interdepartmental dialogue. The industry will push to ensure that organic is positioned well as this transition occurs and that support and understanding of organic is at the forefront of their planning.
Consistent and permanent funding for Canadian Organic Standards needed
In Canada, organic standards are owned by the Canadian General Standards Board (CGSB). Although this is a government agency, the content of the standards is fully determined by voting industry members of the CGSB. The Canadian government expects the organic industry to fund the standards revision process, which puts Canadian operators at a significant trading disadvantage compared to their trading partners in the USA and the European Union (where the standards process is publically funded). The industry has no practical way to fund the standards as the industry is still comparatively small, and it is impossible presently to create a check-off program in Canada under the current regulatory environment.
Canada Organic Trade Association (COTA), Canadian Organic Growers (COG) and the Organic Federation of Canada (OFC), with the support of each provincial organic association, are leading a government relations campaign to secure permanent funding as part of the 2018 Federal Budget. There is an imminent need to raise one million Canadian dollars by 2020 for the standards revisions. In addition, funding needs to be secured to incorporate new organic standards as a result of the Safe Foods for Canadians Act (it will be permitted to certify aquaculture under the Canadian Organic Regulation COR). The standards are the backbone of the industry, and they are at risk of being shelved should the funding not be made available. Such an outcome would have massive negative implications for organic trade. The organic standards should have consistent and permanent government funding, as is the case in the United States and in the European Union.
Closing regulatory gaps across provinces and territories
The Canadian Government introduced the national organic regulations in 2009. These standards apply to products that cross provincial, territorial or federal borders, or use the Canada Organic logo. However, they do not apply to products that are produced and sold within the same province/territory, leaving a significant regulatory gap.
Manitoba, British Columbia, Nova Scotia and New Brunswick have adopted the national standards and Quebec has its own regulation. The remainder of Canada’s provinces and territories do not have any regulation at all. This gap creates an unequal playing field and creates vulnerabilities for transgressions that affect the
North America › Canada
FiBL & IFOAM – Organics International (2018): The World of Organic Agriculture. Frick and Bonn 295
integrity of the Canada Organic brand. Ensuring that all provinces and territories have their own organic regulations is necessary to establish a strong and fair organic sector.
Resources − Canada Organic Trade Association - www.ota.com/canada-ota − Canadian Organic Growers - www.cog.ca − Census of Agriculture 2016 - https://www.statcan.gc.ca/eng/ca2016 − Organic Agriculture Centre of Canada at Dalhousie University -
https://www.dal.ca/faculty/agriculture/oacc/en-home.html − Organic Federation of Canada - https://www.organicfederation.ca/

North America › Statistics
296 FiBL & IFOAM – Organics International (2018): The World of Organic Agriculture. Frick and Bonn
North America: Current statistics
JULIA LERNOUD,1 HELGA WILLER,2 AND BERNHARD SCHLATTER3
Overview
North America’s organic agricultural land was 3.1 million hectares in 2016, which is 0.8 percent of the total agricultural area. The area under organic cultivation has almost trebled from the million hectares in 2000, and now represents six percent of the global organic agricultural land. Between 2015 and 2016, the area increased by over 156’000 hectares or 5.3 percent. Almost 1.7 percent of the farmland in Canada is organic, and the proportion in the United States is 0.6 percent. There is a total of 18’422 producers in North America; most of them are in the United States (almost 77 percent).
Land use
Land use details were available for almost the whole of the organic agricultural land. In 2016, only three percent of all organic farmland was utilized for permanent crops (almost 104’000 hectares) while almost 38 percent was used to grow arable crops (almost 1.2 million hectares), and 46 percent (over 1.4 million hectares) was grassland/grazing. The United States has the largest grassland/grazing area, almost 933’000 hectares, and Canada reported almost 506’000 hectares.
The key organic arable crop group is cereals, with almost 542’000 hectares, representing almost 46 percent of the region organic arable area, and 0.7 percent of the total cereal area in the region. In the United States over 281’000 hectares of organic cereals were grown, and Canada reported almost 261’000 hectares. The key organic cereal in the region was wheat (almost 247’000 hectares), this represented almost one percent of the total wheat grown in the region. Organic vegetables were grown on almost 78’000 hectares in 2016, 8.3 percent of the total vegetables in the region, with leafy/stalked vegetables (26’230 hectares) and fruit vegetables (over 16’000 hectares) being the key produced vegetables.
The main organic permanent crops were temperate fruits (almost 13’000 hectares), grapes (12’000 hectares), and berries (almost 10’000 hectares). Organic temperate fruits represented four percent of the total temperate fruit area in the region. The key temperate fruits are apples, cherries, and plums. The key organic berries are blueberries (over 7’500 hectares, 8.2 percent of the total blueberries grown in the region), and cranberries (800 hectares, 3.3 percent of the total cranberry area).
1 Julia Lernoud, Research Institute of Organic Agriculture (FiBL), Frick, Switzerland, www.fibl.org 2 Helga Willer, Research Institute of Organic Agriculture (FiBL), Frick, Switzerland, www.fibl.org 3 Bernhard Schlatter, Research Institute of Organic Agriculture (FiBL), Frick, Switzerland, www.fibl.org
North America › Statistics
FiBL & IFOAM – Organics International (2018): The World of Organic Agriculture. Frick and Bonn 297
Producers
In 2016, 18’422 organic producers were reported in North America. The United States is the country with the most organic producers, over 14’000, and Canada reported over 4’200 organic producers. Since 2004, when there were 11’000 organic producers, the number increased over 60 percent.
Wild collection
Unfortunately, for the United States data on organic wild collection is not available with the exception of over 300 of wild blueberries, so it can be assumed that the wild collection area is much bigger in the region than the current 79’855 hectares reported mainly by Canada. In Canada, there are almost 63’000 hectares of maple trees, a key commodity for the country.
Market
In 2016, the organic market continued to grow in North America, reaching 41.9 billion euros. In Canada, the organic market grew by over 9 percent in 2016, and in the United States, the organic market grew by 8 percent. The United States is the largest single organic market in the world, and North America continues to be the region with the largest organic market. In the United States, people spent 121 euros per capita on organic products in 2016, while in Canada the per capita consumption was 83 euros. For 2016, Canada reported an organic share of the total retail sales of 2.6 percent, and in the United States an organic share 5.3 percent was noted.
For more information about the North American figures, see data tables, page 300.

North America › Statistics › Graphs
298 FiBL & IFOAM – Organics International (2018): The World of Organic Agriculture. Frick and Bonn
Organic Agriculture in North America: Graphs
Figure 103: North America: Organic agricultural land in Canada and the United States 2016
Source: Canada Organic Trade Association and United States Department of Agriculture.
Figure 104: North America: Organic share of total agricultural land in Canada and the United States 2016
Source: Canada Organic Trade Association and United States Department of Agriculture.
1'099'014
2'031'318
0 500'000 1'000'000 1'500'000 2'000'000 2'500'000
Canada
United States ofAmerica
Hectares
North America: Organic agriculture area 2016Source: COTA and USDA, 2018
0.6%
1.7%
0.0% 0.5% 1.0% 1.5% 2.0%
United States of America
Canada
Share of total agricultural land
North America: Organic share of total agricultural land 2016Source: COTA and USDA, 2018

North America › Statistics › Graphs
FiBL & IFOAM – Organics International (2018): The World of Organic Agriculture. Frick and Bonn 299
Figure 105: North America: Development of organic agricultural land 2000-2016
Source: Canada Organic Trade Association and United States Department of Agriculture1
Figure 106: North America: Land use in organic agriculture 2016
Source: Canada Organic Trade Association and United States Department of Agriculture
1 Due to methodological differences, the United States shows a drop of its area in 2014. A reason could be that the wild collection might have been included in the past.
1.061.28 1.26
1.41
1.72
2.22
1.79
2.292.58 2.65
2.47
3.02 3.01 3.05
2.46
2.973.13
0.0
0.5
1.0
1.5
2.0
2.5
3.0
3.5
2000
2001
2002
2003
2004
2005
2006
2007
2008
2009
2010
2011
2012
2013
2014
2015
2016
Mill
ion
hect
ares
North America: Development of organic agricultural land 2000-2016Source: COG-COTA and USDA, 2001-2018

North America › Statistics › Tables
300 FiBL & IFOAM – Organics International (2018): The World of Organic Agriculture. Frick and Bonn
Organic Agriculture in North America: Tables
Table 71: North America: Organic agricultural land, organic share of total agricultural land, and number of producers 2016 Country Area [ha] Share of total agr. land [%] Producer [no.] Bermuda Processing only United States of America 2’031’318 0.6% 14’217 Canada 1’099’014 1.7% 4’205 Total 3’130’332 0.8% 18’422
Source: Canada Organic Trade Association and United States Department of Agriculture; FiBL survey 2018
Table 72: North America: All organic areas 2016 Country Agriculture [ha] Forest [ha] Wild collection [ha] Total [ha] Bermuda Processing only Canada 1’099’014 49’459 79’517 1’227’990 United States of America 2’031’318 205’196 338 2’236’852 Total 3’130’332 254’655 79’855 3’464’842
Source: Canada Organic Trade Association and United States Department of Agriculture; FiBL survey 2018
Table 73: North America: Land use in organic agriculture 2016 Land use Crop group Area [ha] Agricultural land, no details
407’550
Arable land crops Arable crops, no details 10’159
Cereals 541’971
Dry pulses 72’239
Fallow land, crop rotation 8’583
Flowers and ornamental plants 634
Green fodders from arable land 328’751
Hops 367
Medicinal and aromatic plants 3’671
Mushrooms and truffles 22
Oilseeds 102’075
Root crops 12’618
Strawberries 2’702
Textile crops 8’959
Tobacco 4’045
Vegetables 77’691
Arable land crops total
1’174’489 Other agricultural land
6’038
Permanent crops Berries 9’853
Citrus fruit 4’919
Coffee 87
Fruit, temperate 12’578
Fruit, tropical and subtropical 3’520
Grapes 12’072
Nurseries 91
Nuts 8’622
Olives 719
Permanent crops, other 51’321
Permanent crops total
103’781 Permanent grassland 1’438’474 Total
3’130’332
Source: Canada Organic Trade Association and United States Department of Agriculture; FiBL survey 2018

FiBL & IFOAM – Organics International (2018): The World of Organic Agriculture. Frick and Bonn 301
Oceania
Map 7: Organic agricultural land in the countries of Oceania 2016 (in hectares)
Source: FiBL survey 2018, based on information from the private sector, certifiers, and governments. For detailed data sources see annex, page 330.

Oceania › Australia
302 FiBL & IFOAM – Organics International (2018): The World of Organic Agriculture. Frick and Bonn
Australia
ANDREW LAWSON,1 ANDREW MONK,2 AND AMY COSBY3
Introduction
Australia has seen even more growth in 2016 in the area of pastoral land under certified organic management. The number of certified organic primary producers also increased steadily in 2016. Using a limited data set, it is estimated that the overall volume (in metric tons) of Australian-grown organic products exported to other countries increased 17 percent between 2015 and 2016. The regulatory and governance arrangements in the certified organic sector in Australia have remained stable since the last World of Organic Yearbook (Lawson et al. 2107), but change is in the air. The Australian Government, organic industry groups, and the participants in the organic supply chain generally are involved in a number of initiatives aimed at enhancing value for the organic sector in Australia.
Primary producers and area of farmland
By the end of 2016, Australia had an estimated 2’075 certified organic producers, including both fully certified and in-conversion. Producer numbers are more than 20 percent higher than a decade ago, though they have not yet returned to the highpoint of 2009 shown in Table 74. This may be due to consolidation of smaller farms into bigger enterprises.
The area under certified organic management (in-conversion and fully certified) is estimated to be about 27 million hectares (see Table 74). This is more than double the area a decade ago and four-times the area in 2002. The Australian Bureau of Statistics estimates the total area of farmland in Australia to be about 385 million hectares,
which means about 7 percent of Australian farmland is under certified organic management. The vast majority of the area under certified organic management in Australia is for pasture-based beef cattle production in the “Outback” (the semi-arid rangelands or pastoral zones of Australia). The size of individual cattle production enterprises in the Outback are typically tens of thousands of hectares each.
1 Andrew Lawson, Australian Centre for Agriculture and Law, University of New England, Armidale, NSW 2351, Australia 2 Andrew Monk, Australian Organic Ltd, 18 Eton Street, Nundah, Queensland 4012, Australia 3 Amy Cosby, Australian Centre for Agriculture and Law, University of New England, Armidale, NSW 2351, Australia

Oceania › Australia
FiBL & IFOAM – Organics International (2018): The World of Organic Agriculture. Frick and Bonn 303
Table 74: Estimated certified organic primary production operations and area [ha] in Australia 2002-2016
Year Primary production operations Area under certified organic management (ha)
2002 1’650 6’150’171 2003 1’730 11’198’188 2004 1’859 12’077’362 2005 1’871 11’715’744 2006 1’691 12’294’290 2007 1’776 11’988’044 2009 2’129 12’001’724 *2011 2’117 11’199’578 2014 1’707 22’690’000 **2015 1’999 22’108’495 **2016 2’075 27’145’021
* Estimated using Australian Bureau of Statistics (ABS) data. Organic industry sources put this as high as almost 17 million hectares ** Based on data from the two largest certifiers only – Australian Certified Organic (ACO) and NASAA Certified Organics (NCO) – and therefore an underestimate.
It is estimated that 37 percent of all certified organic producers in Australia were involved in the fruit-growing sector in 2016, which has the highest proportion of producers in the plant-based sectors. About one third of all producers grow vegetables, about one third produce lucerne hay, and about one fifth grow root crops or cereals. The proportions are relatively stable between 2015 and 2016, with the exception of oilseed growers, which dipped downwards.
Beef production is the animal-based sector that involves the most certified organic producers in Australia – almost a third. The numbers of producers in the animal-based sectors were relatively stable between 2015 and 2016, with the exception of lamb producers – a greater proportion of organic producers were raising lamb in 2016 compared with 2015.
Exports
Like much of the conventional Australian agriculture, Australian organic production has a strong export orientation. Based on limited data on exports, it is estimated there was a 17 percent increase in the overall tonnage of organic products exported from Australia between 2015 and 2016. Export certificates were issued for Australian organic products going to at least 69 different countries in 2016. Exports increased to all continents in 2016, as shown in Figure 107, and new markets opened up in Central Asia and South America.

Oceania › Australia
304 FiBL & IFOAM – Organics International (2018): The World of Organic Agriculture. Frick and Bonn
Figure 107: Estimated percentage of certified export volume from Australia destined for global regions 2016
Source: Australian Organic 2017
The top five export destinations for 2016 accounted for about two-thirds of total volume (in metric tonnes) exported from Australia. The United States was the biggest export destination and accounts for about one third of exported tonnage. South Korea remained the second most important export destination, though exports dipped in 2016. China (excluding Hong Kong), in third place, saw 27 percent growth in 2016, and Singapore, in fifth place, showed 39 percent growth. The quiet achiever was Hong Kong, which moved Japan out of fourth position, more than tripling imports of Australian organic products in 2016. Destinations that showed the largest growth in imports of organic products from Australia (by tonnage) in 2016 were Hong Kong, the United States, Sweden, China and New Zealand.
Beef was the top export commodity (based on volume in metric tons), at close to 20 percent of all exports in 2016. Horticultural produce, dairy products and wine all contributed around 5 percent of exports. Some sectors dipped in 2016, but most showed strong growth. Bakery items showed more than four-fold growth, and sheep/lamb meat, cosmetics, alcoholic drinks, dairy products and chicken all showed exceptional growth.
The United States dominates overall in terms of total imported volume (in metric tons) of Australian organics, and beef dominates the United States imports. About 56 percent of United States imports of Australian organic volume was organic beef. The United States is also the leading destination for certified lamb, horticultural products, and tea, coffee, and snacks.
In some cases, a single destination accounted for half or more of the volume ascribed to export certificates. For example, beef and lamb to the United States; chicken to Hong Kong; bakery items to South Korea; and alcohol other than wine to New

Oceania › Australia
FiBL & IFOAM – Organics International (2018): The World of Organic Agriculture. Frick and Bonn 305
Zealand. About a third of Australian organic dairy products, cosmetics, and wine go to China, Hong Kong and Sweden respectively.
Regulatory framework
There have been few substantive changes to the regulatory framework for governing organics in Australia since the 2017 edition of “The World of Organic Agriculture” yearbook. In summary, Australian law provides that Australian-produced products that are labelled as organic and exported from Australia must be certified as organic by one of six government-accredited certifying organizations: AUS-QUAL, Australian Certified Organic (ACO), Bio-Dynamic Research Institute (BDRI), National Association for Sustainable Agriculture Australia (NASAA) Certified Organic, Organic Food Chain (OFC), and Safe Food Production Queensland (SFPQ).
The certifiers must certify, at a minimum, to the National Standard for Organic and Bio-Dynamic Produce (National Standard). Some certifiers, for additional market access or branding purposes, also certify operators to their own standard, which must be at least as stringent as the National Standard. The National Standard was last updated in 2016 and is maintained by the industry owned and funded Organic Industry Standards and Certification Council (OISCC) on behalf of the Department of Agriculture and Water Resources (DAWR).
Certification means the exported products leave Australia in compliance with Australian law, but it does not guarantee the products comply with the importing country’s law. Consequently, the Australian Government and individual Australian certifiers must engage in equivalency negotiations with the importing country on a government-to-government or certifier-to-government basis respectively. Consequently, and by example, three separate Australian certifiers are accredited directly with the USDA1 NOP2 requirements for access to the United States marketplace. Government-to-government negotiations are continuing with South Korea to enable direct access to that market via equivalency provisions. These negotiations have been ongoing for some years but are expected to be finalised in 2018.
In the domestic Australian market, there is no legislation specifically referencing organic production and marketing requirements. There is, however, strict domestic consumer protection legislation (Australian Consumer Law 2010) prohibiting misleading or deceptive conduct. All the major chain retailers also require certification to recognised industry standards for access to their shelves, as do some farmers markets and other independent retailers.
1 USDA is the United States Department of Agriculture. The USDA website is available on https://www.ams.usda.gov/. 2 NOP is the National Organic Programme of the United States of America. More information is available at https://www.ams.usda.gov/about-ams/programs-offices/national-organic-program.

Oceania › Australia
306 FiBL & IFOAM – Organics International (2018): The World of Organic Agriculture. Frick and Bonn
The majority of the Australian industry is covered under the provisions of the National Standard, which has been in place since the 1990s. There is also a shadow organic standard, which was established by industry via Standards Australia (an Australian standards setting organization), known as the AS6000, which is based on the National Standard. This standard is not used as a certification standard commercially within Australia but has the potential to be referenced by the government consumer organisation the Australian Competition and Consumer Commission (ACCC) in cases of dispute over organic claims domestically. Convergence of the two regimes or standards – export and domestic – remains a work in progress. In 2018, industry is expected to preside over a major review of the Export Orders and regulatory arrangements, in order to develop one single standard and related regulatory regime when the current regulatory arrangements sunset in 2020.
Competitive exports
In mid-2015, the Australian Government released a policy paper on increasing the competiveness of Australian agriculture. A key plank of the paper focuses on access to premium international export markets for Australian-grown produce. The Government’s connection with organics from a regulatory point of view is the oversight of the export regime, via export regulations. Under the banner of access to premium export markets, the Government is working with players in the organic sector in Australia on a number of initiatives including: • Development of an action plan, with the specific aim of creating a national voice
for the organic sector • A review of the organic export regulations, and • Public funding to support development and implementation of a five-year
Organic Market Access Strategy
On the industry side, leading organic sector players have founded a project called “Organic Industries” led by an organizing committee – the Australian Organic Industry Working Group – “with a view to establishing a harmonised national voice for all organic producers, certifiers and the supply chain” (Organic Industries, 2017).
A new peak structure and voice for organics in Australia?
The deliberations of the organic industries project may result in a new national representative structure “that will be the voice of organic industries at national and state level and that promotes viable and sustainable industries with broad representation from all sectors” (Organic Industries, 2017).
Thus far, there have been a series of consultative workshops in regions across Australia. The consultations involved government agencies, certified organic producers and support industries, organic exporters, value-adders, and retailers. A consultation paper collating and analysing responses to the consultation process has now been published (Policy Partners, 2017).

Oceania › Australia
FiBL & IFOAM – Organics International (2018): The World of Organic Agriculture. Frick and Bonn 307
The consultation paper focuses on the importance of the Australian organic sector enhancing relationships with government, producers, supply chains and external stakeholders. The main objectives are value creation, effective regulation, and building trust, not just for the export of Australian-produced organics, but also for the integrity of the Australian domestic market. The consultants prepared a roadmap for the sector to develop a preferred option for a proposed peak structure. The structure could be operating by mid-2018, depending on the sector’s deliberations. The two most promising options canvassed by the consultants were:
• Establishing an entirely new peak body, or • Morphing the parent body of ACO – Australian Organic Limited – into the peak
body, taking advantage of its existing profile and resources. The consultation and engagement process is ongoing, and this space will be one to watch over the coming year. The other significant industry event of the year was the approval by members of Australian Organic Ltd (AOL) to separate its certification subsidiary, ACO Pty Ltd. Starting in 2018, this will enable greater competition for service providers for access to the Bud logo (the logo found on the majority of certified organic products in Australia), while enabling AOL to become more of a focused industry services group. Whether or not industry in turn requests the use of AOL resources and structures to form a new peak structure, or sets up a separate structure to complement the work of this industry services organisation remains to be seen and will be determined through industry consultation in 2018.
Review of export regulations
As mentioned above, organic products come within the operation of Australia’s export regulations, which class organic products as “prescribed goods” subject to legal requirements – in particular, certification. The specific regulation is subject to a “sunset clause” and will expire in 2020. The Government has engaged the professional services firm Deloitte to lead a review of the export regime, with a review report expected in mid-2018. There are a number of actions the government could take – continue the current arrangements requiring certification of exports of Australian-produced organics, abolish the current arrangements, or strengthen, weaken or otherwise amend the export regime. Once again, this is a space to watch during 2018.
Common voluntary organic logo for Australia
Unlike the United States and European Union, there is no Australian Government organic logo. There have been attempts over the years to create one, but the results of these attempts have not persisted. The lack of a national logo was raised as a

Oceania › Australia
308 FiBL & IFOAM – Organics International (2018): The World of Organic Agriculture. Frick and Bonn
negotiating issue in 2015 by South Korea in government-to-government equivalency negotiations with the Australian Government.1
In 2017, Australia’s trademark authority (IP Australia) formally registered two trademarks in the name of the Organic Industry Standards and Certification Council (OISCC). OISCC’s organic trademarks are available for use by operators certified by any of the six government accredited certifiers. Use of the marks is voluntary and does not prevent a certifier from using its own logo.
Meanwhile the domestic marketplace in Australia continues to consolidate and simplify. The Australian marketplace remains an open market with moderate regulatory arrangements in place domestically (rather than mandatory legislative requirements), driven by the buyer in terms of demand for certified organic products. The year ahead will be a major year for the Australian organic industry as it lobbies government for an updated legislative arrangement that references one single standard for export and domestic market requirements – a long-standing desire of the trade and the movement.
References Australian Bureau of Statistics (2016): 7121.0 – Agricultural Commodities, Australia, 2014-15. Available at
http://www.abs.gov.au/ausstats/[email protected]/mf/7121.0 ACO (2016): National Organic Seal (OISCC). https://aco.net.au/national-organic-seal-oiscc/ Australian Government (2015): Agricultural Competitiveness White Paper. Canberra. Available at
http://agwhitepaper.agriculture.gov.au/ Australian Government Department of Agriculture and Water Resources (2017): Accessing Premium
Markets: Australian Organics – Discussions with Industry on Implementing the Australian Government Agricultural Competitiveness Policy. Canberra.
Australian Government Department of Agriculture and Water Resources (2017): Improving Access to Premium Markets for Organic Products. Available at http://www.agriculture.gov.au/export/controlled-goods/organic-bio-dynamic/accessing-premium-markets-organic-products
Australian Organic (2017): Australian Organic Market Report 2017. Australian Organic, Nundah, www.austorganic.com
Lawson, A., Monk, A., and Cosby A. (2017) Australia. In: Willer, H. and Lernoud, J. (2017): The World of Organic Agriculture. Statistics and Emerging Trends 2017. FiBL and IFOAM – Organics International, Bonn and Frick
Organic Industry Standards and Certification Council (OISCC) (2010): National Standards sub Committee (NSsC). The website of the Organic Industry Standards and Certification Council, Brisbane. Available at https://oiscc.org/national-standards-sub-committee/
Organic Industries (2017): Organic Industries. A voice for Australia’s organic industries. Available at https://www.onevoice.organicindustries.com.au
Policy Partners (2017): A Proposed Roadmap for Australia’s Organic Industry – Considering Options for the Leadership of the Industry. Consultation paper prepared for Organic Industries. The Organic Industry website, Available at https://www.onevoice.organicindustries.com.au/Consultation/Paper
1 It is possible for individual Australian certifiers to be accredited by the South Korean Government, and ACO has achieved this accreditation.
Oceania › Pacific Islands
FiBL & IFOAM – Organics International (2018): The World of Organic Agriculture. Frick and Bonn 309
The Pacific Islands
KAREN MAPUSUA1
Recent developments
Regional and national agencies and development partners increasingly recognize the value of organic agriculture as a development tool for the Pacific Islands context. Innovations such as the Pacific Organic Tourism and Hospitality Standard and the online Pacific Organic Policy Toolkit are attracting interest from organic farmers through to policymakers. Successes and lessons learned from past projects are being incorporated into programmes to upscale activities, like Participatory Guarantee System (PGS) development, and are being recognized as providing a platform for social development including women’s and youth economic empowerment.
The number of organic farmers in the region is continuing to grow with PGS growing at a faster rate than third-party certification.
The Pacific Organic Tourism and Hospitality Standard
The organic movement and members of the hospitality industry currently involved in organic farm-to-table projects called for a brand or identifier they can use to promote their use of organic produce. The Pacific Organic Tourism and Hospitality Standard (POTHS) was developed in 2016 with the assistance of the European Union Pacific Agriculture Policy Project (PAPP) to meet this need. The POTHS and accompanying guarantee system can be applied to menu items, food/catering providers or whole destinations. The POTHS aligns with the standards and requirements of the Pacific Organic Standard (POS). The POTHS will enable tourism operators to procure fresh and value-added products through a certified organic value chain and, if compliant with other environmental and social standards, will qualify to be certified to the Standard and use the “Organic Pasifika” mark in their branding and marketing.
Pilots for the POTHS have been established with the assistance of the International Fund for Agricultural Development IFAD, the Sustainable Development Goals Fund and the United Nations Development Programme in Vanuatu and Fiji during 2017. The first certification is expected in 2018.
Participatory Guarantee Systems
Interest in Participatory Guarantee Systems (PGS) in the Pacific Islands continued to expand through 2016-2017 as market opportunities for PGS-certified products evolved, and examples were generated of how organic and PGS can be tools for holistic and sustainable social and economic development. The Pacific Organic and
1 Karen Mapusua, Team Leader, Land Resources Division, Pacific Community, Suva, Fiji

Oceania › Pacific Islands
310 FiBL & IFOAM – Organics International (2018): The World of Organic Agriculture. Frick and Bonn
Ethical Trade Community (POETCom) with support from the International Fund for Agricultural Development (IFAD) began in 2013 developing models for Participatory Guarantee Systems tailored to the diverse situations of Pacific organic growers. After learning from the first Pacific PGS – BioCaledonia and BioFetia in New Caledonia and French Polynesia respectively – three pilot PGS were established in Fiji and Kiribati focusing on specific products (virgin coconut oil, coco sap sugar and papaya).
A PGS training package has been developed, and it is now being utilised to assist further development.
PGS models in the Pacific include wild harvest, “whole island”1, as well as more traditional grower groups. Respect for traditional authorities (chiefs) is strong in the Pacific Islands, and in some cases, traditional village or island governance systems have been embraced to provide support to the guarantee system. Processing and value-adding operations are also certified through the PGS process. This has created a need to provide considerable upskilling to those PGS that include processing so that they can manage the more complex inspection requirements. Processor PGS certification at this point is only provided in countries, where there are multiple processors to allow PGS processors to peer review across the PGS groups.
A unique aspect of PGS in the Pacific is the regional PGS Mark “Organic Pasifika Guaranteed”. PGS can apply to POETCom to be licensed to use this mark, which not only facilitates the recognition of organic product in the local market but is recognized across the 22 Pacific Island countries and territories, facilitating intra-regional trade in organic products. This trade is in its infancy but already small quantities of organic products such as forest nuts, virgin coconut oil and coco sap sugar are being exported to other Pacific Island countries for their developing organic markets. There are currently eight PGS approved to use the Organic Pasifika Mark, and a further three are under development.
Third-party certification
Third-party organic certification continues to grow slowly. Each year shows some withdrawals from certification and some new licensees. For some growers of long-term crops, such as coconuts, devastation by tropical cyclones makes maintaining certification through the recovery period uneconomical. Costs remain high and in some cases, prohibitive for smallholder family farms. A considerable proportion of the costs relate to travel expenses, as inspectors have to fly in, usually from Australia or New Zealand. Due to flight logistics, geographic spread or locations of grower groups, inspectors are often required to stay on an island a considerable amount of time. In 2015, POETCom initiated training of organic inspectors based in the Pacific Islands with trainees from seven Pacific Island countries beginning the process of training to be organic inspectors. Training was delivered by the International Organic
1 Under the „whole island“ approach, an entire island is certified under traditional land tenure arrangements.

Oceania › Pacific Islands
FiBL & IFOAM – Organics International (2018): The World of Organic Agriculture. Frick and Bonn 311
Inspectors Association together with the National Association of Sustainable Agriculture Australia (NASAA) and with support from Biogro and Bioagricert. The aim is to build a pool of locally based inspectors that POETCom’s partner certifying bodies can contract to undertake inspections on their behalf, reducing travel costs for operators. Lack of resources has constrained the continued development of inspectors.
Market & trade
Most of the organically certified products from the region are for export. There are indications of growing local markets through basket (box) schemes, unverified organic claims on labels, PGS development, organic stalls at farmers markets, and increased awareness. As of yet, however, there are no mechanisms for collecting local organic market data.
Commodities
The following summary table lists the main products, which are currently organically certified in the Pacific region.
Table 75: Pacific region: Main products, which are currently organically certified
Products Countries Vanilla, ginger & other spices Fiji, Vanuatu, Niue, Samoa Cocoa Vanuatu, Samoa, Papua New Guinea Virgin coconut oil Samoa, Fiji, Solomon Islands, Tonga, Vanuatu Coconut meal Vanuatu Nonu /noni (Morinda Citrifolia) Cook Islands, Samoa, Fiji, Niue, French Polynesia Honey Niue Bananas (including processed) Fiji, Papua New Guinea, Samoa Coffee PNG, Samoa, Fiji Livestock( beef, goats and sheep) Vanuatu, Fiji Fruit & Vegetables ( including processed) Fiji, New Caledonia, Samoa, French Polynesia Rum French Polynesia Forest nuts Solomon Islands
Source: SPC
Domestic Markets
Domestic markets for certified organic products are slowly developing. Organic products are commonly sold as conventional without premiums or any acknowledgment of the organic status of the product. Some initiatives are ongoing or are in the pipeline to promote consumer awareness about organic products, in particular in linking the concept of organic with local food consumption as part of strategies to reduce non-communicable diseases, which are a major health issue in the Pacific Islands. Interesting opportunities are now being explored within the tourist structures of several countries that have larger tourism industries (e.g. Fiji, Vanuatu, Cook Islands and Samoa) focusing on development of Pacific cuisine and linking smallholder organic farmers directly with tourism and hospitality providers. There are now several up-market island-based resorts in Fiji, which have their island

Oceania › Pacific Islands
312 FiBL & IFOAM – Organics International (2018): The World of Organic Agriculture. Frick and Bonn
organically certified and which commit to serving guests organic produce from their land. The development of the Pacific Organic Tourism and Hospitality Standard (POTHS) is expected to support growth in domestic markets in coming years. The growth in interest in PGS in several counties also implies that there is an opportunity for further development of domestic markets, and the acceptance of PGS certification across the region has stimulated initial regional trade in organic goods.
Legislation
Until recently, there have been no significant changes in legislation and no real indication governments were considering policy in the area of organic agriculture. However, in recent years, governments of the region have approached POETCom for advice on assisting the growth of organics. In 2016, POETCom partnered with IFOAM – Organics International to develop an online Pacific Organic Policy Toolkit, which is now available. The government of Vanuatu has utilized the toolkit to develop a national policy with the objective for Vanuatu to be 100 percent organic by 2020. Governments of Fiji and Samoa are also planning to utilize this online resource.
Government and international support
Pacific Community (SPC) as a regional intergovernmental organization continues to provide support for organics development and now houses the POETCom secretariat. However, as current project funding cycles come to an end, the need for bridging finance and developing a longer-term financing strategy to support the organic movement is critical.
POETCom national affiliates continue to receive assistance from partners such as OXFAM New Zealand, Canada Fund, UNDP1 small grants programmes and bilateral donor assistance from Australia and New Zealand. In a few cases, national governments also provide financial support for organic certification costs as in the case of Samoa, Tonga and Niue, where the national governments cover certification fees for large national grower groups.
Outlook
Sustainable resourcing for the secretariat and core services of POETCom presents a challenge. Since 2016, the coordinator´s role in POETCom had been unfunded. This created a significant burden on remaining staff and required substantial voluntary work from members and supporters. Functioning in this way is not sustainable. However, as governance and management structures are strengthened and with the implementation of the Pacific Organic Guarantee System, in particular the elements of PGS, the export certification scheme and regional organic branding, growth and momentum are likely to continue. Funding support is being sought to design and
1 UNDP is the United Nations Development Programme. For more information, see www.undp.org.

Oceania › Pacific Islands
FiBL & IFOAM – Organics International (2018): The World of Organic Agriculture. Frick and Bonn 313
develop cost recovery mechanisms for services. Projects for development funding are also under development.
A growing understanding of the role and potential for organic agriculture in adaptation to climate change will provide a basis for incorporating organics as a development tool in Pacific agriculture and climate change policy, but financial support will be required to undertake the necessary trials and demonstrations required for farmers and policymakers to widely adopt organic agriculture.
There is also an expectation that the local market for organic products will start to expand as the tourism and hospitality industries start to look towards organic and sustainability as part of the Pacific Islands’ brand.
Links and further reading • Pacific Organic and Ethical Trade Community
www.organicpasifika.com • Pacific Organic Standard
http://www.organicpasifika.com/poetcom/wp-content/uploads/sites/2/2014/08/POS.pdf • Growing Our Future POETCom Strategic Plan 2013 – 2017
http://www.organicpasifika.com/poetcom/wp-content/uploads/sites/2/2014/08/POETCom-Strategic-Plan.pdf
• POETCom Annual Reports http://www.organicpasifika.com/poetcom/who-are-we/annual-reports/
• Pacific Organic Policy Toolkit http://www.organicpasifika.com/pasifikapolicytoolkit/

Oceania › Statistics
314 FiBL & IFOAM – Organics International (2018): The World of Organic Agriculture. Frick and Bonn
Oceania: Current statistics JULIA LERNOUD,1 HELGA WILLER,2 AND BERNHARD SCHLATTER3
In 2016, the organic agricultural land in Oceania was 27.3 million hectares, which constituted 6.5 percent of the total agricultural area in the region. Forty-seven percent of the world’s organic agricultural land is in Oceania. The area under organic production has increased 5-fold since 2000 (5.3 million hectares). Between 2015 and 2016, the area in Oceania grew by over 5 million hectares – almost 23 percent more - mainly due to a large growth of the organic agricultural area in Australia. However, further countries, such as Samoa (almost 36’000 hectares more) and French Polynesia (over 14’000 hectares more) showed an important growth. The country with the biggest organic agricultural area is Australia with 27.1 million hectares, and the highest organic share of total agricultural land is in French Polynesia, with 31.3 percent of all farmland under organic cultivation, followed by Samoa with 22.4 percent.
Land use
It is estimated that in 2016, almost 96 percent of all organic farmland in Oceania was grassland/grazing areas (26 million hectares, mainly in Australia). Detailed data on land use was not available for Australia, the country with the largest area. However, it was available for all other countries. From the available data, we can assume that permanent crops play an important role in the region. Coconuts is the largest grown commodity (over 93’000 hectares, 17.4 percent of the total region’s tropical fruit area). Furthermore, coffee (nearly 15’300 hectares, 28 percent of the total coffee grown in the region) are largely grown in the Pacific Islands, mainly for oil production.
Producers
There were more than 27’000 organic producers in the region, with the largest number of producers in Papua New Guinea (almost 15’000 producers), Australia (over 2’000 producers), and the Solomon Islands (over 1’500 producers). Since 2006, when data for most of the countries became available, their number has more than trebled.
Market
For 2016, no updated data on the organic market was available. In 2015, the total organic market was 1.1 billion euros for the region. Australia, reported an organic market of 941 million euros and New Zealand retail sales value 124 million euros. For the other countries in the region, no data is available. The annual organic consumption was 40 euros per person in Australia (2015) and 27 euros per person in New Zealand (2015). For more information, see the data tables on page 314.
1 Julia Lernoud, Research Institute of Organic Agriculture (FiBL), Frick, Switzerland, www.fibl.org 2 Helga Willer, Research Institute of Organic Agriculture (FiBL), Frick, Switzerland, www.fibl.org 3 Bernhard Schlatter, Research Institute of Organic Agriculture (FiBL), Frick, Switzerland, www.fibl.org

Oceania › Statistics › Graphs
FiBL & IFOAM – Organics International (2018): The World of Organic Agriculture. Frick and Bonn 315
Organic Agriculture in Oceania: Graphs
Figure 108: Oceania: Organic agricultural land by country 2016
Source: FiBL survey 2018, based on information from the private sector, certifiers, and governments. For detailed data sources see annex, page 330
Figure 109: Oceania: Organic share of total agricultural land by country 2016
Source: FiBL survey 2018, based on information from the private sector, certifiers, and governments. For detailed data sources see annex, page 330
101644381'5021'6005'72311'79413'34714'22915'63263'39374'134
27'145'021
0 10'000'000 20'000'000 30'000'000
Cook IslandsNiue
New CaledoniaTonga
KiribatiSolomon Islands
VanuatuFiji
French PolynesiaPapua New Guinea
SamoaNew Zealand
Australia
Hectares
Oceania: Organic agricultural land by country 2016Source: FiBL survey 2018
0.2%0.7%0.7%1.3%
3.1%3.3%
4.6%4.7%5.3%
6.3%6.7%
22.4%31.3%
0% 5% 10% 15% 20% 25% 30% 35%
New CaledoniaCook IslandsNew Zealand
Papua New GuineaFiji
NiueTonga
KiribatiSolomon Islands
VanuatuAustralia
SamoaFrench Polynesia
Share of total agricultural land
Oceania: Organic share of total agricultural land by country 2016Source: FiBL survey 2018

Oceania › Statistics › Graphs
316 FiBL & IFOAM – Organics International (2018): The World of Organic Agriculture. Frick and Bonn
Figure 110: Oceania: Development of organic agricultural land 2000-2016
Source: FiBL-IFOAM-SOEL 2000-2018; based on information from the private sector, certifiers, and governments. For detailed data sources see annex, page 330
5.31
5.34 6.25
11.3
0
12.1
8
11.8
1
12.4
3
12.0
7
12.1
1
12.1
5
12.1
5
12.1
9
12.1
6
17.3
2
18.5
3 22.2
6
27.3
5
0
5
10
15
20
25
30
2000
2001
2002
2003
2004
2005
2006
2007
2008
2009
2010
2011
2012
2013
2014
2015
2016
Mill
ion
hect
ares
Oceania: Development of organic agricultural land 2000-2016Source: FiBL-IFOAM-SOEL-Surveys 2002-2018

Oceania › Statistics › Tables
FiBL & IFOAM – Organics International (2018): The World of Organic Agriculture. Frick and Bonn 317
Organic Agriculture in Oceania: Tables
Table 76: Oceania: Organic agricultural land, organic share of total agricultural land, and number of producers 2016
Country Area [ha] Share of total agr. land [%] Producer [no.] Australia 27’145’021 6.7% 2’075 Cook Islands 10 0.7% 50 Fiji 13’347 3.1% 1’547 French Polynesia 14’229 31.3% 140 Kiribati 1’600 4.7% 900 New Caledonia 438 0.2% 94 New Zealand 74’134 0.7% 842 Niue 164 3.3% 51 Papua New Guinea 15’632 1.3% 14’914 Samoa 63’393 22.4% 1’614 Solomon Islands 5’723 5.3% 1’510 Tonga 1’502 4.6% 1’146 Vanuatu 11’794 6.3% 2’483 Total 27’346’986 6.5% 27’366
Source: FiBL survey 2018, based on information from the private sector, certifiers, and governments. For detailed data sources see annex, page 330
Table 77: Oceania: All organic areas 2016
Country Agriculture [ha] Wild collection [ha] Total [ha] Australia 27’145’021
27’145’021
Cook Islands 10
10 Fiji 13’347 653 14’000 French Polynesia 14’229
14’229
Kiribati 1’600
1’600 New Caledonia 438
438
New Zealand 74’134
74’134 Niue 164 112 276 Papua New Guinea 15’632
15’632
Samoa 63’393
63’393 Solomon Islands 5’723
5’723
Tonga 1’502
1’502 Vanuatu 11’794
11’794
Total 27’346’986 765 27’347’751
Source: FiBL survey 2018, based on information from the private sector, certifiers, and governments. For detailed data sources see annex, page 330

Oceania › Statistics › Tables
318 FiBL & IFOAM – Organics International (2018): The World of Organic Agriculture. Frick and Bonn
Table 78: Oceania: Land use in organic agriculture 2016
Land use Crop group Area [ha] Agricultural land, no details
836’205
Arable land crops Medicinal and aromatic plants 1’231
Sugarcane 7
Arable crops, other 438
Arable land crops total
1’676 Cropland, no details 9’677 Other agricultural land
5’821
Permanent crops Cocoa 657
Coconut 93’376
Coffee 15’268
Fruit, temperate 1’000
Fruit, tropical and subtropical 3’883
Grapes 2’022
Medicinal and aromatic plants, permanent 59
Permanent crops, other 835
Permanent crops total 117’099 Permanent grassland total
26’376’507
Total 27’346’986
Source: FiBL survey 2018, based on information from the private sector, certifiers, and governments. For detailed data sources see annex, page 330

FiBL & IFOAM – Organics International (2018): The World of Organic Agriculture. Frick and Bonn 319
Achievements and Outlook

Achievements and Outlook
320 FiBL & IFOAM – Organics International (2018): The World of Organic Agriculture. Frick and Bonn
A new narrative for the organic movement and IFOAM – Organics International
MARKUS ARBENZ1
The global General Assembly of IFOAM – Organics International 2017 decided unanimously that Organic 3.02 shall be incorporated into the strategy of all IFOAM members and that it shall guide change in the organic movement. IFOAM – Organics International is taking the lead with a new strategic plan and gives itself a new identity as an agent of change.
The umbrella
IFOAM – Organics International has been the global organic umbrella organization since 1972: From the early days of the pioneers (i.e. “Organic 1.0”) to the formation of the organic movement and the codification of standards and enforced rules that have established the organic sector with a market value of almost 90 billion US dollars per year (i.e. “Organic 2.0”).3
In the 45 years of its existence, IFOAM – Organics International has managed to facilitate the building of a dynamic global organic movement and sector with active institutions and local and global organic value chains. However, thanks to the achievements and due to a changed environment (e.g., the development of information technology, the introduction of organic regulations in many countries and the emergence of like-minded initiatives such as Fair Trade), the mission of IFOAM – Organics International has evolved. For a long time, it has been stakeholder-oriented and focused on uniting and assisting its affiliates. It has shown its relevance, e.g., through the development of basic standards for producers and certification bodies, through advocacy, and through sector development projects.
Now the organic movement is entering a new phase that we call “Organic 3.0”. Organic 3.0 positions organic as a modern, innovative system that has positive impacts on global environmental and social challenges. It is the overall strategic plan
1 Markus Arbenz, Executive Director, IFOAM - Organics International, Bonn, Germany, www.ifoam.bio 2 IFOAM – Organics International & SOAAN (2017): Organic 3.0 for truly sustainable farming & consumption. A Landmark Document of the Organic Movement. IFOAM – Organics International, Bonn. Available at https://www.ifoam.bio/sites/default/files/summary_organic3.0_print__0.pdf 3 For definitions see above-mentioned publication.
IFOAM – Organics International is the organic agent of change for true sustainability in agriculture, value chains and consumption. It works on behalf of its membership, the global organic movement in over 120 countries.
Its mission is: Leading Change, Organically!
Achievements and Outlook
FiBL & IFOAM – Organics International (2018): The World of Organic Agriculture. Frick and Bonn 321
of the global organic movement for further growth and sustainable development in order to increase positive impacts on the planet and the people. At the same time, we see increased recognition of the need for a more sustainable agriculture in general. We are spearheading momentum in which citizens, consumers, companies, governments and the United Nations start to act and call for change to agriculture policies.
So far, our organic solutions have only been adopted on a small percentage of the farmland, and the organic market share is still low. Yet, we are fast growing and have the responsibility to support, facilitate and advocate change.
The new narrative
The world faces challenges: poverty, hunger and malnutrition are prevailing, the global society has an unfair distribution of wealth and power, biodiversity is decreasing, natural resources like soil and water are deteriorating, and the planet ́s climate is changing. Agriculture and related value chains, as presently practiced, are among the main causes of the above-mentioned challenges and are responsible for bringing the planet to its limit. There is a wide consensus that we need to move towards more sustainable agriculture and food systems and that business as usual is not an option any more. Agriculture, done differently, can be part of the solution. If we get it right with agriculture and food systems, we get it right for the people and the planet!
Organic agriculture, a dynamic and continuously developing farming system based on the science of agroecology, is a form of truly sustainable agriculture and offers practical solutions to address major global challenges. Organic agriculture and equally sustainable systems produce healthy, nutritious food and other natural products for a growing population. They enable farmers to earn a fair living, regenerate and enhance soil fertility and biodiversity, safeguard and replenish scarce water resources, mitigate climate change, and help people, who have been negatively impacted by climate change, to adapt to it and become more resilient.
As an agent of change, IFOAM – Organics International - legitimized by its membership and in collaboration with its networks - facilitates and actively contributes to improvements towards true sustainability in agriculture, in its value chains and in consumption. It pursues the trifold goal of enhancing growth of the global organic sector, making it more sustainable and inspiring mainstream agriculture.
In order to fully utilize the potential of organic agriculture, IFOAM – Organics International works on three key factors or levers (see Figure 111 and the strategic plan below):
• Enhancing supply with capacity development of operators and other value chain actors;
• Stimulating demand with communication support and awareness campaigns; and

Achievements and Outlook
322 FiBL & IFOAM – Organics International (2018): The World of Organic Agriculture. Frick and Bonn
• Advocating for a policy and guarantee environment that is conducive to truly sustainable production and consumption.
Figure 111: The theory of change of IFOAM – Organics International
The strategic plan of IFOAM – Organics International
VISION Broad adoption of truly sustainable agriculture, value chains and consumption in line with the principles of organic agriculture
MISSION Leading change, organically.
GOALS We contribute to an increased: Uptake of organic agriculture and similar approaches, certified or non-certified; Number of organic operations that move from good practice towards best practice; Number of agriculture operations that are becoming more sustainable and integrate organic principles and methods.
THE 3 PILLARS OF ACTION
1. Supply: We facilitate capacity development for truly sustainable production; 2. Demand: We campaign to multipliers and act as a resource center for organic communications; 3. Policy and Guarantee: We advocate and provide competence for the creation of a favorable policy environment.
GOVERNANCE A democratic, international association of organic and likeminded institutions, that is accountable to its members. We also facilitate a global action network of self-organized institutions that have “IFOAM” in their name and we join forces with actors who share our vision.
The institutional context
The impact of this strategy development on the membership system of IFOAM - Organics International is still in discussion. In November 2017, the IFOAM General Assembly mandated the IFOAM World Board to introduce a discussion process and to present a reformed system to a virtual General Assembly in the second half of 2018.
As a consequence of the strategic plan, IFOAM – Organics International seeks further collaboration and partnerships. This includes discussions with organisations

Achievements and Outlook
FiBL & IFOAM – Organics International (2018): The World of Organic Agriculture. Frick and Bonn 323
advocating for agroecology, food sovereignty and fair trade organisations, which include livelihood and nutrition development or environmental protection in their objectives.
IFOAM – Organics International is acting in the “IFOAM Action Group”, a network that includes all ten self-organised regional bodies and seven sector platforms (see Figure 112). All of these structures carry “IFOAM” in their name, and they all commit to the so-called organic landmarks,1 which are the highest-level positions of IFOAM – Organics International (e.g., the principles of organic agriculture2 or the best practice guidelines). In 2018, the IFOAM Action Group is planning to develop a strategic plan for the network to support all of the above-mentioned trends and to mainstream organic 3.0 in all institutions of the organic movement.
Figure 112: The institutional context
1 IFOAM - Organics International (2017): Organic Landmarks. The IFOAM.bio website. IFOAM- Organics International, Bonn. Available at https://www.ifoam.bio/en/what-we-do/organic-landmarks 2 IFOAM - Organics International (2017): Principles of Organic Agriculture. The IFOAM.bio website. IFOAM- Organics International, Bonn. Available at https://www.ifoam.bio/en/organic-landmarks/principles-organic-agriculture.


FiBL & IFOAM – Organics International (2018): The World of Organic Agriculture. Frick and Bonn 325
Annex
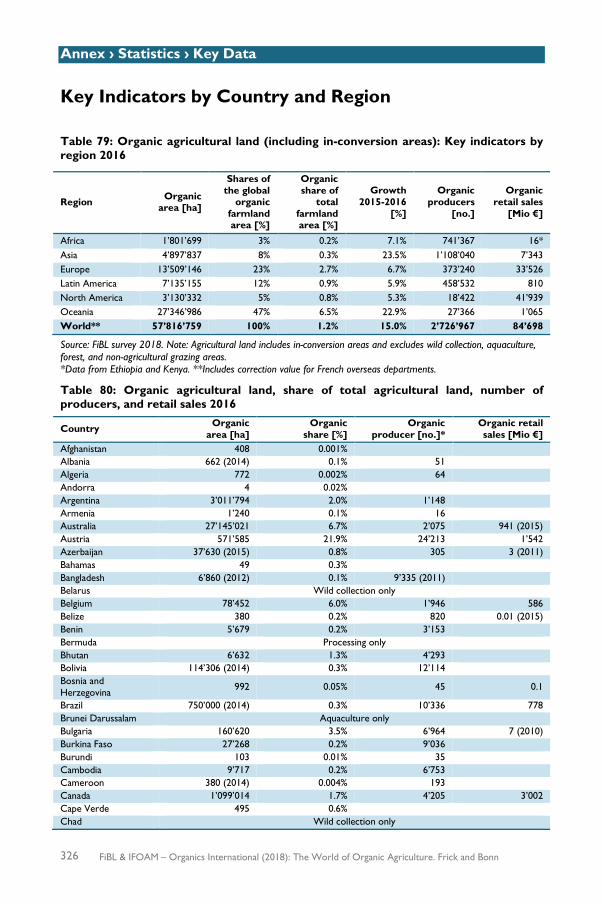
Annex › Statistics › Key Data
326 FiBL & IFOAM – Organics International (2018): The World of Organic Agriculture. Frick and Bonn
Key Indicators by Country and Region
Table 79: Organic agricultural land (including in-conversion areas): Key indicators by region 2016
Region Organic area [ha]
Shares of the global
organic farmland area [%]
Organic share of
total farmland area [%]
Growth 2015-2016
[%]
Organic producers
[no.]
Organic retail sales
[Mio €]
Africa 1’801’699 3% 0.2% 7.1% 741’367 16* Asia 4’897’837 8% 0.3% 23.5% 1’108’040 7’343 Europe 13’509’146 23% 2.7% 6.7% 373’240 33’526 Latin America 7’135’155 12% 0.9% 5.9% 458’532 810 North America 3’130’332 5% 0.8% 5.3% 18’422 41’939 Oceania 27’346’986 47% 6.5% 22.9% 27’366 1’065 World** 57’816’759 100% 1.2% 15.0% 2’726’967 84’698
Source: FiBL survey 2018. Note: Agricultural land includes in-conversion areas and excludes wild collection, aquaculture, forest, and non-agricultural grazing areas. *Data from Ethiopia and Kenya. **Includes correction value for French overseas departments.
Table 80: Organic agricultural land, share of total agricultural land, number of producers, and retail sales 2016
Country Organic area [ha]
Organic share [%]
Organic producer [no.]*
Organic retail sales [Mio €]
Afghanistan 408 0.001%
Albania 662 (2014) 0.1% 51
Algeria 772 0.002% 64
Andorra 4 0.02%
Argentina 3’011’794 2.0% 1’148
Armenia 1’240 0.1% 16
Australia 27’145’021 6.7% 2’075 941 (2015) Austria 571’585 21.9% 24’213 1’542 Azerbaijan 37’630 (2015) 0.8% 305 3 (2011) Bahamas 49 0.3%
Bangladesh 6’860 (2012) 0.1% 9’335 (2011)
Belarus Wild collection only Belgium 78’452 6.0% 1’946 586 Belize 380 0.2% 820 0.01 (2015) Benin 5’679 0.2% 3’153
Bermuda Processing only Bhutan 6’632 1.3% 4’293
Bolivia 114’306 (2014) 0.3% 12’114
Bosnia and Herzegovina 992 0.05% 45 0.1
Brazil 750’000 (2014) 0.3% 10’336 778 Brunei Darussalam Aquaculture only Bulgaria 160’620 3.5% 6’964 7 (2010) Burkina Faso 27’268 0.2% 9’036
Burundi 103 0.01% 35
Cambodia 9’717 0.2% 6’753
Cameroon 380 (2014) 0.004% 193
Canada 1’099’014 1.7% 4’205 3’002 Cape Verde 495 0.6%
Chad Wild collection only

Annex › Statistics › Key Data
FiBL & IFOAM – Organics International (2018): The World of Organic Agriculture. Frick and Bonn 327
Country Organic area [ha]
Organic share [%]
Organic producer [no.]*
Organic retail sales [Mio €]
Channel Islands 180 (2014) 1.9%
Chile 15’838 0.1% 446 2 (2009) China 2’281’215 0.4% 6’308 5’900 Colombia 31’621 (2014) 0.1% 4’775 (2011)
Comoros 2’577 1.9% 1’540
Congo, D.R. 94’386 0.4% 36’571
Cook Islands 10 0.7% 50
Costa Rica 7’908 0.4% 3’000 (2009) 1 (2008) Côte d’Ivoire 42’004 0.2% 494
Croatia 93’593 6.0% 3’546 99 (2014) Cuba 1’282 0.02% 508
Cyprus 5’550 5.1% 1’174 2 (2006) Czech Republic 488’591 11.5% 4’271 79 (2015) Denmark 201’476 7.7% 3’306 1’298 Dominica 240 (2011) 1.0%
Dominican Republic 205’258 8.7% 29’311
Ecuador 39’824 0.7% 12’483
Egypt 105’908 2.8% 970
El Salvador 1’426 0.1% 2’000
Estonia 180’852 18.9% 1’753
Ethiopia 186’155 (2015) 0.5% 203’602 13 (2015) Falkland Islands (Malvinas) 135’596 12.2% 5
Faroe Islands 253 8.4%
Fiji 13’347 3.1% 1’547
Finland 238’240 10.4% 4’493 273 France 1’538’047 5.5% 32’264 6’736 French Guiana (France) 3’051 10.0% 62
French Polynesia 14’229 31.3% 140
Georgia 1’452 (2015) 0.1% 1’075
Germany 1’251’320 7.5% 27’132 9’478 Ghana 21’326 0.1% 2’673
Greece 342’584 4.2% 20’197 60 (2010) Grenada (2010) 85 1.1% 3
Guadeloupe (France) 168 0.3% 37
Guatemala (2011) 13’380 0.4% 3’008
Guinea-Bissau 689 0.04%
Guyana Wild collection only Haiti 6’112 0.3% 1’210
Honduras 28’689 0.9% 5’686
Hong Kong Processing only Hungary 186’347 4.0% 3’414 30 (2015) Iceland 22’710 1.2% 28
India 1’490’000 0.8% 835’000 130 (2012) Indonesia 126’014 0.2% 5’810
Iran 18’871 0.04% 3’879
Iraq 60 0.001%
Ireland 76’701 1.5% 1’767 150 Israel (2015) 5’758 1.1% 303
Italy 1’796’363 14.5% 64’210 2’644 Jamaica 374 0.1% 127 1 Japan 9’956 0.2% 2’130 (2012) 1’000 (2009) Jordan 1’517 0.1% 19
Kazakhstan (2015) 303’381 (2015) 0.1% 29
Kenya 154’488 0.6% 37’295 3

Annex › Statistics › Key Data
328 FiBL & IFOAM – Organics International (2018): The World of Organic Agriculture. Frick and Bonn
Country Organic area [ha]
Organic share [%]
Organic producer [no.]*
Organic retail sales [Mio €]
Kiribati 1’600 4.7% 900
Kosovo (2015) 160 0.04% 100
Kuwait 20 0.01%
Kyrgyzstan 7’974 0.1% 1’427
Lao, P.D.R. 7’668 0.3% 1’342
Latvia 259’146 14.3% 4’145 4 (2011) Lebanon 1’079 0.2% 101
Lesotho (2015) 548 0.02% 4
Liechtenstein 1’383 37.7% 43 6 Lithuania 221’665 7.6% 2’539 6 (2011) Luxembourg 4’274 3.3% 93 108 Macedonia, FYROM 3’245 0.3% 509
Madagascar 60’023 0.1% 20’210
Malawi 12’239 0.2% 7
Malaysia (2013) 603 0.01% 119
Mali (2014) 11’919 0.03% 12’619
Malta 24 0.2% 14
Martinique (France) 297 0.9% 50
Mauritius 13 0.01% 22
Mexico 673’968 0.6% 210’000 14 (2013) Moldova 30’142 1.2% 114
Monaco Processing only Montenegro 3’470 1.5% 280 0.1 (2010) Morocco 10’000 0.03% 80
Mozambique 7’412 0.01% 3
Myanmar 4’568 0.04% 12
Namibia (2015) 30’127 0.1% 25
Nepal (2013) 9’361 0.2% 687
Netherlands 52’204 2.8% 1’557 1’171 New Caledonia 438 0.2% 94
New Zealand (2015) 74’134 0.7% 842 124 Nicaragua (2009) 33’621 0.7% 10’060
Niger 262 0.001%
Nigeria 52’421 0.1% 102
Niue 164 3.3% 51
Norway 47’621 4.8% 2’083 394 Oman 38 (2015) 0.003% 4 (2013)
Pakistan 45’299 0.1% 111
Palestine, State of 5’993 2.0% 1’553
Panama (2013) 15’183 0.7% 1’300
Papua New Guinea 15’632 1.3% 14’914
Paraguay (2015) 64’097 0.3% 58’258
Peru 323’578 1.3% 91’771 14 (2010) Philippines 198’309 1.6% 165’994
Poland 536’579 3.7% 22’435 167 (2015) Portugal 245’052 6.7% 4’313 21 (2011) Puerto Rico 14 0.01% 5
Republic of Korea 20’165 1.2% 12’896 281 (2015) Réunion (France) 881 1.8% 203
Romania 226’309 1.7% 10’083 80 (2011) Russian Federation 289’890 0.1% 55 120 (2012) Rwanda 1’284 0.1% 4’013 Samoa 63’393 22.4% 1’614
San Marino Processing only Sao Tome and Principe (2014) 6’706 13.8% 3’738

Annex › Statistics › Key Data
FiBL & IFOAM – Organics International (2018): The World of Organic Agriculture. Frick and Bonn 329
Country Organic area [ha]
Organic share [%]
Organic producer [no.]*
Organic retail sales [Mio €]
Saudi Arabia 17’212 0.01% 151
Senegal 7’172 0.1% 18’398
Serbia 14’358 0.4% 286
Sierra Leone 69’686 1.8% 1’400
Singapore Processing only Slovakia 187’024 9.9% 431 4 (2010) Slovenia 43’579 9.0% 3’513 49 (2013) Solomon Islands 5’723 5.3% 1’510
Somalia Wild collection only South Africa 14’196 0.01% 196
Spain 2’018’802 8.7% 36’207 1’686 Sri Lanka (2015) 96’318 3.5% 8’713
Sudan (2014) 130’000 0.2% 354
Suriname 39 0.04%
Swaziland 5 0.0004%
Sweden 552’695 18.0% 5’741 1’944 Switzerland 141’249 13.5% 6’348 2’298 Syrian Arab Republic 19’987 (2010) 0.1% 2’458 (2010)
Taiwan (2015) 6’490 0.8% 2’598
Tajikistan (2012) 12’659 0.3% 10’486
Tanzania 268’729 (2015) 0.7% 148’610 (2013)
Thailand 57’189 0.3% 15’670 12 (2014) Timor-Leste 28’259 7.4% 4
Togo 21’572 0.6% 9’934
Tonga 1’502 4.6% 1’146
Tunisia (2015) 181’076 1.8% 3’400
Turkey 523’777 1.4% 67’879 4 (2009) Uganda 262’282 1.8% 210’352
Ukraine 381’173 0.9% 294 21 United Arab Emirates 4’590 1.2% 92
United Kingdom 490’205 2.9% 3’402 2’460 United States 2’031’318 0.6% 14’217 38’938 US Virgin Islands 26 0.7%
Uruguay 1’656’952 11.5% 6
Uzbekistan Wild collection only Vanuatu 11’794 6.3% 2’483
Venezuela Processing only Viet Nam 53’348 0.5% 8’365 18 Zambia 7’738 0.03% 10’061
Zimbabwe 3’179 0.02% 2’006 0.01 World 57’816’759 1.2% 2’726’967 84’698
Source: FiBL survey 2018, based on data from governments, the private sector, and certifiers. For retail sales data: FiBL-AMI- survey 2018, based on data from government bodies, the private sector, and market research companies. For detailed data sources see annex, page 330 *Total number includes data for countries with less than three operators.

Annex › Data Providers and Data Sources
330 FiBL & IFOAM – Organics International (2018): The World of Organic Agriculture. Frick and Bonn
Data Providers and Data Sources
COMPILED BY JULIA LERNOUD1 AND HELGA WILLER2
Afghanistan Certifier data. Albania › Source for all data: Mediterranean
Organic Agriculture Network (MOAN), MOAN Secretariat Istituto Agronomico Mediterraneo di Bari (CIHEAM Bari), Bari, Italy
Algeria Source › Mediterranean Organic Agriculture
Network (MOAN), MOAN Secretariat Istituto Agronomico Mediterraneo di Bari (CIHEAM Bari), Bari, Italy
Andorra Source › Ecocert, 32600 L’Isle Jourdain, France Contact › Emma Tsessue, Ecocert, BO 47, 32600
L’Isle Jourdain, France, www.ecocert.com
Argentina Source › Land use/operator/production data:
SENASA, 2017 “Situación de la Producción Orgánica en la Argentina durante el año 2016". Buenos Aires. In addition, further data was provided by SENASA, www.senasa.gov.ar
› Export value data is from 2009. Contact › Juan Carlos Ramirez and Diego Pinasco,
SENASA, Buenos Aires, Argentina, www.senasa.gov.ar
Armenia Source
1 Julia Lernoud, Research Institute of Organic Agriculture (FiBL), Frick, Switzerland, www.fibl.org 2 Dr. Helga Willer, Research Institute of Organic Agriculture (FiBL), Frick, Switzerland, www.fibl.org
› Survey of Ecoglobe - Organic control and certification body, 375033 Yerevan, Republic of Armenia www.ecoglobe.am.
Contact › Nune Darbinyan, Ecoglobe - Organic
control and certification body, 375033 Yerevan, Republic of Armenia www.ecoglobe.am.
› Eliza Petrosyan, Ecoglobe - Organic control and certification body, 375033 Yerevan, Republic of Armenia
Australia Source › Australian Organic (2017): Market
Report 2017. Australian Organic, Nundah
› Retail sales data is from 2015 Contact › Andrew Monk, Chairman, Australian
Organic, Nundah, Australia, www.austorganic.com
› Andrew Lawson, University of New England, Armidale, Australia
Austria Sources › Area, land use and farms:
Bundesministerium für Land- und Forstwirtschaft, Umwelt und Wasserwirtschaft, Vienna, Austria, and Eurostat Luxembourg
› Retail sales: RollAMA based on GfK, AMA-Marketing, Agrarmarkt Austria Marketing GesmbH, Vienna, Austria
› Export data are from 2011 and were compiled by the Organic Retailers Association (ORA).
Contact › Otto Hofer, Federal Ministry of
Agriculture, Forestry, Environment and Water Management (AT), Vienna, Austria
› Barbara Köcher-Schulz, AMA-Marketing GesmbH AMA, Vienna, Austria
› Pia Reindl, AMA-Marketing GesmbH AMA, Vienna, Austria
Azerbaijan Source › Experimental and Resource Center
affiliated to the Azerbaijan Botanic Center, Ganja, Azerbaijan, www.etkt.az. The data is from 2015.
Contact

Annex › Data Providers and Data Sources
FiBL & IFOAM – Organics International (2018): The World of Organic Agriculture. Frick and Bonn 331
› Nick Nwolisa; Experimental and Resource Center affiliated to the Azerbaijan Botanic Center, Ganja, Azerbaijan, www.etkt.az
Bahamas › Certifier data. Bangladesh Source › Horticulture Export Development
Foundation, Dhaka, Bangladesh, www.hortex.org. For the crops, some data from an international certifier were included. The data is from 2012.
Belarus Source › Certifier data (wild collection only).
Products include among others blueberries, cranberries, and mushrooms.
Belgium Sources › Area and operator data: Landbouw en
Visserij, Brussels, Belgium › Livestock data: Eurostat database,
Eurostat, Luxembourg › Retail sales: Landbouw en Visserij,
Brussels, Belgium › Organic share of all retail sales.
Biowallonie (2017): Les Chiffres du Bio 2016. Biowallonie, Namur, Belgium. https://www.biowallonie.com/wp-content/uploads/2017/06/Le-bio-en-chiffre-2016-1.pdf
Contact › Jonathan Platteau, Landbouw en
Visserij, Brussels, Belgium Belize Source › Survey among the certified companies in
Belize. Contact › Estevan Assi Jr, Toledo Cacao Growers
Association, Belize Benin Source › Survey among certifiers Contact › Laurent C. Glin, FiBL Terrain,
SYPROBIO-CRRA, Sikasso, République du Mali
Bermuda Source › Certifier data.
Bhutan Source › Ministry of Agriculture (MOA), National
Organic Programme DOA, Thimphu, Bhutan, www.moa.gov.bt
Contact › Kesang Tshomo, Ministry of Agriculture
MOA, National Organic Programme DOA, Thimphu, Bhutan, www.moa.gov.bt.
› Tshering Zam, Ministry of Agriculture MOA, National Organic Programme DOA, Thimphu, Bhutan, www.moa.gov.bt.
Bolivia Source › Survey of the Bolivian Association of
Organic Producers Organisations – AOPEB. The data is from 2014.
Contact › Edmundo Janco Mita, Asociación de
Organizaciones de Productores Ecológicos de Bolivia AOPEB, Bolivia
Bosnia Herzegovina Source › Organska Kontrola, Sarajevo, Bosnia &
Herzegovina Contact › Bernisa Klepo, Organska Kontrola,
Sarajevo, Bosnia & Herzegovina › Mersida Musabegović, Organska
Kontrola, Sarajevo, Bosnia and Herzegovina
Brazil Sources › Area data: Ministério da Agricultura,
Pecuária e Abastecimento, Ministry of Agriculture website. Available at http://www.agricultura.gov.br/comunicacao/noticias/2015/03/numero-de-produtores-organicos-cresce-51porcento-em-um-ano
› Operator data: certifiers data › Retail sales data: Organic Brazil Contacts › Ming Liu, Organic Brasil, Brazil Brunei Darussalam Source › Ecocert China, Beijing, China Contact › Lisha Zheng, Ecocert China, Beijing,
China

Annex › Data Providers and Data Sources
332 FiBL & IFOAM – Organics International (2018): The World of Organic Agriculture. Frick and Bonn
Bulgaria Sources › Land area, operators: Eurostat,
Luxembourg/Ministry of Agriculture, Bulgaria
› Domestic market data (from 2010): Bioselena, Karlovo, Bulgaria. www.bioselena.com
› Wild collection data; Bioselena, Karlovo, Bulgaria and Ministry of Agriculture, Bulgaria
› In addition to the agricultural land and wild collection areas, 900 hectares of Damask roses (Rosa damascena) were grown in 2016
Contact › Dr. Stoilko Apostolov, FOA Bioselena,
Karlovo, Bulgaria. www.bioselena.com Burkina Faso Sources The data were compiled by FiBL based on the data of the following international certifiers. › CERTISYS, B-1150 Bruxelles, Belgium,
www.certisys.eu. › Ecocert West Africa, Ougadougou,
Burkina Faso › LACON GmbH, Moltkestraße 4, 77654
Offenburg, Germany (2012 data) Not all certifiers provided updated data. Contact › Nathalie Boes, CERTISYS, B-1150
Bruxelles, Belgium, www.certisys.eu. › Aziz Yanogo, Ecocert West Africa,
Ougadougou, Burkina Faso Note A direct year-to-year comparison over the years is not possible as not all certifiers provided updates every year. Burundi Source › Ecocert East Africa, Madagascar Contact › Sandra Randrianarisoa, Ecocert S.A.,
Villa Arimanantsoa, Madagascar, www.ecocert.com.
Cambodia Source › The data is based on a survey among
organic certifiers and organisations of the organic sector in Cambodia.
› GIZ Cambodia, ASEAN Sustainable Agrifood Systems, Phnom Penh, Cambodia; www.asean-agrifood.org
› Cambodian Organic Agriculture Association (COrAA), Khan Chamkar Morn, Phnom Penh, Cambodia, www.coraa.org.
Contact › Claudius Bredehoeft, GIZ Cambodia,
ASEAN Sustainable Agrifood Systems, Phnom Penh, Cambodia; www.asean-agrifood.org
› Channa Samorn, GIZ Cambodia, ASEAN Sustainable Agrifood Systems, Phnom Penh, Cambodia; www.asean-agrifood.org
Cameroon Source › Ecocert West Africa, Ougadougou,
Burkina Faso, www.ecocert.com Ecocert, BP 47, 32600 L’Isle Jourdain, France, www.ecocert.com. The data is from 2014.
Contact › Aziz Yanogo, Ecocert West Africa,
Ougadougou, Burkina Faso, www.ecocert.com
Canada Source › Land area, producers and other operator
types, market data: Survey of the Canada Organic Trade Association (COTA), Ottawa, Canada, based on information of the certifiers.
Contact › Jill Guerra, Canada Organic Trade
Association (COTA), Ottawa, Canada, http://ota.com/otacanada.html
Note See also article about organic farming in Canada in this and in previous editions of “The World of Organic Agriculture.” Cape Verde Source › Certifier data. Chad Source › Certifier data. Channel Islands Source › FAOSTAT (2016) Organic area data
Channel Islands. The FAOSTAT website, FAOSTAT, Rome, Italy, FAOSTAT > Agri-Environmental Indicators> Inputs. The data is from 2014.

Annex › Data Providers and Data Sources
FiBL & IFOAM – Organics International (2018): The World of Organic Agriculture. Frick and Bonn 333
Chile Source › Certified areas, producers/ smallholders,
livestock and export data: Servicio Agrícola y Ganadero (SAG) Santiago, Chile, www.sag.gob.cl.
› Domestic market data (2009) according to USDA: Organic Products Report Chile. GAIN Report Number CI0031. November 30, 2010
Contact › Pilar M. Eguillor Recabarren, Oficina de
Estudios y Políticas Agrarias (ODEPA), Ministerio de Agricultura, Teatinos 40, Santiago, Chile, www.odepa.gob.cl.
China Sources › Land area, operators, market and export
data; Chinese Agricultural University, Beijing, China
Contact › Dr. Wang Maohua, Certification and
Accreditation Administration of the People’s Republic of China CNCA
› Yuhui Qiao, Chinese Agricultural University, Beijing, China
› Zejiang Zhou, President, Board of IFOAM Asia, China
Colombia Source › ECONEXOS, Conexion Ecologica, Calle
5 No. 45A-125, Cali, Colombia, [email protected], www.econexos.com, based on a survey among the certifiers. The data is from 2015.
Contact › Carlos Escobar, ECONEXOS - Desarrollo
en Movimiento, Cali República de Colombia, www.econexos.com.
Comoros Source › Ecocert, BO 47, 32600 L’Isle Jourdain,
France, www.ecocert.com. Contact › Sandra Randrianarisoa, Ecocert S.A.,
Villa Arimanantsoa, Madagascar, www.ecocert.com.
Congo, Democratic Republic of Source › Certifier data.
Cook Islands Source › Pacific Organic and Ethical Trade
Community (POETCom), Suva Fiji, www.spc.int.
Contact › Karen Mapusua, Secretariat of the Pacific
Community (SPC), Private Mail Bag, Suva Fiji, www.spc.int
Costa Rica Source › Land area, operators and export volume
data: Servicio Fitosanitario del Estado (2017): Programas Especiales/ Agricultura Orgánica. Estadísticas 2016. M.A.G Costa Rica, San José.
› Export value (2009 data) PROMOCER (2011): Costa Rica: exportaciones de productos orgánicos según destino.
› Domestic market data (2008) were provided by the organic sector organization MAOCO.
Contact › Roberto Azofeifa, Ministerio de
Agricultura y Ganadería, 10094-1000 San José, Costa Rica.
Côte d’Ivoire Sources The data were compiled by FiBL based on the data of the following international certifiers. › BCS, Nürnberg, Germany, www.bcs-
oeko.de › CERTISYS, B-1150 Bruxelles, Belgium › Control Union, Zwolle, The
Netherlands, www.controlunion.org › Ecocert West Africa, Ougadougou,
Burkina Faso, www.ecocert.com Not all certifiers provided updated data. Contact › Nathalie Boes, CERTISYS, B-1150
Bruxelles, Belgium, www.certisys.eu. › Tobias Fischer, BCS, Nürnberg,
Germany, www.bcs-oeko.de; › Daniel Szalai, Control Union, Zwolle,
The Netherlands, www.controlunion.org › Aziz Yanogo, Ecocert West Africa,
Ougadougou, Burkina Faso, www.ecocert.com
Note A direct year-to-year comparison over the years is not possible as not all certifiers provided updates every year.

Annex › Data Providers and Data Sources
334 FiBL & IFOAM – Organics International (2018): The World of Organic Agriculture. Frick and Bonn
Croatia Sources › Area and operators: Eurostat database
organic farming, Eurostat, Luxembourg › Wild collection data (from 2013):
Mediterranean Organic Agriculture Network (MOAN), MOAN Secretariat Istituto Agronomico Mediterraneo di Bari (CIHEAM Bari), Bari, Italy
› Market (from 2014) & export data (from 2011): Darko Znaor, Independent Consultant, 10000 Zagreb, Croatia
Contact › Darko Znaor, Independent Consultant,
10000 Zagreb, Croatia Cuba › Certifier data. Cyprus Source › Land area and producer data: Eurostat,
Luxembourg › Market data (from 2006): Organic
Retailers Association, Ecozept and Biovista (eds.) (2008): Specialised Organic Retail Report 2008. Freising and Vienna 2008
Czech Republic Source › Area and operator data: Eurostat
database, Eurostat, Luxembourg › Market and international trade data:
Institute of Agricultural Economics and Information (UZEI), Department of Agri-environmental Policy, 602 00 Brno, Czech Republic. The market and international trade data are from 2015.
Contact › Hana Šejnohová, Institute of
Agricultural Economics and Information (UZEI), Department of Agri-environmental Policy, 602 00 Brno, Czech Republic
› Andrea Hrabalova, Institute of Agricultural Economics and Information (UZEI), 602 00 Brno, Czech Republic
Denmark Sources › Land area, land use, Operators: Eurostat
database, Eurostat, Luxembourg › Domestic sales: Landbrug & Fødevarer.
Based on data from Statistics Denmark (retail sales) and Organic Denmark (for other marketing channels)
› Exports, imports: Statistics Denmark › Other marketing channels: Organic
Denmark. Data compiled by Danish Agriculture & Food Council, Agro Food Park 15, 8200 Aarhus
Contact › Martin Lundoe, Statistics Denmark,
Copenhagen, www.statbank.dk › Ejvind Pedersen, Danish Agriculture &
Food Council, Agro Food Park 13, 8200 Aarhus N, Denmark
Dominica Source › Division of Agriculture provided by
Dominica Organic Agriculture Movement (DOAM) Inc., PO Box 1953 - Roseau, Commonwealth of Dominica. The data is from 2014
Contact › Ms. Aikuali Joseph, Dominica Organic
Agriculture Movement (DOAM) Inc., Roseau, Commonwealth of Dominica.
Dominican Republic Source › Secretaria de Estado de Agricultura,
Oficina de Control Orgánico, Santa Domingo, Dominican Republic, www.agricultura.gob.do.
Contact › José A. Zapata, Secretaria de Estado de
Agricultura, Oficina de Control Orgánico, Santa Domingo, Dominican Republic, www.agricultura.gob.do.
Ecuador Source › Land area, operators, exports:
Agrocalidad, Quito Ecuador, www.agrocalidad.gob.ec. The crop data is from 2014 and the aquaculture data is from 2012.
Contact › Paulina Betancourt, Agrocalidad, Quito,
Ecuador › Omar Pavón, Agrocalidad, Quito,
Ecuador Egypt Source › Mediterranean Organic Agriculture
Network (MOAN), MOAN Secretariat Istituto Agronomico Mediterraneo di Bari (CIHEAM Bari), Bari, Italy

Annex › Data Providers and Data Sources
FiBL & IFOAM – Organics International (2018): The World of Organic Agriculture. Frick and Bonn 335
El Salvador Source › Ministerio de Agricultura y Ganadería,
Final 1a. Avenida Norte, 13 Calle Poniente y Avenida Manuel, Gallardo, Santa Tecla, El Salvador
Contact › Jose Fernando Maldonado Cestona,
Coordinador Area de Inocuidad de Alimentos y Agricultura Orgánica Ministerio de Agricultura y Ganadería Dirección General de Sanidad Vegetal, El Salvador
Estonia Sources › Land area, land use, operators: Eurostat
database, Eurostat, Luxembourg › Market data was not available › A detailed report about organic farming
in Estonia can be found at http://www.maheklubi.ee/upload/Editor/mahe_eestis_2016.pdf
Contact › Merit Mikk, Centre of Ecological
Engineering, Tartu, Estonia Ethiopia Source › Ethiopian Institute of Agricultural
Research, Akaki, Ethiopia. The data is from 2015.
Contact › Addisu Alemayeh, Ethiopian Institute of
Agricultural Research, Akaki, Ethiopia Falkland Islands Source › Department of Agriculture, Bypass
Road, Stanley, Falkland Islands, www.agriculture.gov.fk. Data on export is from 2013.
Contact › Lucy Ellis, Department of Agriculture,
Bypass Road, Stanley, Falkland Islands, www.agriculture.gov.fk
Faroe Islands Source › Vottunarstofan Tún ehf, Laugavegur 7,
101 Reykjavík, Iceland, www.tun.is. Contact › Gunnar Gunnarsson, Vottunarstofan
Tún ehf., Reykjavík, Iceland, www.tun.is › Rannveig Guðleifsdóttir, Vottunarstofan
Tún ehf., Reykjavík, Iceland, www.tun.is
Fiji Islands Sources › Pacific Organic and Ethical Trade
Community (POETCom), Suva Fiji, www.spc.int
Contact › Karen Mapusua, Pacific Organic and
Ethical Trade Community (POETCom), Suva, Fiji
Finland Sources › Land area and operators: Eurostat
database, Eurostat, Luxembourg. › Wild collection provided Pro Luomu,
Kauniainen, Finland; › Market data: Pro Luomu, Kauniainen,
Finland › Export data (2015): Pro Luomu,
Kauniainen, Finland › Beehives (2015): Eurostat database,
Eurostat, Luxembourg Contact › Marja-Riitta Kottila, Pro Luomu,
Kauniainen, Finland › Minna Nurro, Pro Luomu, Kauniainen,
Finland France Source › Area and operators: Agence Bio,
Montreuil-sur-Bois, France. www.agencebio.org, and Eurostat database, Eurostat Luxembourg
› Retail sales: Agence Bio, Montreuil-sur-Bois, France
› Export and import data: Agence Bio, Montreuil-sur-Bois, France
Contact › Nathalie Rison, Agence Bio, Montreuil-
sous-Bois, France, www.agencebio.fr French Guyana Source › Agence BIO: The Agence Bio website,
Agence Bio, 93100 Montreuil-sous-Bois, France. Available at http://www.agencebio.org/la-bio-dans-les-regions
Contact › Nathalie Rison, Agence Bio, Montreuil
sous Bois, France, www.agencebio.fr

Annex › Data Providers and Data Sources
336 FiBL & IFOAM – Organics International (2018): The World of Organic Agriculture. Frick and Bonn
French Polynesia Sources › Pacific Organic and Ethical Trade
Community (POETCom), Suva Fiji, www.spc.int.
Contact › Karen Mapusua, Secretariat of the Pacific
Community (SPC), Private Mail Bag, Suva Fiji, www.spc.int
Gambia Data for Gambia have not been supplied since 2007 by any of the certification bodies. Any information on certified organic farming in Gambia should be sent to Julia Lernoud or Helga Willer at [email protected] and [email protected]. Georgia Source › Elkana Survey, Elkana, 16 Gazapkhuli
street, 0177 Tbilisi, Georgia, www.elkana.org.ge.
Contact › Elene Shatberashvili, Biological Farming
Association Elkana, 16 Gazapkhuli street, 0177 Tbilisi, Georgia, www.elkana.org.ge
Germany Sources › Agrarmarkt Informations-Gesellschaft
mbH (AMI), Bonn, Germany, www.ami-informiert.de.
› Retail sales: Arbeitskreis Biomarkt (Working group organic market), coordinated by AMI based on data of GfK, Nielsen, bioVista und Klaus Braun Kommunikationsberatung.
Contact › Diana Schaack, Agrarmarkt
Informations-Gesellschaft mbH (AMI), Bonn, Germany, www.ami-informiert.de
Ghana Source The data was compiled by FiBL based on the data of the following international certifiers. › BCS, Nürnberg, Germany, www.bcs-
oeko.de; › CERTISYS, Brussels, www.certisys.eu › Control Union, Zwolle, The
Netherlands, www.controlunion.org › Ecocert West Africa, Ougadougou,
Burkina Faso › IMO, Weinfelden, Switzerland,
www.imo.ch
Contact › Ruben Cortes, IMO, Weinfelden,
Switzerland › Tobias Fischer, BCS, Nürnberg,
Germany, www.bcs-oeko.de › Nathalie Boes, CERTISYS, Brussels,
Belgium › Daniel Szalai, Control Union, Zwolle,
The Netherlands › Aziz Yanogo, Ecocert West Africa,
Ougadougou, Burkina Faso, www.ecocert.com
Note A direct year-to-year comparison over the years is not possible as not all certifiers provided updates every year. Greece Sources › Land area and operators: Eurostat
database, Eurostat, Luxembourg. › Market data (from 2010) were provided
by Nicolette van der Smissen, Feres, Greece
› Wild collection data (2015) Mediterranean Organic Agriculture Network (MOAN), MOAN Secretariat Istituto Agronomico Mediterraneo di Bari (CIHEAM Bari), Bari, Italy
Contact › Nicolette van der Smissen, Feres, Greece Grenada › Data from one international certifier
(data from 2010). Guadeloupe Source › Agence BIO: The Agence Bio homepage
93100 Montreuil-sous-Bois, France. Available at http://www.agencebio.org/la-bio-dans-les-regions
Contact › Nathalie Rison, Agence Bio, Montreuil-
sous-Bois, France, www.agencebio.fr Guatemala Source › Department of Organic Agriculture,
Ministerio de Agricultura, Ganaderia y Alimentación (MAGA), Ciudad de Guatemala, Guatemala C.A. 01013, http://www2.maga.gob.gt. The data is from 2011.

Annex › Data Providers and Data Sources
FiBL & IFOAM – Organics International (2018): The World of Organic Agriculture. Frick and Bonn 337
Contact › Ing. Agr. Alvaro Alfredo Ramos
Méndez, Departamento de Agricultura Orgánica, Viceministerio de Sanidad Agropecuaria y Regulaciones, Ministerio de Agricultura Ganadería y Alimentación
Guinea Bissau › Certifier data. Guyana Source › Ecocert Colombia, Bogota D.C.,
Colombia (wild collection only). Contact › Richard Escobar, Henao, Ecocert
Colombia, Bogota D.C, Colombia. Haiti Source › Ecocert, BO 47, 32600 L’Isle Jourdain,
France, www.ecocert.com Contact › Eva Berre, Ecocert, BO 47, 32600 L’Isle
Jourdain, France, www.ecocert.com Honduras Source › Agricultura Orgánica Honduras,
Secretaria de Agricultura y Ganadería, Tegucigalpa, Honduras, SENASA Honduras.
Contact › Carlos Galo, Jefe del Departamento de
Agricultura Orgánica (DAO) Sub Dirección de Sanidad Vegetal (SAVE). Servicio Nacional de Sanidad Vegetal (SENASA) Secretaría de Agricultura y Ganadería (SAG) Edificio Senasa Boulevard Centroamérica, Ave. La FAO, antes de INJUPEMH, Tegucigalpa. M.D.C. Honduras.
Hong Kong › Certifier data. Hungary Sources › Land area: Eurostat database organic
farming, Eurostat, Luxembourg › Operators: National Food Chain Safety
Office, Budapest, Hungary, www.nebih.gov.hu
› Market and trade data (2015): Survey/Estimate by Ferenc Frühwald, Budapest, Hungary
Contact › Dora Drexler, ÖMKI, Budapest,
Hungary, www.biokutats.hu
Iceland Source › Vottunarstofan Tún ehf., Laugavegur 7,
101 Reykjavík, Iceland, www.tun.is. Contact › Gunnar Gunnarsson, Vottunarstofan
Tún ehf., Laugavegur 7, 101 Reykjavík, Iceland, www.tun.is
› Rannveig Guðleifsdóttir, Vottunarstofan Tún ehf., Reykjavík, Iceland, www.tun.is
India Source › Land area, operators, exports:
Agricultural and Processed Food Products Export Development (APEDA) Ministry of Commerce & Industry, Government of India, New Delhi - 110 016, India, www.apeda.com. The retail sales data is from 2012.
Contact › Manoj Kumar Menon, International
Competence Centre for Organic Agriculture ICCOA, Bangalore, India
Indonesia Source › Indonesian Organic Alliance, Bangor,
Indonesia (www.organicindonesia.org). Survey among the certifiers active in the country.
Contact › Lidya Ariesusanty, Indonesia Organic
Alliance, Indonesia, www.organicindonesia.org
Iran Source › Environmental Sciences Research
Institute, Shahid Beheshti University ESRI, Evin, Tehran, Iran. The information is based on the data of the certifiers active in the country.
Contact › Hossein Mahmoudi, Environmental
Sciences Research Institute, Shahid Beheshti University ESRI, Tehran, Iran
Iraq Source › Zakho Small Villages Projects (ZSVP),
Dohuk City, Dohuk, Iraq Contact › Dr. Abid Ali Hasan, Zakho Small
Villages Projects (ZSVP), Program Coordinator in Iraq, Dohuk City, Dohuk, Iraq
Annex › Data Providers and Data Sources
338 FiBL & IFOAM – Organics International (2018): The World of Organic Agriculture. Frick and Bonn
Ireland Source › Area, operators and livestock data:
Eurostat, Luxembourg › Market data: Bord Bia, Dublin, Ireland Contact › Philipp Cullen, Department of
Agriculture Fisheries and Food, Johnstown Castle Estate, Co. Wexford, Ireland www.agriculture.gov.ie.
› Lorcan Burke, Bord Bia, Dublin, Ireland Israel Source › Standardization and Accreditation
Department Ministry of Agriculture and Rural Development Plant Protection and Inspection Services (PPIS), Israel, www.ppiseng.moag.gov.il/ppiseng/ISRAEL The data is from 2015.
Contact › Brett Hickson, Senior Chief Officer,
Standardization and Accreditation Department, Ministry of Agriculture and Rural Development, Plant Protection and Inspection Services (PPIS), Israel
Italy Sources › Operator, primary crops, livestock
products, imports: Eurostat database, Eurostat, Luxembourg and SINAB, Rome, Italy
› Market: Assobio based on FederBio, Nielsen, Nomisma, and Sana Observatory.
Contact › Roberto Pinton, ASSOBIO, 35121
Padova, Italy › Silvia Zucconi, Nomisma, Bologna, Italy Jamaica Source › Jamaica Organic Movement JOAM, P.O.
Box 5728, Kingston 6, Jamaica, www.joamltd.org
Contact › Trevor Brown, Jamaica Organic
Movement JOAM, www.joamltd.org Japan Source › Area and producer data: Ministry of
Agriculture, Forestry and Fisheries (MAFF), Tokyo 100 - 8950, Japan, www.maff.go.jp/e/index.html. The producer data is from 2012
› Domestic market data (from 2009): Heinz Kuhlmann, ABC Enterprises, Tokyo, Japan
Contact › Heinz Kuhlmann, ABC Enterprises,
Tokyo, Japan Jordan Source › Mediterranean Organic Agriculture
Network (MOAN), MOAN Secretariat Istituto Agronomico Mediterraneo di Bari (CIHEAM Bari), Bari, Italy
Kazakhstan Source › V.V. Grigoruk and Е.V. Klimov (2016):
Developing Organic Agriculture in Kazakhstan. FAO, Ankara. Report provided by Evgeny Klimov, Kazakhstan federation of organic agriculture movements - KAZFOAM, Kazakhstan. The data is from 2015.
Contact › Evgeniy Klimov, Kazakhstan federation
of organic agriculture movements - KAZFOAM, Kazakhstan, www.organiccenter.kz
Kenya Source › Kenya Organic Movement (KOAN),
Nairobi, Kenya, www.koan.co.ke. Contact › Jack Juma, Kenya Organic Movement
(KOAN), Nairobi, Kenya, www.koan.co.ke
Kiribati Sources › Pacific Organic and Ethical Trade
Community (POETCom), Suva Fiji, www.spc.int
Contact › Karen Mapusua, Secretariat of the Pacific
Community (SPC), Private Mail Bag, Suva Fiji, www.spc.int
Korea, Republic of Source › Korea Rural Economic Institute (KREI),
Republic of Korea. Contact › Jennifer Chang, Korean Federation of
Organic Agriculture Organisations (KFSA), Republic of Korea

Annex › Data Providers and Data Sources
FiBL & IFOAM – Organics International (2018): The World of Organic Agriculture. Frick and Bonn 339
Kosovo Source › Initiative for agricultural development of
Kosovo (IADK), Mitrovica, Republic of Kosovo. Data is from 2015.
Contact › Syle Sylanaj, Faculty of Agriculture &
Veterinary-Department of Pomology, University of Prishtina, Republic of Kosovo
Kuwait Source › Ecocert, BO 47, 32600 L’Isle Jourdain,
France, www.ecocert.com Contact › Tovohery Ramahaimandimbisoa,
Ecocert, BO 47, 32600 L’Isle Jourdain, France, www.ecocert.com
Kyrgyzstan Source › Agricultural Commodity and Service
Cooperative "Bio Farmer", Kyrgyzstan. To this data, the data of one international certifier was added.
Contact › Gulzaada Aleshova, Helvetas, Jalalabad,
Kyrgyzstan Lao People’s Democratic Republic Source › Department of Agriculture (DOA), PO
BOX 811, Vientiane, Laos. Contact › Thavisith Bounyasouk, Department of
Agriculture (DOA), PO BOX 811, Vientiane, Laos
Latvia Source › Area and Operators: Eurostat database,
Eurostat, Luxembourg › Market data (from 2011): Ekoconnect,
Dresden, Germany and AMI, Bonn, Germany
Contact › Livija Zarina, State Priekuli Plant
Breeding Institute SPPBI, Priekuli, Cesis distr, Latvia
Lebanon Source › Source: Mediterranean Organic
Agriculture Network (MOAN), MOAN Secretariat Istituto Agronomico Mediterraneo di Bari (CIHEAM Bari), Bari, Italy
Lesotho › Certifier data Liechtenstein Source › Klaus Büchel Anstalt, Institute of
Agriculture and Environment, 9493 Mauren, Liechtenstein, www.kba.li.
Contact › Florian Bernardi and Klaus Büchel,
Institute of Agriculture and Environment, 9493 Mauren, Liechtenstein, www.kba.li.
Lithuania Source › Land area, production volume,
operators: Eurostat database, Eurostat, Luxembourg
› Domestic Market data (from 2011): Ekoconnect, Dresden, Germany and AMI, Bonn, Germany
Contact › Virgilijus Skulskis, Lithuanian Institute
of Agri Economics, Vilnius, Lithuania Luxembourg Source › Land area and operator data Eurostat
database, Eurostat, Luxembourg › Market data: Oekopolis estimate based
on turnover data of the specialized shops and supermarkets, Oikopolis, Munsbach, Luxembourg
Contact › Claudine Gengler, Ministère de
l’Agriculture, de la Viticulture et de la Protection des consommateurs, Luxembourg, www.asta.etat.lu
› Aender Schanck, Biogros, 13 Parc d’Activité Syrdall, L-5365 Munsbach, www.biogros.lu
Macedonia, the Former Yugoslav Republic Source › Area and operators Eurostat database,
Eurostat, Luxembourg › Wild collection: Certifier data Madagascar › Certifier data. Malawi Source › Certifier data Malaysia Source › Department of Agriculture, Malaysia.
The data is from 2013.

Annex › Data Providers and Data Sources
340 FiBL & IFOAM – Organics International (2018): The World of Organic Agriculture. Frick and Bonn
Contact › Ong Kung Wai, Humus Consultancy,
Penang, Malaysia Mali › Ecocert West Africa, Ougadougou,
Burkina Faso, www.ecocert.com. The data is from 2014.
Contact › Aziz Yanogo, Ecocert West Africa,
Ougadougou, Burkina Faso, www.ecocert.com
Malta › Source: Eurostat, Luxemburg Martinique (France) Source › Agence Bio, Montreuil sous Bois, France.
Available at: http://www.agencebio.org/la-bio-dans-les-regions
Contact › Nathalie Rison, Agence Bio, Montreuil
sous Bois, France, www.agencebio.fr Mauritius Source › Ecocert S.A., Villa Arimanantsoa,
Madagascar, www.ecocert.com. Contact › Sandra Randrianarisoa, Ecocert S.A.,
Villa Arimanantsoa, Madagascar, www.ecocert.com
Mexico Source › Universidad Autónoma Chapingo,
based on data of the certifiers. Contact › Rita Schwentesius, Universidad
Autónoma Chapingo, Carretera México - Texcoco Km. 38.5. Chapingo, México
Moldova Source › Ministry of Agriculture, Regional
Development and Environment of Moldova, Department for Organic Production and Products of Origin, Chişinău, Moldova. Data are based on information from control bodies.
Contact › Marcela Stahil, Chief of the Department
for Organic Production and Products of Origin, Ministry of Agriculture, Regional Development and Environment of Moldova, Chişinău, Moldova
Comment It should be noted that not all international control bodies that are active in the country provide data. Therefore, it may be assumed that the organic farmland is actually larger. Monaco › Certifier data. Mongolia The certifier who provided data in the past did not report any activities any more. Any information on certified organic farming in Mongolia should be sent to Julia Lernoud or Helga Willer at [email protected] and [email protected]. Montenegro Source › Ministry of Agriculture and Rural
Development, Podgorica, Montenegro › Market data (from 2010): Ecozept -
Market research and marketing consulting agency. Freising, Germany
Contact › Andrijana Rakočević, Advisor for
Organic production, Ministry of Agriculture and Rural Development, Podgorica, Montenegro
Morocco Sources › Area for agricultural land, production,
beehives, total wild collection area: Mediterranean Organic Agriculture Network (MOAN), MOAN Secretariat Istituto Agronomico Mediterraneo di Bari (CIHEAM Bari), Bari, Italy
› Breakdown of wild collection area, livestock numbers, operators, production and export data: AMABIO, Casa Blanca, Morocco, www.amabio.org
Contact › Zaoui Elhousseine, AMABIO/FIMABIO,
Casa Blanca, Morocco, www.amabio.org Mozambique Sources › BCS, Nürnberg, Germany › Control Union, Zwolle, The Netherlands › Ecocert, South Africa, Capetown, South
Africa Contact › Tobias Fischer, BCS, Nürnberg,
Germany › Cliflyn McKenzie, Ecocert South Africa,
Capetown, South Africa

Annex › Data Providers and Data Sources
FiBL & IFOAM – Organics International (2018): The World of Organic Agriculture. Frick and Bonn 341
› Daniel Szalai, Control Union, Zwolle, The Netherlands
Myanmar Source › Certifier data Contact › San Linn, Myanmar Organic Agriculture
Group, Yangon, Myanmar Namibia Source › Namibian Organic Association, PO Box
1504, Okahandja, Namibia, the data of one international certifier was included, and PGS figures were included. Data from 2015.
Contact › Manjo Smith, Namibian Organic
Association (NOA), PO Box 1504, Okahandja, Namibia
Nepal Source › The data were provided by Maheswar
Ghimire, Kathmandu, Nepal. The data is from 2013.
Contact › Maheswar Ghimire, Kathmandu, Nepal Netherlands Sources › Land area and operator data: Eurostat
database, Eurostat, Luxembourg. › Retail sales and exports data: Bionext,
Zeist, The Netherlands; the Bionext website, available at https://bionext.nl/feiten-cijfers
Contact › Bavo van der Idsert, Bionext, Utrecht,
The Netherlands. New Caledonia Source › Pacific Organic and Ethical Trade
Community (POETCom), Suva Fiji, www.spc.int;
Contact › Karen Mapusua, Secretariat of the Pacific
Community (SPC), Private Mail Bag, Suva Fiji, www.spc.int
New Zealand Source › The AgriBusiness Group, Christchurch,
New Zealand, www.agribusinessgroup.com. The data is from 2015.
Contact › Jon Manhire, the AgriBusiness Group,
Christchurch, New Zealand, www.agribusinessgroup.com
Nicaragua Source › Ministerio Agropecuario y Forestal
MAGFOR, Managua, Nicaragua, www.magfor.gob.ni The data was supplemented with data from an international certifier. The data is from 2009.
Contact › Ministerio Agropecuario y Forestal
MAGFOR, Managua, Nicaragua, www.magfor.gob.ni
Niger › Certifier data. Nigeria Source › Association of Organic Agriculture
Practitioners of Nigeria (NOAN), Ibadan, Nigeria, and University of Ibadan, Nigeria The data includes PGS area.
Contact › Olugbenga O. AdeOluwa, University of
Ibadan, Nigeria Niue Source › Pacific Organic and Ethical Trade
Community (POETCom), Suva Fiji, www.spc.int.
Contact › Karen Mapusua, Secretariat of the Pacific
Community (SPC), Private Mail Bag, Suva Fiji, www.spc.int
Norway Sources › Land area and operator data: Eurostat
database, Eurostat, Luxembourg › Market data:: Norwegian Agricultural
Authority SLF, Oslo, Norway Contact › Julie Kilde Mjelva, Statens
landbruksforvaltning (SLF), Oslo, Norway
Oman Source › Organic Plant Production and
Agroecosystems Research in the Tropics and Subtropics, Kassel University, Witzenhausen, Germany, www.uni-

Annex › Data Providers and Data Sources
342 FiBL & IFOAM – Organics International (2018): The World of Organic Agriculture. Frick and Bonn
kassel.de/agrar/?language=en. The data is from 2015.
Contact › Prof. Dr. Andreas Bürkert, Organic Plant
Production and Agroecosystems Research in the Tropics and Subtropics Kassel University, Witzenhausen, Germany, www.uni-kassel.de/agrar/?language=en.
Pakistan › Certifier data. Palestine, State of › Area for agricultural land, production,
beehives, total wild collection area: Mediterranean Organic Agriculture Network (MOAN), MOAN Secretariat Istituto Agronomico Mediterraneo di Bari (CIHEAM Bari), Bari, Italy
Panamá Source › Ministerio de Desarrollo Agropecuario,
Dirección Nacional de Sanidad Vegetal, Panama, www.mida.gob.pa. The data is from 2013.
Contact › Fermín Romero, Dirección Nacional de
Sanidad Vegetal, Ministerio de Desarrollo Agropecuario, Panama, www.mida.gob.pa
Papua New Guinea Source › Pacific Organic and Ethical Trade
Community (POETCom), Suva Fiji, www.spc.int
Contact › Karen Mapusua, Secretariat of the Pacific
Community (SPC), Private Mail Bag, Suva Fiji, www.spc.int
Paraguay Source › Servicio Nacional de Calidad y Sanidad
Vegetal y de Semillas, Department of Organic Agriculture, Asuncion, Paraguay, www.senave.gov.py. The data is from 2015.
Contact › Genaro Coronel, Servicio Nacional de
Calidad y Sanidad Vegetal y de Semillas, Department of Organic Agriculture, Asuncion, Paraguay, www.senave.gov.py
Perú Source › Area and number of producers:
SENASA. Producción Orgánica. Lima, Perú
› Market (2010) and export (2015) data: Promperu, San Isidro - Lima 27 Perú, www.promperu.gob.pe. The total value of domestic market is an estimate, based the data from Promperu that the domestic market is between 13.1 and 23.2 million US dollars (2010).
Contact › Dr. Jorge Leonardo Jave Nakayo,
Director de Producción Orgánica, Ministerio de Agricultura, SENASA, Peru
Philippines Sources The data were compiled by FiBL from a number of certifiers, but there are more certifiers active than those listed below. Certifiers who provided data › BCS, Nürnberg, Germany, www.bcs-
oeko.de; › Ceres, Happburg, Germany, www.ceres-
cert.com; › Control Union, Zwolle, The
Netherlands, www.controlunion.org; › Ecocert, L’Isle Jourdain, France,
www.ecocert.com; › Organic Certification Center of the
Philippines OCCP (2009 data), Barangay Laging Handa, Quezon City, Philippines, www.occpphils.org.
Contact › Tobias Fischer, BCS, Nürnberg,
Germany, www.bcs-oeko.de; › Simone Groh, Ceres, Happburg,
Germany, www.ceres-cert.com; › Camille Godard, Area Manager, Ecocert,
L’Isle Jourdain, France, www.ecocert.com;
› Lani Katimbang-Limpin, OCCP, Quezon City, Philippines, www.occpphils.org
› Daniel Szalai, Control Union, Zwolle, The Netherlands, www.controlunion.org.
Note A direct year-to-year comparison over the years is not possible as not all certifiers provided updates every year.

Annex › Data Providers and Data Sources
FiBL & IFOAM – Organics International (2018): The World of Organic Agriculture. Frick and Bonn 343
Poland Source › Land area and land use, livestock and
production: Eurostat database, Luxemburg
› Market data: Fresh Plaza (2016): Poland: Organic market has great potential to grow. The Fresh Plaza website. PKO Bank Polski. The data is from 2015.
Contact › Naczelnik Wydziału, Organic Farming
Division, Ministry of Agriculture and Rural Development, Poland, www.minrol.gov.pl
Portugal Source › Organic land and operators: Eurostat
database, Luxembourg › Market data (2011): INTERBIO,
http://www.interbio.pt Contact › Catarina Crisostomo, Portugal Puerto Rico › Certifier data. Réunion Source › Agence Bio, Montreuil sous Bois, France.
Available at http://www.agencebio.org/la-bio-dans-les-regions
Contact › Nathalie Rison, Agence Bio, Montreuil-
sous-Bois, France, www.agencebio.fr Romania Sources › Organic area, land use, livestock and
production: Eurostat database, Luxemburg.
› Wild collection: Ministry of Agriculture MADR, Bucharest, Romania, see http://www.madr.ro/ro/agricultura-ecologica/dinamica-operatorilor-si-a-suprafetelor-in-agricultura-ecologica.html. The data is from 2014.
› Market data (from 2011): BCG-Global Advisors (2013) Romanian Organic Sector – Business Insight Booklet. Global Advisors, Bio-Romania Association, University of Bucharest. Bucharest 2012
Contact › Iulia Grosulescu, Counsellor Organic
Farming Office, Ministry of Agriculture
and Rural Development, 24,Blvd Carol I, Bucharest Romania
› Marian Cioceanu, Asociatia Bio Romania, Str.Mihai Eminescu, Bucureşti, Romania, http://www.bio-romania.org/contact/
Russian Federation Source The data was compiled by FiBL based on the data of the following international. › BCS, Nürnberg, Germany, www.bcs-
oeko.de; › Bio.Inspecta, Frick, Switzerland,
www.bio-inspecta.ch › Control Union, Zwolle, The
Netherlands, www.controlunion.org; › Ecocert China, Beijing, China › Ecocert IMO Denetim ve Belgelendirme
Ltd. Sti, Izmir, Turkey › Eco-control Ltd., 141506 Solnechnogorsk,
Russia, www.eco-control.ru. Not all certifiers provided updated data.
› Istituto per la Certificazione Etica e Ambientale (ICEA), Bologna. Italy, www.icea.info
Contact › Mustafa Avci, General manager,
ECOCERT IMO Denetim ve Belgelendirme Ltd. Sti, Izmir, Turkey
› Milena Belli, Istituto per la Certificazione Etica e Ambientale (ICEA), Bologna. Italy, www.icea.info
› Tobias Fischer, BCS, Nürnberg, Germany, www.bcs-oeko.de
› Daniel Szalai, Control Union, Zwolle, The Netherlands, www.controlunion.org
› Ulrike Zdralek, Bio.Inspecta, Frick, Switzerland, www.bio-inspecta.ch
› Weimin YU, Project Manager, Ecocert China, Beijing, China
Note A direct year-to-year comparison over the years is not possible as not all certifiers provide updates every year. Rwanda › Certifier data. Samoa Source › Pacific Organic and Ethical Trade
Community (POETCom), Suva Fiji, www.spc.int.

Annex › Data Providers and Data Sources
344 FiBL & IFOAM – Organics International (2018): The World of Organic Agriculture. Frick and Bonn
Contact › Karen Mapusua, Secretariat of the Pacific
Community (SPC), Private Mail Bag, Suva Fiji, www.spc.int
San Marino › Certifier data. Sao Tome and Prince Source › Ecocert West Africa, Ougadougou,
Burkina Faso. The data is from 2014. Contact › Aziz Yanogo, Ecocert West Africa,
Ougadougou, Burkina Faso, www.ecocert.com
Saudi Arabia Source › Department of Organic Agriculture
(DOA), http://moa.gov.sa/organice/portale
Contact › Eng. Ayman Saad Al-Ghamdi, General
Manager of Organic Agriculture Department (DOA), Saudi Arabia
› Mohamed Salih; Abdalla, Deutsche Gesellschaft für Internationale Zusammenarbeit (GIZ), Riyadh, Saudi Arabia, www.giz.de
Senegal Source › National Federation for Organic
Agriculture, AGRECOL BP. 347 Thiès, Sénégal. Data from international certifiers was added.
Contact › Ibrahima Seck, National Federation for
Organic Agriculture, AGRECOL, BP. 347 Thiès, Sénégal
› Famara Diedhioe, National Federation for Organic Agriculture, AGRECOL, BP. 347 Thiès, Sénégal
Serbia Source › Area and operator data: Eurostat
database, Eurostat, Luxembourg › Export and import data: National
Association Serbia Organica (2016): Organic Agriculture in Serbia at a glance 2017. National Association Serbia Organica, Belgrade, Serbia
Contact › Ivana Simic, General secretary, National
Association "Serbia Organica", Belgrade, Serbia; www.serbiaorganica.org
Sierra Leone › Certifier data. Singapore › Two international certifiers reported a
number of processors. Slovakia Sources › Area, operators, livestock, and crop
production: Eurostat database, Luxemburg
› Market data (2010): Ecozept, market research and marketing consulting agency. Freising, Germany
Slovenia Sources › Area, operators, livestock, crop
production: Eurostat database, Luxemburg
› Domestic market data (from 2103): Institute for Sustainable Development, Ljubljana, Slovenia
› Marketing channels (from 2009): Institute for Sustainable Development, Ljubljana, Slovenia
› Exports and imports (from 2009): Institute for Sustainable Development, Ljubljana, Slovenia
Contact › Anamarija Slabe, Institute for
Sustainable Development, Ljubljana, Ljubljana, Slovenia
Solomon Islands Source › Pacific Organic and Ethical Trade
Community (POETCom), Suva Fiji, www.spc.int.
Contact › Karen Mapusua, Secretariat of the Pacific
Community (SPC), Private Mail Bag, Suva Fiji, www.spc.int
Somalia › Certifier data: wild collection only. South Africa Source The data were compiled by FiBL based on the data of the following international certifiers. › BCS, Nürnberg, Germany, www.bcs-
oeko.com › Control Union, Zwolle, The
Netherlands, www.controlunion.org › Ecocert Southern Africa, Gardens Cape
Town, www.ecocert.com
Annex › Data Providers and Data Sources
FiBL & IFOAM – Organics International (2018): The World of Organic Agriculture. Frick and Bonn 345
› IMO, Weinfelden, Switzerland, www.imo.ch
› Soil Association, Bristol, United Kingdom, www.soilassociation.org
Please note that not all certifiers provided updated data. Contact › Andrew Bayliss, Soil Association,
Bristol, United Kingdom › Ruben Cortes, IMO, Weinfelden,
Switzerland › Tobias Fischer, BCS, Nürnberg, Source,
BCS › Clifyn Mckenzie, Ecocert Southern
Africa, Gardens Cape Town › Daniel Szalai, Control Union, Zwolle,
The Netherland Spain Sources › Area and land use, operators: Eurostat
database, Luxembourg › Market and international trade data
MAPAMA - Ministerio de Agricultura y Pesca, Alimentación y Medio Ambiente (2017): Estrategias de vertebración del sector de la producción ecológica de España – Año 2017. MAPAMA, Madrid
Contact › Pedro López, Pro-Voc-Association,
Madrid, Spain, www.provotec.es › Victor Gonzálvez Pérez, Spanish Society
of Organic Agriculture SEAE, Catarroja (Valencia), Spain, www.agroecologia.net
› Joan Picazos, Biocop Productos Biológicos, S.A. (BIOCOP), Lliçà de vall (Barcelona), Spain, www.biocop.es
Sri Lanka Source › Lanka Organic Agriculture Movement
(LOAM), Nawinna, Maharagama, Sri Lanka, survey among the international certifiers.
Contact › Thilak Kariyawasam Lanka Organic
Agriculture Movement (LOAM), Nawinna, Maharagama, Sri Lanka.
Sudan (former) Sources › Federal Ministry of Agriculture &
Irrigation Export Development& Quality Control Unit, Republic of the Sudan. Data on wild collection from one
international certifier were included. Data from 2014
Contact › Afaf Abdelrahim Elgzouly, Federal
Ministry of Agriculture & Irrigation Export Development & Quality Control Unit, Sudan
Suriname › Certifier data. Swaziland › Certifier data. Sweden Sources › Area, livestock and operators: Eurostat
database, Luxembourg › Market data: Statistics Sweden SCB,
Orebro, Sweden Contact › Lisa Allemo, Statistics Sweden SCB,
Orebro, Sweden Switzerland Sources › Land area and crop data, producers:
Federal Agency for Statistics (BfS), Neufchatel, Switzerland. Operators and market data: Bio Suisse, Basel, Switzerland, www.biosuisse.ch/de/bioinzahlen.php.
Contact › Helga Willer, FiBL, Frick, Switzerland Syria › Source for all data: Mediterranean
Organic Agriculture Network (MOAN), MOAN Secretariat Istituto Agronomico Mediterraneo di Bari (CIHEAM Bari), Bari, Italy
› No separate figure for the number of producers was available; the figure communicated is that for all operators in the country.
All data is from 2010. Taiwan Source › Taiwan Organic Agriculture Information
Centre. Statistics 1996-2015 at http://info.organic.org.tw/supergood/front/bin/ptlist.phtml?Category=104854, Agricultural and Food Agency, Council of Agriculture, Taiwan. The data is from 2015.

Annex › Data Providers and Data Sources
346 FiBL & IFOAM – Organics International (2018): The World of Organic Agriculture. Frick and Bonn
Tajikistan Source › SAS - SUGDAGROSERV, 2 Baraka
Boboeva, Khujand 735700, Tajikistan. (Data 2012). To these data, the data of one international certifier were added (2012).
Contact › Javohir Eshmatov, SAS - Sugdagroserv,
2 Baraka Boboeva, Khujand 735700, Tajikistan.
Tanzania Source › Tanzania Organic Agriculture
Movement (TOAM), PO Box 70089, Dar es Salaam, Tanzania, www.kilimohai.net. Survey among the organic operators in the country. The data is from 2015.
Contact › Jordan Gama, Tanzania Organic
Agriculture Movement (TOAM), PO Box 70089, Dar es Salaam, Tanzania, www.kilimohai.net.
Thailand Source › Green Net Survey among the
international and domestic certifiers; Green Net, 10330 Bangkok, Thailand. Domestic market and international trade data is from 2014.
Contact › Vitoon Panyakul, Green Net, 10330
Bangkok, Thailand, www.greennet.or.th. Timor-Leste › Certifier data. Togo Sources The data was compiled by FiBL based on the data of the following international certifiers. Not all certifiers provided updated information. › CERTISYS, Brussels, Belgium,
www.certisys.eu › Ecocert, Ecocert West Africa,
Ougadougou, Burkina Faso, www.ecocert.com
› LACON GmbH, Moltkestraße 4, 77654 Offenburg, Germany (2012 data)
Contact › Nathalie Boes, CERTISYS, Brussels,
Belgium
› Aziz Yanogo, Ecocert West Africa, Ougadougou, Burkina Faso
Note A direct year-to-year comparison over the years is not possible as not all certifiers provided updates every year. Tonga Sources › Pacific Organic and Ethical Trade
Community (POETCom), Suva Fiji, www.spc.int
Contact › Karen Mapusua, Secretariat of the Pacific
Community (SPC), Private Mail Bag, Suva Fiji, www.spc.int
Tunisia Source › Direction Générale de L’Agriculture
Biologique (DGAB), Tunis, Tunisia. Contact › Samia Maamer Belkhiria, Direction
Générale de L’Agriculture Biologique (DGAB), Ministry of Agriculture and Hydraulic Resources, Tunis, Tunisia
Turkey Source › Ministry of Food, Agriculture and
Livestock (MoFAL), Ankara, Turkey › Market data (2009): Estimate by Erdal
Süngü, MoFAL, Ankara, Turkey Notes › Some areas contain crops that can be
harvested from the same parcel. Therefore, the total of the land use/crop data exceeds the actual area surface cultivated for organic farming. A correction value was used in order to calculate the correct total.
› Data on the organic domestic market value are roughly estimated (2009 data).
Uganda Source › National Organic Agricultural
Movement of Uganda (NOGAMU), PO Box 70071, Clock Tower, Kampala, Uganda, www.nogamu.org.ug.
Contact › Hedwig Tushemerirwe, National
Organic Agricultural Movement of Uganda (NOGAMU), PO Box 70071, Clock Tower, Kampala, Uganda, www.nogamu.org.ug.

Annex › Data Providers and Data Sources
FiBL & IFOAM – Organics International (2018): The World of Organic Agriculture. Frick and Bonn 347
Ukraine Sources › Area and operator data: Reform Support
Team at the Ministry of Agrarian Policy and Food of Ukraine, Kyiv, Ukraine
› Export data: Organic Standard, Kyiv, Ukraine
› Crop data: Estimate of FiBL Switzerland and Agricultural Information Company AMI based on data of the Organic Federation of Ukraine, Agricultural Information Company AMI and Ministry of Agrarian Policy and Food of Ukraine
› Retail sales and wild collection: Organic Federation of Ukraine (OFU), Kyiv, Ukraine, www.organic.com.ua
Contact › Olena Berezovska, Reform Support
Team at the Ministry of Agrarian Policy and Food of Ukraine, Kyiv, Ukraine, www.minagro.gov.ua/en
› Sergiy Galashevskyy, Organic Standard certification body, General Manager, Kyiv, Ukraine, [email protected], www.organicstandard.com.ua
› Eugene Milovanov, Organic Federation of Ukraine, Kyiv, Ukraine, www.organic.com.ua
United Arab Emirates Source › Ministry of Environment and Water
(MOEW), United Arab Emirates. The data is from 2014.
Contact › Eng. Saif Mohamed Alshara, Ministry of
Environment and Water, UAE › Fatima Obaid Saeed, Ministry of
Environment and Water, UAE › Mohammad Al-Oun (PhD), Organic
Farming, Plant Health and Development Department, Dubai, UAE
United Kingdom Sources › Land use details/crops/operators:
Eurostat database, Eurostat, Luxembourg
› Market data: Soil Association 2017: Organic Market Report 2017. Bristol, UK
Contacts › Dr. Susanne Padel, The Organic
Research Centre Elm Farm, Newbury, UK, www.organicresearchcentre.com
› Finn Cottle, Soil Association, Bristol, UK United States of America Source › Land area and producers: United States
Department of Agriculture, Washington, USA. Available at http://usda.mannlib.cornell.edu/usda/current/OrganicProduction/OrganicProduction-09-20-2017_correction.pdf
› Market data: Organic Trade Association 2017: Organic Industry Survey, Brattleboro VT 05301, USA, www.ota.com
› Export data: USDA provided by Barbara Haumann, OTA, Brattleboro VT 05301, www.ota.com.
Contact › Catherine Greene, United States
Department of Agriculture, Washington, USA, www.ers.usda.gov/briefing/organic/.
› Barbara Haumann, OTA, Brattleboro VT 05301, www.ota.com
United States Virgin Islands › Certifier data. Uruguay Source › Certifier data. Contact › Betty Mandl, Ministerio de Ganadería,
Agricultura y Pesca (MGAP), Montevideo, Uruguay, www.mgap.gub.uy
Uzbekistan Source › Certifier data (wild collection only). The
data is from 2010. Vanuatu Source › Pacific Organic and Ethical Trade
Community (POETCom), Suva Fiji, www.spc.int
Contact › Karen Mapusua, Secretariat of the Pacific
Community (SPC), Private Mail Bag, Suva Fiji, www.spc.int

Annex › Data Providers and Data Sources
348 FiBL & IFOAM – Organics International (2018): The World of Organic Agriculture. Frick and Bonn
Venezuela › United States Department of Agriculture
(USDA) Organic Integrity Database. USDA, Washington
Viet Nam Source › Vietnam Organic Agriculture
Association, Hanoi, Vietnam. Please note that PGS figures were included
Contact › Nhung Tu Thi Tuyet, Vietnam Organic
Agriculture Association, Hanoi, Vietnam
Zambia › Certifier data. Zimbabwe Source › Zimbabwe Organic Producers and
Promoters Association, Zimbabwe. Contact › Tichaona T. Charova, Zimbabwe
Organic Producers and Promoters Association ZOPPA, Harare, Zimbabwe


The IFOAM Family of Standards
draws the line between organic and non-organic standards.
Be organic. Join the IFOAM Family of Standards today.
Visit www.ifoam.bio/ogs or contact [email protected]
EU Organic Regulation
Switzerland Organic Regulation
Turkey Organic Regulation
Bio Suisse Standards, Switzerland
Nature & Progrès Standards, France
The EcoWellness Standard, Germany
CCPB Global Standard, Italy
Krav Standards, Sweden
THE FAMILY OF STANDARDS contains all standards officially endorsed as organic by the Organic Movement, based on their equivalence with the Common Objectives and Requirements of Organic Standards. Both private standards and government regulations are admissible.
That’s Organic - Worldwide.
www.ifoam.bio/ogs
OCEANIA
GLOBAL
AFRICA
ASIA
EUROPE
THE AMERICAS
Tunisia Organic RegulationEast African Organic Products Standard
The SAOSO Standard, South AfricaZimbabwe Standard for Organic Farming, Zimbabwe
USA Organic Regulation
Argencert Organic Standard, Argentina
OIA Organic Standards, Argentina
Bolicert Private Standards, Bolivia
IBD Organic Guidelines, Brazil
CCOF International Standard, USA
Korea Organic RegulationDiaoyutai Private Organic Standard, China
OFDC Organic Certification Standard, China
Sunshine Earth Organic Standard, China
HKORC Organic Standard, Hong Kong
Biocert International Standards, India
Japan Organic & Natural Foods Association Organic Standard, Japan
MASIPAG Organic Standards, The Philippines
DCOK, LLC International Standards, South Korea
ACT Basic Standard, Thailand
Vietnam PGS Standards, Vietnam
National Standard for Organic and Bio-Dynamic Produce, Australia
New Zealand Organic Export Regulation
Pacific Organic Standard, Pacific Community
Australian Certified Organic Standard, Australia
NASAA Organic Standard, Australia
Asian Regional Organic Standard
Saudi Arabia Organic Regulation
China Organic Regulation
India Organic RegulationIsrael Organic RegulationJapan Organic Regulation
Argentina Organic Regulation
Canada Organic Regulation
Costa Rica Organic Regulation
Ecuador Organic Regulation
IFOAM StandardInternational Standard for Forest Garden Products (FGP) Biocyclic-Vegan Standard
Note: Applicant standards are marked in grey. Family Standards Frame: January 03, 2018. Click on each standard to see more details. Best viewed with Adobe Reader
AsureQuality Organic Standard, New Zealand

OrganizerNürnbergMesseT +49 9118606-0F +49 [email protected]
Admission for trade visitors only
biofach.com
Save the date
13 – 16.2.2019Nuremberg, Germany
National supporting organizationInternational patron

Supported by
In cooperation with
ISBN Printed version 978-3-03736-067-5ISBN PDF version 978-3-03736-068-2
FiB
L &
IFO
AM
– O
RG
AN
ICS
IN
TER
NA
TIO
NA
L TH
E W
OR
LD O
F O
RG
AN
IC A
GR
ICU
LTU
RE
201
8
STA
TIS
TIC
S
Organic agriculture is practiced in 178 countries, and 57.8 million hectares of agricultural land are managed organically by approximately 2.7 million farmers. The global sales of organic food and drink reached almost 90 billion US dollars in 2016, according to Ecovia Intelligence.
The 19th edition of The World of Organic Agriculture, published by the Research Institute of Organic Agriculture (FiBL) and IFOAM – Organics International, provides a comprehensive review of recent developments in global organic agri-culture. It includes contributions from representatives of the organic sector around the world and provides comprehensive organic farming statistics that cover the area under organic management, speci�c information about land use in organic systems, the number of farms and other operator types, and selected market data.
The book also contains information about the global market for organic food, infor-mation on standards and regulations, organic policy, and insights into current and emerging trends in organic agriculture in Africa, Asia, Europe, the Mediterranean, Latin America and the Caribbean, North America, and Oceania. In addition, the volume contains reports about the organic sector in Australia, Canada, Ukraine, the Paci�c Islands, and the United States of America and brief updates for various countries in Asia as well as Latin America and the Caribbean.
The book also includes an article about organic cotton and a chapter reviewing key commodities certi�ed by selected Voluntary Sustainability Standards (VSS).
The latest data are presented annually at BIOFACH in Nuremberg, Germany 2019: 13 - 16 February.