Embed Size (px)
Citation preview

Proc. Nati Acad. Sci. USAVol. 80, pp. 1616-1620, March 1983Biophysics
Fibrinogen and fibrin structure and fibrin formation measured byusing magnetic orientation
(Cotton-Mouton effect/magnetic birefringence/secondary structure/fiber structure/ldnetics of polymerization)
J.-M. FREYSSINET*, J. TORBETt, G. HUDRY-CLERGEON*, AND G. MARETt*Laboratoire d'H6matologie, Unite 217 Institut National de la Sante et de la Recherche Mdicale, D6partement de Recherche Fondamentale, Centre d'EtudesNuclkaires, 85 X, F-38041 Grenoble Cedex, France; and tHochifeld-Magnetlabor des Max-Planck-Institutes fir Festkorperforschung, 166 X,F-38042 Grenoble Cedex, France
Communicated by Manfred Eigen, December 21, 1982
ABSTRACT Accurate birefringence measurements show thatfibrinogen orients to a small degree in high magnetic fields. Thiseffect can be explained as due to the molecule having about 30%(by weight) a-helix oriented relatively parallel to the long axis. Bi-refringence measurements on fully oriented fibrin suggest thataligned a-helical content is less than that estimated for fibrinogen.But because of limitations in the analysis this difference must beviewed with caution. Highly oriented fibrin results when poly-merization takes place slowly in a strong magnetic field. Low-angleneutron diffraction patterns from oriented fibrin made in thepresence of EDTA, made in the presence of calcium, or stabilizedwith factor XIIIa are very similar, showing that the packing of themolecules within the fibers is the same or very similar in these dif-ferent preparations. The induced magnetic birefringence was usedto follow fibrin formation under conditions in which thrombin wasrate limiting. The fiber network formed by approximately the ge-lation point constitutes a kind of matrix or frame that is largelybuilt upon during the remaining ==85% of the reaction. After ge-lation the reaction is pseudo-first order.
The arrest of blood loss from an injured vessel, hemostasis, re-quires the participation of several plasma proteins and alsoplatelets, cells that form occlusive aggregates at the site of therupture. The last stage of the blood clotting process is the en-zyme-catalyzed activation of a soluble plasma protein, fibrin-ogen, which then undergoes polymerization to form an insol-uble fibrin gel, thus mechanically reinforcing the platelet plug.The limited cleavage of fibrinogen by thrombin, a serine pro-teinase, is the result of a series of steps involving many otherclotting factors; much is known about this sequence of highlyregulated events (for a recent and exhaustive review see ref. 1).Thrombin also converts factor XIII into factor XIIIa, the plasmatransglutaminase which, in the presence of calcium, crosslinksadjacent fibrin monomers of a fiber by forming E-(y-gluta-myl)lysyl pseudo peptide bonds (2).The trinodular elongated (450-A-long) structure for the fi-
brinogen molecule proposed by Hall and Slayter (3) is the mostwidely accepted model, and it has obtained additional supportfrom recent work on native fibrinogen (4-8) or slightly modifiedfibrinogen (9-11). Fibrin monomers are produced by thrombin,which releases the small negatively charged fibrinopeptides Aand B. The monomers associate in a longitudinal half-staggeredarrangement to generate the two-stranded fibrin protofibril (12,13), then these protofibrils associate laterally to form the thickerfibrin fibers (12). In a recent study, we have shown that whenpolymerization of fibrin takes place slowly in a high magneticfield one ends up with a highly oriented gel on which neutronlow-angle diffraction studies demonstrate that the protofibrils
pack with three-dimensional order, probably in a tetragonal unitcell with a = b = 185 A and c = 446 A and containing eight mol-ecules (14). The mechanism of assembly of fibrin has been ex-tensively studied (2, 15-18) but due to its complexity and thelimitations of the experimental investigations many importantpoints remain to be elucidated. It is important to have as preciseknowledge as possible about the fibrin polymerization process;not only is it of interest in itself but also it may be an excellentmodel for other aggregation processes of biological macromol-ecules (19).The present study shows that measuring the gradual orien-
tation of fibrin in a high magnetic field reveals kinetic featuresof the polymerization reaction, and it also demonstrates thatstructural details of the secondary structure of the fibrinogenmolecule or the fibrin monomer can be assessed by studyingtheir behavior in the field.
MATERIALS AND METHODSProtein Preparation. Purified bovine fibrinogen (>98%
clottable protein) was obtained as described in ref. 20. Unlessspecified otherwise the experiments were performed in 0.05 MTris'HC1 buffer containing 0.1 M NaCl, 0.5 mM EDTA, and0.01% (wt/vol) NaN3 (pH7.5). Thrombin and reptilase (Both-rops atrox serine proteinase) were purchased from the Institutde Serotherapie Hematopoietique (Paris) and Laboratoire Stago(Asnieres, France), respectively. All measurements were madeat 200C.
Samples for neutron diffraction experiments were made byforming fibrin (polymerization time 1 hr) in a magnetic fieldthat had an average value of about 15 teslas (1 tesla, T, = 104gauss). The orientation was performed in lH20 buffer, whichwas subsequently replaced as required with 2H20 buffer by dif-fusion. The sample thickness was 0.1 or 0.2 cm.
Measurements of the Magnetically Induced Birefringence.The samples were contained in quartz cells that had an opticalpath length of 3, 1, or 0.1 cm. These were placed in a temper-ature-stabilized (±0.1C) sample holder within a Bitter typemagnet (maximal field 13.5 T) that had a small radial opticalbore. The magnetic birefringence An was sensitively measured(resolution An 10-10, A = 6,328 A) by using a combined pho-toelastic modulation and compensation technique (21). Polar-izer and analyzer were crossed and at 450 with respect to thefield direction. A 50-kHz modulation of the birefringence wasproduced by a photoelastic modulator, resulting in a 100-kHzintensity modulation of the photodiode output. Any superim-posed steady-state (magnetic) birefringence produced an ad-ditional 50-kHz photodiode output, which was phase-sensi-tively detected, converted to dc, and used (as error signal in afeedback loop) to compensate the steady-state birefringence bymeans of a Pockels cell. Hence in the compensated case the
1616
The publication costs of this article were defrayed in part by page chargepayment. This article must therefore be hereby marked "advertise-ment" in accordance with 18 U. S. C. §1734 solely to indicate this fact.

Proc. NatL Acad. Sci. USA 80 (1983) 1617
voltage across the Pockels cell was a direct measure of the mag-netic birefringence An. In order to measure the large birefrin-gence given by fibrin polymerization the Pockels cell was re-placed by an electrically driven Babinet-Soleil compensator.
Neutron Diffraction Measurements. The neutron diffrac-tion patterns were obtained on the small-angle scattering cam-era D 11 (22) at the Institut Laue-Langevin (Grenoble). Thescattered neutrons were detected on a two-dimensional (64 X64) BF3 multidetector. The wavelength used was 10 A and AA/A was 8% (full width, half maximum). The specimen-to-detectordistance was 2.55 m. A water spectrum, which is isotropic underthese conditions, was used to correct for detector response.
Theory
We are interested in a dilute solution of elongated moleculesthat after limited proteolysis polymerize to form large fibers.Consider the molecules to be rotationally symmetric about theirlong axis. The following quantities are defined: c = concentra-tion; Mr = molecular weight; NA = Avogadro's number (cNA/Mr = number of molecules per unit volume); k = Boltzmannconstant; T = absolute temperature; A = wavelength of light;no = refractive index, which at low concentration is equal to thatof water (1.33); H = magnetic field strength; and Aa = all -a1, the optical anisotropy, and Ax = All - Xl, the diamagneticanistropy-i. e., the difference in their values parallel and per-pendicular to the axis of symmetry (XI and X1 are always neg-ative). The induced birefringence, An, is used to monitor theorientation, An = nil - no, the difference in the refractive in-dices of light linearly polarized parallel and perpendicular tothe applied magnetic field direction. An, = birefringence at fullorientation; in this study the symmetry axis orients parallel tothe field direction.
In a magnetic field diamagnetically anisotropic particles ex-perience a torque that acts to bring the axis of smallest absolutediamagnetic susceptibility nearer to the field direction. Thismeans that if Axis positive, I,,ii < Ix±,I the Xm axis moves nearerto the field direction, whereas if AXis negative, IxllI > Ix-I, theAll axis moves away from the field direction. The magnetic ori-entation is opposed by the randomizing effect of Brownian mo-tion. In general the magnetic orienting energy AVH2/2 < kT,so only weak orientation is attained. However, because dia-magnetic anisotropy is an additive property, if N particles arealigned as in a polymer with their symmetry axes parallel, thentheir total anisotropy is NAX(for a stiff polymer) and ifN is largeenough the orienting energy will be significantly larger than kT.For better than 90% orientation parallel to the field (positiveAX) NAXH2/2 > 16kT.
For weakly orienting samples (AXH2 < 0.6kT) the inducedbirefringence is given by (An << Ans).
21r (n 2 + 2)2 H2 CNAAn = - - AXAa. [1]
135 no kT Mr
When An is plotted against H2 a straight line results; from thisline the Cotton-Mouton constant, CM (CM = An/AH2), is ob-tained
21T (n2+ 2)2 1 CNACM = -AXAa. [2]
135 no AkT Mr
Thus CM is proportional to the product AaAX. If it is positivethe direction of maximal susceptibility is one of minimal polar-izability, and if it is negative the directions of maximal suscep-tibility and polarizability coincide.
The birefringence of a fully aligned sample is according to the
Lorentz-Lorenz formula
2ir (n2 + 2)2 CNAAn, = -a.
9 no Mr [3]
The Lorentz-Lorenz formula does not have a firm theoreticalbasis for solutions or gels of anisotropic particles, but becausethe analysis is based on comparison with measurements of knownstructures this is not a handicap.Now consider that polymerization and orientation occur si-
multaneously and that the An from the oriented polymer con-centration, c2(t), is large compared to that of the unpolymerizedmaterial concentration cl(t). Both concentrations are dependenton time, t, and add up to the total concentration c = cl(t) + c2(t).At the beginning (t = 0), c1(O) = c, c2(0) = 0, and An(O) 0,and at the end of polymerization (t -m oo), cl(oo) = 0, c2(oo) =c,and An(oo) = An,.
At intermediate times
A'~t' - 21r(n + 2)2 C2(t)NA- 9n. MrA,which, when combined with Eq. 3, gives
An(t) = - c2(t) and Ans - An(t) = -s cl(t).C C
[4]
[5]
Thus An(t) is directly proportional to the polymer concen-tration. This is valid even if the alignment is not complete, pro-vided the degree of orientation is the same throughout and, asabove, the signal from the unpolymerized material is relativelyweak, in which case Ans is not given by Eq. 3 but is equal to thebirefringence at the end of the reaction. For a first-order orpseudo-first-order reaction c1(t) = cekt, in which k is the ap-parent rate constant. Hence from Eq. 5
An, - An(t) = Ane-t. [6]
Comparative measurements
The ratio of the birefringences of two aligned samples (sub-scripts 1 and 2) at the same concentration is calculated by usingEq. 3: An,1/An,2 = Mr2Aa1/Mr1Aa2. If both sorts of particleshave the same structure and flexibility (or more generally thesame Aa per unit mass) and differ only in length, then this ratiois equal to 1. However, if particle 1 has a fractionf that has thesame Aa per unit mass as particle 2 and its remaining fraction(1 - J) has zero optical anisotropy, then
An,,Ans2= [7]
Similarly, making use of Eq. 2, the ratio of the Cotton-Mouton constants is given by CM1/CM2 = Mr2AalAX1/Mnj Aa2AX2. For particles that differ only in length (or gen-erally if they have the same AaAX/M2) this simplifies to CM1/CM2 = MrI/Mr2. Again, if particle 1 has a fraction f with thesame structure as particle 2 and the diamagnetic and optical an-isotropies of the remainder are 0, then
CM1-: Mrlf2
CM2 Mr2[8]
Above it is assumed that the Aa values and Ax values areadditive. This is justifiable for the latter, but it is not so reliablefor Aa because it may have both a shape, Aa,, and intrinsic,AaI, component and to a first approximation Aa = Aa, + Aa,.
Biophysics: Freyssinet et al.

1618 Biophysics: Freyssinet et al.
RESULTS AND DISCUSSIONStructure of Fibrinogen in Solution. The magnetically in-
duced birefringence of fibrinogen in solution (Fig. 1) varies lin-early (Eq. 2) with H2 up to the highest fields used. No saturationwas observed, indicating that only partial orientation takes place.The birefringence is positive, as is that of oriented fibrin (seelater), so it is reasonable to conclude that the long axis, whichis the axis of rotational symmetry of the fibrinogen molecule,tends to orient in the direction of the magnetic field, as do themonomers in fibrin (14). This is thus the axis of smallest nu-merical diamagnetic susceptibility and Ax is positive, as is Aafrom Eq. 2.The specific Cotton-Mouton constant (i.e., CM divided by
the concentration) of fibrinogen is 1.58 (± 0.1) X 10-7 T-2 cm2mg'1. It is independent of the protein concentration in the range10 to 80 mg/ml and of the salt concentration between 0.05 and0.45 M NaCl. These results demonstrate that over these rangesof conditions there is little intermolecular interaction or sig-nificant change in conformation.
It is useful to compare the CM of fibrinogen with that of twofilamentous bacteriophages (23), Pf1 and fd, whose structuresare well characterized (24-26). The ratio of the specific CMs is8.0 x 10-4 (fibrinogen/Pfl) and 16.2 X 10⁻⁴ (fibrinogen/fd),whereas the ratios of the molecular weights are, respectively,9.07 x 10-3 and 2 x 10⁻². From Eq. 8, f = 0.30 or 0.28, de-pending on whether the comparison is with Pfl or fd. In orderto assess the significance of this result it is necessary to refer tothe structures of the phages. Both viruses are long (Pf1 22m,fd 0.9 /Lm) with a diameter of about 60 A. They contain cir-cular single-stranded DNA (5% by weight in Pf1, 14% in fd) en-capsulated in a helical arrangement of coat protein monomers,which account for about all of the phage protein. In Pf14% andin fd 12% of the amino acids are aromatic. The coat protein isalmost 100% a-helical; the helix lies at an average angle of about200 to the phage long axis. Although the a-helices, aromatic aminoacid residues, and DNA bases are all potential contributors, itturns out that the Cotton-Mouton effect comes largely from thea-helices, because the average orientation of the other groupsrelative to the phage long axis is such that they have little in-fluence (23). Thus as far as the magnetic birefringence mea-surements are concerned fibrinogen behaves as though there isabout 30% (fl- 0.30, above) a-helix oriented relatively parallelto the molecule long axis. This value is similar to that from othersources (27-30) but is nevertheless circumscribed by the fol-
2.0
C,r_4 1.5
- 10
0.5
50 100 150
H2, T2
FIG. 1. Continuously measured magnetically induced birefrin-gence, An, of a solution of fibrinogen (c = 20 mg/ml) at 220C. It tookabout 60 sec to sweep up the field and down again.
lowing assumptions implicit in the analysis. First, that the ar-omatic residues in the a-helices contribute little, as in the phages,to the optical and magnetic anisotropies and, second, that thecontribution from the rest of the molecule is small. The latterassumption is reasonable because these regions are expected tobe rather globular and therefore unlikely to be very anisotropic.
Structure of Oriented Fibrin Gels. When fibrin is formedin a strong magnetic field it can be aligned parallel to the field(14). At near complete orientation as checked by neutron dif-fraction, Ans/c is 1.24 (± 0.07) x 10-' ml mg-'. The corre-sponding values for Pf1 and fd are, respectively, 6.27 x 10⁻⁵and 6.05 x 10⁻⁵ ml mg-' (23). Thus from Eq. 7,f = 0.20 whenfibrin is compared with these two viruses. This suggests thatabout 20% of fibrin is a-helical with an axis relatively parallelto the fiber axis as in Pf1 and fd. The assumptions are the sameas those invoked for the interpretation ofthe CM offibrinogen.Because in both cases the analysis is not rigorous one must becautious about attributing significance to the difference be-tween the estimates of the aligned a-helical contents of fibrin-ogen and fibrin.The low-angle neutron diffraction pattern given by magnet-
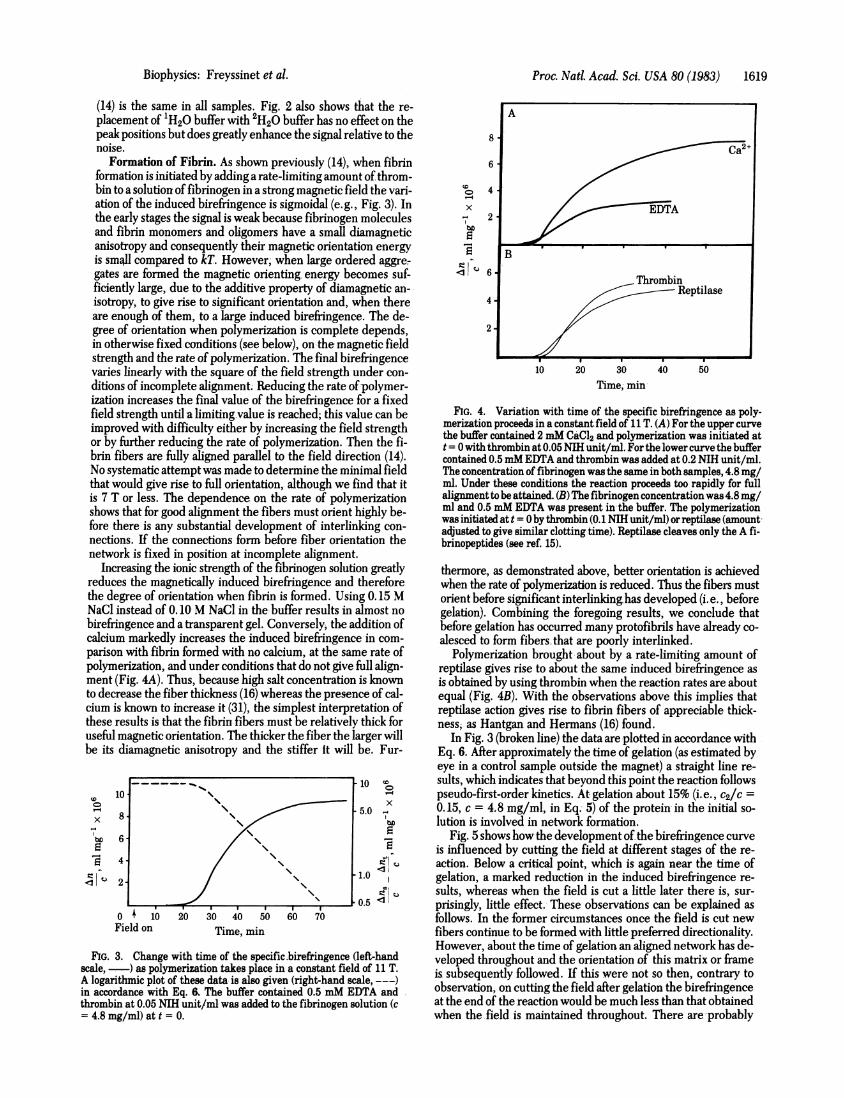
ically oriented fibrin made in the absence of calcium has beenreported (14). In Fig. 2 the low-angle diffraction patterns canbe compared for fibrin made without calcium, fibrin with cal-cium, and fibrin covalently linked by factor XIIIa. The positionsof the maxima are identical, therefore the packing or unit cell
A B
C H .D
0_(E>A005C7~~~ A-1 .
FIG. 2. Neutron diffraction pattern from fibrin (10 mg/ml) ori-ented by polymerization in a magnetic field, H, of about 15 T. The con-tour levels are the same in A, B, and C. The samples were formed in1H20 buffer, which was replaced by 2H20 buffer inA, B, and C, but notD. The sample thickness was 0.2 cm in A, B, and C and 0.1 cm in D.The variation in the buffer conditions and the units of thrombin usedto initiate polymerization were as follows. A, 0.5 mM EDTA, 0.05 Na-tional Institutes of Health (NIH) unit/ml; B, 2 mM CaCl2, 0.018 NIHunit/ml; C, 2mM CaCl2 and 3% (vol/vol) bovine plasma as a source offactor XII, 0.018 NIH unit/ml; D, 0.5 mM EDTA, 0.05 NIH unit/ml.Exposure time of patternD was 3 times that of patternsA, B, or C. Thepositions of the peaks are the same in the four patterns. The meridionalreflections have a 223 ± 5A periodicity andthe sharp equatorial peaksare at 184 ± 5A (the very strong equatorial peaks nearest to the centerare due to leakage of the direct beam round the cadmium beam catcher).The fibrin fibers were not exactly perpendicular to the neutron beamand for this reason the meridional reflections are not symmetric in in-tensity about the center. This effect is particularly obvious inD, wherethere are no meridional peaks in the lower half of the pattern. See ref.14 for a more detailed discussion of the diffraction results.
Proc. Nad Acad. Sci. USA 80 (1983)
Proc. Natl. Acad. Sci. USA 80 (1983) 1619
(14) is the same in all samples. Fig. 2 also shows that the re-placement of '1H20 buffer with 21H20 buffer has no effect on thepeak positions but does greatly enhance the signal relative to thenoise.
Formation of Fibrin. As shown previously (14), when fibrinformation is initiated by adding a rate-limiting amount of throm-bin to a solution of fibrinogen in a strong magnetic field the vari-ation of the induced birefringence is sigmoidal (e.g., Fig. 3). Inthe early stages the signal is weak because fibrinogen moleculesand fibrin monomers and oligomers have a small diamagneticanisotropy and consequently their magnetic orientation energyis small compared to kT. However, when large ordered aggre-gates are formed the magnetic orienting energy becomes suf-ficiently large, due to the additive property of diamagnetic an-isotropy, to give rise to significant orientation and, when thereare enough of them, to a large induced birefringence. The de-gree of orientation when polymerization is complete depends,in otherwise fixed conditions (see below), on the magnetic fieldstrength and the rate of polymerization. The final birefringencevaries linearly with the square of the field strength under con-ditions of incomplete alignment. Reducing the rate ofpolymer-ization increases the final value of the birefringence for a fixedfield strength until a limiting value is reached; this value can beimproved with difficulty either by increasing the field strengthor by further reducing the rate of polymerization. Then the fi-brin fibers are fully aligned parallel to the field direction (14).No systematic attempt was made to determine the minimal fieldthat would give rise to full orientation, although we find that itis 7 T or less. The dependence on the rate of polymerizationshows that for good alignment the fibers must orient highly be-fore there is any substantial development of interlinking con-nections. If the connections form before fiber orientation thenetwork is fixed in position at incomplete alignment.
Increasing the ionic strength of the fibrinogen solution greatlyreduces the magnetically induced birefringence and thereforethe degree of orientation when fibrin is formed. Using 0.15 MNaCl instead of 0.10 M NaCl in the buffer results in almost nobirefringence and a transparent gel. Conversely; the addition ofcalcium markedly increases the induced birefringence in com-parison with fibrin formed with no calcium, at the same rate ofpolymerization, and under conditions that do not give full align-ment (Fig. 4A). Thus, because high salt concentration is knownto decrease the fiber thickness (16) whereas the presence of cal-cium is known to increase it (31), the simplest interpretation ofthese results is that the fibrin fibers must be relatively thick foruseful magnetic orientation. The thicker the fiber the larger willbe its diamagnetic anisotropy and the stiffer it will be. Fur-
ADo.
xC-.
bD
C! C.
*10 'o
x-5.0 -
*1.0
0
0.OA
O + 10 20 30 40 5CField on Time, min
FIG. 3. Change with time of the specific birefringence (left-handscale, -) as polymerization takes place in a constant field of 11 T.A logarithmic plot of these data is also given (right-hand scale, ---)in accordance with Eq. & The buffer contained 0.5 mM EDTA andthrombin at 0.05 NIH unit/ml was added to the fibrinogen solution (c= 4.8 mg/ml) at t = 0.
~o4X EDTA
2
~. B
ThrombinReptilase
4
2
10 20 30 40 50Time, min
FIG. 4. Variation with time of the specific birefringence as poly-merization proceeds in a constant.field of 1 T. (A) For the upper curvethe buffer contained 2 mM CaCl2 and polymerization was initiated att = 0 with thrombin at 0.05 NIH unit/ml. For the lower curve the buffercontained 0.5mM EDTA and thrombin was added at 0.2 NIH unit/ml.The concentration of fibrinogen was the same in both samples, 4.8 mg/ml. Under these conditions the reaction proceeds too rapidly for fullalignmentto be attained. (B) The fibrinogen concentration was 4.8 mg/ml and 0.5 mM EDTA was present in the buffer. The polymerizationwas initiated at t = Oby thrombin (0.1 NIH unit/ml) orreptilase (amount,adjusted to give similar clotting time). Reptilase cleaves only the A fi-brinopeptides (see ref. 15).
thermore, as demonstrated above, better orientation is achievedwhen the rate of polymerization is reduced. Thus the fibers mustorient before significant interlinkinghas developed (i.e., beforegelation). Combining the foregoing results, we conclude thatbefore gelation has occurred many protofibrils have already co-alesced to form fibers that are poorly interlinked.
Polymerization brought about by a rate-limiting amount ofreptilase gives rise to about the same induced birefringence asis obtained by using thrombin when the reaction rates are aboutequal (Fig. 4B). With the observations above this implies thatreptilase action gives rise to fibrin fibers of appreciable thick-ness; as Hantgan and Hermans (16) found.
In Fig. 3 (broken line) the data are plotted in accordance withEq. 6. After approximately the time of gelation (as estimated byeye in a control sample outside the magnet) a straight line re-sults, which indicates that beyond this point the reaction followspseudo-first-order kinetics. At gelation about 15% (i. e., c2/c =0.15, c = 4.8 mg/ml, in Eq.- 5) of the protein' in the initial so-lution is involved in network formation.
Fig. 5 shows how the development of the birefringence curveis influenced by cutting the field at different stages of the re-action. Below a critical point, which is again near the time ofgelation, a marked reduction in the induced birefringence re-sults, whereas when the field is cut a little later there is, sur-prisingly, little effect. These observations can be explained asfollows. In the former circumstances once the field is cut newfibers continue, to be formed with little preferred directionality.However, about the time of gelation an aligned network has de-veloped throughout and the orientation of this matrix or frameis subsequently followed. If this were not so then, contrary toobservation, on cutting the field after gelation the birefringenceat the end of the reaction would be much less than that obtainedwhen the field is maintained throughout. There are -probably
Biophysics: Freyssinet et al.

1620 Biophysics: Freyssinet et al.
6 ~ .. ......ba
10 20 30 40 50
Field on Time, min
FIG. 5. Variation with time of the specific birefringence as poly-merization proceeds in a constant field of 11 T, which was cut at dif-ferent times during the reaction. , Field on during whole course ofthe reaction;. , field switched off at time t3 (when the field wasswitched off at any time above t2 a similar curve was obtained); ----,
field switched offjust below t2. When the field was switched off at timeti the signal decreased somewhat and then stabilized. It took about 30sec to reduce the field from 11 to 0 T. The fibrinogen concentration was4.8 mg/ml, and 0.5mM EDTA and thrombin at 0.085 NIH unit/ml wereadded at t = 0.
relatively few free ends in the gel, so the principal process ofgrowth is predominantly due to the lateral attachment of mono-mers, dimers, or oligomers to existing fibers in a way resem-
bling crystallization. If this is so then few new fibers can formafter gelation. However, if very long protofibrils continue to beproduced some of them may attach laterally to more than onefiber, giving rise to new interlinks or fibers while neverthelesslargely conforming to the orientation of the existing matrix.Thicker fibers will grow more quickly because they have a largersurface to which additions can be made. So the final form of thegel depends on steps preceding gelation. This could be one ofthe factors controlling the size of a clot in vivo.
Because above the critical point the polymerization and ori-entation of fibers follow the same kinetics with or without thefield and the coagulation times and the turbidities are very sim-ilar, we conclude that the action of thrombin on fibrinogen mol-ecules is not modified to a significant extent by the high mag-netic field.
Hantgan and Hermans (16) have used stopped-flow lightscattering to follow the events during polymerization in con-ditions when thrombin was not rate limiting. When compari-sons are made it is important to remember that in our experi-ments thrombin concentration, on the contrary, was rate limiting.Their measurements are informative about the early events butreveal little about changes that occur later, whereas in our ex-periments the converse is true. The scheme proposed by Hant-gan and Hermans (16) is as follows: monomers polymerize toform protofibrils; long protofibrils associate laterally to form fi-bers; occasionally a long protofibril associates with two differentfibers to form an interfiber connection; finally, a network of in-terlinked fibers develops. Now, incorporating the results re-
ported here, we propose: monomers polymerize to form pro-tofibrils; long protofibrils associate laterally to produce fibers,interlinks are rare; occasionally a fiber or protofibril joins twodifferent fibers and a fully interlinked network develops (ge-lation occurs); and the matrix existing at gelation is built up bythe lateral growth of existing fibers, and possibly new fibers are
occasionally formed by very long protofibrils making lateral at-tachments to more than one fiber. From about the time of ge-lation the overall process follows pseudo-first-order kinetics.
Our study also demonstrates that in the case of orientablepolymers (biological or not) measuring the magnetically inducedbirefringence, which is proportional to the concentration ofmonomers that have undergone polymerization, can be an ex-cellent technique with which to follow the assembly process.
J.T. thanks the Deutsche Forschungsgemeinschaft for support. Weare indebted to the Service National des Champs Intenses (Centre Na-tional de la Recherche Scientifique) and to the Institut Laue-Langevin,both in Grenoble.
1. Jackson, C. M. & Nemerson, Y. (1980) Annu. Rev. Biochem. 49,765-811.
2. Doolittle, R. F. (1981) in Haemostasis and Thrombosis, eds. Bloom,A. L. & Thomas, D. P. (Churchill Livingstone, London), pp. 163-191.
3. Hall, C. E. & Slayter, H. S. (1959)J. Biophys. Biochem. Cytot 5,11-15.
4. Fowler, W. E. & Erickson, H. P. (1979)J. Mol Biol 134, 241-249.5. Telford, J. N., Nagy, J. A., Hatcher, P. A. & Scheraga, H. A. (1980)
Proc. Natl. Acad. Sci. USA 77, 2372-2376.6. Estis, L. F. & Haschemeyer, R. H. (1980) Proc. Nati Acad. Sci.
USA 77, 3139-3143.7. Price, T. M., Strong, D. D., Rudee, M. L. & Doolittle, R. F. (1981)
Proc. Nati Acad. Sci. USA 78, 200-204.8. Williams, R. C. (1981) J. Mol. Biol 150, 399-408.9. Tooney, N. M. & Cohen, C. (1977) J. Mol Biol 110, 363-385.
10. Weisel, J. W., Warren, J. S. & Cohen, C. (1978)J. Mol Biol 126,159-183.
11. Hewat, E. A., Tranqui, L. & Wade, R. H. (1982)J. Mol Biol 161,459-477.
12. Ferry, J. D. (1952) Proc. Natl Acad. Sci. USA 38, 566-569.13. Fowler, W. E., Hantgan, R. R., Hermans, J. & Erickson, H. P.
(1981) Proc. NatL Acad. Sci. USA 78, 4872-4876.14. Torbet, J., Freyssinet, J.-M. & Hudry-Clergeon, G. (1981) Na-
ture (London) 289, 91-93.15. Blomback, B., Hessel, B., Hogg, D. & Therkildsen, L. (1978)
Nature (London) 275, 501-505.16. Hantgan, R. R. & Hermans, J. (1979) J. Biol Chem. 254, 11272-
11281.17. Collen, D., Vandereycken, G. & De Maeyer, L. (1970) Nature
(London) 228, 669-671.18. Smith, G. F. (1980) Biochem. J. 185, 1-11.19. Qosawa, F. & Kasai, M. (1962)J. Mol. Biol 4, 10-21.20. Kekwick, R. A., Mackay, M. E., Nance, M. M. & Record, B. H.
(1955) Biochem. J. 60, 671-683.21. Maret, G. & Dransfeld, K. (1977) Physica B 86-88, 1077-1083.22. Ibel, K. (1976) J. Appl Crystallogr. 9, 630-643.23. Torbet, J. & Maret, G. (1981) Biopolymers 20, 2657-2669.24. Day, L. A. & Wiseman, R. L. (1978) in The Single-Stranded DNA
Phages, Cold Spring Harbor Laboratory Monograph Series, eds.Denhardt, D. T., Dressler, D. & Ray, D. S. (Cold Spring HarborLaboratory, Cold Spring Harbor, NY), Vol. 8, pp. 605-625.
25. Makowski, L., Caspar, D. L. & Marvin, D. A. (1980)J. Mol Biol140, 149-181.
26. Nave, C., Brown, R. S., Fowler, A. G., Ladner, J. E., Marvin,D. A., Provencher, S. W, Tsugita, A., Armstrong, J. & Perham,R. N. (1981)J. Mol Biol 149, 675-707.
27. Cohen, C. & Szent-Gyorgyi, A. G. (1957) J. Am. Chem. Soc. 79,248.
28. Mihalyi, E. (1965) Biochim. Biophys. Acta 102, 487-499.29. Budzynski, A. Z. (1971) Biochim. Biophys. Acta 229, 663-671.30. Doolittle, R. F., Goldbaum, D. M. & Doolittle, L. R. (1978) J.
Mol, Biol 120, 311-324.31. Hantgan, R. R., Fowler, W. E., Erickson, H. P. & Hermans, J.
(1980) Thromb. Haemostasis 44, 119-124.
Proc. Nad Acad. Sci. USA 80 (1983)