Embed Size (px)
Citation preview
Fibrinolytic enzymes from a newly isolated marinebacterium Bacillus subtilis A26: characterizationand statistical media optimization
Rym Agrebi, Anissa Haddar, Mohamed Hajji, Fakher Frikha, Laila Manni, KemelJellouli, and Moncef Nasri
Abstract: A fibrinolytic enzyme producing bacterium was isolated and identified as Bacillus subtilis A26 on the basis ofthe 16S rRNA gene sequence. The fibrin zymography analysis reveals the presence of at least three fibrinolytic enzymes.The crude enzyme exhibited maximal activity at 60 8C and pH 8.0. Medium composition and culture conditions for the en-zyme production by B. subtilis A26 were optimized using two statistical methods. The Plackett–Burman statistical designwas applied to find the key ingredients and conditions for the best yield of enzyme production. Five significant variables(hulled grain of wheat, casein peptone, NaCl, CaCl2, and initial pH) were selected for the optimization studies. The re-sponse surface methodological approach was used to determine the optimal concentrations and conditions. The optimizedmedium contained 40.0 g�L–1 hulled grain of wheat, 3.53 g�L–1 casein peptone, 4.0 g�L–1 CaCl2, 3.99 g�L–1 NaCl, 0.01 g�L–1
MgSO4, and 0.01 g�L–1 KH2PO4, pH 7.78. The medium optimization resulted in a 4.2-fold increased level of fibrino-lytic production (269.36 U�mL–1) compared with that obtained with the initial medium (63.45 U�mL–1). A successfuland significant improvement in the production of protease by the A26 strain was accomplished using inexpensive car-bon substrate (hulled grain of wheat), allowing a significant reduction in the cost of medium constituents.
Key words: Bacillus subtilis A26, fibrinolytic enzymes, characterization, optimization, Plackett–Burman design, responsesurface methodology.
Resume : Une souche bacterienne productrice d’enzymes fibrinolytique a ete isolee et identifiee sur la base de la sequencedu gene codant pour l’ARN ribosomal 16S comme etant Bacillus subtilis A26. L’analyse par zymogramme sur fibrine re-vele la presence d’au moins trois enzymes fibrinolytiques. L’extrait enzymatique presente un optimum d’activite a 60 8Cet a pH 8,0. La composition du milieu et les conditions de cultures pour la production d’enzymes fibrinolytiques par B.subtilis A26 ont ete optimisees par la methodologie des plans d’experiences. La matrice de Plackett–Burman a ete em-ployee pour cribler les facteurs ayant un effet significatif sur la production d’enzymes fibrinolytiques. Cinq facteurs signi-ficatifs (gruau, peptone de caseine, NaCl, CaCl2 et pH initial) ont ete selectionnes pour l’optimisation par la methodologiedes surfaces de reponses. Le milieu optimise est compose de 40,0 g�L–1 gruau, 3,53 g�L–1 peptone de caseine, 4,0 g�L–1
CaCl2 , 3,99 g�L–1 NaCl, 0,01 g�L–1 MgSO4 et 0,01 g�L–1 KH2PO4, pH 7,78. L’optimisation a permis d’ameliorer le niveaude production d’enzymes fibrinolytiques d’un facteur de 4,2 (269,36 U�mL–1) par rapport au milieu initial (63,45 U�mL–1).Une amelioration significative du niveau de production de proteases fibrinolytiques par la souche A26 est obtenue en utili-sant un substrat carbone bon marche (gruau), ce qui permet une reduction interessante du cout des constituants du milieude culture et donc de la production.
Mots-cles : Bacillus subtilis A26, enzymes fibrinolytiques, caracterisation, optimisation, matrice de Plackett–Burman,methodologie des surfaces de reponses.
Introduction
Protease represents one of the most important groups ofindustrial enzymes (Layman 1986). Most of them are usedin the detergent industry; they are also used in the pharma-ceuticals industry and in medical diagnosis for resolving
serious medical problems such as disorders of blood clottingand fibrinolysis (Gupta et al. 2002b; Peng et al. 2005).
Blood clots (fibrin) are formed from fibrinogen by throm-bin and are lysed by plasmin, which is activated from plas-minogen by tissue plasminogen activator. Although fibrinclots formation and fibrinolysis are maintained in balance
Received 3 December 2008. Revision received 4 April 2009. Accepted 1 May 2009. Published on the NRC Research Press Web site atcjm.nrc.ca on 12 September 2009.
R. Agrebi, A. Haddar, M. Hajji, L. Manni, K. Jellouli, and M. Nasri.1 Laboratoire de Genie Enzymatique et de Microbiologie, EcoleNationale d’Ingenieurs de Sfax. BP « W » 3038 Sfax, Tunisia.F. Frikha. Laboratoire de Biochimie et de Genie Enzymatique des Lipases, Ecole Nationale d’Ingenieurs de Sfax. BP « W » 3038 Sfax,Tunisia.
1Corresponding author (e-mail: [email protected]).
1049
Can. J. Microbiol. 55: 1049–1061 (2009) doi:10.1139/W09-057 Published by NRC Research Press
Can
. J. M
icro
biol
. Dow
nloa
ded
from
ww
w.n
rcre
sear
chpr
ess.
com
by
Uni
vers
ity o
f Q
ueen
slan
d on
06/
20/1
3Fo
r pe
rson
al u
se o
nly.
by the biological system, thromboses, such as myocardial in-farction, occur when clots are not lysed as a result of a dis-order of the balance. The fibrinolytic agents available todayfor clinical use are mostly plasminogen activators such as atissue-type plasminogen activator (Collen and Lijnen 2004),a urokinase-type plasminogen activator (Spraggon et al.1995), and a bacterial plasminogen activator streptokinase(Banerjee et al. 2004). Despite their widespread use, all ofthese agents have undesired side effects, exhibit low specif-icity for fibrin, and are also relatively expensive.
Various fibrinolytic enzymes produced by different micro-organisms have been discovered in recent years (Kim et al.1997; Choi et Shin 1998). Nattokinase is the first fibrino-lytic enzyme identified from fermented food (Sumi et al.1987). It was purified from Bacillus subtilis natto screenedfrom natto, a traditional Japanese soybean fermented food(Sumi et al. 1990; Fujita et al. 1993). Other fibrinolytic en-zymes that were produced by Bacillus strains screened fromtraditional fermented foods have been reported, such as sub-tilisin CK 11-4 from Chungkook-Jang (Kim et al. 1996),subtilisin DJ-4 from Doen-Jang (Kim and Choi 2000) in Ko-rea, and subtilisin DFE from Douchi in China (Peng et al.2003). These enzymes have significant potential for foodfortification and neutraceutical applications, since their usecould effectively prevent cardiovascular diseases (Mine etal. 2005).
To meet the growing demands of enzymes in the industry,it is necessary to improve the performance of the system andthus increase the yield without increasing the cost of produc-tion. The growth and extracellular protease production bymicroorganisms are greatly influenced by media compo-nents, especially carbon and nitrogen sources, metal ions,and physical factors such as pH, temperature, dissolved oxy-gen, and incubation time (Varela et al. 1996). Medium com-position is one of the most important parameters whenenzymes are particularly produced for industrial purposesbecause approximately 30%–40% of the production costwas estimated to be accounted for by the cost of the growthmedium (Kirk et al. 2002). The traditional one-variable-at-a-time optimization strategy is simple and easy, and the indi-vidual effects of medium components can be seen on agraph without the need to revert to statistical analysis. How-ever, this strategy is extremely time-consuming and expen-sive when a large number of variables are considered. Inaddition, the traditional optimization strategy does not con-sider the interaction effects among the variables, as anyprocess is influenced by several variables.
In recent years, the use of a statistical approach involvingPlackett–Burman designing and response surface methodol-ogy (RSM) has gained much impetus for medium optimiza-tion and understanding the interactions among variousphysicochemical parameters using a minimum number ofexperiments. The Plackett–Burman design allows the screen-ing of main factors from a large number of variables thatcan be retained in further optimization processes (Plackettand Burman 1946). The RSM is a time-saving method thatreveals the interactions that occur among the components ofthe medium (Adinarayana and Ellaiah 2002). RSM is a col-lection of statistical techniques for designing experiments,building models, evaluating the effects of factors, andsearching optimum conditions of studied factors for desir-
able responses. Few studies have been reported concerningculture medium optimization for fibrinolytic enzyme pro-duction using statistical experimental methods (Liu et al.2005; Deepak et al. 2008).
During a screening program, a fibrinolytic activity pro-ducing strain was isolated and identified as B. subtilis. Theobjective of this study was to identify significant variablesinfluencing fibrinolytic enzymes production by B. subtilisA26 using the Plackett–Burman design. The levels of thesignificant variables were further optimized using RSM.The biochemical properties of crude enzyme were also de-termined.
Materials and methods
ChemicalsAll microbiological media components were from Bio-
Rad (France). Fibrin bovine for fibrinolytic assay was pur-chased from MP Biomedical Co. (St. Louis, Missouri). Mir-abilis jalaba tuber powder (MJTP), shrimp wastes powder(SWP), and chicken feather powder (CFP) were prepared inour laboratory. Hulled grain of wheat (HGW) is a by-prod-uct of semolina factories that contains 50%–60% starch,8%–12% proteins, 15% cellulose, and 5% carbohydrates.All other chemicals were of analytical grade.
To obtain MJTP, raw material was peeled, grinded, andthen dried at 80 8C for at least 5 h. The dried preparationwas minced again to obtain a fine powder and then storedin glass bottles at room temperature. The MJTP contained32.6 ± 2% starch, 17.3 ± 3% proteins, 20 ± 2% ash, andlow lipid content.
To obtain SWP, shrimp waste, collected from the marinefood processing industry, was washed thoroughly with tapwater and then cooked for 20 min at 100 8C. The solid ma-terial obtained was dried, minced to obtain a fine powder,and then stored in glass bottles at room temperature. TheSWP contained high protein content (46%–49%), relativelyhigh ash and chitin contents (27%–35% and 17%–20%, re-spectively), and low lipid content (5%–6.5%) (Jellouli et al.2008).
Isolation of fibrinolytic enzyme producing strainsThe fibrinolytic enzyme producing bacterium A26 was
isolated from seawater in Sfax City (Tunisia). Samples col-lected were plated onto skim-milk agar plates containing5.0 g�L–1 peptone, 3.0 g�L–1 yeast extract, 12.0 g�L–1 bacter-iological agar, and 250 mL of skim-milk. Plates were incu-bated for 24–48 h at 37 8C. A clear zone of skim-milkhydrolysis gave an indication of protease-producing strains.Different colonies from the plates were purified through re-peated streaking on fresh agar plates. Purified colonies werefinally transferred to fibrin agar plates composed of 5.0 g�L–1
fibrin, 2.0 g�L–1 ammonium sulfate, 1.0 g�L–1 CaCl2, 0.1 g�L–1
K2HPO4, 0.1 g�L–1 KH2PO4, 0.2 g�L–1 MgSO4�7H2O, and18.0 g�L–1 agar, pH 8.0. Plates were then incubated at 37 8Cfor 24 h. Isolates, which formed a clear zone around the colo-nies on fibrin agar medium, were isolated for the subsequentinvestigation.
Microorganism and taxonomic studyStrain A26 was identified as B. subtilis on the basis of
1050 Can. J. Microbiol. Vol. 55, 2009
Published by NRC Research Press
Can
. J. M
icro
biol
. Dow
nloa
ded
from
ww
w.n
rcre
sear
chpr
ess.
com
by
Uni
vers
ity o
f Q
ueen
slan
d on
06/
20/1
3Fo
r pe
rson
al u
se o
nly.
rRNA 16S gene sequence analysis. The rRNA 16S gene ofthe isolate was amplified by use of the upstream primer P1(5’-GCTAACTAACGTGCCAGCAG-3’) and the down-stream primer P2 (5’-CCCGGGATCCAAGCTTAAG-GAGGTGATCCAGCC-3’), which generate a fragment ofapproximately 1 kb. Amplification of DNA was carried outusing a Techne FT Gene 2D thermocycler under the follow-ing conditions: denaturation at 94 8C for 5 min followed by30 cycles of 94 8C for 1 min, 59 8C for 1 min, and 72 8C for2 min and a final extension at 72 8C for 15 min.
The DNA nucleotide sequence was determined by the di-deoxynucleotide chain termination method (Sanger et al.1977) using an ABI PRISM 3100 Avant sequencer (AppliedBiosystem) according to the manufacturer’s instructions.Two independent PCR products were sequenced in both di-rections to confirm the fidelity of the sequence. Sequencecomparison with the databases was performed using BLASTthrough the National Center of Biotechnology Informationserver (Altschul et al. 1997).
The 992 bp rRNA 16S gene sequence of B. subtilis A26has been submitted to the GenBank database and assignedaccession No. EU684320. Bacillus subtilis A26 is availablein the strain collection of Centre de Biotechnologie de Sfax,Tunisia, and assigned accession No. CTM 50700.
Culture and growth conditionsThe initial medium used for the production of fibrinolytic
enzyme by B. subtilis A26 was composed of 10.0 g�L–1
starch, 2.0 g�L–1 yeast extract, 0.1 g�L–1 K2HPO4, 0.1 g�L–1
KH2PO4, and 2.0 g�L–1 CaCl2, pH 8.0. Inocula were rou-tinely grown in Luria–Bertani broth medium composed of10.0 g�L–1 peptone, 5.0 g�L–1 yeast extract, and 5.0 g�L–1
NaCl (Miller 1972). Media were autoclaved at 120 8C for20 min. Cultivations were conducted on a rotatory shaker(200 rpm) in 250 mL Erlenmeyer flasks with a working vol-ume of 25 mL for 24 h at 37 8C. The culture medium wascentrifuged at 8000g for 15 min at 4 8C and the cell-freesupernatant was used for estimation of fibrinolytic activity.
Biochemical properties of the fibrinolytic enzymes
Assay of fibrinolytic activityFibrinolytic activity was measured by the method of
Kembhavi et al. (1993) using fibrin as a substrate. Enzymesolution (0.5 mL), suitably diluted, was mixed with 0.5 mLof 0.1 mol�L–1 Tris–HCl (pH 8.0) containing 1% (m/v) fi-brin and incubated for 15 min at 60 8C. The reaction wasstopped by addition of 0.5 mL of 20% (m/v) trichloroaceticacid. The mixture was allowed to stand at room tempera-ture for 15 min and then centrifuged at 10 000g for15 min to remove the precipitate. The absorbance wasmeasured at 280 nm. A standard curve was generated usingsolutions of 0–50 mg�L–1 tyrosine. One unit of protease ac-tivity was defined as the amount of enzyme that liberated1 mg of tyrosine per minute under the experimental condi-tions used.
Influence of protease inhibitors and metal ions on enzymeactivity
The effects of various enzyme inhibitors on protease ac-tivity were studied using phenylmethylsulfonyl fluoride
(PMSF), ethylenediaminetetraacetic acid (EDTA), and 5,5’-dithiobis(2-nitrobenzoic acid) (DTNB). The crude enzymewas preincubated with the inhibitors for 30 min at 30 8Cand the remaining enzyme activity was determined using1% (m/v) fibrin as a substrate. The activity of the enzymedetermined without any inhibitor was considered as 100%.
The effect of various metal ions (0.005 mol�L–1) on en-zyme activity was investigated by adding monovalent (Na+
or K+) or divalent (Ca2+, Mn2+, Zn2+, Cu2+, Ba2+, Mg2+, or
Hg2+) metal ions to the reaction mixture. The activity ofthe enzyme without any metallic ions was considered as100%.
Effect of pH and temperature on fibrinolytic enzymeactivity and stability
The optimum pH of the crude enzyme was studied over apH range of 2.0–13.0 at 60 8C using 1% (m/v) fibrin as asubstrate. For the measurement of pH stability, the enzymepreparation was incubated for 1 h at 30 8C in different buf-fers and the residual fibrinolytic activity was determinedunder standard assay conditions. The following buffer sys-tems were used: 0.1 mol�L–1 glycine–HCl buffer (pH 2.0–4.0), 0.1 mol�L–1 sodium acetate buffer (pH 5.0–6.0),0.1 mol�L–1 potassium phosphate buffer (pH 7.0),0.1 mol�L–1 Tris–HCl buffer (pH 8.0), and 0.1 mol�L–1 gly-cine–NaOH buffer (pH 9.0–13.0).
To investigate the effect of temperature, the activity wastested using 1% (m/v) fibrin as a substrate from 30 to 70 8Cin 0.1 mol�L–1 Tris–HCl buffer, pH 8.0. Thermal stabilitywas examined by incubating the crude enzyme for 60 minat different temperatures. Aliquots were withdrawn at de-sired time intervals to test the remaining activity at pH 8.0and 60 8C. The nonheated enzyme was considered to be thecontrol (100%) activity.
Gel electrophoresis and zymography analysisSDS–PAGE was performed as described by Laemmli
(1970) using a 5% (m/v) stacking gel and a 12% (m/v) sepa-rating gel.
Casein zymography was performed to test the proteolyticactivity of the crude supernatant. The sample was notheated before electrophoresis. After electrophoresis, the gelwas submerged in 0.1 mol�L–1 Tris–HCl, pH 8.0, contain-ing 2.5% (v/v) Triton X-100 for 45 min to remove SDS(Lacks and Springhorn 1980). Triton X-100 was then re-moved by washing the gel three times with 0.1 mol�L–1
Tris–HCl, pH 8.0. The gel was then incubated with 1%(m/v) casein in 0.1 mol�L–1 Tris–HCl, pH 8.0, for 30 minat 50 8C.
In addition, fibrin zymography was performed to screenfibrinolytic enzymes. A 12% (m/v) separating gel solutionwas prepared with 3% (m/v) fibrin. After running, the gelwas treated with Triton X-100 as described above and thenincubated for 1 h at 50 8C in 0.1 mol�L–1 Tris–HCl,pH 8.0. Finally, after incubations, gels were stained with0.25% Coomassie Brilliant Blue R-250 in 45% ethanol –10% acetic acid and destained with 5% ethanol – 7.5%acetic acid. The development of clear zones on the bluebackground of the gel indicated the presence of proteaseactivity.
Agrebi et al. 1051
Published by NRC Research Press
Can
. J. M
icro
biol
. Dow
nloa
ded
from
ww
w.n
rcre
sear
chpr
ess.
com
by
Uni
vers
ity o
f Q
ueen
slan
d on
06/
20/1
3Fo
r pe
rson
al u
se o
nly.
Selection of the most suitable carbon and nitrogensources by the one-variable-at-a-time approach
Initial screening of the most significant carbon and nitro-gen sources allowing the maximum protease production wasperformed by the one-variable-at-a-time approach. Twelvedifferent carbon sources at concentration of 10 g�L–1 (starch,glucose, lactose, fructose, saccharose, maltose, inulin,MJTP, soybean meal, CFP, HGW, and SWP) and nine sour-ces of azote at concentration of 2 g�L–1 (casein peptone,yeast extract, fibrin, gelatine, soy peptone, casein, urea,(NH4)2SO4, and NH4Cl) were individually evaluated fortheir performance in fibrinolytic enzyme production.
All experiments were conducted in triplicate. In the inves-tigation of carbon sources, cultivations were carried out inthe initial medium containing yeast extract as nitrogensource. In the screening of nitrogen sources, cultivationswere conducted with the initial medium supplemented withthe best carbon source.
Identification of the significant variables by the Plackett–Burman design
The Plackett–Burman design was used to determine whichnutrients had a significant effect on protease production. ThePlackett–Burman experimental design is a two-factorial de-sign that identifies the main physicochemical parameters re-quired for elevated fibrinolytic enzyme production byscreening N variables in N + 1 experiments; each variablewas examined at two levels: –1 for a low level and +1 for ahigh level (Plackett and Burman 1946). The variableschosen for the present study were HGW, casein peptone,K2HPO4, KH2PO4, CaCl2, NaCl, incubation temperature,speed of agitation, initial medium pH, and inoculum size.Table 1 lists the factors under investigation as well as thelevels of each factor used in the experimental design, andTable 2 represents the design matrix and the experimentalfibrinolytic enzyme production levels. Design Expert 7.0(Stat-Ease, Inc., Minneapolis, Minnesota) was used to ana-lyze the experimental Plackett–Burman design.
Optimization of key ingredients by RSMRSM using a central composite design was adopted for
the optimization of key components to maximize proteaseproduction. The significant variables utilized were HGW,casein peptone, CaCl2, NaCl, and initial medium pH andwere assessed at five coded levels (–2.828, –1, 0, +1,and +2.828) as shown in Table 3.
A total of 27 experiments were conducted and repeatedfourfold. All variables were taken at a central coded value,which was considered as zero. The minimum and maximumranges of the variables were used, the full experimental planwith regard to their values in actual and coded form, and thecorresponding experimental and predicted responses values(Y) are provided in Table 4.
Statistical analysis and modellingThe data obtained from the RSM on fibrinolytic enzyme
production were subjected to ANOVA. Central compositedesigns with the five factors were used. After running theexperiments and measuring the activity levels, the experi-mental results of RSM were fitted via the response surfaceregression procedure using the following second-order poly-nomial equation:
½1� Y ¼ a0 þX
i
aiXi þX
ii
aiiX2i þ
X
ij
aijXiXj
where Y is the predicted fibrinolytic enzyme production (re-sponse), Xi and Xj are the levels of the independent vari-ables, a0 is the intercept term, ai is the ith linearcoefficient, aii is the ith quadratic coefficient, and aij is theijth interaction coefficient. However, in this study, the inde-pendent variables were coded as X1, X2, X5, X7, and X10 cor-responding, respectively, to HGW, casein peptone, CaCl2,NaCl, and initial medium pH (Table 1). Thus, the second-order polynomial equation can be presented as follows:
½2� Y ¼ a0 þ a1X1 þ a2X2 þ a5X5 þ a7X7 � a10X10 � a12X1X2 þ a15X1X5 � a17X1X7 þ a110X1X10 þ a25X2X5 þ a27X2X7
� a210X2X10 þ a57X5X7 � a510X5X10 þ a710X7X10 � a11X21 � a22X2
2 � a55X25 � a77X2
7 � a1010X210
The statistical significance of the model equation and themodel terms were evaluated via Fisher’s test. The qualityof fit of the second-order polynomial model equation wasexpressed via the coefficient of determination (R2) and theadjusted R2 (Adj R2). The fitted polynomial equation wasthen expressed in the form of three-dimensional surfaceplots to illustrate the relationship between the responses andthe experimental levels of each of the variables utilized inthis study.
Validation of the experimental modelThe statistical model was validated with respect to all five
variables within the design space. A random set of nine ex-perimental combinations were used to study the fibrinolyticenzyme production under the experimental conditions de-scribed above.
Results
Isolation and identification of fibrinolytic enzymeproducing strains
Protease-producing strains screened from different sea-water samples and able to grow on skim-milk agar wereplated on fibrin plates. Bacteria showing maximum zones ofclearance around their colonies were selected. Of the overmore than 10 strains screened, A26 was selected as themost potent producer of fibrinolytic activity (Fig. 1). Thestrain was identified as B. subtilis based on 16S rDNA se-quence analysis.
The fibrinolytic activity of the A26 strain was also eval-uated with the crude protease preparation in a test tube inthe presence of an artificial fibrin clot prepared by coagula-tion in a glass test tube using fresh human plasma. The clot
1052 Can. J. Microbiol. Vol. 55, 2009
Published by NRC Research Press
Can
. J. M
icro
biol
. Dow
nloa
ded
from
ww
w.n
rcre
sear
chpr
ess.
com
by
Uni
vers
ity o
f Q
ueen
slan
d on
06/
20/1
3Fo
r pe
rson
al u
se o
nly.
was completely solubilized after 3 h of incubation at pH 7.4and 37 8C revealing the presence of fibrinolytic enzyme(s)(results not shown).
Casein zymography of the crude enzyme preparation re-vealed the presence of at least seven clear zones, suggestingthe presence of at least seven proteases (Fig. 2a). Fibrin wasalso used as a substrate to reveal fibrinolytic proteasesamong caseinolytic enzymes produced by the A26 strain.Zymographic analysis showed only three clear zones, indi-cating the presence of at least three fibrinolytic enzymes(Fig. 2b).
Biochemical properties of fibrinolytic enzymes
Effect of enzyme inhibitors and metal ions on enzymeactivity
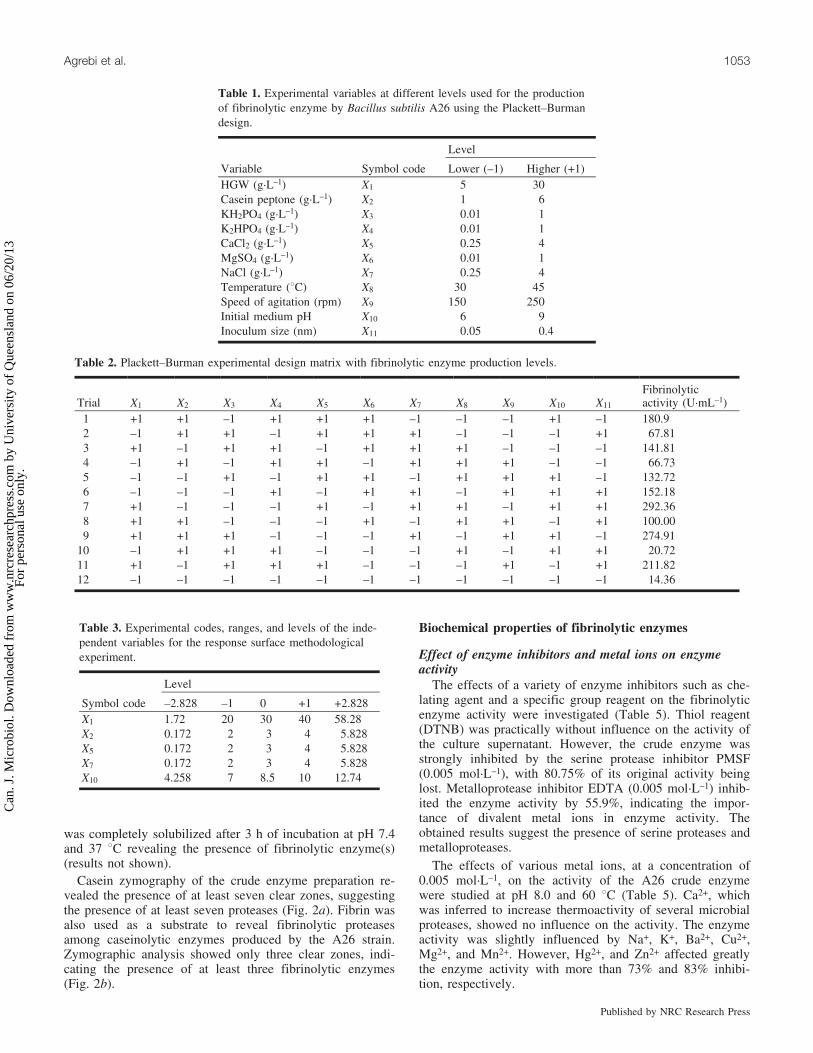
The effects of a variety of enzyme inhibitors such as che-lating agent and a specific group reagent on the fibrinolyticenzyme activity were investigated (Table 5). Thiol reagent(DTNB) was practically without influence on the activity ofthe culture supernatant. However, the crude enzyme wasstrongly inhibited by the serine protease inhibitor PMSF(0.005 mol�L–1), with 80.75% of its original activity beinglost. Metalloprotease inhibitor EDTA (0.005 mol�L–1) inhib-ited the enzyme activity by 55.9%, indicating the impor-tance of divalent metal ions in enzyme activity. Theobtained results suggest the presence of serine proteases andmetalloproteases.
The effects of various metal ions, at a concentration of0.005 mol�L–1, on the activity of the A26 crude enzymewere studied at pH 8.0 and 60 8C (Table 5). Ca2+, whichwas inferred to increase thermoactivity of several microbialproteases, showed no influence on the activity. The enzymeactivity was slightly influenced by Na+, K+, Ba2+, Cu2+,Mg2+, and Mn2+. However, Hg2+, and Zn2+ affected greatlythe enzyme activity with more than 73% and 83% inhibi-tion, respectively.
Table 1. Experimental variables at different levels used for the productionof fibrinolytic enzyme by Bacillus subtilis A26 using the Plackett–Burmandesign.
Level
Variable Symbol code Lower (–1) Higher (+1)HGW (g�L–1) X1 5 30Casein peptone (g�L–1) X2 1 6KH2PO4 (g�L–1) X3 0.01 1K2HPO4 (g�L–1) X4 0.01 1CaCl2 (g�L–1) X5 0.25 4MgSO4 (g�L–1) X6 0.01 1NaCl (g�L–1) X7 0.25 4Temperature (8C) X8 30 45Speed of agitation (rpm) X9 150 250Initial medium pH X10 6 9Inoculum size (nm) X11 0.05 0.4
Table 2. Plackett–Burman experimental design matrix with fibrinolytic enzyme production levels.
Trial X1 X2 X3 X4 X5 X6 X7 X8 X9 X10 X11
Fibrinolyticactivity (U�mL–1)
1 +1 +1 –1 +1 +1 +1 –1 –1 –1 +1 –1 180.92 –1 +1 +1 –1 +1 +1 +1 –1 –1 –1 +1 67.813 +1 –1 +1 +1 –1 +1 +1 +1 –1 –1 –1 141.814 –1 +1 –1 +1 +1 –1 +1 +1 +1 –1 –1 66.735 –1 –1 +1 –1 +1 +1 –1 +1 +1 +1 –1 132.726 –1 –1 –1 +1 –1 +1 +1 –1 +1 +1 +1 152.187 +1 –1 –1 –1 +1 –1 +1 +1 –1 +1 +1 292.368 +1 +1 –1 –1 –1 +1 –1 +1 +1 –1 +1 100.009 +1 +1 +1 –1 –1 –1 +1 –1 +1 +1 –1 274.91
10 –1 +1 +1 +1 –1 –1 –1 +1 –1 +1 +1 20.7211 +1 –1 +1 +1 +1 –1 –1 –1 +1 –1 +1 211.8212 –1 –1 –1 –1 –1 –1 –1 –1 –1 –1 –1 14.36
Table 3. Experimental codes, ranges, and levels of the inde-pendent variables for the response surface methodologicalexperiment.
Level
Symbol code –2.828 –1 0 +1 +2.828X1 1.72 20 30 40 58.28X2 0.172 2 3 4 5.828X5 0.172 2 3 4 5.828X7 0.172 2 3 4 5.828X10 4.258 7 8.5 10 12.74
Agrebi et al. 1053
Published by NRC Research Press
Can
. J. M
icro
biol
. Dow
nloa
ded
from
ww
w.n
rcre
sear
chpr
ess.
com
by
Uni
vers
ity o
f Q
ueen
slan
d on
06/
20/1
3Fo
r pe
rson
al u
se o
nly.
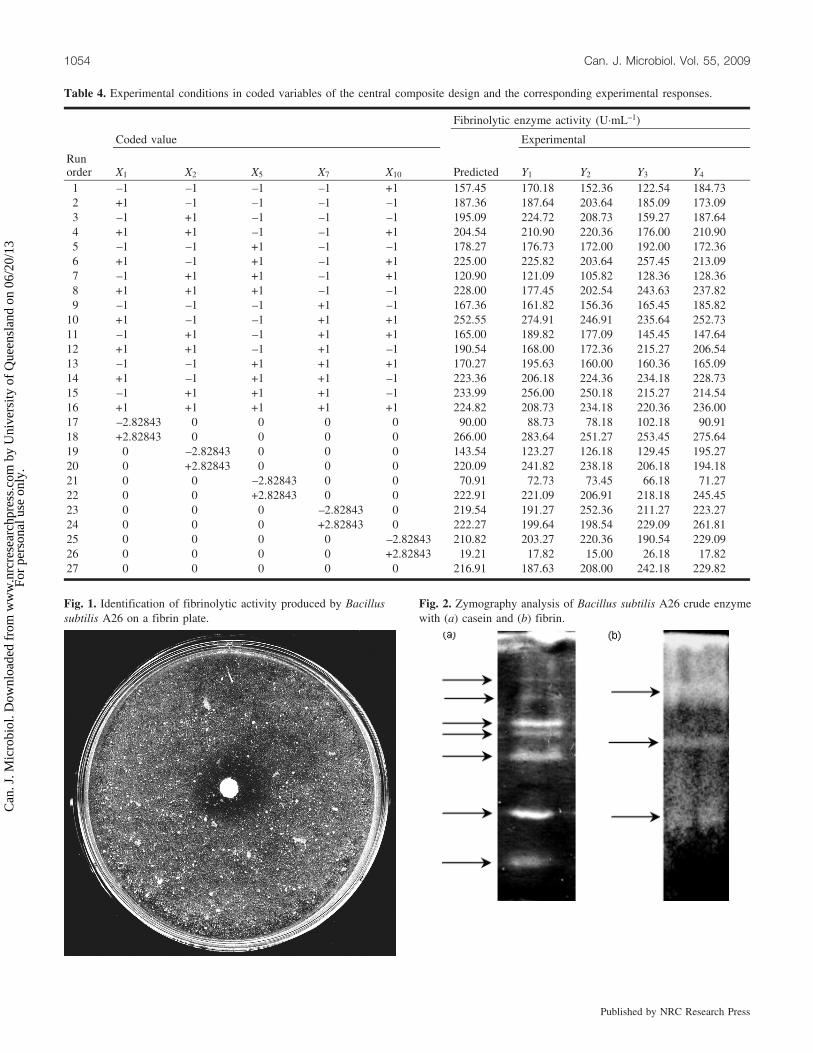
Table 4. Experimental conditions in coded variables of the central composite design and the corresponding experimental responses.
Fibrinolytic enzyme activity (U�mL–1)
Coded value Experimental
Runorder X1 X2 X5 X7 X10 Predicted Y1 Y2 Y3 Y4
1 –1 –1 –1 –1 +1 157.45 170.18 152.36 122.54 184.732 +1 –1 –1 –1 –1 187.36 187.64 203.64 185.09 173.093 –1 +1 –1 –1 –1 195.09 224.72 208.73 159.27 187.644 +1 +1 –1 –1 +1 204.54 210.90 220.36 176.00 210.905 –1 –1 +1 –1 –1 178.27 176.73 172.00 192.00 172.366 +1 –1 +1 –1 +1 225.00 225.82 203.64 257.45 213.097 –1 +1 +1 –1 +1 120.90 121.09 105.82 128.36 128.368 +1 +1 +1 –1 –1 228.00 177.45 202.54 243.63 237.829 –1 –1 –1 +1 –1 167.36 161.82 156.36 165.45 185.82
10 +1 –1 –1 +1 +1 252.55 274.91 246.91 235.64 252.7311 –1 +1 –1 +1 +1 165.00 189.82 177.09 145.45 147.6412 +1 +1 –1 +1 –1 190.54 168.00 172.36 215.27 206.5413 –1 –1 +1 +1 +1 170.27 195.63 160.00 160.36 165.0914 +1 –1 +1 +1 –1 223.36 206.18 224.36 234.18 228.7315 –1 +1 +1 +1 –1 233.99 256.00 250.18 215.27 214.5416 +1 +1 +1 +1 +1 224.82 208.73 234.18 220.36 236.0017 –2.82843 0 0 0 0 90.00 88.73 78.18 102.18 90.9118 +2.82843 0 0 0 0 266.00 283.64 251.27 253.45 275.6419 0 –2.82843 0 0 0 143.54 123.27 126.18 129.45 195.2720 0 +2.82843 0 0 0 220.09 241.82 238.18 206.18 194.1821 0 0 –2.82843 0 0 70.91 72.73 73.45 66.18 71.2722 0 0 +2.82843 0 0 222.91 221.09 206.91 218.18 245.4523 0 0 0 –2.82843 0 219.54 191.27 252.36 211.27 223.2724 0 0 0 +2.82843 0 222.27 199.64 198.54 229.09 261.8125 0 0 0 0 –2.82843 210.82 203.27 220.36 190.54 229.0926 0 0 0 0 +2.82843 19.21 17.82 15.00 26.18 17.8227 0 0 0 0 0 216.91 187.63 208.00 242.18 229.82
Fig. 1. Identification of fibrinolytic activity produced by Bacillussubtilis A26 on a fibrin plate.
Fig. 2. Zymography analysis of Bacillus subtilis A26 crude enzymewith (a) casein and (b) fibrin.
1054 Can. J. Microbiol. Vol. 55, 2009
Published by NRC Research Press
Can
. J. M
icro
biol
. Dow
nloa
ded
from
ww
w.n
rcre
sear
chpr
ess.
com
by
Uni
vers
ity o
f Q
ueen
slan
d on
06/
20/1
3Fo
r pe
rson
al u
se o
nly.
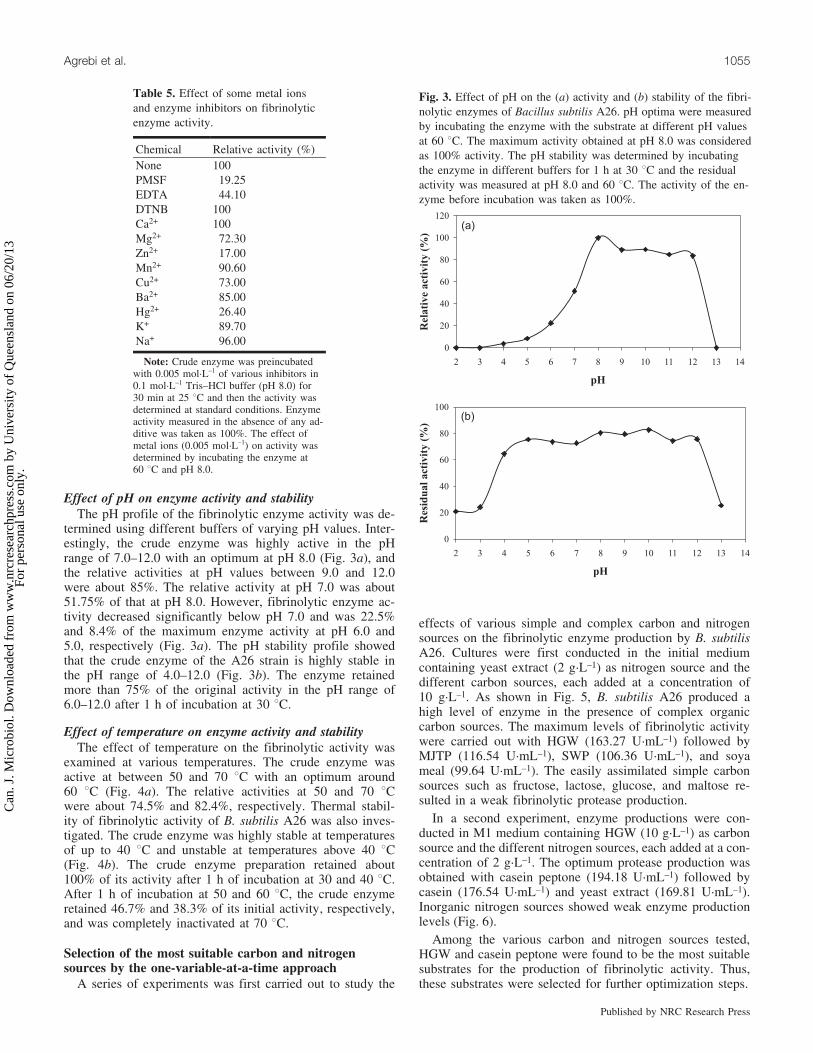
Effect of pH on enzyme activity and stabilityThe pH profile of the fibrinolytic enzyme activity was de-
termined using different buffers of varying pH values. Inter-estingly, the crude enzyme was highly active in the pHrange of 7.0–12.0 with an optimum at pH 8.0 (Fig. 3a), andthe relative activities at pH values between 9.0 and 12.0were about 85%. The relative activity at pH 7.0 was about51.75% of that at pH 8.0. However, fibrinolytic enzyme ac-tivity decreased significantly below pH 7.0 and was 22.5%and 8.4% of the maximum enzyme activity at pH 6.0 and5.0, respectively (Fig. 3a). The pH stability profile showedthat the crude enzyme of the A26 strain is highly stable inthe pH range of 4.0–12.0 (Fig. 3b). The enzyme retainedmore than 75% of the original activity in the pH range of6.0–12.0 after 1 h of incubation at 30 8C.
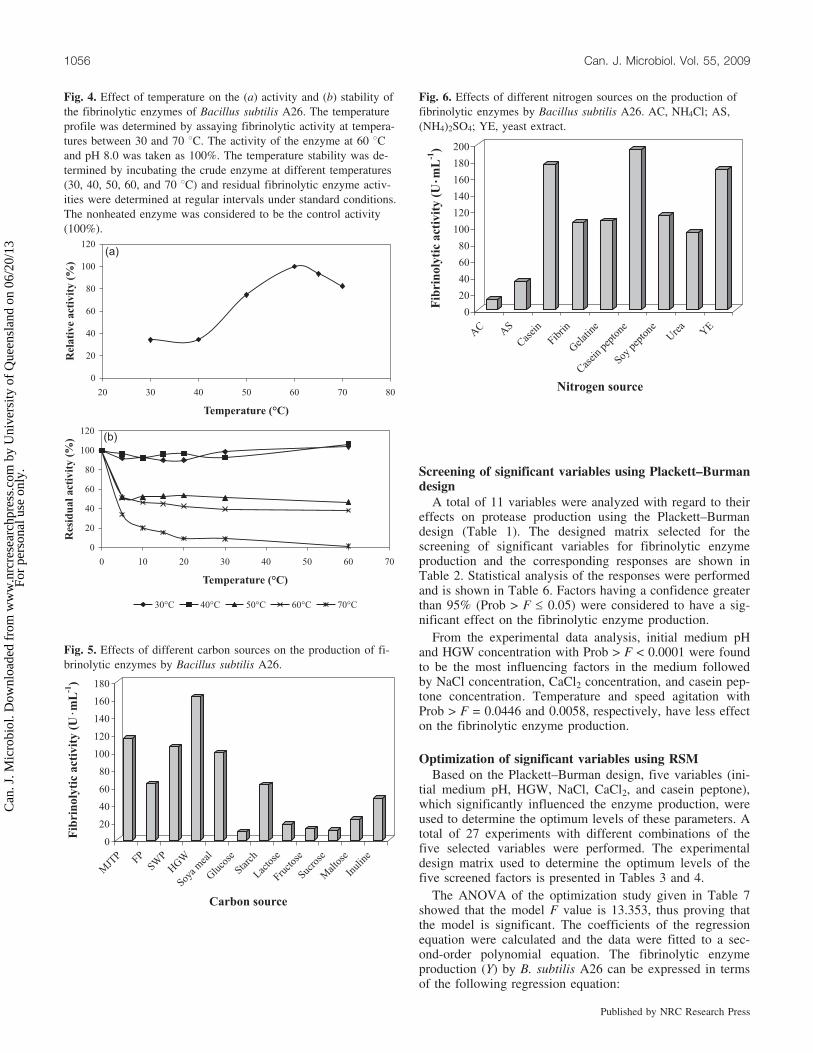
Effect of temperature on enzyme activity and stabilityThe effect of temperature on the fibrinolytic activity was
examined at various temperatures. The crude enzyme wasactive at between 50 and 70 8C with an optimum around60 8C (Fig. 4a). The relative activities at 50 and 70 8Cwere about 74.5% and 82.4%, respectively. Thermal stabil-ity of fibrinolytic activity of B. subtilis A26 was also inves-tigated. The crude enzyme was highly stable at temperaturesof up to 40 8C and unstable at temperatures above 40 8C(Fig. 4b). The crude enzyme preparation retained about100% of its activity after 1 h of incubation at 30 and 40 8C.After 1 h of incubation at 50 and 60 8C, the crude enzymeretained 46.7% and 38.3% of its initial activity, respectively,and was completely inactivated at 70 8C.
Selection of the most suitable carbon and nitrogensources by the one-variable-at-a-time approach
A series of experiments was first carried out to study the
effects of various simple and complex carbon and nitrogensources on the fibrinolytic enzyme production by B. subtilisA26. Cultures were first conducted in the initial mediumcontaining yeast extract (2 g�L–1) as nitrogen source and thedifferent carbon sources, each added at a concentration of10 g�L–1. As shown in Fig. 5, B. subtilis A26 produced ahigh level of enzyme in the presence of complex organiccarbon sources. The maximum levels of fibrinolytic activitywere carried out with HGW (163.27 U�mL–1) followed byMJTP (116.54 U�mL–1), SWP (106.36 U�mL–1), and soyameal (99.64 U�mL–1). The easily assimilated simple carbonsources such as fructose, lactose, glucose, and maltose re-sulted in a weak fibrinolytic protease production.
In a second experiment, enzyme productions were con-ducted in M1 medium containing HGW (10 g�L–1) as carbonsource and the different nitrogen sources, each added at a con-centration of 2 g�L–1. The optimum protease production wasobtained with casein peptone (194.18 U�mL–1) followed bycasein (176.54 U�mL–1) and yeast extract (169.81 U�mL–1).Inorganic nitrogen sources showed weak enzyme productionlevels (Fig. 6).
Among the various carbon and nitrogen sources tested,HGW and casein peptone were found to be the most suitablesubstrates for the production of fibrinolytic activity. Thus,these substrates were selected for further optimization steps.
Table 5. Effect of some metal ionsand enzyme inhibitors on fibrinolyticenzyme activity.
Chemical Relative activity (%)None 100PMSF 19.25EDTA 44.10DTNB 100Ca2+ 100Mg2+ 72.30Zn2+ 17.00Mn2+ 90.60Cu2+ 73.00Ba2+ 85.00Hg2+ 26.40K+ 89.70Na+ 96.00
Note: Crude enzyme was preincubatedwith 0.005 mol�L–1 of various inhibitors in0.1 mol�L–1 Tris–HCl buffer (pH 8.0) for30 min at 25 8C and then the activity wasdetermined at standard conditions. Enzymeactivity measured in the absence of any ad-ditive was taken as 100%. The effect ofmetal ions (0.005 mol�L–1) on activity wasdetermined by incubating the enzyme at60 8C and pH 8.0.
0
20
40
60
80
100
120
2 3 4 5 6 7 8 9 10 11 12 13 14
pH
Rel
ati
ve
act
ivit
y(%
)
0
20
40
60
80
100
2 3 4 5 6 7 8 9 10 11 12 13 14
pH
Res
idu
al
act
ivit
y(%
)
(a)
(b)
Fig. 3. Effect of pH on the (a) activity and (b) stability of the fibri-nolytic enzymes of Bacillus subtilis A26. pH optima were measuredby incubating the enzyme with the substrate at different pH valuesat 60 8C. The maximum activity obtained at pH 8.0 was consideredas 100% activity. The pH stability was determined by incubatingthe enzyme in different buffers for 1 h at 30 8C and the residualactivity was measured at pH 8.0 and 60 8C. The activity of the en-zyme before incubation was taken as 100%.
Agrebi et al. 1055
Published by NRC Research Press
Can
. J. M
icro
biol
. Dow
nloa
ded
from
ww
w.n
rcre
sear
chpr
ess.
com
by
Uni
vers
ity o
f Q
ueen
slan
d on
06/
20/1
3Fo
r pe
rson
al u
se o
nly.
Screening of significant variables using Plackett–Burmandesign
A total of 11 variables were analyzed with regard to theireffects on protease production using the Plackett–Burmandesign (Table 1). The designed matrix selected for thescreening of significant variables for fibrinolytic enzymeproduction and the corresponding responses are shown inTable 2. Statistical analysis of the responses were performedand is shown in Table 6. Factors having a confidence greaterthan 95% (Prob > F £ 0.05) were considered to have a sig-nificant effect on the fibrinolytic enzyme production.
From the experimental data analysis, initial medium pHand HGW concentration with Prob > F < 0.0001 were foundto be the most influencing factors in the medium followedby NaCl concentration, CaCl2 concentration, and casein pep-tone concentration. Temperature and speed agitation withProb > F = 0.0446 and 0.0058, respectively, have less effecton the fibrinolytic enzyme production.
Optimization of significant variables using RSMBased on the Plackett–Burman design, five variables (ini-
tial medium pH, HGW, NaCl, CaCl2, and casein peptone),which significantly influenced the enzyme production, wereused to determine the optimum levels of these parameters. Atotal of 27 experiments with different combinations of thefive selected variables were performed. The experimentaldesign matrix used to determine the optimum levels of thefive screened factors is presented in Tables 3 and 4.
The ANOVA of the optimization study given in Table 7showed that the model F value is 13.353, thus proving thatthe model is significant. The coefficients of the regressionequation were calculated and the data were fitted to a sec-ond-order polynomial equation. The fibrinolytic enzymeproduction (Y) by B. subtilis A26 can be expressed in termsof the following regression equation:
0
20
40
60
80
100
120
20 30 40 50 60 70 80
Temperature (°C)
Rel
ati
ve
act
ivit
y(%
)
0
20
40
60
80
100
120
0 10 20 30 40 50 60 70
Temperature (°C)
Res
idu
al
act
ivit
y(%
)
30°C 40°C 50°C 60°C 70°C
(a)
(b)
Fig. 4. Effect of temperature on the (a) activity and (b) stability ofthe fibrinolytic enzymes of Bacillus subtilis A26. The temperatureprofile was determined by assaying fibrinolytic activity at tempera-tures between 30 and 70 8C. The activity of the enzyme at 60 8Cand pH 8.0 was taken as 100%. The temperature stability was de-termined by incubating the crude enzyme at different temperatures(30, 40, 50, 60, and 70 8C) and residual fibrinolytic enzyme activ-ities were determined at regular intervals under standard conditions.The nonheated enzyme was considered to be the control activity(100%).
0
20
40
60
80
100
120
140
160
180
Fib
rin
oly
tic
act
ivit
y(U
·m
L-1
)
MJT
P FPSW
P
HG
W
Soyam
eal
Glu
cose
Starc
h
Lacto
se
Fruct
ose
Sucro
se
Mal
tose
Inul
ine
Carbon source
Fig. 5. Effects of different carbon sources on the production of fi-brinolytic enzymes by Bacillus subtilis A26.
0
20
40
60
80
100
120
140
160
180
200
Fib
rin
oly
tic
act
ivit
y(U
. mL
-1)
AC A
S
Cas
ein
Fibrin
Gel
atin
e
Cas
ein
pept
one
Soype
pton
eU
rea
YE
Nitrogen source
Fig. 6. Effects of different nitrogen sources on the production offibrinolytic enzymes by Bacillus subtilis A26. AC, NH4Cl; AS,(NH4)2SO4; YE, yeast extract.
1056 Can. J. Microbiol. Vol. 55, 2009
Published by NRC Research Press
Can
. J. M
icro
biol
. Dow
nloa
ded
from
ww
w.n
rcre
sear
chpr
ess.
com
by
Uni
vers
ity o
f Q
ueen
slan
d on
06/
20/1
3Fo
r pe
rson
al u
se o
nly.
½3�
Y ¼ 229:020ð�10:4402Þ þ 26:0308ð�2:84999ÞX1 þ 6:41036ð�2:84999ÞX2 þ 15:6878ð�2:84999ÞX5
þ 4:73834ð�2:84999ÞX7 � 19:1491ð�2:84999ÞX10 � 5:91578ð�4:03050ÞX1X2
þ 2:18766ð�4:03050ÞX1X5 � 1:61891ð�4:03050ÞX1 þ 0:812969ð�4:03050ÞX2X7
� 10:5395ð�4:03050ÞX2X10 þ 5:11891ð�4:03050ÞX5X7 � 9:32359ð�4:03050ÞX5X10 þ 4:0X7
þ 15:7105ð�4:03050ÞX1X10 þ 0:483281ð�4:03050ÞX2X59734ð�4:03050ÞX7X10
� 6:12514ð�2:11050ÞX21 � 5:64811ð�2:11050ÞX2
2 � 10:0117ð�2:11050ÞX25
� 0:761865ð�2:11050ÞX27 � 13:9989ð�2:11050ÞX2
10
where X1 is HGW concentration, X2 is casein peptone con-centration, X5 is CaCl2 concentration, X7 is NaCl concentra-tion, and X10 is initial medium pH.
The regression equation obtained from the ANOVA indi-cated that the value of R2 is 0.754. This value indicated thatonly 24.6% of the total variation was not explained by themodel. The value of Adj R2 (0.6977) and that of the pre-dicted R2 (Pred R2 = 0.6214) were also high, indicatinghigh significance of the model (Khuri and Cornell 1987).For a good statistical model, the R2 value should be close to1.0 and all factors should be positive and close to eachother, as was found. In addition, the model has an adequateprecision value of 13.628; this suggests that the model canbe used to explore the designed space. The adequate preci-sion value is an index of the signal to noise ratio and avalue >4 is an essential prerequisite to fit the model well. Alower value of coefficient of variation (17.36) showed theexperiments’ precision and reliability (Box et al. 1978).
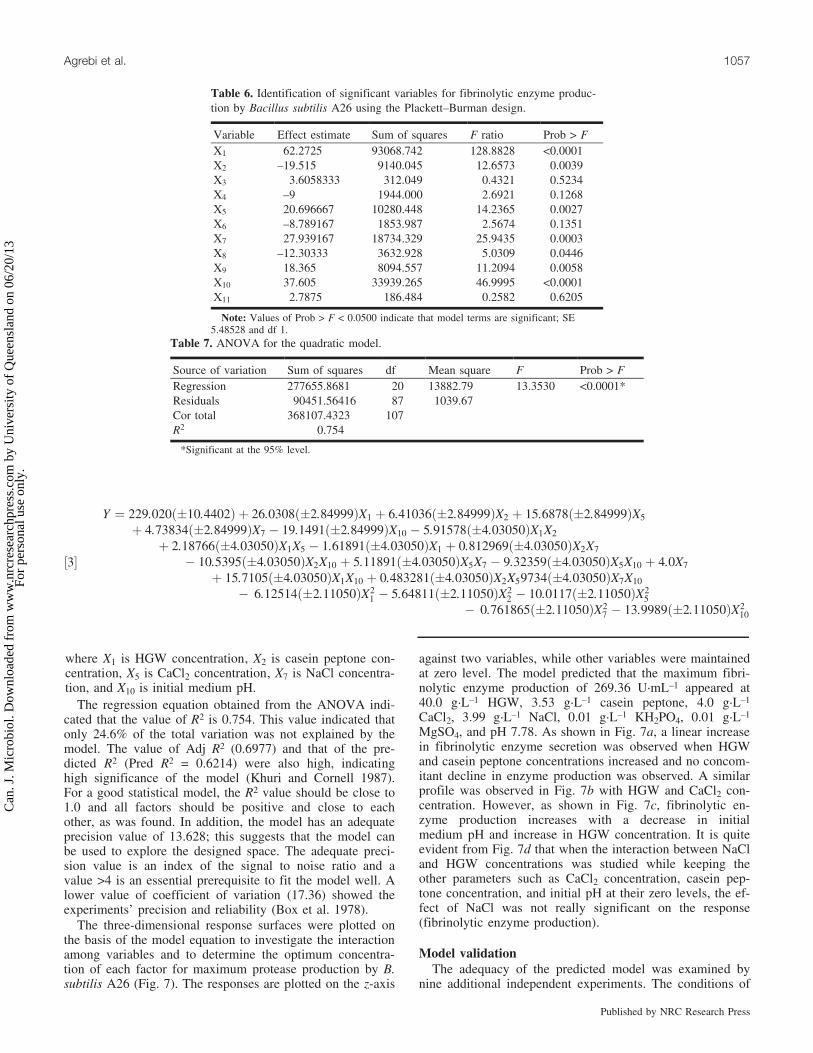
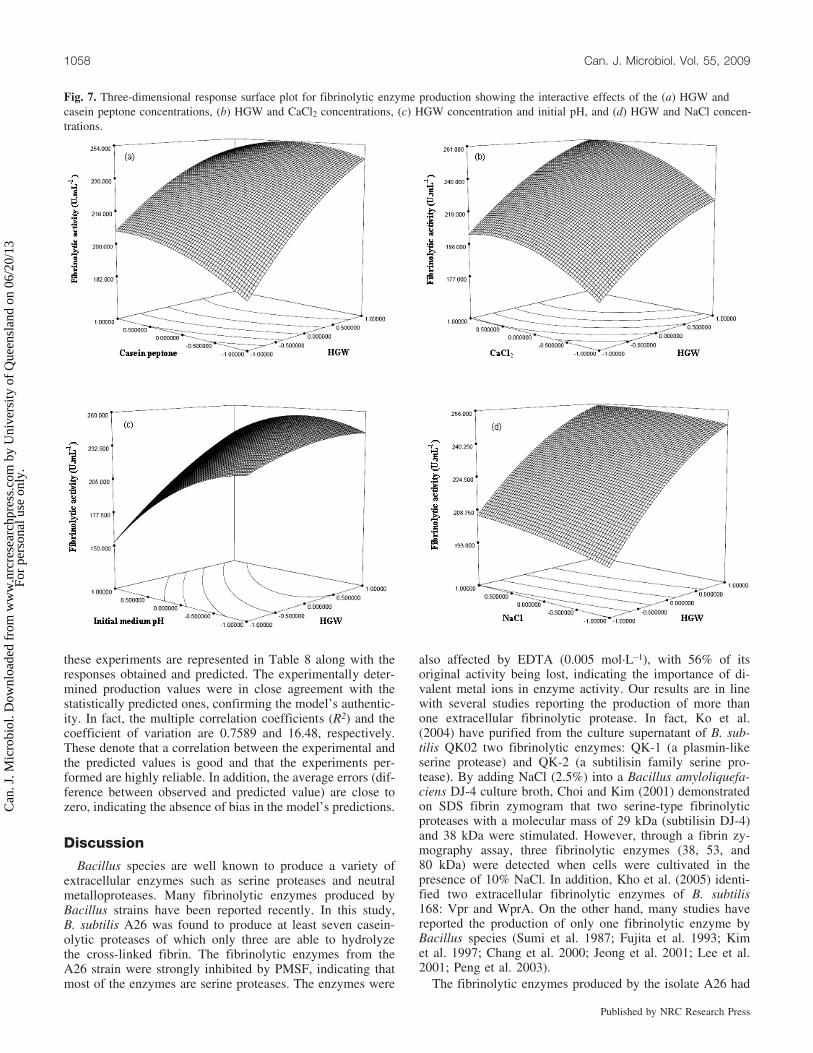
The three-dimensional response surfaces were plotted onthe basis of the model equation to investigate the interactionamong variables and to determine the optimum concentra-tion of each factor for maximum protease production by B.subtilis A26 (Fig. 7). The responses are plotted on the z-axis
against two variables, while other variables were maintainedat zero level. The model predicted that the maximum fibri-nolytic enzyme production of 269.36 U�mL–1 appeared at40.0 g�L–1 HGW, 3.53 g�L–1 casein peptone, 4.0 g�L–1
CaCl2, 3.99 g�L–1 NaCl, 0.01 g�L–1 KH2PO4, 0.01 g�L–1
MgSO4, and pH 7.78. As shown in Fig. 7a, a linear increasein fibrinolytic enzyme secretion was observed when HGWand casein peptone concentrations increased and no concom-itant decline in enzyme production was observed. A similarprofile was observed in Fig. 7b with HGW and CaCl2 con-centration. However, as shown in Fig. 7c, fibrinolytic en-zyme production increases with a decrease in initialmedium pH and increase in HGW concentration. It is quiteevident from Fig. 7d that when the interaction between NaCland HGW concentrations was studied while keeping theother parameters such as CaCl2 concentration, casein pep-tone concentration, and initial pH at their zero levels, the ef-fect of NaCl was not really significant on the response(fibrinolytic enzyme production).
Model validationThe adequacy of the predicted model was examined by
nine additional independent experiments. The conditions of
Table 6. Identification of significant variables for fibrinolytic enzyme produc-tion by Bacillus subtilis A26 using the Plackett–Burman design.
Variable Effect estimate Sum of squares F ratio Prob > FX1 62.2725 93068.742 128.8828 <0.0001X2 –19.515 9140.045 12.6573 0.0039X3 3.6058333 312.049 0.4321 0.5234X4 –9 1944.000 2.6921 0.1268X5 20.696667 10280.448 14.2365 0.0027X6 –8.789167 1853.987 2.5674 0.1351X7 27.939167 18734.329 25.9435 0.0003X8 –12.30333 3632.928 5.0309 0.0446X9 18.365 8094.557 11.2094 0.0058X10 37.605 33939.265 46.9995 <0.0001X11 2.7875 186.484 0.2582 0.6205
Note: Values of Prob > F < 0.0500 indicate that model terms are significant; SE5.48528 and df 1.
Table 7. ANOVA for the quadratic model.
Source of variation Sum of squares df Mean square F Prob > FRegression 277655.8681 20 13882.79 13.3530 <0.0001*Residuals 90451.56416 87 1039.67 . .Cor total 368107.4323 107 . . .R2 0.754 . . . .
*Significant at the 95% level.
Agrebi et al. 1057
Published by NRC Research Press
Can
. J. M
icro
biol
. Dow
nloa
ded
from
ww
w.n
rcre
sear
chpr
ess.
com
by
Uni
vers
ity o
f Q
ueen
slan
d on
06/
20/1
3Fo
r pe
rson
al u
se o
nly.
these experiments are represented in Table 8 along with theresponses obtained and predicted. The experimentally deter-mined production values were in close agreement with thestatistically predicted ones, confirming the model’s authentic-ity. In fact, the multiple correlation coefficients (R2) and thecoefficient of variation are 0.7589 and 16.48, respectively.These denote that a correlation between the experimental andthe predicted values is good and that the experiments per-formed are highly reliable. In addition, the average errors (dif-ference between observed and predicted value) are close tozero, indicating the absence of bias in the model’s predictions.
Discussion
Bacillus species are well known to produce a variety ofextracellular enzymes such as serine proteases and neutralmetalloproteases. Many fibrinolytic enzymes produced byBacillus strains have been reported recently. In this study,B. subtilis A26 was found to produce at least seven casein-olytic proteases of which only three are able to hydrolyzethe cross-linked fibrin. The fibrinolytic enzymes from theA26 strain were strongly inhibited by PMSF, indicating thatmost of the enzymes are serine proteases. The enzymes were
also affected by EDTA (0.005 mol�L–1), with 56% of itsoriginal activity being lost, indicating the importance of di-valent metal ions in enzyme activity. Our results are in linewith several studies reporting the production of more thanone extracellular fibrinolytic protease. In fact, Ko et al.(2004) have purified from the culture supernatant of B. sub-tilis QK02 two fibrinolytic enzymes: QK-1 (a plasmin-likeserine protease) and QK-2 (a subtilisin family serine pro-tease). By adding NaCl (2.5%) into a Bacillus amyloliquefa-ciens DJ-4 culture broth, Choi and Kim (2001) demonstratedon SDS fibrin zymogram that two serine-type fibrinolyticproteases with a molecular mass of 29 kDa (subtilisin DJ-4)and 38 kDa were stimulated. However, through a fibrin zy-mography assay, three fibrinolytic enzymes (38, 53, and80 kDa) were detected when cells were cultivated in thepresence of 10% NaCl. In addition, Kho et al. (2005) identi-fied two extracellular fibrinolytic enzymes of B. subtilis168: Vpr and WprA. On the other hand, many studies havereported the production of only one fibrinolytic enzyme byBacillus species (Sumi et al. 1987; Fujita et al. 1993; Kimet al. 1997; Chang et al. 2000; Jeong et al. 2001; Lee et al.2001; Peng et al. 2003).
The fibrinolytic enzymes produced by the isolate A26 had
Fig. 7. Three-dimensional response surface plot for fibrinolytic enzyme production showing the interactive effects of the (a) HGW andcasein peptone concentrations, (b) HGW and CaCl2 concentrations, (c) HGW concentration and initial pH, and (d) HGW and NaCl concen-trations.
1058 Can. J. Microbiol. Vol. 55, 2009
Published by NRC Research Press
Can
. J. M
icro
biol
. Dow
nloa
ded
from
ww
w.n
rcre
sear
chpr
ess.
com
by
Uni
vers
ity o
f Q
ueen
slan
d on
06/
20/1
3Fo
r pe
rson
al u
se o
nly.

an optimum activity at pH 8.0 and 60 8C. The crude enzymewas stable in the wide pH range of 4.0–12.0. In addition, theA26 fibrinolytic enzymes retained 100% activity after 1 h ofincubation at 30 and 40 8C. At 50 and 60 8C, the remainingactivities were 46% and 38%, respectively. Comparatively,the fibrinolytic enzyme (subtilisin DFE) from B. amylolique-faciens DC-4 had an optimum activity at pH 9.0 and 48 8C.Subtilisin DFE was very stable for 1 h at 40 8C and showed76% and 9% residual activity at 50 and 60 8C, respectively,but the fibrinolytic activity of subtilisin DFE was completelylost after incubation for 10 min at 70 8C (Peng et al. 2003).
It is well known that media components and culture con-ditions greatly influence the extracellular production of en-zymes and their interaction plays an important role in thesynthesis of these enzymes. Many attempts have been madeto improve expression of the fibrinolytic enzymes, includingthe selection of medium components. Since different mi-crobes possess diverse physiological characteristics, it isnecessary to optimize nutriment components and environ-mental conditions for cell growth and fibrinolytic enzymeproduction (Lee et al. 1999; Seo and Lee 2004). The tradi-tional one-at-a-time optimization strategy is simple andeasy; it frequently fails to locate the region of optimal re-sponse because the comprehensive effect of factors is nottaken into consideration.
Complex carbon sources were found to be excellent sub-strates for enzyme production, and the fibrinolytic enzymelevel was maximal (163.27 U�mL–1) in the presence ofHGW. In addition, powders prepared from M. jalapa tubersand from shrimp wastes were found to be a good carbonsource for fibrinolytic enzyme production. However, fibrino-lytic enzyme production by the A26 strain was very lowwhen simple carbon sources (i.e., glucose, sucrose, maltose,and lactose) were used in the culture medium. This could bedue to catabolite repression. A similar catabolic repressionmechanism for extracellular protease production has beendescribed for Bacillus sp. Ve1 (Patel et al. 2005) and Bacil-lus licheniformis NH1 (El Hadj-Ali et al. 2007), suggestingthat proteins and peptides are necessary for protease produc-tion, while carbohydrates repress protease formation(Drucker 1972; Fukushima et al. 1989).
In general, both organic and inorganic nitrogen sourceswere used efficiently for protease production. With differentorganic nitrogen sources, fibrinolytic enzyme productionranged between 105.45 and 194.2 U�mL–1 and the optimum
protease production was achieved with casein peptone fol-lowed by casein, yeast extract, soy peptone, gelatine, and fi-brin. Enzyme production was highly reduced in the presenceof inorganic nitrogen sources such as urea (94 U�mL–1),(NH4)2SO4 (34.54 U�mL–1), and NH4Cl (12.36 U�mL–1).Complex carbon and nitrogen sources were found to be suit-able substrates for the production of fibrinolytic enzyme.These findings are in line with several reports showing theenhancement of protease production in the presence of com-plex carbon (Gupta et al. 2002a; Chauhan and Gupta 2004)and organic nitrogen sources (Kalisz 1988; Srinivasan andDhar 1988; Gupta et al. 2002a). Liu et al. (2005) reportedbetter nattokinase production in the presence of a simplecarbon source.
However, the production of nattokinase by Bacillus nattoNLSSE was optimal in the presence of maltose as carbonsource, and glucose and sucrose had similar positive effectson nattokinase production (Liu et al. 2005).
These days, there is growing acceptance for the use ofstatistical experimental designs in biotechnology to optimizeculture medium components and conditions. Many studieshave reported satisfactory optimization of protease produc-tion from microbial sources using a statistical approach(Adinarayana and Ellaiah 2002; Gupta et al. 2002b; Puri etal. 2002; Beg et al. 2003; Hajji et al. 2008; Wang et al.2008). However, few studies have reported on the optimiza-tion of culture media for the production of fibrinolytic en-zyme using statistical approaches. Liu et al. (2005)employed the statistical methods fractional factorial designand central composite design to optimize the fermentationmedia for production of nattokinase and finally increasedthe fibrinolytic activity by about 6.5 times that of the origi-nal one. RSM and central composite rotary design were alsoemployed to optimize a fermentation medium for the pro-duction of nattokinase by B. subtilis at pH 7.5. The opti-mized medium resulted in a twofold increase in nattokinaseproduction (Deepak et al. 2008).
The application of statistical design for screening and op-timization of culture conditions for the production of fibri-nolytic enzymes allows quick identification of the importantfactors and interactions between them. So, the significantvariables necessary for the enhancement of fibrinolytic en-zyme production were selected using the Plackett–Burmandesign. A large variation in fibrinolytic enzyme production(14.36–292.36 U�mL–1) from that mandated by the Plackett–
Table 8. Checkpoints expressed in coded variables and the corresponding experimental and calculated responses.
Variables value Fibrinolytic enzyme production (U�mL–1)
Runorder X1 X2 X5 X7 X10 Calculated (yi) Experimental (yi) Residual (e = yi – yi)1 0.5 0.2 –0.8 –0.2 –0.5 220.911 241.45 20.5392 –0.5 –0.3 0.5 –0.2 0.5 196.112 211.27 15.1583 0.8 0.8 –0.5 –0.2 –0.3 233.991 240.73 6.7394 –0.8 –0.3 0.7 –0.2 0.4 186.668 214.91 28.2425 0.2 –0.2 0.1 –0.2 0.8 211.750 229.45 17.7006 0.7 0.9 –0.9 –0.2 –0.2 219.187 235.64 16.4537 –0.4 0.2 0.5 –0.2 0.9 181.398 203.27 21.8728 –0.3 –0.4 0.8 –0.2 –0.9 233.909 208.36 25.5499 1 1 1 –0.2 –0.86 260.669 266.36 5.691
Note: X1, HGW; X2, casein peptone; X5, CaCl2; X10, initial pH.
Agrebi et al. 1059
Published by NRC Research Press
Can
. J. M
icro
biol
. Dow
nloa
ded
from
ww
w.n
rcre
sear
chpr
ess.
com
by
Uni
vers
ity o
f Q
ueen
slan
d on
06/
20/1
3Fo
r pe
rson
al u
se o
nly.
Burman design experiments suggested a need for further op-timization. The RSM applied to the optimization of proteaseproduction in this investigation suggested the importance ofa variety of factors at different levels. The central compositedesign exploited in the present study enabled us to study andexplore the culture conditions that would support a 4.2-foldincrease in fibrinolytic enzyme production. A high degree ofsimilarity was observed between the predicted and experi-mental values that reflected the accuracy and applicabilityof RSM to optimize the process for enzyme production(Table 5).
The importance of initial pH with regard to microbial fer-mentation processes is generally accepted. As shown inFig. 7c, fibrinolytic enzyme production increased with a de-crease in the initial medium pH and an important interactionoccurred between the initial medium pH and HGW concen-tration. Our model also indicated that fibrinolytic enzymeproduction increased steadily with the increase of variousphysicochemical factors. When fibrinolytic enzyme produc-tion was selected as a response to the interaction of HGWand CaCl2 concentration as variables and the rest of parame-ters were at optimal points, it was observed that there wasan enhancement in protease production at all concentrationsof HGW and CaCl2 between minimum and maximum levels(Fig. 7b). The same interaction was observed between caseinpeptone and HGW concentrations (Figs. 7a and 7b). The fi-nal composition of the optimized medium was as follows:40 g�L–1 HGW, 3.53 g�L–1 casein peptone, g�L–1 CaCl2 4,3.99 g�L–1 NaCl, all other salts at a low level as shown inthe Plackett–Burman design, pH 7.87, temperature 37 8C,and speed of agitation 200 rpm.
The close relationship between the predicted and experi-mental response values from the validation experiment dem-onstrate the validity and acceptability of the statistical modelfor the optimization of both culture conditions and mediumnutriments, allowing for maximum fibrinolytic enzyme pro-duction. The optimization of the medium resulted in about a4.2-fold higher protease production that of the unoptimizedmedium.
AcknowledgmentsWe are grateful to Dr. Radhouane Gdoura for the help in
the identification of the strain. This work was funded by theMinistry of Higher Education, Scientific Research and Tech-nology-Tunisia.
ReferencesAdinarayana, K., and Ellaiah, P. 2002. Response surface optimiza-
tion of the critical medium components for the production of al-kaline protease by a newly isolated Bacillus sp. J. Pharm.Pharmaceut. Sci. 5: 272–278. PMID:12553896.
Altschul, S.F., Madden, T.L., Schaffer, A.A., Zhang, J., Zhang, Z.,Miller, W., and Lipman, D.J. 1997. Gapped BLAST and PSI-BLAST, a new generation of protein database search programs.Nucleic Acids Res. 25: 3389–3402. doi:10.1093/nar/25.17.3389.PMID:9254694.
Banerjee, A., Chisti, Y., and Banerjee, U.C. 2004. Streptokinase: aclinically useful thrombolytic agent. Biotechnol. Adv. 22: 287–307. doi:10.1016/j.biotechadv.2003.09.004. PMID:14697452.
Beg, Q.K., Sahai, V., and Gupta, R. 2003. Statistical media optimi-zation and alkaline protease production from Bacillus mojaven-
sis in a bioreactor. Process Biochem. 39: 203–209. doi:10.1016/S0032-9592(03)00064-5.
Box, G.E.P., Hunter, W.G., and Hunter, J.S. 1978. Statistics for ex-periments: an introduction to design data analysis and modelBuilding. John Wiley, New York. pp. 291–334.
Chang, C.T., Fan, M.H., Kuo, F.C., and Sung, H.Y. 2000. Potentfibrinolytic enzyme from a mutant of Bacillus subtilis IMR-NK1. J. Agric. Food Chem. 48: 3210–3216. doi:10.1021/jf000020k. PMID:10956093.
Chauhan, B., and Gupta, R. 2004. Application of statistical experi-mental design for optimization of alkaline protease productionfrom Bacillus sp. RGR-14. Process Biochem. 39: 2115–2122.doi:10.1016/j.procbio.2003.11.002.
Choi, H.S., and Shin, H.H. 1998. Purification and partial character-ization of a fibrinolytic protease in Pleurotus ostreatus. Mycolo-gia, 90: 674–679. doi:10.2307/3761226.
Choi, N.S., and Kim, S.H. 2001. The effect of sodium chloride onthe serine-type fibrinolytic enzymes and the thermostability ofextracellular protease from Bacillus amyloliquefaciens DJ-4. J.Biochem. Mol. Biol. 34: 134–138.
Collen, D., and Lijnen, H.R. 2004. Tissue-type plasminogen activa-tor: a historical perspective and personal account. J. Thromb.Haemost. 2: 541–546. doi:10.1111/j.1538-7933.2004.00645.x.PMID:15102005.
Deepak, V., Kalishwaralal, K., Ramkumarpandian, S., VenkateshBabu, S., Senthilkumar, S.R., and Sangiliyandi, G. 2008. Opti-mization of media composition for Nattokinase production byBacillus subtilis using response surface methodology. Bioresour.Technol. 99: 8170–8174. doi:10.1016/j.biortech.2008.03.018.PMID:18430568.
Drucker, H. 1972. Regulation of exocellular proteases in Neuro-spora crassa: induction and repression of enzyme synthesis. J.Bacteriol. 110: 1041–1049. PMID:4260559.
El Hadj-Ali, N., Agrebi, R., Ghorbel-Frikha, B., Sellami-Kamoun,A., Kanoun, S., and Nasri, M. 2007. Biochemical and molecularcharacterization of a detergent stable alkaline serine-proteasefrom a newly isolated Bacillus licheniformis NH1. Enzyme Mi-crob. Technol. 40: 515–523. doi:10.1016/j.enzmictec.2006.05.007.
Fujita, M., Nomura, K., Hong, K., Ito, Y., Asada, A., and Nishi-muro, S. 1993. Purification and characterization of a strong fi-brinolytic enzyme (nattokinase) in the vegetable cheese natto, apopular soybean fermented food in Japan. Biochem. Biophys.Res. Commun. 197: 1340–1347. doi:10.1006/bbrc.1993.2624.PMID:8280151.
Fukushima, Y., Itoh, H., Fukase, T., and Motai, H. 1989. Continu-ous protease production in a carbon-limited chemostat culture bysalt tolerant Aspergillus oryzae. Appl. Microbiol. Biotechnol. 30:604–608. doi:10.1007/BF00255366.
Gupta, R., Beg, Q.K., Khan, S., and Chauhan, B. 2002a. An over-view on fermentation, downstream processing and properties ofmicrobial alkaline proteases. Appl. Microbiol. Biotechnol. 60:381–395. doi:10.1007/s00253-002-1142-1. PMID:12466877.
Gupta, R., Beg, Q.K., and Lorenz, P. 2002b. Bacterial alkaline pro-teases: molecular approaches and industrial applications. Appl.Microbiol. Biotechnol. 59: 15–32. doi:10.1007/s00253-002-0975-y. PMID:12073127.
Hajji, M., Rebai, A., Gharsallah, N., and Nasri, M. 2008. Optimiza-tion of alkaline protease production by Aspergillus clavatus ES1in Mirabilis jalapa tuber powder using statistical experimentaldesign. Appl. Microbiol. Biotechnol. 79: 915–923. doi:10.1007/s00253-008-1508-0. PMID:18481054.
Jellouli, K., Bayoudh, A., Manni, L., Agrebi, R., and Nasri, M.2008. Purification, biochemical and molecular characterization
1060 Can. J. Microbiol. Vol. 55, 2009
Published by NRC Research Press
Can
. J. M
icro
biol
. Dow
nloa
ded
from
ww
w.n
rcre
sear
chpr
ess.
com
by
Uni
vers
ity o
f Q
ueen
slan
d on
06/
20/1
3Fo
r pe
rson
al u
se o
nly.
of a metalloprotease from Pseudomonas aeruginosa MN7 grownon shrimp wastes. Appl. Microbiol. Biotechnol. 79: 989–999.doi:10.1007/s00253-008-1517-z. PMID:18512057.
Jeong, Y.K., Park, J.U., Baek, H., Park, S.H., and Kong, I.S. 2001.Purification and biochemical characterization of a fibrinolyticenzyme from Bacillus subtilis BK-17. World J. Microbiol. Bio-technol. 17: 89–92. doi:10.1023/A:1016685411809.
Kalisz, H.M. 1988. Microbial proteinases. Adv. Biochem. Eng.Biotechnol. 36: 1–65. PMID:3142224.
Kembhavi, A.A., Kulkarni, A., and Pant, A. 1993. Salt-tolerant andthermostable alkaline protease from Bacillus subtilis NCIMNo.64. Appl. Biochem. Biotechnol. 38: 83–92. doi:10.1007/BF02916414. PMID:8346907.
Kho, C.W., Park, S.G., Cho, S., Lee, D.H., Myung, P.K., and Park,B.C. 2005. Confirmation of Vpr as a fibrinolytic enzyme presentin extracellular proteins of Bacillus subtilis. Protein Expr. Purif.39: 1–7. doi:10.1016/j.pep.2004.08.008. PMID:15596354.
Khuri, A.I., and Cornell, J.A. 1987. Response surfaces: design andanalysis. Marcel Decker Inc., New York.
Kim, H.K., Kim, G.T., Kim, D.K., Choi, W.A., Park, S.H., Jeong,Y.K., and Kong, I.S. 1997. Purification and characterization of anovel fibrinolytic enzyme from Bacillus sp. KA38 originatedfrom fermented fish. J. Ferment. Bioeng. 84: 307–312. doi:10.1016/S0922-338X(97)89249-5.
Kim, S.H., and Choi, N.S. 2000. Purification and characterizationof Subtilisin DJ-4 secreted by Bacillus sp. strain DJ-4 screenedfrom Doen-Jang. Biosci. Biotechnol. Biochem. 64: 1722–1725.doi:10.1271/bbb.64.1722. PMID:10993162.
Kim, W., Choi, K., Kim, Y., Park, H., Choi, J., Lee, Y., et al. 1996.Purification and characterization of a fibrinolytic enzyme pro-duced from Bacillus sp. strain CK 11-4 screened from chung-kook-Jang. Appl. Environ. Microbiol. 62: 2482–2488. PMID:8779587.
Kirk, O., Borchert, T.V., and Fuglsang, C.C. 2002. Industrial en-zyme applications. Curr. Opin. Biotechnol. 13: 345–351. doi:10.1016/S0958-1669(02)00328-2. PMID:12323357.
Ko, J.H., Yan, J.P., Zhu, L., and Qi, Y.P. 2004. Identification oftwo novel fibrinolytic enzymes from Bacillus subtilis QK02.Comp. Biochem. Physiol. C Toxicol. Pharmacol. 137(1): 65–74.doi:10.1016/j.cca.2003.11.008.
Lacks, S.A., and Springhorn, S.S. 1980. Renaturation of enzymesafter polyacrylamide gel electrophoresis in the presence of so-dium dodecyl sulfate. J. Biol. Chem. 255: 7467–7473. PMID:6156169.
Laemmli, U.K. 1970. Cleavage of structural proteins during the as-sembly of the head of bacteriophage T4. Nature, 227: 680–685.doi:10.1038/227680a0. PMID:5432063.
Layman, P.L. 1986. Industrial enzymes: battling to remain special-ities. Chem. Eng. News, 64: 11–14.
Lee, J., Park, S., Choi, W.A., Lee, K.H., Jeong, Y.K., Kong, I.S.,and Park, S. 1999. Production of a fibrinolytic enzyme in bior-eactor culture by Bacillus subtilis BK-17. J. Microbiol. Biotech-nol. 9: 443–449.
Lee, S.K., Bae, D.H., Kwon, T.J., Lee, S.B., Lee, H.H., Park, J.H.,et al. 2001. Purification and characterization of a fibrinolytic en-zyme from Bacillus sp. KDO-13 isolated from soybean paste. J.Microbiol. Biotechnol. 11: 845–852.
Liu, J., Xing, J., Chang, T., Ma, Z., and Liu, H. 2005. Optimizationof nutritional conditions for nattokinase production by Bacillusnatto NLSSE using statistical experimental methods. ProcessBiochem. 40: 2757–2762. doi:10.1016/j.procbio.2004.12.025.
Miller, J.H. 1972. Experiments in molecular genetics. Cold Spring
Harbor Laboratory Press, Cold Spring Harbor, New York.pp. 431–435.
Mine, Y., Wong, A.H.K., and Jiang, B. 2005. Fibrinolytic enzymesin Asian traditional fermented foods. Food Res. Int. 38: 243–250. doi:10.1016/j.foodres.2004.04.008.
Patel, R., Dodia, M., and Singh, S.P. 2005. Extracellular alkalineprotease from a newly isolated haloalkaliphilic Bacillus sp.: pro-duction and optimization. Process Biochem. 40: 3569–3575.doi:10.1016/j.procbio.2005.03.049.
Peng, Y., Huang, Q., Zhang, R.H., and Zhang, Y.Z. 2003. Purifica-tion and characterization of a fibrinolytic enzyme produced byBacillus amyloliquefaciens DC-4 screened from douchi, a tradi-tional Chinese soybean food. Comp. Biochem. Physiol. B Bio-chem. Mol. Biol. 134: 45–52. doi:10.1016/S1096-4959(02)00183-5. PMID:12524032.
Peng, Y., Yang, X., and Zhang, Y. 2005. Microbial fibrinolytic en-zymes: an overview of source, production, properties, andthrombolytic activity in vivo. Appl. Microbiol. Biotechnol. 69:126–132. doi:10.1007/s00253-005-0159-7. PMID:16211381.
Plackett, R.L., and Burman, J.P. 1946. The design of optimum mul-tifactorial experiments. Biometrika, 33: 305–325. doi:10.1093/biomet/33.4.305.
Puri, S., Beg, Q.K., and Gupta, R. 2002. Optimization of alkalineprotease production from Bacillus sp. by response surface meth-odology. Curr. Microbiol. 44: 286–290. doi:10.1007/s00284-001-0006-8. PMID:11910500.
Sanger, F., Niklen, S., and Coulson, A.R. 1977. DNA sequencingwith chain-terminating inhibitors. Proc. Natl. Acad. Sci. U.S.A.74: 5463–5467. doi:10.1073/pnas.74.12.5463. PMID:271968.
Seo, J.H., and Lee, S.P. 2004. Production of fibrinolytic enzymefrom soybean grits fermented by Bacillus firmus NA-1. J. Med.Food, 7: 442–449. doi:10.1089/jmf.2004.7.442. PMID:15671687.
Spraggon, G., Phillips, C., Nowak, U.K., Ponting, C.P., Saunders,D., Dobson, C.M., et al. 1995. The crystal structure of the cata-lytic domain of human urokinase-type plasminogen activator.Structure, 3: 681–691. doi:10.1016/S0969-2126(01)00203-9.PMID:8591045.
Srinivasan, M., and Dhar, S.C. 1988. Effect of carbon and nitrogenon exoprotease synthesis in batch cultures of Bacillus lichenifor-mis NCIM 2042. Indian J. Exp. Biol. 26: 22–24. PMID:3042617.
Sumi, H., Hamada, H., Tsushima, H., Mihara, H., and Muraki, H.1987. A novel fibrinolytic enzyme (nattokinase) in the vegetablecheese Natto; a typical and popular soybean food in the Japa-nese diet. Experientia, 43: 1110–1111. doi:10.1007/BF01956052. PMID:3478223.
Sumi, H., Hamada, H., Nakanishi, K., and Hiratani, H. 1990. En-hancement of the fibrinolytic activity in plasma by oral adminis-tration of nattokinase. Acta Haematol. 84: 139–143. doi:10.1159/000205051. PMID:2123064.
Varela, H., Ferrari, M.D., Belobradjic, L., Weyrauch, R., and Lo-perena, M.L. 1996. Effect of medium composition on the pro-duction by a new Bacillus subtilis isolate of protease withpromising unhairing activity. World J. Microbiol. Biotechnol.12: 643–645. doi:10.1007/BF00327730.
Wang, Q., Hou, Y., Xu, Z., Miao, J., and Li, G. 2008. Optimizationof cold-active protease production by the psychrophilic bacter-ium Colwellia sp. NJ341 with response surface methodology.Bioresour. Technol. 99: 1926–1931. doi:10.1016/j.biortech.2007.03.028. PMID:17499500.
Agrebi et al. 1061
Published by NRC Research Press
Can
. J. M
icro
biol
. Dow
nloa
ded
from
ww
w.n
rcre
sear
chpr
ess.
com
by
Uni
vers
ity o
f Q
ueen
slan
d on
06/
20/1
3Fo
r pe
rson
al u
se o
nly.

![Characterization of AprE176, a Fibrinolytic Enzyme from ... · Nattokinase secreted by Bacillus subtilis natto is the most well-known example [32]. Similar fibrinolytic enzymes are](https://img.pdfslide.net/doc/110x75/60041d225ce539424f66bbc2/characterization-of-apre176-a-fibrinolytic-enzyme-from-nattokinase-secreted.jpg)