Embed Size (px)
Citation preview
Principal Sponsor
Water Use and Efficiency in
Thermal Power Plants
FICCI – HSBC Knowledge Initiative

Water Use and Efficiency in
Thermal Power Plants
Principal Sponsor
FICCI – HSBC Knowledge Initiative
Water Use and Efficiency in
Thermal Power Plants
Principal Sponsor
FICCI – HSBC Knowledge Initiative
Water Use and Efficiency in Thermal Power Plants
1 Foreword . . . . . . . . . . . . . . . . . . . . . . . . . . . . . . . . . . . . . . . . . . . . . . . . . . . . . . . 01
2 Message . . . . . . . . . . . . . . . . . . . . . . . . . . . . . . . . . . . . . . . . . . . . . . . . . . . . . . . 02
3 Introduction . . . . . . . . . . . . . . . . . . . . . . . . . . . . . . . . . . . . . . . . . . . . . . . . . . . . 03
4 Water use in thermal power plants . . . . . . . . . . . . . . . . . . . . . . . . . . . . . . . . . . 04
5 Future water demand . . . . . . . . . . . . . . . . . . . . . . . . . . . . . . . . . . . . . . . . . . . . . 07
6 Water Conservation in thermal power plants . . . . . . . . . . . . . . . . . . . . . . . . . . . 09
7 Case Studies: Water efficiency in thermal power plants
Adani Power Limited . . . . . . . . . . . . . . . . . . . . . . . . . . . . . . . . . . . . . . . . . . . . . . 13
Essar Power Limited. . . . . . . . . . . . . . . . . . . . . . . . . . . . . . . . . . . . . . . . . . . . . . . 16
Jindal Power Limited . . . . . . . . . . . . . . . . . . . . . . . . . . . . . . . . . . . . . . . . . . . . . . 20
NTPC Ltd. . . . . . . . . . . . . . . . . . . . . . . . . . . . . . . . . . . . . . . . . . . . . . . . . . . . . . . . 22
TATA Power Company Limited . . . . . . . . . . . . . . . . . . . . . . . . . . . . . . . . . . . . . . . 30
v
v
v
v
v
C o n t e n t
© Federation of Indian Chambers of Commerce and IndustryFICCIFederation HouseTansen MargNew Delhi - 110001Website - www.ficci.com
This report is a product of FICCI Water Mission's interaction with the members of the Power Committee and case studies submitted to the Mission.
This compendium of case studies of water usage and management in the power sector is published under the auspices of the 'FICCI-HSBC Knowledge Initiative'. Executed by FICCI and sponsored by HSBC, the Knowledge Initiative of the Water Mission is an attempt by FICCI and HSBC to highlight best practices in water usage across key water intensive sectors within Indian industry such as power, agriculture, steel, chemicals, cement, etc.
Though utmost care has been taken to present accurate information, FICCI and HSBC makes no representation towards the completeness or correctness of the information contained herein. This document is for informational purposes only. Further, all information contained in the document are subject to change without notice.
This publication is not intended to be a substitute for professional, legal or technical advice. FICCI and HSBC does not accept any liability whatsoever for any direst or consequential loss arising for any use of this document or its contents.
Rights and permissions
The material in this publication is copyrighted. Reproduction / transmission of all or any part of this work without permission may be a violation of the applicable law. FICCI encourages you to seek permission before producing portions of this work. Inquiries in this regard can be addressed to FICCI Water Mission, FICCI Federation House, Tansen Marg, new Delhi -110001. Ph: +91-11-23738760-70 (ext - 252/488).
FICCI – HSBC Knowledge Initiative

Water Use and Efficiency in
Thermal Power Plants 01
Foreword
Water is fast becoming a scarce commodity. According to a recent estimate by the International Food
Policy Research Institute (IFPRI) and Veolia, around 36% of the world's population is already living in
water-scarce regions. Looking forward to 2050, around 52% of the world's population, producing 45%
of its GDP, is expected to be living in such regions.
Among the G-20 nations, emerging economies such as Saudi Arabia, South Africa, South Korea and
India face the largest water stress. In one of HSBC's reports entitled Scoring Climate Change Risk, 9
August 2011, we identified India as the most vulnerable nation to climate change among the G-20. 3India, once a water abundant country, with per capita water availability of around 4,100 m /capita/year
(1960) has now turned 'water stressed' with per capita water availability poised at a meagre 1580 3m /capita/year (2009). Given a highly uneven distribution of water resources between its eastern and
western halves, the national average therefore masks acute shortage of water in various states across
the country.
Among various sectors, power generation depends heavily on water and is one of the largest
consumers of water. It therefore comes as no surprise that water shortages are increasingly causing
power generation losses. The impact of water shortages on the power sector was clearly visible in the
2010 summer, when not only hydro capacity but also over 6,400MW of thermal capacity was adversely
affected by water shortages. A joint analysis by World Resource Institute (WRI) and HSBC presented in a
report entitled Over Heating, April 2010 suggests that 79% of the new generation capacity to be built
by three key power generation companies in India is located in water scarce or stressed areas.
Businesses and investors across the world are fast awakening to the reality of water scarcity and its
potential to jeopardize economic growth. Increasing significance of water for industry is reflected in a
sudden jump in institutional investors' interest in the Global Water Disclosure Project initiative.
This study by FICCI on Water Use and Efficiency in Thermal Power Plants is therefore important in
highlighting some of the best industry practices and examples for water conservation in thermal power
plants.
Naina Lal Kidwai
Senior Vice President, FICCI
& Country Head, HSBC India
Water Use and Efficiency in
Thermal Power Plants 03
IntroductionWith 3.4 per cent of global energy consumption, India is the sixth largest energy consumer in
1the world . Experiencing an average growth rate of 3.6 per cent in the past few decades, the 2
country's total demand for electricity is likely to cross 950,000 MW by 2030 . The annual per
capita consumption of power is expected to grow from 704.2 Kwh in 2008 to 1,000 Kwh by
2012 and 75 per cent of the total planned power capacity expansion is projected to come
from thermal power. Of the total power generation in the country, 65 per cent is from coal 3fired thermal power plants .
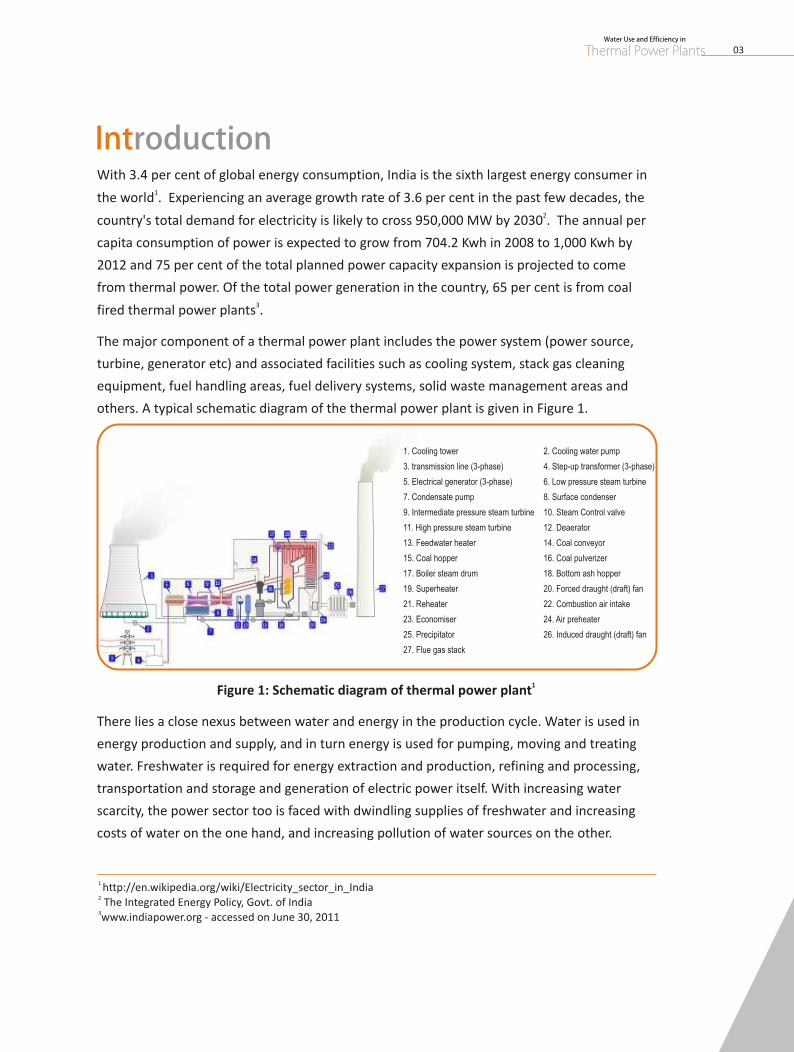
The major component of a thermal power plant includes the power system (power source,
turbine, generator etc) and associated facilities such as cooling system, stack gas cleaning
equipment, fuel handling areas, fuel delivery systems, solid waste management areas and
others. A typical schematic diagram of the thermal power plant is given in Figure 1.
1Figure 1: Schematic diagram of thermal power plant
There lies a close nexus between water and energy in the production cycle. Water is used in
energy production and supply, and in turn energy is used for pumping, moving and treating
water. Freshwater is required for energy extraction and production, refining and processing,
transportation and storage and generation of electric power itself. With increasing water
scarcity, the power sector too is faced with dwindling supplies of freshwater and increasing
costs of water on the one hand, and increasing pollution of water sources on the other.
1. Cooling tower 2. Cooling water pump
3. transmission line (3-phase) 4. Step-up transformer (3-phase)
5. Electrical generator (3-phase) 6. Low pressure steam turbine
7. Condensate pump 8. Surface condenser
9. Intermediate pressure steam turbine 10. Steam Control valve
11. High pressure steam turbine 12. Deaerator
13. Feedwater heater 14. Coal conveyor
15. Coal hopper 16. Coal pulverizer
17. Boiler steam drum 18. Bottom ash hopper
19. Superheater 20. Forced draught (draft) fan
21. Reheater 22. Combustion air intake
23. Economiser 24. Air preheater
25. Precipitator 26. Induced draught (draft) fan
27. Flue gas stack
Water Use and Efficiency in
Thermal Power Plants02
Message
1 http://en.wikipedia.org/wiki/Electricity_sector_in_India2 The Integrated Energy Policy, Govt. of India3www.indiapower.org - accessed on June 30, 2011
The thermal power sector accounts for 65 per cent of the total power generated in India. Thermal
power plants (TPPs) will play a crucial role in meeting the energy requirements in future with the per
capita electricity consumption expected to reach 1,895 Kwh in 2030.
Water is a key component in TPPs and is required for multiple processes. It is used for ash handling,
cooling tower, drinking and domestic use and for service uses like fire fighting, cleaning etc. It is said
that the thermal power sector accounts for the highest share of freshwater use in the industrial sector.
Over the past few decades, there has been a decline in freshwater water availability for TPPs. There is
also a growing realisation amongst the plant owners to conserve water and minimise the use of
freshwater through water harvesting, wastewater treatment and reuse.
FICCI Power Committee has identified water conservation as an important area of work. Member
industries of the committee have undertaken water conservation measures in their organisations.
While the scale and nature of work may vary amongst different companies, it is true that Indian power
companies are seriously taking steps to reduce their water footprint.
The publication 'Water Use and Efficiency on Thermal Power Plants' is an attempt to highlight some of
the efforts of Indian companies in the area of water management. The case studies documented in the
publication depict a variety of measures various power companies have undertaken. These range from
desalination, rainwater harvesting, wastewater treatment, optimising ash-water ratio and introduction
of less water intensive technology. Power companies are committed to reducing their freshwater intake
thereby contributing to the cause of environmental protection.
I hope that the publication will serve as a valuable resource and would enable sharing of best practices
within the thermal power sector.
RS Sharma
Chair - FICCI Power Committee
& MD, Jindal Power Limited
Water Use and Efficiency in
Thermal Power Plants 03
IntroductionWith 3.4 per cent of global energy consumption, India is the sixth largest energy consumer in
1the world . Experiencing an average growth rate of 3.6 per cent in the past few decades, the 2
country's total demand for electricity is likely to cross 950,000 MW by 2030 . The annual per
capita consumption of power is expected to grow from 704.2 Kwh in 2008 to 1,000 Kwh by
2012 and 75 per cent of the total planned power capacity expansion is projected to come
from thermal power. Of the total power generation in the country, 65 per cent is from coal 3fired thermal power plants .
The major component of a thermal power plant includes the power system (power source,
turbine, generator etc) and associated facilities such as cooling system, stack gas cleaning
equipment, fuel handling areas, fuel delivery systems, solid waste management areas and
others. A typical schematic diagram of the thermal power plant is given in Figure 1.
1Figure 1: Schematic diagram of thermal power plant
There lies a close nexus between water and energy in the production cycle. Water is used in
energy production and supply, and in turn energy is used for pumping, moving and treating
water. Freshwater is required for energy extraction and production, refining and processing,
transportation and storage and generation of electric power itself. With increasing water
scarcity, the power sector too is faced with dwindling supplies of freshwater and increasing
costs of water on the one hand, and increasing pollution of water sources on the other.
1. Cooling tower 2. Cooling water pump
3. transmission line (3-phase) 4. Step-up transformer (3-phase)
5. Electrical generator (3-phase) 6. Low pressure steam turbine
7. Condensate pump 8. Surface condenser
9. Intermediate pressure steam turbine 10. Steam Control valve
11. High pressure steam turbine 12. Deaerator
13. Feedwater heater 14. Coal conveyor
15. Coal hopper 16. Coal pulverizer
17. Boiler steam drum 18. Bottom ash hopper
19. Superheater 20. Forced draught (draft) fan
21. Reheater 22. Combustion air intake
23. Economiser 24. Air preheater
25. Precipitator 26. Induced draught (draft) fan
27. Flue gas stack
Water Use and Efficiency in
Thermal Power Plants02
Message
1 http://en.wikipedia.org/wiki/Electricity_sector_in_India2 The Integrated Energy Policy, Govt. of India3www.indiapower.org - accessed on June 30, 2011
The thermal power sector accounts for 65 per cent of the total power generated in India. Thermal
power plants (TPPs) will play a crucial role in meeting the energy requirements in future with the per
capita electricity consumption expected to reach 1,895 Kwh in 2030.
Water is a key component in TPPs and is required for multiple processes. It is used for ash handling,
cooling tower, drinking and domestic use and for service uses like fire fighting, cleaning etc. It is said
that the thermal power sector accounts for the highest share of freshwater use in the industrial sector.
Over the past few decades, there has been a decline in freshwater water availability for TPPs. There is
also a growing realisation amongst the plant owners to conserve water and minimise the use of
freshwater through water harvesting, wastewater treatment and reuse.
FICCI Power Committee has identified water conservation as an important area of work. Member
industries of the committee have undertaken water conservation measures in their organisations.
While the scale and nature of work may vary amongst different companies, it is true that Indian power
companies are seriously taking steps to reduce their water footprint.
The publication 'Water Use and Efficiency on Thermal Power Plants' is an attempt to highlight some of
the efforts of Indian companies in the area of water management. The case studies documented in the
publication depict a variety of measures various power companies have undertaken. These range from
desalination, rainwater harvesting, wastewater treatment, optimising ash-water ratio and introduction
of less water intensive technology. Power companies are committed to reducing their freshwater intake
thereby contributing to the cause of environmental protection.
I hope that the publication will serve as a valuable resource and would enable sharing of best practices
within the thermal power sector.
RS Sharma
Chair - FICCI Power Committee
& MD, Jindal Power Limited
Water Use and Efficiency in
Thermal Power Plants 05
A study by NGO, Centre for Science and Environment has estimated the volume of water used
in TPPs to the tune of 35,157.4 million cubic metres (MCM) annually which constitute 87.8 per
cent of the total industrial water use. The same study using the Central Pollution Control
Board (CPCB) data has observed that the total wastewater discharged by all major industrial
sources is 83,048 million litres per day (mld). This includes 66,700 mld of cooling water
discharged by TPPs. Out of the remaining 16,348 mld of wastewater, TPPs generates another
7,275 mld as boiler blow down water and overflow from ash pond.
The figures of water use in TPPs have been computed using the specific water consumption
which is the key indicator for comparing and assessing the performance of different thermal 3power stations. The specific water consumption is generally expressed as m /MW or
litre/kWh. Table 1 below gives the specific water consumption for different power plants.
4
3Power plant type Range m */MW
Gas based power plants 1.7 - 2.0
200 MW coal based thermal power plants 4.5 - 5.0
660 MW coal based thermal power plants 4.0 - 4.5
200 MW coal based power plants with ash water recycling 3.5 - 4.0
660 MW coal based super thermal power plants with ash water recycling 3.0 - 4.0
110 MW coal based old power plants 7.0 - 8.0
3*1 M = 1000 litresData Source: The Bulletin on Energy Efficiency, 2006, Volume 7, Issue 3
Table 1: Specific water consumption of power plants
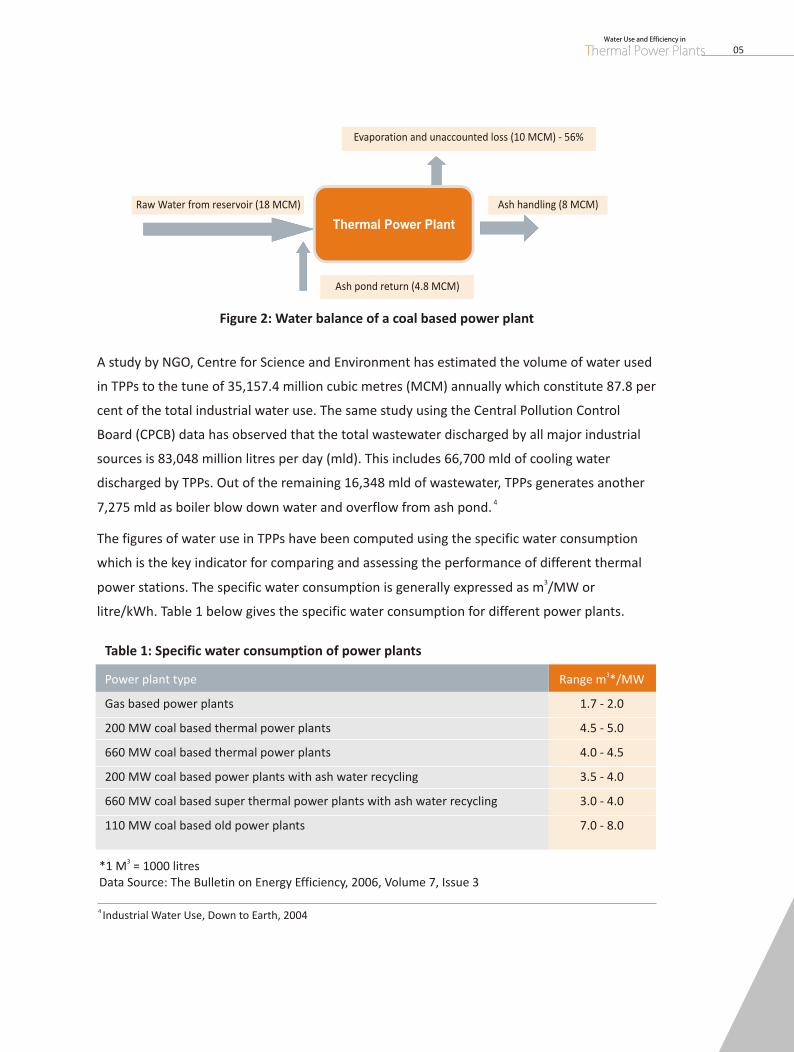
Figure 2: Water balance of a coal based power plant
Thermal Power Plant
Ash pond return (4.8 MCM)
Raw Water from reservoir (18 MCM) Ash handling (8 MCM)
Evaporation and unaccounted loss (10 MCM) - 56%
Water Use and Efficiency in
Thermal Power Plants04
The water use in TPPs can be majorly classified into the following types depending upon the
quality of water and end use considerations:
Cooling Tower Water: water used in the cooling towers.
Make-up Water: water used to compensate the loss due to evaporation of water in
the cooling tower.
Demineralised Water (DM water): water used in the boilers for generating steam is
demineralised. DM Water comes at a higher cost as compared to cooling tower water
and its use is limited for specific function.
Ash Handling Water: water used for handling ash generated during the combustion
process into slurry for disposal. It is ideal to use treated water for ash handling and
coal dust suppression.
Service Water: water used for processes like coal dust suppression, fire fighting
measures, use in toilets and other utilities, plantation and greening activities. It is ideal
to use treated water instead of freshwater for these purposes
Potable Water: water used for drinking water for the plant and the colony is known as
potable water.
The main source of water for Indian TPPs is surface water sources through rivers, canals and
ponds while in some cases groundwater sources are also used to meet the water
requirements of the TPP. The cooling water system may either be a direct cooling system for
condenser i.e without cooling towers where a substantial quantity of water is returned back
to the source, or an indirect cooling system with cooling towers which are a part of a closed
circuit system and in which case only the make-up water drawn from the source becomes
consumptive.
A typical water balance for a 660 MW coal based plant is shown in Figure 2. As seen, around
56 percent of the water goes in evaporation and unaccounted loss while ash handling takes
the remaining share of water. There is some amount of water used for the drinking water
purposes. However, this constitutes a small portion of the total water use.
v
v
v
v
v
v
Water Use in Thermal Power Plants
4 Industrial Water Use, Down to Earth, 2004
Water Use and Efficiency in
Thermal Power Plants 05
A study by NGO, Centre for Science and Environment has estimated the volume of water used
in TPPs to the tune of 35,157.4 million cubic metres (MCM) annually which constitute 87.8 per
cent of the total industrial water use. The same study using the Central Pollution Control
Board (CPCB) data has observed that the total wastewater discharged by all major industrial
sources is 83,048 million litres per day (mld). This includes 66,700 mld of cooling water
discharged by TPPs. Out of the remaining 16,348 mld of wastewater, TPPs generates another
7,275 mld as boiler blow down water and overflow from ash pond.
The figures of water use in TPPs have been computed using the specific water consumption
which is the key indicator for comparing and assessing the performance of different thermal 3power stations. The specific water consumption is generally expressed as m /MW or
litre/kWh. Table 1 below gives the specific water consumption for different power plants.
4
3Power plant type Range m */MW
Gas based power plants 1.7 - 2.0
200 MW coal based thermal power plants 4.5 - 5.0
660 MW coal based thermal power plants 4.0 - 4.5
200 MW coal based power plants with ash water recycling 3.5 - 4.0
660 MW coal based super thermal power plants with ash water recycling 3.0 - 4.0
110 MW coal based old power plants 7.0 - 8.0
3*1 M = 1000 litresData Source: The Bulletin on Energy Efficiency, 2006, Volume 7, Issue 3
Table 1: Specific water consumption of power plants
Figure 2: Water balance of a coal based power plant
Thermal Power Plant
Ash pond return (4.8 MCM)
Raw Water from reservoir (18 MCM) Ash handling (8 MCM)
Evaporation and unaccounted loss (10 MCM) - 56%
Water Use and Efficiency in
Thermal Power Plants04
The water use in TPPs can be majorly classified into the following types depending upon the
quality of water and end use considerations:
Cooling Tower Water: water used in the cooling towers.
Make-up Water: water used to compensate the loss due to evaporation of water in
the cooling tower.
Demineralised Water (DM water): water used in the boilers for generating steam is
demineralised. DM Water comes at a higher cost as compared to cooling tower water
and its use is limited for specific function.
Ash Handling Water: water used for handling ash generated during the combustion
process into slurry for disposal. It is ideal to use treated water for ash handling and
coal dust suppression.
Service Water: water used for processes like coal dust suppression, fire fighting
measures, use in toilets and other utilities, plantation and greening activities. It is ideal
to use treated water instead of freshwater for these purposes
Potable Water: water used for drinking water for the plant and the colony is known as
potable water.
The main source of water for Indian TPPs is surface water sources through rivers, canals and
ponds while in some cases groundwater sources are also used to meet the water
requirements of the TPP. The cooling water system may either be a direct cooling system for
condenser i.e without cooling towers where a substantial quantity of water is returned back
to the source, or an indirect cooling system with cooling towers which are a part of a closed
circuit system and in which case only the make-up water drawn from the source becomes
consumptive.
A typical water balance for a 660 MW coal based plant is shown in Figure 2. As seen, around
56 percent of the water goes in evaporation and unaccounted loss while ash handling takes
the remaining share of water. There is some amount of water used for the drinking water
purposes. However, this constitutes a small portion of the total water use.
v
v
v
v
v
v
Water Use in Thermal Power Plants
4 Industrial Water Use, Down to Earth, 2004
Water Use and Efficiency in
Thermal Power Plants 07
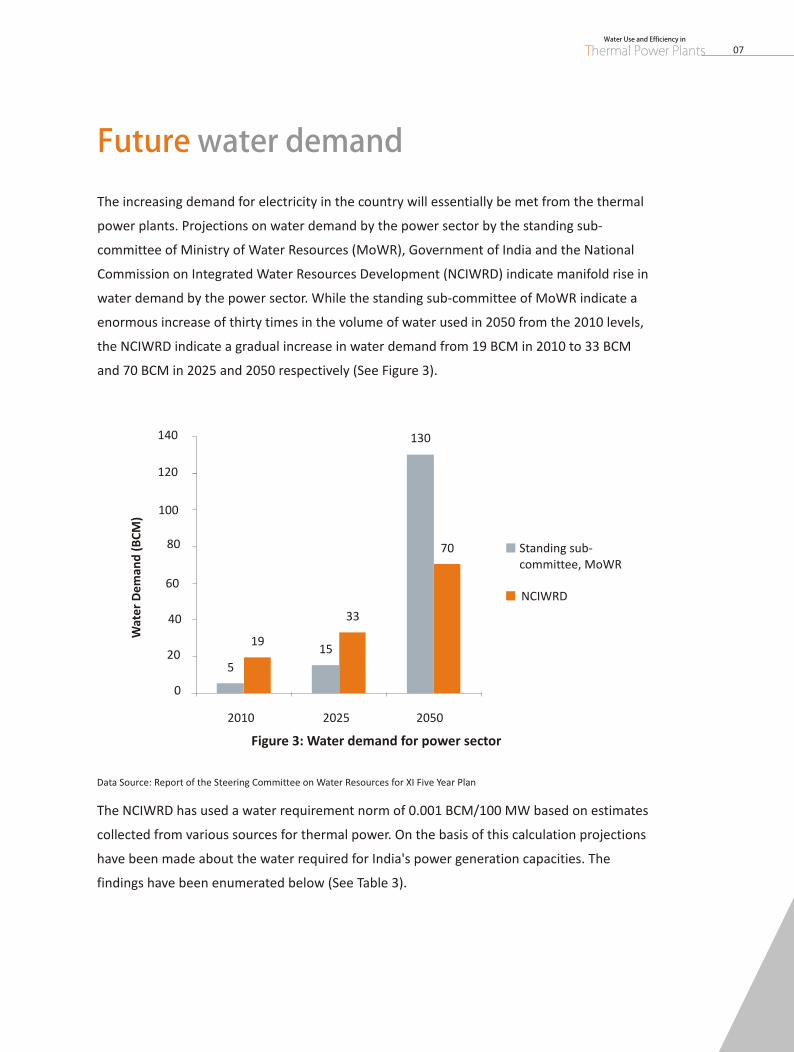
The increasing demand for electricity in the country will essentially be met from the thermal
power plants. Projections on water demand by the power sector by the standing sub-
committee of Ministry of Water Resources (MoWR), Government of India and the National
Commission on Integrated Water Resources Development (NCIWRD) indicate manifold rise in
water demand by the power sector. While the standing sub-committee of MoWR indicate a
enormous increase of thirty times in the volume of water used in 2050 from the 2010 levels,
the NCIWRD indicate a gradual increase in water demand from 19 BCM in 2010 to 33 BCM
and 70 BCM in 2025 and 2050 respectively (See Figure 3).
Data Source: Report of the Steering Committee on Water Resources for XI Five Year Plan
The NCIWRD has used a water requirement norm of 0.001 BCM/100 MW based on estimates
collected from various sources for thermal power. On the basis of this calculation projections
have been made about the water required for India's power generation capacities. The
findings have been enumerated below (See Table 3).
2010 2025 2050
5
19 15
33
140
120
100
80
60
40
20
0
130
70 Standing sub-committee, MoWR
NCIWRD
Wat
er
De
man
d (
BC
M)
Future water demand
Figure 3: Water demand for power sector
Water Use and Efficiency in
Thermal Power Plants06
3As observed the specific water consumption figures vary from 1.7 to 8.0 m /MW. This is
mainly due to the variation in size, age and the type of the plant (either coal based or gas
based), type of water circulation (once through system or cooling tower based), dry ash
handling system or wet ash handling system, provision for ash water recycling, etc.
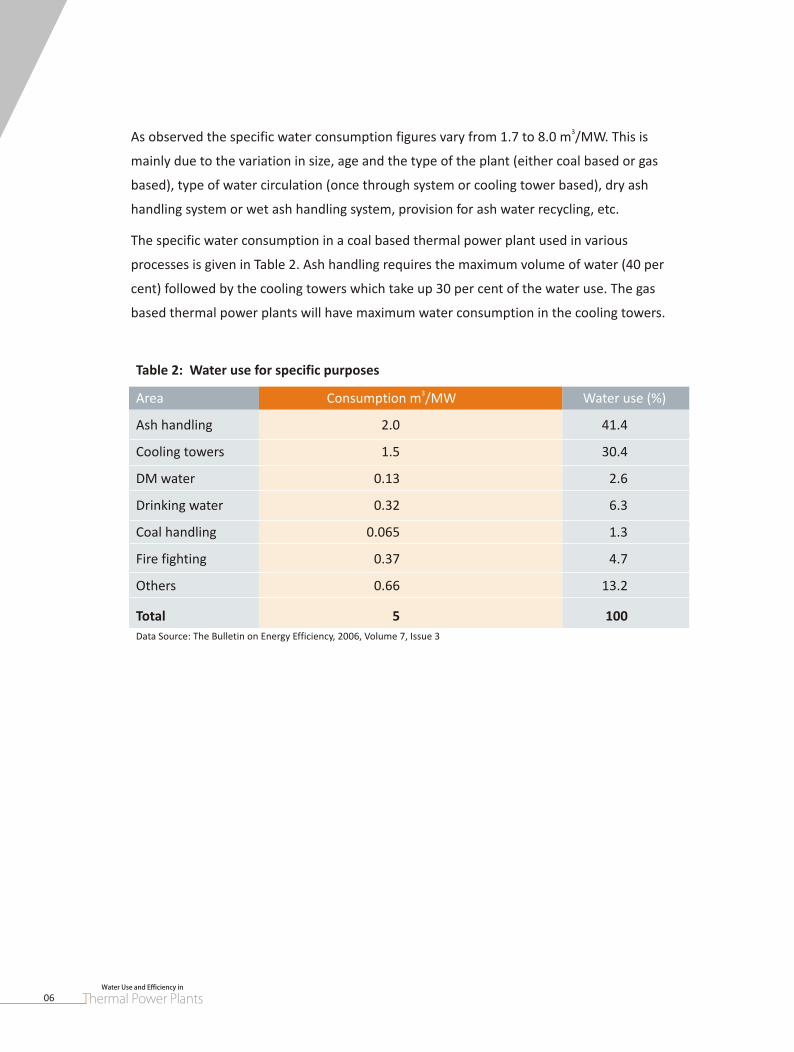
The specific water consumption in a coal based thermal power plant used in various
processes is given in Table 2. Ash handling requires the maximum volume of water (40 per
cent) followed by the cooling towers which take up 30 per cent of the water use. The gas
based thermal power plants will have maximum water consumption in the cooling towers.
3Area Consumption m /MW Water use (%)
Ash handling 2.0 41.4
Cooling towers 1.5 30.4
DM water 0.13 2.6
Drinking water 0.32 6.3
Coal handling 0.065 1.3
Fire fighting 0.37 4.7
Others 0.66 13.2
Total 5 100
Data Source: The Bulletin on Energy Efficiency, 2006, Volume 7, Issue 3
Table 2: Water use for specific purposes
Water Use and Efficiency in
Thermal Power Plants 07
The increasing demand for electricity in the country will essentially be met from the thermal
power plants. Projections on water demand by the power sector by the standing sub-
committee of Ministry of Water Resources (MoWR), Government of India and the National
Commission on Integrated Water Resources Development (NCIWRD) indicate manifold rise in
water demand by the power sector. While the standing sub-committee of MoWR indicate a
enormous increase of thirty times in the volume of water used in 2050 from the 2010 levels,
the NCIWRD indicate a gradual increase in water demand from 19 BCM in 2010 to 33 BCM
and 70 BCM in 2025 and 2050 respectively (See Figure 3).
Data Source: Report of the Steering Committee on Water Resources for XI Five Year Plan
The NCIWRD has used a water requirement norm of 0.001 BCM/100 MW based on estimates
collected from various sources for thermal power. On the basis of this calculation projections
have been made about the water required for India's power generation capacities. The
findings have been enumerated below (See Table 3).
2010 2025 2050
5
19 15
33
140
120
100
80
60
40
20
0
130
70 Standing sub-committee, MoWR
NCIWRD
Wat
er
De
man
d (
BC
M)
Future water demand
Figure 3: Water demand for power sector
Water Use and Efficiency in
Thermal Power Plants06
3As observed the specific water consumption figures vary from 1.7 to 8.0 m /MW. This is
mainly due to the variation in size, age and the type of the plant (either coal based or gas
based), type of water circulation (once through system or cooling tower based), dry ash
handling system or wet ash handling system, provision for ash water recycling, etc.
The specific water consumption in a coal based thermal power plant used in various
processes is given in Table 2. Ash handling requires the maximum volume of water (40 per
cent) followed by the cooling towers which take up 30 per cent of the water use. The gas
based thermal power plants will have maximum water consumption in the cooling towers.
3Area Consumption m /MW Water use (%)
Ash handling 2.0 41.4
Cooling towers 1.5 30.4
DM water 0.13 2.6
Drinking water 0.32 6.3
Coal handling 0.065 1.3
Fire fighting 0.37 4.7
Others 0.66 13.2
Total 5 100
Data Source: The Bulletin on Energy Efficiency, 2006, Volume 7, Issue 3
Table 2: Water use for specific purposes

Water Use and Efficiency in
Thermal Power Plants 09
The use of high volumes of water in the thermal power plants necessitates undertaking water
conservation measures. A precursor to undertaking these is a systematic water audit and
quantifying water flows at each pumping station and drawing up a water balance. Water
audits will help in quantifying the inflows and outflows, the losses or wastage which can be
optimised by taking appropriate water conservation measures. The following measures can be
undertaken for conserving water in thermal power plants:
a. Increasing cycles of concentration: Maximum water loss in the thermal power plants
occurs in the cooling towers, in the form of evaporation. Make up water is provided to
compensate for this evaporation loss, the blow down losses and drift losses. There is a 3requirement of 135 m /hr cooling water flow to the condenser to generate 1 MW. The
3expected evaporation ratio for every 1 MW of power generation is 2.0 m /hr. Since the
water is circulated many times in the closed loop, the concentration of dissolved solids
increases over a period of time. The cycles of concentration (COC) is the ratio of
dissolved solids in the circulating water to the make-up water. Cooling towers are
normally designed for a COC of around 5. By increasing COC, the blow down quantity
can be reduced by external water treatment and adding water treatment chemicals,
COC of even 10 can be reached. Increasing COC can result in significant saving of water
in TPPs.
b. Optimising ash-water ratio: Around 45-50 per cent of the total water use is consumed
in ash handling. Using the condenser outlet water instead of freshwater reduces the
intake of freshwater. Bottom ash and fly ash is flushed by high pressure water while low
pressure water is used for ash hopper filling. Bottom ash and fly ash can be handled
separately or together by mixing in a common pit. The ash slurry is then evacuated by a
series of ash slurry disposal pumps to an ash dyke. Typical design ash water ratios are
around 1:5 for fly ash and 1:8 for bottom ash. However, the actual combined ash water
ratios are found to be around1:20 or even more. For every percent reduction of ash 3
water ratio, there is a saving potential of 60 m /hr of water.
Water conservation in thermal power plants
Water Use and Efficiency in
Thermal Power Plants08
Table 3: Water required for power development
2010 2025 2050
Category Low High Low High Low High
(Economic (Economic (Economic (Economic (Economic (Economic
Growth) Growth)
Thermal 2.81 3.43 7.85 9.59 28.71 35.07
Hydropower 15.00 15.00 22.00 22.00 30.00 30.00
Nuclear 0.29 0.36 1.13 1.38 3.68 4.50
Solar / Wind 0.00 0.00 0.01 0.01 0.04 0.04
Gas Based 0.02 0.02 0.06 0.07 0.18 0.22
Total 18.10 18.80 31.10 33.10 62.60 69.80
Data Source: Phansalkar Sanjiv and Verma Shilp; India's Water Future 2050: Potential Deviations from Business as Usual, International Journal of Rural Management (2007) 3: 14
Water Use and Efficiency in
Thermal Power Plants 09
The use of high volumes of water in the thermal power plants necessitates undertaking water
conservation measures. A precursor to undertaking these is a systematic water audit and
quantifying water flows at each pumping station and drawing up a water balance. Water
audits will help in quantifying the inflows and outflows, the losses or wastage which can be
optimised by taking appropriate water conservation measures. The following measures can be
undertaken for conserving water in thermal power plants:
a. Increasing cycles of concentration: Maximum water loss in the thermal power plants
occurs in the cooling towers, in the form of evaporation. Make up water is provided to
compensate for this evaporation loss, the blow down losses and drift losses. There is a 3requirement of 135 m /hr cooling water flow to the condenser to generate 1 MW. The
3expected evaporation ratio for every 1 MW of power generation is 2.0 m /hr. Since the
water is circulated many times in the closed loop, the concentration of dissolved solids
increases over a period of time. The cycles of concentration (COC) is the ratio of
dissolved solids in the circulating water to the make-up water. Cooling towers are
normally designed for a COC of around 5. By increasing COC, the blow down quantity
can be reduced by external water treatment and adding water treatment chemicals,
COC of even 10 can be reached. Increasing COC can result in significant saving of water
in TPPs.
b. Optimising ash-water ratio: Around 45-50 per cent of the total water use is consumed
in ash handling. Using the condenser outlet water instead of freshwater reduces the
intake of freshwater. Bottom ash and fly ash is flushed by high pressure water while low
pressure water is used for ash hopper filling. Bottom ash and fly ash can be handled
separately or together by mixing in a common pit. The ash slurry is then evacuated by a
series of ash slurry disposal pumps to an ash dyke. Typical design ash water ratios are
around 1:5 for fly ash and 1:8 for bottom ash. However, the actual combined ash water
ratios are found to be around1:20 or even more. For every percent reduction of ash 3
water ratio, there is a saving potential of 60 m /hr of water.
Water conservation in thermal power plants
Water Use and Efficiency in
Thermal Power Plants08
Table 3: Water required for power development
2010 2025 2050
Category Low High Low High Low High
(Economic (Economic (Economic (Economic (Economic (Economic
Growth) Growth)
Thermal 2.81 3.43 7.85 9.59 28.71 35.07
Hydropower 15.00 15.00 22.00 22.00 30.00 30.00
Nuclear 0.29 0.36 1.13 1.38 3.68 4.50
Solar / Wind 0.00 0.00 0.01 0.01 0.04 0.04
Gas Based 0.02 0.02 0.06 0.07 0.18 0.22
Total 18.10 18.80 31.10 33.10 62.60 69.80
Data Source: Phansalkar Sanjiv and Verma Shilp; India's Water Future 2050: Potential Deviations from Business as Usual, International Journal of Rural Management (2007) 3: 14
Case Studies
Water Use and Efficiency in
Thermal Power Plants10
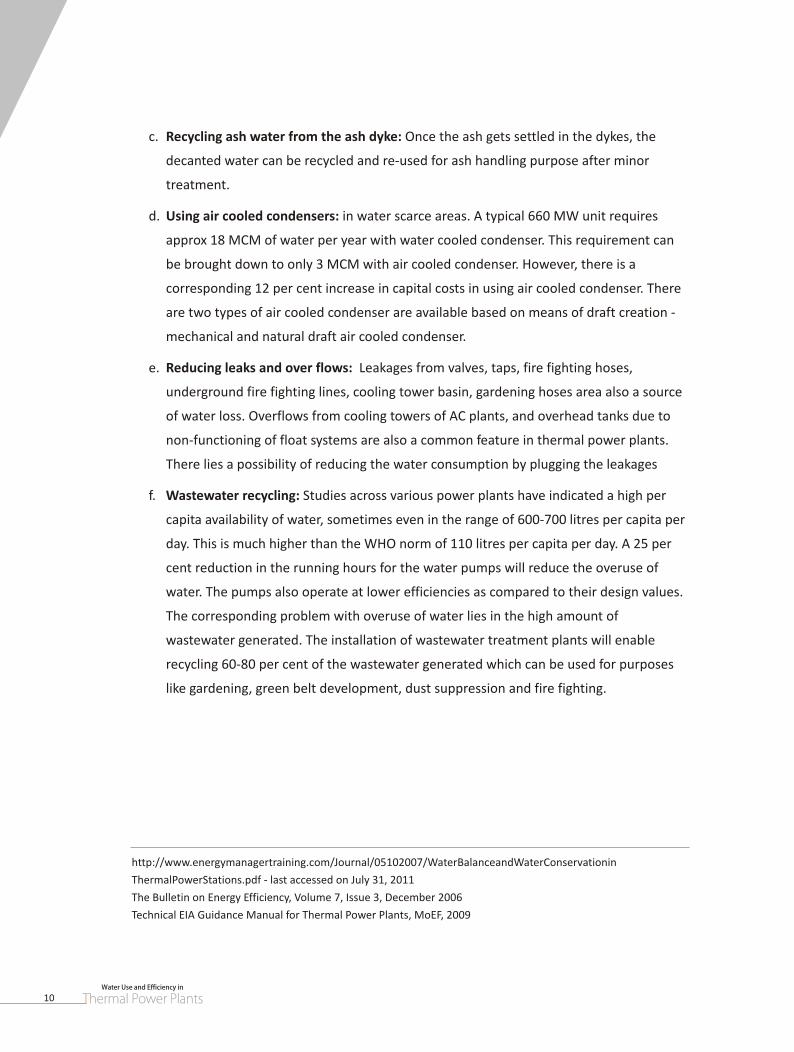
c. Recycling ash water from the ash dyke: Once the ash gets settled in the dykes, the
decanted water can be recycled and re-used for ash handling purpose after minor
treatment.
d. Using air cooled condensers: in water scarce areas. A typical 660 MW unit requires
approx 18 MCM of water per year with water cooled condenser. This requirement can
be brought down to only 3 MCM with air cooled condenser. However, there is a
corresponding 12 per cent increase in capital costs in using air cooled condenser. There
are two types of air cooled condenser are available based on means of draft creation -
mechanical and natural draft air cooled condenser.
e. Reducing leaks and over flows: Leakages from valves, taps, fire fighting hoses,
underground fire fighting lines, cooling tower basin, gardening hoses area also a source
of water loss. Overflows from cooling towers of AC plants, and overhead tanks due to
non-functioning of float systems are also a common feature in thermal power plants.
There lies a possibility of reducing the water consumption by plugging the leakages
f. Wastewater recycling: Studies across various power plants have indicated a high per
capita availability of water, sometimes even in the range of 600-700 litres per capita per
day. This is much higher than the WHO norm of 110 litres per capita per day. A 25 per
cent reduction in the running hours for the water pumps will reduce the overuse of
water. The pumps also operate at lower efficiencies as compared to their design values.
The corresponding problem with overuse of water lies in the high amount of
wastewater generated. The installation of wastewater treatment plants will enable
recycling 60-80 per cent of the wastewater generated which can be used for purposes
like gardening, green belt development, dust suppression and fire fighting.
http://www.energymanagertraining.com/Journal/05102007/WaterBalanceandWaterConservationin
ThermalPowerStations.pdf - last accessed on July 31, 2011
The Bulletin on Energy Efficiency, Volume 7, Issue 3, December 2006
Technical EIA Guidance Manual for Thermal Power Plants, MoEF, 2009
Case Studies
Water Use and Efficiency in
Thermal Power Plants10
c. Recycling ash water from the ash dyke: Once the ash gets settled in the dykes, the
decanted water can be recycled and re-used for ash handling purpose after minor
treatment.
d. Using air cooled condensers: in water scarce areas. A typical 660 MW unit requires
approx 18 MCM of water per year with water cooled condenser. This requirement can
be brought down to only 3 MCM with air cooled condenser. However, there is a
corresponding 12 per cent increase in capital costs in using air cooled condenser. There
are two types of air cooled condenser are available based on means of draft creation -
mechanical and natural draft air cooled condenser.
e. Reducing leaks and over flows: Leakages from valves, taps, fire fighting hoses,
underground fire fighting lines, cooling tower basin, gardening hoses area also a source
of water loss. Overflows from cooling towers of AC plants, and overhead tanks due to
non-functioning of float systems are also a common feature in thermal power plants.
There lies a possibility of reducing the water consumption by plugging the leakages
f. Wastewater recycling: Studies across various power plants have indicated a high per
capita availability of water, sometimes even in the range of 600-700 litres per capita per
day. This is much higher than the WHO norm of 110 litres per capita per day. A 25 per
cent reduction in the running hours for the water pumps will reduce the overuse of
water. The pumps also operate at lower efficiencies as compared to their design values.
The corresponding problem with overuse of water lies in the high amount of
wastewater generated. The installation of wastewater treatment plants will enable
recycling 60-80 per cent of the wastewater generated which can be used for purposes
like gardening, green belt development, dust suppression and fire fighting.
http://www.energymanagertraining.com/Journal/05102007/WaterBalanceandWaterConservationin
ThermalPowerStations.pdf - last accessed on July 31, 2011
The Bulletin on Energy Efficiency, Volume 7, Issue 3, December 2006
Technical EIA Guidance Manual for Thermal Power Plants, MoEF, 2009

Water Use and Efficiency in
Thermal Power Plants 13
Case Study 1: Adani Power Limited
l
l
l
Location and capacity:
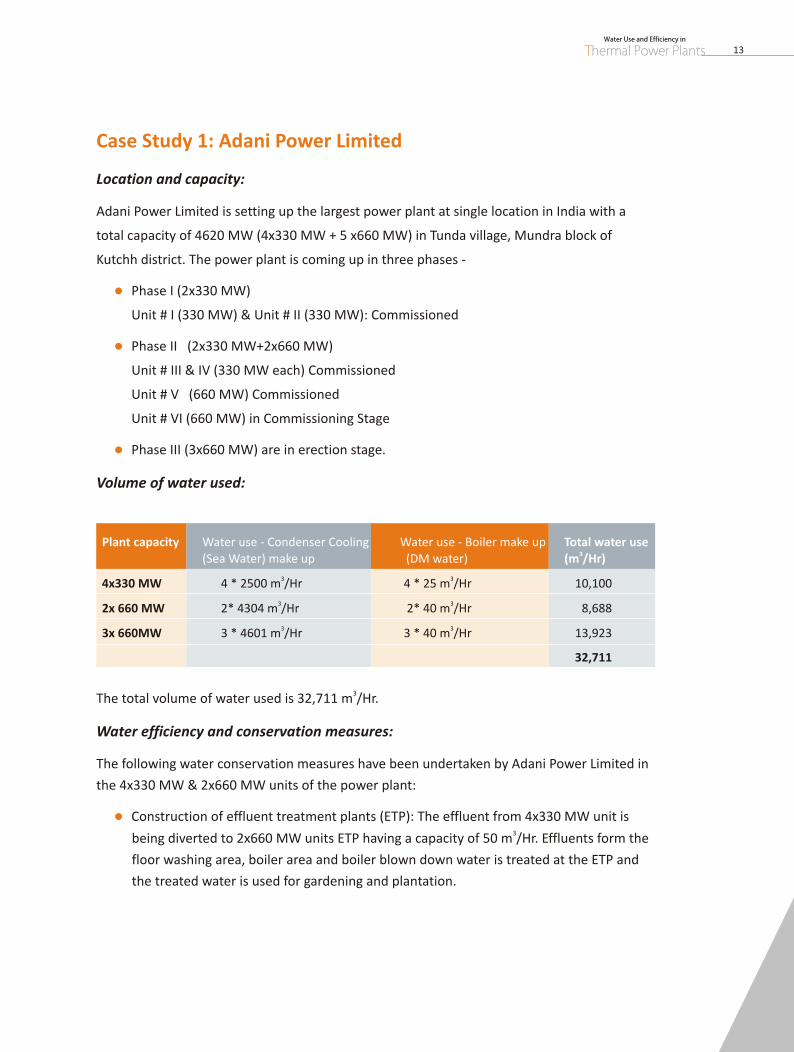
Adani Power Limited is setting up the largest power plant at single location in India with a
total capacity of 4620 MW (4x330 MW + 5 x660 MW) in Tunda village, Mundra block of
Kutchh district. The power plant is coming up in three phases -
Phase I (2x330 MW)
Unit # I (330 MW) & Unit # II (330 MW): Commissioned
Phase II (2x330 MW+2x660 MW)
Unit # III & IV (330 MW each) Commissioned
Unit # V (660 MW) Commissioned
Unit # VI (660 MW) in Commissioning Stage
Phase III (3x660 MW) are in erection stage.
Volume of water used:
3The total volume of water used is 32,711 m /Hr.
Water efficiency and conservation measures:
The following water conservation measures have been undertaken by Adani Power Limited in
the 4x330 MW & 2x660 MW units of the power plant:
Construction of effluent treatment plants (ETP): The effluent from 4x330 MW unit is 3
being diverted to 2x660 MW units ETP having a capacity of 50 m /Hr. Effluents form the
floor washing area, boiler area and boiler blown down water is treated at the ETP and
the treated water is used for gardening and plantation.
l
Plant capacity Water use - 3(Sea Water) make up (DM water) (m /Hr)
Condenser Cooling Water use - Boiler make up Total water use
3 34x330 MW 4 * 2500 m /Hr 4 * 25 m /Hr 10,100
3 32x 660 MW 2* 4304 m /Hr 2* 40 m /Hr 8,688
3 33x 660MW 3 * 4601 m /Hr 3 * 40 m /Hr 13,923
32,711
Water Use and Efficiency in
Thermal Power Plants 13
Case Study 1: Adani Power Limited
l
l
l
Location and capacity:
Adani Power Limited is setting up the largest power plant at single location in India with a
total capacity of 4620 MW (4x330 MW + 5 x660 MW) in Tunda village, Mundra block of
Kutchh district. The power plant is coming up in three phases -
Phase I (2x330 MW)
Unit # I (330 MW) & Unit # II (330 MW): Commissioned
Phase II (2x330 MW+2x660 MW)
Unit # III & IV (330 MW each) Commissioned
Unit # V (660 MW) Commissioned
Unit # VI (660 MW) in Commissioning Stage
Phase III (3x660 MW) are in erection stage.
Volume of water used:
3The total volume of water used is 32,711 m /Hr.
Water efficiency and conservation measures:
The following water conservation measures have been undertaken by Adani Power Limited in
the 4x330 MW & 2x660 MW units of the power plant:
Construction of effluent treatment plants (ETP): The effluent from 4x330 MW unit is 3
being diverted to 2x660 MW units ETP having a capacity of 50 m /Hr. Effluents form the
floor washing area, boiler area and boiler blown down water is treated at the ETP and
the treated water is used for gardening and plantation.
l
Plant capacity Water use - 3(Sea Water) make up (DM water) (m /Hr)
Condenser Cooling Water use - Boiler make up Total water use
3 34x330 MW 4 * 2500 m /Hr 4 * 25 m /Hr 10,100
3 32x 660 MW 2* 4304 m /Hr 2* 40 m /Hr 8,688
3 33x 660MW 3 * 4601 m /Hr 3 * 40 m /Hr 13,923
32,711
Water Use and Efficiency in
Thermal Power Plants 15
Water Use and Efficiency in
Thermal Power Plants14
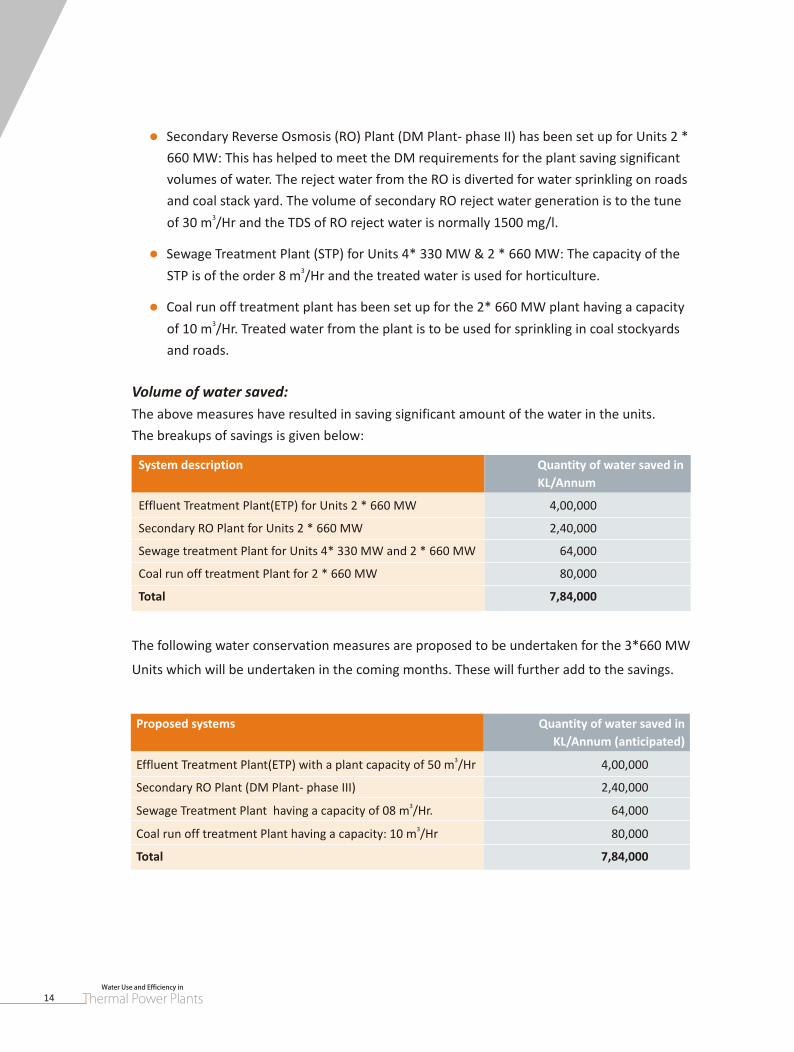
System description Quantity of water saved in
KL/Annum
Effluent Treatment Plant(ETP) for Units 2 * 660 MW
Secondary RO Plant for Units 2 * 660 MW 2,40,000
Sewage treatment Plant for Units 4* 330 MW and 2 * 660 MW 64,000
Coal run off treatment Plant for 2 * 660 MW 80,000
Total 7,84,000
4,00,000
The following water conservation measures are proposed to be undertaken for the 3*660 MW
Units which will be undertaken in the coming months. These will further add to the savings.
Proposed systems Quantity of water saved in
KL/Annum (anticipated)3Effluent Treatment Plant(ETP) with a plant capacity of 50 m /Hr 4,00,000
Secondary RO Plant (DM Plant- phase III) 2,40,0003Sewage Treatment Plant having a capacity of 08 m /Hr. 64,000
3Coal run off treatment Plant having a capacity: 10 m /Hr 80,000
Total 7,84,000
Volume of water saved:
The above measures have resulted in saving significant amount of the water in the units.
The breakups of savings is given below:
l
l
l
Secondary Reverse Osmosis (RO) Plant (DM Plant- phase II) has been set up for Units 2 *
660 MW: This has helped to meet the DM requirements for the plant saving significant
volumes of water. The reject water from the RO is diverted for water sprinkling on roads
and coal stack yard. The volume of secondary RO reject water generation is to the tune 3
of 30 m /Hr and the TDS of RO reject water is normally 1500 mg/l.
Sewage Treatment Plant (STP) for Units 4* 330 MW & 2 * 660 MW: The capacity of the 3
STP is of the order 8 m /Hr and the treated water is used for horticulture.
Coal run off treatment plant has been set up for the 2* 660 MW plant having a capacity 3
of 10 m /Hr. Treated water from the plant is to be used for sprinkling in coal stockyards
and roads.
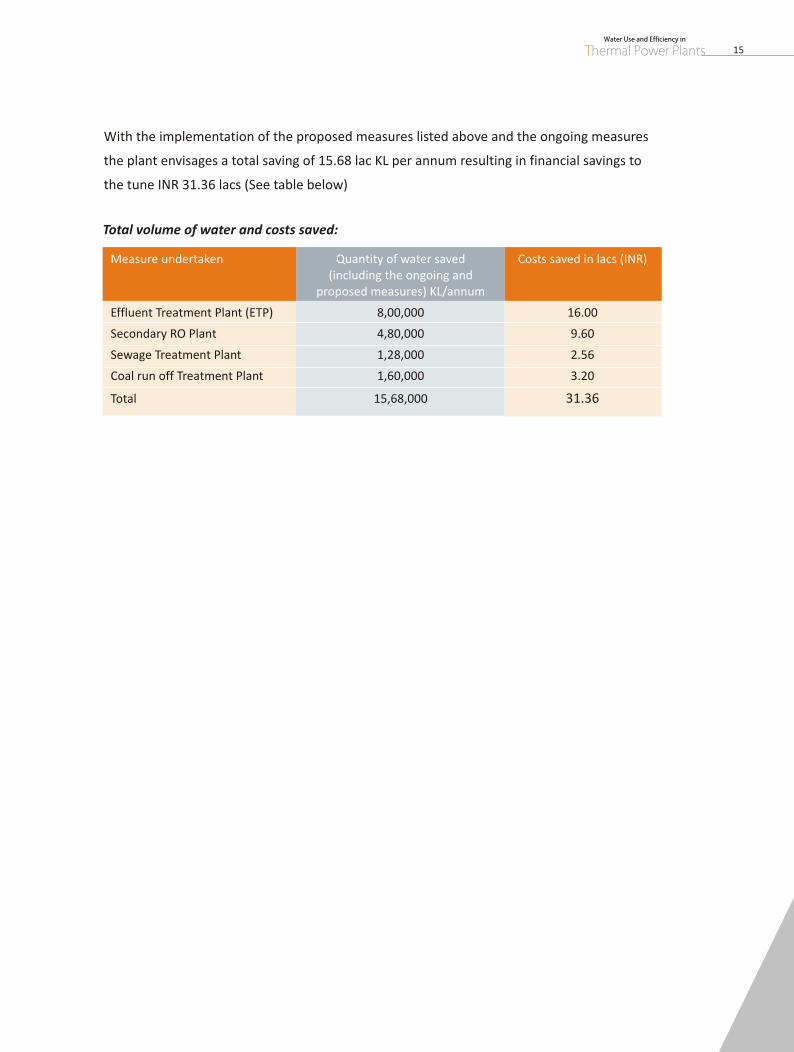
With the implementation of the proposed measures listed above and the ongoing measures
the plant envisages a total saving of 15.68 lac KL per annum resulting in financial savings to
the tune INR 31.36 lacs (See table below)
Total volume of water and costs saved:
Measure undertaken Quantity of water saved Costs saved in lacs (INR)(including the ongoing and
proposed measures) KL/annum
Effluent Treatment Plant (ETP) 8,00,000 16.00
Secondary RO Plant 4,80,000 9.60
Sewage Treatment Plant 1,28,000 2.56
Coal run off Treatment Plant 1,60,000 3.20
Total 15,68,000 31.36
Water Use and Efficiency in
Thermal Power Plants 15
Water Use and Efficiency in
Thermal Power Plants14
System description Quantity of water saved in
KL/Annum
Effluent Treatment Plant(ETP) for Units 2 * 660 MW
Secondary RO Plant for Units 2 * 660 MW 2,40,000
Sewage treatment Plant for Units 4* 330 MW and 2 * 660 MW 64,000
Coal run off treatment Plant for 2 * 660 MW 80,000
Total 7,84,000
4,00,000
The following water conservation measures are proposed to be undertaken for the 3*660 MW
Units which will be undertaken in the coming months. These will further add to the savings.
Proposed systems Quantity of water saved in
KL/Annum (anticipated)3Effluent Treatment Plant(ETP) with a plant capacity of 50 m /Hr 4,00,000
Secondary RO Plant (DM Plant- phase III) 2,40,0003Sewage Treatment Plant having a capacity of 08 m /Hr. 64,000
3Coal run off treatment Plant having a capacity: 10 m /Hr 80,000
Total 7,84,000
Volume of water saved:
The above measures have resulted in saving significant amount of the water in the units.
The breakups of savings is given below:
l
l
l
Secondary Reverse Osmosis (RO) Plant (DM Plant- phase II) has been set up for Units 2 *
660 MW: This has helped to meet the DM requirements for the plant saving significant
volumes of water. The reject water from the RO is diverted for water sprinkling on roads
and coal stack yard. The volume of secondary RO reject water generation is to the tune 3
of 30 m /Hr and the TDS of RO reject water is normally 1500 mg/l.
Sewage Treatment Plant (STP) for Units 4* 330 MW & 2 * 660 MW: The capacity of the 3
STP is of the order 8 m /Hr and the treated water is used for horticulture.
Coal run off treatment plant has been set up for the 2* 660 MW plant having a capacity 3
of 10 m /Hr. Treated water from the plant is to be used for sprinkling in coal stockyards
and roads.
With the implementation of the proposed measures listed above and the ongoing measures
the plant envisages a total saving of 15.68 lac KL per annum resulting in financial savings to
the tune INR 31.36 lacs (See table below)
Total volume of water and costs saved:
Measure undertaken Quantity of water saved Costs saved in lacs (INR)(including the ongoing and
proposed measures) KL/annum
Effluent Treatment Plant (ETP) 8,00,000 16.00
Secondary RO Plant 4,80,000 9.60
Sewage Treatment Plant 1,28,000 2.56
Coal run off Treatment Plant 1,60,000 3.20
Total 15,68,000 31.36
Water Use and Efficiency in
Thermal Power Plants 17
Water Use and Efficiency in
Thermal Power Plants16
Case Study 2: Essar Power Limited
Location and capacity:
Essar Power has a thermal power plant located in Hazira in Surat district of Gujarat.
Commissioned in 1997, it has a capacity of 515 MW and is the country's first multi-fuel plant,
operating simultaneously on naphtha and gas. Of the 515 MW of power generated, 215MW is
captive to the Essar steel plant and 300MW is supplied to Gujarat Urja Vikas Nigam.
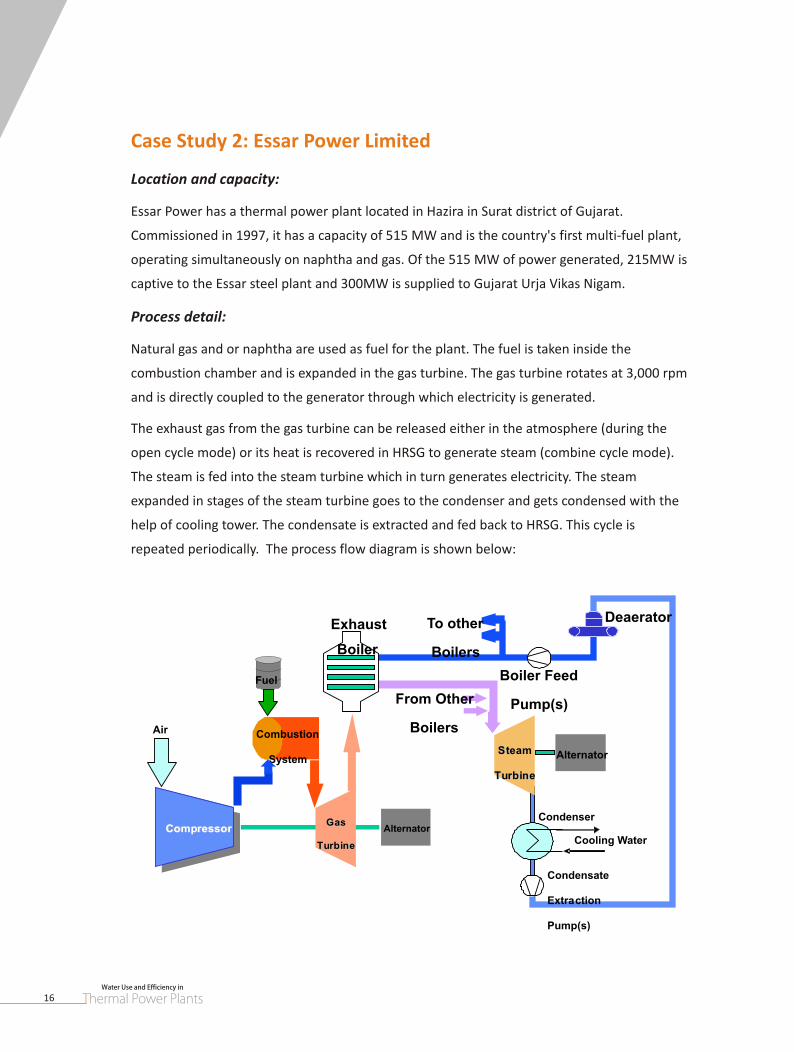
Process detail:
Natural gas and or naphtha are used as fuel for the plant. The fuel is taken inside the
combustion chamber and is expanded in the gas turbine. The gas turbine rotates at 3,000 rpm
and is directly coupled to the generator through which electricity is generated.
The exhaust gas from the gas turbine can be released either in the atmosphere (during the
open cycle mode) or its heat is recovered in HRSG to generate steam (combine cycle mode).
The steam is fed into the steam turbine which in turn generates electricity. The steam
expanded in stages of the steam turbine goes to the condenser and gets condensed with the
help of cooling tower. The condensate is extracted and fed back to HRSG. This cycle is
repeated periodically. The process flow diagram is shown below:
Water use and wastewater generated:
3Total raw water in-take to the power plant - 38.6 lacs m /annum
3Total wastewater generated - 13.52 lacs m /annum
3Volume of wastewater treated and re-used - 11.56 lacs m /annum (85 per cent of total
wastewater is being recycled and reused)
Water efficiency and conservation measures:
Essar Power has undertaken the following water conservation measures in its Hazira Plant:
Increased cooling tower Cycles of Concentration (COC): Condenser is used to cool steam
from steam turbine exhaust through cooling tower water. Circulation rate of cooling tower 3
is 39,000 m /hr. Cooling water circuit was earlier operated at an average COC of 3.68. The
COC is controlled by stainless steel tubes (comprising 5 per cent of total numbers of tubes
and remaining 95 per cent are made up of brass) inside the condenser. It is well known that
chloride ion concentration has a direct impact on stainless steel as it leads to corrosion. 3Based on the COC of 3.68, cooling tower blow down water was 205 m /hr. Several options
were studied and based on a detailed analysis study, it was decided to replace the existing
stainless steel tubes with Cu-Ni material of construction (MOC). This has resulted in
operating the cooling water system with average of 5 COC and has enabled major savings
in terms of water use and dozing chemicals. The condenser tube MOC was changed at a
total cost in Rs 62.5 lacs and the payback period for the project was less than a year.
Cooling tower blow down water is recovered and reused as make- up water for the steel
plant and for horticulture and plantation in the township. This project attracted an
investment of Rs. 35 lacs and yielded significant savings in terms of water use for the steel
plant, around 80 per cent less use of chemical (acid) dosing. During the last year around
72,550 m³ cooling water blow down water has been effectively re-used at Essar township
for gardening and horticulture.
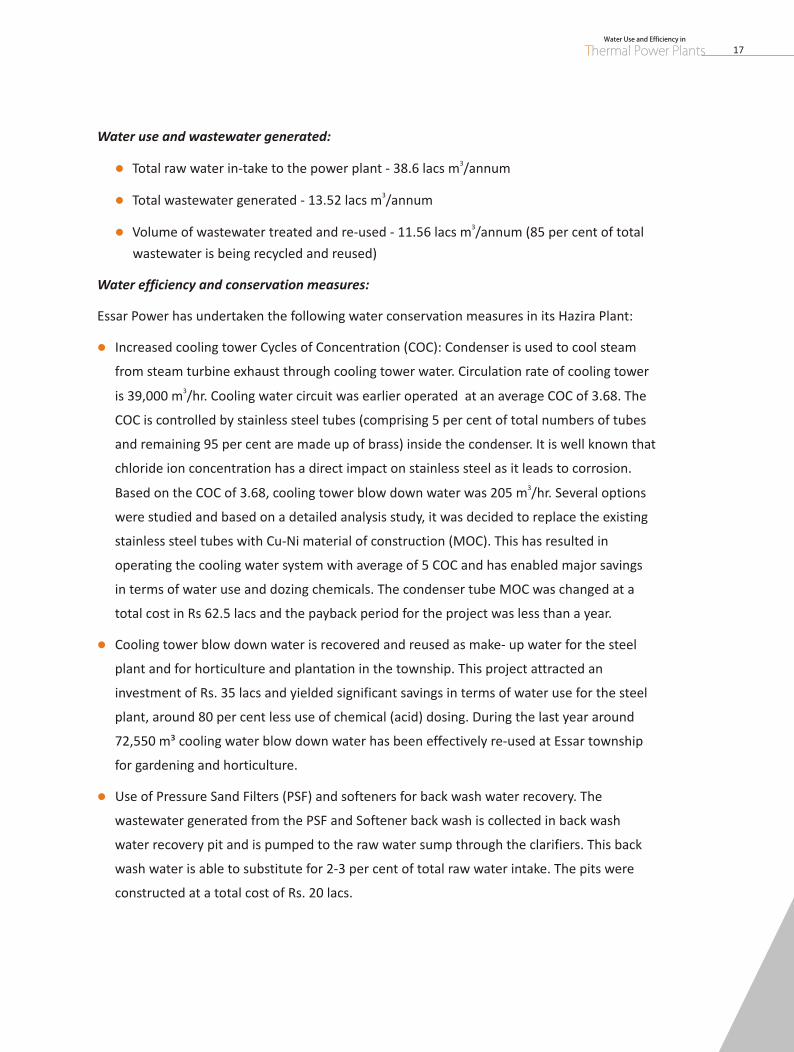
Use of Pressure Sand Filters (PSF) and softeners for back wash water recovery. The
wastewater generated from the PSF and Softener back wash is collected in back wash
water recovery pit and is pumped to the raw water sump through the clarifiers. This back
wash water is able to substitute for 2-3 per cent of total raw water intake. The pits were
constructed at a total cost of Rs. 20 lacs.
l
l
l
l
l
l
Air
GGaass
TTuurrbbiinnee
CCoommpprreessssoorr
Fuel
Combustion
System
Exhaust
Alternator
Boiler
SStteeaamm
TTuurrbbiinnee
Alternator
Condenser
Cooling Water
Boiler Feed
Pump(s)
Condensate
Extraction
Pump(s)
DeaeratorTo other
Boilers
From Other
Boilers
Water Use and Efficiency in
Thermal Power Plants 17
Water Use and Efficiency in
Thermal Power Plants16
Case Study 2: Essar Power Limited
Location and capacity:
Essar Power has a thermal power plant located in Hazira in Surat district of Gujarat.
Commissioned in 1997, it has a capacity of 515 MW and is the country's first multi-fuel plant,
operating simultaneously on naphtha and gas. Of the 515 MW of power generated, 215MW is
captive to the Essar steel plant and 300MW is supplied to Gujarat Urja Vikas Nigam.
Process detail:
Natural gas and or naphtha are used as fuel for the plant. The fuel is taken inside the
combustion chamber and is expanded in the gas turbine. The gas turbine rotates at 3,000 rpm
and is directly coupled to the generator through which electricity is generated.
The exhaust gas from the gas turbine can be released either in the atmosphere (during the
open cycle mode) or its heat is recovered in HRSG to generate steam (combine cycle mode).
The steam is fed into the steam turbine which in turn generates electricity. The steam
expanded in stages of the steam turbine goes to the condenser and gets condensed with the
help of cooling tower. The condensate is extracted and fed back to HRSG. This cycle is
repeated periodically. The process flow diagram is shown below:
Water use and wastewater generated:
3Total raw water in-take to the power plant - 38.6 lacs m /annum
3Total wastewater generated - 13.52 lacs m /annum
3Volume of wastewater treated and re-used - 11.56 lacs m /annum (85 per cent of total
wastewater is being recycled and reused)
Water efficiency and conservation measures:
Essar Power has undertaken the following water conservation measures in its Hazira Plant:
Increased cooling tower Cycles of Concentration (COC): Condenser is used to cool steam
from steam turbine exhaust through cooling tower water. Circulation rate of cooling tower 3
is 39,000 m /hr. Cooling water circuit was earlier operated at an average COC of 3.68. The
COC is controlled by stainless steel tubes (comprising 5 per cent of total numbers of tubes
and remaining 95 per cent are made up of brass) inside the condenser. It is well known that
chloride ion concentration has a direct impact on stainless steel as it leads to corrosion. 3Based on the COC of 3.68, cooling tower blow down water was 205 m /hr. Several options
were studied and based on a detailed analysis study, it was decided to replace the existing
stainless steel tubes with Cu-Ni material of construction (MOC). This has resulted in
operating the cooling water system with average of 5 COC and has enabled major savings
in terms of water use and dozing chemicals. The condenser tube MOC was changed at a
total cost in Rs 62.5 lacs and the payback period for the project was less than a year.
Cooling tower blow down water is recovered and reused as make- up water for the steel
plant and for horticulture and plantation in the township. This project attracted an
investment of Rs. 35 lacs and yielded significant savings in terms of water use for the steel
plant, around 80 per cent less use of chemical (acid) dosing. During the last year around
72,550 m³ cooling water blow down water has been effectively re-used at Essar township
for gardening and horticulture.
Use of Pressure Sand Filters (PSF) and softeners for back wash water recovery. The
wastewater generated from the PSF and Softener back wash is collected in back wash
water recovery pit and is pumped to the raw water sump through the clarifiers. This back
wash water is able to substitute for 2-3 per cent of total raw water intake. The pits were
constructed at a total cost of Rs. 20 lacs.
l
l
l
l
l
l
Air
GGaass
TTuurrbbiinnee
CCoommpprreessssoorr
Fuel
Combustion
System
Exhaust
Alternator
Boiler
SStteeaamm
TTuurrbbiinnee
Alternator
Condenser
Cooling Water
Boiler Feed
Pump(s)
Condensate
Extraction
Pump(s)
DeaeratorTo other
Boilers
From Other
Boilers
Water Use and Efficiency in
Thermal Power Plants 19
Water Use and Efficiency in
Thermal Power Plants18
l
l
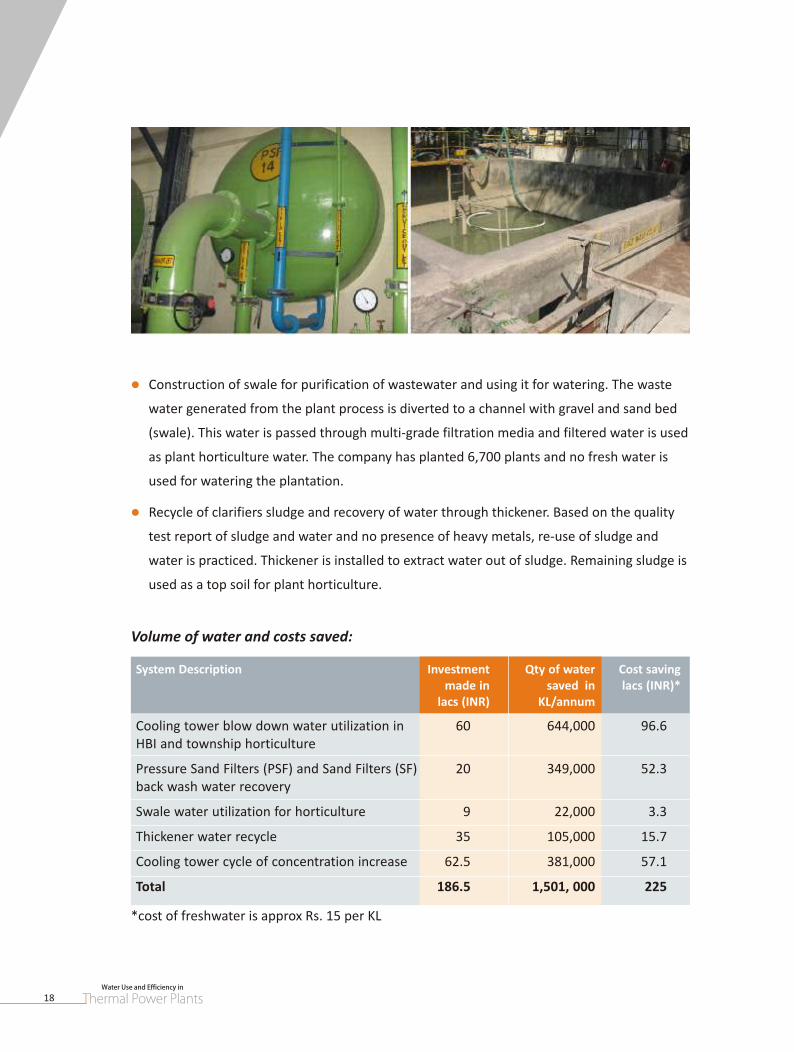
Construction of swale for purification of wastewater and using it for watering. The waste
water generated from the plant process is diverted to a channel with gravel and sand bed
(swale). This water is passed through multi-grade filtration media and filtered water is used
as plant horticulture water. The company has planted 6,700 plants and no fresh water is
used for watering the plantation.
Recycle of clarifiers sludge and recovery of water through thickener. Based on the quality
test report of sludge and water and no presence of heavy metals, re-use of sludge and
water is practiced. Thickener is installed to extract water out of sludge. Remaining sludge is
used as a top soil for plant horticulture.
*cost of freshwater is approx Rs. 15 per KL
Volume of water and costs saved:
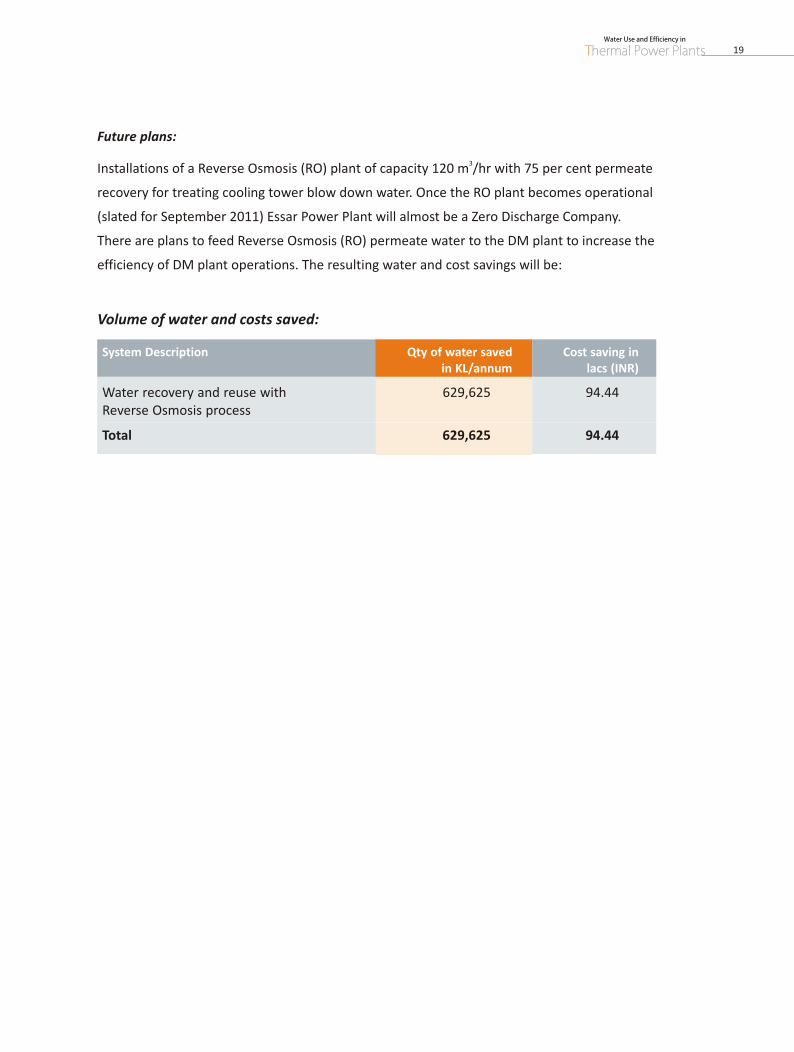
System Description Qty of water savedin KL/annum lacs (INR)
Cost saving in
Water recovery and reuse with 629,625 94.44Reverse Osmosis process
Total 629,625 94.44
Volume of water and costs saved:
System Description Investment made in saved in lacs (INR)*
lacs (INR) KL/annum
Qty of water Cost saving
Cooling tower blow down water utilization in 60 644,000 96.6 HBI and township horticulture
Pressure Sand Filters (PSF) and Sand Filters (SF) 20 349,000 52.3back wash water recovery
Swale water utilization for horticulture 9 22,000 3.3
Thickener water recycle 35 105,000 15.7
Cooling tower cycle of concentration increase 62.5 381,000 57.1
Total 186.5 1,501, 000 225
Future plans:
3Installations of a Reverse Osmosis (RO) plant of capacity 120 m /hr with 75 per cent permeate
recovery for treating cooling tower blow down water. Once the RO plant becomes operational
(slated for September 2011) Essar Power Plant will almost be a Zero Discharge Company.
There are plans to feed Reverse Osmosis (RO) permeate water to the DM plant to increase the
efficiency of DM plant operations. The resulting water and cost savings will be:
Water Use and Efficiency in
Thermal Power Plants 19
Water Use and Efficiency in
Thermal Power Plants18
l
l
Construction of swale for purification of wastewater and using it for watering. The waste
water generated from the plant process is diverted to a channel with gravel and sand bed
(swale). This water is passed through multi-grade filtration media and filtered water is used
as plant horticulture water. The company has planted 6,700 plants and no fresh water is
used for watering the plantation.
Recycle of clarifiers sludge and recovery of water through thickener. Based on the quality
test report of sludge and water and no presence of heavy metals, re-use of sludge and
water is practiced. Thickener is installed to extract water out of sludge. Remaining sludge is
used as a top soil for plant horticulture.
*cost of freshwater is approx Rs. 15 per KL
Volume of water and costs saved:
System Description Qty of water savedin KL/annum lacs (INR)
Cost saving in
Water recovery and reuse with 629,625 94.44Reverse Osmosis process
Total 629,625 94.44
Volume of water and costs saved:
System Description Investment made in saved in lacs (INR)*
lacs (INR) KL/annum
Qty of water Cost saving
Cooling tower blow down water utilization in 60 644,000 96.6 HBI and township horticulture
Pressure Sand Filters (PSF) and Sand Filters (SF) 20 349,000 52.3back wash water recovery
Swale water utilization for horticulture 9 22,000 3.3
Thickener water recycle 35 105,000 15.7
Cooling tower cycle of concentration increase 62.5 381,000 57.1
Total 186.5 1,501, 000 225
Future plans:
3Installations of a Reverse Osmosis (RO) plant of capacity 120 m /hr with 75 per cent permeate
recovery for treating cooling tower blow down water. Once the RO plant becomes operational
(slated for September 2011) Essar Power Plant will almost be a Zero Discharge Company.
There are plans to feed Reverse Osmosis (RO) permeate water to the DM plant to increase the
efficiency of DM plant operations. The resulting water and cost savings will be:
Water Use and Efficiency in
Thermal Power Plants 21
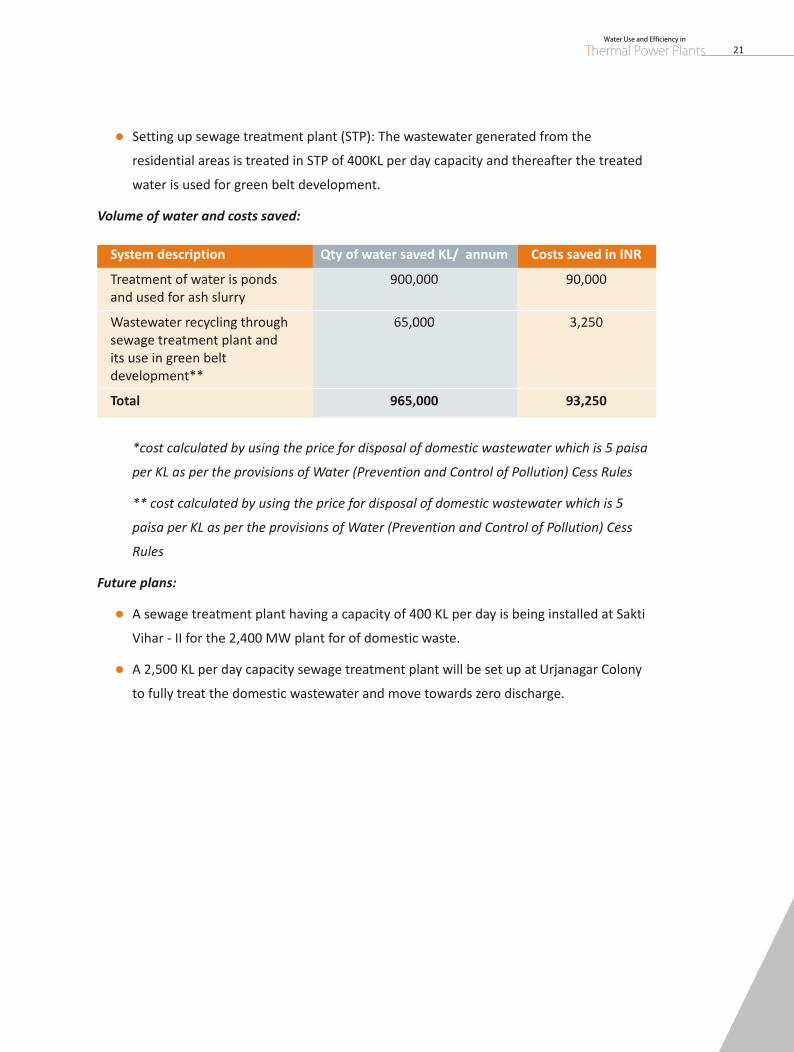
lSetting up sewage treatment plant (STP): The wastewater generated from the
residential areas is treated in STP of 400KL per day capacity and thereafter the treated
water is used for green belt development.
Volume of water and costs saved:
*cost calculated by using the price for disposal of domestic wastewater which is 5 paisa
per KL as per the provisions of Water (Prevention and Control of Pollution) Cess Rules
** cost calculated by using the price for disposal of domestic wastewater which is 5
paisa per KL as per the provisions of Water (Prevention and Control of Pollution) Cess
Rules
Future plans:
Vihar - II for the 2,400 MW plant for of domestic waste.
A 2,500 KL per day capacity sewage treatment plant will be set up at Urjanagar Colony
to fully treat the domestic wastewater and move towards zero discharge.
l
l
A sewage treatment plant having a capacity of 400 KL per day is being installed at Sakti
System description Qty of water saved KL/ annum Costs saved in INR
Treatment of water is ponds 900,000 90,000and used for ash slurry
Wastewater recycling through 65,000 3,250sewage treatment plant and its use in green belt development**
Total 965,000 93,250
Water Use and Efficiency in
Thermal Power Plants20
Case Study 3: Jindal Power Limited
l
Location and capacity:
Jindal Power Limited's power plant located in Tamnar village in Raigarh district is a coal based
plant with a capacity of 1,000 MW.
Water used and wastewater generated:
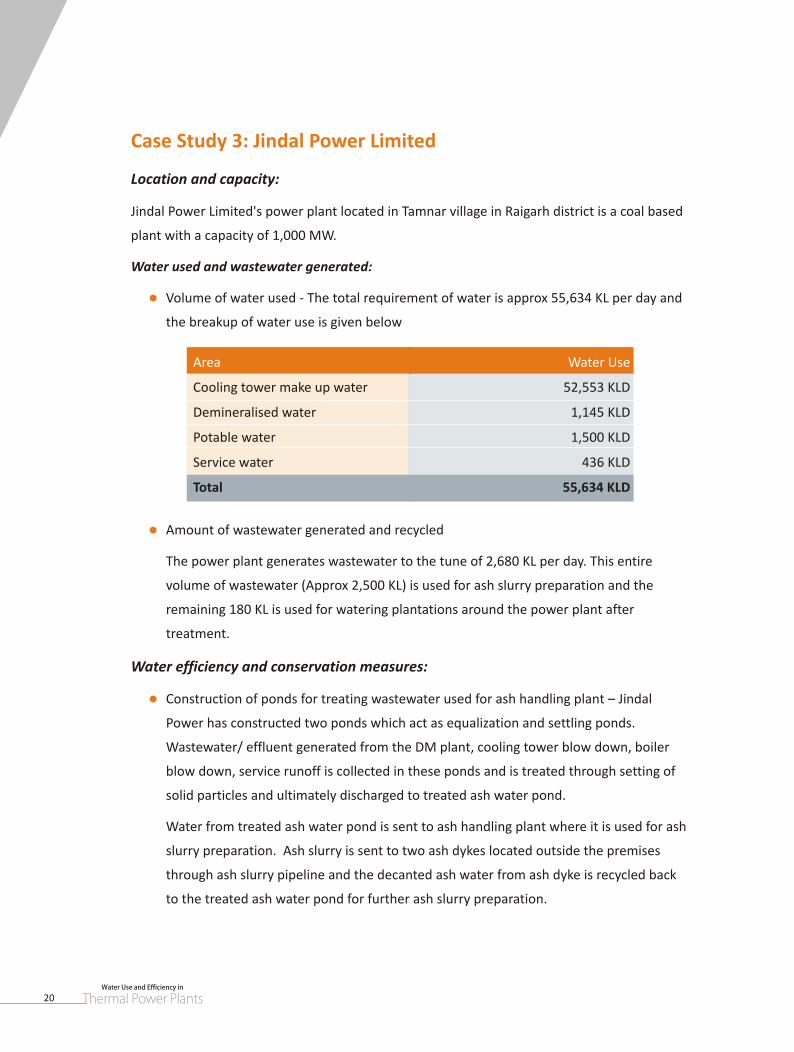
Volume of water used - The total requirement of water is approx 55,634 KL per day and
the breakup of water use is given below
l
l
Amount of wastewater generated and recycled
The power plant generates wastewater to the tune of 2,680 KL per day. This entire
volume of wastewater (Approx 2,500 KL) is used for ash slurry preparation and the
remaining 180 KL is used for watering plantations around the power plant after
treatment.
Water efficiency and conservation measures:
Construction of ponds for treating wastewater used for ash handling plant – Jindal
Power has constructed two ponds which act as equalization and settling ponds.
Wastewater/ effluent generated from the DM plant, cooling tower blow down, boiler
blow down, service runoff is collected in these ponds and is treated through setting of
solid particles and ultimately discharged to treated ash water pond.
Water from treated ash water pond is sent to ash handling plant where it is used for ash
slurry preparation. Ash slurry is sent to two ash dykes located outside the premises
through ash slurry pipeline and the decanted ash water from ash dyke is recycled back
to the treated ash water pond for further ash slurry preparation.
Area Water Use
Cooling tower make up water 52,553 KLD
Demineralised water 1,145 KLD
Potable water 1,500 KLD
Service water 436 KLD
Total 55,634 KLD
Water Use and Efficiency in
Thermal Power Plants 21
lSetting up sewage treatment plant (STP): The wastewater generated from the
residential areas is treated in STP of 400KL per day capacity and thereafter the treated
water is used for green belt development.
Volume of water and costs saved:
*cost calculated by using the price for disposal of domestic wastewater which is 5 paisa
per KL as per the provisions of Water (Prevention and Control of Pollution) Cess Rules
** cost calculated by using the price for disposal of domestic wastewater which is 5
paisa per KL as per the provisions of Water (Prevention and Control of Pollution) Cess
Rules
Future plans:
Vihar - II for the 2,400 MW plant for of domestic waste.
A 2,500 KL per day capacity sewage treatment plant will be set up at Urjanagar Colony
to fully treat the domestic wastewater and move towards zero discharge.
l
l
A sewage treatment plant having a capacity of 400 KL per day is being installed at Sakti
System description Qty of water saved KL/ annum Costs saved in INR
Treatment of water is ponds 900,000 90,000and used for ash slurry
Wastewater recycling through 65,000 3,250sewage treatment plant and its use in green belt development**
Total 965,000 93,250
Water Use and Efficiency in
Thermal Power Plants20
Case Study 3: Jindal Power Limited
l
Location and capacity:
Jindal Power Limited's power plant located in Tamnar village in Raigarh district is a coal based
plant with a capacity of 1,000 MW.
Water used and wastewater generated:
Volume of water used - The total requirement of water is approx 55,634 KL per day and
the breakup of water use is given below
l
l
Amount of wastewater generated and recycled
The power plant generates wastewater to the tune of 2,680 KL per day. This entire
volume of wastewater (Approx 2,500 KL) is used for ash slurry preparation and the
remaining 180 KL is used for watering plantations around the power plant after
treatment.
Water efficiency and conservation measures:
Construction of ponds for treating wastewater used for ash handling plant – Jindal
Power has constructed two ponds which act as equalization and settling ponds.
Wastewater/ effluent generated from the DM plant, cooling tower blow down, boiler
blow down, service runoff is collected in these ponds and is treated through setting of
solid particles and ultimately discharged to treated ash water pond.
Water from treated ash water pond is sent to ash handling plant where it is used for ash
slurry preparation. Ash slurry is sent to two ash dykes located outside the premises
through ash slurry pipeline and the decanted ash water from ash dyke is recycled back
to the treated ash water pond for further ash slurry preparation.
Area Water Use
Cooling tower make up water 52,553 KLD
Demineralised water 1,145 KLD
Potable water 1,500 KLD
Service water 436 KLD
Total 55,634 KLD
Water Use and Efficiency in
Thermal Power Plants 23
Water Use and Efficiency in
Thermal Power Plants22
Case Study 4: NTPC Ltd.
l
l
l
l
Location and capacity:
National Thermal Power Corporation's (NTPCs) Vindhyachal Super Thermal Power Station
(VSTPS) is situated in Singrauli district of Madhya Pradesh. It is the largest coal based thermal
power station in the country. The power plant has been running on a plant load factor of 92
per cent. Power generated from this plant caters to electricity requirements of Madhya
Pradesh, Chhattisgarh, Maharashtra, Gujarat, Goa, Daman and Diu and Dadar Nagar Haveli.
The station has a commissioned capacity of 3,260 MW which utilises coal from Nigahi mines
and water from discharge of Singrauli super thermal power station. The approved investment
for the plant is Rs. 4,053.42 crores (Stage I & II) and Rs. 4,201.5 crores for Stage-III. The
capacity of the VSTPS at Stage I is 1260 (6x 210) MW while that of Stage-II & III is 1000 (2x500)
MW each.
Water audit:
The Vindhyachal power plant draws sizable amount of water for various processes in power
generation system. To enhance its effort towards water conservation and management VSTPS
conducted a water balance in all the units of the power plant (Stage-I, II & III). The study was
undertaken during April-July 2010, with the following objectives:
To conserve water and enhance the re-use and recycling of effluents;
To reduces costs in accessing freshwater by implementing a series of water conservation
measures identified through the audit; and
To assess existing provisions and options for further conservation of water and to
achieve near zero discharge of effluents.
The NTPC team conducted field visits, involving one reconnaissance survey of the entire plant,
collection of preliminary information and two detailed field surveys including
monitoring/measurements of flows and water quality at several important identified locations
of the entire water supply pipeline network, open channels and wastewater discharge
locations at the all the stages of the plant as well as the township area.
Flow measurement at study region included monitoring of the water flows at all the existing
major water sources and usage areas at all the three plants (Stage-I, II & III). The flow
measurements were undertaken covering the following important locations:
Source water intake points from water reservoirs at Stage-I & III
Filter houses of each stage (I, II & III)
Drinking water supply to the townships and the plant
Service line water supply
DM plant water supply
Ash water recirculation system (AWRS) of all the three stages
Cooling Towers at all the three stages (I, II & III)
Boilers and auxiliary usage
OAC channels
ETP (Effluent Treatment Plant) and major drains of plant
Flow was also measured at the inlet and outlet of STP (sewage treatment plant) in the
township. This exercise was undertaken to understand the quantum of water being drawn and
consumed in the plant processes and account for leakages and losses as well as wastewater
being discharged. The flow measurement exercise involved validation of the mechanical
meters (wherever possible) already present and installation of ultrasonic flow meters at
selected locations of distribution pipelines.
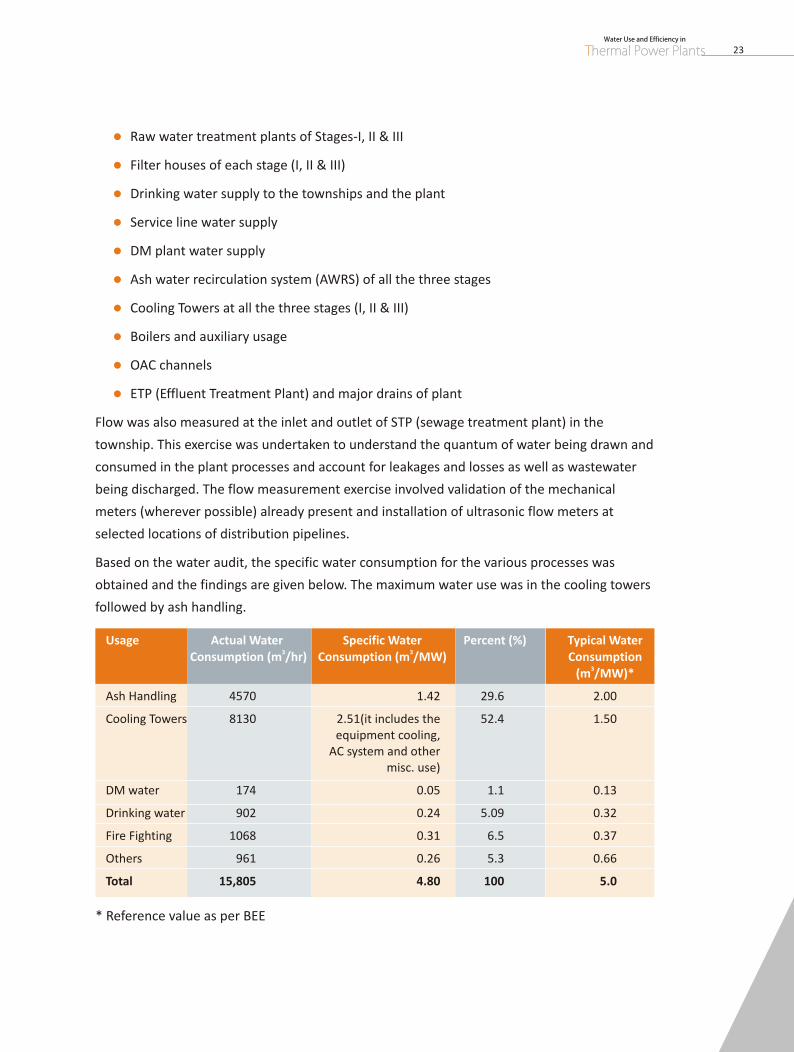
Based on the water audit, the specific water consumption for the various processes was
obtained and the findings are given below. The maximum water use was in the cooling towers
followed by ash handling.
l
l
l
l
l
l
l
l
l
l
Raw water treatment plants of Stages-I, II & III
Usage Actual Water3 3 Consumption (m /hr) Consumption (m /MW) Consumption
3(m /MW)*
Specific Water Percent (%) Typical Water
Ash Handling 4570 1.42 29.6 2.00
Cooling Towers 8130 2.51(it includes the 52.4 1.50 equipment cooling,
AC system and othermisc. use)
DM water 174 0.05 1.1 0.13
Drinking water 902 0.24 5.09 0.32
Fire Fighting 1068 0.31 6.5 0.37
Others 961 0.26 5.3 0.66
Total 15,805 4.80 100 5.0
* Reference value as per BEE
Water Use and Efficiency in
Thermal Power Plants 23
Water Use and Efficiency in
Thermal Power Plants22
Case Study 4: NTPC Ltd.
l
l
l
l
Location and capacity:
National Thermal Power Corporation's (NTPCs) Vindhyachal Super Thermal Power Station
(VSTPS) is situated in Singrauli district of Madhya Pradesh. It is the largest coal based thermal
power station in the country. The power plant has been running on a plant load factor of 92
per cent. Power generated from this plant caters to electricity requirements of Madhya
Pradesh, Chhattisgarh, Maharashtra, Gujarat, Goa, Daman and Diu and Dadar Nagar Haveli.
The station has a commissioned capacity of 3,260 MW which utilises coal from Nigahi mines
and water from discharge of Singrauli super thermal power station. The approved investment
for the plant is Rs. 4,053.42 crores (Stage I & II) and Rs. 4,201.5 crores for Stage-III. The
capacity of the VSTPS at Stage I is 1260 (6x 210) MW while that of Stage-II & III is 1000 (2x500)
MW each.
Water audit:
The Vindhyachal power plant draws sizable amount of water for various processes in power
generation system. To enhance its effort towards water conservation and management VSTPS
conducted a water balance in all the units of the power plant (Stage-I, II & III). The study was
undertaken during April-July 2010, with the following objectives:
To conserve water and enhance the re-use and recycling of effluents;
To reduces costs in accessing freshwater by implementing a series of water conservation
measures identified through the audit; and
To assess existing provisions and options for further conservation of water and to
achieve near zero discharge of effluents.
The NTPC team conducted field visits, involving one reconnaissance survey of the entire plant,
collection of preliminary information and two detailed field surveys including
monitoring/measurements of flows and water quality at several important identified locations
of the entire water supply pipeline network, open channels and wastewater discharge
locations at the all the stages of the plant as well as the township area.
Flow measurement at study region included monitoring of the water flows at all the existing
major water sources and usage areas at all the three plants (Stage-I, II & III). The flow
measurements were undertaken covering the following important locations:
Source water intake points from water reservoirs at Stage-I & III
Filter houses of each stage (I, II & III)
Drinking water supply to the townships and the plant
Service line water supply
DM plant water supply
Ash water recirculation system (AWRS) of all the three stages
Cooling Towers at all the three stages (I, II & III)
Boilers and auxiliary usage
OAC channels
ETP (Effluent Treatment Plant) and major drains of plant
Flow was also measured at the inlet and outlet of STP (sewage treatment plant) in the
township. This exercise was undertaken to understand the quantum of water being drawn and
consumed in the plant processes and account for leakages and losses as well as wastewater
being discharged. The flow measurement exercise involved validation of the mechanical
meters (wherever possible) already present and installation of ultrasonic flow meters at
selected locations of distribution pipelines.
Based on the water audit, the specific water consumption for the various processes was
obtained and the findings are given below. The maximum water use was in the cooling towers
followed by ash handling.
l
l
l
l
l
l
l
l
l
l
Raw water treatment plants of Stages-I, II & III
Usage Actual Water3 3 Consumption (m /hr) Consumption (m /MW) Consumption
3(m /MW)*
Specific Water Percent (%) Typical Water
Ash Handling 4570 1.42 29.6 2.00
Cooling Towers 8130 2.51(it includes the 52.4 1.50 equipment cooling,
AC system and othermisc. use)
DM water 174 0.05 1.1 0.13
Drinking water 902 0.24 5.09 0.32
Fire Fighting 1068 0.31 6.5 0.37
Others 961 0.26 5.3 0.66
Total 15,805 4.80 100 5.0
* Reference value as per BEE
Water Use and Efficiency in
Thermal Power Plants 25
Water Use and Efficiency in
Thermal Power Plants24
3The overall specific water consumption at VSTPS is 4.80 m /M which is within the reference 3
value of the typical water consumption pattern in India of about 5.0 m /MW as per Bureau of
Energy Efficiency norms.
The cycle of concentration (COC) for Stage-I, II & III (power plants) was of the following order -
Cycle of Concentration (COC) Stage-I = 1.99 = 2
Cycle of Concentration (COC) Stage-II = 2.01 = 2
Cycle of Concentration (COC) Stage-III = 2.50 = 2.5
Therefore the overall COC for all three stages of Vindhyachal Super Thermal Power Station
is 2.2.
Recommendations of the water audit:
The water audit helped in identifying a plan for water conservation for the plant in the
following processes:
a. Cooling process (Cooling Towers): Overflows from the cooling towers needs to be
prevented to save the high volumes of water being lost. This can be redirected into the
cooling process.
b. Drinking water supply: The audit findings highlighted the high per capita intake of water
in the residential areas much above the 110 litres per capita per day norm. There was a
need to rationalise the water use at township by optimising the water demand supply
situation and reducing the existing per capita water consumption.
3c. Minimising leakages: An estimated 335 m /day of water was lost due to leakages in the
water supply network within the plant. These leakages needed to be immediately
plugged to save water.
d. Fire fighting water: The amount of water being misused through fire hydrants was to be
brought down and there should be a separate arrangement for using treated
wastewater for fire fighting purposes.
e. Wastewater management at the power plant: The wastewater at present was being
treated/handled at four different systems. It was recommended that a separate central
common effluent treatment plant should be established. The existing drains could be 3
diverted to this common location. About 63,933 m /day of wastewater is being
l
l
l
discharged from the plant which should be recycled completely to achieve zero
discharge and reuse the water. A centralised effluent treatment plant (ETP) to recycle 3
63,933 m /day or 63.9 MLD (Million litres per day) of water discharged (unused) should
be considered.
f. Wastewater (STP) management at Township: STP outlet water is suitable for
horticultural uses (which have a huge scope given the vast land area of the power plant) 3
and can be reused entirely thus saving water to the tune of about 3,836 m /day and 3ensuring zero discharge. Presently only 1,231 m /day is being used. It was also proposed
to use the treated water from STP for use in ash water handling system.
Cost Benefit analysis:
There is an enormous scope of saving significant amount of water by water conservation,
recycling and reuse (as discussed earlier). The Vindhyachal power plant procures water from 3
the irrigation department for its use at Rs. 4 per m . Considering about 80% of potential water
saving is achieved through the water conservation measures implemented, the potential cost
savings from different interventions would be as follows.
Water Use and Efficiency in
Thermal Power Plants 25
Water Use and Efficiency in
Thermal Power Plants24
3The overall specific water consumption at VSTPS is 4.80 m /M which is within the reference 3
value of the typical water consumption pattern in India of about 5.0 m /MW as per Bureau of
Energy Efficiency norms.
The cycle of concentration (COC) for Stage-I, II & III (power plants) was of the following order -
Cycle of Concentration (COC) Stage-I = 1.99 = 2
Cycle of Concentration (COC) Stage-II = 2.01 = 2
Cycle of Concentration (COC) Stage-III = 2.50 = 2.5
Therefore the overall COC for all three stages of Vindhyachal Super Thermal Power Station
is 2.2.
Recommendations of the water audit:
The water audit helped in identifying a plan for water conservation for the plant in the
following processes:
a. Cooling process (Cooling Towers): Overflows from the cooling towers needs to be
prevented to save the high volumes of water being lost. This can be redirected into the
cooling process.
b. Drinking water supply: The audit findings highlighted the high per capita intake of water
in the residential areas much above the 110 litres per capita per day norm. There was a
need to rationalise the water use at township by optimising the water demand supply
situation and reducing the existing per capita water consumption.
3c. Minimising leakages: An estimated 335 m /day of water was lost due to leakages in the
water supply network within the plant. These leakages needed to be immediately
plugged to save water.
d. Fire fighting water: The amount of water being misused through fire hydrants was to be
brought down and there should be a separate arrangement for using treated
wastewater for fire fighting purposes.
e. Wastewater management at the power plant: The wastewater at present was being
treated/handled at four different systems. It was recommended that a separate central
common effluent treatment plant should be established. The existing drains could be 3
diverted to this common location. About 63,933 m /day of wastewater is being
l
l
l
discharged from the plant which should be recycled completely to achieve zero
discharge and reuse the water. A centralised effluent treatment plant (ETP) to recycle 3
63,933 m /day or 63.9 MLD (Million litres per day) of water discharged (unused) should
be considered.
f. Wastewater (STP) management at Township: STP outlet water is suitable for
horticultural uses (which have a huge scope given the vast land area of the power plant) 3
and can be reused entirely thus saving water to the tune of about 3,836 m /day and 3ensuring zero discharge. Presently only 1,231 m /day is being used. It was also proposed
to use the treated water from STP for use in ash water handling system.
Cost Benefit analysis:
There is an enormous scope of saving significant amount of water by water conservation,
recycling and reuse (as discussed earlier). The Vindhyachal power plant procures water from 3
the irrigation department for its use at Rs. 4 per m . Considering about 80% of potential water
saving is achieved through the water conservation measures implemented, the potential cost
savings from different interventions would be as follows.
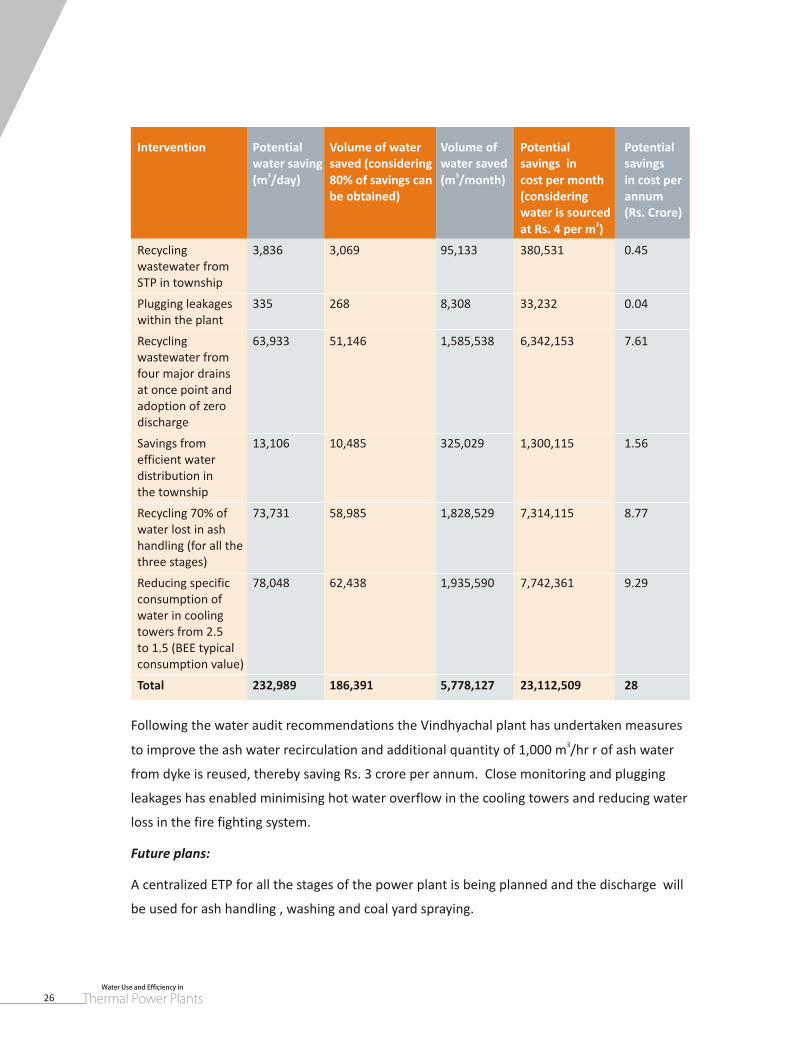
Water Use and Efficiency in
Thermal Power Plants 27
Water Use and Efficiency in
Thermal Power Plants26
Intervention Potential Volume of water water saving saved (considering water saved savings in savings
3 3(m /day) 80% of savings can (m /month) cost per month in cost per be obtained) (considering annum
water is sourced (Rs. Crore) 3at Rs. 4 per m )
Volume of Potential Potential
Recycling 3,836 3,069 95,133 380,531 0.45wastewater from STP in township
Plugging leakages 335 268 8,308 33,232 0.04within the plant
Recycling 63,933 51,146 1,585,538 6,342,153 7.61wastewater from four major drains at once point and adoption of zero discharge
Savings from 13,106 10,485 325,029 1,300,115 1.56efficient water distribution in the township
Recycling 70% of 73,731 58,985 1,828,529 7,314,115 8.77water lost in ash handling (for all the three stages)
Reducing specific 78,048 62,438 1,935,590 7,742,361 9.29consumption of water in cooling towers from 2.5 to 1.5 (BEE typical consumption value)
Total 232,989 186,391 5,778,127 23,112,509 28
Following the water audit recommendations the Vindhyachal plant has undertaken measures 3
to improve the ash water recirculation and additional quantity of 1,000 m /hr r of ash water
from dyke is reused, thereby saving Rs. 3 crore per annum. Close monitoring and plugging
leakages has enabled minimising hot water overflow in the cooling towers and reducing water
loss in the fire fighting system.
Future plans:
A centralized ETP for all the stages of the power plant is being planned and the discharge will
be used for ash handling , washing and coal yard spraying.
Case Study 5: NTPC Ltd.
Location and capacity:
National Thermal Power Corporation has a 657 MW gas based power plant located in Bharuch
district of Gujarat. Commissioned in 1994, the Jhanor - Gandhar plant caters to the power
demands of Madhya Pradesh, Gujarat, Maharashtra, Goa, Daman, Diu, Dadar and Nagar
Haveli, Chhattisgarh.
Volume of water use and wastewater generated:
Water for the power plant is sourced from the Narmada River. The volume of water used in 3 3the cooling tower is to the tune of 40,000 m /hr, the makeup rate is 1,000 m /hr (the plant has
3a COC value of 4). DM water requirement for water injection amounts to 165 m /hr.
The discharge from the power plant as cooling tower blown water is of the order 150 - 200 3 3m /hr and DM plant regeneration waste is 8-13 m /hr.
Figure below illustrates the process flow chart of water use and wastewater generated in the
Gandhar power plant.
Raw Water Raw Water Pumps
From Narmada
Water Reservoir Pretreatment Filteration
DM Plants
DM Tanks
Make up water
From WHRB
ETP-1
Neut.Pit
ETP-2
Solid Waste
HVAC System
To Bhukhi khadi
Softening Plant
Slude Pit
Potable Water
Sewage Treatment
Plant
Sludge Pumps
From Pretreatment Plant
CT

Water Use and Efficiency in
Thermal Power Plants 27
Water Use and Efficiency in
Thermal Power Plants26
Intervention Potential Volume of water water saving saved (considering water saved savings in savings
3 3(m /day) 80% of savings can (m /month) cost per month in cost per be obtained) (considering annum
water is sourced (Rs. Crore) 3at Rs. 4 per m )
Volume of Potential Potential
Recycling 3,836 3,069 95,133 380,531 0.45wastewater from STP in township
Plugging leakages 335 268 8,308 33,232 0.04within the plant
Recycling 63,933 51,146 1,585,538 6,342,153 7.61wastewater from four major drains at once point and adoption of zero discharge
Savings from 13,106 10,485 325,029 1,300,115 1.56efficient water distribution in the township
Recycling 70% of 73,731 58,985 1,828,529 7,314,115 8.77water lost in ash handling (for all the three stages)
Reducing specific 78,048 62,438 1,935,590 7,742,361 9.29consumption of water in cooling towers from 2.5 to 1.5 (BEE typical consumption value)
Total 232,989 186,391 5,778,127 23,112,509 28
Following the water audit recommendations the Vindhyachal plant has undertaken measures 3
to improve the ash water recirculation and additional quantity of 1,000 m /hr r of ash water
from dyke is reused, thereby saving Rs. 3 crore per annum. Close monitoring and plugging
leakages has enabled minimising hot water overflow in the cooling towers and reducing water
loss in the fire fighting system.
Future plans:
A centralized ETP for all the stages of the power plant is being planned and the discharge will
be used for ash handling , washing and coal yard spraying.
Case Study 5: NTPC Ltd.
Location and capacity:
National Thermal Power Corporation has a 657 MW gas based power plant located in Bharuch
district of Gujarat. Commissioned in 1994, the Jhanor - Gandhar plant caters to the power
demands of Madhya Pradesh, Gujarat, Maharashtra, Goa, Daman, Diu, Dadar and Nagar
Haveli, Chhattisgarh.
Volume of water use and wastewater generated:
Water for the power plant is sourced from the Narmada River. The volume of water used in 3 3the cooling tower is to the tune of 40,000 m /hr, the makeup rate is 1,000 m /hr (the plant has
3a COC value of 4). DM water requirement for water injection amounts to 165 m /hr.
The discharge from the power plant as cooling tower blown water is of the order 150 - 200 3 3m /hr and DM plant regeneration waste is 8-13 m /hr.
Figure below illustrates the process flow chart of water use and wastewater generated in the
Gandhar power plant.
Raw Water Raw Water Pumps
From Narmada
Water Reservoir Pretreatment Filteration
DM Plants
DM Tanks
Make up water
From WHRB
ETP-1
Neut.Pit
ETP-2
Solid Waste
HVAC System
To Bhukhi khadi
Softening Plant
Slude Pit
Potable Water
Sewage Treatment
Plant
Sludge Pumps
From Pretreatment Plant
CT
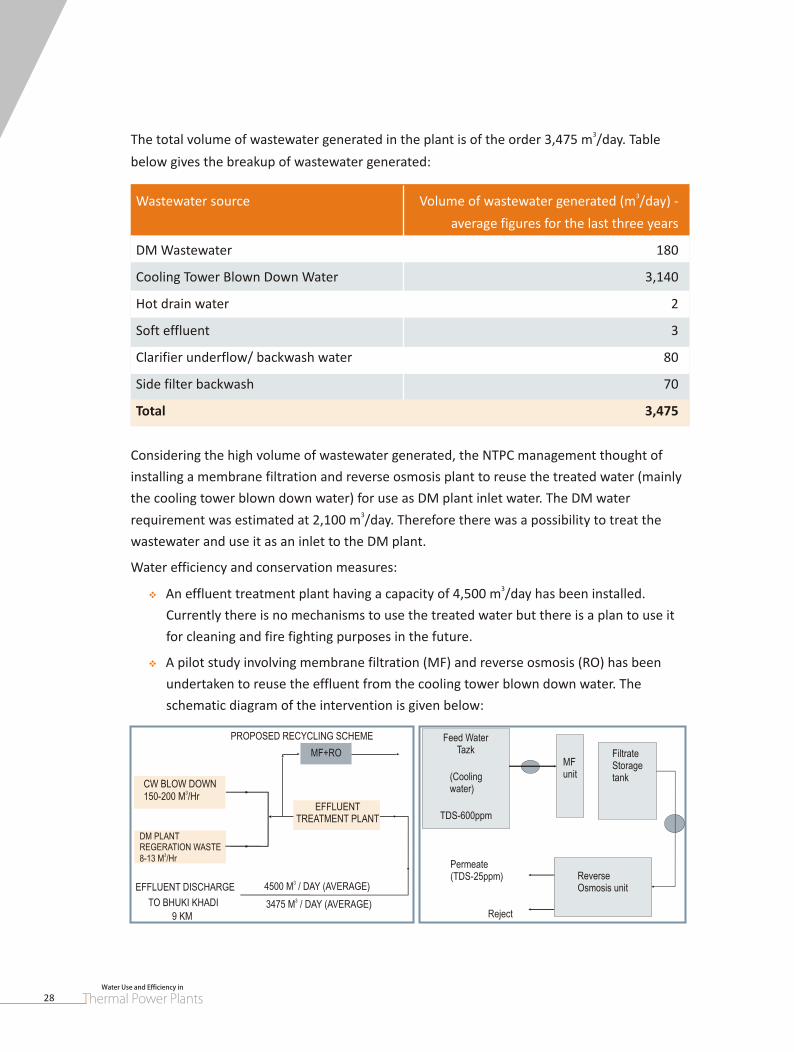
Water Use and Efficiency in
Thermal Power Plants 29
Water Use and Efficiency in
Thermal Power Plants28
3The total volume of wastewater generated in the plant is of the order 3,475 m /day. Table
below gives the breakup of wastewater generated:
3Wastewater source Volume of wastewater generated (m /day) -
average figures for the last three years
DM Wastewater 180
Cooling Tower Blown Down Water 3,140
Hot drain water 2
Soft effluent 3
Clarifier underflow/ backwash water 80
Side filter backwash 70
Total 3,475
Considering the high volume of wastewater generated, the NTPC management thought of
installing a membrane filtration and reverse osmosis plant to reuse the treated water (mainly
the cooling tower blown down water) for use as DM plant inlet water. The DM water 3
requirement was estimated at 2,100 m /day. Therefore there was a possibility to treat the
wastewater and use it as an inlet to the DM plant.
Water efficiency and conservation measures:
3An effluent treatment plant having a capacity of 4,500 m /day has been installed.
Currently there is no mechanisms to use the treated water but there is a plan to use it
for cleaning and fire fighting purposes in the future.
A pilot study involving membrane filtration (MF) and reverse osmosis (RO) has been
undertaken to reuse the effluent from the cooling tower blown down water. The
schematic diagram of the intervention is given below:
v
v
CW BLOW DOWN3150-200 M /Hr
DM PLANTREGERATION WASTE
38-13 M /Hr
EFFLUENTTREATMENT PLANT
MF+RO
34500 M / DAY (AVERAGE)33475 M / DAY (AVERAGE)
EFFLUENT DISCHARGE
TO BHUKI KHADI
9 KM
PROPOSED RECYCLING SCHEME
ReverseOsmosis unit
Reject
Permeate(TDS-25ppm)
FiltrateStoragetank
MFunit
Feed WaterTazk
(Coolingwater)
TDS-600ppm
The water quality of the RO outlet was compared with the raw water and was found to be
better than the raw water. A comparison of the CT blown down water, raw water with the RO
outlet water indicates the suitability of the RO water for use in the DM plant as compared to
raw water.
Parameter pH Cond.
(Us/cm) (ppm CaCO ) (ppm) (ppm) (ppm)
CT Blow Down 7.84 1,016 415.7 57.8 46.6 133.8
RO Outlet 6.1 18.4 Nil 0.6 4.3 3.8
Raw water 8-9.3 175 21 192 34
Hardness Silica M-alkalinity Chloride
3
Volume of water and costs saved:
Parameter Unit cost Savings in cost per cost per month (INR) year (INR)
3Pumping cost to Bhukhi Khadi 0.6 KWh/m 1,30,176 1,073,952@ Rs. 2.20/- per KWh for 2260
3m /Day *
3Water Charges on a/c of raw water Rs. 12.10/- per m 825,000 10,890,000 3for 2,500 M daily
3Cess charges Rs. 0.05 per m 3,750 45,000 3for 2,500 m daily
3Saving in Regeneration chemicals Rs. 3.0/- per m 203,400 2,440,800
3 Pretreatment chemicals and Rs. 1.30 per m 97,500 11,70,000power consumption
Total 1,56,19,752
Savings in
3* the consumption of 0.6 Kwh/ m has been calculated from energy meter reading and
quantity of effluent treated and disposed from ETP and EDPH.
The estimated cost of the entire operation is valued at Rs. 6 crore and the pay back period is
likely to be within 3-4 years.

Water Use and Efficiency in
Thermal Power Plants 29
Water Use and Efficiency in
Thermal Power Plants28
3The total volume of wastewater generated in the plant is of the order 3,475 m /day. Table
below gives the breakup of wastewater generated:
3Wastewater source Volume of wastewater generated (m /day) -
average figures for the last three years
DM Wastewater 180
Cooling Tower Blown Down Water 3,140
Hot drain water 2
Soft effluent 3
Clarifier underflow/ backwash water 80
Side filter backwash 70
Total 3,475
Considering the high volume of wastewater generated, the NTPC management thought of
installing a membrane filtration and reverse osmosis plant to reuse the treated water (mainly
the cooling tower blown down water) for use as DM plant inlet water. The DM water 3
requirement was estimated at 2,100 m /day. Therefore there was a possibility to treat the
wastewater and use it as an inlet to the DM plant.
Water efficiency and conservation measures:
3An effluent treatment plant having a capacity of 4,500 m /day has been installed.
Currently there is no mechanisms to use the treated water but there is a plan to use it
for cleaning and fire fighting purposes in the future.
A pilot study involving membrane filtration (MF) and reverse osmosis (RO) has been
undertaken to reuse the effluent from the cooling tower blown down water. The
schematic diagram of the intervention is given below:
v
v
CW BLOW DOWN3150-200 M /Hr
DM PLANTREGERATION WASTE
38-13 M /Hr
EFFLUENTTREATMENT PLANT
MF+RO
34500 M / DAY (AVERAGE)33475 M / DAY (AVERAGE)
EFFLUENT DISCHARGE
TO BHUKI KHADI
9 KM
PROPOSED RECYCLING SCHEME
ReverseOsmosis unit
Reject
Permeate(TDS-25ppm)
FiltrateStoragetank
MFunit
Feed WaterTazk
(Coolingwater)
TDS-600ppm
The water quality of the RO outlet was compared with the raw water and was found to be
better than the raw water. A comparison of the CT blown down water, raw water with the RO
outlet water indicates the suitability of the RO water for use in the DM plant as compared to
raw water.
Parameter pH Cond.
(Us/cm) (ppm CaCO ) (ppm) (ppm) (ppm)
CT Blow Down 7.84 1,016 415.7 57.8 46.6 133.8
RO Outlet 6.1 18.4 Nil 0.6 4.3 3.8
Raw water 8-9.3 175 21 192 34
Hardness Silica M-alkalinity Chloride
3
Volume of water and costs saved:
Parameter Unit cost Savings in cost per cost per month (INR) year (INR)
3Pumping cost to Bhukhi Khadi 0.6 KWh/m 1,30,176 1,073,952@ Rs. 2.20/- per KWh for 2260
3m /Day *
3Water Charges on a/c of raw water Rs. 12.10/- per m 825,000 10,890,000 3for 2,500 M daily
3Cess charges Rs. 0.05 per m 3,750 45,000 3for 2,500 m daily
3Saving in Regeneration chemicals Rs. 3.0/- per m 203,400 2,440,800
3 Pretreatment chemicals and Rs. 1.30 per m 97,500 11,70,000power consumption
Total 1,56,19,752
Savings in
3* the consumption of 0.6 Kwh/ m has been calculated from energy meter reading and
quantity of effluent treated and disposed from ETP and EDPH.
The estimated cost of the entire operation is valued at Rs. 6 crore and the pay back period is
likely to be within 3-4 years.
Water Use and Efficiency in
Thermal Power Plants30
Case Study 6: TATA Power Company Limited
l
l
l
l
l
l
l
Location and capacity:
TATA Power has a 547.5 MW (1*67.5 MW+4*120 MW) coal based thermal power plant
located in Jojobera, Jamshedpur.
Amount of water use:
3The amount of water used is 1,520 tonnes / hr (T/hr) which correspond to _ m per day.
Amount of wastewater generated:
The Jojobera plant generates wastewater to the tune of 357 tonnes/ hr. This does not include
the unrecoverable evaporation loss of 1,100 tonnes/ hr from cooling towers.
Amount of wastewater recycled:
The pumping of Unit 1/Unit 4 CT basin water to Units 2&3 CT basins has enabled recycling 54
T/hr of wastewater (Unit 2 and Unit 3 have common CT basin) and its reuse as blow down
water. Another 203 T/hr of wastewater is reused in ash plant for boiler bottom ash handling
and disposal.
Water conservation measures undertaken:
Pumping of Unit 1/Unit 4 CT basin water to Units 2&3 CT basin (Unit 2 and Unit 3 have
common CT basin) to reuse blow down water of U 1/U 4 in U 2&3 basin.
An effluent treatment plant (ETP) is being commissioned at Jojobera Power Plant and it
has started functioning from August, 2011. This plant will recycle 100 per cent effluent
generated and will ensure zero discharge to inland surfaces. The details are provided
below -
The present arrangement for the disposal of ash water consists of:
Collection pond of approximate dimension 115m long x 40m width;
Chamber adjoining the pump house to receive the over flow from the collection pond;
Pumping station with three pumps to pump out water from the chamber to disposal;
Pumps are located in a dry pit approximately 15 meters below ground level and a
provision for a sump pump is observed to pump out any water flooding the dry pit;
Adjoining the pump house, a separate room to house the electrical switch gear Cable
gallery etc. is provided;
Water Use and Efficiency in
Thermal Power Plants 31
the area)
Ash water which is presently being sent to drain is to be recovered for reuse. The system is
designed for making de-sludging of collection pond convenient; recover and reuse for ash
handling and for use as cooling tower make up.
The schematic diagram of the effluent treatment plant is shown below:
lOut-door transformer station exists next to the MCC room (towards the fencing side of
The treatment system for the recovery of water works on the following:
1. With the upgrading of the inlet ash water handling system, the water to be treated for
recovery is expected to have the following characteristics: -
Total suspended solids (TSS) 1,000 ppm max.
pH - 6 - 8.5
Temperature 18°c - 30°C
l
l
l
limeDosing
Alum Dosing
PE Dosing
Sludge Line
Discharge
Tube settler
Flocculator Flush Mixer Collection Tank Ash Water Pond
Sludge Disposal By Pump
Clarified water tank
Dual Medica FilterTank
CW - Unit # 2/3 &4 or HP Sump
FINAL WATER QUALITY
Ph 6.5 - 8.0Turbidity (NTU) < 10TSS mg/1 < 5Oil & Grease mg/1 BDL
Effluent Treatment Plant JOJOBERA PLANT
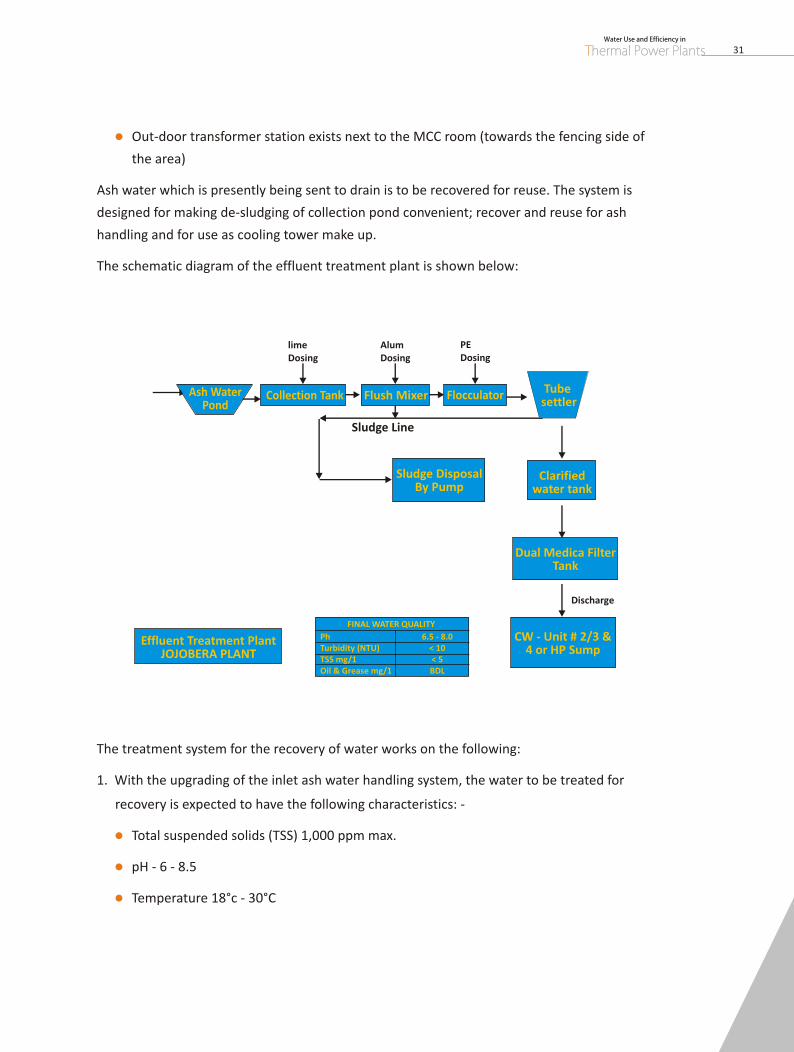
Water Use and Efficiency in
Thermal Power Plants30
Case Study 6: TATA Power Company Limited
l
l
l
l
l
l
l
Location and capacity:
TATA Power has a 547.5 MW (1*67.5 MW+4*120 MW) coal based thermal power plant
located in Jojobera, Jamshedpur.
Amount of water use:
3The amount of water used is 1,520 tonnes / hr (T/hr) which correspond to _ m per day.
Amount of wastewater generated:
The Jojobera plant generates wastewater to the tune of 357 tonnes/ hr. This does not include
the unrecoverable evaporation loss of 1,100 tonnes/ hr from cooling towers.
Amount of wastewater recycled:
The pumping of Unit 1/Unit 4 CT basin water to Units 2&3 CT basins has enabled recycling 54
T/hr of wastewater (Unit 2 and Unit 3 have common CT basin) and its reuse as blow down
water. Another 203 T/hr of wastewater is reused in ash plant for boiler bottom ash handling
and disposal.
Water conservation measures undertaken:
Pumping of Unit 1/Unit 4 CT basin water to Units 2&3 CT basin (Unit 2 and Unit 3 have
common CT basin) to reuse blow down water of U 1/U 4 in U 2&3 basin.
An effluent treatment plant (ETP) is being commissioned at Jojobera Power Plant and it
has started functioning from August, 2011. This plant will recycle 100 per cent effluent
generated and will ensure zero discharge to inland surfaces. The details are provided
below -
The present arrangement for the disposal of ash water consists of:
Collection pond of approximate dimension 115m long x 40m width;
Chamber adjoining the pump house to receive the over flow from the collection pond;
Pumping station with three pumps to pump out water from the chamber to disposal;
Pumps are located in a dry pit approximately 15 meters below ground level and a
provision for a sump pump is observed to pump out any water flooding the dry pit;
Adjoining the pump house, a separate room to house the electrical switch gear Cable
gallery etc. is provided;
Water Use and Efficiency in
Thermal Power Plants 31
the area)
Ash water which is presently being sent to drain is to be recovered for reuse. The system is
designed for making de-sludging of collection pond convenient; recover and reuse for ash
handling and for use as cooling tower make up.
The schematic diagram of the effluent treatment plant is shown below:
lOut-door transformer station exists next to the MCC room (towards the fencing side of
The treatment system for the recovery of water works on the following:
1. With the upgrading of the inlet ash water handling system, the water to be treated for
recovery is expected to have the following characteristics: -
Total suspended solids (TSS) 1,000 ppm max.
pH - 6 - 8.5
Temperature 18°c - 30°C
l
l
l
limeDosing
Alum Dosing
PE Dosing
Sludge Line
Discharge
Tube settler
Flocculator Flush Mixer Collection Tank Ash Water Pond
Sludge Disposal By Pump
Clarified water tank
Dual Medica FilterTank
CW - Unit # 2/3 &4 or HP Sump
FINAL WATER QUALITY
Ph 6.5 - 8.0Turbidity (NTU) < 10TSS mg/1 < 5Oil & Grease mg/1 BDL
Effluent Treatment Plant JOJOBERA PLANT
Water Use and Efficiency in
Thermal Power Plants32
2. The plant is designed to work on gravity flow and treated water will be collected in a sump.
This collected water will be pumped through a dual media filter for use in cooling towers.
33. The scheme for each stream of 100 m /hr consists of:
a. Stilling chamber to receive water from the existing pump - 1no. - 1.4m x 1.4m x 1.5m
liquid depth.
b. Parshall flume to measure the flow in to the plant – 1no.
c. Flush mixer to mix water with added chemicals 1 no. - 2.2m x 2.2m x 2.5m SWD RCC
make.
d. Flocculator for forming flocs - 1no. 3.6m x 3.6m x 3.5m SWD. RCC make
e. Tube settler type static clarifiers to settle out all settle able matter 2nos / stream each
for 50 m³/h 5.2m x 4.6m x 3.5m Hopper Bottom RCC make
f. Chemical dosing system to dose -
3i. Alum - 2 nos. common to both streams 2 m diameter 5.78 m capacity MSEP tank
3ii. Poly electrolyte - 2 nos. common to both streams 1 m diameter 3.37 m capacity
MSEP tank
3iii. Lime for pH correction - 2 nos. common to both streams 2.5m diameter 6.38 m
capacity MSEP tank
iv. Each system is provided with 2 nos. dosing pumps and agitators.
g. Clarified water collection sump (filter feed tank) 5m x 3.5 m x 3 m SWD RCC make
h. Filter feed pump 2 nos 120 m³/h each & 70 MMWC
i. Pressure type dual media filter as per enclosed specification – 2 nos. to filter clarified
water to make it suitable for use in cooling towers. With 3.3 m X 2.2 m X T/T pipe up to
cooling tower (IS3589)
j. Blowers are provided to Backwash filters and also to agitate tube settler - 2 nos.
650m³/h at 0.5kg/cm² each system to clean the clogged tube
3k. Raw effluent Transfer pump 120 m /Hr and 25 MMWC
l. A flow totalizer is provided at the outlet of filter
Water Use and Efficiency in
Thermal Power Plants 33
m. One common sludge thickener to receive the blow down from various units and to
recover water and return the same to ash pond or any other point - 1 no 6.1m dia x 3
MLD
n. Sludge pumps to deliver thickened sludge to designated area.
3o. 2 nos. sludge transfer pump 7.6 m /Hr at 15 MMWC to transfer sludge from tube
settlers and sludge thickener.
This plant will recycle 100 per cent effluent generated and will ensure zero discharge to inland
surfaces.
Volume of water and costs saved:
Measure undertaken Qty of water saved unit / annum Costs saved in INR
Pumping of Unit 1/Unit 4 CT basinwater to Units 2&3 CT basin to reuse (54 T/hr.*24 hours*335 days, of clarified waterblow down water of U 1/U 4 in U 2&3 considering 30 days for ASD being Rs.5.52 per T)basin. of two Units)
Total 434,160 Tonnes / annum 23 lacs
434,160 Tonnes /annum Rs. 2,396,563.2 (cost

Water Use and Efficiency in
Thermal Power Plants32
2. The plant is designed to work on gravity flow and treated water will be collected in a sump.
This collected water will be pumped through a dual media filter for use in cooling towers.
33. The scheme for each stream of 100 m /hr consists of:
a. Stilling chamber to receive water from the existing pump - 1no. - 1.4m x 1.4m x 1.5m
liquid depth.
b. Parshall flume to measure the flow in to the plant – 1no.
c. Flush mixer to mix water with added chemicals 1 no. - 2.2m x 2.2m x 2.5m SWD RCC
make.
d. Flocculator for forming flocs - 1no. 3.6m x 3.6m x 3.5m SWD. RCC make
e. Tube settler type static clarifiers to settle out all settle able matter 2nos / stream each
for 50 m³/h 5.2m x 4.6m x 3.5m Hopper Bottom RCC make
f. Chemical dosing system to dose -
3i. Alum - 2 nos. common to both streams 2 m diameter 5.78 m capacity MSEP tank
3ii. Poly electrolyte - 2 nos. common to both streams 1 m diameter 3.37 m capacity
MSEP tank
3iii. Lime for pH correction - 2 nos. common to both streams 2.5m diameter 6.38 m
capacity MSEP tank
iv. Each system is provided with 2 nos. dosing pumps and agitators.
g. Clarified water collection sump (filter feed tank) 5m x 3.5 m x 3 m SWD RCC make
h. Filter feed pump 2 nos 120 m³/h each & 70 MMWC
i. Pressure type dual media filter as per enclosed specification – 2 nos. to filter clarified
water to make it suitable for use in cooling towers. With 3.3 m X 2.2 m X T/T pipe up to
cooling tower (IS3589)
j. Blowers are provided to Backwash filters and also to agitate tube settler - 2 nos.
650m³/h at 0.5kg/cm² each system to clean the clogged tube
3k. Raw effluent Transfer pump 120 m /Hr and 25 MMWC
l. A flow totalizer is provided at the outlet of filter
Water Use and Efficiency in
Thermal Power Plants 33
m. One common sludge thickener to receive the blow down from various units and to
recover water and return the same to ash pond or any other point - 1 no 6.1m dia x 3
MLD
n. Sludge pumps to deliver thickened sludge to designated area.
3o. 2 nos. sludge transfer pump 7.6 m /Hr at 15 MMWC to transfer sludge from tube
settlers and sludge thickener.
This plant will recycle 100 per cent effluent generated and will ensure zero discharge to inland
surfaces.
Volume of water and costs saved:
Measure undertaken Qty of water saved unit / annum Costs saved in INR
Pumping of Unit 1/Unit 4 CT basinwater to Units 2&3 CT basin to reuse (54 T/hr.*24 hours*335 days, of clarified waterblow down water of U 1/U 4 in U 2&3 considering 30 days for ASD being Rs.5.52 per T)basin. of two Units)
Total 434,160 Tonnes / annum 23 lacs
434,160 Tonnes /annum Rs. 2,396,563.2 (cost
Water Use and Efficiency in
Thermal Power Plants34
Case Study 7: TATA Power Company Limited
l
l
Location and capacity:
Tata Power Company Limited (TPC) is installing a thermal power plant of 4,000 MW capacity
(5 x 800 MW) at Mundra in Kutch district of Gujarat. The plant site is located on the northern
shore of the Gulf of Kutch of the Arabian Sea and is about 25 km west of Mundra port. This
ultra mega project will establish India's first 800-megawatt unit super-critical technology
thermal power plant, which is likely to be the most energy-efficient, coal-based thermal
power plant in the country.
Amount of water use:
3The power plant will use desalinated water to the tune of 630,000 m /hr for cooling purpose 3and 25,000 m /day to meet operations, service and drinking water needs during full load
operation.
Amount of wastewater generated and recycled:
In the ongoing construction phase, wastewater to the tune of 3.5 lakh litres per day is
generated from the labour colony. This entire volume is recycled through a sewage treatment
plant set up having a capacity of 10 lakh litres per day.
Water conservation measures undertaken
Kutch, a semi-arid district in the state of Gujarat and is known for its water scarcity. For the
industries which are set up in Kutch, water scarcity has been a regular affair resulting in huge
production losses. According to the Federation of Kutch Industries Association (FOKIA), water
from the Narmada being supplied through the Saurashtra branch canal since 2005 is
inadequate to meet the requirements of the industry. The Coastal Gujarat Power Limited a
SPV of TATA Power has taken the following intervention to limit the usage of groundwater and
other freshwater sources:
There is a self moratorium on not using groundwater during construction as well as
operation stages.
Sea water desalination: is being undertaken to meet the plant cooling, service and 3
potable water requirements. At full plant operation, 630,000 m /hr (630 million
litres/hr) of cooling water will be required for which 10 numbers, concrete volute
pumps each of 63,000 m³ /hr capacity have been provided to meet the condenser,
desalination and auxiliary cooling water requirements. The 550 meters intake channel
Water Use and Efficiency in
Thermal Power Plants 35
feeding this requirement of sea water along with the 2.5 km outfall channel for
discharging the water back to sea are concrete lined to prevent ingress of sea water in
to the water table and thus prevent groundwater salination.
A sea water based Reverse Osmosis (RO) plant of capacity 25 million litres/day capacity
along with downstream demineralization plant to produce DM water has been installed.
Demineralised water is required to make good the loss of inventory from the TG Cycle of
the power plant. The RO plant along with a re-mineralization plant based on the DM
water plant output serves the total plant service and potable water requirements.
Wastewater treatment and recycling: Sea water is being used to separate ash from
water in specially designed ash pond (to prevent ingress of sea water into the water
table) and the clear water is discharged back to sea. A Sewage Treatment Plant (STP) of
10 lakh litres/day capacity has been set up. This meets the water requirements for the
extensive vegetation screen development along the plant periphery and landscaping.
Construction / improvement of structures to store rain treated water: old nullahs have
been widened and re-routed to channelize rain water to catchment area. Further
numerous small ponds have been dug up to conserve the treated water from STP.
Rainwater harvesting system is installed in all major buildings in plant and colony
l
l
l
Volume of water and costs saved
Measure undertaken Qty of water saved unit / annum Costs saved in INR
Recycled water from STP being used for greenvegetation purpose and ground water charging (3,50,000 litres per day x 365) (@ Rs 44/KL)
Total 12,77 MLD 5,600, 000
12,77 MLD 56 lakhs / Annum
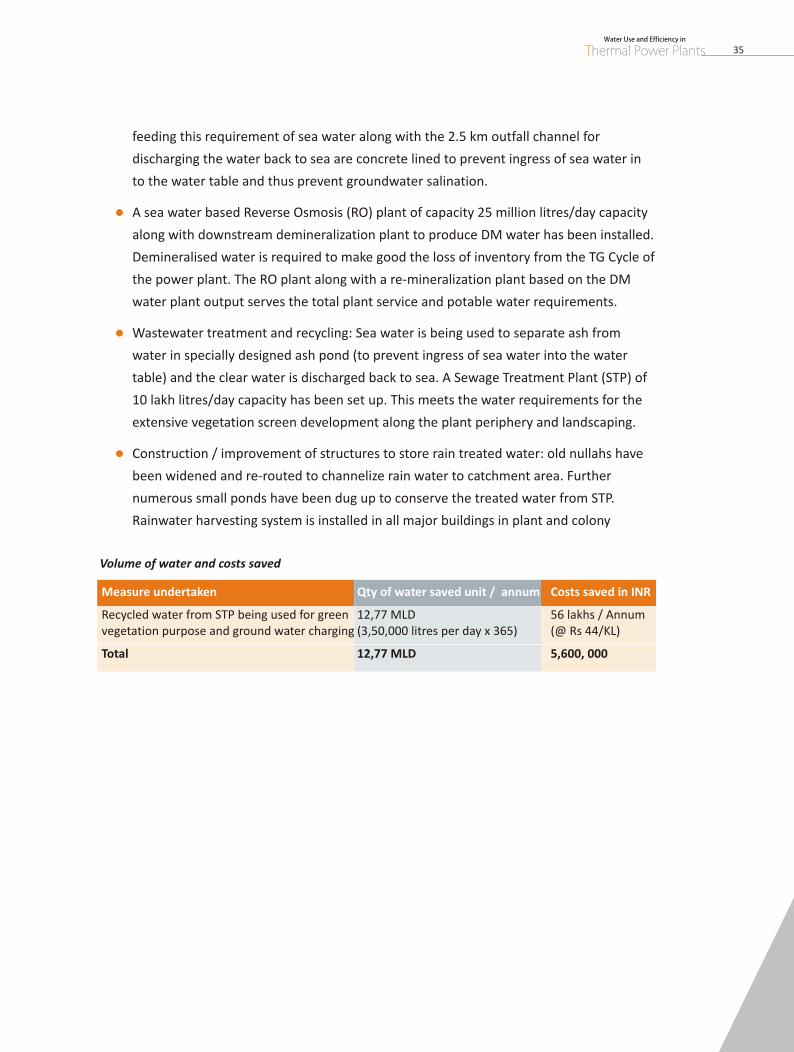
Water Use and Efficiency in
Thermal Power Plants34
Case Study 7: TATA Power Company Limited
l
l
Location and capacity:
Tata Power Company Limited (TPC) is installing a thermal power plant of 4,000 MW capacity
(5 x 800 MW) at Mundra in Kutch district of Gujarat. The plant site is located on the northern
shore of the Gulf of Kutch of the Arabian Sea and is about 25 km west of Mundra port. This
ultra mega project will establish India's first 800-megawatt unit super-critical technology
thermal power plant, which is likely to be the most energy-efficient, coal-based thermal
power plant in the country.
Amount of water use:
3The power plant will use desalinated water to the tune of 630,000 m /hr for cooling purpose 3and 25,000 m /day to meet operations, service and drinking water needs during full load
operation.
Amount of wastewater generated and recycled:
In the ongoing construction phase, wastewater to the tune of 3.5 lakh litres per day is
generated from the labour colony. This entire volume is recycled through a sewage treatment
plant set up having a capacity of 10 lakh litres per day.
Water conservation measures undertaken
Kutch, a semi-arid district in the state of Gujarat and is known for its water scarcity. For the
industries which are set up in Kutch, water scarcity has been a regular affair resulting in huge
production losses. According to the Federation of Kutch Industries Association (FOKIA), water
from the Narmada being supplied through the Saurashtra branch canal since 2005 is
inadequate to meet the requirements of the industry. The Coastal Gujarat Power Limited a
SPV of TATA Power has taken the following intervention to limit the usage of groundwater and
other freshwater sources:
There is a self moratorium on not using groundwater during construction as well as
operation stages.
Sea water desalination: is being undertaken to meet the plant cooling, service and 3
potable water requirements. At full plant operation, 630,000 m /hr (630 million
litres/hr) of cooling water will be required for which 10 numbers, concrete volute
pumps each of 63,000 m³ /hr capacity have been provided to meet the condenser,
desalination and auxiliary cooling water requirements. The 550 meters intake channel
Water Use and Efficiency in
Thermal Power Plants 35
feeding this requirement of sea water along with the 2.5 km outfall channel for
discharging the water back to sea are concrete lined to prevent ingress of sea water in
to the water table and thus prevent groundwater salination.
A sea water based Reverse Osmosis (RO) plant of capacity 25 million litres/day capacity
along with downstream demineralization plant to produce DM water has been installed.
Demineralised water is required to make good the loss of inventory from the TG Cycle of
the power plant. The RO plant along with a re-mineralization plant based on the DM
water plant output serves the total plant service and potable water requirements.
Wastewater treatment and recycling: Sea water is being used to separate ash from
water in specially designed ash pond (to prevent ingress of sea water into the water
table) and the clear water is discharged back to sea. A Sewage Treatment Plant (STP) of
10 lakh litres/day capacity has been set up. This meets the water requirements for the
extensive vegetation screen development along the plant periphery and landscaping.
Construction / improvement of structures to store rain treated water: old nullahs have
been widened and re-routed to channelize rain water to catchment area. Further
numerous small ponds have been dug up to conserve the treated water from STP.
Rainwater harvesting system is installed in all major buildings in plant and colony
l
l
l
Volume of water and costs saved
Measure undertaken Qty of water saved unit / annum Costs saved in INR
Recycled water from STP being used for greenvegetation purpose and ground water charging (3,50,000 litres per day x 365) (@ Rs 44/KL)
Total 12,77 MLD 5,600, 000
12,77 MLD 56 lakhs / Annum
Water Use and Efficiency in
Thermal Power Plants36
FICCI Water Mission
Access to safe water is one of the essential elements for sustainable development and poverty
reduction. However, the past few decades has seen an increase in demand amongst various
water using sectors putting enormous stress on the natural resource.
FICCI constituted a 'Water Mission' to promote and provide thought leadership in the area of
water efficiency. It aims to facilitate the sharing and dissemination of best practices across
industry sectors in order to encourage corporate and industry players to imbibe a culture of
water conservation within their organizations.
The Mission is working to create awareness on the existing situation pertaining to water
scarcity, quality and generate a discourse on sustainable use of water amongst various users.
With growing and extensive depletion and pollution of our water resources, our current work
is being restructured to bring this issue back in focus to provide a sense of urgency to the
debate of water management.
The objectives of the divisions work are:
vTo formulate suggestions for changes in policy framework in India for better water
resource allocation, conservation and management;
vTo promote fresh water conservation strategies across the irrigation, industry and
domestic sectors;
vTo document and disseminate best practices across various sectors and create a forum to
facilitate exchange of information and experiences in the country;
vTo promote new innovative technologies of water saving and management like rainwater
harvesting, watershed management, desalination, water auditing and accounting across
water intensive sectors through projects, workshops, conferences and training
programmes.
Queries to FICCI may be directed to:
Mr. Romit Sen Federation of Indian Chambers of
Senior Assistant Director Commerce and Industry
FICCI Water Mission Federation House
Tansen Marg, New Delhi - 110001
Ph: +91-11-23738252
Fax: +91-11-23765333
Email: [email protected]

Federation House, Tansen Marg, New Delhi - 110001T: +91-11- 23487252 / F: +91-11- 23765333
E: [email protected]: www.ficci.com
FEDERATION OF INDIAN CHAMBERS OF COMMERCE AND INDUSTRY