Embed Size (px)
Citation preview
FIDELITYASIAN VALUES PLC
Interim Report for the 6 months ended
31 January
2005
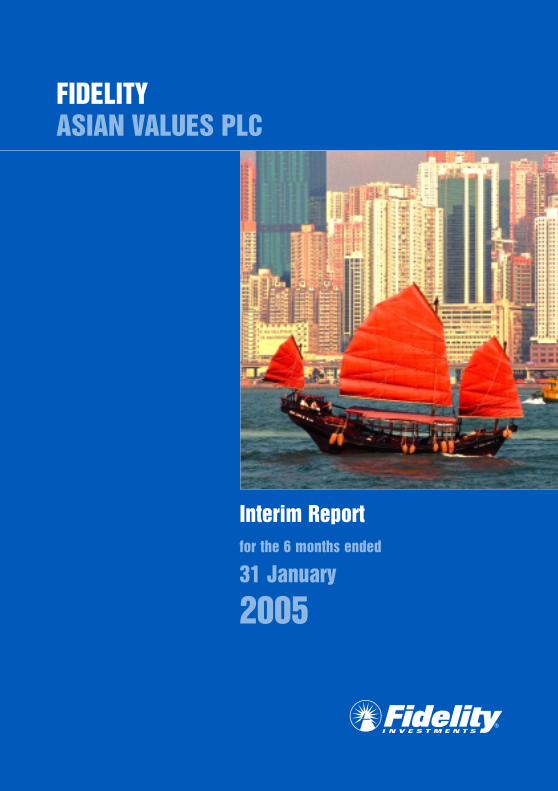
The Investment Objective
of the Company is to achieve long-term capital growth through
investment principally in the stockmarkets of the Asian Region
(excluding Japan).
Net asset value (NAV) +22.6% -16.6%
Share price +31.4% -22.0%
MSCI All Countries (Combined)Far East Free ex Japan Index (£)
+18.5% -33.9%
Net asset value per share -25.5% -12.6% -30.1% +39.3% +9.2%
Share price -28.4% -16.1% -27.5% +41.4% +15.1%
From launch Six months to 13 June 1996 to
31 January 2005 31 January 2005
31/01/00 31/01/01 31/01/02 31/01/03 31/01/04to to to to to
31/01/01 31/01/02 31/01/03 31/01/04 31/01/05
(Past performance is not a guide to future returns)
Performance – total return (includes reinvested income)
Standardised performance
1
Contents
2 Summary of Results
3 Interim Report
5 Portfolio Listing
6 Statement of Total Return
8 Balance Sheet
9 Cash Flow Statement
10 Notes to the Accounts
12 Investor Information
13 Directory
2
Summary of Results
* price change1 cash includes investment in Fidelity Institutional Cash Fund plc2 price index, sterling adjusted3 with net dividends (after tax) reinvested, expressed in £
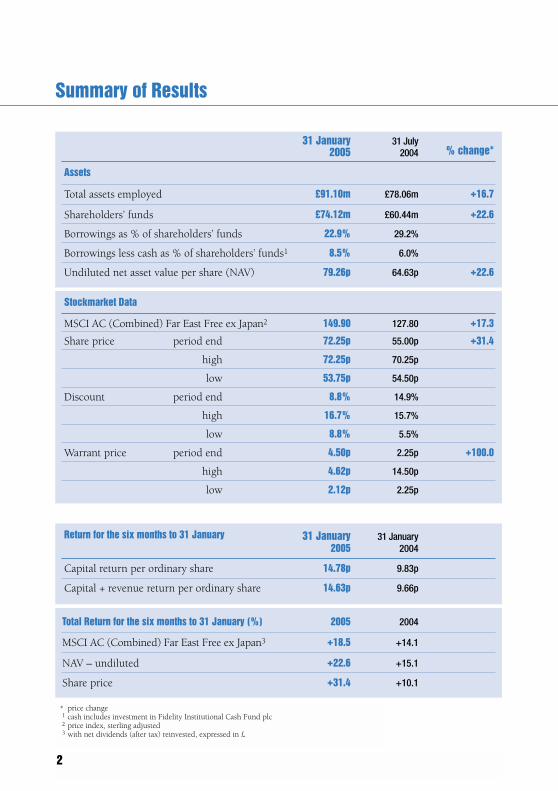
31 January 31 July2005 2004 % change*
Assets
Total assets employed £91.10m £78.06m +16.7
Shareholders’ funds £74.12m £60.44m +22.6
Borrowings as % of shareholders’ funds 22.9% 29.2%
Borrowings less cash as % of shareholders’ funds1 8.5% 6.0%
Undiluted net asset value per share (NAV) 79.26p 64.63p +22.6
Stockmarket Data
MSCI AC (Combined) Far East Free ex Japan2 149.90 127.80 +17.3
Share price period end 72.25p 55.00p +31.4
high 72.25p 70.25p
low 53.75p 54.50p
Discount period end 8.8% 14.9%
high 16.7% 15.7%
low 8.8% 5.5%
Warrant price period end 4.50p 2.25p +100.0
high 4.62p 14.50p
low 2.12p 2.25p
Return for the six months to 31 January 31 January 31 January2005 2004
Capital return per ordinary share 14.78p 9.83p
) Capital + revenue return per ordinary share 14.63p 9.66p
Total Return for the six months to 31 January (%) 2005 2004
MSCI AC (Combined) Far East Free ex Japan3 +18.5 +14.1
NAV – undiluted +22.6 +15.1
Share price +31.4 +10.1
Interim Report
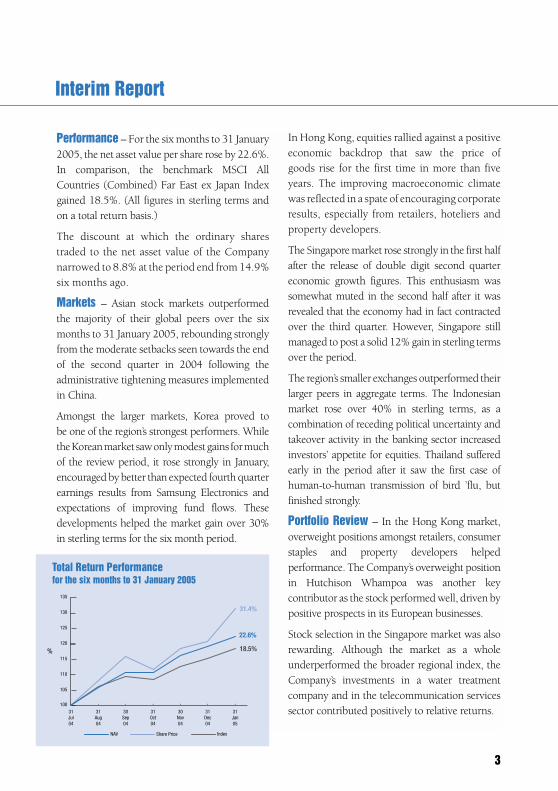
Performance – For the six months to 31 January2005, the net asset value per share rose by 22.6%.In comparison, the benchmark MSCI AllCountries (Combined) Far East ex Japan Indexgained 18.5%. (All figures in sterling terms andon a total return basis.)
The discount at which the ordinary sharestraded to the net asset value of the Companynarrowed to 8.8% at the period end from 14.9%six months ago.
Markets – Asian stock markets outperformed the majority of their global peers over the sixmonths to 31 January 2005, rebounding stronglyfrom the moderate setbacks seen towards the endof the second quarter in 2004 following theadministrative tightening measures implementedin China.
Amongst the larger markets, Korea proved to be one of the region’s strongest performers. While the Korean market saw only modest gains for muchof the review period, it rose strongly in January,encouraged by better than expected fourth quarterearnings results from Samsung Electronics andexpectations of improving fund flows. Thesedevelopments helped the market gain over 30% in sterling terms for the six month period.
In Hong Kong, equities rallied against a positiveeconomic backdrop that saw the price of goods rise for the first time in more than fiveyears. The improving macroeconomic climatewas reflected in a spate of encouraging corporateresults, especially from retailers, hoteliers andproperty developers.
The Singapore market rose strongly in the first halfafter the release of double digit second quartereconomic growth figures. This enthusiasm wassomewhat muted in the second half after it wasrevealed that the economy had in fact contractedover the third quarter. However, Singapore stillmanaged to post a solid 12% gain in sterling termsover the period.
The region’s smaller exchanges outperformed theirlarger peers in aggregate terms. The Indonesianmarket rose over 40% in sterling terms, as acombination of receding political uncertainty andtakeover activity in the banking sector increasedinvestors’ appetite for equities. Thailand sufferedearly in the period after it saw the first case ofhuman-to-human transmission of bird ’flu, butfinished strongly.
Portfolio Review – In the Hong Kong market,overweight positions amongst retailers, consumerstaples and property developers helpedperformance. The Company’s overweight positionin Hutchison Whampoa was another keycontributor as the stock performed well, driven bypositive prospects in its European businesses.
Stock selection in the Singapore market was alsorewarding. Although the market as a wholeunderperformed the broader regional index, theCompany’s investments in a water treatmentcompany and in the telecommunication servicessector contributed positively to relative returns.
% 18.5%
31.4%
100
105
110
115
120
125
130
135
IndexShare PriceNAV
'31Jan05
'31Dec04
'30Nov04
'31Oct04
'30Sep04
'31Aug04
'31Jul04
22.6%
Total Return Performancefor the six months to 31 January 2005
3
Telecommunications and financial sector holdingsin Taiwan also aided performance. By contrast,poor stock selection in the Korean market,including key positions in an advertising agencyand a leading food retailer had a negative impact. The Company’s investment in SamsungElectronics, one of the top ten holdings, alsodisappointed. Despite the announcement of better than expected results in the final weeks ofthe review period, the stock suffered in its lead-upperiod due to speculation that an appreciatingcurrency could reduce profit margins. Finally, theCompany’s overweight position in Malaysia alsodetracted from performance as the marketunderperformed the broader regional index by aconsiderable margin.
Outlook for the Region – In terms of marketsentiment the outlook for equity based investmentin the Asian region seems broadly positive. Thereflation theme, particularly relevant in marketssuch as Hong Kong and Singapore, should provesupportive for a number of sectors, includingbanks, real estate, building materials and retailers.There are also likely to be further structuralimprovements through government reforms andgreater returns on capital as companies becomemore efficient. But there are some provisos, whichmean that the signs are difficult to read.
The region’s prosperity has traditionally beendependent on demand from western nations, theUnited States in particular, for electroniccomponents and consumer goods. The health ofthe US economy, and of the US dollar to whichregional currencies are linked, are therefore ofcritical concern. More recently intra-Asian tradehas been fuelled by demand from China, the
region’s rapidly growing economic powerhouse. IfChinese growth were to falter, this could have aknock-on effect.
There are also political uncertainties. NorthKorea’s nuclear ambitions remain a matter of real concern to its neighbours, to the UnitedStates and to most of the rest of the world. ButTaiwan continues to be the most serious sourceof potential instability. While tensions betweenthe United States and China over the island’sstatus have long been managed successfully, anincreasingly assertive Japan has recently angeredChina by making clear – for the first time – thatit has a security interest in Taiwan which it shareswith the United States. As with North Korea, itis in the overwhelming interest of the region andthe international community that the situationbe kept under control. But the war of words couldfrighten the markets from time to time.
Directors – On 9 February 2005 William Knightand Kathryn Matthews were appointed asDirectors of the Company and Simon Haslamresigned from the Board. Following a career ininvestment banking Mr Knight chairs a corporatefinance and advisory company. Miss Matthews ishead of the Manager’s Portfolio Strategies Groupand Mr Haslam is its Chief Administrative Officer.
By order of the BoardFidelity Investments International18 March 2005
Interim Report
4
5
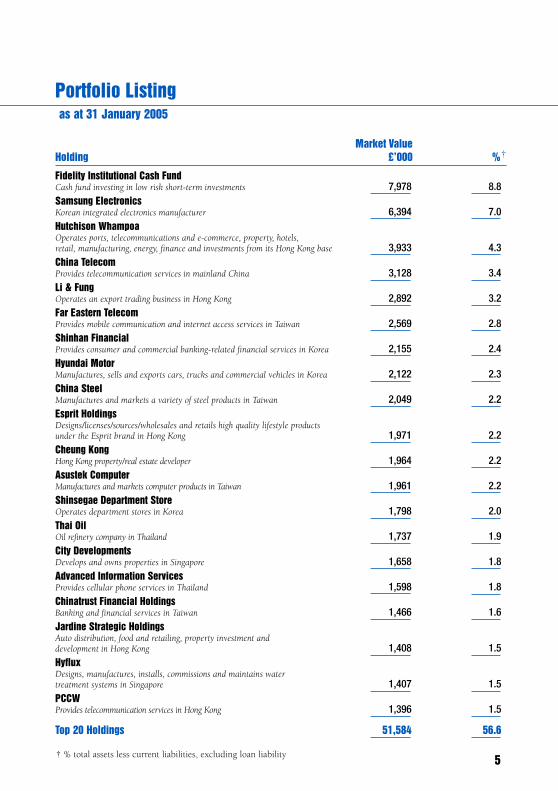
Portfolio Listing
† % total assets less current liabilities, excluding loan liability
as at 31 January 2005
Market ValueHolding £’000 %†
Fidelity Institutional Cash FundCash fund investing in low risk short-term investments 7,978 8.8Samsung ElectronicsKorean integrated electronics manufacturer 6,394 7.0Hutchison WhampoaOperates ports, telecommunications and e-commerce, property, hotels, retail, manufacturing, energy, finance and investments from its Hong Kong base 3,933 4.3China TelecomProvides telecommunication services in mainland China 3,128 3.4Li & FungOperates an export trading business in Hong Kong 2,892 3.2Far Eastern TelecomProvides mobile communication and internet access services in Taiwan 2,569 2.8Shinhan FinancialProvides consumer and commercial banking-related financial services in Korea 2,155 2.4Hyundai MotorManufactures, sells and exports cars, trucks and commercial vehicles in Korea 2,122 2.3China SteelManufactures and markets a variety of steel products in Taiwan 2,049 2.2Esprit HoldingsDesigns/licenses/sources/wholesales and retails high quality lifestyle products under the Esprit brand in Hong Kong 1,971 2.2Cheung KongHong Kong property/real estate developer 1,964 2.2Asustek ComputerManufactures and markets computer products in Taiwan 1,961 2.2Shinsegae Department StoreOperates department stores in Korea 1,798 2.0Thai OilOil refinery company in Thailand 1,737 1.9City DevelopmentsDevelops and owns properties in Singapore 1,658 1.8Advanced Information ServicesProvides cellular phone services in Thailand 1,598 1.8Chinatrust Financial HoldingsBanking and financial services in Taiwan 1,466 1.6Jardine Strategic HoldingsAuto distribution, food and retailing, property investment and development in Hong Kong 1,408 1.5HyfluxDesigns, manufactures, installs, commissions and maintains water treatment systems in Singapore 1,407 1.5PCCWProvides telecommunication services in Hong Kong 1,396 1.5
Top 20 Holdings 51,584 56.6
6
unaudited
revenue capital totalnotes £’000 £’000 £’000
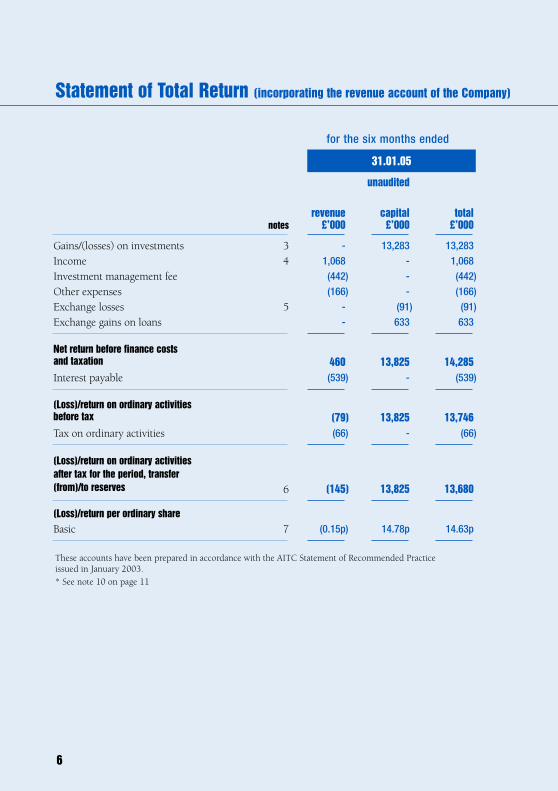
Gains/(losses) on investments 3 - 13,283 13,283Income 4 1,068 - 1,068Investment management fee (442) - (442)Other expenses (166) - (166)Exchange losses 5 - (91) (91)Exchange gains on loans - 633 633
460 13,825 14,285Interest payable (539) - (539)
(79) 13,825 13,746Tax on ordinary activities (66) - (66)
6 (145) 13,825 13,680
(Loss)/return per ordinary shareBasic 7 (0.15p) 14.78p 14.63p
These accounts have been prepared in accordance with the AITC Statement of Recommended Practice issued in January 2003.
* See note 10 on page 11
(Loss)/return on ordinary activitiesafter tax for the period, transfer(from)/to reserves
(Loss)/return on ordinary activitiesbefore tax
Net return before finance costsand taxation
Statement of Total Return (incorporating the revenue account of the Company)
for the six months ended
31.01.05
7
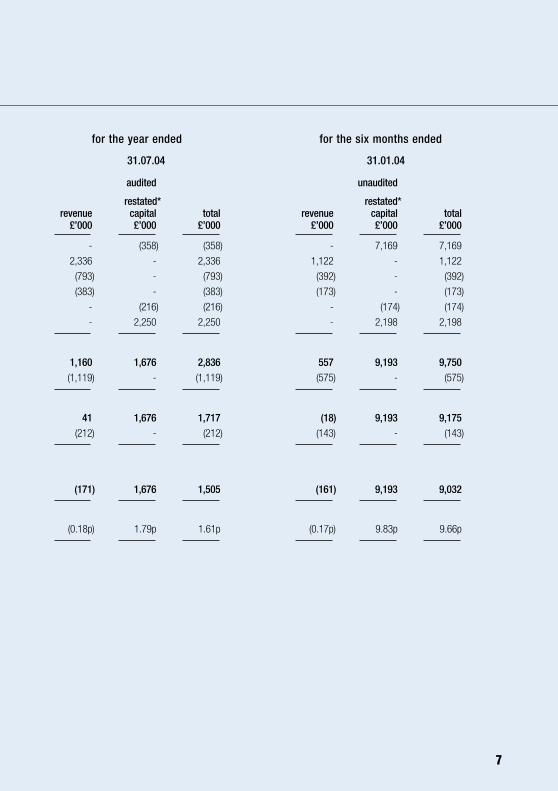
audited unaudited
restated* restated*revenue capital total revenue capital total
£’000 £’000 £’000 £’000 £’000 £’000
- (358) (358) - 7,169 7,169
2,336 - 2,336 1,122 - 1,122
(793) - (793) (392) - (392)
(383) - (383) (173) - (173)
- (216) (216) - (174) (174)
- 2,250 2,250 - 2,198 2,198
1,160 1,676 2,836 557 9,193 9,750 (1,119) - (1,119) (575) - (575)
41 1,676 1,717 (18) 9,193 9,175 (212) - (212) (143) - (143)
(171) 1,676 1,505 (161) 9,193 9,032
(0.18p) 1.79p 1.61p (0.17p) 9.83p 9.66p
for the year ended for the six months ended
31.07.04 31.01.04
8
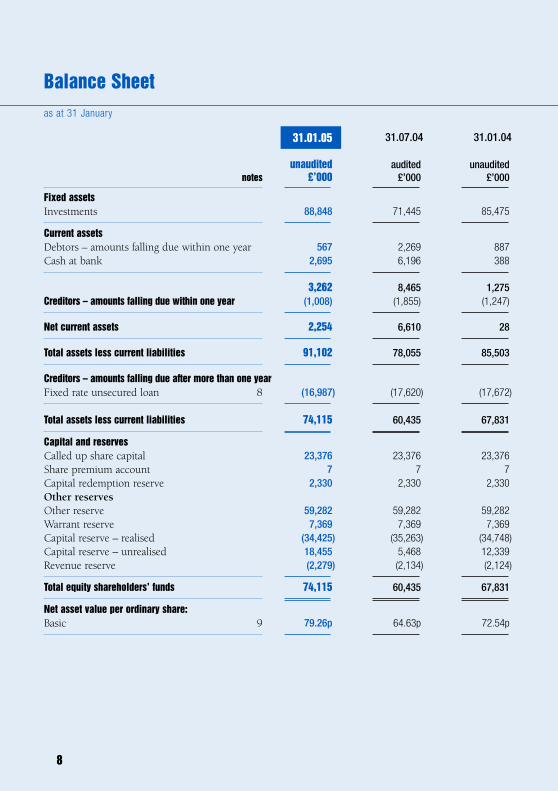
unaudited audited unauditednotes £’000 £’000 £’000
Fixed assetsInvestments 88,848 71,445 85,475
Current assetsDebtors – amounts falling due within one year 567 2,269 887Cash at bank 2,695 6,196 388
3,262 8,465 1,275 Creditors – amounts falling due within one year (1,008) (1,855) (1,247)
Net current assets 2,254 6,610 28
Total assets less current liabilities 91,102 78,055 85,503
Creditors – amounts falling due after more than one yearFixed rate unsecured loan 8 (16,987) (17,620) (17,672)
Total assets less current liabilities 74,115 60,435 67,831
Capital and reservesCalled up share capital 23,376 23,376 23,376 Share premium account 7 7 7Capital redemption reserve 2,330 2,330 2,330 Other reservesOther reserve 59,282 59,282 59,282 Warrant reserve 7,369 7,369 7,369 Capital reserve – realised (34,425) (35,263) (34,748)Capital reserve – unrealised 18,455 5,468 12,339 Revenue reserve (2,279) (2,134) (2,124)
Total equity shareholders’ funds 74,115 60,435 67,831
Net asset value per ordinary share:Basic 9 79.26p 64.63p 72.54p
Balance Sheetas at 31 January
31.01.05 31.07.04 31.01.04
9
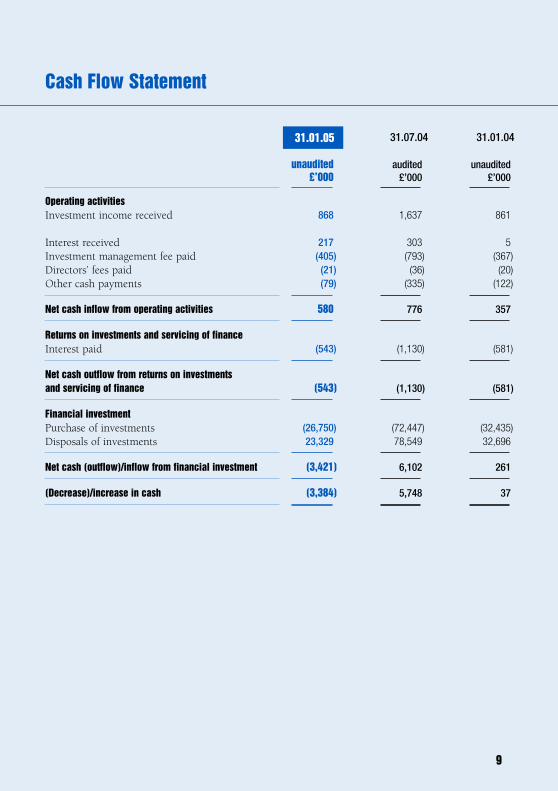
unaudited audited unaudited£’000 £’000 £’000
Operating activitiesInvestment income received 868 1,637 861
Interest received 217 303 5Investment management fee paid (405) (793) (367)Directors’ fees paid (21) (36) (20)Other cash payments (79) (335) (122)
Net cash inflow from operating activities 580 776 357
Returns on investments and servicing of financeInterest paid (543) (1,130) (581)
Net cash outflow from returns on investmentsand servicing of finance (543) (1,130) (581)
Financial investmentPurchase of investments (26,750) (72,447) (32,435)Disposals of investments 23,329 78,549 32,696
Net cash (outflow)/inflow from financial investment (3,421) 6,102 261
(Decrease)/increase in cash (3,384) 5,748 37
Cash Flow Statement
31.01.05 31.07.04 31.01.04

10
Notes to the Accounts
1. Accounting policies – The interim financial statements have been prepared on the basis of the accountingpolicies set out in the Company’s annual report and accounts dated 31 July 2004.
2. Statement of Total Return – The revenue column on this statement is the profit and loss account of the Company.
3. Gains/(losses) on investments – Realised and unrealised gains and losses on investments.
4. Income
31.01.05 31.07.04 31.01.04unaudited audited unaudited
UK dividends 5 - -UK scrip dividends 6 60 41Overseas dividends 840 1,973 944Interest on securities 188 291 133Deposit interest 29 12 4
1,068 2,336 1,122
5. Exchange losses – Attributable to other assets and liabilities, excluding borrowings.
6. (Loss)/return on ordinary activities – Attributable to equity shareholders.
7. (Loss)/return per ordinary share – Basic returns per ordinary share are based on the loss on ordinaryactivities after taxation of £145,000 (31.07.04: loss £171,000; 31.01.04: loss £161,000) and the capitalappreciation in the period of £13,825,000 (31.07.04: appreciation £1,676,000; 31.01.04: appreciation£9,193,000) and on 93,505,653 ordinary shares (31.07.04: 93,505,653; 31.01.04: 93,505,653), beingthe weighted average number of shares in issue during the period. According to the provisions ofFRS14, the fully-diluted returns have been calculated on the assumptions that the warrants in issue wereconverted on the first day of the financial period on a weighted average basis for the period over whichthey were outstanding, and that the proceeds from conversion have been used by the Company topurchase its own shares at a fair market price.
8. Loan facility – A fixed rate loan facility of US$32,000,000 from HSBC Bank plc was drawn down on 27 September 2001 at an interest rate of 6.28% per annum. The loan is for a period of five years and is due to be repaid on 27 September 2006. The sterling value of the loan as at 31 January 2005 was£16,987,000 (31.07.04: £17,620,000; 31.01.04: £17,672,000).
9. Net asset value per share – The basic net asset value per ordinary share is based on net assets of £74,115,000 (31.07.04: £60,435,000; 31.01.04: £67,831,000) and on 93,505,653 ordinary shares(31.07.04: 93,505,653; 31.01.04: 93,505,653), being the number of ordinary shares in issue at the period end.
11
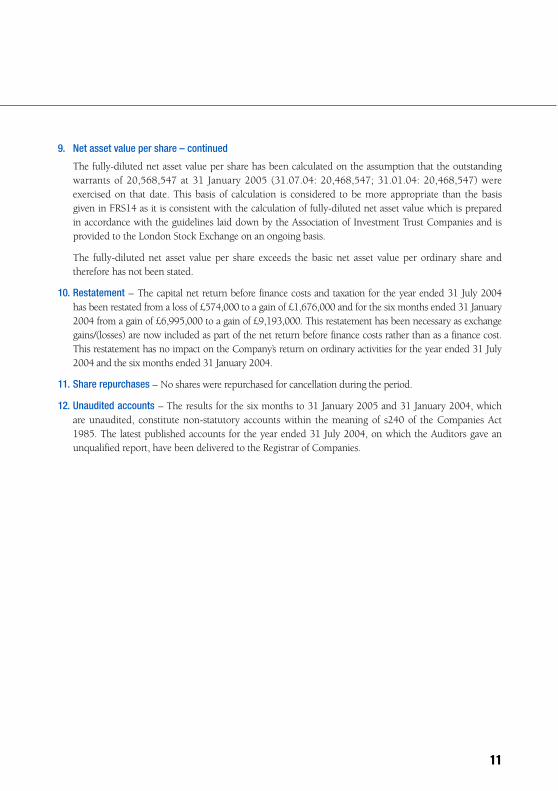
The fully-diluted net asset value per share has been calculated on the assumption that the outstandingwarrants of 20,568,547 at 31 January 2005 (31.07.04: 20,468,547; 31.01.04: 20,468,547) wereexercised on that date. This basis of calculation is considered to be more appropriate than the basisgiven in FRS14 as it is consistent with the calculation of fully-diluted net asset value which is preparedin accordance with the guidelines laid down by the Association of Investment Trust Companies and isprovided to the London Stock Exchange on an ongoing basis.
The fully-diluted net asset value per share exceeds the basic net asset value per ordinary share andtherefore has not been stated.
10. Restatement – The capital net return before finance costs and taxation for the year ended 31 July 2004 has been restated from a loss of £574,000 to a gain of £1,676,000 and for the six months ended 31 January2004 from a gain of £6,995,000 to a gain of £9,193,000. This restatement has been necessary as exchangegains/(losses) are now included as part of the net return before finance costs rather than as a finance cost.This restatement has no impact on the Company’s return on ordinary activities for the year ended 31 July2004 and the six months ended 31 January 2004.
11. Share repurchases – No shares were repurchased for cancellation during the period.
12. Unaudited accounts – The results for the six months to 31 January 2005 and 31 January 2004, whichare unaudited, constitute non-statutory accounts within the meaning of s240 of the Companies Act1985. The latest published accounts for the year ended 31 July 2004, on which the Auditors gave anunqualified report, have been delivered to the Registrar of Companies.
9. Net asset value per share – continued
12
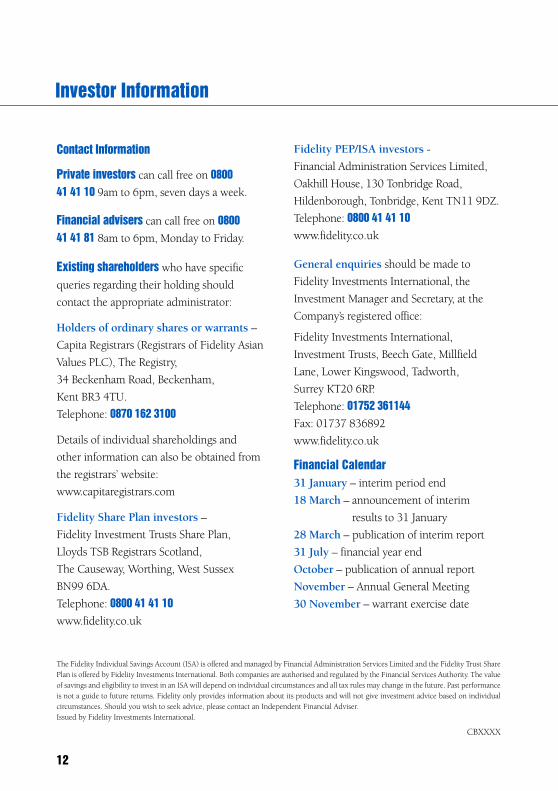
Investor Information
Contact Information
Private investors can call free on 0800 41 41 10 9am to 6pm, seven days a week.
Financial advisers can call free on 0800 41 41 81 8am to 6pm, Monday to Friday.
Existing shareholders who have specific
queries regarding their holding should
contact the appropriate administrator:
Holders of ordinary shares or warrants –
Capita Registrars (Registrars of Fidelity Asian
Values PLC), The Registry,
34 Beckenham Road, Beckenham,
Kent BR3 4TU.
Telephone: 0870 162 3100
Details of individual shareholdings and
other information can also be obtained from
the registrars’ website:
www.capitaregistrars.com
Fidelity Share Plan investors –
Fidelity Investment Trusts Share Plan,
Lloyds TSB Registrars Scotland,
The Causeway, Worthing, West Sussex
BN99 6DA.
Telephone: 0800 41 41 10www.fidelity.co.uk
Fidelity PEP/ISA investors -
Financial Administration Services Limited,
Oakhill House, 130 Tonbridge Road,
Hildenborough, Tonbridge, Kent TN11 9DZ.
Telephone: 0800 41 41 10www.fidelity.co.uk
General enquiries should be made to
Fidelity Investments International, the
Investment Manager and Secretary, at the
Company’s registered office:
Fidelity Investments International,
Investment Trusts, Beech Gate, Millfield
Lane, Lower Kingswood, Tadworth,
Surrey KT20 6RP.
Telephone: 01752 361144Fax: 01737 836892
www.fidelity.co.uk
Financial Calendar31 January – interim period end
18 March – announcement of interim
results to 31 January
28 March – publication of interim report
31 July – financial year end
October – publication of annual report
November – Annual General Meeting
30 November – warrant exercise date
The Fidelity Individual Savings Account (ISA) is offered and managed by Financial Administration Services Limited and the Fidelity Trust SharePlan is offered by Fidelity Investments International. Both companies are authorised and regulated by the Financial Services Authority. The valueof savings and eligibility to invest in an ISA will depend on individual circumstances and all tax rules may change in the future. Past performanceis not a guide to future returns. Fidelity only provides information about its products and will not give investment advice based on individualcircumstances. Should you wish to seek advice, please contact an Independent Financial Adviser.Issued by Fidelity Investments International.
CBXXXX
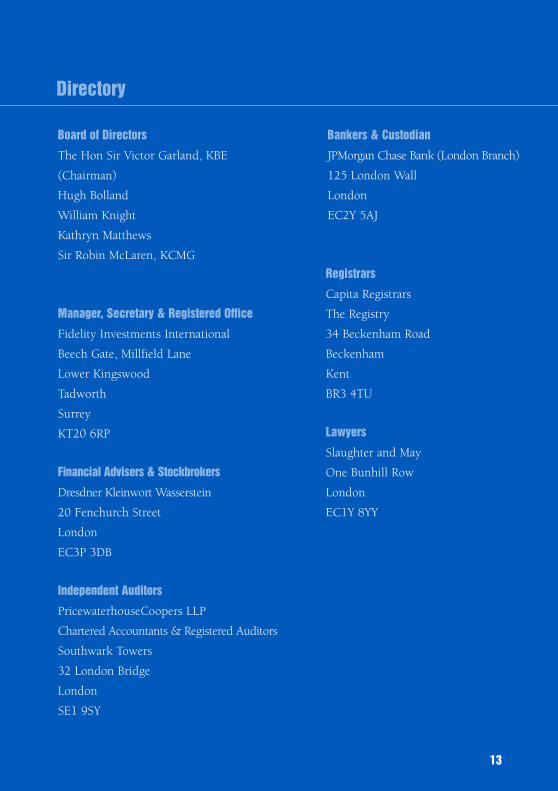
Board of Directors
The Hon Sir Victor Garland, KBE
(Chairman)
Hugh Bolland
William Knight
Kathryn Matthews
Sir Robin McLaren, KCMG
Manager, Secretary & Registered Office
Fidelity Investments International
Beech Gate, Millfield Lane
Lower Kingswood
Tadworth
Surrey
KT20 6RP
Financial Advisers & Stockbrokers
Dresdner Kleinwort Wasserstein
20 Fenchurch Street
London
EC3P 3DB
Independent Auditors
PricewaterhouseCoopers LLP
Chartered Accountants & Registered Auditors
Southwark Towers
32 London Bridge
London
SE1 9SY
Bankers & Custodian
JPMorgan Chase Bank (London Branch)
125 London Wall
London
EC2Y 5AJ
Registrars
Capita Registrars
The Registry
34 Beckenham Road
Beckenham
Kent
BR3 4TU
Lawyers
Slaughter and May
One Bunhill Row
London
EC1Y 8YY
Directory
13

FIDELITYASIAN VALUES PLC
Beech GateMillfield LaneLower KingswoodTadworthSurrey KT20 6RP


![Morningstar Rating™ † Fidelity Funds – Asian High Yield Fund · a-mdist-usd a n - ¯ l ] ó æ 202.04.07 8.25 ffasiam lx lu0286669428 a-mdist-hkd a n- ¯ l ] ó- È 218.08.10](https://img.pdfslide.net/doc/110x75/5b373ab97f8b9aad388e0d20/morningstar-rating-fidelity-funds-asian-high-yield-a-mdist-usd-a.jpg)