Embed Size (px)
Citation preview

PORTFOLIO MANAGER Q&A | AS OF SEPTEMBER 30, 2019
Fidelity Freedom® Index Funds
Key Takeaways
• For the semiannual reporting period ending September 30, 2019, the Investor Class shares of each Fidelity Freedom® Index Fund posted a gain, ranging from 4.27% for Fidelity Freedom® Index Income Fund to roughly 4.8% for longer-dated Funds. As expected, each Fund performed about in line with its respective Composite index.
• All major asset classes the Funds invest in produced a positive return the past six months.
• Long-term U.S. Treasury bonds outperformed all other asset classes, gaining roughly 14% as many investors sought these investments as potential "safe havens" amid increasing concerns about sluggish global economic growth.
• Investment-grade bonds and U.S. equities also performed well, as each category returned about 5% this period.
• Conversely, non-U.S. equities and short-term debt securities lagged other segments, as each returned about 1% for the six months.
• Based on their research frameworks, the portfolio managers believe that the glide path and strategic asset allocation of Fidelity Freedom®
Index Funds will drive the majority of returns over time, and that recent updates will offer additional diversification benefits for shareholders.
• On June 28, 2019, Fidelity expanded the Freedom Index Funds lineupto include Freedom Index 2065 Fund.
• In April 2019, GAA replaced underlying retail fund holdings (Fidelity Total Market Index Fund and Fidelity U.S. Bond Index Fund) with new Series funds with the same strategy, through an "in-kind" transaction.
FUND NAMES
Fidelity Freedom Index Income Fund Fidelity Freedom Index 2005 Fund Fidelity Freedom Index 2010 Fund Fidelity Freedom Index 2015 Fund Fidelity Freedom Index 2020 Fund Fidelity Freedom Index 2025 Fund Fidelity Freedom Index 2030 Fund Fidelity Freedom Index 2035 Fund Fidelity Freedom Index 2040 Fund Fidelity Freedom Index 2045 Fund Fidelity Freedom Index 2050 Fund Fidelity Freedom Index 2055 Fund Fidelity Freedom Index 2060 Fund
Not FDIC Insured • May Lose Value • No Bank Guarantee

PORTFOLIO MANAGER Q&A | AS OF SEPTEMBER 30, 2019
2 | For definitions, fund risks and other important information, please see the Definitions and Important Information section of this Q&A.
Market RecapThe global business cycle continued to mature during the six months ending September 30, 2019, with most major economiesin the late-cycle phase. The U.S. economy remained firmly in the late cycle, as capacity constraints emerged and economic activityappeared to peak. China's economy stabilized, but reacceleration from its growth recession remained elusive and weighed on the global economy. U.S.–China trade-policy uncertainty served as an ongoing drag on corporate confidence. Overall, a global industrial and trade recession showed few signsof abating, and it remained to be seen if policy easing would spark global economic reacceleration.
Looking at global assets, non-U.S. equities gained 1.24%, according to the MSCI ACWI (All Country World Index) ex USA Index. By region, resource-rich Canada (+6%) led the way, followed by continental Europe (+5%) and Japan (+4%). Conversely, emerging markets (-3%) and Asia-Pacific ex Japan (-0.48%) lagged the broader market. By sector, growth-oriented information technology (+7%) fared best, followed by consumer staples and utilities (+4% each), two higher-dividend-yielding groups. Conversely, real estate, energy and materials each returned about -4% this period.
The U.S. equity bellwether S&P 500® index advanced 6.08% the past six months. Nine of 11 sectors had a gain, with the exceptions of energy (-9%), which was hurt by falling commodityprices, and health care (-1%), which suffered from political rhetoric related to shifting health care policy ahead of the 2020 election. Higher-dividend-yielding sectors stood out, led by utilities (+13%), as well as real estate and consumer staples, eachof which gained about 10%. The small-cap-oriented Russell 2000® Index returned -0.36% for the period. Commodities lagged other assets, as reflected in the -3.00% result of the Bloomberg Barclays Commodity Index Total Return.
U.S. taxable investment-grade bonds advanced broadly this period, driven by slower global economic growth, uncertainty regarding trade policy and the direction of U.S. interest rates. The Bloomberg Barclays U.S. Aggregate Bond Index gained 5.42%. Corporate bonds advanced 7.38%, topping both government-related bonds (+5.44%) and U.S. Treasuries (+5.48%). Securitized bonds rose 4.10%, led by commercial mortgage-backed securities (+5.23%). Outside the index, high-yield bonds tended to lag investment-grade debt, while TreasuryInflation-Protected Securities (TIPS) gained 4.25%. ■
BROAD ASSET CLASS RETURNS (%) PERIOD ENDING SEPTEMBER 30, 2019
Calendar-Year Returns Average Annual Cumulative
2009 2010 2011 2012 2013 2014 2015 2016 2017 2018 5 Year 3 Year 1 Year 6 Mos 3 Mos
79.0 19.7 8.9 18.6 33.5 16.9 4.1 17.5 37.8 1.9 10.4 12.8 13.2 6.8 4.0
58.1 19.2 8.7 18.5 21.2 12.5 1.2 12.6 24.5 0.7 6.8 6.7 10.7 5.8 2.5
53.5 17.5 8.5 16.6 7.4 7.0 0.5 11.8 21.2 0.6 5.4 6.4 10.6 5.4 2.3
52.5 16.8 7.8 16.4 5.4 6.0 0.4 11.6 9.3 0.0 5.1 6.1 10.3 5.3 1.3
33.9 15.1 4.4 15.5 0.1 5.5 0.2 10.4 8.3 -0.3 4.4 5.7 6.3 5.1 1.2
28.6 12.0 1.5 12.7 -1.8 2.5 0.1 10.2 7.5 -2.3 4.3 4.6 5.7 3.8 1.1
28.2 10.4 1.1 9.8 -2.0 1.8 0.1 5.3 4.7 -4.1 3.4 4.4 3.0 3.2 0.9
18.9 9.1 0.1 5.0 -2.3 0.9 -0.5 4.9 4.3 -4.6 3.3 3.8 2.8 3.0 0.6
12.0 6.5 -12.1 4.2 -5.6 0.1 -2.9 4.0 3.5 -5.3 2.7 2.9 2.4 2.6 0.6
5.9 5.2 -13.3 0.1 -6.6 -1.8 -4.6 3.0 1.9 -11.2 2.0 1.9 -0.7 1.2 -0.9
0.2 0.2 -18.2 -1.1 -9.5 -4.2 -14.6 2.6 1.7 -13.9 1.0 1.6 -1.6 -3.0 -1.8
-- -- -- -- -- -17.0 -24.7 0.3 0.9 -14.2 -7.2 -1.5 -6.6 -3.4 -4.1
Best
Perfor
mance
Worst
Dispersionof Returns* 78.8 19.5 27.1 19.7 43.0 33.9 28.8 17.1 36.9 16.1 17.6 14.3 19.8 10.2 8.1
■ U.S. Equities
■ Non-U.S. Developed-Markets Equities
■ Emerging-Markets Equities
■ Commodities
■ High-Yield Debt
■ Floating-Rate Debt
■ International Debt
■ Emerging-Markets Debt
■ Real Estate Debt
■ Investment-Grade Debt
■ Inflation-Protected Debt
■ Short-Term Debt
Source: FMRCo., periods greater than one year are annualized*Difference between best- and worst-performing asset classes over the given time periodYou cannot invest directly in an index. Past performance is no guarantee of future results.U.S. Equities - Dow Jones U.S. Total Stock Market Index, Non-U.S. Developed-Markets Equities - MSCI World ex USA Net Mass, Emerging-Markets Equities - MSCI Emerging Markets Index, Commodities - Bloomberg Commodity Index Total Return, High-Yield Debt - ICE BofAML U.S. High Yield Constrained Index, Floating-Rate Debt - S&P/LSTA Leveraged Performing Loan Index, International Debt - Bloomberg Barclays Global Aggregate Credit Ex U.S. Index Hedged (USD), Emerging-Markets Debt - J.P. Morgan Emerging Markets Bond Index Global, Real Estate Debt - Fidelity Real Estate Income Composite Index, Investment-Grade Debt - Bloomberg Barclays U.S. Aggregate Bond Index, Inflation-Protected Debt - Bloomberg Barclays U.S. 1-10 Year Treasury Inflation-Protected Securities (TIPS) Index (Series-L), Short-Term Debt - Bloomberg Barclays U.S. 3 Month Treasury Bellwether Index

PORTFOLIO MANAGER Q&A | AS OF SEPTEMBER 30, 2019
3 | For definitions, fund risks and other important information, please see the Definitions and Important Information section of this Q&A.
Andrew DierdorfCo-Manager
Brett SumsionCo-Manager
Finola McGuire FoleyCo-Manager
Fund FactsFreedom Index Fund
Trading Symbol
Start DateSize (in millions)
Income FIKFX 10/02/2009 $465.92005 FJIFX 10/02/2009 $154.12010 FKIFX 10/02/2009 $628.02015 FLIFX 10/02/2009 $1,460.92020 FPIFX 10/02/2009 $5,056.62025 FQIFX 10/02/2009 $5,686.02030 FXIFX 10/02/2009 $6,809.22035 FIHFX 10/02/2009 $4,819.02040 FBIFX 10/02/2009 $4,844.62045 FIOFX 10/02/2009 $3,213.72050 FIPFX 10/02/2009 $2,866.92055 FDEWX 06/01/2011 $1,317.62060 FDKLX 08/05/2014 $434.4
Investment Approach• Fidelity Freedom® Index Funds (the Funds) are designed
so that the target date referenced in the Fund name is the approximate year when we expect investors to retire and begin gradually withdrawing their investment.
• Except for Fidelity Freedom® Index Income Fund, each of the Funds seeks high total return until reaching its respective target retirement date; thereafter, each Fund's objective will be to seek high current income and, as a secondary objective, capital appreciation.
• Except for Fidelity Freedom® Index Income Fund, each Fund's asset allocation strategy becomes increasingly conservative as it approaches its target date – and beyond. Ultimately, the Funds are expected to merge with Fidelity Freedom Index Income Fund.
• The Funds employ a robust investment process focused on helping investors solve the challenge of investing through retirement by leveraging the depth and strengthof Fidelity's investment research and resources.
Q&AAn interview with Co-Portfolio Managers Andrew Dierdorf, Brett Sumsion and Finola McGuire Foley
Q: Andrew, how did Fidelity Freedom® Index Funds perform for the six months ending September 30, 2019
A.D. The Investor Class shares of each Fund posted a gain. Returns ranged from 4.27% for Fidelity Freedom® Index Income Fund to roughly 4.8% for longer-dated Funds. Each Fund performed roughly in line with its respective Composite index. The Funds' returns were generally in line with or ahead of their respective peer group averages for thesix months.
Looking out a bit longer term, all the Funds performed roughly in line with their respective Composites for the 12 months ending September 30, 2019, and all outperformed their respective peer group averages. (For specific Fund results, please refer to the Fiscal Performance Summaries.)
Q: How would you characterize the Funds' overall performance the past six months
A.D. It was a good period. The Funds achieved a mid-single-digit return, driven by positive returns for all underlying asset classes.
The Funds' diversified exposure to multiple asset classes continued to provide a balance between portfolio risk and return, amid a dynamic market environment that featured performance disparity among various asset classes.
Q: Why is diversification so important to the objectives of the Funds
A.D. Our research indicates diversification is the best way to manage uncertainty in the capital markets over extended investment horizons.
Our approach to diversification incorporates assets we believe can provide independent sources of return and risk. Assets that deliver unique results in distinct market environments can help protect investors from unexpected and persistent changes in the global macroeconomic environment.
Our investment process for establishing the strategic asset allocation (i.e., glide path) emphasizes research into

PORTFOLIO MANAGER Q&A | AS OF SEPTEMBER 30, 2019
4 | For definitions, fund risks and other important information, please see the Definitions and Important Information section of this Q&A.
participant needs, portfolio diversification, and the long-termforces that affect capital markets.
We analyze factors that influence participant outcomes over the longer term, such as demographic trends, expectations for growth and inflation, and regulatory dynamics. Because these factors evolve gradually over time, we periodically adjust the glide path to reflect our latest research. [See the next section of this report for the latest updates on Fidelity's glide path.]
Q: Brett, what specific factors influenced the Funds' performance this period
B.S. Long-term U.S. Treasury bonds performed best, gaining 14.43% this period as measured by the Bloomberg Barclays Long-Term U.S. Treasury Bond Index.
The Funds' investment in Fidelity® Series Long-Term TreasuryBond Index Fund, which became part of the strategic allocation during the second half of 2018, roughly kept pace, advancing 14.37%.
Many investors sought exposure to Treasuries as potential "safe havens" amid increasing concerns about sluggish global economic growth, which pushed bond prices higher. We added strategic, long-term exposure to this asset class after our research indicated that long-duration bonds can provide some protection during times of market stress.
Similarly, the Bloomberg Barclays U.S. Aggregate Bond Index, a proxy for U.S. investment-grade bond performance, rose 5.42% for the period. The Funds' investment in Fidelity® Series Bond Index Fund added value, returning 5.45%.
Treasury Inflation-Protected Securities (TIPS) gained 3.15%, as measured by the Bloomberg Barclays 1-10 TIPS Index. TheFunds' investment in Fidelity® Series Inflation-Protected Bond Index Fund slightly outperformed, gaining 3.28% for the six months.
Q: Finola, what else influenced the Funds' performance
F.F. U.S. equities performed well this period. Investors generally favored the U.S. equity markets relative to foreign stocks. Data suggested the U.S. economy remained more firmly entrenched in expansion than other developed-marketeconomies around the world, despite indications that most were in a late-cycle phase of expansion.
The Dow Jones U.S. Total Stock Market Index, a well-rounded benchmark for U.S. equities, advanced 5.27% the past six months. The Funds' underlying investment in U.S.-based equity index funds performed roughly on par with this index.
By comparison, non-U.S. equities returned 1.24% for the six months, based on the MSCI All Country World ex USA Index.
The Funds' investment in Fidelity® Series Global ex U.S. Index Fund nearly kept pace with this index.
Q: Any final thoughts for shareholders as of September 30, Andrew
A.D. As a reminder, the Funds' strategic asset allocation emphasizes diversification and is expected to be the primary driver of long-term outcomes. Over the past six to 12 months, strategic asset allocation decisions have emphasizedgreater diversification, based on our views of lower long-term returns across major asset classes and increased capital markets uncertainty.
Our research frameworks inform the makeup of our glide path, and are oriented around historical returns and risks, as well as our forward-looking views. From time to time, these research perspectives, along with shifting market dynamics, prompt us to update or enhance our glide path, most recently in 2019.
Philosophically, we believe the glide path and strategic asset allocation will drive the majority of the long-term outcomes for the Freedom® Index Funds. ■
PORTFOLIO MANAGER Q&A | AS OF SEPTEMBER 30, 2019
5 | For definitions, fund risks and other important information, please see the Definitions and Important Information section of this Q&A.
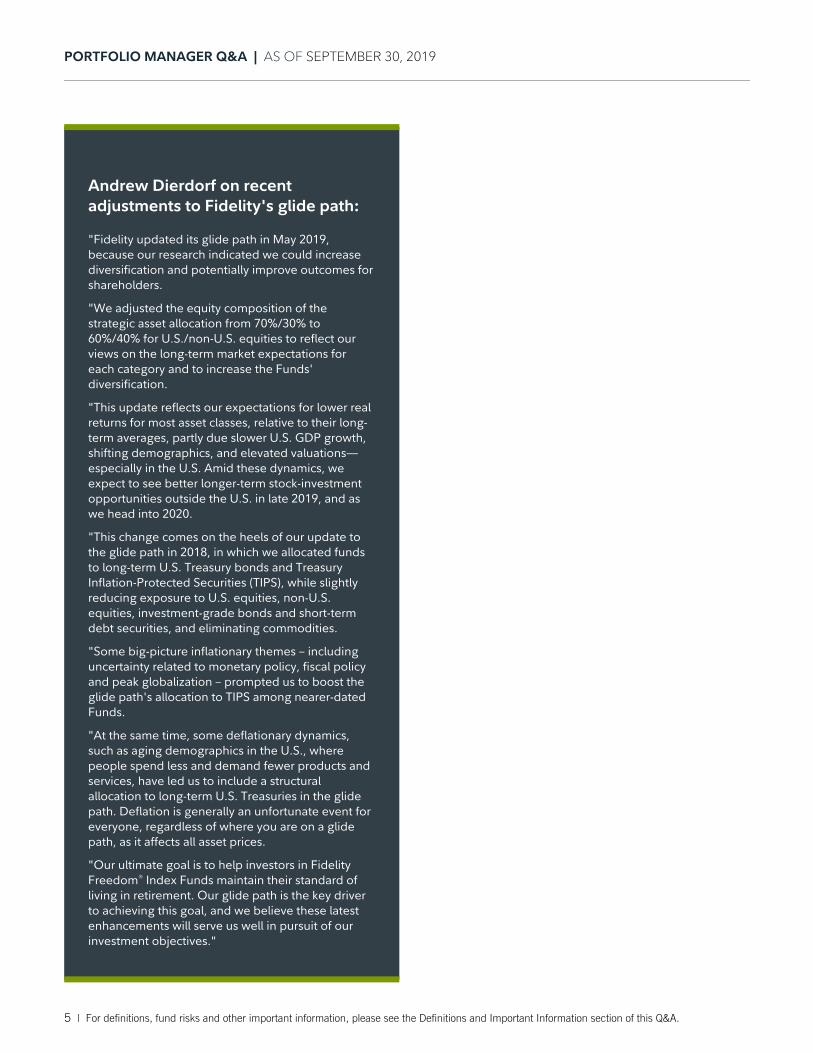
Andrew Dierdorf on recent adjustments to Fidelity's glide path:
"Fidelity updated its glide path in May 2019, because our research indicated we could increase diversification and potentially improve outcomes forshareholders.
"We adjusted the equity composition of the strategic asset allocation from 70%/30% to 60%/40% for U.S./non-U.S. equities to reflect our views on the long-term market expectations for each category and to increase the Funds' diversification.
"This update reflects our expectations for lower real returns for most asset classes, relative to their long-term averages, partly due slower U.S. GDP growth, shifting demographics, and elevated valuations—especially in the U.S. Amid these dynamics, we expect to see better longer-term stock-investment opportunities outside the U.S. in late 2019, and as we head into 2020.
"This change comes on the heels of our update to the glide path in 2018, in which we allocated funds to long-term U.S. Treasury bonds and Treasury Inflation-Protected Securities (TIPS), while slightly reducing exposure to U.S. equities, non-U.S. equities, investment-grade bonds and short-term debt securities, and eliminating commodities.
"Some big-picture inflationary themes – including uncertainty related to monetary policy, fiscal policy and peak globalization – prompted us to boost the glide path's allocation to TIPS among nearer-dated Funds.
"At the same time, some deflationary dynamics, such as aging demographics in the U.S., where people spend less and demand fewer products and services, have led us to include a structural allocation to long-term U.S. Treasuries in the glide path. Deflation is generally an unfortunate event for everyone, regardless of where you are on a glide path, as it affects all asset prices.
"Our ultimate goal is to help investors in Fidelity Freedom® Index Funds maintain their standard of living in retirement. Our glide path is the key driver to achieving this goal, and we believe these latest enhancements will serve us well in pursuit of our investment objectives."

PORTFOLIO MANAGER Q&A | AS OF SEPTEMBER 30, 2019
6 | For definitions, fund risks and other important information, please see the Definitions and Important Information section of this Q&A.
Fidelity Freedom Index Income Fund
ASSET ALLOCATION
Asset ClassPortfolio Weight
Portfolio Weight Six Months Ago
Domestic Equities 12.53% 13.32%
Equities 12.53% 13.32%
Series Total Market Index 12.53% --
International Equities 6.79% 5.69%
Series Global ex US Index 6.79% 5.69%
Bonds 55.12% 55.57%
Investment-Grade Debt 45.21% 45.62%
Series Bond Index Fund 45.21% --
Long-Term U.S. Treasuries 2.97% 3.08%
Ser LT Treasury Bd Idx 2.97% 3.08%
Inflation-Protected Debt 9.91% 9.94%
Ser Infl-Prot Bd Idx 9.91% 9.94%
Short-Term Debt & Net Other Assets 25.56% 25.42%
Ser Treasury Bill Index 22.46% 22.18%
NET OTHER ASSETS 0.13% 0.15%
Net Other Assets can include fund receivables, fund payables, and offsetsto other derivative positions, as well as certain assets that do not fall into any of the portfolio composition categories. Depending on the extent to which the fund invests in derivatives and the number of positions that are held for future settlement, Net Other Assets can be a negative number.
TARGET ASSET ALLOCATION ■ Current Year
100%
80%
60%
40%
20%
0% 50 45 40 35 30 25 20 15 10 5 0 5 10 15 20
YEARS TO RETIREMENT RETIREMENT YEARS 1
■ Domestic Equity Funds ■ International Equity Funds ■ Bond Funds
■ Short-Term Funds
The graphic above represents a revised Glide Path, the implementation of which is expected to be completed by mid-2020.
Source: FMRCo.Fidelity's Freedom Funds invest in a diversified mix of Fidelity domestic equity, international equity, bond, and short-term funds, many of which are managed exclusively for this purpose. As the chart above shows, Freedom Funds follow an asset allocation strategy that becomes increasingly more conservative as the target date approaches and passes. Freedom Funds are generally expected to reach their most conservative allocation 10-19 years after the target date. Future target allocations for the Freedom Fund featured above may differ from this approximate illustration.
FISCAL PERFORMANCE SUMMARY:Periods ending September 30, 2019
Cumulative Annualized
6Month YTD
1Year
3Year
5Year
10 Year/ LOF1
Fidelity Freedom Index Income Fund - Investor Class Gross Expense Ratio: 0.12%2 4.27% 8.75% 7.01% 4.50% 3.75% 4.01%
Bloomberg Barclays U.S. Aggregate Bond Index 5.42% 8.52% 10.30% 2.92% 3.38% 3.72%
Fidelity Freedom Index Income Composite Index 4.36% 8.85% 7.07% 4.67% 3.88% 4.30%
Morningstar Fund Target-Date Retirement 4.09% 10.11% 5.90% 4.78% 4.01% --
% Rank in Morningstar Category (1% = Best) -- -- 14% 65% 72% --
# of Funds in Morningstar Category -- -- 191 160 127 --1 Life of Fund (LOF) if performance is less than 10 years. Fund inception date: 10/02/2009.2 This expense ratio is from the prospectus in effect as of the date shown above and generally is based on amounts incurred during that fiscal year. It does not include any fee waivers or reimbursements, which would be reflected in the fund's net expense ratio.
Past performance is no guarantee of future results. Investment return and principal value of an investment will fluctuate; therefore, you may havea gain or loss when you sell your shares. Current performance may be higher or lower than the performance stated. To learn more or to obtain the most recent month-end or other share-class performance, visit institutional.fidelity.com or 401k.com. Total returns are historical and include change in share value and reinvestment of dividends and capital gains, if any. Cumulative total returns are reported as of the period indicated. Performance is that of the fund's Investor Class shares unless noted otherwise. Please see the last page(s) of this Q&A document for most-recent calendar-quarter performance.

PORTFOLIO MANAGER Q&A | AS OF SEPTEMBER 30, 2019
7 | For definitions, fund risks and other important information, please see the Definitions and Important Information section of this Q&A.
Fidelity Freedom Index 2005 Fund
ASSET ALLOCATION
Asset ClassPortfolio Weight
Portfolio Weight Six Months Ago
Domestic Equities 17.21% 18.93%
Equities 17.21% 18.93%
Series Total Market Index 17.21% --
International Equities 9.34% 8.09%
Series Global ex US Index 9.34% 8.09%
Bonds 51.31% 51.31%
Investment-Grade Debt 42.64% 42.75%
Series Bond Index Fund 42.64% --
Long-Term U.S. Treasuries 2.97% 3.09%
Ser LT Treasury Bd Idx 2.97% 3.09%
Inflation-Protected Debt 8.67% 8.56%
Ser Infl-Prot Bd Idx 8.67% 8.56%
Short-Term Debt & Net Other Assets 22.14% 21.67%
Ser Treasury Bill Index 19.06% 18.44%
NET OTHER ASSETS 0.11% 0.14%
Net Other Assets can include fund receivables, fund payables, and offsetsto other derivative positions, as well as certain assets that do not fall into any of the portfolio composition categories. Depending on the extent to which the fund invests in derivatives and the number of positions that are held for future settlement, Net Other Assets can be a negative number.
TARGET ASSET ALLOCATION ■ Current Year
100%
80%
60%
40%
20%
0% 50 45 40 35 30 25 20 15 10 5 0 5 10 15 20
YEARS TO RETIREMENT RETIREMENT YEARS 1
■ Domestic Equity Funds ■ International Equity Funds ■ Bond Funds
■ Short-Term Funds
The graphic above represents a revised Glide Path, the implementation of which is expected to be completed by mid-2020.
Source: FMRCo.Fidelity's Freedom Funds invest in a diversified mix of Fidelity domestic equity, international equity, bond, and short-term funds, many of which are managed exclusively for this purpose. As the chart above shows, Freedom Funds follow an asset allocation strategy that becomes increasingly more conservative as the target date approaches and passes. Freedom Funds are generally expected to reach their most conservative allocation 10-19 years after the target date. Future target allocations for the Freedom Fund featured above may differ from this approximate illustration.
FISCAL PERFORMANCE SUMMARY:Periods ending September 30, 2019
Cumulative Annualized
6Month YTD
1Year
3Year
5Year
10 Year/ LOF1
Fidelity Freedom Index 2005 Fund - Investor Class Gross Expense Ratio: 0.12%2 4.37% 9.83% 6.64% 5.41% 4.46% 5.42%
Bloomberg Barclays U.S. Aggregate Bond Index 5.42% 8.52% 10.30% 2.92% 3.38% 3.72%
Fidelity Freedom Index 2005 Composite Index 4.45% 9.91% 6.73% 5.59% 4.59% 5.86%
Morningstar Fund Target-Date 2000-2010 3.94% 10.27% 5.58% 5.38% 4.65% --
% Rank in Morningstar Category (1% = Best) -- -- 7% 55% 74% --
# of Funds in Morningstar Category -- -- 138 96 76 --1 Life of Fund (LOF) if performance is less than 10 years. Fund inception date: 10/02/2009.2 This expense ratio is from the prospectus in effect as of the date shown above and generally is based on amounts incurred during that fiscal year. It does not include any fee waivers or reimbursements, which would be reflected in the fund's net expense ratio.
Past performance is no guarantee of future results. Investment return and principal value of an investment will fluctuate; therefore, you may havea gain or loss when you sell your shares. Current performance may be higher or lower than the performance stated. To learn more or to obtain the most recent month-end or other share-class performance, visit institutional.fidelity.com or 401k.com. Total returns are historical and include change in share value and reinvestment of dividends and capital gains, if any. Cumulative total returns are reported as of the period indicated. Performance is that of the fund's Investor Class shares unless noted otherwise. Please see the last page(s) of this Q&A document for most-recent calendar-quarter performance.

PORTFOLIO MANAGER Q&A | AS OF SEPTEMBER 30, 2019
8 | For definitions, fund risks and other important information, please see the Definitions and Important Information section of this Q&A.
Fidelity Freedom Index 2010 Fund
ASSET ALLOCATION
Asset ClassPortfolio Weight
Portfolio Weight Six Months Ago
Domestic Equities 23.19% 25.35%
Equities 23.19% 25.35%
Series Total Market Index 23.19% --
International Equities 12.60% 10.81%
Series Global ex US Index 12.60% 10.81%
Bonds 46.26% 46.26%
Investment-Grade Debt 39.03% 39.13%
Series Bond Index Fund 39.03% --
Long-Term U.S. Treasuries 2.96% 3.09%
Ser LT Treasury Bd Idx 2.96% 3.09%
Inflation-Protected Debt 7.23% 7.13%
Ser Infl-Prot Bd Idx 7.23% 7.13%
Short-Term Debt & Net Other Assets 17.95% 17.58%
Ser Treasury Bill Index 14.89% 14.37%
NET OTHER ASSETS 0.10% 0.12%
Net Other Assets can include fund receivables, fund payables, and offsetsto other derivative positions, as well as certain assets that do not fall into any of the portfolio composition categories. Depending on the extent to which the fund invests in derivatives and the number of positions that are held for future settlement, Net Other Assets can be a negative number.
TARGET ASSET ALLOCATION ■ Current Year
100%
80%
60%
40%
20%
0% 50 45 40 35 30 25 20 15 10 5 0 5 10 15 20
YEARS TO RETIREMENT RETIREMENT YEARS 1
■ Domestic Equity Funds ■ International Equity Funds ■ Bond Funds
■ Short-Term Funds
The graphic above represents a revised Glide Path, the implementation of which is expected to be completed by mid-2020.
Source: FMRCo.Fidelity's Freedom Funds invest in a diversified mix of Fidelity domestic equity, international equity, bond, and short-term funds, many of which are managed exclusively for this purpose. As the chart above shows, Freedom Funds follow an asset allocation strategy that becomes increasingly more conservative as the target date approaches and passes. Freedom Funds are generally expected to reach their most conservative allocation 10-19 years after the target date. Future target allocations for the Freedom Fund featured above may differ from this approximate illustration.
FISCAL PERFORMANCE SUMMARY:Periods ending September 30, 2019
Cumulative Annualized
6Month YTD
1Year
3Year
5Year
10 Year/ LOF1
Fidelity Freedom Index 2010 Fund - Investor Class Gross Expense Ratio: 0.12%2 4.50% 11.00% 6.32% 6.19% 5.03% 6.32%
Bloomberg Barclays U.S. Aggregate Bond Index 5.42% 8.52% 10.30% 2.92% 3.38% 3.72%
Fidelity Freedom Index 2010 Composite Index 4.55% 11.07% 6.38% 6.37% 5.15% 6.90%
Morningstar Fund Target-Date 2000-2010 3.94% 10.27% 5.58% 5.38% 4.65% --
% Rank in Morningstar Category (1% = Best) -- -- 13% 5% 28% --
# of Funds in Morningstar Category -- -- 138 96 76 --1 Life of Fund (LOF) if performance is less than 10 years. Fund inception date: 10/02/2009.2 This expense ratio is from the prospectus in effect as of the date shown above and generally is based on amounts incurred during that fiscal year. It does not include any fee waivers or reimbursements, which would be reflected in the fund's net expense ratio.
Past performance is no guarantee of future results. Investment return and principal value of an investment will fluctuate; therefore, you may havea gain or loss when you sell your shares. Current performance may be higher or lower than the performance stated. To learn more or to obtain the most recent month-end or other share-class performance, visit institutional.fidelity.com or 401k.com. Total returns are historical and include change in share value and reinvestment of dividends and capital gains, if any. Cumulative total returns are reported as of the period indicated. Performance is that of the fund's Investor Class shares unless noted otherwise. Please see the last page(s) of this Q&A document for most-recent calendar-quarter performance.

PORTFOLIO MANAGER Q&A | AS OF SEPTEMBER 30, 2019
9 | For definitions, fund risks and other important information, please see the Definitions and Important Information section of this Q&A.
Fidelity Freedom Index 2015 Fund
ASSET ALLOCATION
Asset ClassPortfolio Weight
Portfolio Weight Six Months Ago
Domestic Equities 29.19% 31.78%
Equities 29.19% 31.78%
Series Total Market Index 29.19% --
International Equities 15.85% 13.55%
Series Global ex US Index 15.85% 13.55%
Bonds 41.20% 41.22%
Investment-Grade Debt 35.22% 35.34%
Series Bond Index Fund 35.22% --
Long-Term U.S. Treasuries 2.94% 3.09%
Ser LT Treasury Bd Idx 2.94% 3.09%
Inflation-Protected Debt 5.98% 5.88%
Ser Infl-Prot Bd Idx 5.98% 5.88%
Short-Term Debt & Net Other Assets 13.76% 13.45%
Ser Treasury Bill Index 10.73% 10.26%
NET OTHER ASSETS 0.09% 0.10%
Net Other Assets can include fund receivables, fund payables, and offsetsto other derivative positions, as well as certain assets that do not fall into any of the portfolio composition categories. Depending on the extent to which the fund invests in derivatives and the number of positions that are held for future settlement, Net Other Assets can be a negative number.
TARGET ASSET ALLOCATION ■ Current Year
100%
80%
60%
40%
20%
0% 50 45 40 35 30 25 20 15 10 5 0 5 10 15 20
YEARS TO RETIREMENT RETIREMENT YEARS 1
■ Domestic Equity Funds ■ International Equity Funds ■ Bond Funds
■ Short-Term Funds
The graphic above represents a revised Glide Path, the implementation of which is expected to be completed by mid-2020.
Source: FMRCo.Fidelity's Freedom Funds invest in a diversified mix of Fidelity domestic equity, international equity, bond, and short-term funds, many of which are managed exclusively for this purpose. As the chart above shows, Freedom Funds follow an asset allocation strategy that becomes increasingly more conservative as the target date approaches and passes. Freedom Funds are generally expected to reach their most conservative allocation 10-19 years after the target date. Future target allocations for the Freedom Fund featured above may differ from this approximate illustration.
FISCAL PERFORMANCE SUMMARY:Periods ending September 30, 2019
Cumulative Annualized
6Month YTD
1Year
3Year
5Year
10 Year/ LOF1
Fidelity Freedom Index 2015 Fund - Investor Class Gross Expense Ratio: 0.12%2 4.61% 12.20% 5.91% 6.97% 5.58% 6.76%
Bloomberg Barclays U.S. Aggregate Bond Index 5.42% 8.52% 10.30% 2.92% 3.38% 3.72%
Fidelity Freedom Index 2015 Composite Index 4.64% 12.23% 5.99% 7.15% 5.71% 7.35%
Morningstar Fund Target-Date 2015 4.08% 11.25% 5.36% 5.88% 4.91% --
% Rank in Morningstar Category (1% = Best) -- -- 33% 5% 14% --
# of Funds in Morningstar Category -- -- 129 95 68 --1 Life of Fund (LOF) if performance is less than 10 years. Fund inception date: 10/02/2009.2 This expense ratio is from the prospectus in effect as of the date shown above and generally is based on amounts incurred during that fiscal year. It does not include any fee waivers or reimbursements, which would be reflected in the fund's net expense ratio.
Past performance is no guarantee of future results. Investment return and principal value of an investment will fluctuate; therefore, you may havea gain or loss when you sell your shares. Current performance may be higher or lower than the performance stated. To learn more or to obtain the most recent month-end or other share-class performance, visit institutional.fidelity.com or 401k.com. Total returns are historical and include change in share value and reinvestment of dividends and capital gains, if any. Cumulative total returns are reported as of the period indicated. Performance is that of the fund's Investor Class shares unless noted otherwise. Please see the last page(s) of this Q&A document for most-recent calendar-quarter performance.

PORTFOLIO MANAGER Q&A | AS OF SEPTEMBER 30, 2019
10 | For definitions, fund risks and other important information, please see the Definitions and Important Information section of this Q&A.
Fidelity Freedom Index 2020 Fund
ASSET ALLOCATION
Asset ClassPortfolio Weight
Portfolio Weight Six Months Ago
Domestic Equities 34.37% 37.20%
Equities 34.37% 37.20%
Series Total Market Index 34.37% --
International Equities 18.69% 15.85%
Series Global ex US Index 18.69% 15.85%
Bonds 36.70% 36.90%
Investment-Grade Debt 31.89% 32.14%
Series Bond Index Fund 31.89% --
Long-Term U.S. Treasuries 2.92% 3.09%
Ser LT Treasury Bd Idx 2.92% 3.09%
Inflation-Protected Debt 4.81% 4.76%
Ser Infl-Prot Bd Idx 4.81% 4.76%
Short-Term Debt & Net Other Assets 10.24% 10.05%
Ser Treasury Bill Index 7.24% 6.88%
NET OTHER ASSETS 0.08% 0.09%
Net Other Assets can include fund receivables, fund payables, and offsetsto other derivative positions, as well as certain assets that do not fall into any of the portfolio composition categories. Depending on the extent to which the fund invests in derivatives and the number of positions that are held for future settlement, Net Other Assets can be a negative number.
TARGET ASSET ALLOCATION ■ Current Year
100%
80%
60%
40%
20%
0% 50 45 40 35 30 25 20 15 10 5 0 5 10 15 20
YEARS TO RETIREMENT RETIREMENT YEARS 1
■ Domestic Equity Funds ■ International Equity Funds ■ Bond Funds
■ Short-Term Funds
The graphic above represents a revised Glide Path, the implementation of which is expected to be completed by mid-2020.
Source: FMRCo.Fidelity's Freedom Funds invest in a diversified mix of Fidelity domestic equity, international equity, bond, and short-term funds, many of which are managed exclusively for this purpose. As the chart above shows, Freedom Funds follow an asset allocation strategy that becomes increasingly more conservative as the target date approaches and passes. Freedom Funds are generally expected to reach their most conservative allocation 10-19 years after the target date. Future target allocations for the Freedom Fund featured above may differ from this approximate illustration.
FISCAL PERFORMANCE SUMMARY:Periods ending September 30, 2019
Cumulative Annualized
6Month YTD
1Year
3Year
5Year
10 Year/ LOF1
Fidelity Freedom Index 2020 Fund - Investor Class Gross Expense Ratio: 0.12%2 4.69% 13.10% 5.58% 7.51% 5.96% 7.32%
S&P 500 Index 6.08% 20.55% 4.25% 13.39% 10.84% 13.59%
Fidelity Freedom Index 2020 Composite Index 4.70% 13.19% 5.66% 7.68% 6.08% 7.97%
Morningstar Fund Target-Date 2020 4.11% 11.83% 5.02% 6.20% 5.07% --
% Rank in Morningstar Category (1% = Best) -- -- 29% 6% 9% --
# of Funds in Morningstar Category -- -- 246 205 158 --1 Life of Fund (LOF) if performance is less than 10 years. Fund inception date: 10/02/2009.2 This expense ratio is from the prospectus in effect as of the date shown above and generally is based on amounts incurred during that fiscal year. It does not include any fee waivers or reimbursements, which would be reflected in the fund's net expense ratio.
Past performance is no guarantee of future results. Investment return and principal value of an investment will fluctuate; therefore, you may havea gain or loss when you sell your shares. Current performance may be higher or lower than the performance stated. To learn more or to obtain the most recent month-end or other share-class performance, visit institutional.fidelity.com or 401k.com. Total returns are historical and include change in share value and reinvestment of dividends and capital gains, if any. Cumulative total returns are reported as of the period indicated. Performance is that of the fund's Investor Class shares unless noted otherwise. Please see the last page(s) of this Q&A document for most-recent calendar-quarter performance.

PORTFOLIO MANAGER Q&A | AS OF SEPTEMBER 30, 2019
11 | For definitions, fund risks and other important information, please see the Definitions and Important Information section of this Q&A.
Fidelity Freedom Index 2025 Fund
ASSET ALLOCATION
Asset ClassPortfolio Weight
Portfolio Weight Six Months Ago
Domestic Equities 38.60% 41.78%
Equities 38.60% 41.78%
Series Total Market Index 38.60% --
International Equities 21.00% 17.80%
Series Global ex US Index 21.00% 17.80%
Bonds 33.39% 33.57%
Investment-Grade Debt 29.32% 29.56%
Series Bond Index Fund 29.32% --
Long-Term U.S. Treasuries 2.92% 3.09%
Ser LT Treasury Bd Idx 2.92% 3.09%
Inflation-Protected Debt 4.07% 4.02%
Ser Infl-Prot Bd Idx 4.07% 4.02%
Short-Term Debt & Net Other Assets 7.01% 6.85%
Ser Treasury Bill Index 4.01% 3.68%
NET OTHER ASSETS 0.08% 0.08%
Net Other Assets can include fund receivables, fund payables, and offsetsto other derivative positions, as well as certain assets that do not fall into any of the portfolio composition categories. Depending on the extent to which the fund invests in derivatives and the number of positions that are held for future settlement, Net Other Assets can be a negative number.
TARGET ASSET ALLOCATION ■ Current Year
100%
80%
60%
40%
20%
0% 50 45 40 35 30 25 20 15 10 5 0 5 10 15 20
YEARS TO RETIREMENT RETIREMENT YEARS 1
■ Domestic Equity Funds ■ International Equity Funds ■ Bond Funds
■ Short-Term Funds
The graphic above represents a revised Glide Path, the implementation of which is expected to be completed by mid-2020.
Source: FMRCo.Fidelity's Freedom Funds invest in a diversified mix of Fidelity domestic equity, international equity, bond, and short-term funds, many of which are managed exclusively for this purpose. As the chart above shows, Freedom Funds follow an asset allocation strategy that becomes increasingly more conservative as the target date approaches and passes. Freedom Funds are generally expected to reach their most conservative allocation 10-19 years after the target date. Future target allocations for the Freedom Fund featured above may differ from this approximate illustration.
FISCAL PERFORMANCE SUMMARY:Periods ending September 30, 2019
Cumulative Annualized
6Month YTD
1Year
3Year
5Year
10 Year/ LOF1
Fidelity Freedom Index 2025 Fund - Investor Class Gross Expense Ratio: 0.12%2 4.71% 13.93% 5.28% 8.01% 6.31% 8.02%
S&P 500 Index 6.08% 20.55% 4.25% 13.39% 10.84% 13.59%
Fidelity Freedom Index 2025 Composite Index 4.76% 14.02% 5.36% 8.17% 6.44% 8.78%
Morningstar Fund Target-Date 2025 4.15% 12.91% 4.54% 7.01% 5.57% --
% Rank in Morningstar Category (1% = Best) -- -- 25% 10% 14% --
# of Funds in Morningstar Category -- -- 232 191 147 --1 Life of Fund (LOF) if performance is less than 10 years. Fund inception date: 10/02/2009.2 This expense ratio is from the prospectus in effect as of the date shown above and generally is based on amounts incurred during that fiscal year. It does not include any fee waivers or reimbursements, which would be reflected in the fund's net expense ratio.
Past performance is no guarantee of future results. Investment return and principal value of an investment will fluctuate; therefore, you may havea gain or loss when you sell your shares. Current performance may be higher or lower than the performance stated. To learn more or to obtain the most recent month-end or other share-class performance, visit institutional.fidelity.com or 401k.com. Total returns are historical and include change in share value and reinvestment of dividends and capital gains, if any. Cumulative total returns are reported as of the period indicated. Performance is that of the fund's Investor Class shares unless noted otherwise. Please see the last page(s) of this Q&A document for most-recent calendar-quarter performance.

PORTFOLIO MANAGER Q&A | AS OF SEPTEMBER 30, 2019
12 | For definitions, fund risks and other important information, please see the Definitions and Important Information section of this Q&A.
Fidelity Freedom Index 2030 Fund
ASSET ALLOCATION
Asset ClassPortfolio Weight
Portfolio Weight Six Months Ago
Domestic Equities 45.26% 49.64%
Equities 45.26% 49.64%
Series Total Market Index 45.26% --
International Equities 24.62% 21.14%
Series Global ex US Index 24.62% 21.14%
Bonds 27.15% 26.07%
Investment-Grade Debt 25.20% 24.94%
Series Bond Index Fund 25.20% --
Long-Term U.S. Treasuries 2.93% 3.08%
Ser LT Treasury Bd Idx 2.93% 3.08%
Inflation-Protected Debt 1.95% 1.13%
Ser Infl-Prot Bd Idx 1.95% 1.13%
Short-Term Debt & Net Other Assets 2.97% 3.15%
NET OTHER ASSETS 0.04% 0.07%
Net Other Assets can include fund receivables, fund payables, and offsetsto other derivative positions, as well as certain assets that do not fall into any of the portfolio composition categories. Depending on the extent to which the fund invests in derivatives and the number of positions that are held for future settlement, Net Other Assets can be a negative number.
TARGET ASSET ALLOCATION ■ Current Year
100%
80%
60%
40%
20%
0% 50 45 40 35 30 25 20 15 10 5 0 5 10 15 20
YEARS TO RETIREMENT RETIREMENT YEARS 1
■ Domestic Equity Funds ■ International Equity Funds ■ Bond Funds
■ Short-Term Funds
The graphic above represents a revised Glide Path, the implementation of which is expected to be completed by mid-2020.
Source: FMRCo.Fidelity's Freedom Funds invest in a diversified mix of Fidelity domestic equity, international equity, bond, and short-term funds, many of which are managed exclusively for this purpose. As the chart above shows, Freedom Funds follow an asset allocation strategy that becomes increasingly more conservative as the target date approaches and passes. Freedom Funds are generally expected to reach their most conservative allocation 10-19 years after the target date. Future target allocations for the Freedom Fund featured above may differ from this approximate illustration.
FISCAL PERFORMANCE SUMMARY:Periods ending September 30, 2019
Cumulative Annualized
6Month YTD
1Year
3Year
5Year
10 Year/ LOF1
Fidelity Freedom Index 2030 Fund - Investor Class Gross Expense Ratio: 0.12%2 4.77% 15.28% 4.61% 9.16% 7.03% 8.61%
S&P 500 Index 6.08% 20.55% 4.25% 13.39% 10.84% 13.59%
Fidelity Freedom Index 2030 Composite Index 4.81% 15.39% 4.69% 9.34% 7.17% 9.41%
Morningstar Fund Target-Date 2030 4.03% 13.83% 3.85% 7.65% 6.00% --
% Rank in Morningstar Category (1% = Best) -- -- 25% 4% 5% --
# of Funds in Morningstar Category -- -- 241 201 154 --1 Life of Fund (LOF) if performance is less than 10 years. Fund inception date: 10/02/2009.2 This expense ratio is from the prospectus in effect as of the date shown above and generally is based on amounts incurred during that fiscal year. It does not include any fee waivers or reimbursements, which would be reflected in the fund's net expense ratio.
Past performance is no guarantee of future results. Investment return and principal value of an investment will fluctuate; therefore, you may havea gain or loss when you sell your shares. Current performance may be higher or lower than the performance stated. To learn more or to obtain the most recent month-end or other share-class performance, visit institutional.fidelity.com or 401k.com. Total returns are historical and include change in share value and reinvestment of dividends and capital gains, if any. Cumulative total returns are reported as of the period indicated. Performance is that of the fund's Investor Class shares unless noted otherwise. Please see the last page(s) of this Q&A document for most-recent calendar-quarter performance.

PORTFOLIO MANAGER Q&A | AS OF SEPTEMBER 30, 2019
13 | For definitions, fund risks and other important information, please see the Definitions and Important Information section of this Q&A.
Fidelity Freedom Index 2035 Fund
ASSET ALLOCATION
Asset ClassPortfolio Weight
Portfolio Weight Six Months Ago
Domestic Equities 54.43% 59.44%
Equities 54.43% 59.44%
Series Total Market Index 54.43% --
International Equities 29.58% 25.24%
Series Global ex US Index 29.58% 25.24%
Bonds 13.06% 12.19%
Investment-Grade Debt 13.06% 12.19%
Series Bond Index Fund 13.06% --
Long-Term U.S. Treasuries 2.90% 3.10%
Ser LT Treasury Bd Idx 2.90% 3.10%
Short-Term Debt & Net Other Assets 2.93% 3.13%
NET OTHER ASSETS 0.03% 0.03%
Net Other Assets can include fund receivables, fund payables, and offsetsto other derivative positions, as well as certain assets that do not fall into any of the portfolio composition categories. Depending on the extent to which the fund invests in derivatives and the number of positions that are held for future settlement, Net Other Assets can be a negative number.
TARGET ASSET ALLOCATION ■ Current Year
100%
80%
60%
40%
20%
0% 50 45 40 35 30 25 20 15 10 5 0 5 10 15 20
YEARS TO RETIREMENT RETIREMENT YEARS 1
■ Domestic Equity Funds ■ International Equity Funds ■ Bond Funds
■ Short-Term Funds
The graphic above represents a revised Glide Path, the implementation of which is expected to be completed by mid-2020.
Source: FMRCo.Fidelity's Freedom Funds invest in a diversified mix of Fidelity domestic equity, international equity, bond, and short-term funds, many of which are managed exclusively for this purpose. As the chart above shows, Freedom Funds follow an asset allocation strategy that becomes increasingly more conservative as the target date approaches and passes. Freedom Funds are generally expected to reach their most conservative allocation 10-19 years after the target date. Future target allocations for the Freedom Fund featured above may differ from this approximate illustration.
FISCAL PERFORMANCE SUMMARY:Periods ending September 30, 2019
Cumulative Annualized
6Month YTD
1Year
3Year
5Year
10 Year/ LOF1
Fidelity Freedom Index 2035 Fund - Investor Class Gross Expense Ratio: 0.12%2 4.53% 16.51% 3.39% 9.96% 7.51% 9.18%
S&P 500 Index 6.08% 20.55% 4.25% 13.39% 10.84% 13.59%
Fidelity Freedom Index 2035 Composite Index 4.60% 16.62% 3.46% 10.15% 7.65% 10.08%
Morningstar Fund Target-Date 2035 3.92% 14.68% 3.09% 8.32% 6.37% --
% Rank in Morningstar Category (1% = Best) -- -- 44% 3% 4% --
# of Funds in Morningstar Category -- -- 229 188 144 --1 Life of Fund (LOF) if performance is less than 10 years. Fund inception date: 10/02/2009.2 This expense ratio is from the prospectus in effect as of the date shown above and generally is based on amounts incurred during that fiscal year. It does not include any fee waivers or reimbursements, which would be reflected in the fund's net expense ratio.
Past performance is no guarantee of future results. Investment return and principal value of an investment will fluctuate; therefore, you may havea gain or loss when you sell your shares. Current performance may be higher or lower than the performance stated. To learn more or to obtain the most recent month-end or other share-class performance, visit institutional.fidelity.com or 401k.com. Total returns are historical and include change in share value and reinvestment of dividends and capital gains, if any. Cumulative total returns are reported as of the period indicated. Performance is that of the fund's Investor Class shares unless noted otherwise. Please see the last page(s) of this Q&A document for most-recent calendar-quarter performance.

PORTFOLIO MANAGER Q&A | AS OF SEPTEMBER 30, 2019
14 | For definitions, fund risks and other important information, please see the Definitions and Important Information section of this Q&A.
Fidelity Freedom Index 2040 Fund
ASSET ALLOCATION
Asset ClassPortfolio Weight
Portfolio Weight Six Months Ago
Domestic Equities 58.47% 63.07%
Equities 58.47% 63.07%
Series Total Market Index 58.47% --
International Equities 31.78% 26.78%
Series Global ex US Index 31.78% 26.78%
Bonds 6.85% 7.03%
Investment-Grade Debt 6.85% 7.03%
Series Bond Index Fund 6.85% --
Long-Term U.S. Treasuries 2.89% 3.10%
Ser LT Treasury Bd Idx 2.89% 3.10%
Short-Term Debt & Net Other Assets 2.90% 3.12%
NET OTHER ASSETS 0.01% 0.02%
Net Other Assets can include fund receivables, fund payables, and offsetsto other derivative positions, as well as certain assets that do not fall into any of the portfolio composition categories. Depending on the extent to which the fund invests in derivatives and the number of positions that are held for future settlement, Net Other Assets can be a negative number.
TARGET ASSET ALLOCATION ■ Current Year
100%
80%
60%
40%
20%
0% 50 45 40 35 30 25 20 15 10 5 0 5 10 15 20
YEARS TO RETIREMENT RETIREMENT YEARS 1
■ Domestic Equity Funds ■ International Equity Funds ■ Bond Funds
■ Short-Term Funds
The graphic above represents a revised Glide Path, the implementation of which is expected to be completed by mid-2020.
Source: FMRCo.Fidelity's Freedom Funds invest in a diversified mix of Fidelity domestic equity, international equity, bond, and short-term funds, many of which are managed exclusively for this purpose. As the chart above shows, Freedom Funds follow an asset allocation strategy that becomes increasingly more conservative as the target date approaches and passes. Freedom Funds are generally expected to reach their most conservative allocation 10-19 years after the target date. Future target allocations for the Freedom Fund featured above may differ from this approximate illustration.
FISCAL PERFORMANCE SUMMARY:Periods ending September 30, 2019
Cumulative Annualized
6Month YTD
1Year
3Year
5Year
10 Year/ LOF1
Fidelity Freedom Index 2040 Fund - Investor Class Gross Expense Ratio: 0.12%2 4.43% 16.85% 2.94% 9.96% 7.52% 9.24%
S&P 500 Index 6.08% 20.55% 4.25% 13.39% 10.84% 13.59%
Fidelity Freedom Index 2040 Composite Index 4.48% 17.00% 3.04% 10.16% 7.65% 10.15%
Morningstar Fund Target-Date 2040 3.72% 15.14% 2.50% 8.58% 6.56% --
% Rank in Morningstar Category (1% = Best) -- -- 36% 3% 7% --
# of Funds in Morningstar Category -- -- 241 201 154 --1 Life of Fund (LOF) if performance is less than 10 years. Fund inception date: 10/02/2009.2 This expense ratio is from the prospectus in effect as of the date shown above and generally is based on amounts incurred during that fiscal year. It does not include any fee waivers or reimbursements, which would be reflected in the fund's net expense ratio.
Past performance is no guarantee of future results. Investment return and principal value of an investment will fluctuate; therefore, you may havea gain or loss when you sell your shares. Current performance may be higher or lower than the performance stated. To learn more or to obtain the most recent month-end or other share-class performance, visit institutional.fidelity.com or 401k.com. Total returns are historical and include change in share value and reinvestment of dividends and capital gains, if any. Cumulative total returns are reported as of the period indicated. Performance is that of the fund's Investor Class shares unless noted otherwise. Please see the last page(s) of this Q&A document for most-recent calendar-quarter performance.

PORTFOLIO MANAGER Q&A | AS OF SEPTEMBER 30, 2019
15 | For definitions, fund risks and other important information, please see the Definitions and Important Information section of this Q&A.
Fidelity Freedom Index 2045 Fund
ASSET ALLOCATION
Asset ClassPortfolio Weight
Portfolio Weight Six Months Ago
Domestic Equities 58.42% 63.07%
Equities 58.42% 63.07%
Series Total Market Index 58.42% --
International Equities 31.80% 26.78%
Series Global ex US Index 31.80% 26.78%
Bonds 6.87% 7.03%
Investment-Grade Debt 6.87% 7.03%
Series Bond Index Fund 6.87% --
Long-Term U.S. Treasuries 2.90% 3.10%
Ser LT Treasury Bd Idx 2.90% 3.10%
Short-Term Debt & Net Other Assets 2.91% 3.12%
NET OTHER ASSETS 0.01% 0.02%
Net Other Assets can include fund receivables, fund payables, and offsetsto other derivative positions, as well as certain assets that do not fall into any of the portfolio composition categories. Depending on the extent to which the fund invests in derivatives and the number of positions that are held for future settlement, Net Other Assets can be a negative number.
TARGET ASSET ALLOCATION ■ Current Year
100%
80%
60%
40%
20%
0% 50 45 40 35 30 25 20 15 10 5 0 5 10 15 20
YEARS TO RETIREMENT RETIREMENT YEARS 1
■ Domestic Equity Funds ■ International Equity Funds ■ Bond Funds
■ Short-Term Funds
The graphic above represents a revised Glide Path, the implementation of which is expected to be completed by mid-2020.
Source: FMRCo.Fidelity's Freedom Funds invest in a diversified mix of Fidelity domestic equity, international equity, bond, and short-term funds, many of which are managed exclusively for this purpose. As the chart above shows, Freedom Funds follow an asset allocation strategy that becomes increasingly more conservative as the target date approaches and passes. Freedom Funds are generally expected to reach their most conservative allocation 10-19 years after the target date. Future target allocations for the Freedom Fund featured above may differ from this approximate illustration.
FISCAL PERFORMANCE SUMMARY:Periods ending September 30, 2019
Cumulative Annualized
6Month YTD
1Year
3Year
5Year
10 Year/ LOF1
Fidelity Freedom Index 2045 Fund - Investor Class Gross Expense Ratio: 0.12%2 4.40% 16.86% 2.97% 9.97% 7.52% 9.31%
S&P 500 Index 6.08% 20.55% 4.25% 13.39% 10.84% 13.59%
Fidelity Freedom Index 2045 Composite Index 4.48% 17.00% 3.04% 10.16% 7.65% 10.22%
Morningstar Fund Target-Date 2045 3.69% 15.65% 2.10% 8.91% 6.72% --
% Rank in Morningstar Category (1% = Best) -- -- 26% 8% 10% --
# of Funds in Morningstar Category -- -- 229 188 144 --1 Life of Fund (LOF) if performance is less than 10 years. Fund inception date: 10/02/2009.2 This expense ratio is from the prospectus in effect as of the date shown above and generally is based on amounts incurred during that fiscal year. It does not include any fee waivers or reimbursements, which would be reflected in the fund's net expense ratio.
Past performance is no guarantee of future results. Investment return and principal value of an investment will fluctuate; therefore, you may havea gain or loss when you sell your shares. Current performance may be higher or lower than the performance stated. To learn more or to obtain the most recent month-end or other share-class performance, visit institutional.fidelity.com or 401k.com. Total returns are historical and include change in share value and reinvestment of dividends and capital gains, if any. Cumulative total returns are reported as of the period indicated. Performance is that of the fund's Investor Class shares unless noted otherwise. Please see the last page(s) of this Q&A document for most-recent calendar-quarter performance.

PORTFOLIO MANAGER Q&A | AS OF SEPTEMBER 30, 2019
16 | For definitions, fund risks and other important information, please see the Definitions and Important Information section of this Q&A.
Fidelity Freedom Index 2050 Fund
ASSET ALLOCATION
Asset ClassPortfolio Weight
Portfolio Weight Six Months Ago
Domestic Equities 58.42% 63.07%
Equities 58.42% 63.07%
Series Total Market Index 58.42% --
International Equities 31.80% 26.78%
Series Global ex US Index 31.80% 26.78%
Bonds 6.87% 7.03%
Investment-Grade Debt 6.87% 7.03%
Series Bond Index Fund 6.87% --
Long-Term U.S. Treasuries 2.90% 3.10%
Ser LT Treasury Bd Idx 2.90% 3.10%
Short-Term Debt & Net Other Assets 2.91% 3.12%
NET OTHER ASSETS 0.01% 0.02%
Net Other Assets can include fund receivables, fund payables, and offsetsto other derivative positions, as well as certain assets that do not fall into any of the portfolio composition categories. Depending on the extent to which the fund invests in derivatives and the number of positions that are held for future settlement, Net Other Assets can be a negative number.
TARGET ASSET ALLOCATION ■ Current Year
100%
80%
60%
40%
20%
0% 50 45 40 35 30 25 20 15 10 5 0 5 10 15 20
YEARS TO RETIREMENT RETIREMENT YEARS 1
■ Domestic Equity Funds ■ International Equity Funds ■ Bond Funds
■ Short-Term Funds
The graphic above represents a revised Glide Path, the implementation of which is expected to be completed by mid-2020.
Source: FMRCo.Fidelity's Freedom Funds invest in a diversified mix of Fidelity domestic equity, international equity, bond, and short-term funds, many of which are managed exclusively for this purpose. As the chart above shows, Freedom Funds follow an asset allocation strategy that becomes increasingly more conservative as the target date approaches and passes. Freedom Funds are generally expected to reach their most conservative allocation 10-19 years after the target date. Future target allocations for the Freedom Fund featured above may differ from this approximate illustration.
FISCAL PERFORMANCE SUMMARY:Periods ending September 30, 2019
Cumulative Annualized
6Month YTD
1Year
3Year
5Year
10 Year/ LOF1
Fidelity Freedom Index 2050 Fund - Investor Class Gross Expense Ratio: 0.12%2 4.43% 16.89% 2.92% 9.96% 7.52% 9.36%
S&P 500 Index 6.08% 20.55% 4.25% 13.39% 10.84% 13.59%
Fidelity Freedom Index 2050 Composite Index 4.48% 17.00% 3.04% 10.16% 7.65% 10.29%
Morningstar Fund Target-Date 2050 3.63% 15.74% 1.99% 8.88% 6.76% --
% Rank in Morningstar Category (1% = Best) -- -- 24% 8% 14% --
# of Funds in Morningstar Category -- -- 241 201 154 --1 Life of Fund (LOF) if performance is less than 10 years. Fund inception date: 10/02/2009.2 This expense ratio is from the prospectus in effect as of the date shown above and generally is based on amounts incurred during that fiscal year. It does not include any fee waivers or reimbursements, which would be reflected in the fund's net expense ratio.
Past performance is no guarantee of future results. Investment return and principal value of an investment will fluctuate; therefore, you may havea gain or loss when you sell your shares. Current performance may be higher or lower than the performance stated. To learn more or to obtain the most recent month-end or other share-class performance, visit institutional.fidelity.com or 401k.com. Total returns are historical and include change in share value and reinvestment of dividends and capital gains, if any. Cumulative total returns are reported as of the period indicated. Performance is that of the fund's Investor Class shares unless noted otherwise. Please see the last page(s) of this Q&A document for most-recent calendar-quarter performance.

PORTFOLIO MANAGER Q&A | AS OF SEPTEMBER 30, 2019
17 | For definitions, fund risks and other important information, please see the Definitions and Important Information section of this Q&A.
Fidelity Freedom Index 2055 Fund
ASSET ALLOCATION
Asset ClassPortfolio Weight
Portfolio Weight Six Months Ago
Domestic Equities 58.42% 63.07%
Equities 58.42% 63.07%
Series Total Market Index 58.42% --
International Equities 31.80% 26.78%
Series Global ex US Index 31.80% 26.78%
Bonds 6.87% 7.03%
Investment-Grade Debt 6.87% 7.03%
Series Bond Index Fund 6.87% --
Long-Term U.S. Treasuries 2.90% 3.10%
Ser LT Treasury Bd Idx 2.90% 3.10%
Short-Term Debt & Net Other Assets 2.91% 3.12%
NET OTHER ASSETS 0.01% 0.02%
Net Other Assets can include fund receivables, fund payables, and offsetsto other derivative positions, as well as certain assets that do not fall into any of the portfolio composition categories. Depending on the extent to which the fund invests in derivatives and the number of positions that are held for future settlement, Net Other Assets can be a negative number.
TARGET ASSET ALLOCATION ■ Current Year
100%
80%
60%
40%
20%
0% 50 45 40 35 30 25 20 15 10 5 0 5 10 15 20
YEARS TO RETIREMENT RETIREMENT YEARS 1
■ Domestic Equity Funds ■ International Equity Funds ■ Bond Funds
■ Short-Term Funds
The graphic above represents a revised Glide Path, the implementation of which is expected to be completed by mid-2020.
Source: FMRCo.Fidelity's Freedom Funds invest in a diversified mix of Fidelity domestic equity, international equity, bond, and short-term funds, many of which are managed exclusively for this purpose. As the chart above shows, Freedom Funds follow an asset allocation strategy that becomes increasingly more conservative as the target date approaches and passes. Freedom Funds are generally expected to reach their most conservative allocation 10-19 years after the target date. Future target allocations for the Freedom Fund featured above may differ from this approximate illustration.
FISCAL PERFORMANCE SUMMARY:Periods ending September 30, 2019
Cumulative Annualized
6Month YTD
1Year
3Year
5Year
10 Year/ LOF1
Fidelity Freedom Index 2055 Fund - Investor Class Gross Expense Ratio: 0.12%2 4.40% 16.82% 2.93% 9.95% 7.51% 7.97%
S&P 500 Index 6.08% 20.55% 4.25% 13.39% 10.84% 12.64%
Fidelity Freedom Index 2055 Composite Index 4.48% 17.00% 3.04% 10.16% 7.65% 9.11%
Morningstar Fund Target-Date 2055 3.63% 15.86% 1.84% 9.04% 6.84% --
% Rank in Morningstar Category (1% = Best) -- -- 22% 10% 16% --
# of Funds in Morningstar Category -- -- 229 186 138 --1 Life of Fund (LOF) if performance is less than 10 years. Fund inception date: 06/01/2011.2 This expense ratio is from the prospectus in effect as of the date shown above and generally is based on amounts incurred during that fiscal year. It does not include any fee waivers or reimbursements, which would be reflected in the fund's net expense ratio.
Past performance is no guarantee of future results. Investment return and principal value of an investment will fluctuate; therefore, you may havea gain or loss when you sell your shares. Current performance may be higher or lower than the performance stated. To learn more or to obtain the most recent month-end or other share-class performance, visit institutional.fidelity.com or 401k.com. Total returns are historical and include change in share value and reinvestment of dividends and capital gains, if any. Cumulative total returns are reported as of the period indicated. Performance is that of the fund's Investor Class shares unless noted otherwise. Please see the last page(s) of this Q&A document for most-recent calendar-quarter performance.

PORTFOLIO MANAGER Q&A | AS OF SEPTEMBER 30, 2019
18 | For definitions, fund risks and other important information, please see the Definitions and Important Information section of this Q&A.
Fidelity Freedom Index 2060 Fund
ASSET ALLOCATION
Asset ClassPortfolio Weight
Portfolio Weight Six Months Ago
Domestic Equities 58.42% 63.07%
Equities 58.42% 63.07%
Series Total Market Index 58.42% --
International Equities 31.80% 26.78%
Series Global ex US Index 31.80% 26.78%
Bonds 6.87% 7.03%
Investment-Grade Debt 6.87% 7.03%
Series Bond Index Fund 6.87% --
Long-Term U.S. Treasuries 2.89% 3.10%
Ser LT Treasury Bd Idx 2.89% 3.10%
Short-Term Debt & Net Other Assets 2.91% 3.12%
NET OTHER ASSETS 0.02% 0.02%
Net Other Assets can include fund receivables, fund payables, and offsetsto other derivative positions, as well as certain assets that do not fall into any of the portfolio composition categories. Depending on the extent to which the fund invests in derivatives and the number of positions that are held for future settlement, Net Other Assets can be a negative number.
TARGET ASSET ALLOCATION ■ Current Year
100%
80%
60%
40%
20%
0% 50 45 40 35 30 25 20 15 10 5 0 5 10 15 20
YEARS TO RETIREMENT RETIREMENT YEARS 1
■ Domestic Equity Funds ■ International Equity Funds ■ Bond Funds
■ Short-Term Funds
The graphic above represents a revised Glide Path, the implementation of which is expected to be completed by mid-2020.
Source: FMRCo.Fidelity's Freedom Funds invest in a diversified mix of Fidelity domestic equity, international equity, bond, and short-term funds, many of which are managed exclusively for this purpose. As the chart above shows, Freedom Funds follow an asset allocation strategy that becomes increasingly more conservative as the target date approaches and passes. Freedom Funds are generally expected to reach their most conservative allocation 10-19 years after the target date. Future target allocations for the Freedom Fund featured above may differ from this approximate illustration.
FISCAL PERFORMANCE SUMMARY:Periods ending September 30, 2019
Cumulative Annualized
6Month YTD
1Year
3Year
5Year
10 Year/ LOF1
Fidelity Freedom Index 2060 Fund - Investor Class Gross Expense Ratio: 0.12%2 4.39% 16.84% 2.94% 9.96% 7.51% 7.38%
S&P 500 Index 6.08% 20.55% 4.25% 13.39% 10.84% 11.15%
Fidelity Freedom Index 2060 Composite Index 4.48% 17.00% 3.04% 10.16% 7.65% 7.53%
Morningstar Fund Target-Date 2060+ 3.70% 16.07% 1.87% 9.20% 7.20% --
% Rank in Morningstar Category (1% = Best) -- -- 19% 13% 33% --
# of Funds in Morningstar Category -- -- 216 133 30 --1 Life of Fund (LOF) if performance is less than 10 years. Fund inception date: 08/05/2014.2 This expense ratio is from the prospectus in effect as of the date shown above and generally is based on amounts incurred during that fiscal year. It does not include any fee waivers or reimbursements, which would be reflected in the fund's net expense ratio.
Past performance is no guarantee of future results. Investment return and principal value of an investment will fluctuate; therefore, you may havea gain or loss when you sell your shares. Current performance may be higher or lower than the performance stated. To learn more or to obtain the most recent month-end or other share-class performance, visit institutional.fidelity.com or 401k.com. Total returns are historical and include change in share value and reinvestment of dividends and capital gains, if any. Cumulative total returns are reported as of the period indicated. Performance is that of the fund's Investor Class shares unless noted otherwise. Please see the last page(s) of this Q&A document for most-recent calendar-quarter performance.

PORTFOLIO MANAGER Q&A | AS OF SEPTEMBER 30, 2019
19 |
Definitions and Important InformationInformation provided in this document is for informational and educational purposes only. To the extent any investment information in this material is deemed to be a recommendation, it is not meant to be impartial investment advice or advice in a fiduciary capacity and is not intended to be used as a primary basis for you or your client's investment decisions. Fidelity, and its representatives may have a conflict of interest in the products or services mentioned in this material because they have a financial interest in, and receive compensation, directly or indirectly, in connection with the management, distribution and/or servicing of these products or services including Fidelity funds, certain third-party funds and products, and certain investment services.
BROAD ASSET CLASS RETURNS A graphical representation of historical market performance and the variations in returns among asset classes, as represented by thefollowing indexes:
Bloomberg Barclays Global Aggregate Credit Ex US Index Hedged (USD) is a market value weighted index that measures theperformance, hedged in USD, of the global non-US dollar denominated investment-grade corporate fixed-rate debt issues with maturities of one year or more.
Bloomberg Barclays U.S. 1-10 Year Treasury Inflation-Protected Securities (TIPS) Index (Series-L) is a market value-weighted indexthat measures the performance of inflation-protected securities issued by the U.S. Treasury that have a remaining average life between 1 and 10 years.
Bloomberg Barclays U.S. 3 Month Treasury Bellwether Index is a market value-weighted index of investment-grade fixed-rate publicobligations of the U.S. Treasury with maturities of 3 months, excluding zero coupon strips.
Bloomberg Barclays U.S. Aggregate Bond Index is a broad-based, market-value-weighted benchmark that measures the performance of the investment grade, U.S. dollardenominated, fixed-rate taxable bond market. Sectors in the index include Treasuries, government-related and corporate securities, MBS (agency fixed-rate and hybrid ARM pass-throughs), ABS, and CMBS.
ICE BofAML U.S. High Yield Constrained Index is a modified market capitalization–weighted index of US dollar denominated below investment grade corporate debt publicly issued in the US domestic market. Qualifying securities must have a below investment grade rating (based on an average of Moody's, S&P and Fitch). The country of risk of qualifying issuers must be an FX-G10 member, a Western European nation, or a territory of the US or a Western European nation. The FX-G10 includes all Euro members, the US, Japan, the UK, Canada, Australia, New Zealand, Switzerland, Norway and Sweden. In addition, qualifying securities must have at least one year remaining to final maturity, a fixed coupon schedule and at least $100 million in outstanding face value. Defaulted securities are excluded. The index contains all securities of ICE BofAML U.S. High Yield Index but caps issuer exposure at 2%.
Bloomberg Commodity Index Total Return measures the performance of the commodities market. It consists of exchange-traded futures contracts on physical commodities that are weighted to account for the economic significance and market
liquidity of each commodity.
Dow Jones U.S. Total Stock Market Index is a float-adjusted market capitalization–weighted index of all equity securities of U.S.headquartered companies with readily available price data.
Fidelity Real Estate Income Composite Index is a customized blend of unmanaged indexes, weighted as follows: The BofA Merrill Lynch US Real Estate Index - 40%; MSCI REIT Preferred Index - 40%; and FTSE NAREIT All REITs Index - 20%.
J.P. Morgan Emerging Markets Bond Index Global tracks total returns for the U.S. dollar-denominated debt instruments issued byEmerging Market sovereign and quasi-sovereign entities, such as Brady bonds, loans, and Eurobonds.
MSCI World ex USA Index is a market capitalization weighted index that is designed to measure the investable equity market performance for global investors of developed markets outside theUnited States.
MSCI Emerging Markets Index is a market capitalization-weightedindex that is designed to measure the investable equity market performance for global investors in emerging markets.
S&P/LSTA Leveraged Performing Loan Index is a market value-weighted index designed to represent the performance of U.S. dollar-denominated institutional leveraged performing loan portfolios (excluding loans in payment default) using current market weightings, spreads and interest payments.
FUND RISKSThe fund is subject to risks resulting from the asset allocation decisions of the Investment Adviser. The fund is subject to the volatility of the financial markets, including that of equity and fixed income investments. Fixed income investments entail issuer default and credit risk, inflation risk, and interest rate risk (as interest rates rise, bond prices usually fall and vice versa). This effect is usually more pronounced for longer-term securities. Leverage can increase market exposure, magnify investment risks, and cause losses to be realized more quickly. No target date fund is considered a completeretirement program and there is no guarantee any single fund will provide sufficient retirement income at or through retirement. Principal invested is not guaranteed at any time, including at or after the funds' target dates.
IMPORTANT FUND INFORMATIONRelative positioning data presented in this commentary is based on the fund's primary benchmark (index) unless a secondary benchmarkis provided to assess performance.
INDICESIt is not possible to invest directly in an index. All indices representedare unmanaged. All indices include reinvestment of dividends and interest income unless otherwise noted.
Bloomberg Barclays U.S. Aggregate Bond Index is a broad-based, market-value-weighted benchmark that measures the performance of the investment grade, U.S. dollar-denominated, fixed-rate taxable bond market. Sectors in the index include Treasuries, government-related and corporate securities, MBS (agency fixed-rate and hybrid ARM pass-throughs), ABS, and CMBS.

PORTFOLIO MANAGER Q&A | AS OF SEPTEMBER 30, 2019
20 |
Fidelity Freedom Index Income Composite Index is a customized blend of the following unmanaged indices: Bloomberg Barclays U.S. Aggregate Bond Index, Bloomberg Barclays U.S. Long Treasury Index, Bloomberg Barclays U.S. 3-6 Month Treasury Bill Index, Bloomberg Barclays U.S. 1-10 Year Treasury Inflation Protected Securities (TIPS) Index (Series-L), MSCI All Country World ex U.S. Index (Net Massachusetts tax), and Dow Jones U.S. Total Stock Market Index. The index weightings are adjusted monthly to reflect the fund's changing asset allocations. The composition differed in periods prior to July 2, 2018.
Fidelity Freedom Index 2005 Composite Index is a customized blend of the following unmanaged indices: Bloomberg Barclays U.S. Aggregate Bond Index, Bloomberg Barclays U.S. Long Treasury Index, Bloomberg Barclays U.S. 3-6 Month Treasury Bill Index, Bloomberg Barclays U.S. 1-10 Year Treasury Inflation Protected Securities (TIPS) Index (Series-L), MSCI All Country World ex U.S. Index (Net Massachusetts tax), and Dow Jones U.S. Total Stock Market Index. The index weightings are adjusted monthly to reflect the fund's changing asset allocations. The composition differed in periods prior to July 2, 2018.
Fidelity Freedom Index 2010 Composite Index is a customized blend of the following unmanaged indices: Bloomberg Barclays U.S. Aggregate Bond Index, Bloomberg Barclays U.S. Long Treasury Index, Bloomberg Barclays U.S. 3-6 Month Treasury Bill Index, Bloomberg Barclays U.S. 1-10 Year Treasury Inflation Protected Securities (TIPS) Index (Series-L), MSCI All Country World ex U.S. Index (Net Massachusetts tax), and Dow Jones U.S. Total Stock Market Index. The index weightings are adjusted monthly to reflect the fund's changing asset allocations. The composition differed in periods prior to July 2, 2018.
Fidelity Freedom Index 2015 Composite Index is a customized blend of the following unmanaged indices: Bloomberg Barclays U.S. Aggregate Bond Index, Bloomberg Barclays U.S. Long Treasury Index, Bloomberg Barclays U.S. 3-6 Month Treasury Bill Index, Bloomberg Barclays U.S. 1-10 Year Treasury Inflation Protected Securities (TIPS) Index (Series-L), MSCI All Country World ex U.S. Index (Net Massachusetts tax), and Dow Jones U.S. Total Stock Market Index. The index weightings are adjusted monthly to reflect the fund's changing asset allocations. The composition differed in periods prior to July 2, 2018.
Fidelity Freedom Index 2020 Composite Index is a customized blend of the following unmanaged indices: Bloomberg Barclays U.S. Aggregate Bond Index, Bloomberg Barclays U.S. Long Treasury Index, Bloomberg Barclays U.S. 3-6 Month Treasury Bill Index, Bloomberg Barclays U.S. 1-10 Year Treasury Inflation Protected Securities (TIPS) Index (Series-L), MSCI All Country World ex U.S. Index (Net Massachusetts tax), and Dow Jones U.S. Total Stock Market Index. The index weightings are adjusted monthly to reflect the fund's changing asset allocations. The composition differed in periods prior to July 2, 2018.
Fidelity Freedom Index 2025 Composite Index is a customized blend of the following unmanaged indices: Bloomberg Barclays U.S. Aggregate Bond Index, Bloomberg Barclays U.S. Long Treasury Index, Bloomberg Barclays U.S. 3-6 Month Treasury Bill Index, Bloomberg Barclays U.S. 1-10 Year Treasury Inflation Protected Securities (TIPS) Index (Series-L), MSCI All Country World ex U.S. Index (Net Massachusetts tax), and Dow Jones U.S. Total Stock Market Index. The index weightings are adjusted monthly to reflect the fund's changing asset allocations. The composition differed in periods prior to July 2, 2018.
Fidelity Freedom Index 2030 Composite Index is a customized blend of the following unmanaged indices: Bloomberg Barclays U.S. Aggregate Bond Index, Bloomberg Barclays U.S. Long Treasury Index, Bloomberg Barclays U.S. 1-10 Year Treasury Inflation Protected Securities (TIPS) Index (Series-L), MSCI All Country World ex U.S. Index (Net Massachusetts tax), and Dow Jones U.S. Total Stock Market Index. The index weightings are adjusted monthly to reflect the fund's changing asset allocations. The composition differed in periods prior to July 2, 2018.
Fidelity Freedom Index 2035 Composite Index is a customized blend of the following unmanaged indices: Bloomberg Barclays U.S. Aggregate Bond Index, Bloomberg Barclays U.S. Long Treasury Index, Bloomberg Barclays U.S. 1-10 Year Treasury Inflation Protected Securities (TIPS) Index (Series-L), MSCI All Country World ex U.S. Index (Net Massachusetts tax), and Dow Jones U.S. Total Stock Market Index. The index weightings are adjusted monthly to reflect the fund's changing asset allocations. The composition differed in periods prior to July 2, 2018.
Fidelity Freedom Index 2040 Composite Index is a customized blend of the following unmanaged indices: Bloomberg Barclays U.S. Aggregate Bond Index, Bloomberg Barclays U.S. Long Treasury Index, MSCI All Country World ex U.S. Index (Net Massachusetts tax), and Dow Jones U.S. Total Stock Market Index. The index weightings are adjusted monthly to reflect the fund's changing asset allocations. The composition differed in periods prior to July 2, 2018.
Fidelity Freedom Index 2045 Composite Index is a customized blend of the following unmanaged indices: Bloomberg Barclays U.S. Aggregate Bond Index, Bloomberg Barclays U.S. Long Treasury Index, MSCI All Country World ex U.S. Index (Net Massachusetts tax), and Dow Jones U.S. Total Stock Market Index. The index weightings are adjusted monthly to reflect the fund's changing asset allocations. The composition differed in periods prior to July 2, 2018.
Fidelity Freedom Index 2050 Composite Index is a customized blend of the following unmanaged indices: Bloomberg Barclays U.S. Aggregate Bond Index, Bloomberg Barclays U.S. Long Treasury Index, MSCI All Country World ex U.S. Index (Net Massachusetts tax), and Dow Jones U.S. Total Stock Market Index. The index weightings are adjusted monthly to reflect the fund's changing asset allocations. The composition differed in periods prior to July 2, 2018.
S&P 500 is a market-capitalization-weighted index of 500 common stocks chosen for market size, liquidity, and industry group representation to represent U.S. equity performance.
Fidelity Freedom Index 2055 Composite Index is a customized blend of the following unmanaged indices: Bloomberg Barclays U.S. Aggregate Bond Index, Bloomberg Barclays U.S. Long Treasury Index, MSCI All Country World ex U.S. Index (Net Massachusetts tax), and Dow Jones U.S. Total Stock Market Index. The index weightings are adjusted monthly to reflect the fund's changing asset allocations. The composition differed in periods prior to July 2, 2018.
Fidelity Freedom Index 2060 Composite Index is a customized blend of the following unmanaged indices: Bloomberg Barclays U.S. Aggregate Bond Index, Bloomberg Barclays U.S. Long Treasury Index, MSCI All Country World ex U.S. Index (Net Massachusetts tax), and Dow Jones U.S. Total Stock Market Index. The index weightings are adjusted monthly to reflect the fund's changing asset allocations. The composition differed in periods prior to July 2, 2018.
MSCI ACWI (All Country World Index) ex USA Index is a market-capitalization-weighted index designed to measure the investable

PORTFOLIO MANAGER Q&A | AS OF SEPTEMBER 30, 2019
21 |
equity market performance for global investors of large and mid-cap stocks in developed and emerging markets, excluding the United States.
Bloomberg Barclays Global Aggregate Bond Index is a market value weighted index that measures the performance of the investment-grade U.S. dollar-denominated, fixed-rate taxable bond market.
Bloomberg Barclays U.S. Long-Term Treasury Bond index is an unmanaged index that includes all publicly issued U.S. Treasury securities that have a remaining maturity of 10 or more years, are rated investment grade, and have $250 million or more of outstanding face value.
Bloomberg Barclays 1-10 U.S. Treasury Inflation-Protection Securities (TIPS) Index consists of inflation-protection securities issued by the U.S. Treasury. They must have one to 10 years until final maturity and at least $250 million par amount outstanding. Theyare rated investment grade.
Bloomberg Barclays U.S. 3-6 Month Treasury Bill Index is a market value-weighted index of public obligations of the U.S. Treasury with maturities of three to six months.
RANKING INFORMATION© 2019 Morningstar, Inc. All rights reserved. The Morningstar information contained herein: (1) is proprietary to Morningstar and/or its content providers; (2) may not be copied or redistributed; and (3) is not warranted to be accurate, complete or timely. Neither Morningstar nor its content providers are responsible for any damages or losses arising from any use of this information. Fidelity does not review the Morningstar data and, for mutual fund performance, you should check the fund's current prospectus for the most up-to-date information concerning applicable loads, fees and expenses.
% Rank in Morningstar Category is the fund's total-return percentile rank relative to all funds that have the same MorningstarCategory. The highest (or most favorable) percentile rank is 1 and the lowest (or least favorable) percentile rank is 100. The top-performing fund in a category will always receive a rank of 1%. % Rank in Morningstar Category is based on total returns which include reinvested dividends and capital gains, if any, and exclude sales charges. Multiple share classes of a fund have a common portfolio but impose different expense structures.

PORTFOLIO MANAGER Q&A | AS OF SEPTEMBER 30, 2019
22 | For definitions, fund risks and other important information, please see the Definitions and Important Information section of this Q&A.
Manager Facts
Andrew Dierdorf is a portfolio manager in the Global Asset Allocation (GAA) group at Fidelity Investments. Fidelity Investments is a leading provider of investment management, retirement planning, portfolio guidance, brokerage, benefits outsourcing, and other financial products and services to institutions, financial intermediaries, and individuals.
In this role, Mr. Dierdorf co-manages Fidelity's target date strategies, including Fidelity-managed 529 plans and Canadian target date funds. Additionally, he co-manages Fidelity Four-in-One Index Fund.
Prior to assuming his current responsibilities, Mr. Dierdorf co-managed Fidelity Global Strategies Fund and Fidelity Tactical Strategies Fund.
Before joining Fidelity in 2004, Mr. Dierdorf worked as an actuary at several insurance companies. He has been working in the financial services industry since 1993.
Mr. Dierdorf earned his bachelor of science degree in statistics, with a minor in economics, from the University of Delaware. He is also a CFA® charterholder, a Fellow of the Society of Actuaries(FSA), a Chartered Market Technician (CMT), and a Member of the American Academy of Actuaries (MAAA).
Brett Sumsion is a portfolio manager in the Global Asset Allocation (GAA) group at Fidelity Investments. Fidelity Investments is a leading provider of investment management, retirement planning, portfolio guidance, brokerage, benefits outsourcing, and other financial products and services to institutions, financial intermediaries, and individuals.
In this role, Mr. Sumsion co-manages Fidelity's target date strategies, including Fidelity-managed 529 plans and Canadian target date plans.
Prior to joining Fidelity in 2014, Mr. Sumsion held various positions at DuPont Capital Management, Inc., including managing director of asset allocation and portfolio manager. While at DuPont, Mr. Sumsion managed strategic and tactical asset allocation strategies for institutional clients. He has been inthe financial industry since 2001.
Mr. Sumsion earned his bachelor of arts degree in economics from Brigham Young University and his master of business administration degree in finance from The Wharton School of the University of Pennsylvania. He is also a CFA® charterholder.
Finola McGuire Foley is a portfolio manager in the Global Asset Allocation (GAA) group at Fidelity Investments. Fidelity Investments is a leading provider of investment management, retirement planning, portfolio guidance, brokerage, benefits
outsourcing, and other financial products and services to institutions, financial intermediaries, and individuals.
In this role, Ms. Foley co-manages Fidelity's Freedom Index funds and FIAM Index Target Date portfolios. Additionally, she co-manages the Fidelity Four-in-One Index Fund.
Prior to assuming her current responsibilities, Ms. Foley held various roles within Fidelity, including assistant portfolio manager, portfolio analyst and senior business analyst at Strategic Advisers LLC. Previously, Ms. Foley was a systems analyst at Fidelity Investments Management Technology and at Fidelity Personal and Workplace Investing. She has been in the financial industry since joining Fidelity in 2005.
Ms. Foley earned her bachelor of science degree in business information systems from University College Cork and her master of business administration degree in finance from Bentley University. She is also a CFA® charterholder.

PERFORMANCE SUMMARY:Quarter ending December 31, 2019
Annualized1
Year3
Year5
Year10 Year/
LOF1
InceptionDate
Fidelity Freedom Index Income Fund - Investor Class Gross Expense Ratio: 0.12%2 10.59% 5.39% 3.89% 3.97% 10/02/2009
Fidelity Freedom Index 2005 Fund - Investor Class Gross Expense Ratio: 0.12%2 12.32% 6.38% 4.67% 5.22% 10/02/2009
Fidelity Freedom Index 2010 Fund - Investor Class Gross Expense Ratio: 0.12%2 14.36% 7.31% 5.35% 6.15% 10/02/2009
Fidelity Freedom Index 2015 Fund - Investor Class Gross Expense Ratio: 0.12%2 16.48% 8.27% 6.04% 6.64% 10/02/2009
Fidelity Freedom Index 2020 Fund - Investor Class Gross Expense Ratio: 0.12%2 18.16% 8.97% 6.53% 7.17% 10/02/2009
Fidelity Freedom Index 2025 Fund - Investor Class Gross Expense Ratio: 0.12%2 19.69% 9.58% 6.97% 7.87% 10/02/2009
Fidelity Freedom Index 2030 Fund - Investor Class Gross Expense Ratio: 0.12%2 22.14% 10.85% 7.86% 8.49% 10/02/2009
Fidelity Freedom Index 2035 Fund - Investor Class Gross Expense Ratio: 0.12%2 24.95% 11.92% 8.60% 9.14% 10/02/2009
Fidelity Freedom Index 2040 Fund - Investor Class Gross Expense Ratio: 0.12%2 26.06% 12.15% 8.73% 9.26% 10/02/2009
Fidelity Freedom Index 2045 Fund - Investor Class Gross Expense Ratio: 0.12%2 26.05% 12.15% 8.72% 9.31% 10/02/2009
Fidelity Freedom Index 2050 Fund - Investor Class Gross Expense Ratio: 0.12%2 26.11% 12.13% 8.73% 9.32% 10/02/2009
Fidelity Freedom Index 2055 Fund - Investor Class Gross Expense Ratio: 0.12%2 26.01% 12.13% 8.71% 8.68% 06/01/2011
Fidelity Freedom Index 2060 Fund - Investor Class Gross Expense Ratio: 0.12%2 26.10% 12.16% 8.72% 8.55% 08/05/2014
1 Life of Fund (LOF) if performance is less than 10 years.2 This expense ratio is from the prospectus in effect as of the date shown above and generally is based on amounts incurred during that fiscal year. It does not include any fee waivers or reimbursements, which would be reflected in the fund's net expense ratio.Past performance is no guarantee of future results. Investment return and principal value of an investment will fluctuate; therefore, you may have again or loss when you sell your shares. Current performance may be higher or lower than the performance stated. To learn more or to obtain the most recent month-end or other share-class performance, visit institutional.fidelity.com or 401k.com. Total returns are historical and include change in share value and reinvestment of dividends and capital gains, if any. Cumulative total returns are reported as of the period indicated. Performance is that of the fund's Investor Class shares unless noted otherwise.
Before investing in any mutual fund, please carefully consider the investment objectives, risks, charges, and expenses. For this and other information, call or write Fidelity for a free prospectus or, if available, a summary prospectus. Read it carefully before you invest. Past performance is no guarantee of future results.
Views expressed are through the end of the period stated and do not necessarily represent the views of Fidelity. Views are subject to change at any time based upon market or other conditions and Fidelity disclaims anyresponsibility to update such views. These views may not be relied on as investment advice and, because investment decisions for a Fidelity fund are based on numerous factors, may not be relied on as an indication of trading intent on behalf of any Fidelity fund. The securities mentioned are not necessarily holdings invested in by the portfolio manager(s) or FMR LLC. References to specific company securities should not be construed as recommendations or investment advice.
Diversification does not ensure a profit or guarantee against a loss.Information included on this page is as of the most recent calendar quarter.
S&P 500 is a registered service mark of Standard & Poor's Financial Services LLC.Other third-party marks appearing herein are the property of their respective owners. All other marks appearing herein are registered or unregistered trademarks or service marks of FMR LLC or an affiliated company. Fidelity Brokerage Services LLC, Member NYSE, SIPC., 900 Salem Street, Smithfield, RI 02917. Fidelity Distributors Company LLC, 500 Salem Street, Smithfield, RI 02917.© 2020 FMR LLC. All rights reserved. Not NCUA or NCUSIF insured. May lose value. No credit union guarantee.
702564.13.0