Embed Size (px)
Citation preview

FIELD EVALUATION OF DROP-CHECK STRUCTURESFOR FARM IRRIGATION SYSTEMS
March 1971 ARS 41-180Agricultural Research Service
UNITED STATES DEPARTMENT OF AGRICULTURE

CONTENTS
Page
Introduction 1
Previous work 1
Testing procedure 2
Experimental data and observations 4
Costs 4
Structural strength and durability 4
Structure stability 5
Piping 5
Overtopping 6
Structure movement 7
Streamflow 7
Velocity measurements 8
Hydraulic performance 9
Stilling basins 9
Crest 12
Scour and erosion 13
Discussion 17
Conclusions 19
Literature cited 19
Appendix 21
ii

FIELD EVALUATION OF DROP-CHECK STRUCTURESFOR FARM IRRIGATION SYSTEMS 1
by
A. S. Humpherys and A. R. Robinson 2
Soil and Water Conservation Research Division
INTRODUCTION
The slope of irrigated lands varies greatly, re-quiring gradient control and energy-dissipatingstructures in most irrigation systems. Water-levelcontrol structures are also required for goodwater management on irrigated farms. Combina-tion check and drop structures are often usedwhere both types of control are needed in thesame ditch. The headwall extension length andcutoff wall depth requirements for these struc-tures vary for different soils and site conditions.Most commercial structures of a given hydrauliccapacity have fixed dimensions and do not pro-vide sufficient headwall length or cutoff walldepth for many field conditions. They also havestilling basins that are generally too narrow ortoo short or both. Washed-out structures anderoded ditches are a problem on many farms.
A common standard design for a stable struc-ture at a given site is a formed, cast-in-place, con-crete structure. However, because of economyand convenience of installation, prefabricatedstructures are frequently used. Additional design
and site limitation information is needed to re-duce failures of prefabricated structures. Struc-tures are needed that provide adequate erosionand water control, economy, ease of installation,and ready acceptance by the farmer.
This study was made to obtain information toimprove the design of drop and check structuresfor farm irrigation systems, and for use by theUSDA Soil Conservation Service and otheragencies in evaluating small structures. Thestudy involved the evaluation and comparison ofthe field performance of various conventionaland standard structures as they are commonlyused. Several experimental structures were alsoincluded. The hydraulic and structural character-istics, together with installation and main-tenance requirements, were observed. Theamount of scour occurring upstream and down-stream from each structure, together with bankerosion and undercutting, were observedthrough four seasons of operation.
PREVIOUS WORK
There are many designs of drop structures,and dissipation of the energy below the drop isaccomplished in various ways. Some structures
consist only of a bulkhead or cutoff wall with ascour hole below the notch. The scour hole maybe filled with gravel or lined with small riprap to
'Contribution from Soil and Water Conservation Research Division, Agricultural Research Service, USDA, and the Idaho Agri-cultural Experiment Station, cooperating.
2 Agricultural Engineer, Snake River Conservation Research Center, Kimberly, Idaho; Research Agricultural Engineer and Directorof the Research Center until January 1969 when he became Director, USDA Sedimentation Laboratory, Oxford, Miss.
1

form a stilling basin. Other structures have anapron with and without cutoff walls and endsills below the drop. One commercial structurehas a cofferdam drop preceding a chute orapron. The various methods of energy dissipa-tion used by the structures generally determinetheir relative effectiveness in reducing the exitvelocity and erosion hazard.
There has been little systematic study of theerosion-control and hydraulic characteristics ofsmall drop-check structures for irrigation watercontrol. Various designs have been developedfrom experience or from construction and pre-fabrication requirements rather than from re-search. Several publications give limited informa-tion on the design of small structures (2, 4, 5P.Organizations such as the Soil ConservationService have developed design manuals and
charts based primarily on experience. Generally,the structures proposed are more than adequatefor erosion control, since a factor of safety hasbeen included in the design. However, due inpart to the over-design, they are very expensiveto construct.
Numerous studies have been made on largedrop structures, spillways, and stilling basins.Some of the results from these studies apply tothe smaller structures (3, 6). However, studiesinvolving structures for flows in the range of Ito 3 cubic feet per second (c.f.s.) apparently donot exist.
This report covers the initial phase of thestudy, which was-conducted in the field. Labora-tory studies are planned for improvement andmodification of the structures.
TESTING PROCEDURE
To evaluate cast-in-place and commerciallyavailable structures, a study site was obtainednear Jerome, Idaho. A ditch approximately3 feet across the top and 1 1/2 feet deepwas constructed with a V-ditcher. The ditch wasabout 1,000 feet long and had a drop of about16 feet. The size and shape of the ditch as orig-inally constructed did not conform well to someof the structures. The ditch was reshaped andwidened by hand after the second season. Soilswere classed as lawns and sandy loans, with aslight hardpan at various depths over part of thearea. This hardpan may have restricted thescouring potential over part of the area. Becauseof livestock damage, the test area was fencedafter the first season.
Thirty-one structures, representing 16 designs,were installed in the ditch with a drop of ap-proximatgly 0.5 feet between each structure.Water-measuring flumes equipped with stage re-corders were used to measure and record theflow. Additional flow entered the ditch at itsmidpoint, requiring a second flume at this loca-tion. Continuous flows at varying rates existedduring each of the four seasons of observation.
3 Italicized numbers in parentheses refer to Literature Cited onpage 19.
The maximum flow was in the range of 3 to 4c.f.s., with an average flow between 1 to 2 c.f.s.recorded for much of each period. Since theditch conveyed irrigation water, it was in opera-tion from May to November each year and wasdry for the balance of the year.
A description of the structures used in thisstudy follows:
Structure Structure descriptionNo.
1
Concrete, precast headwall with riprap-lined stillingbasin.
2, 3
Concrete, cast-in-place, rectangular basin withoutend sill, standard design.
4, 5 Concrete, cast-in-place, rectangular basin with endsill, standard design.
46, 17 Concrete, precast with end sill.
4 7, 18 Concrete, precast, without end sill.
8, 9, 10 Concrete, precast, with upstream cofferdam anddownstream liner section, smallsize.
11, 12 Concrete, precast headwall with fiber glass stillingbasin.
4 13ecause of nearby rock outcroppings, structures 17 and 18were removed from service after the first year and, therefore,were not included in the evaluation.
2

StructureNo.
13, 14
15, 16
19, 20
21, 22
23
24
25, 26
27, 28, 29
30
31
Structure description
Concrete, precast headwall with steel-lined stillingbasin.
Concrete, precast headwall with riprap-lined stillingbasin.
Concrete, cast-in-place, trapezoidal basin, standarddesign.
Concrete-block, rectangular basin, standard design.
Commercial, modular steel design.
Commercial, modular aluminum, special design.
Concrete-block headwall with cast-in-place trape-zoidal basin, standard design.
Concrete, precast, with upstream cofferdam anddownstream sidewalls, large size.
Commercial, modular aluminum, local design.
Wooden, standard design.
Photographs of each design of structure areshown in Appendix figures 9 to 26. Those struc-tures called "standard design" were standardSoil Conservation Service structures with thedesigns and dimensions as specified in the SCSEngineering Handbook. The precast concretestructures were all commercially available andwere widely used in the area. The commercialmetal structures were also commonly used andwere available in a range of sizes. Most of thestructures were installed in duplicate, with theremainder installed in triplicate.
Since structure cost is important, the expensewas recorded. For the prefabricated structures,the cost included the structure and the expenseof installation. For those constructed in place,the cost included part of the cost of forms andall labor and materials required to complete thestructure.
Because the structures were combinationcheck and drop structures, they were operatedas such. During the first year of operation, 1966,they were operated only as drop structures. Withthe insertion of check boards, structures in thelower one-half section of the ditch were op-erated as check structures during the second sea-son. During the third season, the structures wereoperated alternately, 1 week as drop structures
and 1 week as check structures. During thefourth season, the check boards were removedand the structures were used as drops through-out the entire season.
During the 4-year test period, observationsand measurements were made both visually andphysically. A complete photographic record wasmade periodically. Elevations were checked oneach structure to determine movement and sta-bility. Measurements were made at the beginningand end of the study to determine weighted-creep ratios and the change in creep ratioscaused by erosion around the structures. Obser-vations were also made of the durability of thestructures, since they were exposed to a widerange of weather conditions. The effect of freez-ing and thawing on the concrete and on the con-crete block structures was of particular interest.
The ditch-bottom profile was measured atperiodic intervals. Cross-section measurementswere made both upstream and downstream fromthe structures. The downstream cross-sectionmeasurements were made at 6, 18, and 30 inchesin order to determine bed degradation and bankwidening. These measurements were made in de-tail at the end of each operating season to deter-mine relative changes.
Velocities were measured at different dis-charges, using a small propeller current meter todetermine the relative effectiveness of eachstructure. Point measurements using the 0.6depth method were made 1 foot upstream andat the end of the stilling basin. Additional meas-urements were made at 1-foot increments down-stream from the end of the stilling basin. Themeasurements were used as a reference in deter-mining which structures reduced velocities to asafe level and which structures promoted highexit velocities.
The structures were rated for economy and,performance, based on measurements of cost;stability and durability; creep ratios; flow veloc-ities; downstream bed degradation, bank widen-ing and sloughing; and general operation. Theseratings can be used as a measure for determiningthe adequacy and desirability of using the dif-ferent types of drop and check irrigation struc-tures.
3

EXPERIMENTAL DATA AND OBSERVATIONS
COSTS
One of the most important variables in thestudy was structure cost. Installed costs of theindividual structures ranged from $13.81 to$75.00 (based on 1966 prices) and are shown intable 1. The most expensive structures, in gen-eral, were those that required forming and con-struction in place. Both labor and material costsof these were high. Labor costs included handexcavation and backfilling, placing and strippingof forms, pouring concrete, assembly and fabri-cation of the metal modular and wooden struc-tures, and installation. Those having the highestmaterial costs were the metal and concrete-blockstructures. Machine costs were incurred in exca-vating for the cast-in-place structures and forhandling the concrete precast structures, whichwere too heavy to place manually. The precastconcrete structures cost less because they re-quired less material and less labor to install; alsomanufacturing costs were less for quantity pro-duction. The labor cost of installation washigher for most of the structures than it wouldbe in normal practice because rocks were some-
times encountered during excavation and thefield crew was inexperienced. This was particu-larly true with the cast-in-place structures be-cause these were the first installations of thistype made by the workers and they had notdeveloped the techniques used by experiencedpersonnel.
STRUCTURAL STRENGTH AND
DURABILITY
Performance of the structural material wassatisfactory for most structures. The followingweather damage and deterioration was observedduring the test period:
Structure 5: Vertical crack in wingwall.Structure 7: Longitudinal cracking in the
corners of the basin at the base of the sidewalls.Structures 8, 9, and 10: Cracking and spalling
on the top of the center section.Structures 11 and 12: Separation of the fiber
glass basins from the concrete headwalls.Structure 21: Block cracking, some joint sepa-
ration and longitudinal block cracking near thebase of the concrete-block sidewalls.
TABLE 1.-Itemized cost of individual drop-check structures tested (based on 1966 prices)
StructureNo.
Structure description Materials
Cost per structureCostrank
MachineLabor(man-hours)
Labor cost@ $2.50/
hour
Totalcost
Concrete headwall with gravel basin $ 736 $1.25 $ 5.00 $13.81 162,3 Concrete, cast-in-place without sill 2 18.51 4.40 13.25 33.12 56.03 74,5 Concrete, cast-in-place with sill. 18.51 4.40 13.25 33.12 56.03 66,17 Concrete, precast with sill 12.00 1.25 2 5.00 18.25 157,18 Concrete, precast without sill 19.73 1.25 2 5.00 25.98 128,9,10 Concrete, precast with cofferdam basin 11.00 3.67 9.18 20.18 1411,12 Concrete headwall with fiber glass basin 22.00 1.25 2 5.00 28.25 1113,14 Concrete headwall with metal basin 23.90 1.25 2 5.00 30.15 1015,1619,20
Concrete headwall with gravel basin Concrete, cast-in-place trapezoidal basin
7.562 18.511.254.40
212.25
5.0030.62
13.8153.5 3
168
21, 22' Concrete-block 31.01 4.40 14.5 36.25 7L66 2232425,26
Commercial steel, modular Commercial aluminum, modular Concrete-block headwall, trapezoidal basin
47.7262.50
2 23.30 2.20
5
14
12.503 12.50
35.00
60.2275.0060.50
413
27,28,29 Concrete, precast with cofferdam basin 12.85 3.5 8.75 21.60 1330 Commercial aluminum, modular 41.15 3 8.23 493 8 931 Wooden 22.40 14 35.00 57.40 5
Based on a scale of 1 (highest cost) to 16 (lowest cost).2 Includes prorated form cost of $2.50 per structure each time form was used.3 installation cost was 20 percent of the material cost.
4

Structure 22: Block cracking, some jointseparation and longitudinal block cracking nearthe base of the concrete-block sidewalls, trans-verse cracking of the basin floor at each end,separation of the basin floor from the sidewalls,and end-sill break.
Structure 25: Longitudinal cracking of thebasin and headwall, caused by settling of thebackfill material beneath the sidewalls.
Structure 26: Transverse cracking of the basinfloor where it joins the headwall, and separationof the basin from the block headwall.
Structures 27, 28, and 29: Concrete spallingon the downstream face of the cofferdam.
Structure 31: Checking of the wood.Prefabricated structures 6 and 17 were rein-
forced with steel. The concrete headwalls usedin structures 1 and in II to 16 were made withan unusually thin steam-cured section, also rein-forced with steel. This resulted in a headwallthat was relatively lightweight and yet appearedsatisfactory for the strength requirement. Theonly other structures using steel reinforcing werethe concrete-block strictures. Although no ma-terial deterioration was observed on the metal
and fiber glass structures, they were less rigidthan the concrete structures and, therefore,subject to greater distortion from unequal set-tling and compaction of the backfill.
STRUCTURE STABILITY
Piping
A weighted-creep distance is often used toevaluate the stability of a structure and its resist-ance to piping. Lane's weighted-creep distance isdefined as the sum of all the vertical distancesplus one-third of the horizontal distances alongthe shortest seepage path at the interface be-tween the structure and the soil from headwaterto tailwater. This value was determined for eachstructure and is shown in table 2 together withthe structure's basic dimensions. The shortestseepage path in all cases was horizontally aroundone end of the headwall and along the stillingbasin sidewall. This was also where all failuresoccurred.
Lane's weighted-creep ratio is the weighted-creep distance divided by the seepage head. A
TABLE 2.-Basic dimensions, weighted-creep distance and creep ratio for drop structures
Structure
Head-wail
exten-
Crestlength(opening
Up-streamcutoff
Toe-wall
cutoff
Still-ing
basin
Stillingbasin
bottomWing-wan
End-sill
Weighted-creep values'
Initial End of study
sion width) depth depth length width length height
Distance Ratio Distance Ratio
Inches Inches Inches Indies Inches Inches Inches Inches Inches Inches1 20 18 2 [6] [30] 124 1 9 i.5 8 1.32, 3 21 18 12 12 32 24 18 35 5.8 28 4.64, 5 21 18 6 6 32 24 18 3 35 5.8 30 56 17 18 7 20 18 3 15 2.4 11 1.97 18 15 8 6 19 15 18 3 7 1.18, 9, 10 3 19 50 12 4 [18.51 23 3.8 20 3.411, 12 20 18 6 6 24 5 12 4 11 1,9 10 1.613, 14 20 18 5 6 30 14 6 11 1.8 9 1.515, 16 20 18 [6] [3-6] [24] 9 1.5 6 1.019, 20 16 24 8 8 42 12 16 41 6.8 39 6.621, 22 32 16 10 10 40 16 32 4 53 8,9 47 7.923 20 20 12 6 36 24 18 8 37 6.2 29 4.924 22 20 110] (10] 25 23 21 314 36 6.0 29 4.925, 26 32 18 4 12 36 12 2 37 6.2 33 5.627, 28, 29 a 22.5 24 14 22 3.7 22 3.730 22 15 [101 20 22 18 3.0 8 1.331 24 18 36 18 24 6 47 7.8 42 7.0
1 Creep path assumed horizontal around outside of headwall and stilling basin walls; seepage head 6 inches. 2 Numbers inbrackets are approximate. 3 Crest length of cofferdam; opening width is smaller. 4 Width of liner below headgate.
5 Trapezoidal stilling basin.
5

minimum value of 4 (7) is commonly used fordesign purposes for loam and sandy loam soilshaving a clay content of 15 percent or greater.Creep ratios at the beginning and at the end ofthe test period are shown in table 2 for a seepagehead of 6 inches. The structures constructed inplace and the prefabricated structures with wing-walls had the highest creep ratios. Most of theprecast concrete structures had a low creepratio. and structures 1, 7, and 11 to 16 failed atleast once during the study. These washout fail-ures, initiated by piping around one end of theheadwall, occurred several times on some struc-tures. None of the cast-in-place structures failedby piping, whereas the only prefabricated andmodular structures that did not fail at least oncewere 6. 8, 9, 10, 24, 27, 28, 29, and 31. None ofthe headwalls on the prefabricated concretestructures were of adequate length. Some ofthese, where failures had occurred, were length-ened with metal modular panels in 1968 to pre-vent further piping.
The concrete cast-in-place structures providedadequate headwall length and also providedgood contact along the sides of the stilling basinbetween the soil and the concrete. When prefab-ricated basins were attached to concrete head-walls (structures 11 to 14) or precast structureswere used, it was not possible to obtain goodsoil-to-structure contact, and thus there waslittle resistance to seepage flow along this inter-face. When wingwalls were used, it was easier tocompact the backfill to obtain seepage resistancealong the length of the structure. Even thoughthe backfill was compacted around structure 23,it washed out three times during each of theseasons 1966 and 1967. Livestock damage androdent holes were contributing factors in thefailures. No failures occurred after the beginningof the 1968 season, when the structure was re-moved, modified, and reinstalled.
Structures installed by driving metal modularpanels into the ground (structures 24 and 30)are normally very resistant to piping failures.Adequate hydraulic design, however, is stillnecessary to prevent failure by undermining anderosion around the structure. In rocky orgravelly soils, it may not be possible to drive thepanels deep enough to prevent piping. A wash-
out failure initiated by piping was experiencedwith structure 30. The headwall panels on oneside of the structure were not driven deepenough and this, combined with erosion fromthe downstream side, caused failure.
The prefabricated structures were relativelyunstable immediately after installation and weresubject to piping failures because of theloosened soil condition. Even though the back-fill was compacted and replaced with care, it wasstill more subject to piping and erosion than soilthat had not been moved. Most piping failuresoccurred during the first two seasons. Livestocktrampling around some structures contributed tothe failures during the first year. Failures duringsubsequent years resulted almost entirely frompiping caused by rodents. In the spring of eachyear the ditch banks were extensively damagedby mice. The structures most seriously affectedwere those that were prefabricated and had in-adequate headwall length. These structures werealso more vulnerable because of the loosenedcondition of the soil after installation.
Piping around prefabricated structures 8, 9,and 10 and 27, 28, and 29 was noticeablyabsent. These structures were installed with abackfill mixture of sand and fine gravel next tothe structure. This backfill, although quite erod-ible, appeared to discourage rodent activity. Theback fill was puddled to consolidate it and toobtain good soil-to-structure contract. If thebackfill can be protected from stream erosion,this installation method might be used to advan-tage with other structures. The backfill materialwas protected from downstream erosion byrocks on structures 8, 9, and 10 and with con-crete sidewalls on structures 27, 28, and 29.
Overtopping
Because of the loosened soil condition follow-ing installation, the prefabricated structureswere more subject to damage from streamflowovertopping than those constructed in place.Structures are usually designed with enoughfreeboard that overtopping is not a problem.During a period of high flow (2.98 c.f.s.)in 1967, structures 27 and 29 were partlywashed out when they were overtopped while
6

being operated with their mated check boardsadjusted to cheek the water 6 inches. If over-topped, these structures are subject to failurebecause of the erodibility of the sand and finegravel backfill mix. Unusually large flows, how-ever, are not common in well-regulated systems.When the cofferdam structures are used aschecks, the check boards must be removed fromthe bottom structures first to prevent water"pileup" and overtopping by the large flows thatwould otherwise occur.
Structure Movement
Elevations were taken at different points onthe structures in November 1966, and again inJuly 1969, after the structures had been in placefor three winters. Elevation differences duringthis period indicate the amount of settling, tilt-ing, or frost heave. The changes in elevation areshown in table 3. Except for structures 24 and30, which show a slight rise in elevation, the
amount of structure movement is negligible.With the exception of structure 24, there was nosignificant difference in movement between theprefabricated, cast-in-place, or metal modularstructures.
STREAMFLOW
Streamflows through the test channel variedduring each irrigation season. Flows in the rangefrom 2.5 to 4 c.f.s. occurred once or twice eachseason but were usually of short duration, last-ing only from 1 to 4 days. The average dailyflow and the number of days each month that ameasurable amount of water flowed in the testditch for the 1966 to 1968 seasons are shown intable 4. Flow- measurements during 1969 werenot made; however, the flow was approximatelythe same as during the three previous seasons.Because the test ditch was a waste channel at thetnd of a distribution lateral, the flow varied con-iderably with intermittent periods during whicho flow occurred.
TABLE 3.-Changes in structure elevations between November 1966 and July 1969 1
Structure No.East headwallor cofferdam
West headwallor cofferdam Basin upstream Basin downstream
Feet Feet Feet Feet2 -0.01 -0.02 -0.01 -0.013 - .03 - .02 - .01 - .024 .01 + .01 - .02 - .025 + .01 .00 .00 • .017 .04 .00 .00 + .01
8 + .01 + .01 .00 .009 + .01 - .02 .00 .00
10 + .02 + .03 + .01 .0011 .00 .00 + .07 + .0412 + .02 + .03 + .03 0313 + .02 + .02 .0214 + .01 + .02 + .0215 + .02 + .0316 + .04 + .0319 + .02 + .02 + . .01 .0020 + .01 + .01 .00 .0021 - .04 + .05 .01 + '.0122 .06 - .03 .01 + .0124 + .14 +..11 .14 + .1225 .00 - .01 .01 + .0126 .02 -.02 .02 + .0327 ,01 + .02 .01 .0028 .02 + .01 1- .02 .0029 .00 + .01 + .01 + .0130 + .01 + .04 .02 + .0631 + .02 03 .01 + .01
1 Data for structures 1, 6, 17, 18, and 23 are not shown because these were removed or repositionedduring the test period.
7

TABLE 4.-Average daily flow and number of days each month that water flowed through drop-checkstructures for three seasons
Month
1966 1967 1 8
Averagedaily flow
Days offlow
Averagedaily flow
Days ofnow
Averagedaily flow
Days offlow
C.f.s. No. C.f.m No. C! a No.May 0.61 9 0.37 18June 1.13 22 1.57 30 1.63 30July .30 21 .68 30 .46 27August .43 17 .82 21 .88 25September 1.42 24 .78 27 .91 24October 1.51 31 .94 30 1.65 31November 0.55 5 1.50 26 1.5 0 5
VELOCITY MEASUREMENTS
Velocity measurements were made at thecenter line near one structure of a pair or groupand are representative of the flow through thatparticular type structure. Because the structureswere normally used both with and withoutcheck boards, measurements were made for eachcondition. In general, the measurements weremade 1 foot upstream froin the structure, at theend of the stilling basin or liner section, 1 footdownstream, and 2 feet downstream. The mea-sured velocities at three different flow rates for
each type structure are shown in table 5. Thesemeasurements were made to indicate, qualita-tively, the relative performance of the struc-tures.
The downstream velocity at the end of an ef-fective stilling basin or liner section should below and generally less than that approaching thestructure. In actual practice, these structures areused as checks with the tailwater checked to anincreased depth by the next structure down-stream, only when the ditch is serving as a headditch for direct irrigation. Therefore, theynormally operate for longer periods of time as
TABLE 5.-Velocity measurements above and below drop structures for different discharges and check board conditions
StructureNo.
Measured velocity
Without check boardsFlow = 0.84 c.f.s.
Without check boardsFlow = 1.40 c.f.s.
With check boardsFlow = 1.59 c.f.s.
( 1 ) (2) (3 ) (4) ( 1 ) (2 ) (3 ) . (4) ( 1 ) (2 ) (3 ) (4)
2 Ft. /sec.
1.51Ft /see.
2.54 1.62 1.60Ft.fsec.
3 1.29 3.05 1.42 1.395 1.57 1.53 0.83 0.93 1.59 1.94 1.48 1.096 1.80 1.18 2.007 2.22 6.01 3.91 2.789 1.48 3.66 2.78 2.80 1.84 5.18 2.90 3.36 0.87 0.80 1.14 1.13
11 1.31 0.58 0.57 0.31 2.04 0.61 0.52 0.3314 1.27 0.43 0.33 0.26 1.76 1.06 1.16 0.5915 4 . . 1.17 1.59 6 0.79 1.46 2.19 1.1720 1.25 1.59 1.25 1.17 1.67 1.35 1.39 1.39 0.85 1.82 1.22 0.9021 1.55 1.39 1.39 0.95 2.01 2.16 2.31 1.16 0.93 0.93 2.07 1.1723 1.63 0.47 1.46 0.41 2.05 0.63 0.56 0.46 0.85 0.5 3 0.34 0.5024 0.86 1.06 0.55 1.20 2.80 1.59 1.11 0.71 0.74 1.52 0.9325 1.54 0.76 0.57 0.34 1.67 1.48 1.04 0.69 0.89 0.50 0.49 0.3128 1.42 3.19 2.65 1.20 1.85 3.77 2.54 1.51 0.57 0.63 1.48 1.0230 2.63 2.04
1 2 3Measurement taken 1 foot upstream, Measurement taken at the end of basin over end sill Measure-ment taken 1 foot downstream. '' Measurement taken 2 feet downstream. 5 Measurement taken 3.8 feet down-Stream. 6 Measurement taken 5 feet downstream.
8

drops, without check boards. When operating asdrop structures, the downstream water depthsare shallower, resulting in higher exit velocitiesthat are more conducive to degradation of thestream channel. There was a reduction invelocity through most of the structures as notedin table 5. At the lower flow without checkboards, structures 3, 9, and 28 all had high exitvelocities. At the higher flow without checkboards, structures 2, 7, 9, 15, 21, 24, and 28 allhad high exit velocities; those for 7, 9, and 28were very high at the end of the basin orliner section. None of the structures with highexit velocities had end sills, except for 21. Atboth flows without check boards, the velocitybelow structure 9 remained high for a distanceof at least 2 feet downstream. The high velocitybelow structure 28 did not persist for as great adistance and was greatly reduced within the first2 feet. The high velocity below structure 15 oc-curred near the end of the basin where some ofthe gravel tended to accumulate. The soil at thislocation did not erode, however, because of pro-tection provided by the gravel material. Whenthe structures were operating as checks with anincreased depth downstream, the exit velocityfrom most structures, at the indicated flow rate,was reasonably low. For all conditions andflows, the velocity 1 foot downstream fromstructure 21 remained relatively high. Because ofturbulence over the end sills, it was difficult toobtain an accurate measurement of averagevelocity at that point. The measured velocitydownstream from some structures having endsills was higher than the measured velocity overthe sill, due to the hydraulic conditions.
The maximum permissible or nonerodiblevelocity is the highest velocity that will notcause erosion of the channel bed. It varies withsoil texture, soil structure, and other factors.The following tabulation showing maximum per-missible velocities for selected soil conditions isgiven by Chow (1):
Maximum permissibleSoil Velocity, Ft. /sec.
Fine sand
1.50Sandy loam
1.75
Silt loam 2.00
Clay
3.75Shale and hardpan
6.00
For soils at the test site, velocities of morethan 2.0 feet per second should not be allowed,particularly near a control structure. Without ahardpan condition, velocities greater than 2.0feet per second would result in downstreamerosion, and the use of riprap and gravel forchannel stabilization would be necessary. Manyof the structures evaluated were questionablefrom an erosion-control standpoint because ofhigh exit velocities.
HYDRAULIC PERFORMANCE
Stilling Basins
The purpose of a stilling basin is to dissipatethe excess energy of flowing water for down-stream channel protection. If water leaves thebasin with a high velocity, energy dissipationcontinues over unprotected soil in the down-stream channel and contributes to channel de-gradation. The exit velocity from a stilling basinis influenced by the basin geometry. Althoughdata were not obtained to design the length of astilling basin, it was observed that, in general,those structures in the study having stillingbasins less than 30 inches in length, did not provide adequate stilling of the water before it leftthe structure.
Structures with narrow stilling basins tend toconfine the flow, and this results in high exitvelocities. This was particularly noticeable forthose structures that did not have end sills orwere not set below grade to provide extra tail-water depth (structures 7, 8, 9, 27, and 28). Theeffect of high velocity downstream from thesestructures and from structures 21 and 22 wasindicated by the absence of moss growing in thebottom of the ditch for some distance down-stream. Structures 10 and 29 operated with agreater tailwater depth and consequently had alower exit velocity than their counterpart struc-tures. The high velocity through the cofferdamstructures (structures 8, 9, 10, and 27, 28, 29)was caused by the narrow throat width belowthe cofferdam; this contracted the flow and ac-celerated it as shown in figure 1. At the higherflows within the design range of these structures,the control shifted from the cofferdam crest to
9

Figure 2.–Photograph showing the Coanda or wailattachment effect.
Figure I.–Photograph showing high-velocity, accelerated flowthrough the narrow opening of a cofferdam-type structure at91 percent (1.65 c.f.s.) of design flow,
the narrow opening. A considerable part of thetotal drop in water surface occurred as the waterflowed through this opening rather than in thecofferdam drop. Therefore, the relatively longcofferdam crest was nullified by the contractedopening downstream, and the effective length ofthe structure was reduced for stilling purposes.Sidewalls were used on structures 27, 28, and 29to protect the downstream channel banks and toprevent erosion of the sand- and-gravel backfillmaterial next to the structure walls. The side-walls increased the effective length of the basin;however, the channel bed between the sidewallswas still exposed to high velocities when thestructures were operated as drops with low tail-water levels. The sidewalls need to be installedrelatively deeply to prevent their being under-mined. Gravel or rock placed between themwould help protect the bed.
Certain conditions seem to favor the occur-rence of the wall attachment or Coanda effect.This occurs in structures having relatively nar-row openings between two confining walls in
which a high velocity fluid flows. Because of thehigh velocity near the wall, a pressure differen-tial exists across the jet that tends to attach thestream or hold it close to the wall. This effectwas observed under certain conditions (fig. 2)with structures 8, 9, and 10, which have rela-tively narrow openings and a liner or basin longenough for the effect to develop. This is anundersirable feature in a drop or check structurebecause the high-velocity flow leaves the struc-ture on one side or the other. This tends to ac-celerate bank undercutting and erosion morethan if the maximum velocity were confined tothe center of the channel. In addition to under-cutting by the high-velocity stream impinging onone bank, a secondary circulation or reverse cur-rent is established near the opposite bank. Thestream is usually directionally unstable and maybe changed from one side to the other by a dis-turbance in the channel deflecting it to the op-posite side. The Coanda effect was not ob-served with structures having wide basins andlow exit velocities.
10
Trapezoidal and rectangular stilling basinseach have advantages. A trapezoidal basin with-out a headwall does not obstruct ditch-cleaningequipment, and a tractor-mounted ditcher canpass through it. The basin can also be con-structed without expensive forming by placingconcrete directly on the soil in the ditch. With alower tailwater, however, the performance of atrapezoidal basin may be poor because the nar-row bottom contracts the flow, resulting in highexit velocities. Structure 19 performed poorlyand had high exit velocities because of shallowtailwater, while structure 20 operated with ahigher tailwater and gave very good perform-ance. Both were effective in stilling the flowwhen operated as checks with adequate tail-water. As water entered the basin, the nappeclung to the wide crest and water spilled downeach sloping side towards the center. Flow meet-ing in the center of the basin resulted in a strongmixing action and turbulence near the upper endof the basin. This effectively stilled the water.before it left the structure. The downstreamchannel must be shaped to match the basin toprevent bank undercutting.
The stilling basins of structures 1, 15, and 16,which were lined with coarse gravel or small rip-rap, were effective in providing good water con-trol and energy dissipation. There were also themost economical of any structures installed.This type of basin requires relatively flat sideslopes for the rock to be stable. Because of this,a wide basin immediately below the structure isneeded. The basins of these structures wereshaped with 2:1 side slopes. At this slope, therock stayed in place if it was not disturbed; how-ever, when disturbed by livestock, it tended tomove to the bottom and end of the basin. Onedisadvantage of this basin is that it is subject todamage when livestock are present. This struc-ture requires an extra long headwall with a deepcutoff to prevent piping and to obtain a satisfac-tory creep ratio.
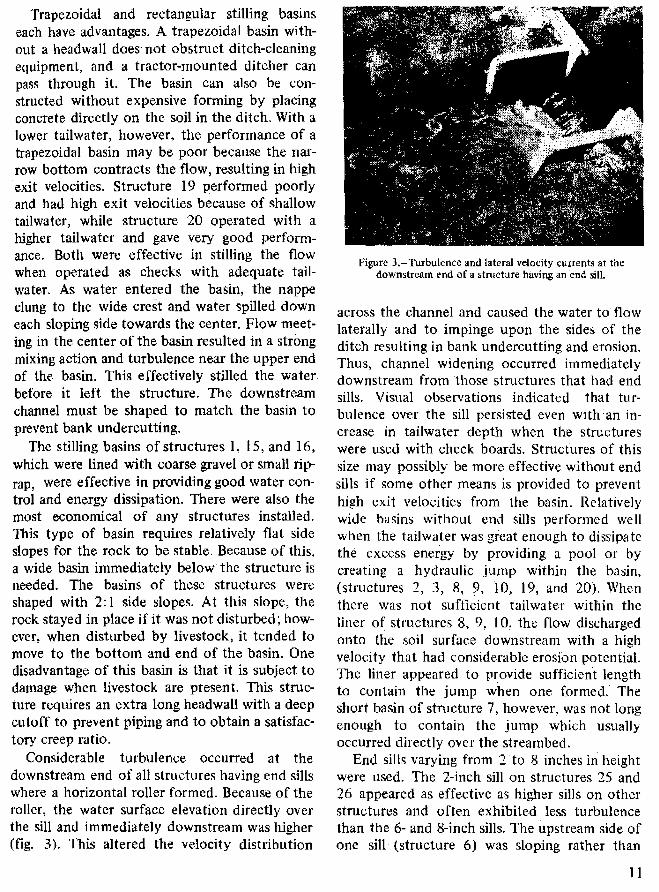
Considerable turbulence occurred at thedownstream end of all structures having end sillswhere a horizontal roller formed. Because of theroller, the water surface elevation directly overthe sill and immediately downstream was higher(fig. 3). This altered the velocity distribution
Figure 3.—Turbulence and lateral velocity currents at thedownstream end of a structure having an end sill.
across the channel and caused the water to flowlaterally and to impinge upon the sides of theditch resulting in bank undercutting and erosion.Thus, channel widening occurred immediatelydownstream from those structures that had endsills. Visual observations indicated that tur-bulence over the sill persisted even with an in-crease in tailwater depth when the structureswere used with check boards. Structures of thissize may possibly be more effective without endsills if some other means is provided to preventhigh exit velocities from the basin. Relativelywide basins without end sills performed wellwhen the tailwater was great enough to dissipatethe excess energy by providing a pool or bycreating a hydraulic jump within the basin,(structures 2, 3, 8, 9, 10, 19, and 20). Whenthere was not sufficient tailwater within theliner of structures 8, 9, 10, the flow dischargedonto the soil surface downstream with a highvelocity that had considerable erosion potential.The liner appeared to provide sufficient lengthto contain the jump when one formed. Theshort basin of structure 7, however, was not longenough to contain the jump which usuallyoccurred directly over the streambed.
End sills varying from 2 to 8 inches in heightwere used. The 2-inch sill on structures 25 and26 appeared as effective as higher sills on otherstructures and often exhibited less turbulencethan the 6- and 8-inch sills. The upstream side ofone sill (structure 6) was sloping rather than
11
vertical. This gave a "flip bucket" effect to theflow as it left the basin and tended to increasethe amount of turbulence.
Metal modular structure 23 (see Appendix,fig. 21) originally had a narrow opening and anarrow stilling basin. At the beginning of the1968 season, it was removed and rebuilt to pro-vide a wider and longer basin with a longer crest.The scour hole that had developed downstreamduring the first two seasons was filled. Extend-ing the crest length and basin width did notentirely correct its faulty performance. Flangeson the vertical edges of the modular componentsprotruded into the stream and apparentlyaltered the pressure distribution near the end ofthe basin. At some discharges, the water wasobserved to flow almost 90° laterally at thedownstream end of the structure. The high endsill in structure 23 also appeared to contributeto strong turbulence, which persisted even withan increased tailwater depth. Because of the lat-eral velocity currents, considerable erosion andchannel widening continued downstream afterthe original scour hole was refilled. This struc-ture washed out several times during the courseof the study, and considerable maintenance wasrequired around the ends of the wingwalls.
The stilling basins for metal modular struc-tures 24 and 30 were too short to provide ade-quate energy dissipation. The apron of structure30 was extremely short, and strong turbulenceoccurred downstream over the unprotected soil;however, an apparent hardpan in this area re-duced the scouring. This structure was designedand installed by the local dealer as it is normallyused in the area. Consequently, the apron wasvery short and wingwalls were not provided.Erosion occurred beneath the basin and behindthe sidewalls extending upstream to the head-wall. This caused the structure to fail by under-mining one side of the headwall. A constructionflange at the end of the basin on the bottom andsides of structure 24 appeared to contribute tothe formation of eddy currents similar to thoseat the end of structure 23. Vortices and eddycurrents tended to form at the downstreamcorners of all basins having 90° wingwalls, butthey were stronger and more pronounced withbasins having sills and protruding flanges. Be-
cause the metal panels are driven into the soil,structures similar to 24 and 30 are normallyresistant to piping and washouts.
After the study was initiated, a culvert wasinstalled downstream from structure 31. This re-suited in an increased tailwater depth, and thestructure operated partly submerged exceptwhen the flow was very small. Even thoughpartly submerged much of the time, the narrowbasin, combined with turbulence over the endsill, caused considerable erosion and streamchannel widening immediately downstream.
Crest
The channel• bottom upstream from the cof-ferdam structures must be as wide as or widerthan the crest. Otherwise, water flows into thecofferdam from the sides, and the channel banksupstream become undercut and slough into theditch. When these structures are used as checks,the cofferdam is not used and stilling occurswithin the short throat section or the liner sec-tion. As noted previously, the cofferdam wasnot very effective at the higher range of flowsfor which these structures were designed, be-cause the control shifted from the crest to thenarrow opening downstream.
Structures with a very wide opening or longeffective crest length, such as trapezoidal struc-tures 19 and 20, have a smaller head or waterdepth over the crest. This results in the waterentering the basin at relatively low velocities, re-quiring a shorter stilling basin. Because thenappe of these structures normally was notaerated, the water plunged into the stilling basinclose to the upstream headwall. For this condi-tion, it appeared that greater stilling was ac-complished than for flow having a higher veloc-ity and a nonaerated nappe entering the mid-portion of the basin. The nonaerated nappeobserved with structures 21 and 22, which havenarrow basins, may account for the good stillingin these structures. The nappe entered the basinclose to the headwall, resulting in a longer effec-tive basin length. An undesirable condition mayexist, however, if the nappe should becomealternately aerated and nonaerated. The nappeon the above structures was always observed
12

nonaerated. Normally, a nonaerated nappe isundesirable; however, for small structures the
`disadvantages of a nonaerated nappe may not besignificant. Because of the relatively low headsand velocities involved, negative pressures shouldnot be great enough to cause cavitation.
SCOUR AND EROSION
Where soils are uniform, scour volumes down-,stream from a series of structures depend on theexit flow velocities and the effectiveness of the
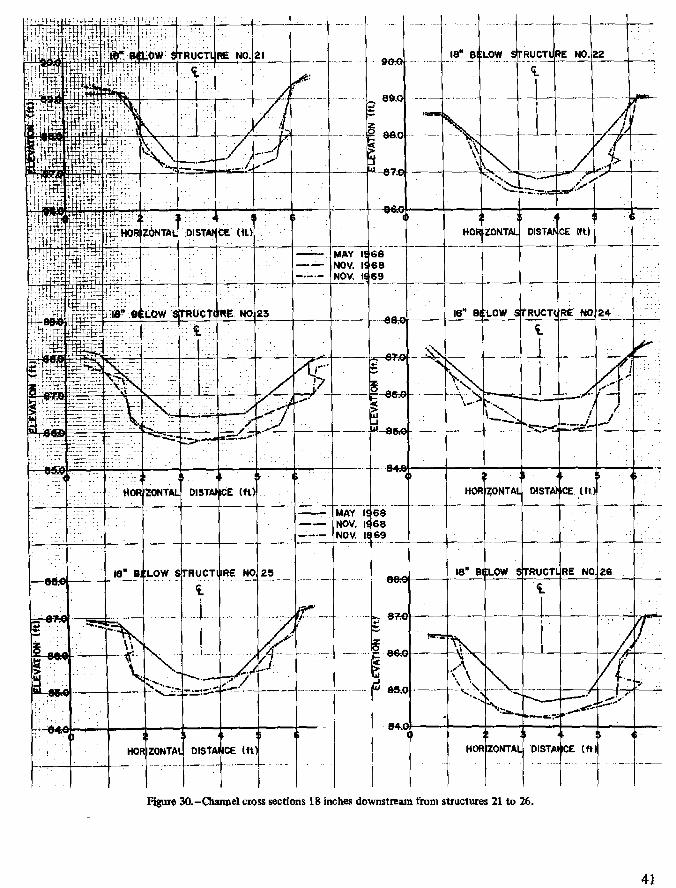
g . control structures. Channel cross-section meas-urements were made at three locations belowthe structures at the beginning of the 1968season and again at the end of the 1968 and1969 seasons. The stream channel cross sections18 inches downstream from each structure areshown .in Appendix figures 27 to 31. The
volume of soil eroded between 6 and 30 inchesdownstream from each structure is shown intable 6. The average scour depth and change inchannel width for the three downstream meas-uring stations are also shown in table 6. Cross-section measurements made during the first 2years were not used because of the variability inchannel size in relation to some of the struc-tures. The narrow ditch resulted in an unusuallylarge amount of erosion and bank undercuttingdownstream from structures having extra-widestilling basins. Also, considerable bank under-cutting occurred upstream during the firstseason from those structures having cofferdamstilling basins. Consequently, large pieces of soilwere dislodged from the sides of the ditch. Afterthe channel was reshaped, bank undercuttingupstream did not occur and undercutting down-stream was not so severe. During the second
TABLE 6.-Erosion volume, average scour depth, and average increase in channelwidth between 0.5 and 2.5 feet downstream from drop-check structures duringa 2-year period
StructureNo.
Erosionvolume
Average scourdepth
Average increase inchannel width
Cu. ft Ft. Pct.1 1.72 0.17 232 2.89 .49 03 2.32 .37 104 1 2.28 .06 345 1 3.31 .21 426 1 3.48 .19 517 3.83 .44 178 3.70 .44 239 3.19 .44 26
10 2.99 .47 2511 1 3.91 .24 58121 4.04 .26 3713 1 4.18 .18 4714 1 3.55 .16 3415 0.85 .00 1516 2.00 .00 1519 5.75 .55 3420 2.20 .10 4521 1 4.17 .28 65221 5.25 .40 65231 7.74 .58 6024 6.14 .65 3025 1 3.67 .29 4426 1 5.66 .43 4827 4.67 .51 2028 4.18 .44 2429 2.41 .26 2130 4.47 .47 45311 5.81 .20 19
1 Structures with end sills.
13

97.0
96.09In
0 95.01-••
94.0
t
••n•ba.ralifte
itA
.
.
• •••••;.• • am• • EN•
\v
\
.,,,• I)
xi..........•
\ ..... z-- ....":"-------...--------. ./............4....,
...•• 1.
•---- ORIGINAL, MAY 1968NOVEMBER 1968-- --•
-•- NOVEMBER 1969
2 3 4 5
793.00
season, when structures 19 to 31 were operatedas checks, considerable sediment accumulatedupstream from each structure. When the struc-tures were operated alternately as checks anddrops the next year, these deposits did not oc-cur.
Two general scour patterns, related to thepresence or absence of an end sill, were ob-served. Downstream channel widening was gen-erally associated with those structures that hadend sills, while degradation of the channel bedwas associated with those structures which didnot have end sills. Structures without sills gen-erally had the greatest scour depth and usuallyhad the highest exit velocities, as shown in table5. A typical channel cross section 18 inchesdownstream from a structure having an end sillis shown in figure 4 and for a structure withoutan end sill in figure 5. Corresponding photo-graphs of these structures are shown in figures 3and 6.
Disregarding those structures having a riPrap-lined basin and structures 17 and 18, which were
removed from service, the remainder of thestructures were equally divided between thosethat had end sills and those that did not. Theywere randomly intermixed throughout thelength of the ditch so that the effect of soilvariations was minimized. The sum of the scourvolumes and scour depths for both groups ofstructures was determined. The average scourper structure for each group at the end of the1968 and 1969 seasons is shown in the followingtabulation:
Structures Structureswith end sills without end sills
Average scour volume per
1968 1968-69 1968 1968-69
structure . . . . cu. ft. 3.9 4.4 3.0 3.8Average scour depth per
structure ft. .24 .27 .39 .43
The above data indicate that, during the 2-yearperiod, about 16 percent more total soil loss oc-curred in the first 2.5 feet downstream fromstructures having end sills. On the other hand,
Q
HORIZONTAL DISTANCE (ft.)Figure 4.—Channel cross section 18 inches below a structure with an end sill, No. 6.
14

•-•-• 98.0••n11.n
097.0
a
96.0
95.00
99.0
•••••;•-•.-....-_________. ---. •-...
•
• •
...._.....0...'
.....-....•-- -----
ORIGINAL,
NOVEMBER
NOVEMBER .
MAY 1968
1968
1969,
--
-•-• -
I 2 3 4 5
HORIZONTAL DISTANCE (ft)Figure 5.—Channel clo gs section 18 inches below a structure without an end sill, No. 2.
6 7
ligure 6.-- Flow in a standard rectangular structure withoutan end
the data show that the average scour depthdownstream from structures without end sillswas about 62 percent greater. For those struc-tures without an end sill, there was a directqualitative relationship between scour volume
and the average velocity at the end of the basin,as represented by the average velocity measuredwith . a flow of 1.4 c.f.s., shown in figure 7.Scour volume and average velocity at the end ofthe basin for structures that had end sills wereonly slightly related.
The difference in tailwater depth noted pre-viously between structures 19 and 20 accountsfor the large difference in scour depth and ero-sion volume for these structures, which are ofthe same design. The difference in scour volumeand performance is significant and emphasizesthe importance of adequate tailwater depth forthis type • of structure. Channel degradationbelow structure 19, which had shallow tailwater,is shown in figure 8.
Erosion upstream from the crest of moststructures was observed. This was sometimes at-tributed to the loosened condition of the soilduring installation. However, erosion also oe-curred . •upstream from the crest of structures 24and 30. where metal modules or panels were
15

STRUCTURES WITHOUTEND SILLS
STRUCTURES WITHEND SILLS
0
0
0
1I 2 3 4 5 6 7 8
MEAN VELOCITY AT END OF BASIN ( ft./sec. )
Figure 7.—Qualitative relationship between scour volume and average velocity at the end of the basinfor structures with and without end sills. The average velocity shown is that measured with a flowof 1.4 c,f.s.
4.6
25
0
re 4
0co
Figure 8.—Channel degradation below a trapezodial structurethat operated with a very shallow tailwater depth.
16

riven into the ground without disturbing thea.Those structures having riprap-lined stilling
asins had the least amount of scour of all struc-
tures in the test study. Some soil movement andwidening of the riprap basins resulted from live-stock trampling along the sides.
DISCUSSION
The hydraulic and erosion-control perform-rice of many of the structures included in this
study needs to be improved. The structures per-tormed better when used as checks with extra,tailwater depth than when used as drops without
vadditional tailwater. This was particularly truewith those structures that did not have end sills.Setting a structure below grade or increasing theeffective tailwater depth is a possible alternativeto the use of an end sill when relatively wide
`basins are used. It may be possible, by changingthe stilling basin design, to overcome some ofthe disadvantages of end-sill turbulence. Thestilling basin of most structures tested was tooshort to contain turbulence created by the drop.There did not appear to be a consistent relation-ship between the height of an end sill and scourvolume: however, turbulence over the highestend sills (6 and 8 inches) appeared greater thanthat over low sills. The cast-in-place structureswere more stable. None of these failed bywashing out, whereas many of the prefabricatedand modular structures failed during the study.
The costs reported are those incurred at thetime of installation (1966) and are not adjustedfor subsequent price changes. There appears tobe a tendency to underdesign metal structures tokeep their cost more competitive with prefab-ricated concrete structures. Because of this, themetal structures are sometimes poorly designed.
Cost and performance ratings for each type ofstructure are shown in table 7. The performanceratings were determined from visual observationsand experimental data collected during thestudy. The ratings, based on a scale from 1 (un-satisfactory) to 10 (excellent), were made on thestructures with the dimensions as shown in table2. In some cases, a particular structure mightpossibly perform better and be rated higher if ithad more adequate dimensions than those usedin this study. For example, the concrete-head-wall structures 11 to 16 rated very low for sta-bility because inadequate headwall length andcutoff wall depth resulted in a low creep ratio.Because of this, washout and piping failures oc-curred. Longer dimensions would have resulted
TABLE 7.-Ratings of drop-check structures'
Hydraulic AverageStructure No. Cost Structural
adequacy StaStability performance Erosioncontrol
Practicalaspects
rating
Drop Check Drop i Check
2, 3 3 9 9 7 8 7 6 6.8 7.04, 5 3 9 9 8 8 7 6 7.0 7.06 8 8 5 5 7 6 7 6.5 6.87 7 6 4 3 6 5 5 5.0 5.58, 9, 10 7 7 7 5 8 6 8 6.7 7.211, 12 7 7 3 6 7 5 5 5.5 5.713, 14 6 7 3 7 8 5 5 5.5 5.71, 15, 16 9 7 3 8 9 9 7 7.2 7.319, 20 4 9 9 5 9 5 7 6.5 7.221, 22 2 6 10 7 8 4 5 5.7 5.823 3 7 7 6 7 2 5 5.0 5.224 2 8 8 5 7 3 6 5.3 5.725, 26 3 6 9 7 9 4 5 5.7 6.027, 28 29 7 8 7 5 8 5 8 6.7 7.230 5 6 3 4 6 5 6 4.8 5.231 3 6 8 7 7 3 6 5.5 5.5
1 .Ratmg Scale: 1.-Unsatisfactory. 2.-Very poor. 4.-Poor. 6.-Fair. 8.-Good. 10.-Excellent.
17

in better performance and a higher rating. Thecost rating assigned was determined from thecost range within which each structure fell. Thetotal structure costs from the lowest to thehighest were divided into ten price ranges, with ascale number assigned to each range. The scalenumber for a given structure's price range is therating for that structure.
Structural strength and durability was deter-mined qualitatively by taking into considerationsuch things as the amount of structural mainte-nance required, steel reinforcing, durability ofthe materials, the amount of freeze-thawdamage, and the susceptibility of a structure tosuch damage.
The rating for structure stability was based oncreep ratios. The total creep ratio range for allstructures as given in table 2 was divided into 1 . 0segments, with a scale number assigned to each.The scale or rating number for each structurewas then adjusted up or down depending uponits field performance. Consideration was given towhether or not the structure washed out and itssusceptibility to failure by piping and over-topping.
The hydraulic performance rating was deter-mined with the structure used as a drop and as acheck. The velocity 1 foot downstream fromeach structure was used as a base for this rating.The range of measured velocities was dividedinto 10 segments. the same as with previousparameters!, the scale number for the velocityassociated with each structure was used as therating. This was then adjusted up or down de-pending upon the structure's field performance,using visual observations and considering thestilling basin design with the dimensions shownin table 2. For example, structures 21 and 22had a high downstream velocity, which gave alow rating. However, because of the extra-longstilling basin and the good stilling that normallyoccurred, the rating was adjusted upward; con-versely, the rating for structure 30 was adjusteddownward because of the very short apron.
The same procedure was followed in ratingthe structures for their erosion-control per-
formance. The erosion volume, as determinedfrom downstream channel cross-section measure-ments, was used as the base for assigning therating numbers. The rating for practicality wassomewhat arbitrary and was based upon theamount of maintenance required; obstruction toditch-cleaning equipment; utility of operation;and farmer acceptance based on the availability,convenience, and ease of installation.
The overall rating is an average of all the rat-ings for the various parameters given in table 7.Generally, a low rating in one category is offsetby a higher rating in another category, so thatthe average structure rating falls within a rathernarrow range.
These small structures usually operate forlonger periods of time as drops than as checks.For this reason, more emphasis should be placedon the average rating as drops as given in table 7.All of the structures rated lower than good;most rated from fair to poor.
With the cost rating excluded, the concretecast-in-place structures have the highest overallperformance rating. The concrete-headwallstructures with gravel-lined stilling basins have ahigh overall rating; however, this would havebeen higher had the headwall been longer with adeeper cutoff. Most of the prefabricated struc-tures would also receive a higher rating if theyhad longer and wider stilling basins and longerheadwalls to insure against piping.
In applying the ratings, those in the individualcost and performance categories will normallyreceive the greatest attention. The average rat-ing gives equal weight to each individual rating.However, in a particular field situation one cate-gory may be more important than another andmay be the dominant criterion. The hydraulicperformance will usually be very important;however, in some cases structure cost or con-venience aspects may be the deciding factorsbetween alternative structures; or, soil condi-tions may require that more consideration begiven to the stability rating.
18

CONCLUSIONS
Based on observations and field data, someneral conclusions may be drawn:(1) The commercial prefabricated structures
id not generally provide adequate stilling basinsfor energy dissipation. They were less stablethan cast-in-place structures and tended to washout more easily.They also required more main-tenance and, because of their smaller size, weregenerally less efficient hydraulically. The prefab-ricated structures, however, cost less and wereeasier to install.
(2) End sills caused turbulence that affectedthe downstream scour pattern and, in a smallditch, increased the total erosion volume byundercutting and eroding the banks immediately
'downstream. Although there did not appear tobe a consistent relationship between the amount
[, of scour and end-sill height, visual observationindicated that there was a greater degree of tur-bulence over the high sills.
(3) Structures having relatively wide basinsperformed better than those with narrow basins.The narrow basins contracted and acceleratedthe flow, resulting in higher exit velocities. Thewide basins provided a larger flow area and thusa lower velocity. With adequate tailwater depth,relatively wide structures without end sills per-formed quite well.
(4) The cofferdam-type structures gave fairlygood hydraulic performance when used as
checks with sufficient tailwater depth. At highflow rates, the narrow opening below the coffer-dam restricted the flow and caused high exitvelocities.
(5) With adequate tailwater depth, a trape-zoidal stilling basin gave good hydraulic per-formance. Without sufficient tailwater, the per-formance was poor and high velocity causedexcessive downstream erosion.
(6) For the relatively small structures andwater depths in the study, a nonaerated nappecontributed to good stilling within the structure.
(7) Structures installed by "puddling" with asand and fine gravel backfill mix were resistantto rodent damage and piping failures, eventhough the mix was quite erodible when thestructures were overtopped.
(8) With adequate cutoff depth and headwalllength, headwall structures with a gravel-linedbasin or plunge pool were the most economicaland the most effective structures tested.
Laboratory studies are needed to investigatedifferent methods of improving the hydraulicdesign. The effects of using flared wingwalls,rounded corners, different sill configurationsand placement, nonaerated nappe, and protrud-ing flanges should be studied, as well as how toeliminate the wall-attachment phenomenon.
LITERATURE CITED
(1) Chow, V. T.1959. Design of channels for uniform
flow. Open-Channel Hydraulics,pp. 157-191. McGraw-Hill Book Co.,Inc., New York.
(2) Code, W.13.1957. Farm irrigation structures. Colo.
(Fort Collins) Agr. Expt. Sta. Bulletin496-S, 60 pp.
(3) Donnelly, C.A., and Blaisdell, F. W.1965. Straight drop spillway stilling
basin. Amer. Soc. Civ. Engin. Proc.,Hydraul. Div. J. 91 (Hy3): 101-131.
(4) Gilden, R. 0., and Woodward, G. E.1952. Low-cost irrigation structures.
Wyo. (Laramie) Agr. Ext. Ser. Cir. 122,16 pp.
(5) Herpich, R. L., and Manges, H. L.1959. Irrigation water control structures.
Kans. (Manhattan) Agr. Expt. Sta.12 pp.
(6) Peterka, A. J.1964. Hydraulic design of stilling basins
and energy dissipators. U.S. Bureau ofReclamation, Engineering MonographNo. 25, 114 pp.
(7) U.S. Department of Agriculture, Soil Con-servation Service
1958. Engineering design standards, FarWestern States.
19
APPENDIX
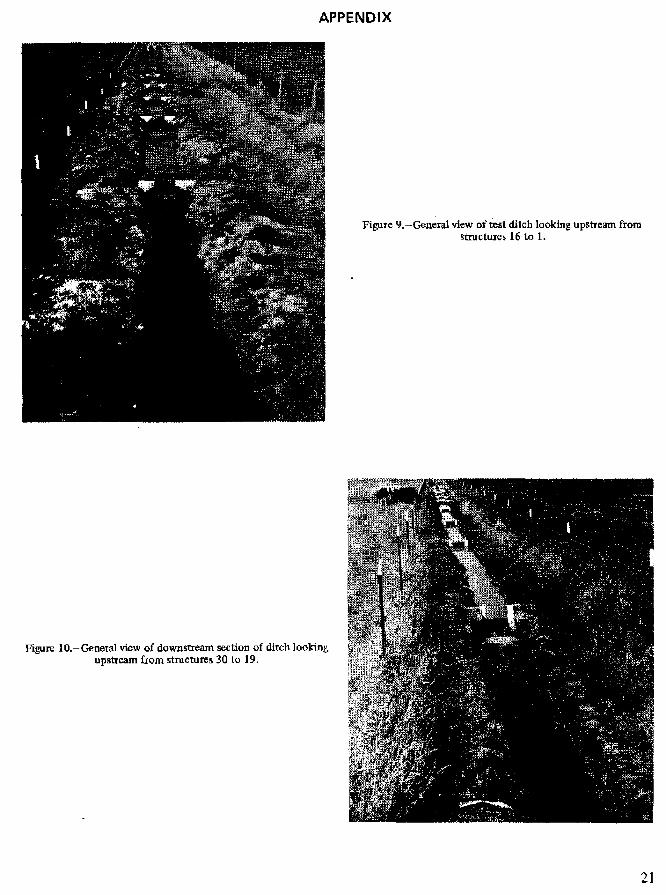
Figure 9.—General view of test ditch looking upstream fromstructures 16 to 1.
Figure 10.—General view of downstream section of ditch lookingupstream from structures 30 to 19.
21
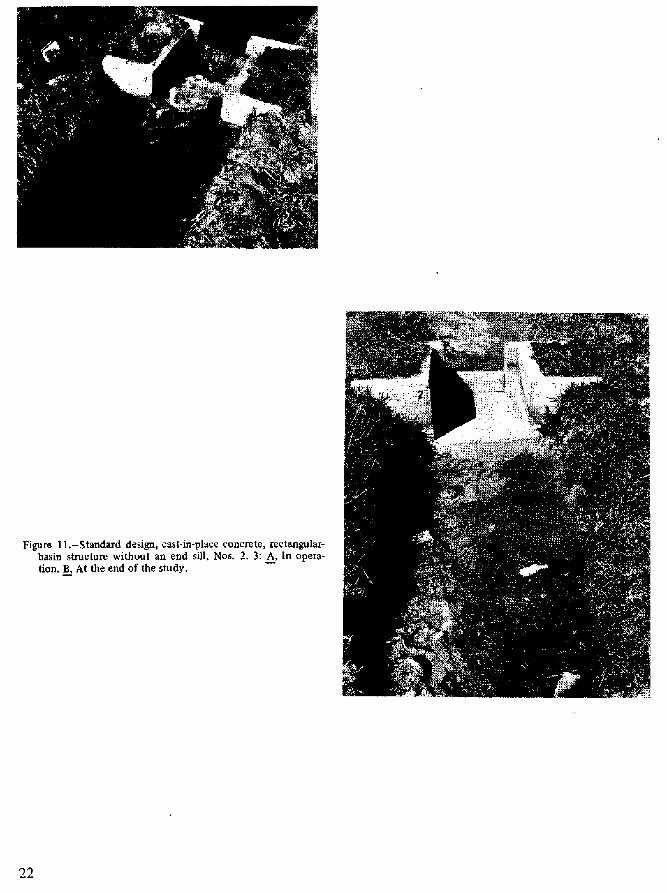
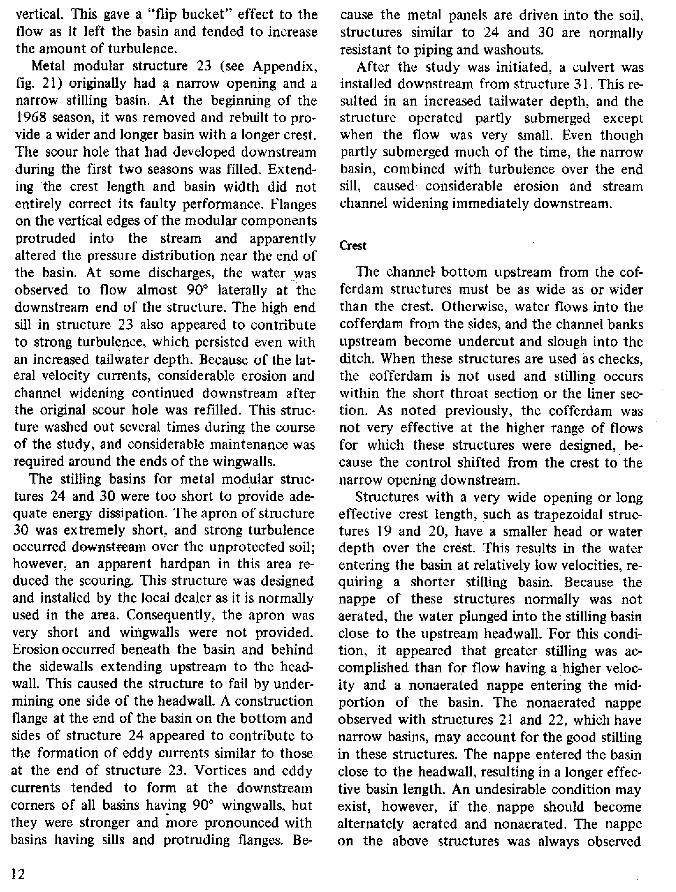
Figure 11.—Standard design, cast-in-place concrete, rectangular-basin structure without an end sill, Nos. 2. 3: A, In opera-tion. B, At the end of the study.
22

Figure 12.– Standard design, cast-in-place concrete, rectangular-basin structure with an end sill, Nos. 4, 5: A, in operation. B,At the end of the study.
23

Figure 13.—Precast concrete structure with an end sill, Nos.6, 17: A In operation. 11 At the end of the study.
24
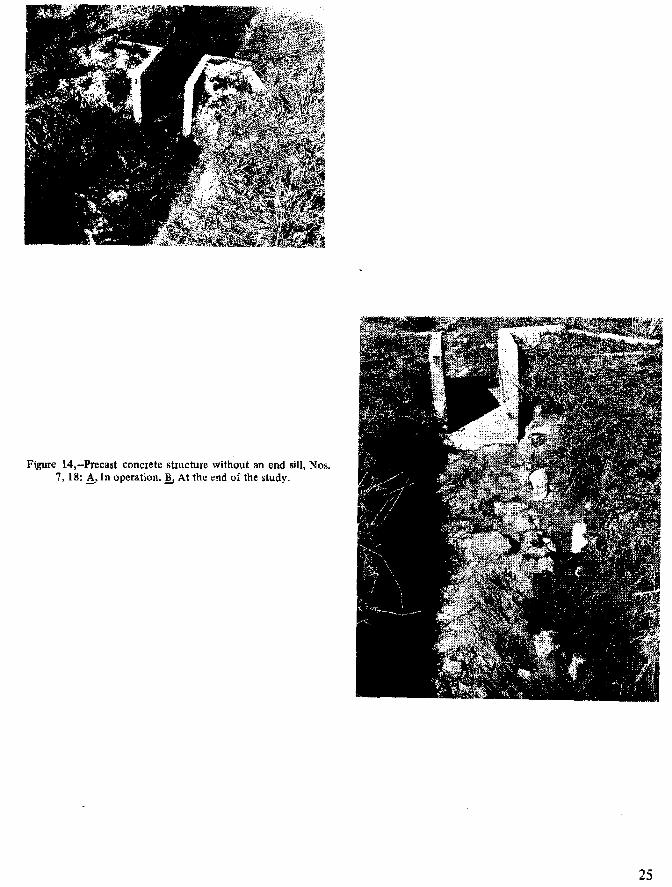
Figure 14,—Precast concrete structure without an end sill, Nos.7, 18: A, In operation. iii, At the end of the study.
25

Figure 15.–Small-size precast concrete structure with upstreamcofferdam and downstream liner section, Nos, 8, 9, 10: A Inoperation. A, At the end of the study.
26

Figure 16.—Precast concrete-headwall structure with fiber glassstilling basin. Nos. 11 and 12: A, In operation, 13 At the endof the study.
27

Figure 17.–Precast concrete-headwall structure with steel-linedstilling basin, Nos. 13. and 14: A, In operation. B At the endof the study.
28

Figure 18.–Precast concrete-headwall structure with small-riprapstilling basin, Nos.,1, 15, and 16: A, In operation. B, At theend of the study.
29

Figure 19.—Standard design, cast-in-place concrete structurewith trapezoidal basin, Nos. 19 and 20: A, In operation. B,At the end of the study.
30

Figure 20.--Standard design, concrete•block structure with rec-tangular basin, Nos. 21 and 22: A, In operation. 13, At theend of the study.
31
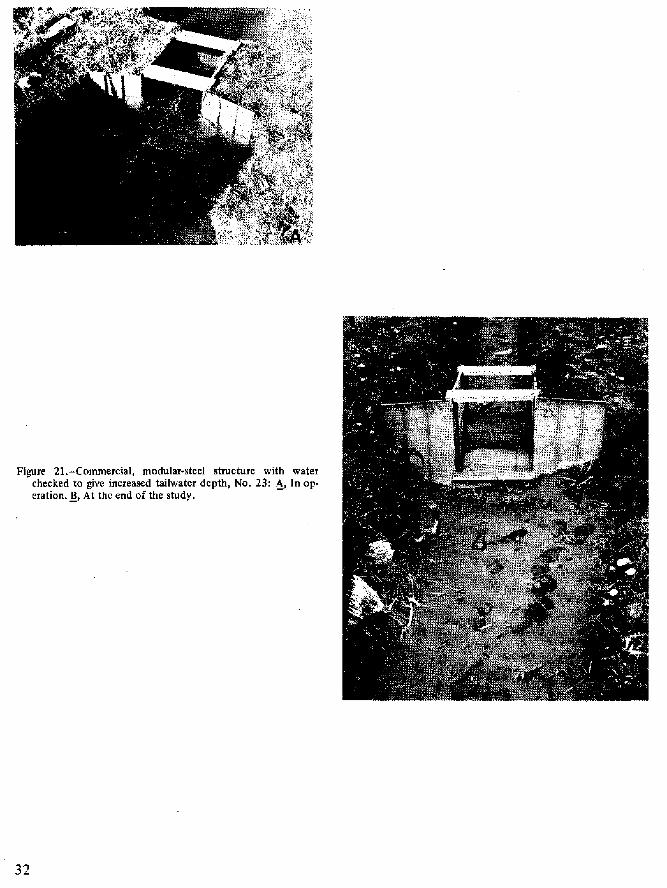
Figure 21.—Commercial, modular-steel structure with waterchecked to give increased tailwater depth, No. 23: A, In op-eration. B At the end of the study.
32
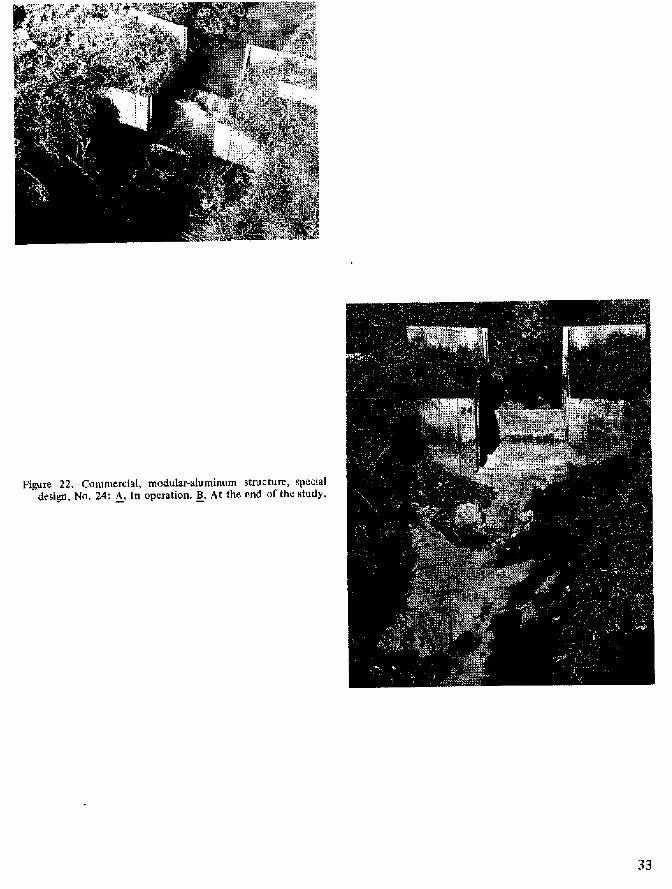
Figure 22.—Commercial, modular-aluminum structure, specialdesign, Na. 24: A, In operation. B. At the end of the study.
33

Figure 23.–Concrete-block headwall structure with formed trap-ezoidal basin, Nos. 25 and 26: A, In operation. B, At the endof the study.
34

Figure 24.–Large-size, precast concrete structure with upstreamcofferdam and downstream sidewails, Nos. 27, 28, and 29: A,In operation. B, At the end of the study.
35

Figure 25.—Commercial, modular aluminum structure, localdesign, No. 30; A, In operation. B, At the end of the study.
36
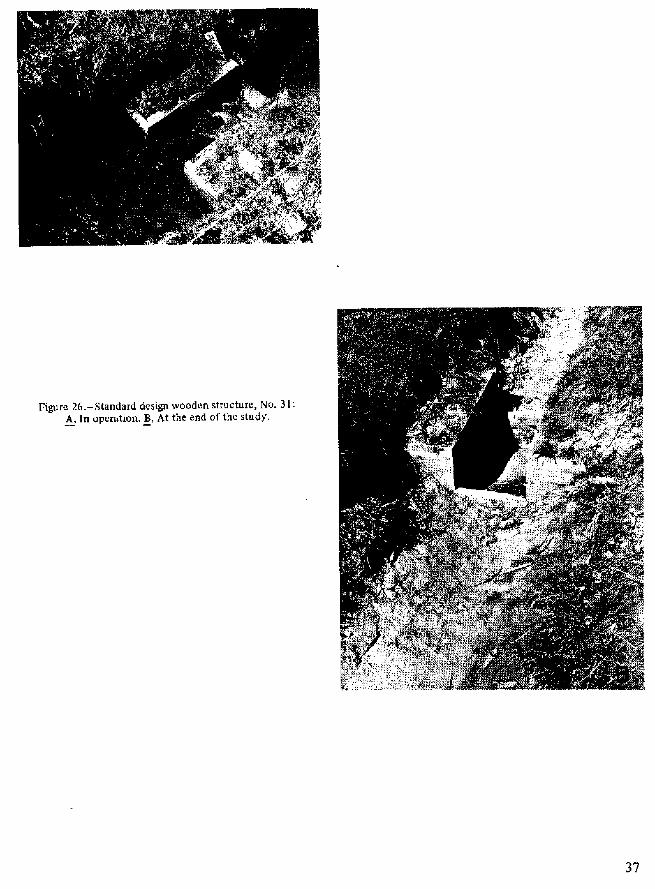
Figure 26.—Standard design wooden structure, No. 31:A, In operation. B, At the end of the study.
37

18" B LOW RUCT RE N 2
MAY INOV. I
: r
GB68
4RE NO
970...1
- 960
111- 95.0
94.0
ed. e RUC RE NO.
111111= 111ME= Al
•REIMER
MINNE OW REI
HOP ZONTA DISTA E {ft.
NI ION*E1111111111IN -
11111111LriMEI
LOW
MAY I 68NOV. I 68
HO
LIME
ZONTA GIST CE [ft.
CE (ft!
IS" B
HOR ZONTA DISTA E (ft. HOR ZONTA DISTA CE (ft.
Figure 27.—Channel cross sections 18 inches downstream from structures 1 to 6.
38

18" LOW RE NORUCT LOW TRUCTIs B RE N97.0
666869
68 -6869
-92
7
MAYNOV. 1NOV. I
MAY INOV. INOV.
HOR ZONTAL DIST CE [ftiZONTAL DISTA CE (ft.
Figure 28.—Channel cross sections 18 inches downstream from structures 7 to 12.
39

LOW
1111
LOW S RUCT 13E NO.
-- MAY I— NOV. I
--- NOV. 1
-- MAY I— NOV. I
NOV.
NOR ZONTA DIST E (ft)HOR ZONTAL DIST CE (ft.)--•.-•• ••
anewalrMEM
31EMEIMEI
111E11111
Figure 29.—Channel cross sections 18 inches downstream from structures 13 to 20.
18" B LOW RUCT RE NO
92
686869
93c
686869
-94
88
87.
40
CE {ft.HOR ZONTA DISTA HOR ZONTA DIST CE (ft.
21
111li
MEM MAY 1
NOV. 1NOV. I
MENEMlir*EMI=NEMINNIM
NM
--•
–87.
686869
686869
I8' B LOW RUCT -E NO. 22• 0 *
a
– MAY I-- NOV. I
--- NOV. I
Figure 30.—Channel cross sections 18 inches downstream from structures 21 to 26.
41

Ht7R ZONTAL DISTA CE (ft)
LOW TRUCT RE NO 282
--
66.
MAY 1968NOV, 1968NOV. 1969
O
HOR ZONTA DISTA CE (ft.
MAY 1968NOV. 1968NOV. 1969
NO 27
Figure 31.—Channel cross sections 18 inches downstream from structures 27 to 31.
42