Embed Size (px)
Citation preview
~ iRIi s936 PLEASE DO NOT REHOVE FROM LIBRARY
Field Evaluations of Magnesium Oxide in Oeep- Bed Fi Itration
By Daniel N. Tallman and Joseph E. Schiller
UNITED STATES DEPARTMENT OF THE INTERIOR i""'~ j O~ • .,~ MINES 75TH A ~
Report of Investigations 8936
Field Evaluations of Magnesium Oxide in Deep-Bed Filtration
By Daniel N. Tallman and Joseph E. Schiller
UNrrED STATES DEPARTMENT OF THE INTERIOR Donald Paul Hodel, Secretary
BUREAU OF MINES Robert C. Horton, Director
Library of Congress Cataloging in Publication Data:
Tallman, Daniel N Field evaluations of magnesium oxide in
(Bureau of Mines report of investigations; 8936)
Bi bliography: p. 10.
Supt. of Docs. po.: I 28.~3:8936.
filtration.
1. Mineral industries -Water~supply. 2. Water-Purification-Filtration. 3. Magnesia. I. Schiller, Joseph E. fI. Title. fII. Series: Report of investigations (United States. Bureau of Mines) ; 8936.
TN23. U43 l'I'N 153] 669'.1 84·600296
CONTENTS
Abstract .................. . Introduction ...............•........... Experimental method •••••• Results and discussion •••
Steel mill process water. Iron ore process water ••• Iron ore flotation plant ••
Conclusions ••• . . . . References.... • ••••••••• Appendix.--Glossary ••••••••••••••••••••
. .. . . . ..... . . . . . . . . . . . . . . . ...
. . . . . . . . . . . . . . . . . . . . . . ..... . . ............................... . . ............................... . • ••••••••••••••••••••••••••• 0 •• It ••••••
ILLUSTRATIONS
1. 2. 3.
1.
Filtration pilot plant •••••••••••••••••••••• Dynamic behavior of typical filtration run •• Pressure profiles of MgO and sand filters.
TABLE
. . . . . . . .......... . . ..... . ....................... .
Fil tration results ........................................................ .
1 2 3 5 5 8 8 9
10 11
4 7 8
6
UNIT OF MEASURE ABBREVIATIONS USED IN THIS REPORT
ft foot min minute
gal gallon mm millimeter
gal/ft 2 gallon per square foot NTU nephelometric turbidity unit
gpm gallon per minute pct percent
gpm/ft 2 gallon per minute per square foot psig pound per square inch
(gauge) h hour
rpm revolution per minute in inch
scfm/ft 2 standard cubic foot per mg/L milligram per liter minute per square foot
FIELD EVALUATIONS OF MAGNESIUM OXIDE IN DEEP·BED FILTRATION
By Daniel N. Tallman 1 and Joseph E, Schiller2
ABSTRACT
To provide technology for achieving more efficient water filtration systems for the mineral industry, the Bureau of Mines performed demonstration filtration tests at three iron ore mines and one steel mill. A comparison of equivalently sized magnesium oxide (MgO) and sand filters showed that MgO had a higher capacity and could operate at higher filtration rates than sand. In demonstration tests when alum (AlK(S04)2) was the coagulant, suspended solids breakthrough occurred even though the pressure across the filter (head loss) was 7 psig or less. Under these circumstances, the MgO demonstrated 20 to 100 pct greater filtration capacity, defined in terms of the volume of water filtered before breakthrough. When an organic floccu1ant was used at one location, head loss was the run-limiting factor; the filters essentially plugged without any solids breakthrough.
Research chemist, Twin cities Research Center, Bureau of Mines, Minneapolis, MN. 2Group supervisor, Twin Cities Research Center, Bureau of Mines, Minneapolis, MN
(now with Materials processing Corp_, st. Paul, MN).
!I'
2
INTRODUCTION
Water is an essential commodity in mining and in the mineral processing industry. Often it is necessary to treat plant effluent before recycle to meet process requirements or before discharge to meet statutory effluent limits. The Bureau of Mines is conducting research investigations to develop improved water treatment technology that will provide desired purity at minimal cost.
A common impurity in mineral processing water is suspended solids, or "cloudiness." Two methods used to remove solids are sedimentation (sometimes referred to as settling or clarification) and filtration. Many operations achieve adequate solids removal by sedimentation, but where very clean water is required, filtration is needed to remove the last traces of solids. The most economical way to filter large volumes of water is by deep-bed filtration (1).3
Deep-bed filtration, also called rapid sand filtration, is the process by which water is clarified as it is percolated through a bed of a granular medium. Although sand filtration is a very old practice, it is still the most practical method of obtaining large volumes of high-quality water from influent contalning relatively low levels of suspended solids (1). A typical mineral industry application is the polish filtering of overflow from a settling pond or clarifier prior to recycle or discharge from the plant.
. Deep-bed filtration is a cyclic batch operation that is composed of two phases: service and regeneration. Coagulants are added to the waste water stream and vigorously mixed to agglomerate the otherwise dispersed colloidal particles and to improve solids capture in the filter. The treated influent is then pumped through the filter until either the pressure differential is too great or the
3 Underlined numbers in parentheses refer to items in the list of references preceding the appendix.
suspended solids concentration in the filtrate exceeds acceptable levels. When either condition occurs, the filter is removed from service and backwashed to dislodge the trapped material. Most filtration plants use air-assisted backwashing where a stream of compressed air is added to agitate the bed more vigorously. This decreases the amount of wash water and time needed for the regeneration phase.
The depth of the filter bed and the media sizes are chosen to give a favorable tradeoff between filtrate quality and the power required to pump against expected head losses. A typical filter is comprised of a 3-ft-deep layer of sand grains of 0.04 in (1 mm) diameter.
If surges of heavy concentrations of suspended solids are a problem in a plant, multimedium filtration can be used to increase filter loading capacity. For example, in conventional dual-medium filters, a layer of coarse anthracite is added to the top of the sand bed. In this arrangement, most of the solids are trapped by the coarse medium to avoid premature loading of the sand. To be compatible, the two media must restratify when the bed is fluidized after airassisted backwashing.
Novel filter materials may also increase the capacity of a filter. The use of magnesium oxide (MgO) as a substitute for sand in the filtration of asbestos has been described previously (2). The greater efficiency of the MgO was attributed to an electrokinetic effect; the MgO surface is positively charged while most suspended particulates are negatively charged, resulting in stronger particle-to-medium bonding. The porosity of the MgO is also greater than that of equivalently sized sand, which allows more material to be deposited in the interstices.
Most of the previous work with HgO was done in small (1.0 in) diameter columns using approximately 2S gal of prepared
suspension or mine water samples (2, 3). A minimum column diameter-to-medium size ratio of 50 or greater has been suggested for reducing wall effects to acceptable levels (4). At ratios smaller than this, the bed porosity increases significantly due to packing irregularities. Therefore, the small columns, which were marginally acceptable for the minus 20- plus 30-mesh MgO tested in earlier laboratory studies, would not be applicable for filtration with a coarser medium. A substantially larger column is also required to evaluate air-assisted backwash. Bureau of Mines experience has shown that since the air bubbles are about 1 in. in diameter, a minimum column diameter of about 1 ft is required. Sample volume requirements for operating the larger column make field testing necessary_ In addition, field tests ensure that water samples used are representative.
The field test program involved the side-by-side testing of two filters filled with equivalently sized sand and MgO. Preliminary bench tests were run in the laboratory to fix most of the
operating parameters with the field tests.
3
before proceeding Choice of floccu-
lant and optimum dosage were established by jar tests. Filter grain size and depth were chosen to give reasonable run lengths based on bench filtration tests. During the field tests, these parameters were kept constant, and the filters were operated at flow rates used in conventional practice.
Tests were run at iron mines in Minnesota, Wisconsin, and Michigan and one steel mill in St. Paul, MN. Since the quality of the water to be filtered was fairly constant at each mine visited, it was possible for convenience, to operate the two columns consecutively rather than simultaneously. At the steel mill, the filters were operated in parallel because the process water quality was expected to be much less uniform. Performance comparisons were based on the volume of water filtered before breakthrough. The maximum acceptable turbidity or breakthrough point was taken as 1.0 nephelometric turbidity units (NTU).
EXPERIMENTAL METHOD
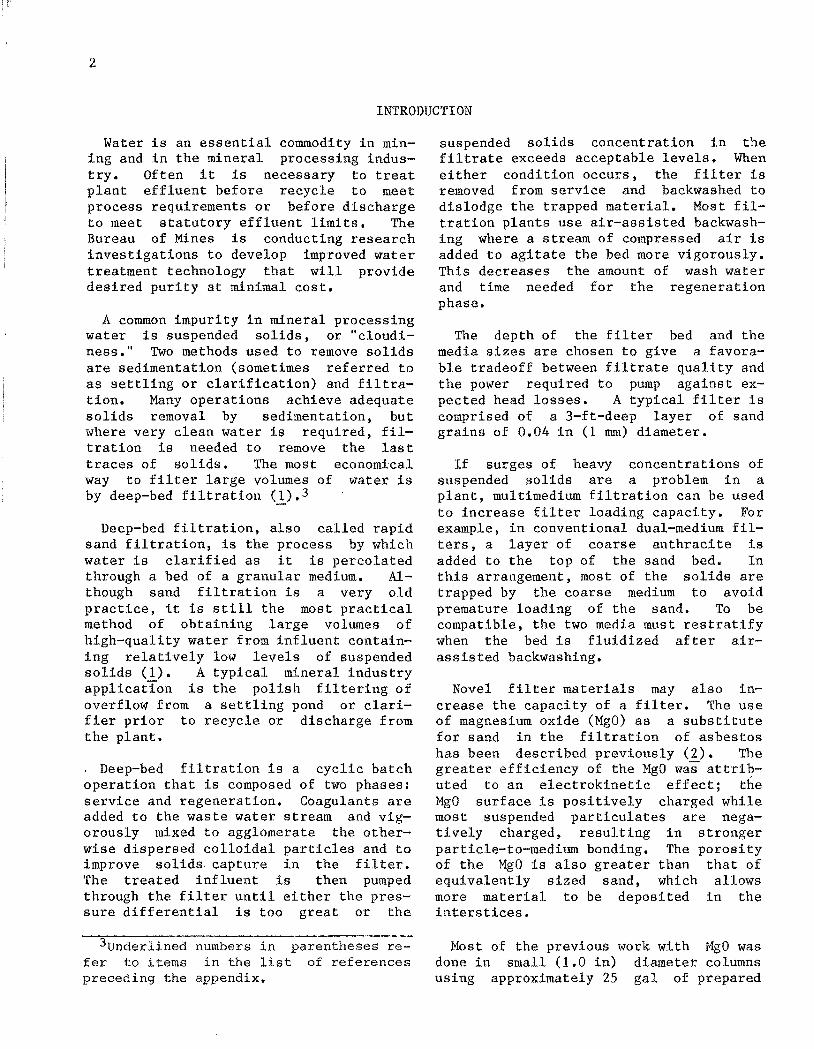
A diagram of the filtration pilot plant is shown in figure 1. During a typical test, water to be filtered was coagulated or flocculated in the mix tank and then pumped through the filter columns at a constant flowrate. A small portion of the filtrate stream was diverted for turbidity measurement. Between tests, each filter was backflushed with a reverse flow of compressed air and water which entered below the filter media support, and carried deposited material out via the inlet header. The backwash was bypassed around the pump by disconnecting the line on the discharge side of the pump. Air vents were placed at the top of the columns to reduce the pressure drop in the backwash outlet line. The filter columns were 5 ft high and had 1~
ft-OD tubes with 1/2-in-thick walls of clear acrylic plastic that permitted direct visual observation of the extent of material penetration into the filters. The filter medium, a 1.5- to 2.0-ft depth
of minus 20, plus 30 mesh sand or MgO, was supported by a perforated plastic plate that was overlaid with sO-mesh screen. The plate perforations were 1/4 in. in diameter and accounted for approximately 4 pct of the column crosssectional area. In one test, a 7- to 8-in-deep layer of minus 6, plus lO-mesh anthracite coal was added to each column to evaluate dual-medium filtration.
Flocculation was done in a 50-gal tank with a side-mounted 1/4-hp, 1,725-rpm mixer. The propeller diameter was 4.5 in. The flocculant solution was fed by a variable-speed peristaltic pump for accurate dosing. The mix tank contents were pumped through the filters by a 1/2-hp, variable-speed, rotary-screw pump. A 1/2-hp single-stage compressor provided the air necessary for backwashing. Air pressure was regulated to 15 psig ahead of the filtration columns.
4
To pressure _-1><1----,-----, transducer Air
bleed
1~~:kwaSh .-l><j ____ _
1 ~ ootlet
Mixing tank
Holding tank
r - -----..- -- t><J- - - - ~- -Backwash To
Pressure taps
wafer turbidimeter -----' '-------+
Filtrate
FIGURE 1. - Filtration pilot plant.
During each filtration test, measurements of turbidity, pressure, and flow rate were necessary for a complete performance description of the filters. A turbidimeter equipped with a flow-through cell was used to monitor filtrate quality. The cell was easily removed for periodic cleaning, recalibration, and measurement of influent samples. The turbidity output signal was relayed to a dual-channel strip-chart recorder so that a continuous and permanent record of filtrate turbidity was available for later reference. Pressure readings were taken every 15 min from gauges at the top of the column. Continuous pressure data ware input to the second channel of the chart recorder from a pressure transducer located at the top of the columns. The transducer signal also activated an automatic pump shutoff to avoid damage to the columns in the event that severe flow restriction suddenly occurred in the filters. Flow rate measurements were made by timed collection of filtrate.
Certain modifications of the system were necessary for simultaneous operation of the two columns at the steel mill. Pumps with higher flow rates and larger diameter piping were needed to accommodate the doubled flow rate. A second (holding) tank was placed downstream of the mix tank to maintain adequate residence time. The two filters were operated in the declining rate mode, where once the initial total flow rate was set, the flow to each column was governed by the gradually changing resistance in the medium (5). Flow through the turbidimeter cell from each column was alternated every 15 min by two timercontrolled solenoid valves. Pressure taps were installed at 6-in intervals to obtain a profile of head losses through each filter medium.
Backwashing was composed of combined air-water scouring of the medium followed by backflushing with water. Flow rates during the combined treatment were 4 to
10 gpm!ft 2 water and 5 to 10 scfm!ft 2
air. After 15 minJ the air flow was stopped J and the flow rate of the water was increased to 10 to 14 gpm!ft 2
for another 15 min. For the dual-medium
5
filters, the backflush rate was 14 to 15 gpm!ft 2 to restratify the media. Flow rates were varied as needed to achieve maximum agitation within the filter bed J based on visual observations.
RESULTS AND DISCUSSION
STEEL MILL PROCESS WATER
Water is essential in the production of steel from scrap. Large quantities of water are used for cooling, direct spray quenching of billets, and scale removal. Mill scale, which is largely composed of iron oxides, and tramp oils are usually present in the process water. Water is recycled at the mill where these tests were performed and contaminants are concentrated considerably by evaporation of the process water. Suspended solids cause clogging of sprayer nozzles used in the plant and also increase abrasion in plant piping. Water treatment methods employed by the company are primary and secondary settling of suspended solids,; oil skimming,; and chemical addition for pH control, bacterial inhibition, and oil breaking (emulsifying).
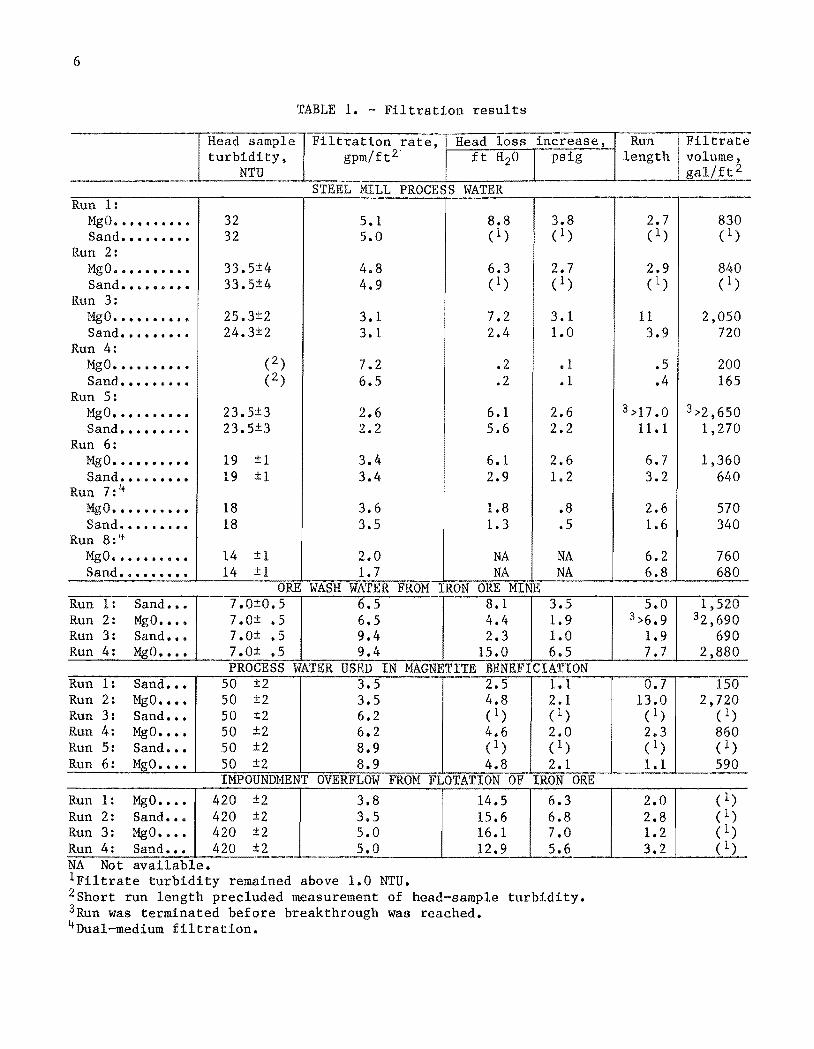
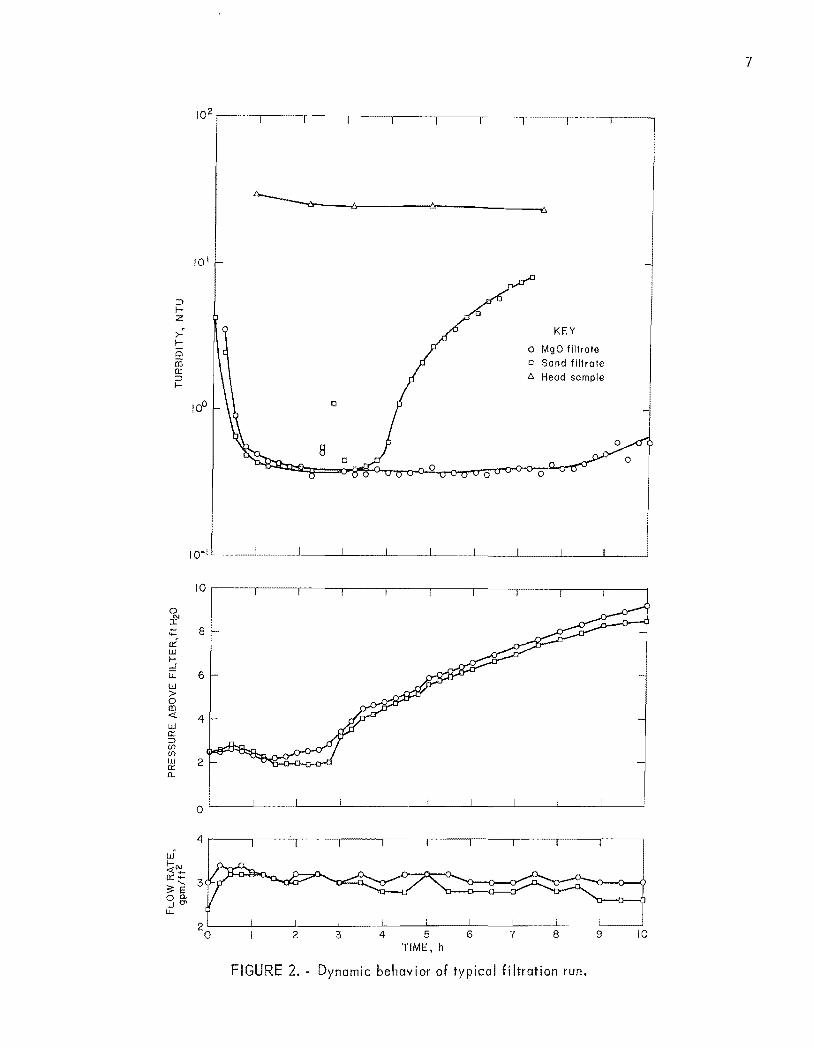
The dynamic behavior of a typical filtration run performed at this steel mill is shown in figure 2. Filtrate turbidity, flow rate, and column pressure exhibit the expected patterns of variation. The flow rate shows a gradual decrease toward the end of the run as expected with declining rate operation. The rapid rise in filtrate turbidity, observed at about 4.5 h for sand, is the typical breakthrough point observed for these filters. The pressures plotted are equivalent to the height of water above the bed necessary to maintain constant flow through a gravity filter. From these data, the volume output of each filter was determined based on the amount of water that passed through the filter during the time that the filtrate turbidity remained below 1.0 NTU. Results for all tests at the steel mill are summarized in table 1. The head loss value given is the difference between the final (taken at the breakthrough point) and the
initial pressure readings taken above the filter beds. Head losses are based on the density of water at the operating temperature, 80° F (1 psi = 2.316 ft H20). Head-sample turbidities are the average of influent grab samples taken throughout each test. (The variation shown is plus or minus one standard deviation and is not a reflection of measurement uncertainty).
Several general observations can be made from the data: (1) filtrate quality (breakthrough) rather than head loss was run limiting, (2) the MgO filter withstood higher filtration rates, and (3) the volume of water filtered by MgO before breakthrough was roughly double that of the sand filter. This represents a real capacity increase of 40 to 50 pct for the MgO filter, since the greater backwashing frequency of the sand filter would lower its net production of finished water. Run length is often limited by breakthrough when alum or other inorganic salts are used for coagUlation (~).
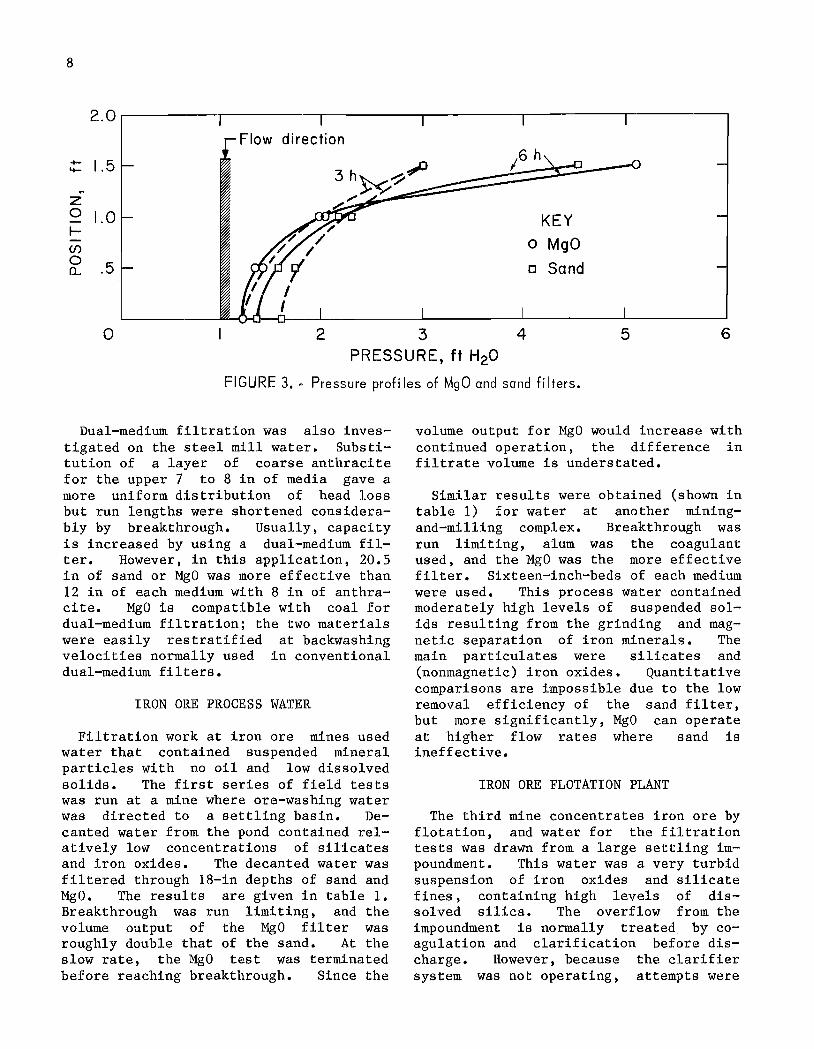
Pressure profiles from the top to the bottom of both filter beds showed that (1) most of the head loss occurred in the top 6 in of media, and (2) pressure profiles for sand and MgO were similar. (In previous filtration tests, head loss was measured across the entire depth of each filter medium, rather than throughout. Head losses through MgO were usually lower than through sand.) Results on pressure versus depth in the filter bed are shown in figure 3. The large pressure gradients at the top of the filter medium indicate that most of the solids collected in the upper portion of the filters, and increasing the depth of the media would not substantially increase loading capacity.
6
TABLE 1. - Filtration results
Head sample Filtration rate, Head loss increase, turbidity, gpm/ft 2 ft H2O I
psig NTU
STEEL MILL PROCESS WATER Run 1 :
MgO ........... 32 5.1 8.8 3.8 Sand ••.•••••• 32 5.0 ( 1 ) ( 1 )
Run 2: HgO •••••••••• 33.5±4 4.8 6.3 2.7 Sand ••••••••• 33.5±4 4.9 (1) ( 1 )
Run 3: MgO •••••••••• 25.3±2 3.1 7.2 3.1 Sand ••.••.••. 24.3±2 3.1 2.4 1.0
Run 4: MgO •••••••••• (2) 7.2 .2 .1 Sand ••••••••• (2) 6.5 .2 • 1
Run 5: MgO ........... 23.5±3 2.6 6.1 2.6 Sand ••••••••. 23.5±3 2.2 5.6 2.2
Run 6: MgO ............ 19 ±1 3.4 6. 1 2.6 Sand ••..••••• 19 ±l 3.4 2.9 1.2
Run 7: 4 MgO ........... 18 3.6 1.8 .8 Sand .••. III •••• 18 3.5 1.3 .5
Run 8: 4 MgO ........ II •• 14 ±1 2.0 NA NA Sand •••.••••• 14 ±1 1.7 NA NA
ORE WASH WATER FROM IRON ORE MINE Run 1 : Sand ••• 7.0±0.S 6.5 8.1 3.5 Run 2: MgO ..... 7.0± .5 6.5 4.4 1.9 Run 3: Sand ••• 7.0± .5 9.4 2.3 1.0 Run 4: MgO •••• 7.0± .5 9.4 15.0 6.5
PROCESS WATER USED IN MAGNETITE BENEFICIATION Run 1 : Sand ••• 50 ±2 3.5 2.5 1.1 Run 2: MgO •••• 50 ±2 3.5 4.8 2.1 Run 3: Sand ••• 50 ±2 6.2 ( 1 ) (1) Run 4: MgO •••• 50 ±2 6.2 4.6 2.0 Run 5: Sand ••• 50 ±2 8.9 (1) (1) Run 6: MgO •••• 50 ±2 8.9 4.8 2.1
IMPOUNDMENT OVERFLOW FROM FLOTATION OF IRON ORE Run 1 : MgO •••• 420 ±2 3.8 14.5 6.3 Run 2: Sand ••• 420 ±2 3.5 15.6 6.8 Run 3: MgO •••• 420 ±2 5.0 16.1 7.0 Run 4: Sand ••• 420 ±2 5.0 12.9 5.6 NA Not available. IFiltrate turbidity remained above 1.0 NTU. 2Short run length precluded measurement of head-sample turbidity. 3Run was terminated before breakthrough was reached. 4Dual-medium filtration.
Run lengt
2.7 830 ( 1 ) ( 1 )
2.9 840 ( 1 ) ( 1 )
11 2,050 3.9 720
.5 200
.4 165
3>17.0 3>2,650 11.1 1,270
6.7 1,360 3.2 640
2.6 570 1.6 340
6.2 760 6.8 680
5.0 1,520 3 >6.9 32,690
1.9 690 7.7 2,880
0.7 150 13.0 2,720
(1) ( 1 )
2.3 860 ( 1 ) ( 1 )
1.1 590
2.0 ( 1)
2.8 ( 1) 1.2 ( 1) 3.2 ( 1) -
10 1
::> f-Z
~ f-0 ii5 0:: ::> f-
10°
10-1
10
9. I - 8 --o! w I-d u.. 6 w > 0 m <:!. 4 w a:: ::> (/) (/) w 2 a:: 0..
0
4 W t:t"i. 0::--
'-:.;: E
:3 00. ...JO' u..
2 0
0
8
2 :3
-6~--------~6-~--------____ ~6
4
a
5 TIME, h
a
6 7
KEY
a MgO filtrate o Sand filtrate b. Head sample
a
8 9
FIGURE 2. - Dynamic behavior of typical filtration run.
7
10
8
2.0 Flow direction
- 1.5 3h~?" 16 h
0+-
~
Z ~". 0 1.0 KEY I-en 0 MgO 0
.5 0... c Sand
o 2 3 4 5 6 PRESSURE, ft H20
FIGURE 3 •• Pressure profi les of MgO and sand fj Iters.
Dual-medium filtration was also investigated on the steel mill water. Substitution of a layer of coarse anthracite for the upper 7 to 8 in of media gave a more uniform distribution of head loss but run lengths were shortened considerably by breakthrough. Usually, capacity is increased by using a dual-medium filter. However, in this application, 20.5 in of sand or MgO was more effective than 12 in of each medium with 8 in of anthracite. MgO is compatible with coal for dual-medium filtration; the two materials were easily restratified at backwashing velocities normally used in conventional dual-medium filters.
IRON ORE PROCESS WATER
Filtration work at iron ore mines used water that contained suspended mineral particles with no oil and low dissolved solids. The first series of field tests was run at a mine where ore-washing water was directed to a settling basin. Decanted water from the pond contained relatively low concentrations of silicates and iron oxides. The decanted water was filtered through 18-in depths of sand and MgO. The results are given in table 1. Breakthrough was run limiting, and the volume output of the MgO filter was roughly double that of the sand. At the slow rate, the MgO test was terminated before reaching breakthrough. Since the
volume output for MgO would increase with continued operation, the difference in filtrate volume is understated.
Similar results were obtained (shown in table 1) for water at another miningand-milling complex. Breakthrough was run limiting, alum was the coagulant used, and the MgO was the more effective filter. Sixteen-inch-beds of each medium were used. This process water contained moderately high levels of suspended solids resulting from the grinding and magnetic separation of iron minerals. The main particulates were silicates and (nonmagnetic) iron oxides. Quantitative comparisons are impossible due to the low removal efficiency of the sand filter, but more significantly, MgO can operate at higher flow rates where sand is ineffective.
IRON ORE FLOTATION PLANT
The third mine concentrates iron ore by flotation, and water for the filtration tests was drawn from a large settling impoundment. This water was a very turbid suspension of iron oxides and silicate fines, containing high levels of dissolved silica. The overflow from the impoundment is normally treated. by coagulation and clarification before discharge. However, because the clarifier system was not operating, attempts were
made to filter water directly from the tailings basin.
Direct filtration of the unclarified water had several significant difficulties. For these tests, a cationic polymer was chosen as the flocculant which, combined with the high concentration of suspended solids, caused excessive head loss to develop during the filtrations. The rate of head loss was lower for the sand filter than for the MgO filter. Deposits of trapped material could be observed throughout the sand filter. Conversely, all of the deposited material appeared to be confined to the upper few inches of the MgO filter, indicating poor utilization of the available filtration capacity. Eighteen inches of each medium was used. Neither filter
9
gave satisfactory effluent quality «1.0 NTU) before run termination, although in some tests the filtrate turbidity was decreasing when head loss limitations were reached (table 1). Considering the high solids loading to the filters, the 1.0 NTU limit is impractical for a single stage of treatment. Another problem encountered with this system was "mud balling." The use of polymer caused the formation of large agglomerates of floes and grains of filter media that could not be removed by backwashing. These macroparticles simply moved about on the top of the expanded filter medium rather than washing out at the top of the columns. This reduced the cross-sectional area available to subsequent filtrations. Both filters were adversely affected.
CONCLUSIONS
Comparison of MgO and sand filters of equal depth and mesh size showed that MgO has a Significantly greater filtration capacity than sand. When quantitative comparisons were possible, the volume output of the MgO filter was larger by 20 to 100 pet. Operation at increased flow rates decreased the volume output per run for both sand and MgO, but the MgO filter was significantly more tolerant of increased filtration rates. When alum coagulation preceded filtration, breakthrough was run limiting. Head loss was run limiting when organic flocculant was used. Medium size, flocculant dosage, suspended solids concentration, and flow rate must be carefully matched when using organic flocculants to avoid excessive
head loss and backwashing. MgO is compatible with coal for dual-medium filtration and presents no unique backwashing problems •
Future bench-scale and pilot-plant tests should include the determining of pressure profiles for evaluating filters. Filters that develop large pressure gradients are relatively inefficient, since much of the media depth is poorly utilized.
Process waste waters treated to date indicate that MgO has wide application in the mineral industry and that tests, as described herein, should be conducted to evaluate each potential new application.
10
REFERENCES
1. Tien, C., and A. C. Payatakes. Advances in Deep Bed Filtration. Am. Inst. of Chem. Eng., v. 25, No.5, 1979, pp. 737-757.
2. Schiller, J. E., and S. E. Khalafalla. Filtration of Asbestos and Other Solids With Magnesium Oxide. Min. Eng., v. 35, No.3, 1983, p. 237.
3. Magnesium Oxide - A Superi-or Deep Bed Filter Medium," Pres. at 17th Great Lakes Regional Am. Chem. Soc. Meeting (St. Paul, MN, June 1-3, 1983); available from D. N. Tallman, BuMines, Minneapolis, MN.
4. Ives, K. J. Deep Bed Fil tration: Theory and Practice. Filtration and Separation, v. 17, 1980, p. 157.
5. Cleasby, J. L., Wastewater Filtration ations. EPA Technol. 1974, 48 pp.
and E. K. Baumann. Design Consider
Transfer 4007,
6. McCabe, W. L., and J. C. Smith. Mechanical Separations. Ch. in Chemical Engineering. McGraw-Hill, 1967, pp. 865-938.
7. Daniels, S. Theory and Practice of Solid-Liquid Separation. Ch. in Coagulation and Flocculation, ed. by F. Tiller. Univ. Houston, Houston, TX, 2d ed., 1975, pp. 135-169.
8. Franson, M. A. (ed.). Turbidity. Ch. in Standard Methods for the Examination of Water and Wastewater. Am. Public Health Assoc., Washington, DC, 14th ed., 1975, pp. 131-139.
11
APPENDIX.--GLOSSARY
Backwash. - Regeneration or a filter by a reverse flow Flow rates are usually high fluidize the bed.
cleaning of of water. enough to
Breakthrough. - The appearance of unacceptably high concentrations of solids in the filtrate.
Cake filtration. - Removal of solid particles from a fluid by passing it through a filtering medium, or septum, on which the solids are deposited (6). The dominant removal mechanism is straining by the medium and by the resulting solids deposit (cake). Generally used to dewater dense suspensions (>2000 mg/L solids) or slurries <.!).
Capacity. - The ability of a filter to capture and store suspended solids. A useful measure of capacity is the mass of solids captured per unit area of filter, in pounds per square foot. Filtrate volume is a useful and convenient relative measure of capacity for a series of tests run at constant influent concentration.
Coagulation. - Conversion of colloidal «0.001 mm) and dispersed (0.001 to 0.1 mm) particles into small visible floc (0.1 to 1 mm) by addition of a simple electrolyte. Addition of electrolyte decreases the magnitude of the electrical repulsion between particles thereby destabilizing them. Dissolved salts such as ferric chloride, aluminum sulfate, and lime are three common coagulants (1).
Declining rate method. A passive method of operating mUltiple filters in parallel, which allows the flow split to each filter to be controlled by the available driving force (either pump
,zU.5. GPO: 1985-505-019/20,027
capacity or gravity head) and the head loss in each filter (1).
Deep-bed filtration. - The removal of suspended solids from a suspension by percolation through a porous bed of granular material. Particles are deposited at various levels in the filter by a variety of transport and bonding mechanisms (1, 4). Deep-bed filtration is usually limited to relatively dilute suspensions «500 mg/L) of fine- or colloidal-size particles (~).
Filtration rate. - Superficial tyj volumetric flow rate divided ter cross-sectional area.
velociby fil-
Flocculation. - The further agglomeration of small, slowly settling floes and particles into large (1 to 10 mm) rapidly settling flocs by addition of organic po1ye1ectrolytes (1).
Head loss. - The frictional (viscous) dissipation of mechanlcal energy by a moving fluid, usually measured as a pressure drop.
NTU. - Nephelometric turbidity unit, a measure of turbidity based on the intensity of light scattered at right angles to the incident light beam <.~).
Run length. - The length of time that a filter is in service before backwashing.
Run limiting. Factors that limit run length, usually head loss or breakthrough. An operational optimum is said to occur when both limitations are reached simultaneously (1, 4). In practice, filters are usually backflushed at preset time intervals.
INT.-BU.OF MINES,PGH.,PA. 2.792.3