Embed Size (px)
Citation preview
Field Guide for Evaluation: How to Develop an Effective Terms of Reference
June 2014
Results and Measurement
Field Guide for Evaluation: How to Develop an Effective
Terms of Reference
Pact, Inc.
Washington, DC
Copyright © 2014 by Pact, Inc.
This work is licensed under the Creative Commons Attribution-ShareAlike 4.0 International License.
To view a copy of this license, visit http://creativecommons.org/licenses/by-sa/4.0/ or send a letter to Creative Commons, 444 Castro Street, Suite 900, Mountain
View, California, 94041, USA.
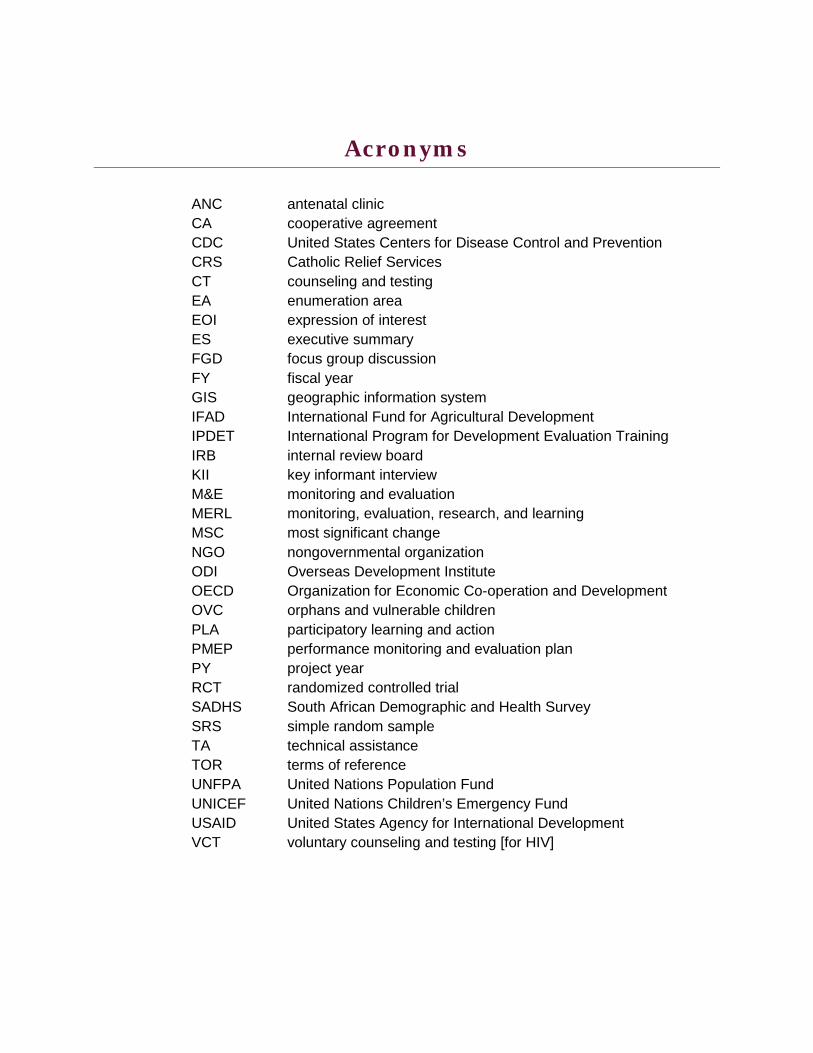
Acronyms ANC antenatal clinic CA cooperative agreement CDC United States Centers for Disease Control and Prevention CRS Catholic Relief Services CT counseling and testing EA enumeration area EOI expression of interest ES executive summary FGD focus group discussion FY fiscal year GIS geographic information system IFAD International Fund for Agricultural Development IPDET International Program for Development Evaluation Training IRB internal review board KII key informant interview M&E monitoring and evaluation MERL monitoring, evaluation, research, and learning MSC most significant change NGO nongovernmental organization ODI Overseas Development Institute OECD Organization for Economic Co-operation and Development OVC orphans and vulnerable children PLA participatory learning and action PMEP performance monitoring and evaluation plan PY project year RCT randomized controlled trial SADHS South African Demographic and Health Survey SRS simple random sample TA technical assistance TOR terms of reference UNFPA United Nations Population Fund UNICEF United Nations Children’s Emergency Fund USAID United States Agency for International Development VCT voluntary counseling and testing [for HIV]
Foreword
Over time, evaluation has become increasingly important at Pact. An updated evaluation policy released in 2014 guides our programs in the requirements and expectations for evaluation. Module 3: Field Guide for Evaluation: How to Develop an Effective Terms of Reference, finalized in 2014 by our Results and Measurement team, provides a basic overview of evaluation concepts and gives those who commission and manage evaluations an overview of best practices for planning, implementing, and managing the overall process of an evaluation.
A slide set accompanying the module provides an opportunity to engage in practical exercises to test the skills outlined in this text.
How to Use This Module A practical guide to managing and leading evaluation efforts, this module is designed for use in evaluations within your organization and among your partners. Increasing local capacity to conduct and manage good program evaluation is a key goal of the Results and Measurement team at Pact. The copyright under a Creative Commons agreement encourages you to use, remix, and adapt all Pact materials as you see fit, with attribution to Pact.
Each chapter’s learning objectives and exercises relate to sections of Pact’s evaluation protocol, and each chapter builds on the previous one. By the end of the module, if you have worked your way through the exercises, you should have a comprehensive, written plan for your evaluation—that is, a full terms of reference (TOR). In addition, a TOR template can be found in Appendix 1 (page 90). The shaded boxes that introduce and give an overview of each chapter refer to relevant sections of this template.
The closing pages of each chapter link you to the wealth of further resources available on the Internet. I encourage all practitioners to use these resources to keep your knowledge of evaluation up to date and growing, in order to deepen your practice and bring your increasing skills to the programs serving the communities we care about.
Kerry Bruce
Senior Director, Global Health and Measurement
PAGE 4

Acknowledgements
This module was inspired by Dr. Rita Sonko and her team in South Africa. Sensing a general
apprehension of managing and participating in evaluation, they developed, with their partners,
a similar training module: Key Considerations for Managing Evaluations, Brief Reference
Guide.
The early draft of this manual was written by Mollie Williams, pulling material and structure
from Dr. Sonko’s work and enriching it with addition of ideas from the literature on evaluation
from both best practices and academia.
Alison Koler and Jade Lamb both worked to finalize the content and format of the document,
bringing it into its final shape and form. The slide set accompanying this module was developed
by Alison Koler, Jade Lamb, and Joris Vandelanotte; Samuel Kudhlande from Pact Swaziland
provided review and feedback on these slides. This curriculum was pilot tested with Pact
Swaziland, its partners, and staff from Pact Tanzania and Pact Zimbabwe; valuable feedback
from this pilot has been incorporated into this current document.
Copyediting and formatting expertise was provided by Karen Cure.
PAGE 5
Contents
Acronyms ............................................................................................................... 3
Foreword ............................................................................................................... 4
Acknowledgements ................................................................................................. 5
Contents ................................................................................................................ 6
Tables ................................................................................................................................. 10 Figures ............................................................................................................................... 10
Chapter 1: What Is Evaluation? ............................................................................. 11
Defining Evaluation ........................................................................................................... 11 Systematic ................................................................................................................ 12 Specific ..................................................................................................................... 12 Versatile .................................................................................................................... 12
Evaluation versus Research ............................................................................................... 12 Why Evaluate? ................................................................................................................... 13 Types of Evaluation............................................................................................................ 13 Internal and External Evaluation ...................................................................................... 14 Involving Stakeholders in Evaluation ................................................................................ 14
Participatory Evaluation .......................................................................................... 15 Common Pitfalls ....................................................................................................... 15
Monitoring and Evaluation ................................................................................................ 15 Barriers to Evaluation ........................................................................................................ 16 Summary ............................................................................................................................ 16 Resources ........................................................................................................................... 17 EXERCISES ....................................................................................................................... 18
#1: Why Should Your Organization Invest in Evaluation? ...................................... 18 #2: Barriers To Evaluation ....................................................................................... 18
Chapter 2: Evaluation Purpose and Questions ...................................................... 19
The Terms of Reference ..................................................................................................... 19 Focusing the Evaluation ................................................................................................... 20
Steps to Focus the Evaluation ................................................................................. 20 Logic Models ..................................................................................................................... 20 Key Assumptions .............................................................................................................. 22 Stakeholder Engagement .................................................................................................. 22 Writing an Evaluation Purpose Statement ....................................................................... 23 Evaluation Questions ........................................................................................................ 23
Evaluation Questions Versus Evaluation Purpose .................................................. 23
PAGE 6
Steps to Develop Evaluation Questions .................................................................. 24 Types of Evaluation Questions ......................................................................................... 24
Descriptive Questions ............................................................................................. 24 Normative Questions ...............................................................................................25 Cause–Effect Questions ...........................................................................................25 An Optimal Mix ........................................................................................................25
Summary ........................................................................................................................... 26 Resources .......................................................................................................................... 26 EXERCISES ....................................................................................................................... 27
#3: Stakeholder Analysis .......................................................................................... 27 #4: Writing Evaluation Purpose Statement ............................................................. 27 #5: Prioritizing Evaluation Questions ...................................................................... 27 Prioritizing Evaluation Questions ........................................................................... 28
Chapter 3: Overview of Evaluation Design and Methods ..................................... 29
What is Evaluation Design? .............................................................................................. 29 Overview of Approaches ................................................................................................... 29 Quantitative Approaches .................................................................................................. 29
Experimental Design ............................................................................................... 30 Quasi-experimental Design ..................................................................................... 30 Nonexperimental/Observational Design ................................................................ 32
Qualitative Approaches ..................................................................................................... 32 Mixed Approaches ............................................................................................................ 33 Choosing a Design ............................................................................................................. 34 What Is Good Basic Design? .............................................................................................. 35 Designing Survey Instruments and Interview Guides ...................................................... 36 Summary ........................................................................................................................... 36 Resources .......................................................................................................................... 36 EXERCISES ...................................................................................................................... 38
#6: Developing a Planning Matrix .......................................................................... 38 Template for an Evaluation Planning Matrix ......................................................... 39
Chapter 4: Data Sources and Collection Methods ................................................. 40
Considering Data Collection Methods .............................................................................. 40 Existing Records ............................................................................................................... 40
Additional Information on Using Existing Data ...................................................... 41 Surveys ............................................................................................................................... 41
Additional Information on Developing and Conducting Surveys ............................ 41 Direct Measurement ......................................................................................................... 42
Additional Information on Direct Measurements .................................................. 42 Observation ....................................................................................................................... 42
Additional Information on Collecting Data by Observation ................................... 42 Key-Informant Interviews ................................................................................................ 43
Additional Information on Conducting Key Informant Interviews ........................ 43
PAGE 7
Focus Group Discussions .................................................................................................. 43 Additional Information on Conducting Focus Group Discussions ......................... 44
Most Significant Change ................................................................................................... 44 Additional Information on Conducting Most Significant Change Evaluation........ 44
Outcome Mapping .............................................................................................................45 Additional Information on Conducting Outcome Mapping ....................................45
Mapping .............................................................................................................................45 Participatory Mapping .............................................................................................45 Transect Walk...........................................................................................................45 Additional Information on Mapping ....................................................................... 46
Selecting the Right Approach and Methods ...................................................................... 47 Ethical Review ................................................................................................................... 47 Summary ............................................................................................................................ 47 Resources .......................................................................................................................... 48 EXERCISE ........................................................................................................................ 49
#7: Evaluation Design via Round Robin Conversations ......................................... 49
Chapter 5: Sampling ............................................................................................ 50
Why Sampling Matters ..................................................................................................... 50 Units of Analysis ............................................................................................................... 50 Definition ........................................................................................................................... 51 Probability Sampling ......................................................................................................... 51
Sampling Frames...................................................................................................... 51 Sample Size ..............................................................................................................52 Sampling Methods ...................................................................................................52 Common Pitfalls to Avoid in Probability Sampling ................................................. 55
Nonprobability Sampling Techniques ............................................................................... 55 Purposive Sampling ................................................................................................. 55 Sample Size for Nonprobability Sampling ...............................................................56
Choosing a Sampling Strategy ...........................................................................................56 Summary ............................................................................................................................ 57 Resources ........................................................................................................................... 57 EXERCISE ........................................................................................................................ 58
#8: Choosing an Appropriate Sample ..................................................................... 58
Chapter 6: Basic Data Analysis .............................................................................. 59
What Is Data Analysis? ......................................................................................................59 Planning for Data Analysis ................................................................................................59 Analyzing Quantitative Data ............................................................................................. 60
Prepare the Quantitative Data ................................................................................ 60 Conduct the Analysis ................................................................................................ 61 Present the Quantitative Data ................................................................................. 63
Analyzing Qualitative Data ............................................................................................... 64 Prepare the Qualitative Data ................................................................................... 64
PAGE 8
Code and Analyze the Qualitative Data ................................................................... 64 Present the Qualitative Data ....................................................................................65
Summary ............................................................................................................................65 Resources ...........................................................................................................................65 EXERCISES ...................................................................................................................... 66
#9: Quantitative Data Analysis ............................................................................... 66 #10: Qualitative Data Analysis ................................................................................ 66
Chapter 7: Using and Communicating the Results ................................................ 67
Using Evaluation Results ................................................................................................... 67 Evaluation Report .............................................................................................................. 67
Selected Criteria to Ensure Quality of the Evaluation Report ................................ 68 Excerpted from US Agency for International Development, 2011.......................... 68
Dissemination of Evaluation Results ................................................................................. 71 Summary ............................................................................................................................ 72 EXERCISE ......................................................................................................................... 73
#11: Communicating and Reporting Evaluation Results ......................................... 73
Chapter 8: Managing the Evaluation ..................................................................... 75
Multifaceted Responsibilities ............................................................................................ 75 Pre-Evaluation Planning .................................................................................................... 75 Developing Terms of Reference ......................................................................................... 77 Budgeting ........................................................................................................................... 77
Costs to Anticipate ................................................................................................... 77 When, Who, and How Much .................................................................................... 77 Common Pitfalls ...................................................................................................... 78
The Evaluation Team ........................................................................................................ 78 How to Choose an Outside Evaluator ..................................................................... 78
Managing Consultants ...................................................................................................... 80 Requiring Special Attention ..................................................................................... 81
Managing Approvals .......................................................................................................... 81 Summary ........................................................................................................................... 82 Resources .......................................................................................................................... 82 EXERCISE ........................................................................................................................ 83
#12: Bibliography .................................................................................................... 83
Glossary ............................................................................................................... 84
References ........................................................................................................... 86
Resources: For Further Reading ......................................................................................... 87
Appendix 1: Evaluation Terms of Reference Template ......................................... 90
PAGE 9
Tables Table 1—Differences in research and evaluation (Fitzpatrick, Sanders, and Worthen, 2011). ..... 13
Table 2—Characteristics of monitoring and evaluation compared
(adapted from Jaszczolt, Potkański, and Alwasiak 2003) ............................................. 16
Table 3—Sample stakeholder analysis grid. ................................................................................. 22
Table 4—Features of qualitative and quantitative approaches. ................................................... 33
Table 5—Sample design matrix template (adapted from World Bank 2007) .............................. 35
Table 6—Decision checklist for determining suitability of an evaluation method. ...................... 46
Table 7—Units of analysis for different evaluation questions ...................................................... 50
Table 8—Sample descriptive statistic dummy table. .................................................................... 59
Table 9—Sample quantitative dummy table. ................................................................................ 60
Table 10—Sample qualitative data dummy table. ........................................................................ 60
Table 11—Sample data set. ............................................................................................................. 61
Table 12—Summary measures of quantitative data (adapted from University
of Nairobi Applied Nutrition Program 1999). ............................................................... 62
Table 13—Checklist to assess the quality of an evaluation report (adapted from Miron 2004). . 69
Table 14—Dissemination plan matrix. ........................................................................................... 71
Table 15—Sample of a complete, well-organized bibliography. ................................................... 76
Figures Figure 1—Visualization of an if–then statement. .......................................................................... 21
Figure 2—Basic format of a logic model. ....................................................................................... 21
Figure 3—Sample bar graph. ........................................................................................................ 63
Figure 4—Sample line graph. ........................................................................................................ 63
Figure 5—Sample table. ................................................................................................................ 63
Figure 6—Representative call for expressions of interest. ........................................................... 80
PAGE 10
Chapter 1: What Is Evaluation?
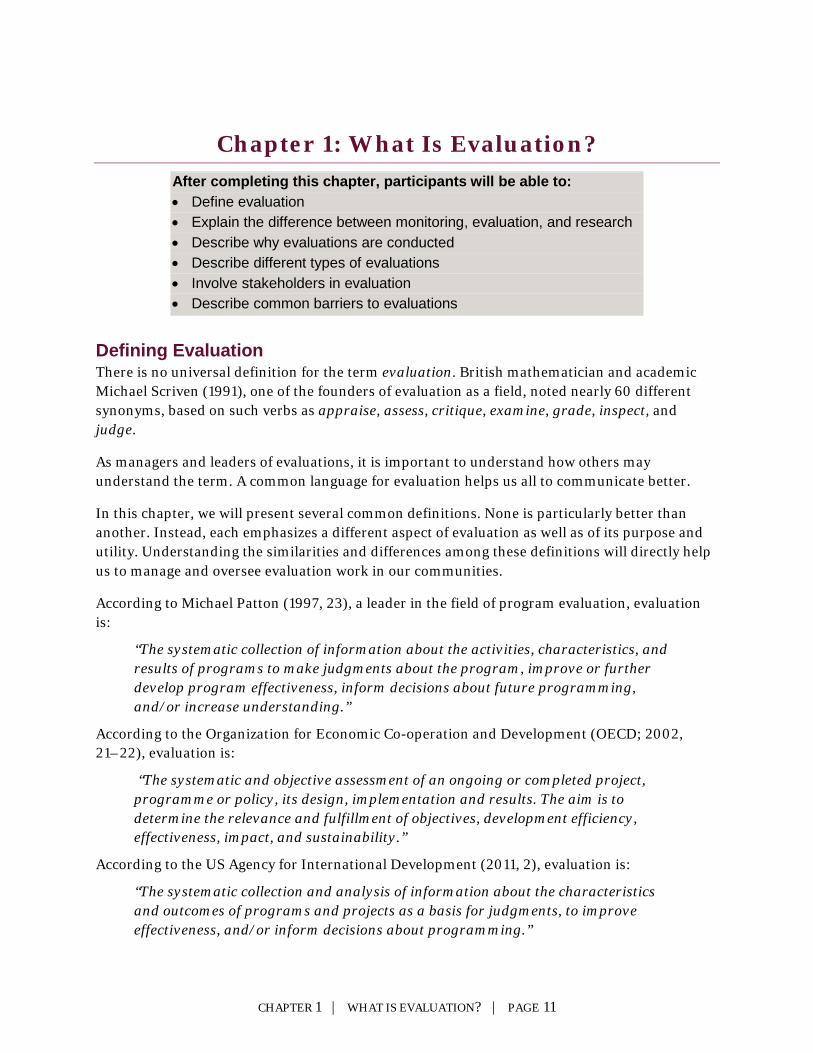
After completing this chapter, participants will be able to: • Define evaluation • Explain the difference between monitoring, evaluation, and research • Describe why evaluations are conducted • Describe different types of evaluations • Involve stakeholders in evaluation • Describe common barriers to evaluations
Defining Evaluation There is no universal definition for the term evaluation. British mathematician and academic Michael Scriven (1991), one of the founders of evaluation as a field, noted nearly 60 different synonyms, based on such verbs as appraise, assess, critique, examine, grade, inspect, and judge.
As managers and leaders of evaluations, it is important to understand how others may understand the term. A common language for evaluation helps us all to communicate better.
In this chapter, we will present several common definitions. None is particularly better than another. Instead, each emphasizes a different aspect of evaluation as well as of its purpose and utility. Understanding the similarities and differences among these definitions will directly help us to manage and oversee evaluation work in our communities.
According to Michael Patton (1997, 23), a leader in the field of program evaluation, evaluation is:
“The systematic collection of information about the activities, characteristics, and results of programs to make judgments about the program, improve or further develop program effectiveness, inform decisions about future programming, and/or increase understanding.”
According to the Organization for Economic Co-operation and Development (OECD; 2002, 21–22), evaluation is:
“The systematic and objective assessment of an ongoing or completed project, programme or policy, its design, implementation and results. The aim is to determine the relevance and fulfillment of objectives, development efficiency, effectiveness, impact, and sustainability.”
According to the US Agency for International Development (2011, 2), evaluation is:
“The systematic collection and analysis of information about the characteristics and outcomes of programs and projects as a basis for judgments, to improve effectiveness, and/or inform decisions about programming.”
CHAPTER 1 | WHAT IS EVALUATION? | PAGE 11
In common, all the preceding definitions assert that evaluation is systematic; that it is specific to a program or project; and that it can answer different types of questions.
Systematic First, evaluation is systematic. In other words, evaluation is grounded in a system, method, or plan. To arrive at credible conclusions, a high-quality evaluation uses consistent methods that are clearly outlined in the evaluation design. In this way, evaluation is closely related to research, and both research and evaluation use many of the same tools.
Specific Next, evaluation is specific to a program or project. This is what distinguishes evaluation from research. For example, someone might investigate whether children who live near the garbage dump get sick more often than children who live far from the dump. This is research, but it is not evaluation. Another person could study whether children who attend a certain nutrition program get sick less often. Both studies are research, but only the second example is specific to a project; thus, only the second example is an evaluation.
Versatile The three definitions also show that evaluation can answer many different types of questions—and knowing what questions to ask is always important to an evaluation manager. For instance, an evaluation may ask:
• Did the program improve the well-being of community residents? • Were resources used effectively? • What factors were most important to the success of the intervention? • Why did the program fail?
Evaluation versus Research Both research and evaluation systematically seek answers to questions; in fact, they use many of the same techniques to answer those questions. However, their purposes sometimes differ. Research usually seeks to create new and generalizable knowledge or understanding; evaluation seeks to inform decisions and judgments about a specific project (Table 1, next page).
CHAPTER 1 | WHAT IS EVALUATION? | PAGE 12
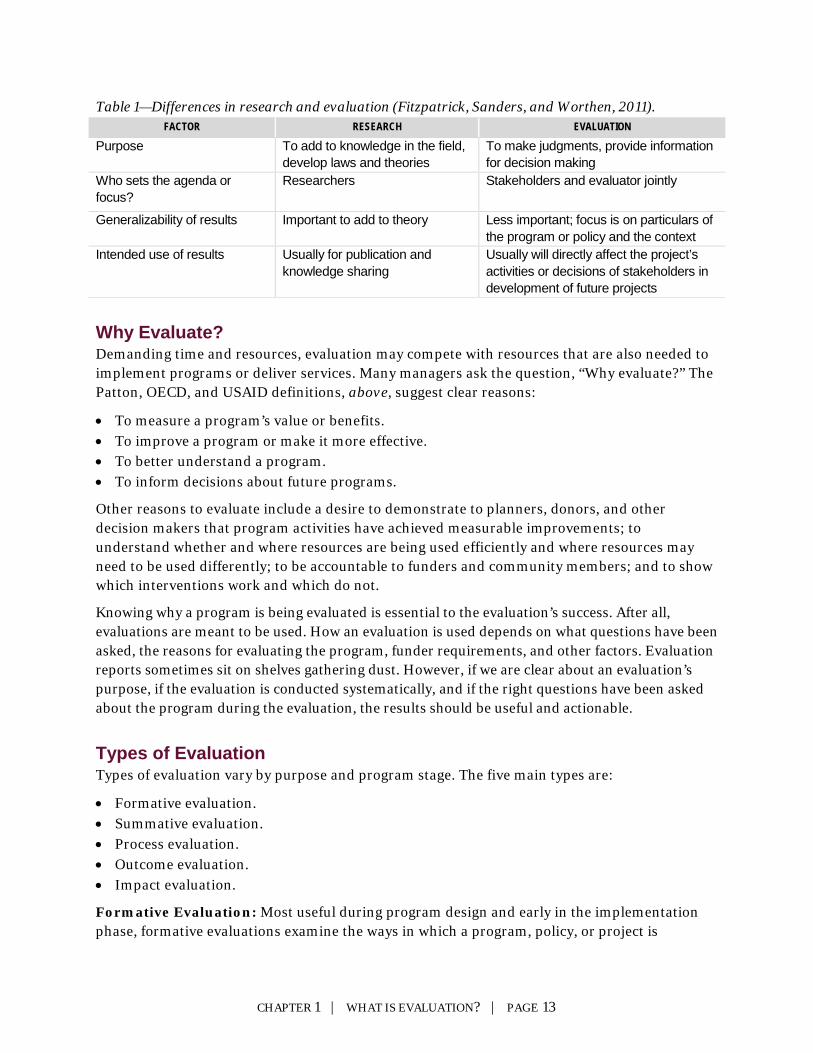
Table 1—Differences in research and evaluation (Fitzpatrick, Sanders, and Worthen, 2011). FACTOR RESEARCH EVALUATION
Purpose To add to knowledge in the field, develop laws and theories
To make judgments, provide information for decision making
Who sets the agenda or focus?
Researchers Stakeholders and evaluator jointly
Generalizability of results Important to add to theory Less important; focus is on particulars of the program or policy and the context
Intended use of results Usually for publication and knowledge sharing
Usually will directly affect the project’s activities or decisions of stakeholders in development of future projects
Why Evaluate? Demanding time and resources, evaluation may compete with resources that are also needed to implement programs or deliver services. Many managers ask the question, “Why evaluate?” The Patton, OECD, and USAID definitions, above, suggest clear reasons:
• To measure a program’s value or benefits. • To improve a program or make it more effective. • To better understand a program. • To inform decisions about future programs.
Other reasons to evaluate include a desire to demonstrate to planners, donors, and other decision makers that program activities have achieved measurable improvements; to understand whether and where resources are being used efficiently and where resources may need to be used differently; to be accountable to funders and community members; and to show which interventions work and which do not.
Knowing why a program is being evaluated is essential to the evaluation’s success. After all, evaluations are meant to be used. How an evaluation is used depends on what questions have been asked, the reasons for evaluating the program, funder requirements, and other factors. Evaluation reports sometimes sit on shelves gathering dust. However, if we are clear about an evaluation’s purpose, if the evaluation is conducted systematically, and if the right questions have been asked about the program during the evaluation, the results should be useful and actionable.
Types of Evaluation Types of evaluation vary by purpose and program stage. The five main types are:
• Formative evaluation. • Summative evaluation. • Process evaluation. • Outcome evaluation. • Impact evaluation.
Formative Evaluation: Most useful during program design and early in the implementation phase, formative evaluations examine the ways in which a program, policy, or project is
CHAPTER 1 | WHAT IS EVALUATION? | PAGE 13
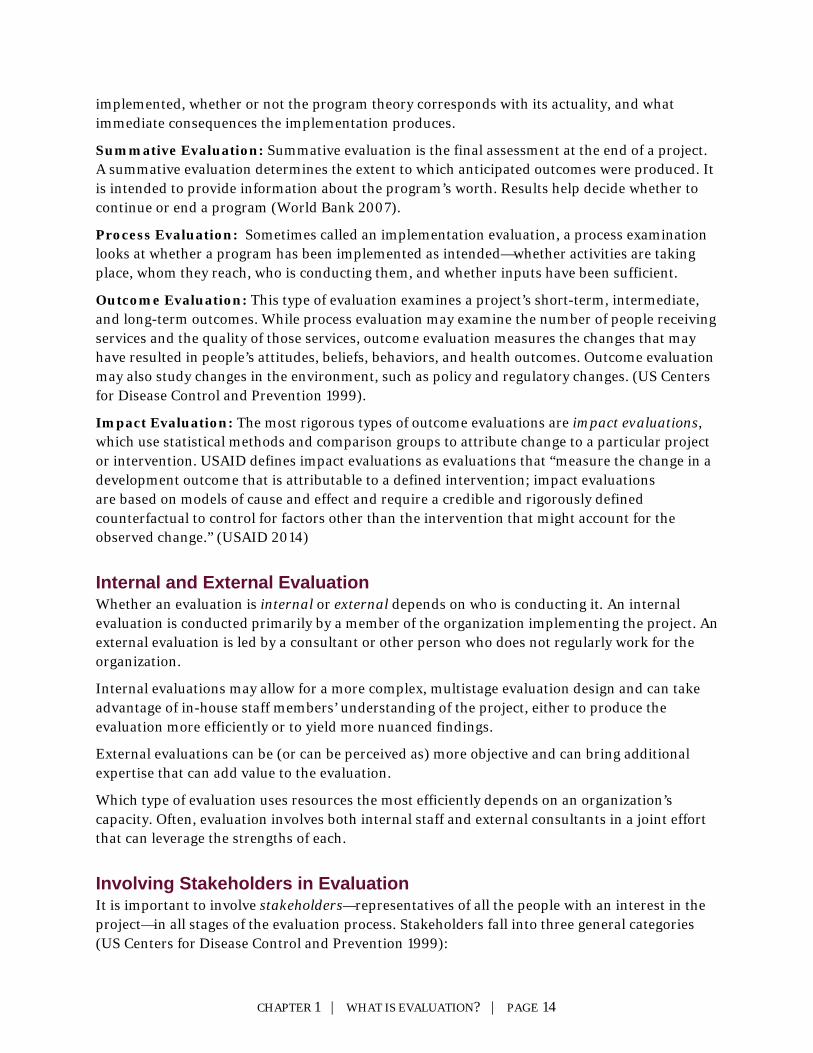
implemented, whether or not the program theory corresponds with its actuality, and what immediate consequences the implementation produces.
Summative Evaluation: Summative evaluation is the final assessment at the end of a project. A summative evaluation determines the extent to which anticipated outcomes were produced. It is intended to provide information about the program’s worth. Results help decide whether to continue or end a program (World Bank 2007).
Process Evaluation: Sometimes called an implementation evaluation, a process examination looks at whether a program has been implemented as intended—whether activities are taking place, whom they reach, who is conducting them, and whether inputs have been sufficient.
Outcome Evaluation: This type of evaluation examines a project’s short-term, intermediate, and long-term outcomes. While process evaluation may examine the number of people receiving services and the quality of those services, outcome evaluation measures the changes that may have resulted in people’s attitudes, beliefs, behaviors, and health outcomes. Outcome evaluation may also study changes in the environment, such as policy and regulatory changes. (US Centers for Disease Control and Prevention 1999).
Impact Evaluation: The most rigorous types of outcome evaluations are impact evaluations, which use statistical methods and comparison groups to attribute change to a particular project or intervention. USAID defines impact evaluations as evaluations that “measure the change in a development outcome that is attributable to a defined intervention; impact evaluations are based on models of cause and effect and require a credible and rigorously defined counterfactual to control for factors other than the intervention that might account for the observed change.” (USAID 2014)
Internal and External Evaluation Whether an evaluation is internal or external depends on who is conducting it. An internal evaluation is conducted primarily by a member of the organization implementing the project. An external evaluation is led by a consultant or other person who does not regularly work for the organization.
Internal evaluations may allow for a more complex, multistage evaluation design and can take advantage of in-house staff members’ understanding of the project, either to produce the evaluation more efficiently or to yield more nuanced findings.
External evaluations can be (or can be perceived as) more objective and can bring additional expertise that can add value to the evaluation.
Which type of evaluation uses resources the most efficiently depends on an organization’s capacity. Often, evaluation involves both internal staff and external consultants in a joint effort that can leverage the strengths of each.
Involving Stakeholders in Evaluation It is important to involve stakeholders—representatives of all the people with an interest in the project—in all stages of the evaluation process. Stakeholders fall into three general categories (US Centers for Disease Control and Prevention 1999):
CHAPTER 1 | WHAT IS EVALUATION? | PAGE 14
• People involved in program operations (e.g., staff, partners, funders). • People served by or affected by the program (e.g., clients, community members, officials). • People who intend to use the evaluation results (e.g., staff, funders, general public).
There are many resources to help an evaluation team think through how to identify and engage stakeholders and engaging stakeholders will be discussed in more detail in Chapter 2.
Whether stakeholders are beneficiaries, project implementers, funders, or another audience, it is important to identify and understand them. Research has demonstrated the value of the personal factor, and a key component to successful use of evaluations is “the presence of an identifiable individual or group of people who personally care about the evaluation and the finding it generates. Where such a person or group was present, evaluations were used; where the personal factor was absent, there was a correspondingly marked absence of evaluation impact” (Patton 1997, 44).
Participatory Evaluation Program clients or beneficiaries are important in an evaluation: They are not only a source of information, but also can be active participants in all key evaluation processes, including design, planning, data collection, analysis, and reporting (Gariba and Durand 2007).
There are many advantages to such participatory evaluation—among them:
• Evaluators gain a better understanding of stakeholder perspectives. • Beneficiaries help hold an organization accountable for the results of its program. • Participatory evaluation can help create an environment of trust and transparency. • It cultivates evaluative thinking and fuels ongoing learning. • It can stimulate innovative ways of measuring outcomes and help clarify indicators. • Participatory evaluation often leads to participatory decision making.
Common Pitfalls Knowing who cares about the evaluation and involving them in the process increase the chances of the evaluation being useful and used. Avoid these pitfalls (Patton, 1997):
• Making yourself or the evaluator the primary stakeholder. • Identifying vague, passive audiences as users of the evaluation, instead of real people. • Targeting organizations as users instead of specific persons. • Focusing on decisions instead of on decision makers. • Automatically assuming the funder is the primary stakeholder. • Waiting until the evaluation is finished to identify its uses and users.
Monitoring and Evaluation Sometimes the terms monitoring and evaluation are used synonymously. Although it is important to both monitor a project and evaluate it, the two activities are not the same (Table 2, next page). Monitoring is primarily intended to provide information about a project’s operations and outputs. Evaluation generally looks at a project on a broader level, assessing whether it is meeting strategic goals. Sometimes, monitoring data can be useful in evaluations, and some
CHAPTER 1 | WHAT IS EVALUATION? | PAGE 15
evaluations are primarily oriented toward assessing operations or process. Consequently, monitoring and evaluation are often linked and can be complementary.
Barriers to Evaluation If evaluation is important, why does it not always happen or happen well? What stands in the way? Among other factors:
• Lack of time, knowledge, and skills. • Lack of resources for evaluation, including a restrictive budget. • Poor project design—for example, evaluation activities were not planned beforehand. • Start-up activities competing with baseline measurements or delaying baseline measurement. • Project capacity overwhelmed by complex or overly ambitious evaluation designs. • Fear of the consequences of negative findings. • The perception of monitoring and evaluation as “police work”—that is, a fault-finding
exercise. • Arguments by stakeholders that monitoring and evaluation resources would be better spent
on program expansion. • Difficulty in convincing others how useful evaluation will be as a learning exercise. • The perception that because no baseline data was collected, it is too late to evaluate.
Barriers to program evaluation are worth overcoming. Learning what works and what does not enables us to better serve the needs of our communities.
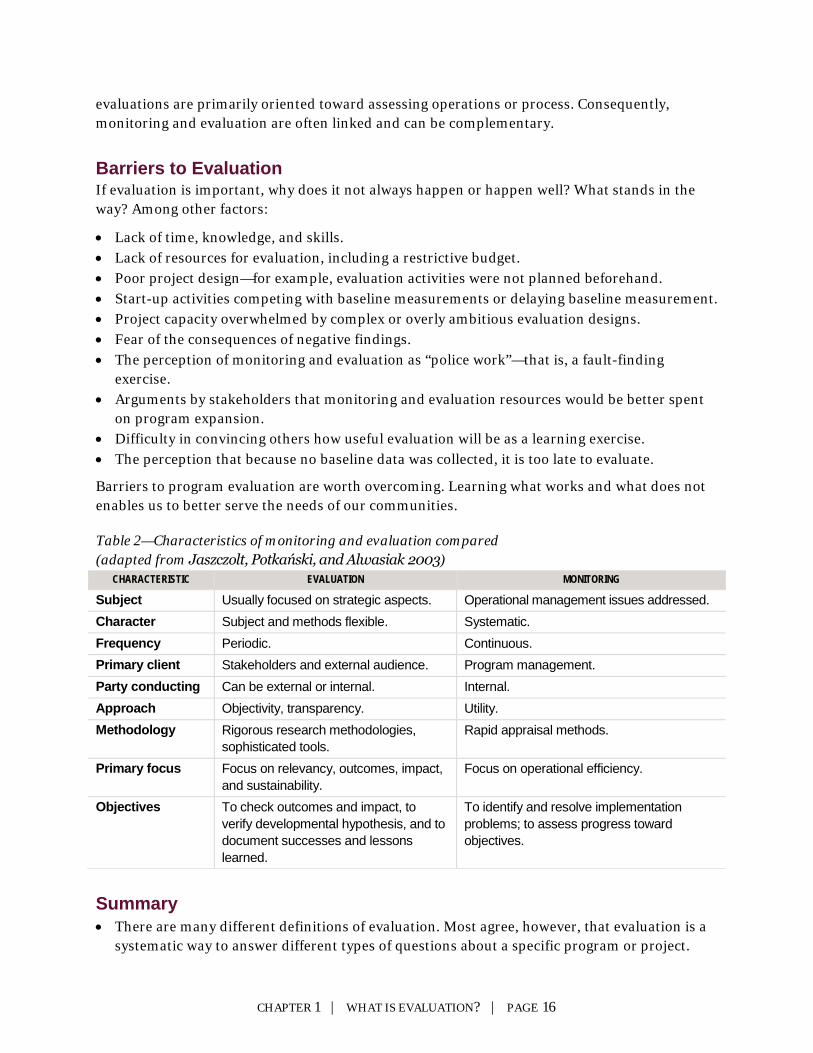
Table 2—Characteristics of monitoring and evaluation compared (adapted from Jaszczolt, Potkański, and Alwasiak 2003)
CHARACTERISTIC EVALUATION MONITORING
Subject Usually focused on strategic aspects. Operational management issues addressed. Character Subject and methods flexible. Systematic. Frequency Periodic. Continuous. Primary client Stakeholders and external audience. Program management. Party conducting Can be external or internal. Internal. Approach Objectivity, transparency. Utility. Methodology Rigorous research methodologies,
sophisticated tools. Rapid appraisal methods.
Primary focus Focus on relevancy, outcomes, impact, and sustainability.
Focus on operational efficiency.
Objectives To check outcomes and impact, to verify developmental hypothesis, and to document successes and lessons learned.
To identify and resolve implementation problems; to assess progress toward objectives.
Summary • There are many different definitions of evaluation. Most agree, however, that evaluation is a
systematic way to answer different types of questions about a specific program or project.
CHAPTER 1 | WHAT IS EVALUATION? | PAGE 16
• Evaluation serves a variety of purposes, including program improvement, decision making, accountability, and learning.
• Involving stakeholders has many benefits, among them an increase in the likelihood that the evaluation will be useful and used.
• Monitoring and evaluation are complementary but distinct. • Barriers to conducting evaluation are important to overcome.
Resources BetterEvaluation, Rainbow Framework http://betterevaluation.org/plan
Pell Institute, “Evaluation 101: The Basics” http://toolkit.pellinstitute.org/evaluation-101/
Research Methods Knowledge Base, Introduction to Evaluation http://www.socialresearchmethods.net/kb/intreval.php
National Science Foundation, “Evaluation and Types of Evaluation” http://www.nsf.gov/pubs/2002/nsf02057/nsf02057_2.pdf
CHAPTER 1 | WHAT IS EVALUATION? | PAGE 17
EXERCISES
#1: Why Should Your Organization Invest in Evaluation? Take a few minutes to reflect on what evaluation means to your organization based on your experience. What are the key reasons your organization should invest in evaluation?
Write down three things you might say to explain to another person why evaluation is important.
1.
2.
3.
#2: Barriers To Evaluation Most programs in the field are not evaluated. As a result, it is difficult to duplicate them or scale them up. In your experience, what are some barriers to program evaluation?
Write down three common barriers to evaluation in the field.
1.
2.
3.
To what extent do you believe that program implementers are open to evaluating their programs? What are some of the underlying reasons they want or do not want to evaluate programs?
CHAPTER 1 | WHAT IS EVALUATION? | PAGE 18
Chapter 2: Evaluation Purpose and Questions After completing this chapter, participants will be able to: • Use logic models to explain program theory • Write an evaluation purpose statement • Develop evaluation questions
To build a terms of reference, participants will: • Describe the program using a logic model (TOR I-B and II-C)1 • Complete a stakeholder analysis (TOR II-A) • Write an evaluation purpose statement (TOR II-B) • Develop evaluation questions (TOR III)
The Terms of Reference The TOR is a comprehensive, written plan for the evaluation.
Developing the TOR yields a shared understanding of the evaluation’s specific purposes, the design and data collection needs, the resources available, the roles and responsibilities of different evaluation team members, the timelines, and other fundamental aspects of the evaluation. The TOR facilitates clear communication of evaluation plans to other people.
Importantly, if the evaluation will be external, the TOR helps communicate expectations to and then managing the consultant(s). Because external evaluators may be less familiar with the project than the individuals commissioning them, it is important to have a TOR that clearly sets forth all the necessary background—specifically, to alert the evaluator to the questions that are most important to stakeholders.
Key components of a TOR include the following:
• Background of the evaluation • Brief description of the program • Purpose of the evaluation • Evaluation questions • Evaluation methodology • Evaluation team • Schedule and logistics • Reporting and dissemination plan • Budget • Timeline • Ethical considerations
A TOR template can be found in Appendix 1 (page 90).
1 In the shaded summary boxes that begin every chapter, the parenthetical references are to sections of the terms of reference template that begins on page 90.
CHAPTER 2 | EVALUATION PURPOSE AND QUESTIONS | PAGE 19
Focusing the Evaluation As you would focus a camera before taking a picture, it is necessary to focus evaluations before collecting data (University of Wisconsin 2008). Focusing is critical to planning an evaluation that will both be useful to the project and make good use of resources.
Spending time to do this up front helps to ensure that the evaluation is relevant, specific, useful, and feasible. Often, when an evaluation fails, the cause of the failure can be traced to lack of focus at the beginning. Lack of focus can threaten the success of an evaluation in several ways:
• The evaluation questions are vague. • Stakeholders have differing views on the purpose of the evaluation. • The evaluation plan is not realistic. • The findings are not useful or actionable.
Steps to Focus the Evaluation Creating a focused evaluation design involves following a specific sequences of activities:
1. Use a logic model to understand and document the program logic. 2. Document key assumptions underlying the program logic. 3. Engage stakeholders to determine what they need to know from the evaluation. 4. Write a purpose statement for the evaluation. 5. Develop a realistic set of questions that will be answered by the evaluation.
Logic Models Logic models visually describe the program’s hypothesis of how project activities will create impact. They are useful in distilling the program logic into its key components and relationships. Results frameworks, logframes, theories of change, and conceptual models, like logic models, also facilitate visualization of program logic.
Program logic—also called the program theory—is the reasoning underlying the program design. The logic can often be expressed with if–then statements. For example, for a malaria prevention program, the program logic might run this way:
If we give people bednets, then they will use them over their beds.
Or
If we educate 60% of adults about mosquito breeding prevention, then the mosquito population will decline.
Because program logic can be complex, many people find a visual depiction helpful in addition to the written narrative. In Figure 1, for example, the arrow between the two boxes suggests a causal relationship. Logic models usually involve many boxes and many arrows, explaining how the program is designed to create certain outcomes over time.
CHAPTER 2 | EVALUATION PURPOSE AND QUESTIONS | PAGE 20
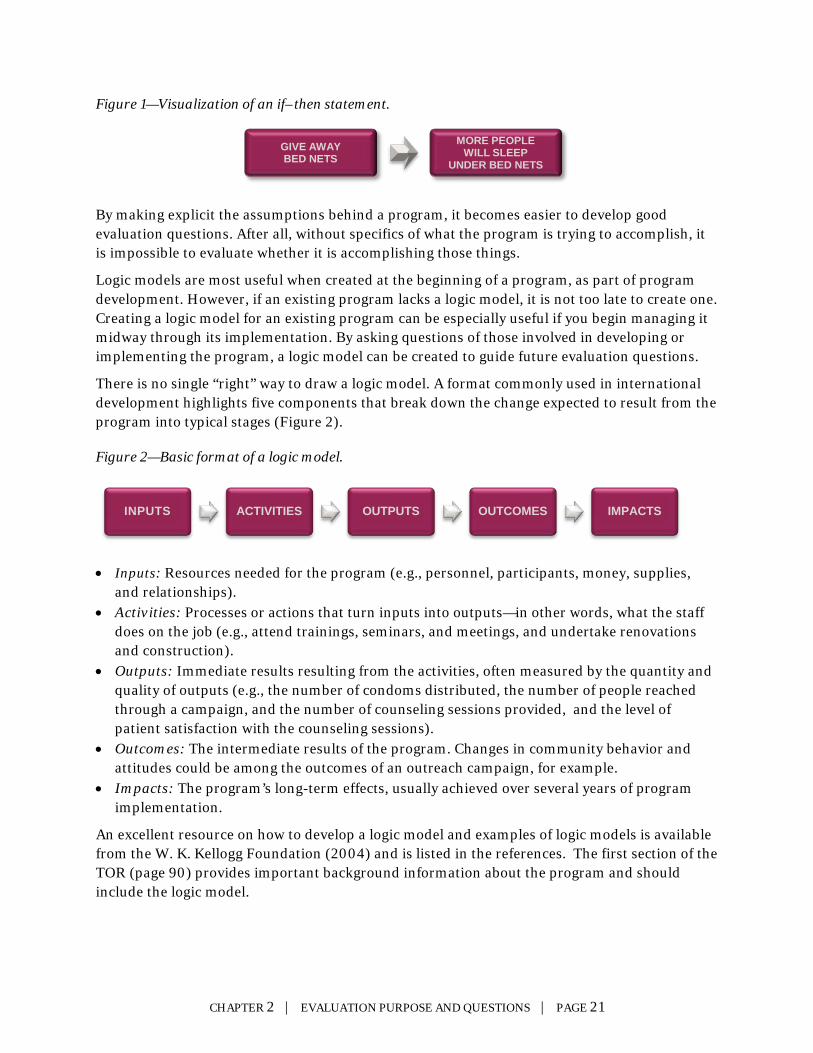
Figure 1—Visualization of an if–then statement.
By making explicit the assumptions behind a program, it becomes easier to develop good evaluation questions. After all, without specifics of what the program is trying to accomplish, it is impossible to evaluate whether it is accomplishing those things.
Logic models are most useful when created at the beginning of a program, as part of program development. However, if an existing program lacks a logic model, it is not too late to create one. Creating a logic model for an existing program can be especially useful if you begin managing it midway through its implementation. By asking questions of those involved in developing or implementing the program, a logic model can be created to guide future evaluation questions.
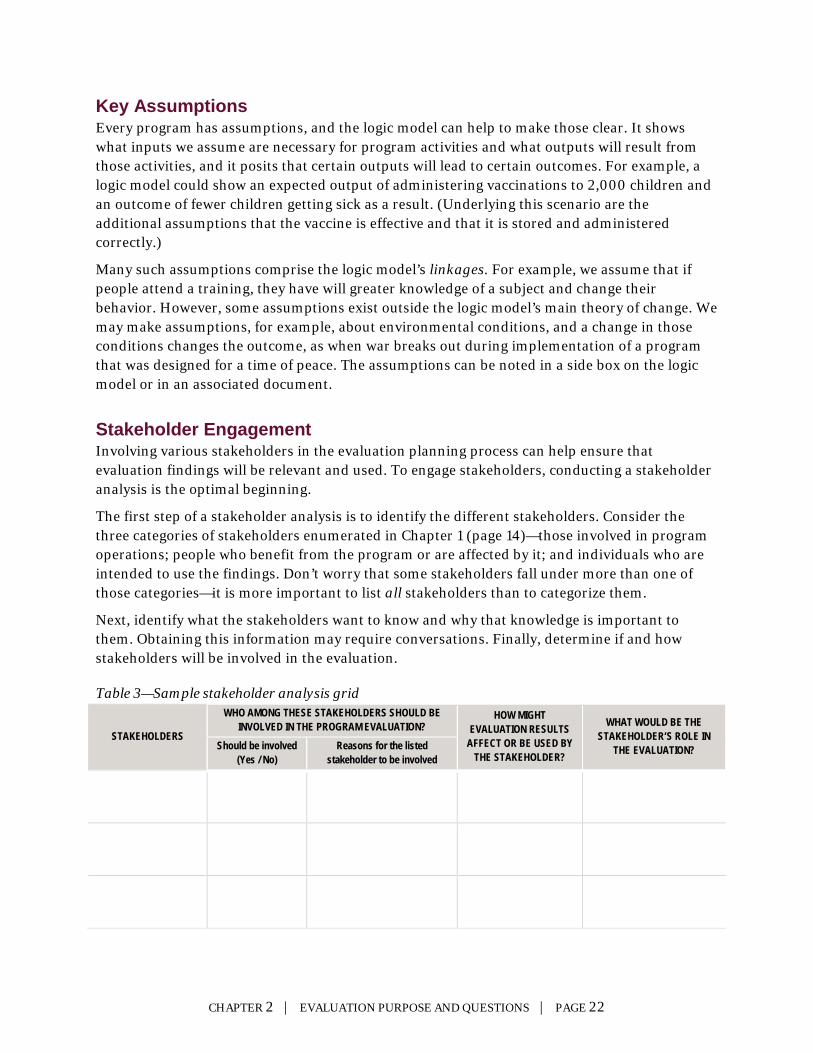
There is no single “right” way to draw a logic model. A format commonly used in international development highlights five components that break down the change expected to result from the program into typical stages (Figure 2).
Figure 2—Basic format of a logic model.
• Inputs: Resources needed for the program (e.g., personnel, participants, money, supplies, and relationships).
• Activities: Processes or actions that turn inputs into outputs—in other words, what the staff does on the job (e.g., attend trainings, seminars, and meetings, and undertake renovations and construction).
• Outputs: Immediate results resulting from the activities, often measured by the quantity and quality of outputs (e.g., the number of condoms distributed, the number of people reached through a campaign, and the number of counseling sessions provided, and the level of patient satisfaction with the counseling sessions).
• Outcomes: The intermediate results of the program. Changes in community behavior and attitudes could be among the outcomes of an outreach campaign, for example.
• Impacts: The program’s long-term effects, usually achieved over several years of program implementation.
An excellent resource on how to develop a logic model and examples of logic models is available from the W. K. Kellogg Foundation (2004) and is listed in the references. The first section of the TOR (page 90) provides important background information about the program and should include the logic model.
GIVE AWAY BED NETS
MORE PEOPLE WILL SLEEP
UNDER BED NETS
INPUTS ACTIVITIES OUTPUTS OUTCOMES IMPACTS
CHAPTER 2 | EVALUATION PURPOSE AND QUESTIONS | PAGE 21
Key Assumptions Every program has assumptions, and the logic model can help to make those clear. It shows what inputs we assume are necessary for program activities and what outputs will result from those activities, and it posits that certain outputs will lead to certain outcomes. For example, a logic model could show an expected output of administering vaccinations to 2,000 children and an outcome of fewer children getting sick as a result. (Underlying this scenario are the additional assumptions that the vaccine is effective and that it is stored and administered correctly.)
Many such assumptions comprise the logic model’s linkages. For example, we assume that if people attend a training, they have will greater knowledge of a subject and change their behavior. However, some assumptions exist outside the logic model’s main theory of change. We may make assumptions, for example, about environmental conditions, and a change in those conditions changes the outcome, as when war breaks out during implementation of a program that was designed for a time of peace. The assumptions can be noted in a side box on the logic model or in an associated document.
Stakeholder Engagement Involving various stakeholders in the evaluation planning process can help ensure that evaluation findings will be relevant and used. To engage stakeholders, conducting a stakeholder analysis is the optimal beginning.
The first step of a stakeholder analysis is to identify the different stakeholders. Consider the three categories of stakeholders enumerated in Chapter 1 (page 14)—those involved in program operations; people who benefit from the program or are affected by it; and individuals who are intended to use the findings. Don’t worry that some stakeholders fall under more than one of those categories—it is more important to list all stakeholders than to categorize them.
Next, identify what the stakeholders want to know and why that knowledge is important to them. Obtaining this information may require conversations. Finally, determine if and how stakeholders will be involved in the evaluation.
Table 3—Sample stakeholder analysis grid
STAKEHOLDERS
WHO AMONG THESE STAKEHOLDERS SHOULD BE INVOLVED IN THE PROGRAM EVALUATION?
HOW MIGHT EVALUATION RESULTS
AFFECT OR BE USED BY THE STAKEHOLDER?
WHAT WOULD BE THE STAKEHOLDER’S ROLE IN
THE EVALUATION? Should be involved (Yes / No)
Reasons for the listed stakeholder to be involved
CHAPTER 2 | EVALUATION PURPOSE AND QUESTIONS | PAGE 22
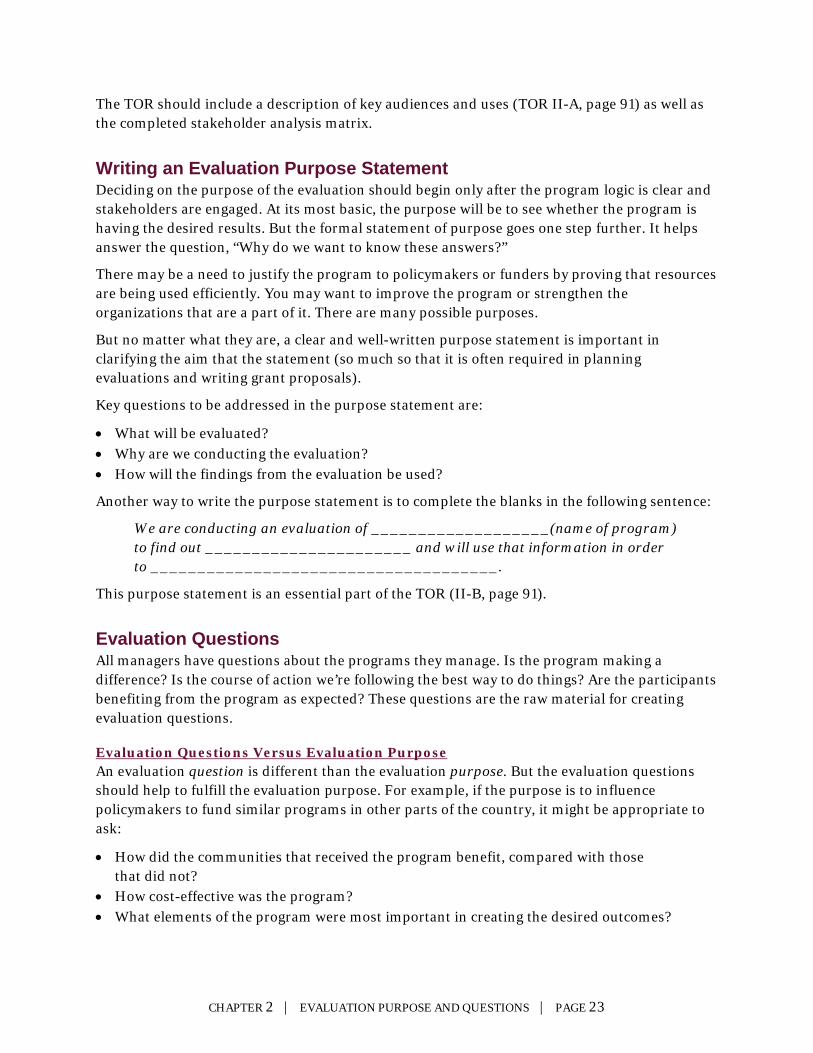
The TOR should include a description of key audiences and uses (TOR II-A, page 91) as well as the completed stakeholder analysis matrix.
Writing an Evaluation Purpose Statement Deciding on the purpose of the evaluation should begin only after the program logic is clear and stakeholders are engaged. At its most basic, the purpose will be to see whether the program is having the desired results. But the formal statement of purpose goes one step further. It helps answer the question, “Why do we want to know these answers?”
There may be a need to justify the program to policymakers or funders by proving that resources are being used efficiently. You may want to improve the program or strengthen the organizations that are a part of it. There are many possible purposes.
But no matter what they are, a clear and well-written purpose statement is important in clarifying the aim that the statement (so much so that it is often required in planning evaluations and writing grant proposals).
Key questions to be addressed in the purpose statement are:
• What will be evaluated? • Why are we conducting the evaluation? • How will the findings from the evaluation be used?
Another way to write the purpose statement is to complete the blanks in the following sentence:
We are conducting an evaluation of ___________________(name of program) to find out ______________________ and will use that information in order to _____________________________________.
This purpose statement is an essential part of the TOR (II-B, page 91).
Evaluation Questions All managers have questions about the programs they manage. Is the program making a difference? Is the course of action we’re following the best way to do things? Are the participants benefiting from the program as expected? These questions are the raw material for creating evaluation questions.
Evaluation Questions Versus Evaluation Purpose An evaluation question is different than the evaluation purpose. But the evaluation questions should help to fulfill the evaluation purpose. For example, if the purpose is to influence policymakers to fund similar programs in other parts of the country, it might be appropriate to ask:
• How did the communities that received the program benefit, compared with those that did not?
• How cost-effective was the program? • What elements of the program were most important in creating the desired outcomes?
CHAPTER 2 | EVALUATION PURPOSE AND QUESTIONS | PAGE 23
On the other hand, if the evaluation purpose is to show program staff how to improve the program, you might ask:
• How do participants of the program perceive it? • What are the program’s strengths and weaknesses? • Why did some program sites perform better than others?
Steps to Develop Evaluation Questions In developing evaluation questions, first review the original program goals and objectives. The questions should relate to these.
Next, to ensure that the evaluation is relevant, be sure you know what is important to the organization and to other stakeholders who might use the evaluation—their priorities and needs.
Finally, consider the timing of the evaluation. Some questions are best asked at the beginning of the program, while others must wait until the program has been completed.
Begin by developing a list of potential evaluation questions. This is often done in a small group with other stakeholders. Then decide which questions are most important. Focus on the questions for which you need answers, not those on questions whose answers would be nice to know. The questions should be answerable and realistic given the resources available.
Also consider evaluation questions that come from the logic model—questions that test the program logic or the assumptions underlying it. Also consider questions about implementation, effectiveness, efficiency, cost, or other aspects of the program.
Section III of the TOR (page 922) presents the evaluation questions. It also includes a matrix that may be helpful in presenting the questions, why they are important and to whom, and your initial thoughts about what data are available and needed in order to answer the questions. Evaluation questions can be broken down into a number of specific sub-questions, which is useful when further deciding on data collection methods.
Types of Evaluation Questions Descriptive Questions Evaluation questions are sometimes categorized as descriptive questions, normative questions, and cause–effect questions. Descriptive questions focus on “what is” and provide a means to understand the present situation regarding processes, participants, stakeholder views, or environmental conditions. Descriptive questions:
• Have answers that provide insight into what is happening with program activities and implementation.
• Are straightforward, asking about who, what, where, when, and how. • Can be used to describe inputs, activities, and outputs. • May include gathering opinions or perceptions of clients or key stakeholders.
Examples • What did participants learn from the program? • Who benefited most (or least) from the program?
CHAPTER 2 | EVALUATION PURPOSE AND QUESTIONS | PAGE 24
• How did the environment change during the years the program was implemented?
Normative Questions The purpose of normative questions is to compare program achievements with an established standard or benchmark, such as national or international guidelines for delivering the same interventions.
Examples • How do our outcomes compare to the outcomes of similar programs? • Are we achieving our target? • Did we accomplish what we said we would accomplish? • Are target agencies adhering to international best practices?
A common challenge for evaluation is that sometimes there are no established benchmarks or standards on which to base normative questions. In such instances, the evaluation team may work with the program team and/or the donor to agree on a performance level that would be acceptable and, typically, targets will be set with stakeholders when the project begins.
Cause–Effect Questions Generally intended to determine whether the intended overarching program change was achieved, assessing the program’s overall effect, cause–effect questions start with an evaluation design that illuminates the fact that it is the program that caused the observed changes (and not another factor). Proving the program’s effect requires exclusion of other potential factors in the change, and that is something that can be addressed by the evaluation design (Chapter 3, page 29).
Examples • Did the women’s empowerment program increase the income of female-headed households? • Did malnutrition rate drop substantially (by at least 20%) among orphaned and vulnerable
children targeted by the nutrition program? • Did increased knowledge and skills in water harvesting techniques result in increased crop
yield and income for the subsistence farmers? • What other impacts (positive or negative) did the intervention have on the wider community? • Did the clinics that received the training implement what they learned? • Did the sites that received conflict mediation have lower rates of violence?
An Optimal Mix A single evaluation can include multiple question types; let the evaluation goal and resources available (i.e., in money, time, and human capacity) determine the mix. Once you have decided on the evaluation questions, add them to the TOR (Section III, page 9292). It is recommended that the number of evaluation questions should be limited to the most important questions so the focus of the evaluation is not diluted.
After the evaluation has been focused by determining its purpose, after stakeholders have been engaged and specific evaluation questions developed, design of the evaluation effort can begin. Spending the necessary time up front to resolve these issues will make the rest of the process go much more smoothly.
CHAPTER 2 | EVALUATION PURPOSE AND QUESTIONS | PAGE 25
Summary • Begin the evaluation planning process by documenting the program theory in a logic model
and identifying any underlying assumptions. • Conduct a stakeholder analysis to determine who should be involved, why, and how. • The evaluation purpose statement concisely states what will be evaluated and why, as well as
how the findings from the evaluation be used. • Depending on the purpose of the evaluation, a mix of descriptive, normative, and cause–
effect questions may be used.
Resources My M&E, “Developing Evaluation Questions” http://www.mymande.org/howto-recomm-page?q=node/88
W. K. Kellogg Foundation, “Using Logic Models to Bring Together Planning, Evaluation, and Action: Logic Model Development Guide” (Battle Creek, Michigan, 2004) http://www.wkkf.org/knowledge-center/resources/2006/02/wk-kellogg-foundation-logic-model-development-guide.aspx
Better Evaluation, “Stakeholder Mapping and Analysis” http://betterevaluation.org/evaluation-options/mapping_stakeholders
World Bank, “What Is Stakeholder Analysis?” http://www1.worldbank.org/publicsector/anticorrupt/PoliticalEconomy/PDFversion.pdf
BSR, “Stakeholder Mapping” (BSR, 2011) http://www.bsr.org/reports/BSR_Stakeholder_Engagement_Stakeholder_Mapping.final.pdf
CHAPTER 2 | EVALUATION PURPOSE AND QUESTIONS | PAGE 26
EXERCISES
#3: Stakeholder Analysis Take time to reflect on your organization’s context. List the different stakeholders who should be involved in evaluating your program and why they should be involved. Using the stakeholder analysis template provided in the chapter, complete the following tasks for your program:
• Identify the different stakeholders. • Identify what they want to know. • Consider why it is important for your stakeholders. • Identify how they will be involved in the evaluation.
#4: Writing Evaluation Purpose Statement Reflecting on your organization’s context, write an evaluation purpose statement for your program by filling in the blanks in the following sentence:
We are conducting an evaluation of ____________________ (name of program) in order to find out ______________________ and we will use the information to ______________.
#5: Prioritizing Evaluation Questions Think about your own program and take a few minutes to complete the following:
1. Brainstorm key evaluation questions that could potentially be relevant to your program.
2. Based on your work on your organization’s evaluation purpose statement and reflecting on your organization’s context, identify key potentially relevant evaluation questions.
3. Prioritize the questions you have identified. Use the Prioritizing Evaluation Questions template (next page) to guide you through the exercise. Once you have determined the priority evaluation questions, plug them into TOR III and into the columns related to evaluation questions and sub-questions in TOR IV-B.
CHAPTER 2 | EVALUATION PURPOSE AND QUESTIONS | PAGE 27
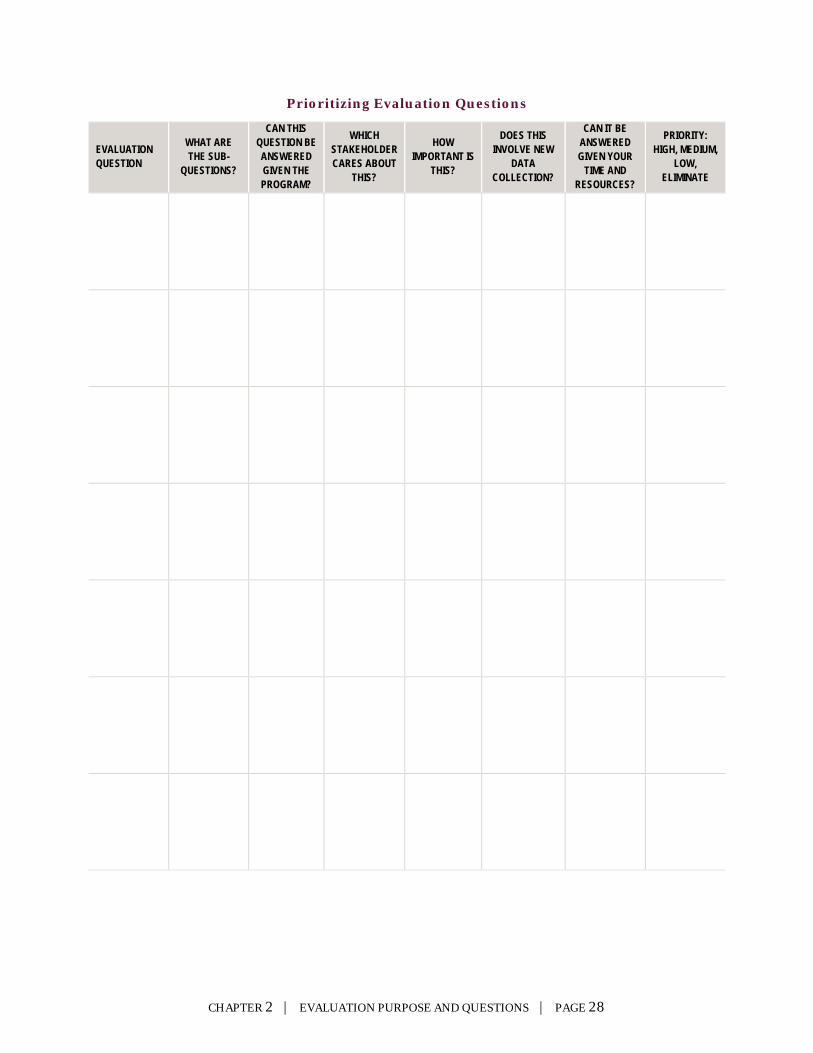
Prioritizing Evaluation Questions
EVALUATION QUESTION
WHAT ARE THE SUB-
QUESTIONS?
CAN THIS QUESTION BE ANSWERED GIVEN THE PROGRAM?
WHICH STAKEHOLDER CARES ABOUT
THIS?
HOW IMPORTANT IS
THIS?
DOES THIS INVOLVE NEW
DATA COLLECTION?
CAN IT BE ANSWERED GIVEN YOUR
TIME AND RESOURCES?
PRIORITY: HIGH, MEDIUM,
LOW, ELIMINATE
CHAPTER 2 | EVALUATION PURPOSE AND QUESTIONS | PAGE 28
Chapter 3: Overview of Evaluation Design and Methods
After completing this chapter, participants will be able to: • Compare and contrast qualitative, quantitative, and mixed approaches • Identify common methods used in evaluations • Match the best method with different evaluation questions • Identify ways to avoid common pitfalls in data collection
To build a terms of reference, participants will: • Complete the TOR Evaluation Design and Approach (TOR IV-A)
What is Evaluation Design? The evaluation design is the plan for answering the key evaluation questions. Evaluation design is critical to the evaluation process and should begin as soon as program planning begins. The evaluation design process should involve key stakeholders.
The design specifies:
• Which people or units will be evaluated • How they will be selected • The kinds of comparisons that should be made • By what approach the comparisons will be made • The evaluation’s timing • The intervals at which groups will be studied
This chapter discusses the main approaches toward evaluation design: quantitative, qualitative, and mixed. At the end, we will consider how to choose the best approach for an evaluation and then discuss the elements of good evaluation design.
Overview of Approaches Programs can be evaluated using several approaches. There are quantitative approaches and qualitative approaches, and many ways to use them both (mixed methods). Although these approaches are often called methods, this manual will use the term approaches, because each actually encompasses a variety of more specific methodologies. These methodologies will be discussed in Chapter 4, page 40.
Quantitative Approaches Quantitative approaches use numerical and statistical comparisons and are appropriate when change can be meaningfully captured by numerical data such as test scores, percent of population accessing services, and income levels. Quantitative data can be collected by surveys,
CHAPTER 3 | OVERVIEW OF EVALUATION DESIGN AND METHODS | PAGE 29
direct observations and direct measurements and by examining existing records (e.g., medical records or censuses). These instruments are detailed further in the following chapter.
Experimental Design In an experimental design, people, facilities, and communities—depending on the level at which the project’s activities will take effect—are randomly assigned to different groups. Some groups receive the intervention, while others receive something else or nothing at all. These groups are often described as being exposed and nonexposed (to the intervention), as the experimental (or treatment) group and the control or counterfactual group, respectively.
The advantage of experimental design is the quality of data it produces. Experimental methods permit attribution of observed changes to the program; the random assignment of the units studied to either the treatment group or the control group should mean that the two groups are similar in every way except for their exposure or nonexposure. The design is very well respected among researchers.
Nonetheless, experimental designs are challenging to use for program evaluation. Programs take place in communities, not in laboratories. Program managers cannot always control who is exposed to a program and who is not. For example, a health program may be given to one group of people and not another, but the people who participated in the program may tell friends and family in the control group what they learned. Moreover, withholding a program from a group of people may be unethical, especially if there is good reason to believe that the program saves or improves lives. In addition, random assignment is not always in the best interests of a program; it may intentionally target precisely the areas, organizations, or people who are most likely to benefit from the intervention. Finally, experimental designs can be expensive to carry out, because twice the number of people must be recruited, retained, and tracked—those who receive the intervention and those who do not.
Quasi-experimental Design Quasi-experimental design also entails comparison of those receiving an intervention and those who do not receive an intervention. However, the people in these groups are not randomly assigned.
For a quasi-experimental design to work, a comparison group or counterfactual—similar to the intervention group—is identified, a group that will not be exposed to the program. Among the many ways to identify a comparison group, we will discuss two: nonequivalent control group pre-test post-test design and generic control design.
Nonequivalent Control Group Pre-Test Post-Test Design: In this model, the comparison group is thought to be similar to the group receiving the intervention. For example, outcomes in a school that received an intervention might be compared to outcomes for a similar school that did not receive the intervention. Groups selected are as similar as possible so that their differences do not interfere with the accuracy of the post-intervention comparison. When selecting the comparison group, certain issues must be considered:
• Whether the group might be exposed to another similar intervention from another institution or organization.
CHAPTER 3 | OVERVIEW OF EVALUATION DESIGN AND METHODS | PAGE 30

• Whether the program we are evaluating might have effects that spill over into the comparison group.
• Whether the key factors that led to the treatment group receiving the intervention might have affected the study outcomes.
Sometimes, in this type of evaluation design, the intervention group will be chosen deliberately and the comparison group randomly from the nonintervention population; in other instances, the comparison group will be chosen systematically to most accurately mirror the intervention group.2
Generic Control Design: Another way to form a comparison group is through generic control design. In this design, the general population is the comparison group. Changes or trends in outcome indicators for the group receiving the intervention would be compared to changes or trends in outcome indicators for the general population. To use this design:
• The population for which comparison data are available must be similar to the target population for your program.
• The outcome indicators measured for the comparison group—that is, the general population—must be relevant to your program, and the same indicators should be collected for the intervention group.
• Data must be collected from both groups at or close to the same time and in the same way.
Quasi-experimental design is much more common in evaluating development programs than experimental design. As with experimental design, quasi-experimental design is capable of producing a high-quality comparison. However, the quality of this comparison hinges on having a nonintervention group that can plausibly act as a counterfactual—that is, an illustration of what would have happened to the treatment group without the treatment. Barriers to achieving a high-quality comparison include:
• The program design shifts after baseline measurements and comparison groups have received the intervention.
• Another institution or organization begins work similar to the intervention with the comparison group, either part of it or the entire group.
• A comparison group was chosen based on some characteristics initially thought important, but a key characteristic that influenced the success of the project was not taken into account.
• Program target beneficiaries were chosen based on specific characteristics that cannot be replicated in a comparison group. For example, specific villages might be targeted because they are the poorest.
• Program effects are intended to be wide-ranging, such as changes to national policy.
Quasi-experimental approaches, like experimental approaches, are sometimes expensive and subject to ethical concerns about measuring a comparison group without providing any benefit. However, properly implemented, quasi-experimental methods can provide very powerful data
2 The different methods for doing this will not be discussed in this manual. To read more on this topic, please visit www.betterevaluation.org.
CHAPTER 3 | OVERVIEW OF EVALUATION DESIGN AND METHODS | PAGE 31
on project achievements—or, equally valuably, can provide important evidence that particular program approaches are not having the expected effects.
Nonexperimental/Observational Design In nonexperimental and observational designs, there are no comparisons among groups: data are collected only from the group of individuals of interest—usually, those who participated in the program. Although this design allows us to document changes in outcome indicators for the program’s target audience, it is difficult to know to what extent these changes have actually resulted from the program. There are many different types of nonexperimental design—among them, before and after, time–series, and post-test only.
Before and After Design: In a before and after design, measurements are taken from program participants before and after the program. For example, children may be weighed before and then after a feeding program; any weight gained is attributed to the program. The weakness of the design is the lack of a comparison. For instance, you may be able to say that the children gained weight, but you do not know if they gained more weight than children who did not participate in the feeding program.
Time–Series Design: In a time–series design, several measurements are taken before, during, and after the intervention, and then any trends are examined. Because there are more than two measures, it may be possible to identify trends associated with the program. In a time–series design, using the example above, children’s weights would be tracked over a longer period of time, preferably long before the commencement of the feeding program and then continuing many months after its completion. These additional data points permit the examination of trends, rather than illuminating simply two points in time. The lengthy duration of the measurement period minimizes the likelihood of random weight fluctuations over the short term being mistaken for long-term changes.
Post-Test-Only Design: Following a post-test-only design, data are collected only after the intervention has been carried out. To continue with the same example, children in a feeding program would be weighed only at the end of the program. The weakness is that while the measurement shows the end result, whether this measurement represents an increase, decrease, or no change is unknown.
Nonexperimental data are often the easiest to collect, but are limited in their ability to demonstrate change attributable to a particular program.
Qualitative Approaches Qualitative evaluation approaches synthesize people’s perceptions of a situation and its meaning. Qualitative evaluation often seeks to answer the “how” and “why” via in-depth inquiry. Qualitative data consist of descriptions, collected through observation, key informant interviews, focus groups, document reviews, or mapping—to name just a few methods (Chapter 4, page 40). In some cases, such visual data as maps or drawings are included. Qualitative methods are helpful when what needs to be measured is too complex to capture in numbers alone. Qualitative data are analyzed by systematically looking for themes and patterns.
CHAPTER 3 | OVERVIEW OF EVALUATION DESIGN AND METHODS | PAGE 32
By nature, all qualitative evaluations are nonexperimental. However, the three categories described for quantitative designs, above, also apply here: Qualitative studies can also be conducted both before and after a project, permitting the evaluator to pick out changes over time in common themes or attitudes. Qualitative studies can also be performed multiple times over the course of a project, with the results used to inform project direction. Similarly, qualitative studies can be performed only at the end of a project, allowing for description of changes imputed to the project or changes in perceptions resulting from the project. In addition, qualitative data can be collected from both intervention and comparison groups, although such collections are not particularly common.
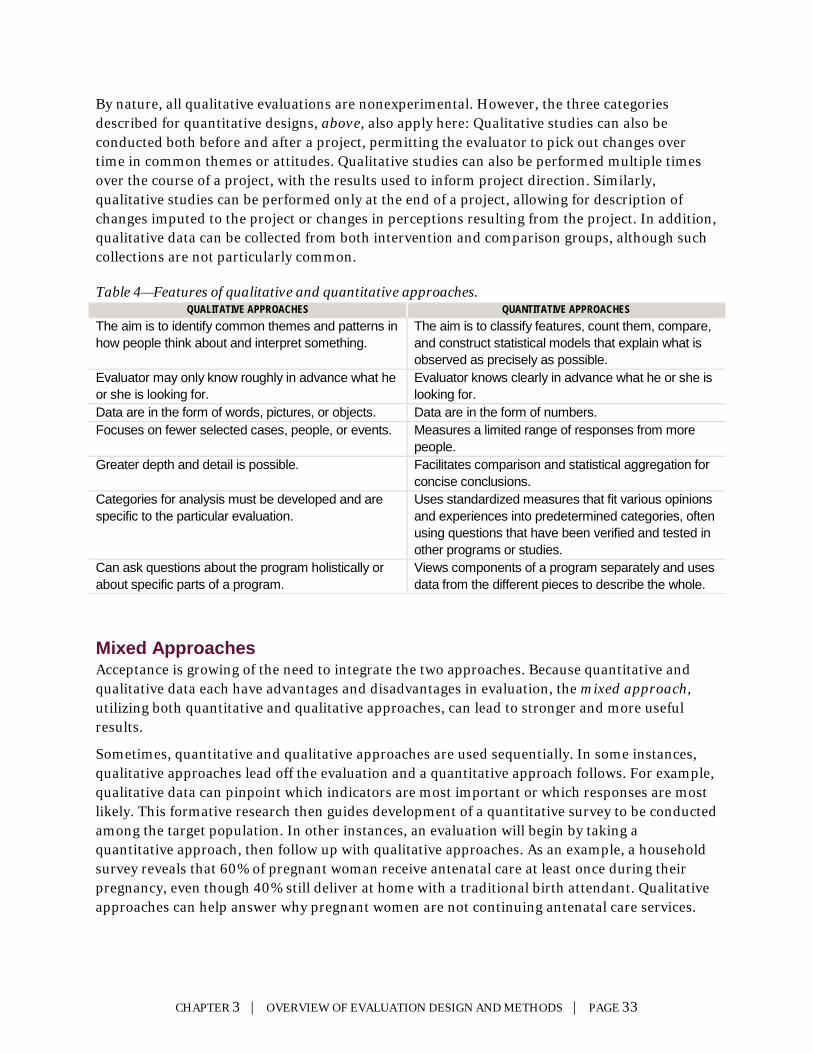
Table 4—Features of qualitative and quantitative approaches. QUALITATIVE APPROACHES QUANTITATIVE APPROACHES
The aim is to identify common themes and patterns in how people think about and interpret something.
The aim is to classify features, count them, compare, and construct statistical models that explain what is observed as precisely as possible.
Evaluator may only know roughly in advance what he or she is looking for.
Evaluator knows clearly in advance what he or she is looking for.
Data are in the form of words, pictures, or objects. Data are in the form of numbers. Focuses on fewer selected cases, people, or events. Measures a limited range of responses from more
people. Greater depth and detail is possible. Facilitates comparison and statistical aggregation for
concise conclusions. Categories for analysis must be developed and are specific to the particular evaluation.
Uses standardized measures that fit various opinions and experiences into predetermined categories, often using questions that have been verified and tested in other programs or studies.
Can ask questions about the program holistically or about specific parts of a program.
Views components of a program separately and uses data from the different pieces to describe the whole.
Mixed Approaches Acceptance is growing of the need to integrate the two approaches. Because quantitative and qualitative data each have advantages and disadvantages in evaluation, the mixed approach, utilizing both quantitative and qualitative approaches, can lead to stronger and more useful results.
Sometimes, quantitative and qualitative approaches are used sequentially. In some instances, qualitative approaches lead off the evaluation and a quantitative approach follows. For example, qualitative data can pinpoint which indicators are most important or which responses are most likely. This formative research then guides development of a quantitative survey to be conducted among the target population. In other instances, an evaluation will begin by taking a quantitative approach, then follow up with qualitative approaches. As an example, a household survey reveals that 60% of pregnant woman receive antenatal care at least once during their pregnancy, even though 40% still deliver at home with a traditional birth attendant. Qualitative approaches can help answer why pregnant women are not continuing antenatal care services.
CHAPTER 3 | OVERVIEW OF EVALUATION DESIGN AND METHODS | PAGE 33
In still other situations, qualitative and quantitative approaches are used simultaneously—perhaps to answer different evaluation questions. Given the complexity of the issue, a question as to how participant perceptions changed during the program is best resolved via a qualitative approach. At the same time, a question about the program’s cost-effectiveness usually requires a quantitative approach.
A good TOR matches the right approach with each question and does not rigidly adhere to one approach or another. A particular evaluation report may contain multiple approaches, data collection methods, and subdesigns and bring together all of those pieces to give the audience a holistic view of the project’s achievements and effects.
Choosing a Design The type of design chosen hinges on a number of factors.
The purpose of the evaluation affects the choice of design. The purpose statement should tell why and for whom the program is being evaluated. For example, if the audience is policymakers and the point is to determine whether the program has been effective in improving health outcomes, it may be important to use a design that will be perceived as rigorous and unbiased, like an experimental design. However, if the purpose statement suggests that the primary reason for the evaluation is to learn about how the program is being implemented and how acceptable it is to the community, a more flexible and less resource-intensive design, such as a qualitative process evaluation, might be appropriate.
Availability of time, money, staff, and consultants, as well as the evaluation’s timing, may also influence design choices. If the evaluation is conducted after the program has ended and no baseline data was collected and no comparison group selected, the options may be limited to a quasi-experimental or nonexperimental design.
During the evaluation design process, it is important to keep in touch with stakeholders, to continue to ensure that the evaluation is on track to meet their needs. At the same time, you can educate stakeholders so that the design and final results don’t take them by surprise. All designs have their limitations, even experimental designs, and it is important to manage the expectations of stakeholders so they won’t be disappointed if the evaluation doesn’t provide them a “final answer” or “the truth” if they were expecting it.
A design matrix can help organize information relating to the program evaluation and is often included in the TOR (Section IV-B, page 93). Based on your study of chapters 1, 2, and 3, you should be able to complete the columns related to questions and sub-questions. You will be able to complete the columns related to data collection methods and data sources after Chapter 4, and unit of analysis and sampling approach will be addressed in Chapter 5.
CHAPTER 3 | OVERVIEW OF EVALUATION DESIGN AND METHODS | PAGE 34
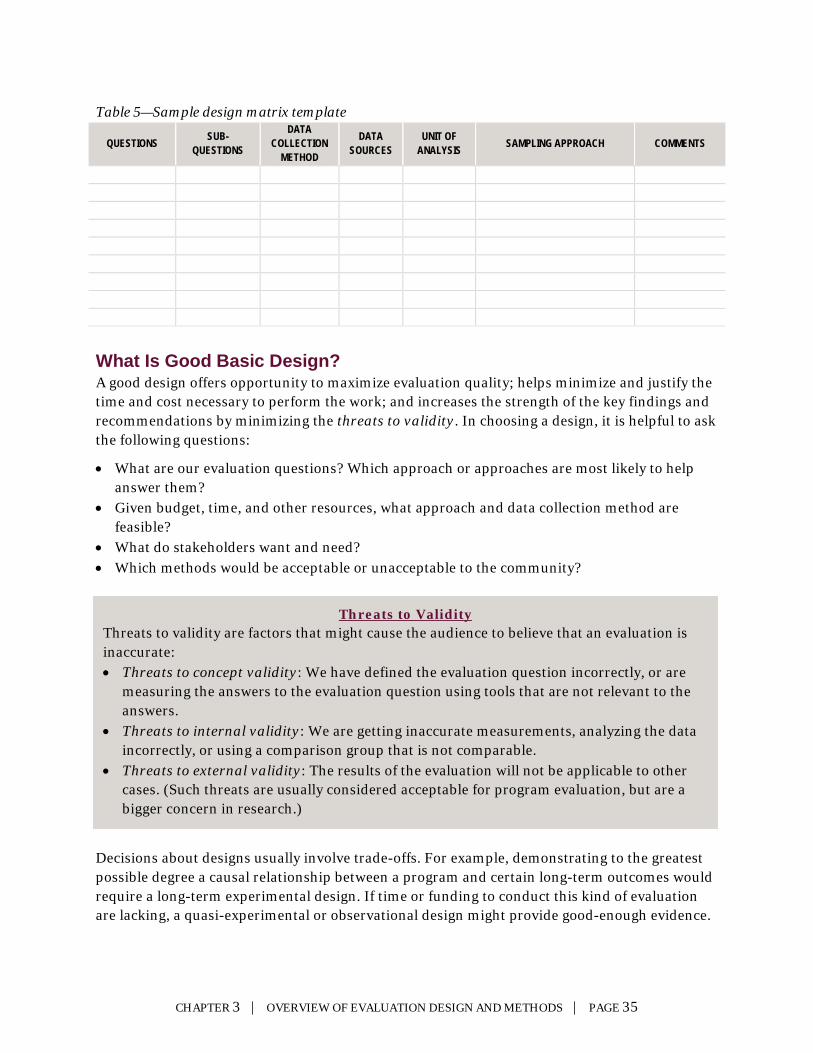
Table 5—Sample design matrix template
QUESTIONS SUB-QUESTIONS
DATA COLLECTION
METHOD
DATA SOURCES
UNIT OF ANALYSIS SAMPLING APPROACH COMMENTS
What Is Good Basic Design? A good design offers opportunity to maximize evaluation quality; helps minimize and justify the time and cost necessary to perform the work; and increases the strength of the key findings and recommendations by minimizing the threats to validity. In choosing a design, it is helpful to ask the following questions:
• What are our evaluation questions? Which approach or approaches are most likely to help answer them?
• Given budget, time, and other resources, what approach and data collection method are feasible?
• What do stakeholders want and need? • Which methods would be acceptable or unacceptable to the community?
Decisions about designs usually involve trade-offs. For example, demonstrating to the greatest possible degree a causal relationship between a program and certain long-term outcomes would require a long-term experimental design. If time or funding to conduct this kind of evaluation are lacking, a quasi-experimental or observational design might provide good-enough evidence.
Threats to Validity Threats to validity are factors that might cause the audience to believe that an evaluation is inaccurate: • Threats to concept validity: We have defined the evaluation question incorrectly, or are
measuring the answers to the evaluation question using tools that are not relevant to the answers.
• Threats to internal validity: We are getting inaccurate measurements, analyzing the data incorrectly, or using a comparison group that is not comparable.
• Threats to external validity: The results of the evaluation will not be applicable to other cases. (Such threats are usually considered acceptable for program evaluation, but are a bigger concern in research.)
CHAPTER 3 | OVERVIEW OF EVALUATION DESIGN AND METHODS | PAGE 35
On the other hand, there may be some instances where it is important to find more money and negotiate more time in order to answer evaluation questions that are strategically important to a program or the organization.
In addition to developing the approach (discussed in this chapter), evaluation design also encompasses data collection methods, sampling, and analysis. These will be covered in the next chapters.
Designing Survey Instruments and Interview Guides It is beyond the scope of this manual to provide guidance on survey and interview guide design. However, there are several resources listed at the end of this chapter that can be used as guidance. If there is an existing questionnaire or survey document that was previously used in a baseline or midterm evaluation, extreme care must be taken if questions will be changed, so that the comparability of the data are not compromised.
Good survey design takes time, multiple reviews, and field testing to ensure that the instrument will collect the data that are required. Additionally, evaluators should create dummy tables (see Chapter 6) prior to data collection to ensure that all data that are needed will be collected, and that data that will not be used in the analysis are not collected.
Summary • Quantitative approaches use numerical data and statistical methods to show change. These
approaches can be experimental, quasi-experimental, or nonexperimental. • Qualitative methods use descriptive data to show themes. • Using qualitative and quantitative approaches together comprises a mixed approach. • Determining which approach to use depends partly on available budget, time, data, and
human resources, as well as on the nature of the evaluation questions. • Survey and interview guide design is critical; these instruments must be developed, reviewed,
and tested prior to beginning data collection.
Resources
Research Methods Knowledge Base: Qualitative Measurement http://www.socialresearchmethods.net/kb/qual.php
Research Methods Knowledge Base: Design http://www.socialresearchmethods.net/kb/design.php
Michael Bamberger, “Introduction to Mixed Methods in Impact Evaluation,” in Impact Evaluation Notes No. 3 (August 2012), Washington, DC: InterAction http://www.interaction.org/document/guidance-note-3-introduction-mixed-methods-impact-evaluation
CHAPTER 3 | OVERVIEW OF EVALUATION DESIGN AND METHODS | PAGE 36

Better Evaluation, “Randomized Controlled Trial (RCT)” http://betterevaluation.org/plan/approach/rct
Judy L. Baker, Evaluating the Impact of Development Projects on Poverty: A Handbook for Practitioners (Washington, DC: World Bank, 2000) http://siteresources.worldbank.org/INTISPMA/Resources/handbook.pdf
National Science Foundation, “Qualitative Methods and Analytic Techniques” http://www.nsf.gov/pubs/1997/nsf97153/chap_3.htm
Ellen Taylor-Powell, Questionnaire design: Asking questions with a purpose (College Station, TX: Texas A&M University System, 1998) http://learningstore.uwex.edu/assets/pdfs/g3658-2.pdf FAO, Chapter 4 Questionnaire Design http://www.fao.org/docrep/w3241e/w3241e05.htm Boyce, Carolyn and Neale, Palena. Conducting In-Depth Interviews, A guide for designing and conducting in depth interviews for evaluation input (Boston: Pathfinder International, 2006) http://www.pathfinder.org/publications-tools/Conducting-In-Depth-Interviews-A-Guide-for-Designing-and-Conducting-In-Depth-Inteviews-for-Evaluation-Input.html
CHAPTER 3 | OVERVIEW OF EVALUATION DESIGN AND METHODS | PAGE 37
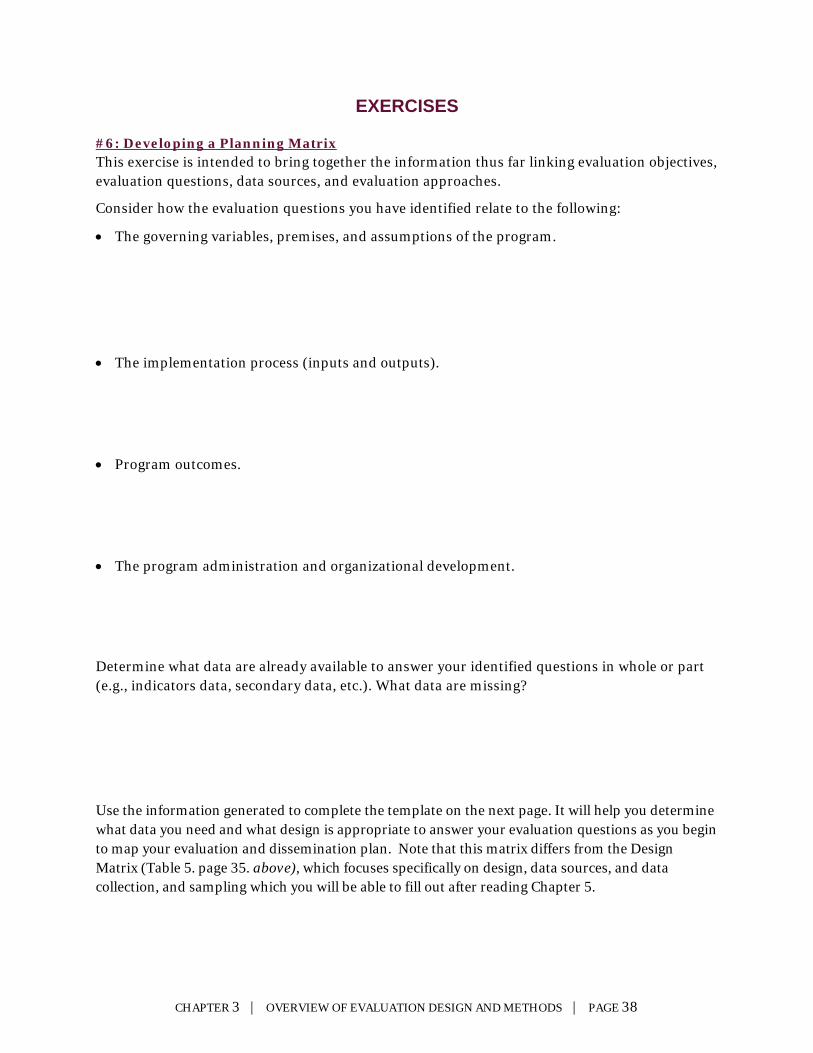
EXERCISES
#6: Developing a Planning Matrix This exercise is intended to bring together the information thus far linking evaluation objectives, evaluation questions, data sources, and evaluation approaches.
Consider how the evaluation questions you have identified relate to the following:
• The governing variables, premises, and assumptions of the program.
• The implementation process (inputs and outputs).
• Program outcomes.
• The program administration and organizational development.
Determine what data are already available to answer your identified questions in whole or part (e.g., indicators data, secondary data, etc.). What data are missing?
Use the information generated to complete the template on the next page. It will help you determine what data you need and what design is appropriate to answer your evaluation questions as you begin to map your evaluation and dissemination plan. Note that this matrix differs from the Design Matrix (Table 5. page 35. above), which focuses specifically on design, data sources, and data collection, and sampling which you will be able to fill out after reading Chapter 5.
CHAPTER 3 | OVERVIEW OF EVALUATION DESIGN AND METHODS | PAGE 38
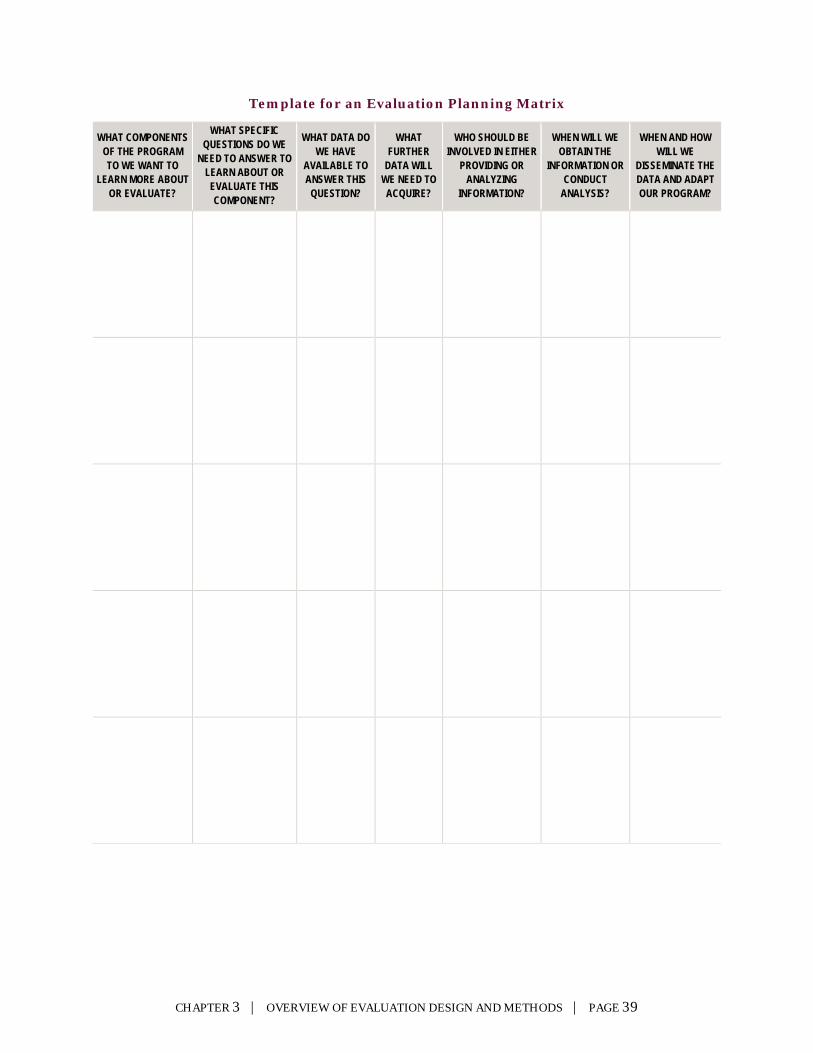
Template for an Evaluation Planning Matrix
WHAT COMPONENTS OF THE PROGRAM TO WE WANT TO
LEARN MORE ABOUT OR EVALUATE?
WHAT SPECIFIC QUESTIONS DO WE
NEED TO ANSWER TO LEARN ABOUT OR
EVALUATE THIS COMPONENT?
WHAT DATA DO WE HAVE
AVAILABLE TO ANSWER THIS
QUESTION?
WHAT FURTHER
DATA WILL WE NEED TO
ACQUIRE?
WHO SHOULD BE INVOLVED IN EITHER
PROVIDING OR ANALYZING
INFORMATION?
WHEN WILL WE OBTAIN THE
INFORMATION OR CONDUCT
ANALYSIS?
WHEN AND HOW WILL WE
DISSEMINATE THE DATA AND ADAPT OUR PROGRAM?
CHAPTER 3 | OVERVIEW OF EVALUATION DESIGN AND METHODS | PAGE 39
Chapter 4: Data Sources and Collection Methods After completing this chapter, participants will be able to: • Compare and contrast different data collection methods • Select practical data collection methods for a project • Discuss ethical considerations in evaluations
To build a terms of reference, participants will: • Begin filling in the design matrix, specifically columns related to data collection methods and data sources (TOR IV-B) • Identify and describe ethical considerations connected with the evaluation (TOR X)
Considering Data Collection Methods Previous chapters looked at evaluation questions and explored the approaches that might be used to answer those questions. Now we will consider which data collection methods are suitable for generating the data needed to answer the evaluation questions.
Although you will not immediately become an expert in program evaluations, you will become familiar in the next few pages with the various methods available for use. It is important to know the most common methods and the strengths and limitations of each.
The methods discussed here can be used to collect both quantitative and qualitative data, though some lend themselves more to one type of data collection than the other. Keep in mind that each data source can be analyzed via different approaches or collected using different types of tools. For example, a focus group discussion—facilitated by a community scorecard tool—might yield an index score that is analyzed quantitatively. Survey tools may produce both quantitative data and open-ended responses that must be analyzed qualitatively.
The data collection methods covered in this chapter represent some of the most common, but there are many others.
Existing Records Much of the data needed to evaluate programs has already been collected or will be collected over the life of a project, independent of any evaluations. In fact, a good evaluation plan integrates program monitoring activities with evaluation plans, so that monitoring data can also be used for evaluation. Quantitative data that already may be collected include health information in clinical records; audits of community needs and resources; and project participation records. Existing records may also include such qualitative data as reports, correspondence, and training materials. Using qualitative data from existing records is sometimes called document review.
Data collected by another person or organization might also be relevant in answering evaluation questions, data that is often available from government offices, donor agencies,
CHAPTER 4 | DATA SOURCES AND COLLECTION METHODS | PAGE 40
nongovernmental organizations, and research institutions. This secondary data might include, for example, national or regional surveys of corruption perception, maternal health practices, or household income.
While using records can be fast, inexpensive, and convenient, it requires understanding of and trust in the data. Because they were collected for another purpose and, in the case of secondary data, by other people, they may not be as accurate as data collected specifically for an evaluation. In addition, some types of records may not be available, such as confidential medical records.
Additional Information on Using Existing Data Better Evaluation http://betterevaluation.org/plan/describe/existing_documents
US Centers for Disease Control and Prevention, “Data Collection Methods for Evaluation: Document Review,” Evaluation ETA Evaluation Briefs, No. 18, January 2009 www.cdc.gov/healthyyouth/evaluation/pdf/brief18.pdf
Surveys Surveys involve asking people questions and recording their answers. Questions may be open-ended or closed-ended. Open-ended questions allow respondents to answer in their own words; closed-ended questions require that the respondent select from a set of possible answers or to answer “yes” or “no.” Closed-ended questions provide quantitative data. Open-ended questions usually generate qualitative data, although the answers can be coded so as to yield quantitative data after collection. A primary characteristic of surveys, as opposed to some other types of interviews, is that all respondents are asked the same questions.
Sometimes surveys are self-administered—that is, participants complete the survey themselves. A self-administered survey can be conducted in person, online, or by mail. Other times, someone asks the participant the questions on the survey and documents the answers. This type of survey can be done in person or over the phone. There are advantages and disadvantages to each approach. Self-administered surveys require fewer personnel. However, people may be less likely to respond to a survey that they have to complete themselves, especially if it is complicated or if the target population has limited reading and writing skills. When choosing how to conduct a survey, it is important to consider participants’ abilities and preferences.
When done correctly, surveys can be an efficient means of collecting data.
Additional Information on Developing and Conducting Surveys Ellen Taylor-Powell and Carol Hermann, “Collecting Evaluation Data: Surveys,” Madison, Wisconsin: Program Development and Evaluation, University of Wisconsin-Extension Cooperative Extension, May 2000 http://learningstore.uwex.edu/assets/pdfs/G3658-10.PDF
Josiah Kapan, Better Evaluation, “Surveys,” April 8, 2013 http://betterevaluation.org/evaluation-options/survey
CHAPTER 4 | DATA SOURCES AND COLLECTION METHODS | PAGE 41
Direct Measurement Sometimes evaluation questions can be answered by directly measuring certain things, such as a person’s height and weight or soil or water content. Sometimes, such direct measurement is combined with a survey—participants would be asked to complete a survey and to have measurements taken or tests performed. Direct measurements include anthropometry (i.e., measurement of height and weight, documentation of age) as well as blood tests, urinalysis, and exams for certain conditions (e.g., goiter and night blindness).
Direct measurement generates quantitative data. A major advantage of direct measurement is that it tends to be more accurate and reliable than individual perceptions. However, obtaining direct measurements can also be intrusive, expensive, and time consuming.
Additional Information on Direct Measurements Better Evaluation http://betterevaluation.org/plan/describe/physical_measurement
UNICEF, “Lesson 3.3: Measuring Infants, Adults and Adolescents,” in “Section 3:Measuring Undernutrition in Individuals,” Nutrition in Emergencies http://www.unicef.org/nutrition/training/3.3/contents.html
Observation Observation is useful when the required information can be obtained by watching and listening. Directly observing operations and activities, an evaluator can answer questions about whether a program is being delivered and operated as planned and can better understand both the situation and context.
Observation can be used to assess patterns of time usage or certain behaviors. It can also offer valuable insights into the social and physical context of a problem being addressed or the use of project inputs. Observation can be direct, where the observer watches and records the activities, or participatory, with the observer is part of the setting.
Observation is generally inexpensive and does not require equipment or technology. However, observation can seem intrusive, and people may act differently because they know someone is watching them. For example, when an evaluator observes healthcare providers to see whether they wash their hands between patients, it can be difficult to know the truth. Are they washing their hands because someone is watching? Or is hand washing their normal behavior?
Additional Information on Collecting Data by Observation Better Evaluation http://betterevaluation.org/plan/describe/observation
USAID Center for Development Information and Evaluation, “Using Direct Observation Techniques,” in Performance Monitoring and Evaluation Tips, No. 4, 1996 http://transition.usaid.gov/policy/evalweb/documents/TIPS-UsingDirectObservationTechniques.pdf
CHAPTER 4 | DATA SOURCES AND COLLECTION METHODS | PAGE 42
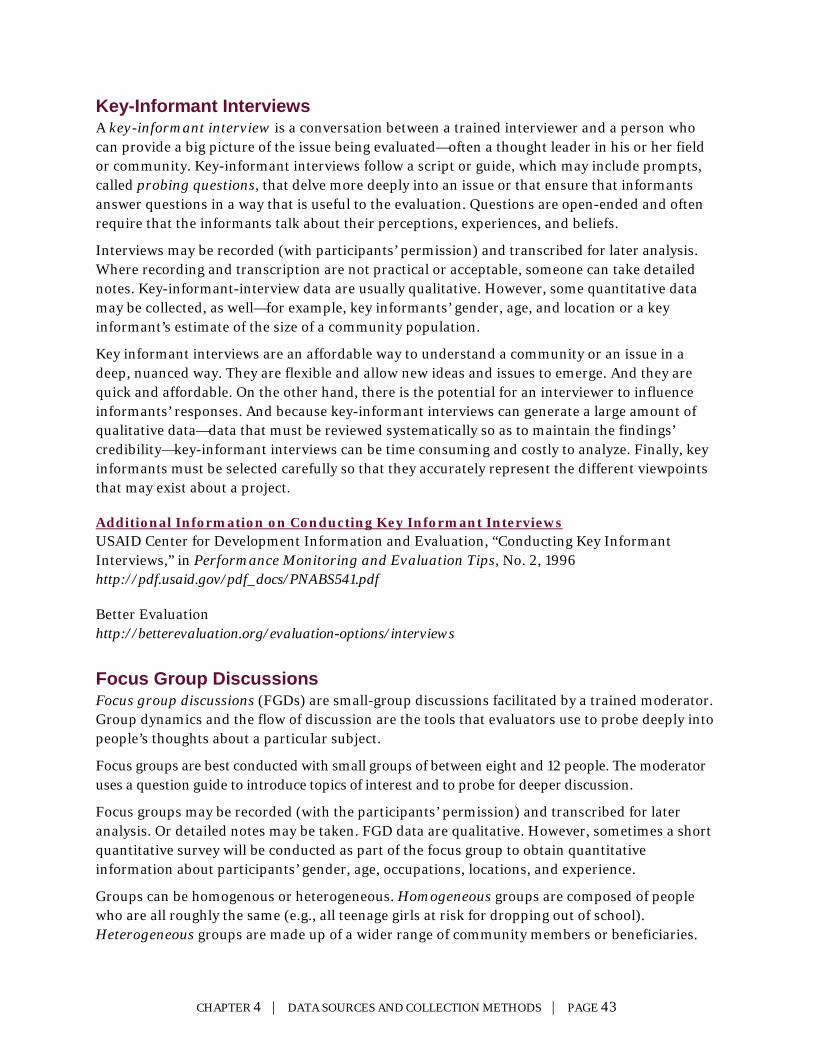
Key-Informant Interviews A key-informant interview is a conversation between a trained interviewer and a person who can provide a big picture of the issue being evaluated—often a thought leader in his or her field or community. Key-informant interviews follow a script or guide, which may include prompts, called probing questions, that delve more deeply into an issue or that ensure that informants answer questions in a way that is useful to the evaluation. Questions are open-ended and often require that the informants talk about their perceptions, experiences, and beliefs.
Interviews may be recorded (with participants’ permission) and transcribed for later analysis. Where recording and transcription are not practical or acceptable, someone can take detailed notes. Key-informant-interview data are usually qualitative. However, some quantitative data may be collected, as well—for example, key informants’ gender, age, and location or a key informant’s estimate of the size of a community population.
Key informant interviews are an affordable way to understand a community or an issue in a deep, nuanced way. They are flexible and allow new ideas and issues to emerge. And they are quick and affordable. On the other hand, there is the potential for an interviewer to influence informants’ responses. And because key-informant interviews can generate a large amount of qualitative data—data that must be reviewed systematically so as to maintain the findings’ credibility—key-informant interviews can be time consuming and costly to analyze. Finally, key informants must be selected carefully so that they accurately represent the different viewpoints that may exist about a project.
Additional Information on Conducting Key Informant Interviews USAID Center for Development Information and Evaluation, “Conducting Key Informant Interviews,” in Performance Monitoring and Evaluation Tips, No. 2, 1996 http://pdf.usaid.gov/pdf_docs/PNABS541.pdf
Better Evaluation http://betterevaluation.org/evaluation-options/interviews
Focus Group Discussions Focus group discussions (FGDs) are small-group discussions facilitated by a trained moderator. Group dynamics and the flow of discussion are the tools that evaluators use to probe deeply into people’s thoughts about a particular subject.
Focus groups are best conducted with small groups of between eight and 12 people. The moderator uses a question guide to introduce topics of interest and to probe for deeper discussion.
Focus groups may be recorded (with the participants’ permission) and transcribed for later analysis. Or detailed notes may be taken. FGD data are qualitative. However, sometimes a short quantitative survey will be conducted as part of the focus group to obtain quantitative information about participants’ gender, age, occupations, locations, and experience.
Groups can be homogenous or heterogeneous. Homogeneous groups are composed of people who are all roughly the same (e.g., all teenage girls at risk for dropping out of school). Heterogeneous groups are made up of a wider range of community members or beneficiaries.
CHAPTER 4 | DATA SOURCES AND COLLECTION METHODS | PAGE 43
Heterogeneous groups can produce a more varied conversation, with an exchange of very different viewpoints. However, in heterogeneous groups, some people may feel uncomfortable expressing themselves, especially if they are from a marginalized population. Homogeneous groups can allow people to feel more comfortable expressing themselves. To capture a diversity of viewpoints, an evaluator can convene several different homogenous focus groups—each group representing a particular slice of the population. In some cases, the nature of the project will result in focus groups that are relatively homogeneous—for example, a project that targets women’s economic empowerment.
FGD strengths and limitations are like those of key-informant interviews. In addition, FGDs can sometimes spark discussion that highlights areas of consensus and dissension. However, if a few strong personalities take over, less assertive individuals with differing viewpoints may stay silent, so facilitators must moderate the discussion in a way that ensures that all perspectives are heard. FGDs are usually not an appropriate venue for sensitive topics or where confidentiality is essential. Additionally, FGDs can generate a lot of data, which can be burdensome to analyze. Knowing when you have reached saturation in your data collection is critical to avoid collecting too much data.
Additional Information on Conducting Focus Group Discussions Julia Laidlaw, “Focus Groups,” Better Evaluation, November 8, 2012 http://betterevaluation.org/evaluation-options/FocusGroups
OMNI, Toolkit for Conducting Focus Groups http://www.rowan.edu/colleges/chss/facultystaff/focusgrouptoolkit.pdf
Most Significant Change The most significant change technique (MSC) involves the “regular collection and participatory interpretation of ‘stories’ about change rather than predetermined quantitative indicators” (Dart and Davies 2003, 138). Because many project stakeholders are involved both in deciding on the changes to be recorded and in analyzing the data, MSC is a highly participatory form of data collection.
MSC begins with the selection of the kind of change to examine and then involves gathering stories that represent that change. Next, a stakeholder panel systematically selects stories from the submissions that describe the program impact. Once changes have been identified, stakeholders meet, read the stories aloud, and discuss the value of the reported changes regularly and in depth. When a final set of stories has been chosen, a document is created to share these stories with all stakeholders.
Additional Information on Conducting Most Significant Change Evaluation Rick Davies and Jess Dart, The ‘Most Significant Change’ (MSC) Technique: A Guide to Its Use (London: Care International, April 2005) http://www.mande.co.uk/docs/MSCGuide.pdf
Better Evaluation, “Most Significant Change” http://betterevaluation.org/plan/approach/most_significant_change
CHAPTER 4 | DATA SOURCES AND COLLECTION METHODS | PAGE 44
Outcome Mapping Outcome mapping illustrates a program’s theory of change in a participatory manner, with participants explaining the link between a change that has been seen and activities they have observed. As a best practice, outcome mapping is set in motion at a workshop before program activities begin. At this workshop, expectations of the program are discussed and monitoring and evaluation plans that will adequately measure expected outcomes set up. Discussion at the workshop focuses on expected outcomes and how they relate. Outcome mapping is not generally suited to a process evaluation.
Outcome mapping works best when the evaluation’s goal is to learn outcome information about complex programs. It requires a skilled facilitator.
Additional Information on Conducting Outcome Mapping Sarah Earl, Fred Carden, and Terry Smutylo, Outcome Mapping: Building Learning and Reflection into Development Programs (Ottawa: International Development Research Centre, 2001) http://www.outcomemapping.ca/resource/resource.php?id=269
Better Evaluation, “Outcome Mapping” http://betterevaluation.org/plan/approach/outcome_mapping
Overseas Development Institute (ODI), “Tools for Knowledge and Learning: Outcome Mapping” http://www.odi.org.uk/sites/odi.org.uk/files/odi-assets/publications-opinion-files/6385.pdf
Mapping Mapping is a visualization of key landmarks’ locations. Maps can be hand drawn, taken from satellite images, or composed using GIS data and software. Maps created before and after an intervention have the potential to depict changes in landmarks that may be relevant to program evaluation. Maps can also spark discussion among community members about changes in their communities, obstacles to address, and other topics that may be a part of the evaluation questions. Where maps are used for program design, management, and monitoring, utilizing maps as part of program evaluation as well dovetails with the program’s methods, expertise, and available data overall.
Participatory Mapping Participatory mapping is commonly used as an evaluation tool, especially for programs in natural resource management (NRM). Near the beginning of the project, a group of participants draws a map of their village (or another selected area), with its important features. The group then discusses the important features of the map. Notes are taken on this discussion and attached to the map to provide additional explanation. After the intervention, the process is repeated and changes are noted (NGO Programme Karnataka-Tamil Nadu 2005)
Transect Walk A transect walk yields diagrams that include such features of land use zones as slope, drainage, vegetation, water, soils, and other resources and that compare the main features, resources, uses, and problems of the different zones. The diagrams can further refine a research team’s understanding of an area and the interaction between the physical environment and human
CHAPTER 4 | DATA SOURCES AND COLLECTION METHODS | PAGE 45

activities. Transects can be constructed by walking in a line through an area with a key informant, observing and noting specific factors and talking to people you meet on the way.
The transect walk method can be used as a baseline survey and conducted again after several years, during the same time of year, to measure changes. The changes observed can then suggest the impact of project activities on the community or its surroundings.
Additional Information on Mapping NOAA Coastal Services Center, “Stakeholder Engagement Strategies for Participatory Mapping” (Charleston, SC: NOAA Coastal Services Center, 2009) http://www.csc.noaa.gov/digitalcoast/_/pdf/participatory-mapping.pdf
International Fund for Agricultural Development (IFAD), “Good Practices in Participatory Mapping” (Rome, 2009) http://www.ifad.org/pub/map/pm_web.pdf
Julia Laidlaw, “Transect,” Better Evaluation http://betterevaluation.org/evaluation-options/transect
Stefanie Keller, “Transect Walk” (Basel: Sustainable Sanitation and Water Management, Seecon International GMBH) http://www.sswm.info/category/planning-process-tools/exploring/exploring-tools/preliminary-assessment-current-status/tran
Table 6—Decision checklist for determining suitability of an evaluation method. METHOD
CHARACTERISTIC PERTINENT QUESTIONS
TO CONSIDER Feasibility • Do you have the resources (personnel, skills, equipment, and time)?
• Can the method fulfill the evaluation purpose and answer the evaluation questions? • What are the language and literacy requirements?
Appropriateness • Does the method suit the project conditions and circumstances? • Do all the stakeholders understand and agree on the method?
Validity • Will the method provide accurate information? • Is it possible to assess the targeted indicator with accuracy?
Reliability • Will the method work whenever applied? • Will the errors that occur be acceptable?
Relevance • Does the method yield information required or does it assess another outcome? • Does the method complement the project’s basic approaches of the project—for example, is it participatory?
Sensitivity • Is the method sufficient to assess variations among different population characteristics—for example, differences among age groups or gender? • Can the method be adapted to changing conditions without excess loss of reliability?
Cost-effectiveness • Will the method produce useful information at relatively low cost? • Is there a more cost-effective alternative method?
Timeliness • Does the method use staff time wisely? Will it require withdrawing staff from their usual activities, leaving project work unattended? • Is the delay between information collection, analysis, and use at an acceptable level? • Can activities connected with the method be incorporated into other daily tasks?
CHAPTER 4 | DATA SOURCES AND COLLECTION METHODS | PAGE 46
Selecting the Right Approach and Methods Given the many evaluation methods, choosing the ones to use can be difficult. Qualitative approaches generally answer “how” or “why” questions; quantitative approaches suit “what” and “how much” questions. The extent to which the method chosen is traditional or participatory depends on the program, your experience with the various methods, available resources, and stakeholder needs. Consider a method’s strengths and limitations in selecting; the right methods are feasible, appropriate, valid, reliable, relevant, sensitive, cost-effective, and timely—qualities that can be assessed by a number of questions (Table 6, page 46, above).
Ethical Review When collecting data from human subjects, it is important to take ethical considerations into account, and it is generally recommended that evaluators be trained in data ethics. For data collection efforts that might be considered research with human subjects, the evaluation design should be examined by an internal review board (IRB). To ensure that the evaluation design and data collection methodology are ethical, consider these questions:
• If the evaluation includes a control group, is the group that receives no program benefits unduly burdened? Does the evaluation raise expectations that the control group might receive services?
• Is the evaluation tool sensitive in its questioning—for example, regarding child abuse? If sensitive areas are discussed, does the evaluation refer respondents to appropriate resources?
• Will FGDs on sensitive topics have negative consequences for participants in their communities?
• Are children being asked questions without an adult present? • Does the TOR provide for the collection of informed consent?
When an IRB is not available in the country where the evaluation is taking place, the TOR and instruments should be reviewed by a commercial IRB firm3 to ensure adherence to standard ethical practices. Written consent forms are often used in evaluations to ensure informed consent among participants. Section TOR X on page 95 provides a template for a consent form.
Summary • Traditional evaluation methods include reviews of existing records; surveys; direct
measurement; observation; key-informant interviews; and focus groups. • Participatory methods include MSC, participatory mapping, and transect walks. • Choose an approach and method that are feasible, appropriate, valid, reliable, relevant,
sensitive, cost-effective, and timely. • Data collection methods for your evaluation should be reviewed for ethical considerations.
3 One example of a commercial IRB firm is http://www.solutionsirb.com/.
CHAPTER 4 | DATA SOURCES AND COLLECTION METHODS | PAGE 47

Resources Better Evaluation, “Approaches” http://betterevaluation.org/approaches
Better Evaluation, “Define Ethical and Quality Evaluation Standards” http://betterevaluation.org/plan/manage_evaluation/ethical_evaluation
Cheyanne Church and Mark M. Rogers, “Ethics in Design, Monitoring, and Evaluation for Conflict Transformation” in Designing for Results (Washington, DC: Search for Common Ground, 2006) http://www.sfcg.org/Documents/dmechapter11.pdf
CHAPTER 4 | DATA SOURCES AND COLLECTION METHODS | PAGE 48
EXERCISE
#7: Evaluation Design via Round Robin Conversations Divide your group into several smaller subgroups, and have the groups spread out around the room. Designate a host for each group, and have the host choose a question from the list below and any others that you feel might be relevant to your planned evaluation.
At a starting signal, each group has 10 minutes to discuss the chosen question while the host takes notes. At the end of the period, have all the individuals regroup around another host. The new groups discuss the question chosen by the host of the group. Repeat the regrouping process until all participants have discussed all the questions.
At that point, invite the hosts to share key points from the several conversations they have led on their topic. Encourage questions and additional comments.
Questions • How can you have confidence that the outcomes you observe are the result of your program
and not another factor or factors? • How can you justify that the changes in the intervention population (compared to the
nonintervention population) are due to support from your program? • How do you ensure that the problems identified prior to implementation are the real
challenges to successful program implementation? • How would you prove that the responses you obtain from your beneficiaries are a true
reflection of their perceptions? • What steps might you take to definitively prove the cause and effect of the results achieved?
CHAPTER 4 | DATA SOURCES AND COLLECTION METHODS | PAGE 49
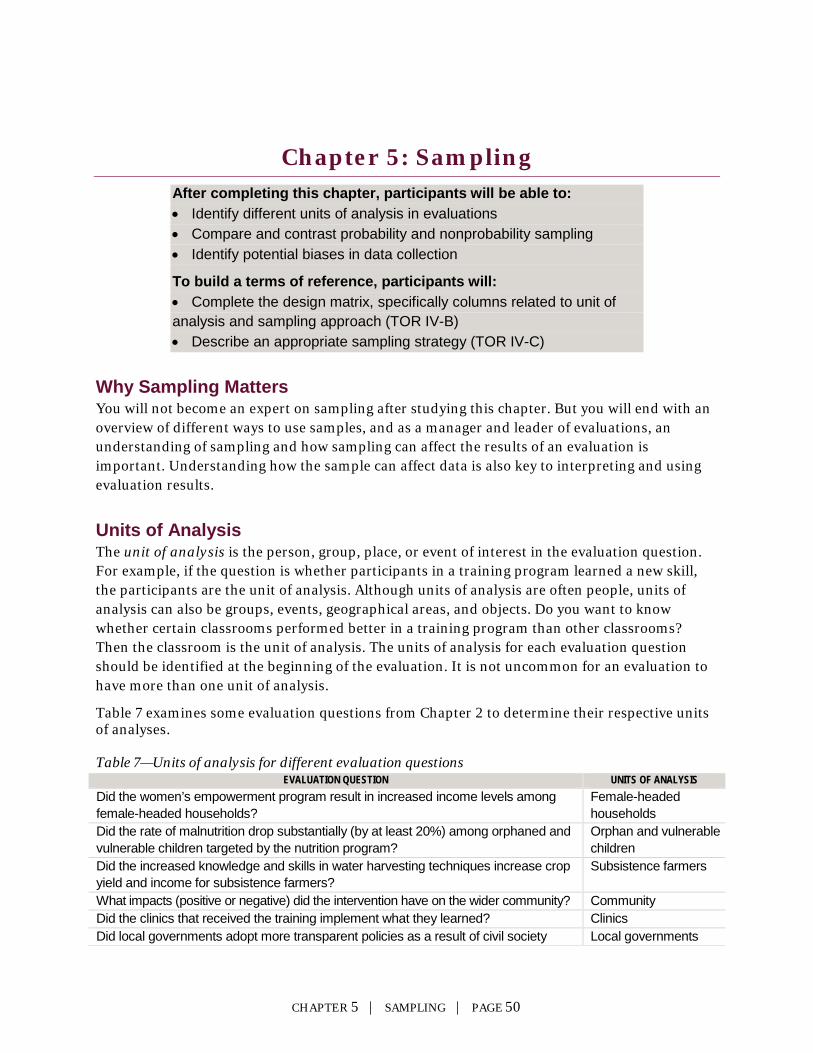
Chapter 5: Sampling After completing this chapter, participants will be able to: • Identify different units of analysis in evaluations • Compare and contrast probability and nonprobability sampling • Identify potential biases in data collection
To build a terms of reference, participants will: • Complete the design matrix, specifically columns related to unit of analysis and sampling approach (TOR IV-B) • Describe an appropriate sampling strategy (TOR IV-C)
Why Sampling Matters You will not become an expert on sampling after studying this chapter. But you will end with an overview of different ways to use samples, and as a manager and leader of evaluations, an understanding of sampling and how sampling can affect the results of an evaluation is important. Understanding how the sample can affect data is also key to interpreting and using evaluation results.
Units of Analysis The unit of analysis is the person, group, place, or event of interest in the evaluation question. For example, if the question is whether participants in a training program learned a new skill, the participants are the unit of analysis. Although units of analysis are often people, units of analysis can also be groups, events, geographical areas, and objects. Do you want to know whether certain classrooms performed better in a training program than other classrooms? Then the classroom is the unit of analysis. The units of analysis for each evaluation question should be identified at the beginning of the evaluation. It is not uncommon for an evaluation to have more than one unit of analysis.
Table 7 examines some evaluation questions from Chapter 2 to determine their respective units of analyses. Table 7—Units of analysis for different evaluation questions
EVALUATION QUESTION UNITS OF ANALYSIS Did the women’s empowerment program result in increased income levels among female-headed households?
Female-headed households
Did the rate of malnutrition drop substantially (by at least 20%) among orphaned and vulnerable children targeted by the nutrition program?
Orphan and vulnerable children
Did the increased knowledge and skills in water harvesting techniques increase crop yield and income for subsistence farmers?
Subsistence farmers
What impacts (positive or negative) did the intervention have on the wider community? Community Did the clinics that received the training implement what they learned? Clinics Did local governments adopt more transparent policies as a result of civil society Local governments
CHAPTER 5 | SAMPLING | PAGE 50
EVALUATION QUESTION UNITS OF ANALYSIS organizations’ work? Once the unit of analysis has been determined, a decision can be made as to the study subjects. Sampling is widely used to learn who should receive a survey or be measured, invited to a focus group, or otherwise targeted by the data collection.
Definition A population is the body of all the units of analysis of interest for the evaluation—perhaps all people in a village or all youth in a city. A sample is a subset of that population. Here, for purposes of simplicity, we will assume that the unit of analysis is an individual person. The methods discussed for sampling individuals can also be applied to sampling communities, organizations, or other units of analysis.
Evaluators use samples because it is often not practical to survey or observe every individual in a population. For example, to learn the average weight of 10-year-old boys in a city, every 10-year-old boy in the city could be weighed—not realistic if the city is very large. Alternatively, only a sample of 10-year-old boys could be selected and weighed. Good sampling techniques will yield an average weight in the sample that will be close to the average weight of all boys in the city.
The two broad types of sampling are: probability sampling and nonprobability sampling. Quantitative methods often employ probability sampling; qualitative methods more often use nonprobability sampling. Each technique has its strengths and limitations; some sampling techniques are better suited than others to different types of data collection and analysis methods.
Probability Sampling Probability samples, also called random samples, are subsets of the population in which every member of the population has an equal chance of being selected. In the example above, a probability sample would be one in which every 10-year-old boy in the city had an equal chance of being weighed. Boys who attended school would have the same chance of being weighed as boys who did not attend school. Boys who were poor would have the same chance of being weighed as boys who were not poor. Boys of one religion would have the same chance of being weighed as boys of another religion, and so on.
Sampling Frames There are various ways to select a probability sample. However, before we proceed, it is important to discuss sampling frames.
A sampling frame is a list of all the members of the population of interest. In the above example, the sampling frame would be a list of every 10-year-old boy in the city. To choose a sample correctly, especially a probability sample, the sampling frame must be complete. You can begin to see how a sampling frame that included only certain 10-year-old boys (e.g., children who attend school) could affect results. As the manager of an evaluation, you need to understand the sampling frame and its limitations.
Sampling frames are often drawn from pre-existing lists (e.g., census, school registration, and birth registration lists, and membership data), depending on the population of interest. When
CHAPTER 5 | SAMPLING | PAGE 51
complete lists of the population of interest do not exist, an evaluation design involving a probability sample must either create its own list for the population—which can be time-consuming and expensive if the population of interest is large—or find a method to approximate random sampling. As an example, for a village survey, surveyors might walk village paths in a predetermined order and survey every tenth house.
Sample Size The size of the sample needed depends on the size of the population, what you are trying to measure, how much you expect things to change, the proportion of people you expect to respond, and the degree of certainty you need. Statisticians and quantitative evaluation experts use various calculations to determine the appropriate sample size for probability sampling. It is important to remember three basic concepts related to sample size:
• Representativeness: The larger the sample, the more likely it is that the sample represents the evaluation population. Small samples are more likely to be unrepresentative by chance.
• Comparisons: If comparisons are to be made between populations, the total sample size needed will be larger than that needed to estimate a single population.
• Differences: The larger the differences between populations, the smaller the sample needed to draw conclusions about the differences.
It is essential to plan for the possibility that some people will refuse to participate or may not be available. In addition, in evaluations that follow people over a period of time, participants may move, die, drop out, or otherwise not be available. So, when determining the sample size, add a certain percentage to the sample size to ensure that at the end of the evaluation, the sample is large enough to conduct the desired analysis. Statisticians and quantitative evaluation experts will determine this percentage based on similar studies.
When calculating a sample size for your evaluation, start by understanding the change you wish to measure. There are several different sample size equations, and choosing one depends on your evaluation design. If you need assistance in identifying which equation to use, reach out to your results and measurement advisor at Pact headquarters.
Once you have determined which equation to use, you can calculate the sample size you need using such online tools as:
• www.openepi.com/v37/Menu/OE_Menu.htm • www.raosoft.com/samplesize.html • www.stat.ubc.ca/~rollin/stats/ssize/
Sampling Methods
Simple Random Sampling: In simple random sampling, people are selected at random to be part of the sample. When people are chosen randomly, each person has the same chance of being selected as the next. Since population records often exist in database form or in an electronic form that can be easily transferred to a spreadsheet, random sampling can be done using the basic functions of any common statistical or database software. If the population list is not digitized, there are still ways to randomly sample from a population. (Consult your results and measurement advisor to learn about them.)
CHAPTER 5 | SAMPLING | PAGE 52
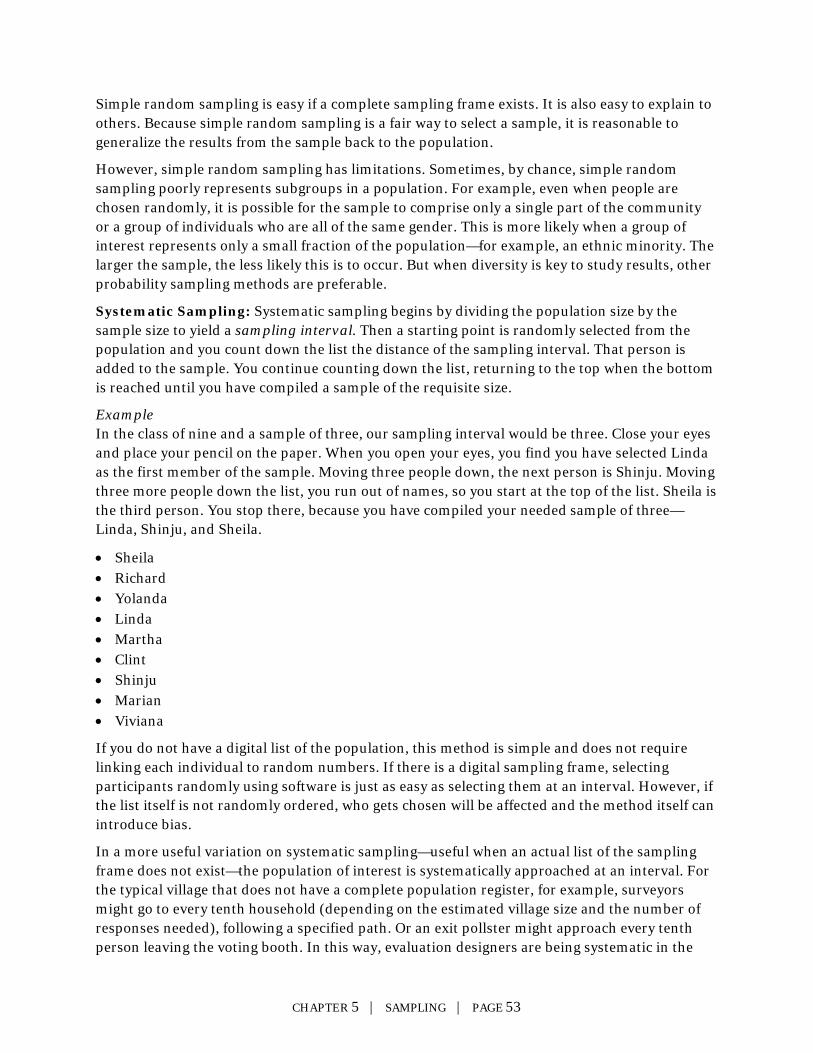
Simple random sampling is easy if a complete sampling frame exists. It is also easy to explain to others. Because simple random sampling is a fair way to select a sample, it is reasonable to generalize the results from the sample back to the population.
However, simple random sampling has limitations. Sometimes, by chance, simple random sampling poorly represents subgroups in a population. For example, even when people are chosen randomly, it is possible for the sample to comprise only a single part of the community or a group of individuals who are all of the same gender. This is more likely when a group of interest represents only a small fraction of the population—for example, an ethnic minority. The larger the sample, the less likely this is to occur. But when diversity is key to study results, other probability sampling methods are preferable.
Systematic Sampling: Systematic sampling begins by dividing the population size by the sample size to yield a sampling interval. Then a starting point is randomly selected from the population and you count down the list the distance of the sampling interval. That person is added to the sample. You continue counting down the list, returning to the top when the bottom is reached until you have compiled a sample of the requisite size.
Example In the class of nine and a sample of three, our sampling interval would be three. Close your eyes and place your pencil on the paper. When you open your eyes, you find you have selected Linda as the first member of the sample. Moving three people down, the next person is Shinju. Moving three more people down the list, you run out of names, so you start at the top of the list. Sheila is the third person. You stop there, because you have compiled your needed sample of three—Linda, Shinju, and Sheila.
• Sheila • Richard • Yolanda • Linda • Martha • Clint • Shinju • Marian • Viviana
If you do not have a digital list of the population, this method is simple and does not require linking each individual to random numbers. If there is a digital sampling frame, selecting participants randomly using software is just as easy as selecting them at an interval. However, if the list itself is not randomly ordered, who gets chosen will be affected and the method itself can introduce bias.
In a more useful variation on systematic sampling—useful when an actual list of the sampling frame does not exist—the population of interest is systematically approached at an interval. For the typical village that does not have a complete population register, for example, surveyors might go to every tenth household (depending on the estimated village size and the number of responses needed), following a specified path. Or an exit pollster might approach every tenth person leaving the voting booth. In this way, evaluation designers are being systematic in the
CHAPTER 5 | SAMPLING | PAGE 53
way they sample the population so as to maximize the likelihood that the sample surveyed will represent the population of interest as a whole.
Stratified Sampling: Stratified sampling begins by dividing the community into homogeneous groups, strata. There are many ways to stratify a community—by race, age, language, occupation, neighborhood. How you do that depends on the evaluation’s purpose and the population differences that might be important to the results. For example, an evaluation looking at how peace committees have influenced the perceptions or outcomes of different ethnic groups might stratify the population by ethnic group; this stratification guarantees that each ethnic group is included in the sample and in numbers large enough to yield statistically significant results, even if the ethnic groups are of different sizes. The study sample might over represent certain minority groups compared to their proportion in the population as a whole, but since statistical weighting methods exist to correct for such overrepresentation, it is not a major concern.
Once the strata have been determined, a sampling frame must be created for each stratum and a simple random sampling process followed for each stratum. Because knowledge of additional characteristics of individuals in a population—in the example above, their ethnicity—is necessary to construct a sampling frame, this methodology may be more expensive or more difficult in some cases than simple random sampling.
Cluster Sampling: A cluster is a collection of units that are associated in some way. For example, the unit of analysis of an education program might be the individual student, but instead of randomly sampling the population of students, an evaluation might choose to randomly sample classes in a school district and survey every child in those classes. In this way, the cluster is sampled, but the data collection and analysis are still conducted at individual level.
This method of sampling can be practical for several reasons. Sometimes it is easier to get a sampling frame at cluster level than at individual level, and it is usually more practicable to conduct data collection within a cluster than in a completely random subset of the population. With the classroom example, it would be more workable to give every student in a sample of classrooms a test than to pull a sample of students out of many classes and administer that same test. Clustering by village means that surveyors would visit many people in a few villages rather than a few people in many villages—and the former is far less costly and time consuming. However, one of the drawbacks of cluster sampling is the introduction of a “design effect,” which will significantly increase your sample size.
Multistage Sampling: Any of these sampling techniques can be combined using a strategy called multistage sampling—that is, sampling at different levels or points in the study. For example, we may randomly select which schools to include in our sample, and then within those schools randomly select which classes to include.
Another example of multistage sampling is the South African Demographic and Health Survey (SADHS). The SADHS used the 1996 census as a sampling frame, with a two-stage sampling method. The sample was stratified by urban and nonurban areas in the nine provinces. In the first stage, areas were sampled. These areas were the census enumeration areas (EA), which are the area of the country assigned to each enumerator during the census. A certain number of EAs were randomly picked from the list, though areas with higher population density were weighted
CHAPTER 5 | SAMPLING | PAGE 54
so that they were more likely to be picked.4 Second, a systematic sample of households was identified in each selected EA for the actual survey, choosing 10 non-urban households and five urban households in each EA.
Common Pitfalls to Avoid in Probability Sampling Probability sampling is a valuable technique that permits the use of statistical methods to apply findings from a small group of people to a large population. However, if done incorrectly, the results can be poor. It’s best to avoid these common pitfalls:
• The unit of analysis is not clearly identified. • There is no reliable sampling frame (many households or individuals may not be listed). • The sampling frame is outdated or incomplete. • The sampling frame excludes people who may differ in ways that are important to the
evaluation (e.g., homeless people, out-of-school youth). • When calculating the sample size, planners fail to account for refusals to participate; attrition
(dropping out of the study along the way); and systematic attrition of people with particular characteristics.
Nonprobability Sampling Techniques Sometimes a probability sample is neither necessary nor practical. An alternative is nonprobability sampling. Nonprobability sampling can be accidental or purposive. Accidental sampling, also sometimes called convenience sampling, is not generally recommended for evaluation because it introduces bias in an uncontrolled way. (This strategy uses the most easily accessible people to participate in a study—conceivably, anybody walking by who is willing to participate in a survey at a shopping mall, or all students in a college psychology class.)
Purposive Sampling Purposive sampling is a nonprobability sampling strategy that is deliberate, chosen with some purpose in mind. Qualitative methods often use purposive sampling. For example, to interview key informants with differing opinions about a local water project, people who hold different opinions would intentionally be invited, so that the interviews would illuminate a variety of perspectives. Although purposive sampling introduces bias, it is a bias that is acknowledged and made explicit. Also, because key informants are often powerful, expert stakeholders, their opinions may reveal more about a project than any random sample possibly could.
There are many different ways to gather a purposive sample as well as different kinds of stakeholders. Often, key informants are chosen because they are particularly well informed about a program or issue; many evaluations include interviews with community leaders so as to draw in their perspectives on a program. However, not all stakeholders of interest are chosen just because they are more knowledgeable than the average community member.
4 This technique is called probability proportional to size, which adjusts the probability a given area will be chosen in proportion to how large it is. In this case, high density areas were more likely to be chosen and low density areas less likely to be chosen. This helps make sure that the overall sample was representative of South Africa’s population distribution.
CHAPTER 5 | SAMPLING | PAGE 55
Modal Instance Sampling: Modal instance sampling, for example, selects the most common case, or the “typical” case. In informal public opinion polls, an evaluator might interview several “typical” voters.
Quota Sampling, Heterogeneity Sampling: In quota sampling, the population is divided into groups, or strata, according to important population characteristics. Then, people familiar with the population choose individuals they believe can adequately represent that population’s viewpoints. This approach sometimes corresponds to heterogeneity sampling, which is appropriate when it’s desirable to include all opinions or views and when representing these views proportionately is not a concern. In order to gather in all the ideas, and especially outlier or unusual ideas, it’s necessary to include a broad and diverse range of participants. Heterogeneity sampling is, in this sense, the opposite of modal instance sampling.
Snowball Sampling: In snowball sampling, sometimes called chain sampling, members of an initial group of participants refer people they know who meet a certain set of criteria to the study. These individuals may, in turn, refer others, until the identified study size is attained. The technique is particularly effective where the population of interest is hidden or difficult to reach and where no reliable sampling frame exists—perhaps for legal reasons or due to community stigma. For example, if an evaluation is studying the behavior of illegal immigrants, one illegal immigrant with whom the evaluator has built a trusting relationship might provide referrals of two other illegal immigrants, who would in turn refer two others. In this way, the evaluator can assemble a wide network to study of a population that would otherwise be inaccessible.
Sample Size for Nonprobability Sampling No formulas or standards exist for sample sizes in nonprobability sampling. Qualitative researchers refer to saturation, the point in the data collection process when patterns and themes begin to emerge and additional data confirms what they have already heard. Often, qualitative researchers begin with an approximate sample size in mind and will reduce or increase the number of participants based on how close they are to saturation.
Choosing a Sampling Strategy When designing a sampling strategy, it is important to ask the following questions:
For probability samples • What is the unit of analysis? • Does the evaluation purpose, question, or method require a probability sample? • What is the sampling frame? • How will we obtain the complete list of the population? • How will we ensure the list is accurate and up to date? • What sampling technique will we use and why? • What is the necessary sample size? • How was the sample size calculated?
For nonprobability samples • Will a nonprobability sampling technique allow us to fulfill the evaluation purpose and
question?
CHAPTER 5 | SAMPLING | PAGE 56
• Are we using purposive sampling? If so, what are our inclusion criteria? • How will we know we have reached saturation? • How will we select your participants? • How will we determine the sample size?
These critical questions will allow managers of evaluations to understand if the evaluation’s sampling strategy is practical both in terms of answering the evaluation questions and in terms of using program resources efficiently.
Summary • The unit of analysis is the person, group, place, or event of interest in the evaluation question. • Sampling is a technique that permits selection of a subgroup of the population. • Based on the evaluation purpose, questions, and methods, probability or nonprobability
sampling may make most sense.
Resources Better Evaluation, “Sample” http://betterevaluation.org/plan/describe/sample
Research Methods Knowledge Base, Sampling http://www.socialresearchmethods.net/kb/sampling.php
Cornell, “Respondent-Driven Sampling” http://www.respondentdrivensampling.org/
CHAPTER 5 | SAMPLING | PAGE 57
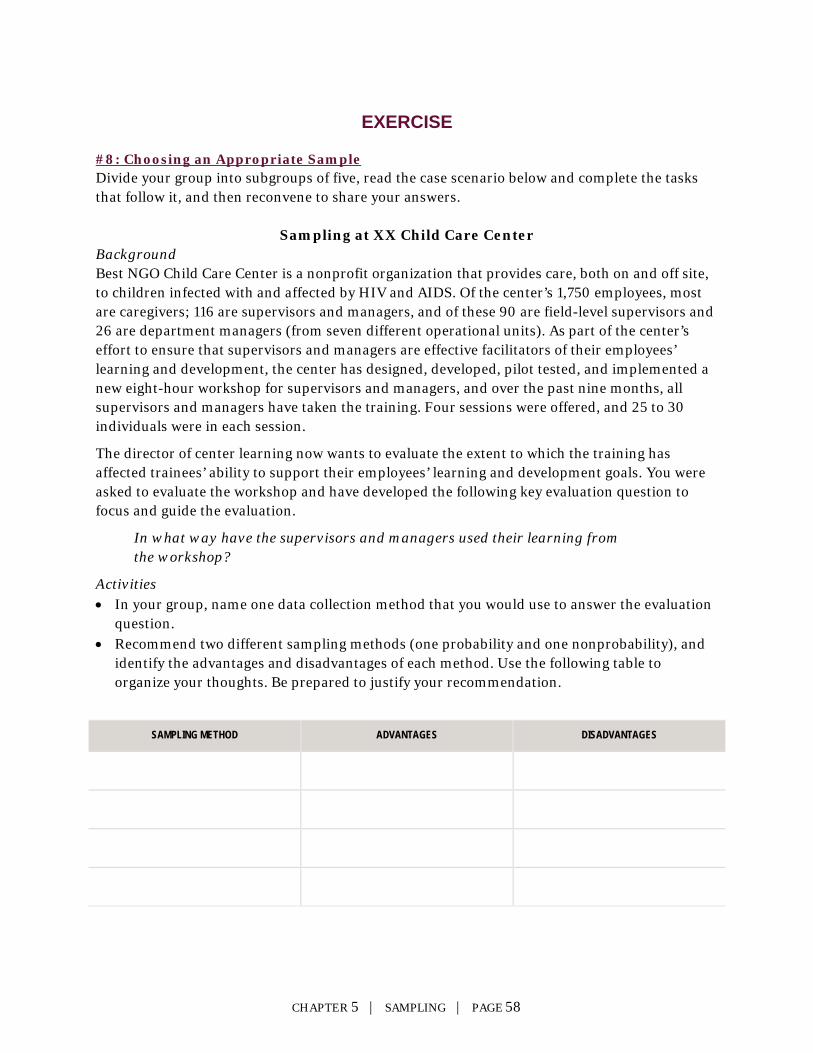
EXERCISE
#8: Choosing an Appropriate Sample Divide your group into subgroups of five, read the case scenario below and complete the tasks that follow it, and then reconvene to share your answers.
Sampling at XX Child Care Center Background Best NGO Child Care Center is a nonprofit organization that provides care, both on and off site, to children infected with and affected by HIV and AIDS. Of the center’s 1,750 employees, most are caregivers; 116 are supervisors and managers, and of these 90 are field-level supervisors and 26 are department managers (from seven different operational units). As part of the center’s effort to ensure that supervisors and managers are effective facilitators of their employees’ learning and development, the center has designed, developed, pilot tested, and implemented a new eight-hour workshop for supervisors and managers, and over the past nine months, all supervisors and managers have taken the training. Four sessions were offered, and 25 to 30 individuals were in each session.
The director of center learning now wants to evaluate the extent to which the training has affected trainees’ ability to support their employees’ learning and development goals. You were asked to evaluate the workshop and have developed the following key evaluation question to focus and guide the evaluation.
In what way have the supervisors and managers used their learning from the workshop?
Activities • In your group, name one data collection method that you would use to answer the evaluation
question. • Recommend two different sampling methods (one probability and one nonprobability), and
identify the advantages and disadvantages of each method. Use the following table to organize your thoughts. Be prepared to justify your recommendation.
SAMPLING METHOD ADVANTAGES DISADVANTAGES
CHAPTER 5 | SAMPLING | PAGE 58
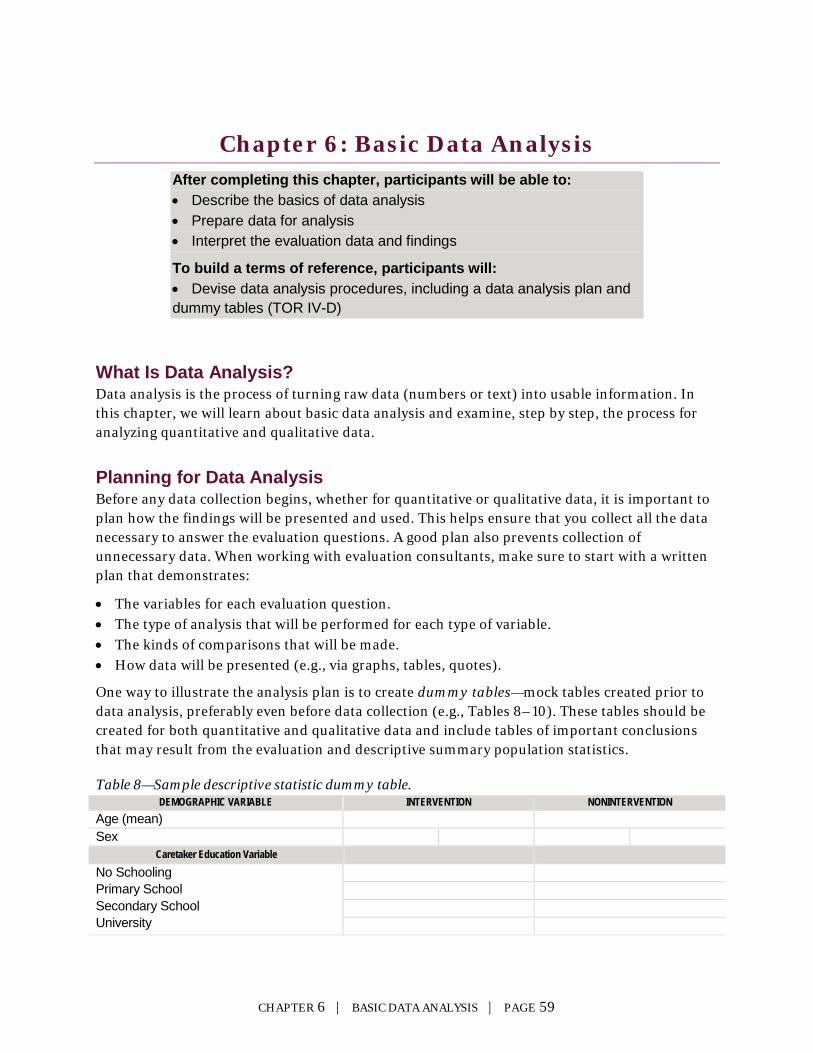
Chapter 6: Basic Data Analysis After completing this chapter, participants will be able to: • Describe the basics of data analysis • Prepare data for analysis • Interpret the evaluation data and findings
To build a terms of reference, participants will: • Devise data analysis procedures, including a data analysis plan and dummy tables (TOR IV-D)
What Is Data Analysis? Data analysis is the process of turning raw data (numbers or text) into usable information. In this chapter, we will learn about basic data analysis and examine, step by step, the process for analyzing quantitative and qualitative data.
Planning for Data Analysis Before any data collection begins, whether for quantitative or qualitative data, it is important to plan how the findings will be presented and used. This helps ensure that you collect all the data necessary to answer the evaluation questions. A good plan also prevents collection of unnecessary data. When working with evaluation consultants, make sure to start with a written plan that demonstrates:
• The variables for each evaluation question. • The type of analysis that will be performed for each type of variable. • The kinds of comparisons that will be made. • How data will be presented (e.g., via graphs, tables, quotes).
One way to illustrate the analysis plan is to create dummy tables—mock tables created prior to data analysis, preferably even before data collection (e.g., Tables 8–10). These tables should be created for both quantitative and qualitative data and include tables of important conclusions that may result from the evaluation and descriptive summary population statistics.
Table 8—Sample descriptive statistic dummy table. DEMOGRAPHIC VARIABLE INTERVENTION NONINTERVENTION
Age (mean) Sex
Caretaker Education Variable No Schooling Primary School Secondary School University
CHAPTER 6 | BASIC DATA ANALYSIS | PAGE 59
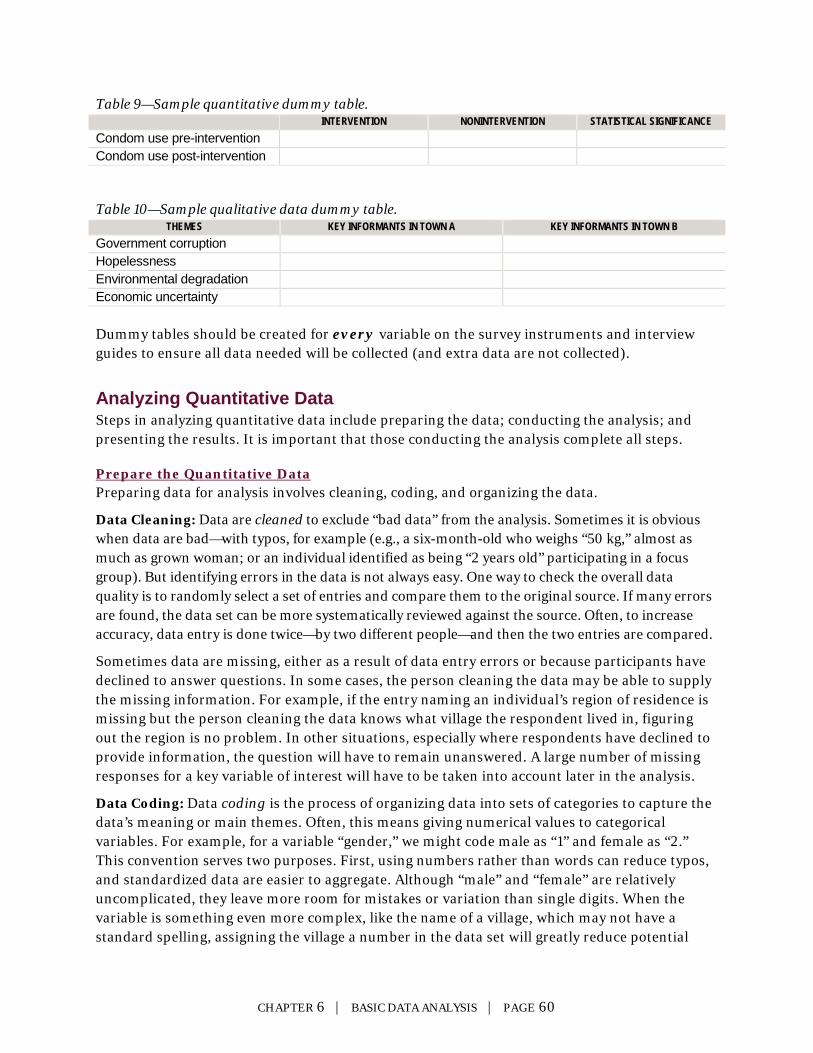
Table 9—Sample quantitative dummy table. INTERVENTION NONINTERVENTION STATISTICAL SIGNIFICANCE
Condom use pre-intervention Condom use post-intervention
Table 10—Sample qualitative data dummy table. THEMES KEY INFORMANTS IN TOWN A KEY INFORMANTS IN TOWN B
Government corruption Hopelessness Environmental degradation Economic uncertainty Dummy tables should be created for every variable on the survey instruments and interview guides to ensure all data needed will be collected (and extra data are not collected).
Analyzing Quantitative Data Steps in analyzing quantitative data include preparing the data; conducting the analysis; and presenting the results. It is important that those conducting the analysis complete all steps.
Prepare the Quantitative Data Preparing data for analysis involves cleaning, coding, and organizing the data.
Data Cleaning: Data are cleaned to exclude “bad data” from the analysis. Sometimes it is obvious when data are bad—with typos, for example (e.g., a six-month-old who weighs “50 kg,” almost as much as grown woman; or an individual identified as being “2 years old” participating in a focus group). But identifying errors in the data is not always easy. One way to check the overall data quality is to randomly select a set of entries and compare them to the original source. If many errors are found, the data set can be more systematically reviewed against the source. Often, to increase accuracy, data entry is done twice—by two different people—and then the two entries are compared.
Sometimes data are missing, either as a result of data entry errors or because participants have declined to answer questions. In some cases, the person cleaning the data may be able to supply the missing information. For example, if the entry naming an individual’s region of residence is missing but the person cleaning the data knows what village the respondent lived in, figuring out the region is no problem. In other situations, especially where respondents have declined to provide information, the question will have to remain unanswered. A large number of missing responses for a key variable of interest will have to be taken into account later in the analysis.
Data Coding: Data coding is the process of organizing data into sets of categories to capture the data’s meaning or main themes. Often, this means giving numerical values to categorical variables. For example, for a variable “gender,” we might code male as “1” and female as “2.” This convention serves two purposes. First, using numbers rather than words can reduce typos, and standardized data are easier to aggregate. Although “male” and “female” are relatively uncomplicated, they leave more room for mistakes or variation than single digits. When the variable is something even more complex, like the name of a village, which may not have a standard spelling, assigning the village a number in the data set will greatly reduce potential
CHAPTER 6 | BASIC DATA ANALYSIS | PAGE 60
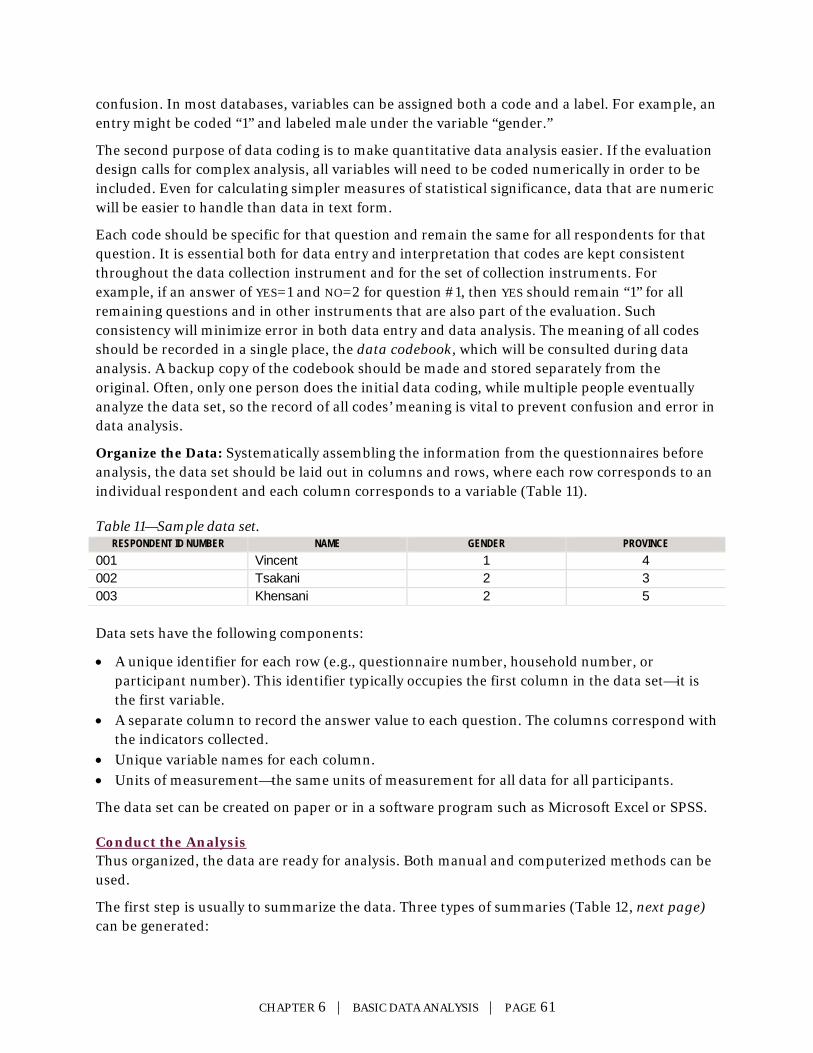
confusion. In most databases, variables can be assigned both a code and a label. For example, an entry might be coded “1” and labeled male under the variable “gender.”
The second purpose of data coding is to make quantitative data analysis easier. If the evaluation design calls for complex analysis, all variables will need to be coded numerically in order to be included. Even for calculating simpler measures of statistical significance, data that are numeric will be easier to handle than data in text form.
Each code should be specific for that question and remain the same for all respondents for that question. It is essential both for data entry and interpretation that codes are kept consistent throughout the data collection instrument and for the set of collection instruments. For example, if an answer of YES=1 and NO=2 for question #1, then YES should remain “1” for all remaining questions and in other instruments that are also part of the evaluation. Such consistency will minimize error in both data entry and data analysis. The meaning of all codes should be recorded in a single place, the data codebook, which will be consulted during data analysis. A backup copy of the codebook should be made and stored separately from the original. Often, only one person does the initial data coding, while multiple people eventually analyze the data set, so the record of all codes’ meaning is vital to prevent confusion and error in data analysis.
Organize the Data: Systematically assembling the information from the questionnaires before analysis, the data set should be laid out in columns and rows, where each row corresponds to an individual respondent and each column corresponds to a variable (Table 11).
Table 11—Sample data set. RESPONDENT ID NUMBER NAME GENDER PROVINCE
001 Vincent 1 4 002 Tsakani 2 3 003 Khensani 2 5 Data sets have the following components:
• A unique identifier for each row (e.g., questionnaire number, household number, or participant number). This identifier typically occupies the first column in the data set—it is the first variable.
• A separate column to record the answer value to each question. The columns correspond with the indicators collected.
• Unique variable names for each column. • Units of measurement—the same units of measurement for all data for all participants.
The data set can be created on paper or in a software program such as Microsoft Excel or SPSS.
Conduct the Analysis Thus organized, the data are ready for analysis. Both manual and computerized methods can be used.
The first step is usually to summarize the data. Three types of summaries (Table 12, next page) can be generated:
CHAPTER 6 | BASIC DATA ANALYSIS | PAGE 61
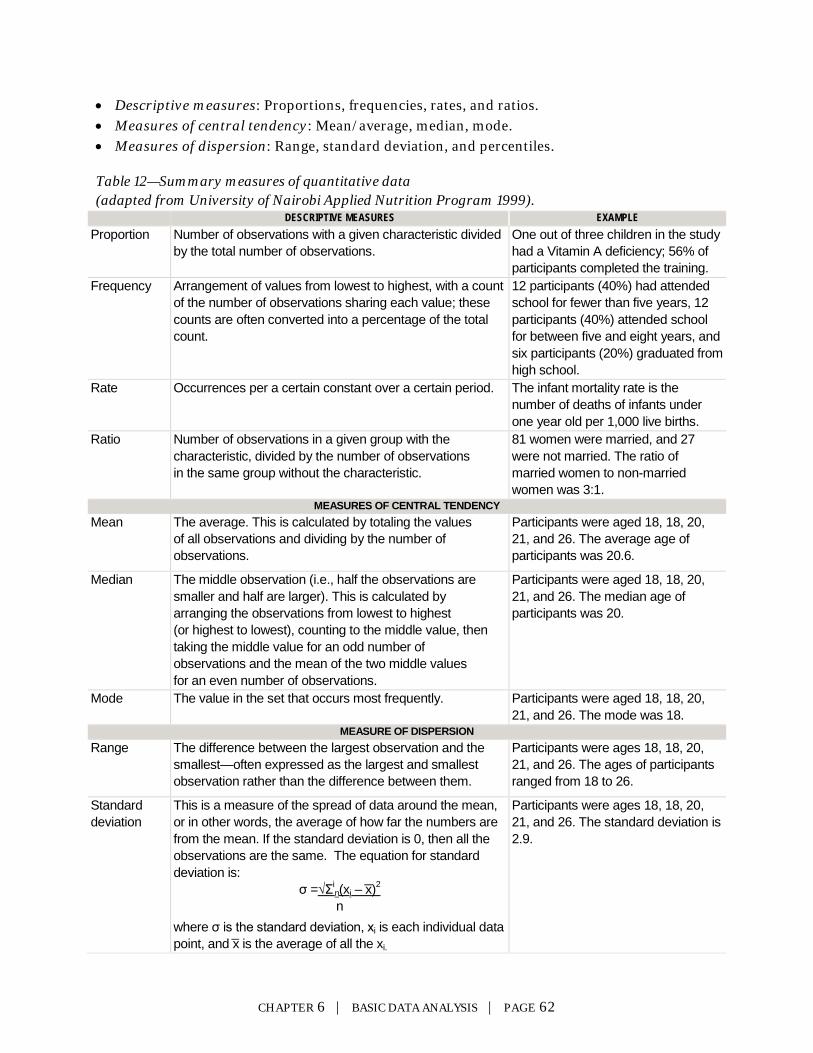
• Descriptive measures: Proportions, frequencies, rates, and ratios. • Measures of central tendency: Mean/average, median, mode. • Measures of dispersion: Range, standard deviation, and percentiles.
Table 12—Summary measures of quantitative data (adapted from University of Nairobi Applied Nutrition Program 1999).
DESCRIPTIVE MEASURES EXAMPLE Proportion Number of observations with a given characteristic divided
by the total number of observations. One out of three children in the study had a Vitamin A deficiency; 56% of participants completed the training.
Frequency Arrangement of values from lowest to highest, with a count of the number of observations sharing each value; these counts are often converted into a percentage of the total count.
12 participants (40%) had attended school for fewer than five years, 12 participants (40%) attended school for between five and eight years, and six participants (20%) graduated from high school.
Rate Occurrences per a certain constant over a certain period. The infant mortality rate is the number of deaths of infants under one year old per 1,000 live births.
Ratio Number of observations in a given group with the characteristic, divided by the number of observations in the same group without the characteristic.
81 women were married, and 27 were not married. The ratio of married women to non-married women was 3:1.
MEASURES OF CENTRAL TENDENCY Mean The average. This is calculated by totaling the values
of all observations and dividing by the number of observations.
Participants were aged 18, 18, 20, 21, and 26. The average age of participants was 20.6.
Median The middle observation (i.e., half the observations are smaller and half are larger). This is calculated by arranging the observations from lowest to highest (or highest to lowest), counting to the middle value, then taking the middle value for an odd number of observations and the mean of the two middle values for an even number of observations.
Participants were aged 18, 18, 20, 21, and 26. The median age of participants was 20.
Mode The value in the set that occurs most frequently. Participants were aged 18, 18, 20, 21, and 26. The mode was 18.
MEASURE OF DISPERSION Range The difference between the largest observation and the
smallest—often expressed as the largest and smallest observation rather than the difference between them.
Participants were ages 18, 18, 20, 21, and 26. The ages of participants ranged from 18 to 26.
Standard deviation
This is a measure of the spread of data around the mean, or in other words, the average of how far the numbers are from the mean. If the standard deviation is 0, then all the observations are the same. The equation for standard deviation is:
σ =√Σin(xi – ͞x)2 n
where σ is the standard deviation, xi is each individual data point, and ͞x is the average of all the xi.
Participants were ages 18, 18, 20, 21, and 26. The standard deviation is 2.9.
CHAPTER 6 | BASIC DATA ANALYSIS | PAGE 62
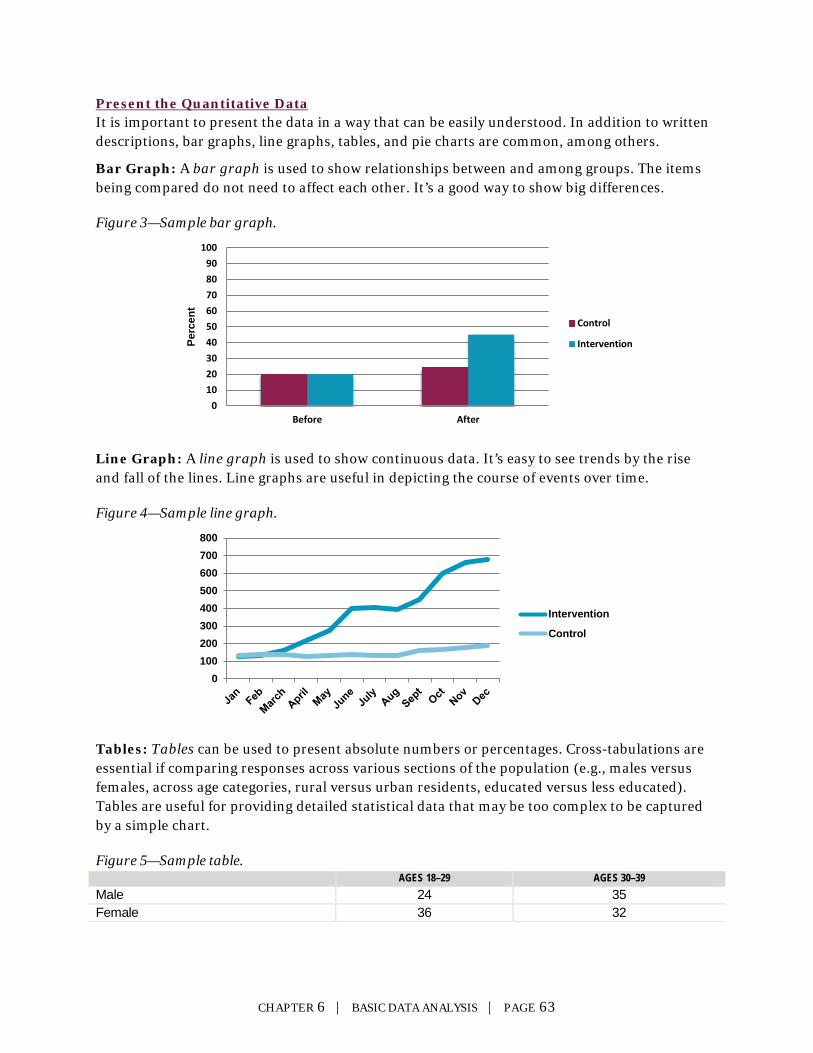
Present the Quantitative Data It is important to present the data in a way that can be easily understood. In addition to written descriptions, bar graphs, line graphs, tables, and pie charts are common, among others.
Bar Graph: A bar graph is used to show relationships between and among groups. The items being compared do not need to affect each other. It’s a good way to show big differences.
Figure 3—Sample bar graph.
Line Graph: A line graph is used to show continuous data. It’s easy to see trends by the rise and fall of the lines. Line graphs are useful in depicting the course of events over time.
Figure 4—Sample line graph.
Tables: Tables can be used to present absolute numbers or percentages. Cross-tabulations are essential if comparing responses across various sections of the population (e.g., males versus females, across age categories, rural versus urban residents, educated versus less educated). Tables are useful for providing detailed statistical data that may be too complex to be captured by a simple chart.
Figure 5—Sample table. AGES 18–29 AGES 30–39
Male 24 35 Female 36 32
0102030405060708090
100
Before After
Perc
ent
Control
Intervention
0100200300400500600700800
Intervention
Control
CHAPTER 6 | BASIC DATA ANALYSIS | PAGE 63
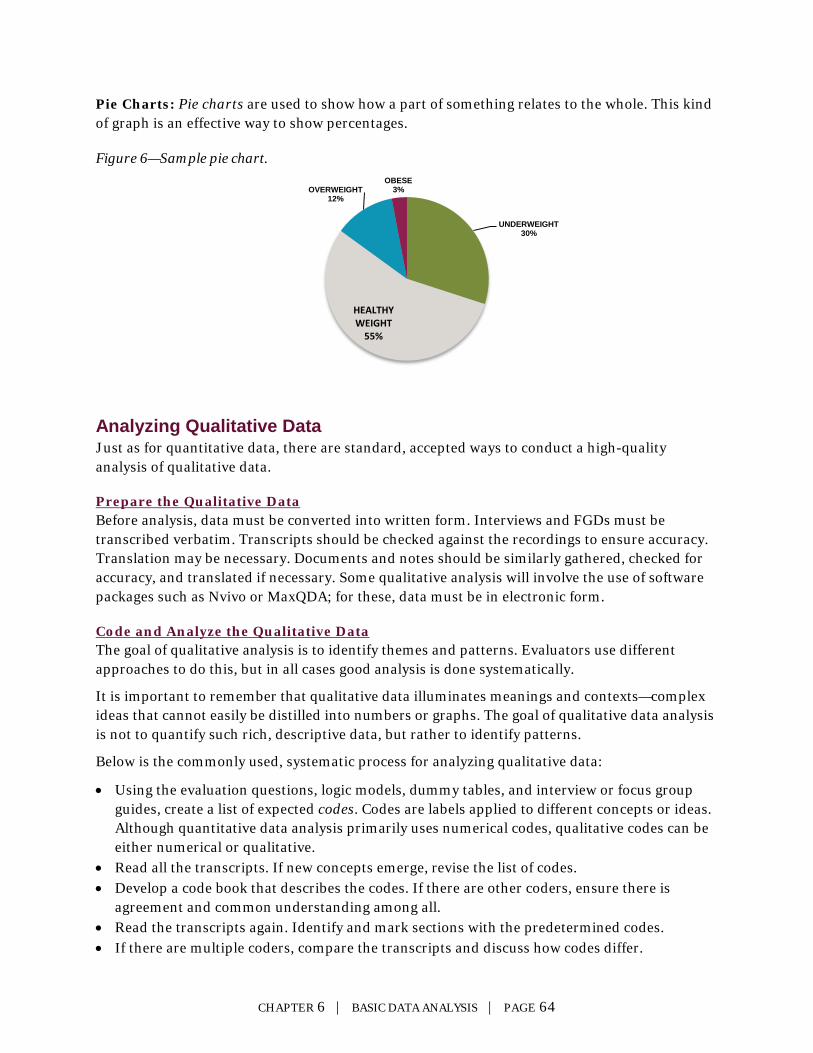
Pie Charts: Pie charts are used to show how a part of something relates to the whole. This kind of graph is an effective way to show percentages.
Figure 6—Sample pie chart.
Analyzing Qualitative Data Just as for quantitative data, there are standard, accepted ways to conduct a high-quality analysis of qualitative data.
Prepare the Qualitative Data Before analysis, data must be converted into written form. Interviews and FGDs must be transcribed verbatim. Transcripts should be checked against the recordings to ensure accuracy. Translation may be necessary. Documents and notes should be similarly gathered, checked for accuracy, and translated if necessary. Some qualitative analysis will involve the use of software packages such as Nvivo or MaxQDA; for these, data must be in electronic form.
Code and Analyze the Qualitative Data The goal of qualitative analysis is to identify themes and patterns. Evaluators use different approaches to do this, but in all cases good analysis is done systematically.
It is important to remember that qualitative data illuminates meanings and contexts—complex ideas that cannot easily be distilled into numbers or graphs. The goal of qualitative data analysis is not to quantify such rich, descriptive data, but rather to identify patterns.
Below is the commonly used, systematic process for analyzing qualitative data:
• Using the evaluation questions, logic models, dummy tables, and interview or focus group guides, create a list of expected codes. Codes are labels applied to different concepts or ideas. Although quantitative data analysis primarily uses numerical codes, qualitative codes can be either numerical or qualitative.
• Read all the transcripts. If new concepts emerge, revise the list of codes. • Develop a code book that describes the codes. If there are other coders, ensure there is
agreement and common understanding among all. • Read the transcripts again. Identify and mark sections with the predetermined codes. • If there are multiple coders, compare the transcripts and discuss how codes differ.
UNDERWEIGHT 30%
HEALTHY WEIGHT
55%
OVERWEIGHT 12%
OBESE 3%
CHAPTER 6 | BASIC DATA ANALYSIS | PAGE 64
• Review the coded data and combine them into a manageable set of themes, usually between five and seven themes. These themes usually comprise the study’s main findings.
Present the Qualitative Data Qualitative findings are most often presented as narrative description. Depending on the evaluation questions, the narrative may describe how participants viewed the setting, their personal experiences, or the order of certain events.
Quotes are often included in the narrative description. By using participants’ exact words, themes can become clearer. Quotes can be used as codes or themes. When qualitative data include images, representative images can be included in the evaluation presentation.
Tables are helpful in summarizing findings. Matrices or cross-tabulations can be used to compare themes between or among groups. Diagrams can be used to visually depict concepts, compare groups, and show a process or series of events.
Summary • Dummy tables are mock tables created during the evaluation planning process and help
evaluators prepare to collect and analyze data in a way that will facilitate answering the evaluation questions.
• The steps in analyzing quantitative and qualitative data are: prepare for analysis; analyze the data; and present the data.
Resources Open Learning Initiative, “Probability and Statistics” (Pittsburgh: Carnegie Mellon University, 2012) http://oli.cmu.edu/courses/free-open/statistics-course-details/
“Qualitative Data Analysis” http://www.sagepub.com/upm-data/43454_10.pdf
Jim Stikeleather, “Three Elements of Successful Data Visualization” (Cambridge: Harvard Business Review Blog Network, Harvard Business Publishing, April 19, 2013) http://blogs.hbr.org/cs/2013/04/the_three_elements_of_successf.html
Jen Underwood, “Data Visualization Best Practices” (San Francisco: SlideShare Inc., April 10, 2013) http://www.slideshare.net/idigdata/data-visualization-best-practices-2013
Vinil Patel, “How to Choose the Right Visualization for Your Data” (McLean, VA: LogiAnalytics, August 6, 2013) http://www.logianalytics.com/blog/logianalytics-how-to-choose-the-right-visualization-for-your-data
CHAPTER 6 | BASIC DATA ANALYSIS | PAGE 65
EXERCISES
#9: Quantitative Data Analysis Participants form groups of four to five people. Make sure that each group has at least one laptop and person who is good at Excel. Share the spreadsheet with program data in Microsoft Excel format. Ask participants to analyze the data within their group. Advise the group that the data analysis should be with the goal of highlighting useful information and, if possible, suggesting conclusions.
Ask two volunteer groups to share their work for plenary discussion
#10: Qualitative Data Analysis Participants form groups of four to five people. A facilitator hands out summary survey results of a hypothetical survey and copies of the Guidance for Qualitative Data Analysis. Undertake an analysis of the results with your group; use the Guidance document to further help analyze the data.
Share your analysis and group work with the entire group.
CHAPTER 6 | BASIC DATA ANALYSIS | PAGE 66
Chapter 7: Using and Communicating the Results After completing this chapter, participants will be able to: • Maximize the use of evaluation findings • Write or oversee the writing of an evaluation report • Develop a plan to share the results
To build a terms of reference, participants will: • Describe the layout and content of the evaluation report (TOR VII-A) • Develop a dissemination plan to share evaluation findings with stakeholders (TOR VII-B)
Using Evaluation Results Chapter 1 discussed the reasons to evaluate programs: learning, improving, decision making, demonstrating effectiveness, and understanding what works and what does not. Knowing why a program is being evaluated is essential if the results are to be useful.
Chapter 1 also emphasized that involving different stakeholders would stimulate the ultimate use of the findings. Before moving ahead in this chapter, take a moment to review the stakeholder analysis from Chapter 2, which addressed how stakeholders might use findings.
Also revisit your original evaluation purpose statement and the text covering evaluation purpose and questions in Chapter 2 (pages 23–26). Sometimes the initial intent still holds true, and sometimes not—occasionally the purpose has changed and new potential uses for the evaluation have emerged. This chapter will discuss how to write a quality evaluation report and how to share that report in ways to inspire its use.
Evaluation Report The evaluation report, the main product of the evaluation process, should contain:
• A title page • A list of acronyms and abbreviations • A table of contents, including a list of annexes • An executive summary (ES) • An introduction describing the program’s background and context • A description of the program and the logic model • A statement of the purpose of the evaluation • Key questions and a statement of the scope of the evaluation, with information on limitations
and delimitations • An overview of the evaluation approach and methodology • Data sources • Findings
CHAPTER 7 | USING AND COMMUNICATING THE RESULTS | PAGE 67
• A summary and explanation of findings and interpretations • Conclusions • Recommendations • Lessons, generalizations, alternatives • Appendices, also known as annexes, including a special methods annex
A good evaluation report is easy to read and free of jargon. Tables, charts, diagrams, and other visuals highlight key findings in clear, simple ways. Because not everyone will be interested in the complete report, a brief ES is important. It should include background and program description and state the evaluation purpose, questions, scope, methodology, data sources, key findings, conclusions, and key recommendations, but should introduce no new material that is not in the main document.
Selected Criteria to Ensure Quality of the Evaluation Report Excerpted from US Agency for International Development, 2011
• The evaluation report should represent a thoughtful, well-researched, well-organized effort to objectively evaluate what worked in the project, what did not, and why.
• Evaluation reports shall address all evaluation questions included in the terms of reference. • The evaluation report should include the terms of reference as an annex. All modifications
to the scope of work—whether in technical requirements, evaluation questions, evaluation team composition, methodology, or timeline—need to be agreed on in writing.
• Evaluation methodology shall be explained in detail and all tools used in conducting the evaluation, such as questionnaires, checklists, and discussion guides will be included in an Annex in the final report.
• Evaluation findings will assess outcomes and impact on males and females. • Limitations to the evaluation shall be disclosed in the report, with particular attention to
the limitations associated with the evaluation methodology (selection bias, recall bias, unobservable differences between comparator groups, etc.)
• Evaluation findings should be presented as analyzed facts, evidence, and data and not based on anecdotes, hearsay, or the compilation of people’s opinions. Findings should be specific, concise, and supported by strong quantitative or qualitative evidence.
• Sources of information need to be properly identified and listed in an annex. • Recommendations need to be supported by a specific set of findings. • Recommendations should be action-oriented, practical, and specific, with defined
responsibility for the action.
CHAPTER 7 | USING AND COMMUNICATING THE RESULTS | PAGE 68
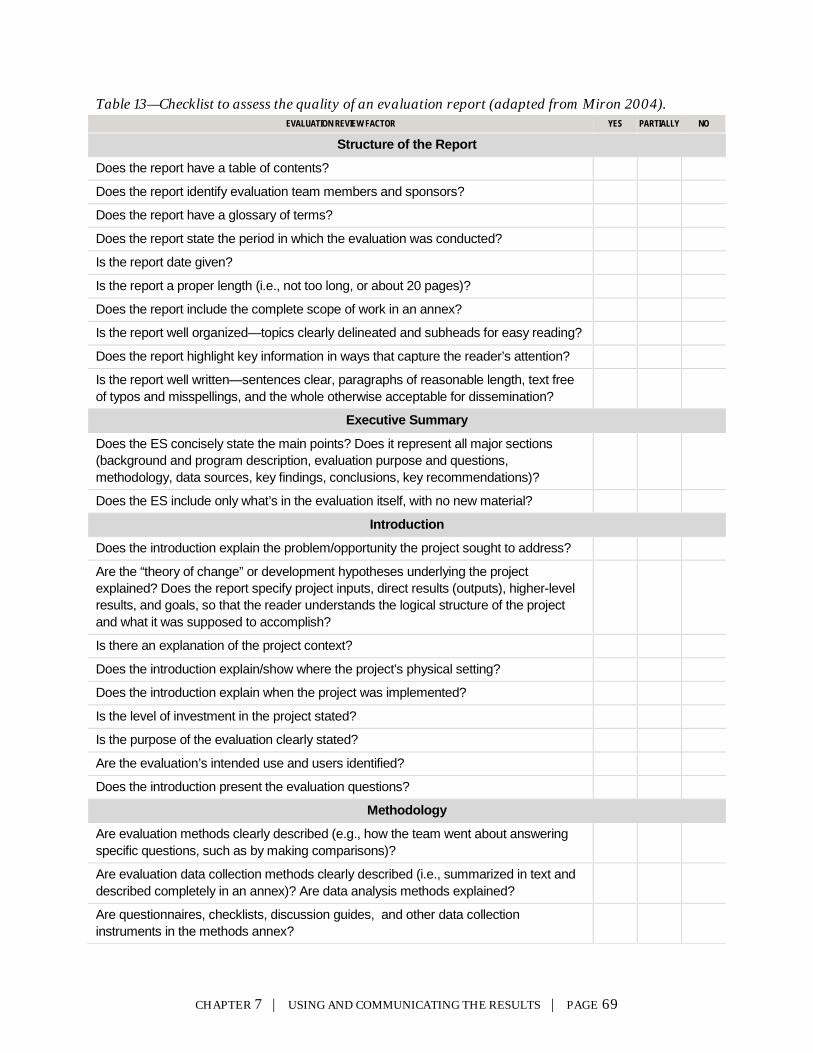
Table 13—Checklist to assess the quality of an evaluation report (adapted from Miron 2004). EVALUATION REVIEW FACTOR YES PARTIALLY NO
Structure of the Report
Does the report have a table of contents?
Does the report identify evaluation team members and sponsors?
Does the report have a glossary of terms?
Does the report state the period in which the evaluation was conducted?
Is the report date given?
Is the report a proper length (i.e., not too long, or about 20 pages)?
Does the report include the complete scope of work in an annex?
Is the report well organized—topics clearly delineated and subheads for easy reading?
Does the report highlight key information in ways that capture the reader’s attention?
Is the report well written—sentences clear, paragraphs of reasonable length, text free of typos and misspellings, and the whole otherwise acceptable for dissemination?
Executive Summary
Does the ES concisely state the main points? Does it represent all major sections (background and program description, evaluation purpose and questions, methodology, data sources, key findings, conclusions, key recommendations)?
Does the ES include only what’s in the evaluation itself, with no new material?
Introduction
Does the introduction explain the problem/opportunity the project sought to address?
Are the “theory of change” or development hypotheses underlying the project explained? Does the report specify project inputs, direct results (outputs), higher-level results, and goals, so that the reader understands the logical structure of the project and what it was supposed to accomplish?
Is there an explanation of the project context?
Does the introduction explain/show where the project’s physical setting?
Does the introduction explain when the project was implemented?
Is the level of investment in the project stated?
Is the purpose of the evaluation clearly stated?
Are the evaluation’s intended use and users identified?
Does the introduction present the evaluation questions?
Methodology
Are evaluation methods clearly described (e.g., how the team went about answering specific questions, such as by making comparisons)?
Are evaluation data collection methods clearly described (i.e., summarized in text and described completely in an annex)? Are data analysis methods explained?
Are questionnaires, checklists, discussion guides, and other data collection instruments in the methods annex?
CHAPTER 7 | USING AND COMMUNICATING THE RESULTS | PAGE 69
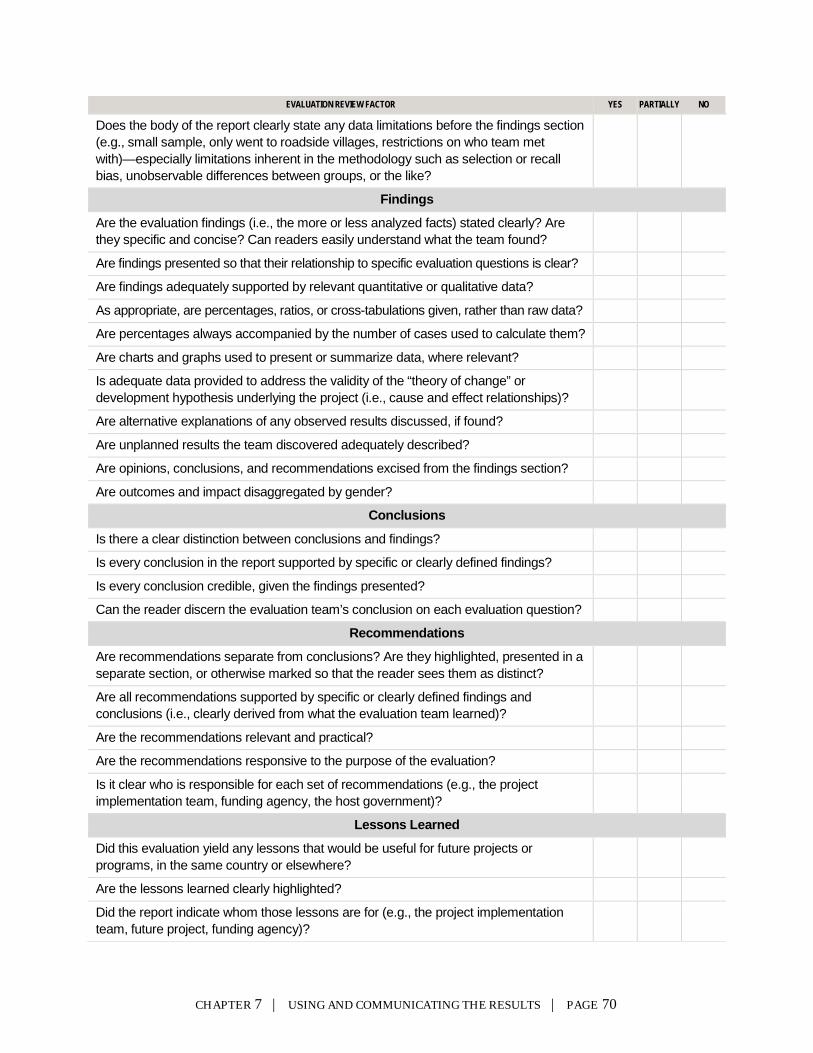
EVALUATION REVIEW FACTOR YES PARTIALLY NO
Does the body of the report clearly state any data limitations before the findings section (e.g., small sample, only went to roadside villages, restrictions on who team met with)—especially limitations inherent in the methodology such as selection or recall bias, unobservable differences between groups, or the like?
Findings
Are the evaluation findings (i.e., the more or less analyzed facts) stated clearly? Are they specific and concise? Can readers easily understand what the team found?
Are findings presented so that their relationship to specific evaluation questions is clear?
Are findings adequately supported by relevant quantitative or qualitative data?
As appropriate, are percentages, ratios, or cross-tabulations given, rather than raw data?
Are percentages always accompanied by the number of cases used to calculate them?
Are charts and graphs used to present or summarize data, where relevant?
Is adequate data provided to address the validity of the “theory of change” or development hypothesis underlying the project (i.e., cause and effect relationships)?
Are alternative explanations of any observed results discussed, if found?
Are unplanned results the team discovered adequately described?
Are opinions, conclusions, and recommendations excised from the findings section?
Are outcomes and impact disaggregated by gender?
Conclusions
Is there a clear distinction between conclusions and findings?
Is every conclusion in the report supported by specific or clearly defined findings?
Is every conclusion credible, given the findings presented?
Can the reader discern the evaluation team’s conclusion on each evaluation question?
Recommendations
Are recommendations separate from conclusions? Are they highlighted, presented in a separate section, or otherwise marked so that the reader sees them as distinct?
Are all recommendations supported by specific or clearly defined findings and conclusions (i.e., clearly derived from what the evaluation team learned)?
Are the recommendations relevant and practical?
Are the recommendations responsive to the purpose of the evaluation?
Is it clear who is responsible for each set of recommendations (e.g., the project implementation team, funding agency, the host government)?
Lessons Learned
Did this evaluation yield any lessons that would be useful for future projects or programs, in the same country or elsewhere?
Are the lessons learned clearly highlighted?
Did the report indicate whom those lessons are for (e.g., the project implementation team, future project, funding agency)?
CHAPTER 7 | USING AND COMMUNICATING THE RESULTS | PAGE 70
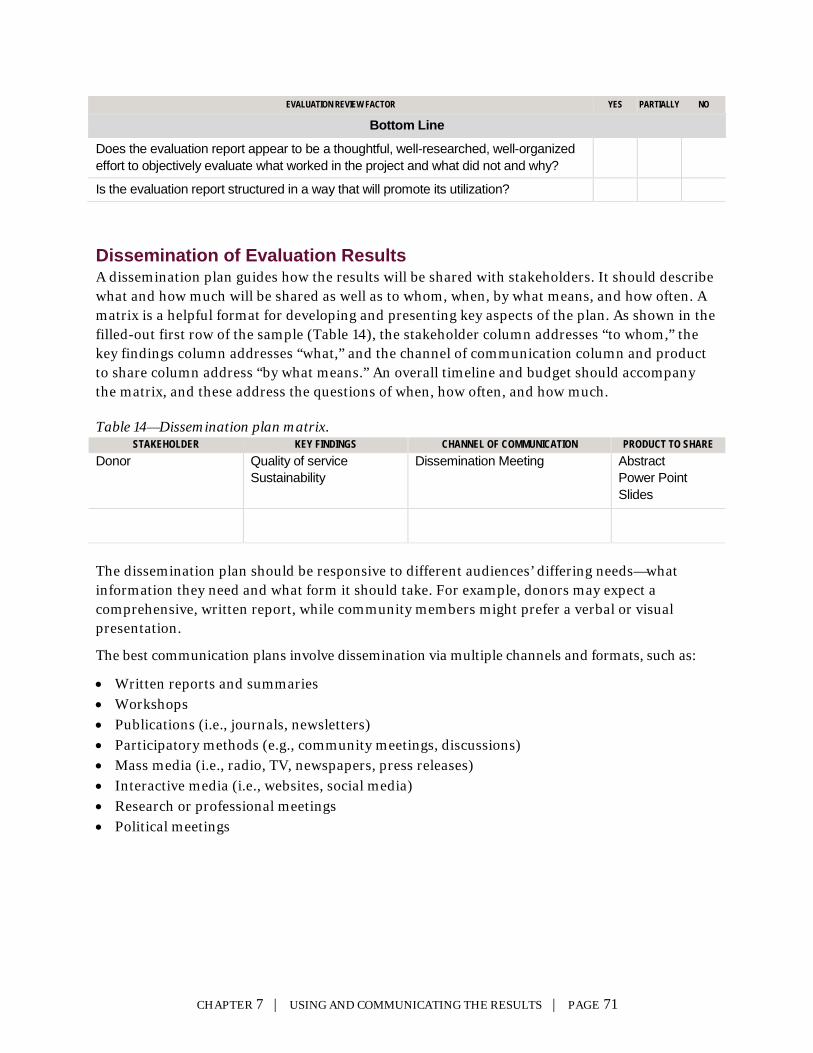
EVALUATION REVIEW FACTOR YES PARTIALLY NO
Bottom Line
Does the evaluation report appear to be a thoughtful, well-researched, well-organized effort to objectively evaluate what worked in the project and what did not and why?
Is the evaluation report structured in a way that will promote its utilization?
Dissemination of Evaluation Results A dissemination plan guides how the results will be shared with stakeholders. It should describe what and how much will be shared as well as to whom, when, by what means, and how often. A matrix is a helpful format for developing and presenting key aspects of the plan. As shown in the filled-out first row of the sample (Table 14), the stakeholder column addresses “to whom,” the key findings column addresses “what,” and the channel of communication column and product to share column address “by what means.” An overall timeline and budget should accompany the matrix, and these address the questions of when, how often, and how much.
Table 14—Dissemination plan matrix. STAKEHOLDER KEY FINDINGS CHANNEL OF COMMUNICATION PRODUCT TO SHARE
Donor Quality of service Sustainability
Dissemination Meeting Abstract Power Point Slides
The dissemination plan should be responsive to different audiences’ differing needs—what information they need and what form it should take. For example, donors may expect a comprehensive, written report, while community members might prefer a verbal or visual presentation.
The best communication plans involve dissemination via multiple channels and formats, such as:
• Written reports and summaries • Workshops • Publications (i.e., journals, newsletters) • Participatory methods (e.g., community meetings, discussions) • Mass media (i.e., radio, TV, newspapers, press releases) • Interactive media (i.e., websites, social media) • Research or professional meetings • Political meetings
CHAPTER 7 | USING AND COMMUNICATING THE RESULTS | PAGE 71

Summary • Maximize use of the results by revisiting the purpose of the evaluation and the needs of the
stakeholders, as described in chapters 1 and 2. • Ensure that the final report is easy to read and visually appealing. The brief executive
summary is an important component. • A good dissemination plan accounts for stakeholders’ varying needs and wants for
information and the form it comes in.
CHAPTER 7 | USING AND COMMUNICATING THE RESULTS | PAGE 72
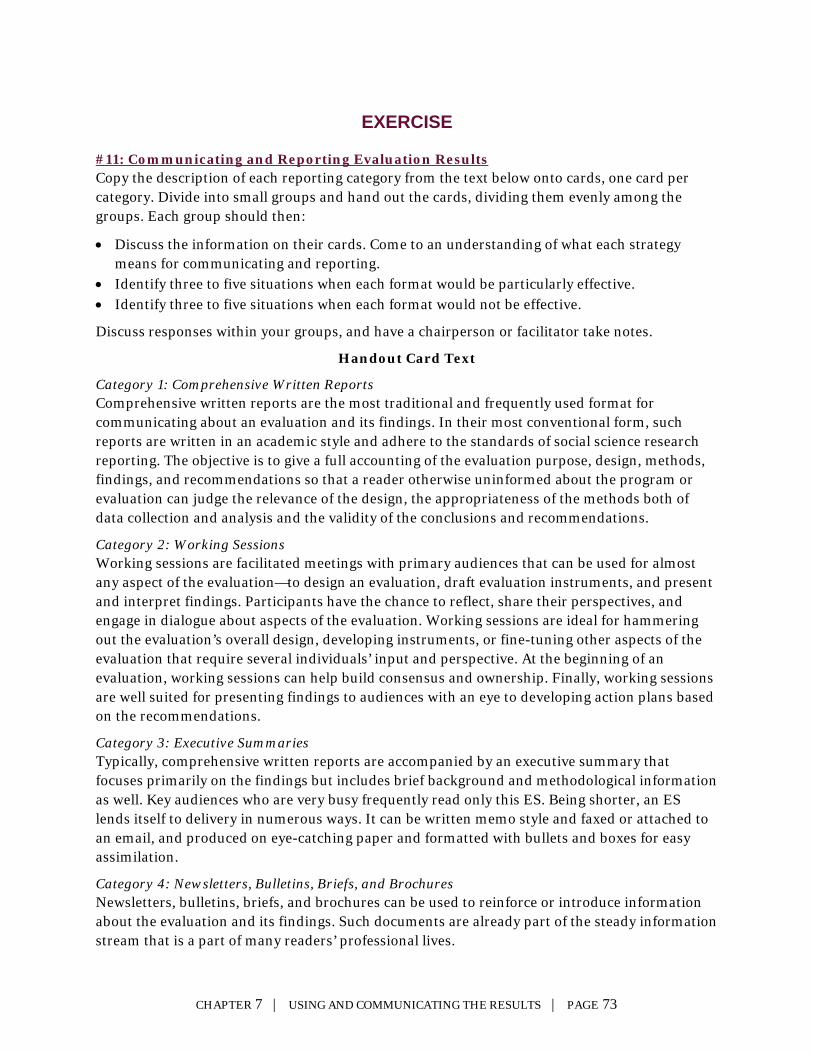
EXERCISE
#11: Communicating and Reporting Evaluation Results Copy the description of each reporting category from the text below onto cards, one card per category. Divide into small groups and hand out the cards, dividing them evenly among the groups. Each group should then:
• Discuss the information on their cards. Come to an understanding of what each strategy means for communicating and reporting.
• Identify three to five situations when each format would be particularly effective. • Identify three to five situations when each format would not be effective.
Discuss responses within your groups, and have a chairperson or facilitator take notes.
Handout Card Text
Category 1: Comprehensive Written Reports Comprehensive written reports are the most traditional and frequently used format for communicating about an evaluation and its findings. In their most conventional form, such reports are written in an academic style and adhere to the standards of social science research reporting. The objective is to give a full accounting of the evaluation purpose, design, methods, findings, and recommendations so that a reader otherwise uninformed about the program or evaluation can judge the relevance of the design, the appropriateness of the methods both of data collection and analysis and the validity of the conclusions and recommendations.
Category 2: Working Sessions Working sessions are facilitated meetings with primary audiences that can be used for almost any aspect of the evaluation—to design an evaluation, draft evaluation instruments, and present and interpret findings. Participants have the chance to reflect, share their perspectives, and engage in dialogue about aspects of the evaluation. Working sessions are ideal for hammering out the evaluation’s overall design, developing instruments, or fine-tuning other aspects of the evaluation that require several individuals’ input and perspective. At the beginning of an evaluation, working sessions can help build consensus and ownership. Finally, working sessions are well suited for presenting findings to audiences with an eye to developing action plans based on the recommendations.
Category 3: Executive Summaries Typically, comprehensive written reports are accompanied by an executive summary that focuses primarily on the findings but includes brief background and methodological information as well. Key audiences who are very busy frequently read only this ES. Being shorter, an ES lends itself to delivery in numerous ways. It can be written memo style and faxed or attached to an email, and produced on eye-catching paper and formatted with bullets and boxes for easy assimilation.
Category 4: Newsletters, Bulletins, Briefs, and Brochures Newsletters, bulletins, briefs, and brochures can be used to reinforce or introduce information about the evaluation and its findings. Such documents are already part of the steady information stream that is a part of many readers’ professional lives.
CHAPTER 7 | USING AND COMMUNICATING THE RESULTS | PAGE 73

Category 5: Video Presentations Video presentations are sometimes used to create stand-alone, widely distributable, visual communications about an evaluation, usually to report findings. The major determinant for the use of this format is cost. Videos can be useful when you want a presentation that will visually engage numerous audiences that are not in the same location. When you show the video to local audiences, you can incorporate some interaction in the form of a question-and-answer or discussion period into the presentation.
Category 6: Memos and Other Brief Communications via Fax, Email, Postal Mail Memos can be delivered internally within organizations or sent via fax or email to outside organizations. They are often used in the course of an evaluation to keep stakeholders abreast of evaluation activities, to solicit feedback and request participation in working sessions, and to report interim or final findings in summary form. Emails can be used to schedule meetings, to send drafts of reports and other written communications and solicit feedback, and to carry on written conversations among a group of individuals. Postcards can be used to send reminders and updates—usually just a single, focused message, sometimes with a graphic or a catchy typeface on bright paper to draw attention.
Category 7: Posters Posters and other visual displays about the evaluation can be viewed by audiences at one event and reused at others, or can be placed where they will be seen by audiences over a period of time (e.g., in the hall or entry area of an organization’s office). Posters are typically used as part of events or in settings where the purpose is broader than simply providing information about a particular evaluation. A poster display can include any amount and type of information about the evaluation and can be interactive or static. If a highly informational poster is displayed at an event, a representative of the evaluation team can be on hand to answer questions.
Category 8: Verbal Presentations Verbal presentations can be used for communicating and reporting on every aspect of an evaluation. They can be part of working sessions or other meetings where evaluation activities or findings are addressed. Verbal presentations vary in the extent to which they are interactive. Even verbal presentations that allow for only minimal audience interaction need not be boring or static. PowerPoint or other overhead slides, flip charts and other props can make verbal presentations highly accessible.
CHAPTER 7 | USING AND COMMUNICATING THE RESULTS | PAGE 74
Chapter 8: Managing the Evaluation After completing this chapter, participants will be able to: • Prepare for evaluations • Budget for an evaluation • Select an evaluation team • Develop Calls for Expressions of Interest and Terms of Reference • Manage evaluation consultants
To build a terms of reference, participants will: • Describe the evaluation team’s roles and responsibilities (TOR V) • Determine how the evaluation team will make and document decisions • Describe the schedule and logistics (TOR VI), and provide a timeline (TOR IX) • Develop an evaluation budget (TOR VIII)
Multifaceted Responsibilities Evaluation managers lead the effort to determine the evaluation purpose, develop evaluation questions, assess the needs and interests of stakeholders, and communicate the results of evaluations. They are responsible for knowing about the technical aspects of evaluation, including evaluation design, methods, types of data, sampling, and data analysis. And although the immediate task of carrying out the more technical activities of an evaluation often lies with consultants, those who manage evaluations must understand the basics so as to monitor, question, and provide input during the evaluation.
This chapter will discuss additional aspects of the process of managing evaluations: budgeting, selecting consultants, and developing key documents, such as the terms of reference.
Pre-Evaluation Planning Before an evaluation, whether that evaluation is internal or external, taking certain steps will help ensure that the evaluation is managed well, makes efficient use of time and resources, and adequately answers evaluation questions. Catholic Relief Services (CRS) and American Red Cross recommend the following seven pre-evaluation steps, especially when preparing for external evaluations commissioned by the donor:
• Identify, empower, and mentor the evaluation manager. This staff member, usually the M&E head or someone from programming, will be managing the consultant. It is essential to have a clear reporting chain and to ensure that someone within the project is responsible for keeping up to date on the evaluation.
• Clarify donor and organizational guidelines on evaluations for program management. For information, look to the project’s monitoring and evaluation plan and relevant generic
CHAPTER 8 | MANAGING THE EVALUATION | PAGE 75
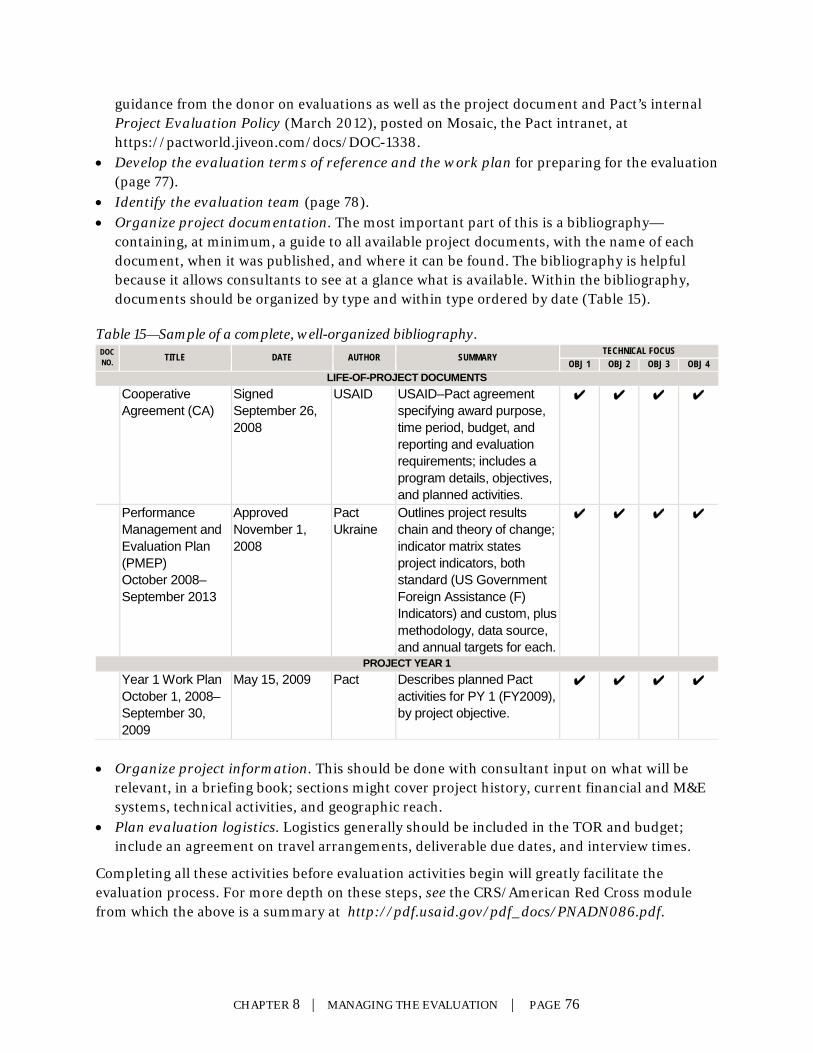
guidance from the donor on evaluations as well as the project document and Pact’s internal Project Evaluation Policy (March 2012), posted on Mosaic, the Pact intranet, at https://pactworld.jiveon.com/docs/DOC-1338.
• Develop the evaluation terms of reference and the work plan for preparing for the evaluation (page 77).
• Identify the evaluation team (page 78). • Organize project documentation. The most important part of this is a bibliography—
containing, at minimum, a guide to all available project documents, with the name of each document, when it was published, and where it can be found. The bibliography is helpful because it allows consultants to see at a glance what is available. Within the bibliography, documents should be organized by type and within type ordered by date (Table 15).
Table 15—Sample of a complete, well-organized bibliography. DOC NO. TITLE DATE AUTHOR SUMMARY TECHNICAL FOCUS
OBJ 1 OBJ 2 OBJ 3 OBJ 4 LIFE-OF-PROJECT DOCUMENTS
Cooperative Agreement (CA)
Signed September 26, 2008
USAID USAID–Pact agreement specifying award purpose, time period, budget, and reporting and evaluation requirements; includes a program details, objectives, and planned activities.
✔ ✔ ✔ ✔
Performance Management and Evaluation Plan (PMEP) October 2008–September 2013
Approved November 1, 2008
Pact Ukraine
Outlines project results chain and theory of change; indicator matrix states project indicators, both standard (US Government Foreign Assistance (F) Indicators) and custom, plus methodology, data source, and annual targets for each.
✔ ✔ ✔ ✔
PROJECT YEAR 1 Year 1 Work Plan
October 1, 2008–September 30, 2009
May 15, 2009 Pact Describes planned Pact activities for PY 1 (FY2009), by project objective.
✔ ✔ ✔ ✔
• Organize project information. This should be done with consultant input on what will be
relevant, in a briefing book; sections might cover project history, current financial and M&E systems, technical activities, and geographic reach.
• Plan evaluation logistics. Logistics generally should be included in the TOR and budget; include an agreement on travel arrangements, deliverable due dates, and interview times.
Completing all these activities before evaluation activities begin will greatly facilitate the evaluation process. For more depth on these steps, see the CRS/American Red Cross module from which the above is a summary at http://pdf.usaid.gov/pdf_docs/PNADN086.pdf.
CHAPTER 8 | MANAGING THE EVALUATION | PAGE 76
Developing Terms of Reference The TOR describes the evaluation manager’s expectations and requirements for the evaluation. It is usually developed before evaluation consultants are hired and then adapted to create the Call for Expressions of Interest (EOIs). Once a consultant is selected, the TOR can serve as the basis for the contract. Annex 1 gives a TOR template. Developing the TOR is a critical first step toward a credible evaluation. Developing a TOR clarifies the rationale for the evaluation and requires that fundamental decisions be made about the appropriate question and evaluation designs, approach, and implementation. In addition, developing a TOR facilitates development of the detailed evaluation study protocol that will then guide the evaluation process.
Budgeting
Costs to Anticipate It is important to plan for the costs of evaluation, including:
• Personnel—regular, contract, and consultants. • Transport for staff, volunteers, and beneficiaries. • Training and meeting costs. • Printing, postage. • Supplies, communication, and equipment.
Some of these costs may be included in the budget of consultants, if you are using them. However, even when consultants do the bulk of the work, there will be other costs to the organization. Although consultants’ time and expenses may be included in their contracts, you will need to budget for printing, postage, food, meeting space, and other related expenses if you plan to write and disseminate a report of the findings or hold additional community meetings beyond those the consultants may have planned for.
When, Who, and How Much Budgeting evaluation activities is a job for project staff responsible for the activities (usually the M&E officer or project coordinator), working with the finance team. However, to ensure that appropriate activities and costs are in the budget, be sure to consult other project staff and stakeholders while you are preparing it.
Too often, budgets are made right before an evaluation is supposed to begin. Actually, it’s far preferable to budget for evaluation during the overall program planning phase—at least to create a rough budget. Negotiating with donors up front to ensure that they approve the evaluation plan and budget is prudent as well.
The amount budgeted depends on the evaluation needs and purposes, including the size and complexity of the project, what activities will be implemented, the tools needed, and the project capacity needs. Considerations include:
• The amount of money and time available for overall project activities. • The funding source—local or from donors. • The program evaluation’s objectives and scope—whether small or large in scale. • Required travel costs.
CHAPTER 8 | MANAGING THE EVALUATION | PAGE 77
• Who is conducting the evaluation (i.e., internal program officer or external evaluator) and that individual’s skills.
• Participation by community members, leaders, and volunteers; whether they will be paid stipends or allowances for their involvement.
• The staff time and labor of the program people that will be involve d in the evaluation.
Different donors recommend different budget thresholds for evaluation, but the range tends to be between 3 percent and 10 percent of the overall program budget. Similarly, different donors have different policies on what the budget should cover—some include all MERL activities while others restrict the evaluation budget to formal evaluation activities and want a separate allocation for monitoring activities.
Common Pitfalls A number of factors can interfere with effective budgeting, including: • Lack of understanding as to the value of evaluation to the program life cycle. Some program
managers and staff do not even know what evaluation is and what evaluation activities need to be budgeted for.
• Minimal priority given to evaluation activities. • Lack of budgeting skills among project staff and M&E officers. • Scarcity of local and donor funding for evaluation activities. • Project organizational structure: M&E and project staff may not be involved in planning and
budgeting for project activities, including evaluation activities.
Evaluations require substantial investments of financial and human resources. When deciding on the resources required for an evaluation, you need to carefully identify the available resources—both funding and staff resources to carry out the work of the evaluation.
The Evaluation Team There are many ways to staff evaluation activities. External evaluators—in addition to being generally viewed as more objective, because they are independent and not part of the program delivery team—have technical training and experience conducting evaluations, which may not exist internally.
Still, with the right training, an internal team made up of the program staff can implement an evaluation that’s cost-effective.
Another option is to divide the work between staff and outside consultants. This course can not only reduce overall cost but also can help build staff capacity while bringing on board consultants’ expertise.
How to Choose an Outside Evaluator Your process of choosing an external evaluator should be systematic and transparent. The first step is to develop a call for expressions of interest and to publicize it widely to attract the right consultants for the job. Advertisements can be placed in various media, both print and electronic. Be mindful of donor requirements for subcontracting and consider what approvals you will need to obtain prior to engaging in a solicitation process. Be sure to build in enough
CHAPTER 8 | MANAGING THE EVALUATION | PAGE 78
time for advertising; allowing too little time for prospective consultants to respond may not garner you the response of some of the most qualified potential teams.
What’s in a Call for Expressions of Interest: The call for EOIs should include: • Background: Briefly describe the program to be evaluated and the evaluation purpose. • Evaluation Questions: List them all. • Evaluation Team: Briefly describe the expertise required of the evaluator or team of
evaluators. • Time Frames for the Evaluation: Provide the estimated number of days for the assignments
and the time period when the evaluation is expected to take place. • Application Process: Explain the process for submitting and reviewing applications. At this
stage, applicants are usually required to submit a letter of interest that states their expertise and experience and is accompanied by their resumes and references. It is common to indicate that the detailed TOR and invitations to submit a full proposal will be extended only to selected candidates meeting minimum requirements for qualifications and experience. Also included in the TOR are deadlines for submissions as well as when feedback should be expected. Lastly, the call for EOIs includes the email or physical address where submissions should be sent.
Reviewing Submissions and Afterwards: After interested consultants have submitted their EOIs, a panel of staff with knowledge of the program or of program evaluation should review the submissions. The sample call for EOIs (next page) outlines normal expectations of an EOI submission. Sometimes the panel selects a consultant based just on the EOI. At other times, especially if the evaluation is to be large and expensive, EOIs are used to identify finalists, who are then asked to submit a full proposal with more detail before the panel chooses the consultant they believe to be most qualified. Before convening, the panel should decide which factors they will consider and which they will weigh most heavily when evaluating the proposals.
After the panel has selected a consultant, the lead staff person writes a selection memo, with the following information: • A brief summary of the evaluation purpose and solicitation process. • A brief summary of the call for EOIs and where it was advertised. • The number and quality of EOIs received. • How applicants were selected to submit full proposals. • The proposal review committee and process, including the proposal scoring criteria. • The outcome of the proposal review and scoring process. • The final decision and communication to the applicants and the next steps in the contracting
process.
CHAPTER 8 | MANAGING THE EVALUATION | PAGE 79
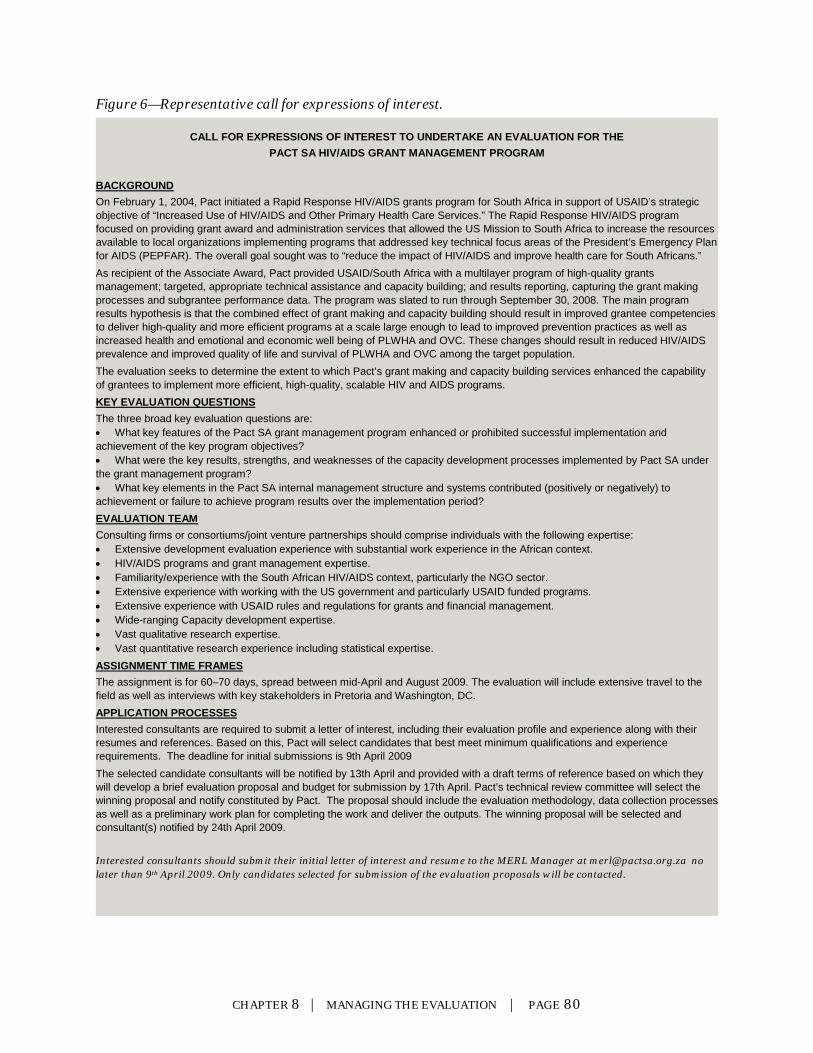
Figure 6—Representative call for expressions of interest.
CALL FOR EXPRESSIONS OF INTEREST TO UNDERTAKE AN EVALUATION FOR THE PACT SA HIV/AIDS GRANT MANAGEMENT PROGRAM
BACKGROUND On February 1, 2004, Pact initiated a Rapid Response HIV/AIDS grants program for South Africa in support of USAID’s strategic objective of “Increased Use of HIV/AIDS and Other Primary Health Care Services.” The Rapid Response HIV/AIDS program focused on providing grant award and administration services that allowed the US Mission to South Africa to increase the resources available to local organizations implementing programs that addressed key technical focus areas of the President’s Emergency Plan for AIDS (PEPFAR). The overall goal sought was to “reduce the impact of HIV/AIDS and improve health care for South Africans.” As recipient of the Associate Award, Pact provided USAID/South Africa with a multilayer program of high-quality grants management; targeted, appropriate technical assistance and capacity building; and results reporting, capturing the grant making processes and subgrantee performance data. The program was slated to run through September 30, 2008. The main program results hypothesis is that the combined effect of grant making and capacity building should result in improved grantee competencies to deliver high-quality and more efficient programs at a scale large enough to lead to improved prevention practices as well as increased health and emotional and economic well being of PLWHA and OVC. These changes should result in reduced HIV/AIDS prevalence and improved quality of life and survival of PLWHA and OVC among the target population. The evaluation seeks to determine the extent to which Pact’s grant making and capacity building services enhanced the capability of grantees to implement more efficient, high-quality, scalable HIV and AIDS programs. KEY EVALUATION QUESTIONS The three broad key evaluation questions are: • What key features of the Pact SA grant management program enhanced or prohibited successful implementation and achievement of the key program objectives? • What were the key results, strengths, and weaknesses of the capacity development processes implemented by Pact SA under the grant management program? • What key elements in the Pact SA internal management structure and systems contributed (positively or negatively) to achievement or failure to achieve program results over the implementation period? EVALUATION TEAM Consulting firms or consortiums/joint venture partnerships should comprise individuals with the following expertise: • Extensive development evaluation experience with substantial work experience in the African context. • HIV/AIDS programs and grant management expertise. • Familiarity/experience with the South African HIV/AIDS context, particularly the NGO sector. • Extensive experience with working with the US government and particularly USAID funded programs. • Extensive experience with USAID rules and regulations for grants and financial management. • Wide-ranging Capacity development expertise. • Vast qualitative research expertise. • Vast quantitative research experience including statistical expertise. ASSIGNMENT TIME FRAMES The assignment is for 60–70 days, spread between mid-April and August 2009. The evaluation will include extensive travel to the field as well as interviews with key stakeholders in Pretoria and Washington, DC. APPLICATION PROCESSES Interested consultants are required to submit a letter of interest, including their evaluation profile and experience along with their resumes and references. Based on this, Pact will select candidates that best meet minimum qualifications and experience requirements. The deadline for initial submissions is 9th April 2009 The selected candidate consultants will be notified by 13th April and provided with a draft terms of reference based on which they will develop a brief evaluation proposal and budget for submission by 17th April. Pact’s technical review committee will select the winning proposal and notify constituted by Pact. The proposal should include the evaluation methodology, data collection processes as well as a preliminary work plan for completing the work and deliver the outputs. The winning proposal will be selected and consultant(s) notified by 24th April 2009.
Interested consultants should submit their initial letter of interest and resume to the MERL Manager at [email protected] no later than 9th April 2009. Only candidates selected for submission of the evaluation proposals will be contacted.
CHAPTER 8 | MANAGING THE EVALUATION | PAGE 80
Managing Consultants Although external and independent, consultants still need to be actively managed. This work includes keeping track of the timeline, being mindful as to when certain milestones or deliverables should be completed, and maintaining regular communication. For long projects, having consultants submit regular written reports using a template that you provide is optimal.
By making expectations clear and communicating about them regularly, problems can be quashed before they fester. Should problems arise, address them as soon as is feasible.
Managing consultants also means that there must be a clear management and decision making process internally. In many cases, evaluation stakeholders include project M&E, management, and technical staff as well as representatives from the donor.
Requiring Special Attention When managing consultants, a few key deliverables and activities will require greater attention from the evaluation manager. • Briefing the Consultants: When consultants begin work, they will undertake a desk review of
documents and will need access to thorough background documents on the project and its history. They may interview staff. At the very beginning, the manager should brief the consultant on the project, evaluation process, and expectations.
• Inception Report: Following the briefing and desk review, the consultant should generate an inception report summarizing the preliminary findings of the desk review and sketching an evaluation plan that answers the evaluation questions as well as enumerating the methods to be used and the expected limitations. The plan may include provision for pilot testing.
• Reviewing Tools: The manager and project staff should give feedback on the data collection tools to ensure that they will meet project evaluation needs and are technically sound. The same is true at the pilot testing stage, if pilot testing is slated to occur.
• Data Collection: The consultant typically manages the day-to-day data collection, but unlike other deliverables, data collection generates no second drafts. During the data collection period, the evaluation manager may want to ensure that practices are in place to ensure high data quality and ethical data collection. More frequent communication with the consultant may be needed in order to put these practices into place.
• Reviewing Drafts: The project’s management and technical experts may have comments on the evaluation report (as they did on reviewing tools) once initial drafts have been completed. Their feedback helps ensure that the evaluation accurately reflects the program activities and answers the evaluation questions. In some cases, technical project staff may have more expertise in the area being evaluated than the evaluator.
• Disseminating Results: Even when evaluation dissemination materials are made by the consultant, as is sometimes the case, the program will typically disseminate those materials. The program should carefully review any materials created for public dissemination.
Managing Approvals The donor may have separate approval and management processes that you must observe. In participatory evaluations, community members are also involved in evaluation design and approval.
CHAPTER 8 | MANAGING THE EVALUATION | PAGE 81
The evaluation manager identified during pre-evaluation planning (page 75) must be alert to the stages in the evaluation process when other stakeholders should be pulled in and how that should happen. For example, before giving feedback, the donor point of contact may need to obtain approval from others within his organization. In addition, throughout the evaluation, to make sure the process is consistently inclusive, it may be appropriate or required for a steering committee or other body to give feedback or approval of various evaluation deliverables.
An outline of different options is here:
http://betterevaluation.org/plan/manage/who_controls
Summary • Evaluation planning steps should be taken before an evaluation begins—particularly, clearly
outlining the evaluation TOR and preparing documents for the evaluation. • Budgets for the evaluation should be created at the time the project budget is laid out.
Evaluation budgets should build in not only the consultants’ fees and costs but also the support costs to the organization of managing the consultant.
• Managing consultants requires that expectations, terms of reference, and deliverables be clearly stated and that people from the project be available to give feedback at all stages.
Resources Better Evaluation, “External Consultant” http://betterevaluation.org/evaluation-options/ExternalConsultant
Better Evaluation, “Terms of Reference” http://betterevaluation.org/evaluation-options/terms_of_reference
Better Evaluation, “Determine and Secure Resources” http://betterevaluation.org/plan/manage_evaluation/determine_resources
International Union for Conservation of Nature and Natural Resources (IUCN), Managing Evaluations in IUCN: A Guide for IUCN Programme and Project Managers (Gland, Switzerland, and Cambridge, United Kingdom: IUCN, 2004) http://cmsdata.iucn.org/downloads/handbook_eng.pdf
Division for Oversight Services, “Tool Number 5: Planning and Managing an Evaluation Process, Part IV, Managing the Evaluation Process,” in Programme Manager’s Planning Monitoring & Evaluation Toolkit (New York: United Nations Population Fund [UNFPA], August 2004). http://www.unfpa.org/monitoring/toolkit/5managing.pdf
CHAPTER 8 | MANAGING THE EVALUATION | PAGE 82
EXERCISE
#12: Bibliography Think about your project to date. What key documents have been created? Create a bibliography using the provided format.
DOC NO. TITLE DATE AUTHOR(S) SUMMARY
CHAPTER 8 | MANAGING THE EVALUATION | PAGE 83
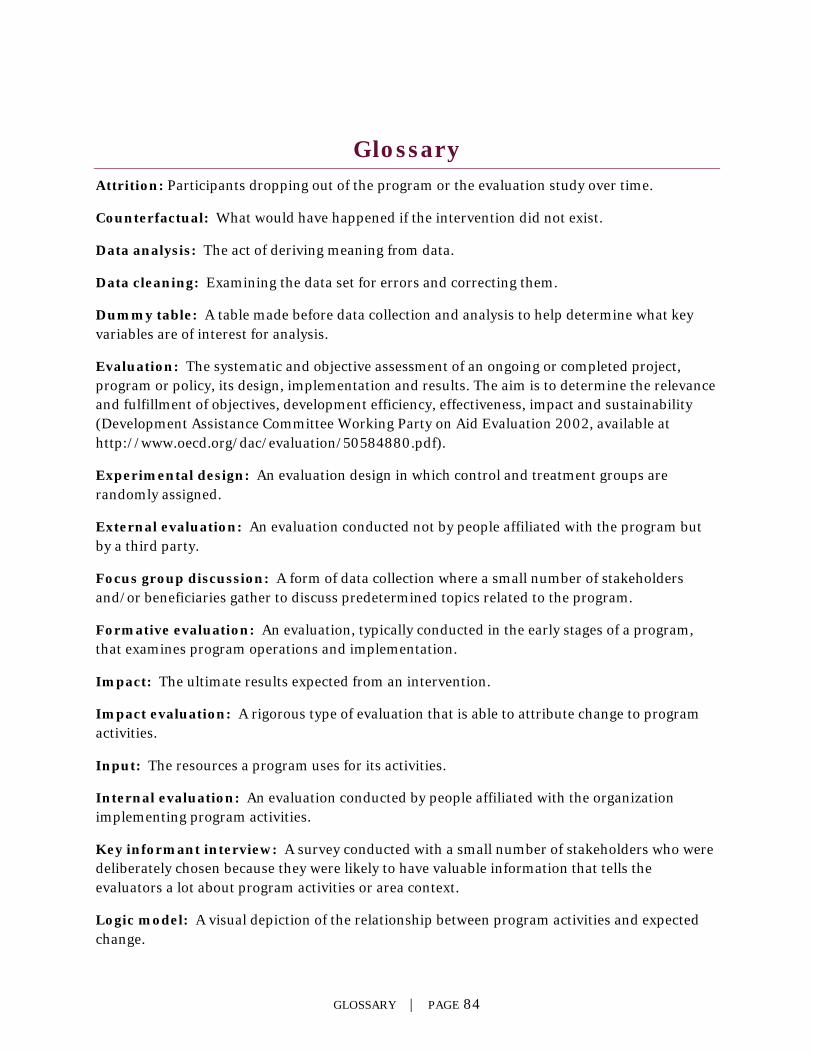
Glossary Attrition: Participants dropping out of the program or the evaluation study over time.
Counterfactual: What would have happened if the intervention did not exist.
Data analysis: The act of deriving meaning from data.
Data cleaning: Examining the data set for errors and correcting them.
Dummy table: A table made before data collection and analysis to help determine what key variables are of interest for analysis.
Evaluation: The systematic and objective assessment of an ongoing or completed project, program or policy, its design, implementation and results. The aim is to determine the relevance and fulfillment of objectives, development efficiency, effectiveness, impact and sustainability (Development Assistance Committee Working Party on Aid Evaluation 2002, available at http://www.oecd.org/dac/evaluation/50584880.pdf).
Experimental design: An evaluation design in which control and treatment groups are randomly assigned.
External evaluation: An evaluation conducted not by people affiliated with the program but by a third party.
Focus group discussion: A form of data collection where a small number of stakeholders and/or beneficiaries gather to discuss predetermined topics related to the program.
Formative evaluation: An evaluation, typically conducted in the early stages of a program, that examines program operations and implementation.
Impact: The ultimate results expected from an intervention.
Impact evaluation: A rigorous type of evaluation that is able to attribute change to program activities.
Input: The resources a program uses for its activities.
Internal evaluation: An evaluation conducted by people affiliated with the organization implementing program activities.
Key informant interview: A survey conducted with a small number of stakeholders who were deliberately chosen because they were likely to have valuable information that tells the evaluators a lot about program activities or area context.
Logic model: A visual depiction of the relationship between program activities and expected change.
GLOSSARY | PAGE 84
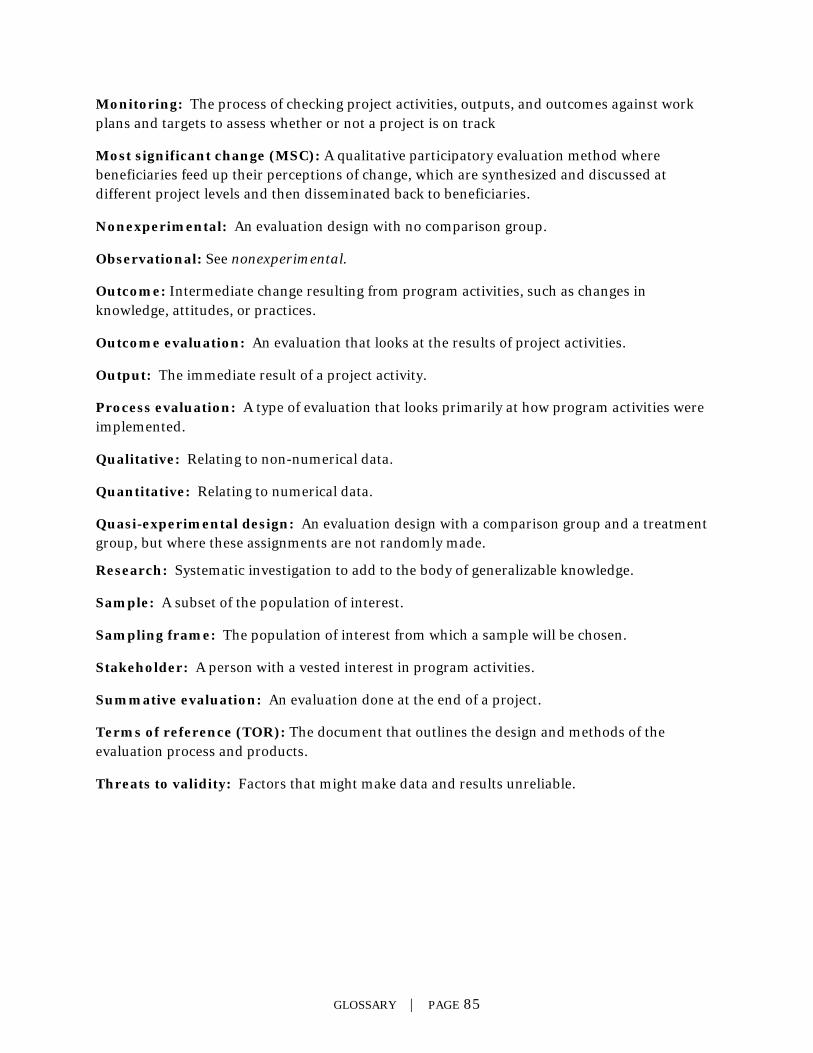
Monitoring: The process of checking project activities, outputs, and outcomes against work plans and targets to assess whether or not a project is on track
Most significant change (MSC): A qualitative participatory evaluation method where beneficiaries feed up their perceptions of change, which are synthesized and discussed at different project levels and then disseminated back to beneficiaries.
Nonexperimental: An evaluation design with no comparison group.
Observational: See nonexperimental.
Outcome: Intermediate change resulting from program activities, such as changes in knowledge, attitudes, or practices.
Outcome evaluation: An evaluation that looks at the results of project activities.
Output: The immediate result of a project activity.
Process evaluation: A type of evaluation that looks primarily at how program activities were implemented.
Qualitative: Relating to non-numerical data.
Quantitative: Relating to numerical data.
Quasi-experimental design: An evaluation design with a comparison group and a treatment group, but where these assignments are not randomly made.
Research: Systematic investigation to add to the body of generalizable knowledge.
Sample: A subset of the population of interest.
Sampling frame: The population of interest from which a sample will be chosen.
Stakeholder: A person with a vested interest in program activities.
Summative evaluation: An evaluation done at the end of a project.
Terms of reference (TOR): The document that outlines the design and methods of the evaluation process and products.
Threats to validity: Factors that might make data and results unreliable.
GLOSSARY | PAGE 85
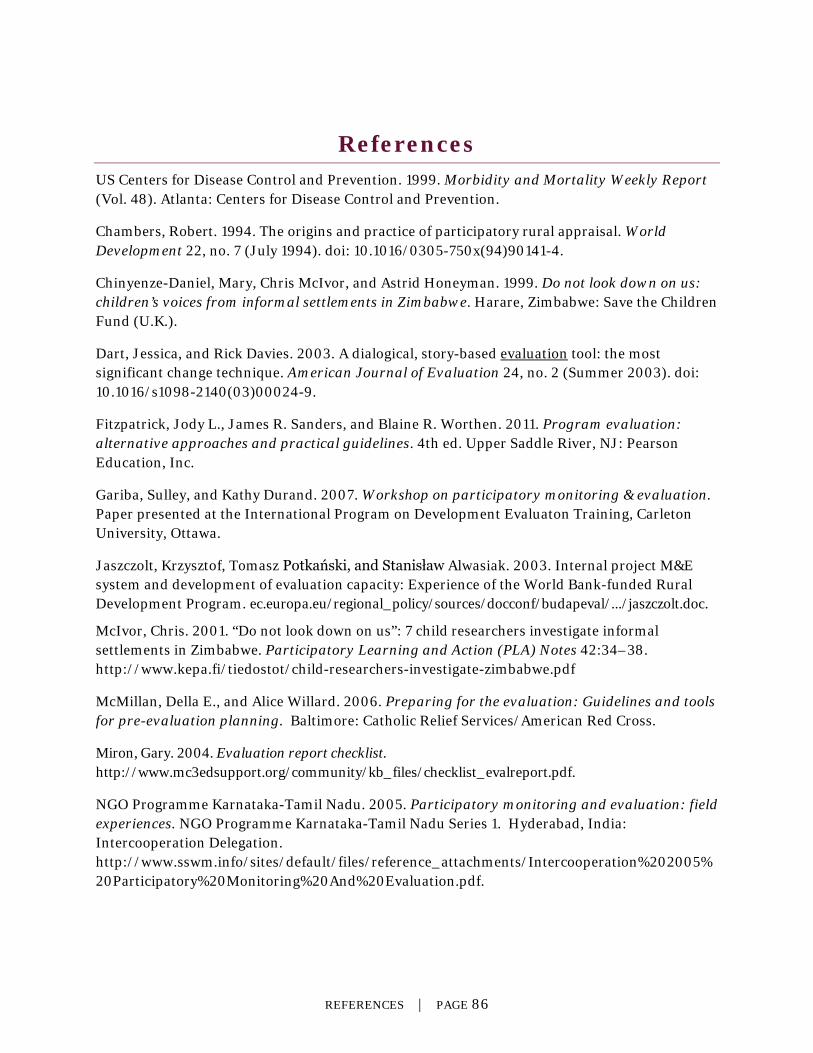
References US Centers for Disease Control and Prevention. 1999. Morbidity and Mortality Weekly Report (Vol. 48). Atlanta: Centers for Disease Control and Prevention.
Chambers, Robert. 1994. The origins and practice of participatory rural appraisal. World Development 22, no. 7 (July 1994). doi: 10.1016/0305-750x(94)90141-4.
Chinyenze-Daniel, Mary, Chris McIvor, and Astrid Honeyman. 1999. Do not look down on us: children’s voices from informal settlements in Zimbabwe. Harare, Zimbabwe: Save the Children Fund (U.K.).
Dart, Jessica, and Rick Davies. 2003. A dialogical, story-based evaluation tool: the most significant change technique. American Journal of Evaluation 24, no. 2 (Summer 2003). doi: 10.1016/s1098-2140(03)00024-9.
Fitzpatrick, Jody L., James R. Sanders, and Blaine R. Worthen. 2011. Program evaluation: alternative approaches and practical guidelines. 4th ed. Upper Saddle River, NJ: Pearson Education, Inc.
Gariba, Sulley, and Kathy Durand. 2007. Workshop on participatory monitoring & evaluation. Paper presented at the International Program on Development Evaluaton Training, Carleton University, Ottawa.
Jaszczolt, Krzysztof, Tomasz Potkański, and Stanisław Alwasiak. 2003. Internal project M&E system and development of evaluation capacity: Experience of the World Bank-funded Rural Development Program. ec.europa.eu/regional_policy/sources/docconf/budapeval/.../jaszczolt.doc.
McIvor, Chris. 2001. “Do not look down on us”: 7 child researchers investigate informal settlements in Zimbabwe. Participatory Learning and Action (PLA) Notes 42:34–38. http://www.kepa.fi/tiedostot/child-researchers-investigate-zimbabwe.pdf
McMillan, Della E., and Alice Willard. 2006. Preparing for the evaluation: Guidelines and tools for pre-evaluation planning. Baltimore: Catholic Relief Services/American Red Cross.
Miron, Gary. 2004. Evaluation report checklist. http://www.mc3edsupport.org/community/kb_files/checklist_evalreport.pdf.
NGO Programme Karnataka-Tamil Nadu. 2005. Participatory monitoring and evaluation: field experiences. NGO Programme Karnataka-Tamil Nadu Series 1. Hyderabad, India: Intercooperation Delegation. http://www.sswm.info/sites/default/files/reference_attachments/Intercooperation%202005%20Participatory%20Monitoring%20And%20Evaluation.pdf.
REFERENCES | PAGE 86
Development Assistance Committee Working Party on Aid Evaluation. 2002. Glossary of key terms in evaluation and results based management. Paris: Organisation for Economic Co-operation and Development. http://www.oecd.org/dac/evaluation/18074294.pdf.
Patton, Michael Quinn. 1997. Utilization-focused evaluation: the new century text. 3rd ed. Thousand Oaks: SAGE Publications, Inc.
Scriven, Michael. 1991. Evaluation thesaurus. 4th ed. Newbury Park, CA: SAGE Publications, Inc.
World Bank. 2007. International Program for Development Evaluation Training (IPDET) Handbook. Washington, DC: World Bank.
US Agency for International Development. 2011. USAID evaluation policy. Washington, DC.
Mwadime, Robert, James Levinson, and Pauline Kuzwayo. 1999. Monitoring and evaluation of nutrition and nutrition-related programmes: A training manual for programme managers and implementors. Nairobi: Applied Nutrition Programme, University of Nairobi.
University of Wisconsin. 2008. Unit 4: Focusing the evaluation. In Building capacity in evaluating outcomes: A teaching and facilitating resource for community-based programs and organizations. Madison, WI: University of Wisconsin Extension, Program Development and Evaluation.
Resources: For Further Reading
Judy L. Baker, Evaluating the Impact of Development Projects on Poverty: A Handbook for Practitioners (Washington, DC: World Bank, 2000) http://siteresources.worldbank.org/INTISPMA/Resources/handbook.pdf
Michael Bamberger, “Introduction to Mixed Methods in Impact Evaluation,” in Impact Evaluation Notes No. 3 (August 2012), Washington, DC: InterAction http://www.interaction.org/document/guidance-note-3-introduction-mixed-methods-impact-evaluation
Better Evaluation, “Approaches” http://betterevaluation.org/approaches
Better Evaluation, “Define Ethical and Quality Evaluation Standards” http://betterevaluation.org/plan/manage_evaluation/ethical_evaluation
Better Evaluation, “Determine and Secure Resources” http://betterevaluation.org/plan/manage_evaluation/determine_resources
REFERENCES | PAGE 87
Better Evaluation, “External Consultant” http://betterevaluation.org/evaluation-options/ExternalConsultant
Better Evaluation, “Randomized Controlled Trial (RCT)” http://betterevaluation.org/plan/approach/rct
Better Evaluation, “Sample” http://betterevaluation.org/plan/describe/sample
Better Evaluation, “Stakeholder Mapping and Analysis” http://betterevaluation.org/evaluation-options/mapping_stakeholders
Better Evaluation, “Terms of Reference” http://betterevaluation.org/evaluation-options/terms_of_reference
Cheyanne Church and Mark M. Rogers, “Ethics in Design, Monitoring, and Evaluation for Conflict Transformation” in Designing for Results (Washington, DC: Search for Common Ground, 2006)
Cornell, “Respondent-Driven Sampling” http://www.respondentdrivensampling.org/
Division for Oversight Services, “Tool Number 5: Planning and Managing an Evaluation Process, Part IV, Managing the Evaluation Process,” in Programme Manager’s Planning Monitoring & Evaluation Toolkit (New York: United Nations Population Fund [UNFPA], August 2004). http://www.unfpa.org/monitoring/toolkit/5managing.pdf
International Union for Conservation of Nature and Natural Resources (IUCN), Managing Evaluations in IUCN: A Guide for IUCN Programme and Project Managers (Gland, Switzerland, and Cambridge, United Kingdom: IUCN, 2004) http://cmsdata.iucn.org/downloads/handbook_eng.pdf
My M&E, “Developing Evaluation Questions” http://www.mymande.org/howto-recomm-page?q=node/88
National Science Foundation, “Evaluation and Types of Evaluation” http://www.nsf.gov/pubs/2002/nsf02057/nsf02057_2.pdf
National Science Foundation, “Qualitative Methods and Analytic Techniques” http://www.nsf.gov/pubs/1997/nsf97153/chap_3.htm
Open Learning Initiative, “Probability and Statistics” (Pittsburgh: Carnegie Mellon University, 2012) http://oli.cmu.edu/courses/free-open/statistics-course-details/
Vinil Patel, “How to Choose the Right Visualization for Your Data” (McLean, VA: LogiAnalytics, August 6, 2013) http://www.logianalytics.com/blog/logianalytics-how-to-choose-the-right-visualization-for-your-data
REFERENCES | PAGE 88
Pell Institute, “Evaluation 101: The Basics” http://toolkit.pellinstitute.org/evaluation-101/
“Qualitative Data Analysis” http://www.sagepub.com/upm-data/43454_10.pdf
Research Methods Knowledge Base: Design http://www.socialresearchmethods.net/kb/design.php
Research Methods Knowledge Base: Introduction to Evaluation http://www.socialresearchmethods.net/kb/intreval.php
Research Methods Knowledge Base: Qualitative Measurement http://www.socialresearchmethods.net/kb/qual.php
Research Methods Knowledge Base: Sampling http://www.socialresearchmethods.net/kb/sampling.php
Jim Stikeleather, “Three Elements of Successful Data Visualization” (Cambridge: Harvard Business Review Blog Network, Harvard Business Publishing, April 19, 2013) http://blogs.hbr.org/cs/2013/04/the_three_elements_of_successf.html
Jen Underwood, “Data Visualization Best Practices” (San Francisco: SlideShare Inc., April 10, 2013) http://www.slideshare.net/idigdata/data-visualization-best-practices-2013
W. K. Kellogg Foundation, “Using Logic Models to Bring Together Planning, Evaluation, and Action: Logic Model Development Guide” (Battle Creek, Michigan, 2004) http://www.wkkf.org/knowledge-center/resources/2006/02/wk-kellogg-foundation-logic-model-development-guide.aspx
World Bank, “What Is Stakeholder Analysis?” http://www1.worldbank.org/publicsector/anticorrupt/PoliticalEconomy/PDFversion.pdf
REFERENCES | PAGE 89
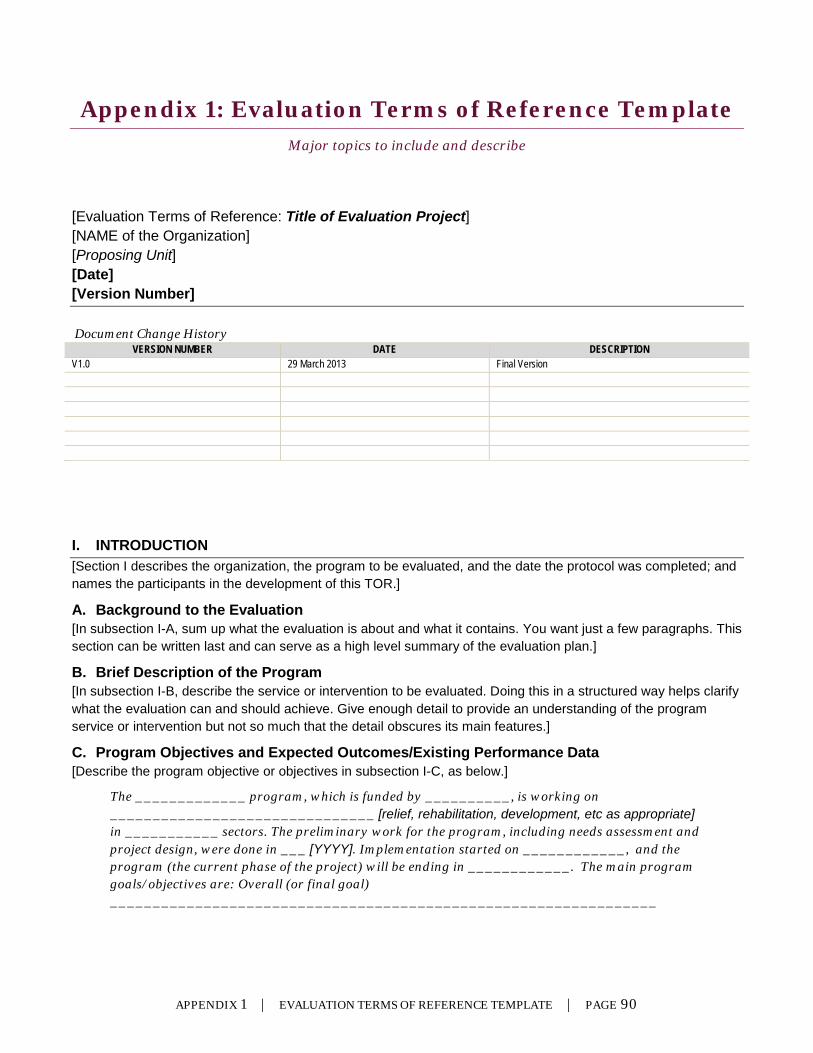
Appendix 1: Evaluation Terms of Reference Template Major topics to include and describe
[Evaluation Terms of Reference: Title of Evaluation Project] [NAME of the Organization] [Proposing Unit] [Date] [Version Number] Document Change History
VERSION NUMBER DATE DESCRIPTION V1.0 29 March 2013 Final Version
I. INTRODUCTION [Section I describes the organization, the program to be evaluated, and the date the protocol was completed; and names the participants in the development of this TOR.]
A. Background to the Evaluation [In subsection I-A, sum up what the evaluation is about and what it contains. You want just a few paragraphs. This section can be written last and can serve as a high level summary of the evaluation plan.]
B. Brief Description of the Program [In subsection I-B, describe the service or intervention to be evaluated. Doing this in a structured way helps clarify what the evaluation can and should achieve. Give enough detail to provide an understanding of the program service or intervention but not so much that the detail obscures its main features.]
C. Program Objectives and Expected Outcomes/Existing Performance Data [Describe the program objective or objectives in subsection I-C, as below.]
The _____________ program, which is funded by __________, is working on _______________________________ [relief, rehabilitation, development, etc as appropriate] in ___________ sectors. The preliminary work for the program, including needs assessment and project design, were done in ___ [YYYY]. Implementation started on ____________, and the program (the current phase of the project) will be ending in ____________. The main program goals/objectives are: Overall (or final goal) ________________________________________________________________
APPENDIX 1 | EVALUATION TERMS OF REFERENCE TEMPLATE | PAGE 90
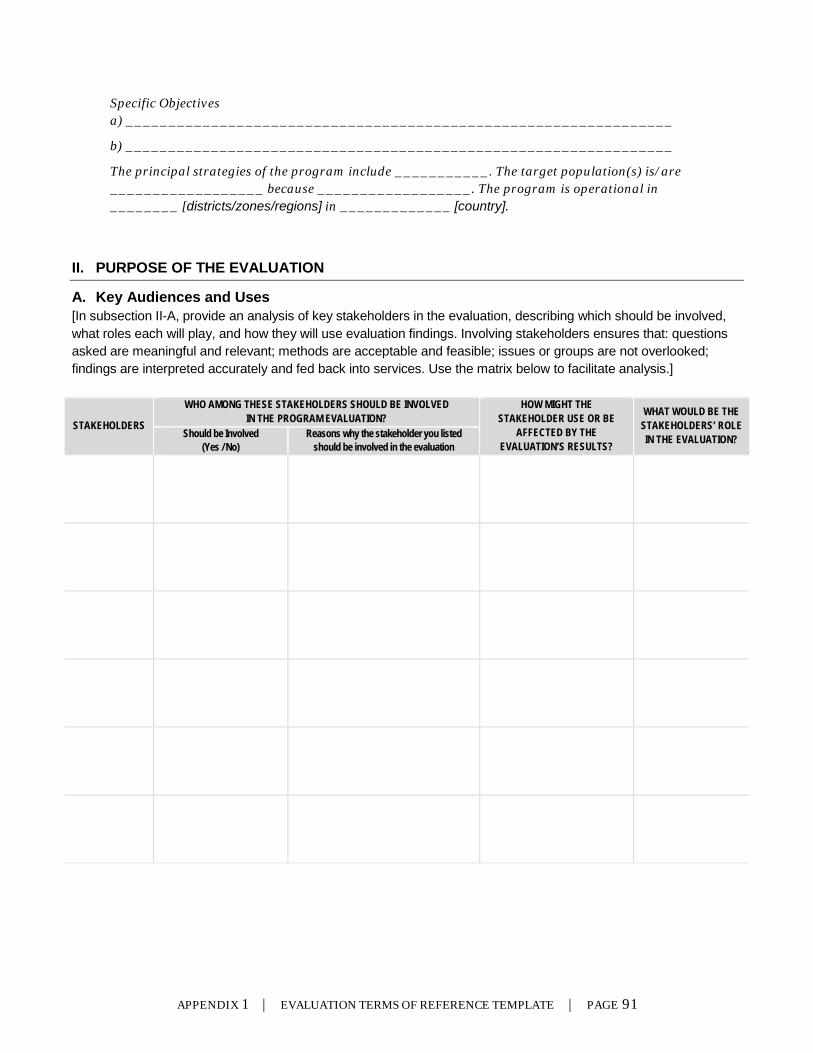
Specific Objectives a) ________________________________________________________________
b) ________________________________________________________________
The principal strategies of the program include ___________. The target population(s) is/are __________________ because __________________. The program is operational in ________ [districts/zones/regions] in _____________ [country].
II. PURPOSE OF THE EVALUATION
A. Key Audiences and Uses [In subsection II-A, provide an analysis of key stakeholders in the evaluation, describing which should be involved, what roles each will play, and how they will use evaluation findings. Involving stakeholders ensures that: questions asked are meaningful and relevant; methods are acceptable and feasible; issues or groups are not overlooked; findings are interpreted accurately and fed back into services. Use the matrix below to facilitate analysis.]
STAKEHOLDERS
WHO AMONG THESE STAKEHOLDERS SHOULD BE INVOLVED IN THE PROGRAM EVALUATION?
HOW MIGHT THE STAKEHOLDER USE OR BE
AFFECTED BY THE EVALUATION’S RESULTS?
WHAT WOULD BE THE STAKEHOLDERS’ ROLE IN THE EVALUATION? Should be Involved
(Yes / No) Reasons why the stakeholder you listed
should be involved in the evaluation
APPENDIX 1 | EVALUATION TERMS OF REFERENCE TEMPLATE | PAGE 91
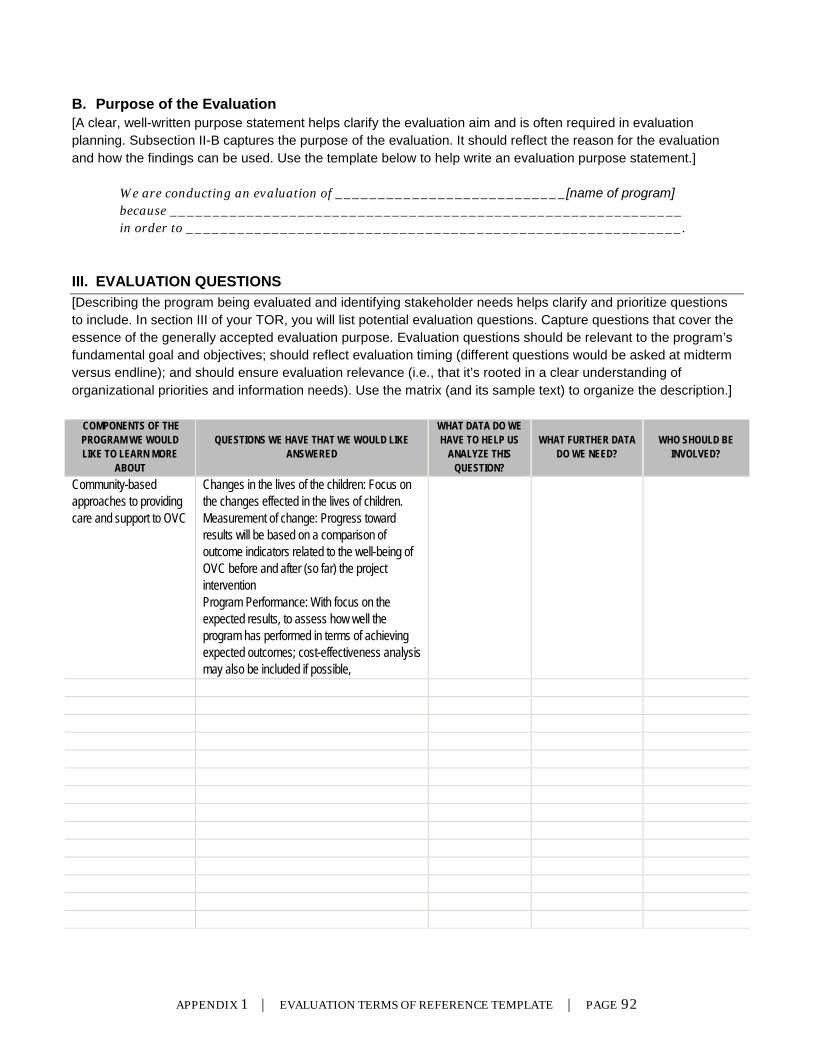
B. Purpose of the Evaluation [A clear, well-written purpose statement helps clarify the evaluation aim and is often required in evaluation planning. Subsection II-B captures the purpose of the evaluation. It should reflect the reason for the evaluation and how the findings can be used. Use the template below to help write an evaluation purpose statement.]
We are conducting an evaluation of ___________________________[name of program] because ____________________________________________________________ in order to __________________________________________________________.
III. EVALUATION QUESTIONS [Describing the program being evaluated and identifying stakeholder needs helps clarify and prioritize questions to include. In section III of your TOR, you will list potential evaluation questions. Capture questions that cover the essence of the generally accepted evaluation purpose. Evaluation questions should be relevant to the program’s fundamental goal and objectives; should reflect evaluation timing (different questions would be asked at midterm versus endline); and should ensure evaluation relevance (i.e., that it’s rooted in a clear understanding of organizational priorities and information needs). Use the matrix (and its sample text) to organize the description.]
COMPONENTS OF THE PROGRAM WE WOULD LIKE TO LEARN MORE
ABOUT
QUESTIONS WE HAVE THAT WE WOULD LIKE ANSWERED
WHAT DATA DO WE HAVE TO HELP US
ANALYZE THIS QUESTION?
WHAT FURTHER DATA DO WE NEED?
WHO SHOULD BE INVOLVED?
Community-based approaches to providing care and support to OVC
Changes in the lives of the children: Focus on the changes effected in the lives of children. Measurement of change: Progress toward results will be based on a comparison of outcome indicators related to the well-being of OVC before and after (so far) the project intervention Program Performance: With focus on the expected results, to assess how well the program has performed in terms of achieving expected outcomes; cost-effectiveness analysis may also be included if possible,
APPENDIX 1 | EVALUATION TERMS OF REFERENCE TEMPLATE | PAGE 92
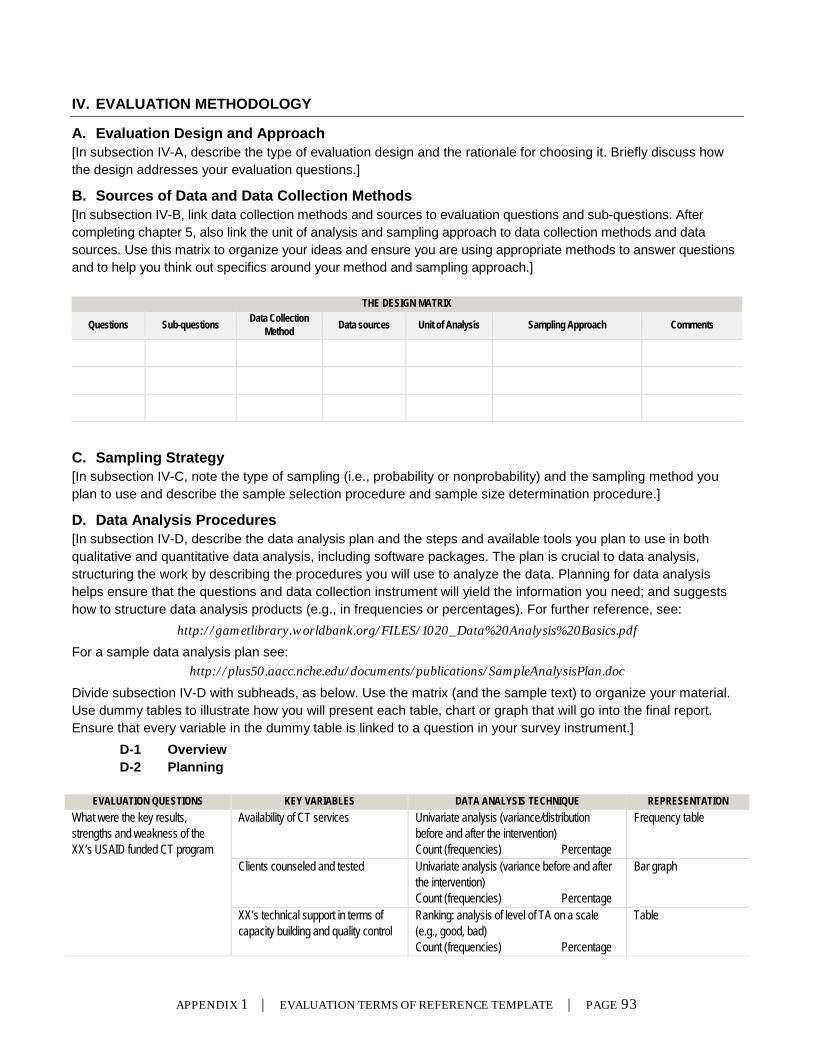
IV. EVALUATION METHODOLOGY
A. Evaluation Design and Approach [In subsection IV-A, describe the type of evaluation design and the rationale for choosing it. Briefly discuss how the design addresses your evaluation questions.]
B. Sources of Data and Data Collection Methods [In subsection IV-B, link data collection methods and sources to evaluation questions and sub-questions. After completing chapter 5, also link the unit of analysis and sampling approach to data collection methods and data sources. Use this matrix to organize your ideas and ensure you are using appropriate methods to answer questions and to help you think out specifics around your method and sampling approach.]
THE DESIGN MATRIX
Questions Sub-questions Data Collection Method Data sources Unit of Analysis Sampling Approach Comments
C. Sampling Strategy [In subsection IV-C, note the type of sampling (i.e., probability or nonprobability) and the sampling method you plan to use and describe the sample selection procedure and sample size determination procedure.]
D. Data Analysis Procedures [In subsection IV-D, describe the data analysis plan and the steps and available tools you plan to use in both qualitative and quantitative data analysis, including software packages. The plan is crucial to data analysis, structuring the work by describing the procedures you will use to analyze the data. Planning for data analysis helps ensure that the questions and data collection instrument will yield the information you need; and suggests how to structure data analysis products (e.g., in frequencies or percentages). For further reference, see:
http://gametlibrary.worldbank.org/FILES/1020_Data%20Analysis%20Basics.pdf
For a sample data analysis plan see: http://plus50.aacc.nche.edu/documents/publications/SampleAnalysisPlan.doc
Divide subsection IV-D with subheads, as below. Use the matrix (and the sample text) to organize your material. Use dummy tables to illustrate how you will present each table, chart or graph that will go into the final report. Ensure that every variable in the dummy table is linked to a question in your survey instrument.]
D-1 Overview D-2 Planning
EVALUATION QUESTIONS KEY VARIABLES DATA ANALYSIS TECHNIQUE REPRESENTATION
What were the key results, strengths and weakness of the XX’s USAID funded CT program
Availability of CT services Univariate analysis (variance/distribution before and after the intervention) Count (frequencies) Percentage
Frequency table
Clients counseled and tested
Univariate analysis (variance before and after the intervention) Count (frequencies) Percentage
Bar graph
XX’s technical support in terms of capacity building and quality control
Ranking: analysis of level of TA on a scale (e.g., good, bad) Count (frequencies) Percentage
Table
APPENDIX 1 | EVALUATION TERMS OF REFERENCE TEMPLATE | PAGE 93
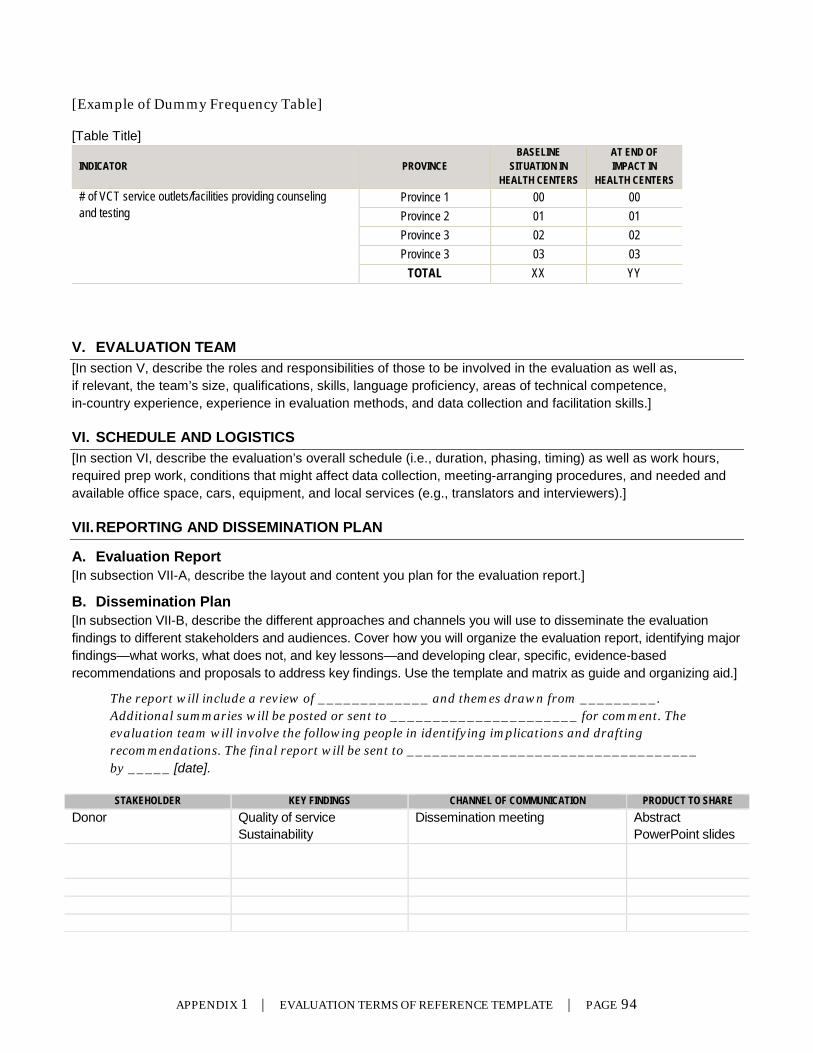
[Example of Dummy Frequency Table]
[Table Title]
INDICATOR PROVINCE BASELINE
SITUATION IN HEALTH CENTERS
AT END OF IMPACT IN
HEALTH CENTERS # of VCT service outlets/facilities providing counseling and testing
Province 1 00 00 Province 2 01 01 Province 3 02 02 Province 3 03 03
TOTAL XX YY
V. EVALUATION TEAM [In section V, describe the roles and responsibilities of those to be involved in the evaluation as well as, if relevant, the team’s size, qualifications, skills, language proficiency, areas of technical competence, in-country experience, experience in evaluation methods, and data collection and facilitation skills.]
VI. SCHEDULE AND LOGISTICS [In section VI, describe the evaluation’s overall schedule (i.e., duration, phasing, timing) as well as work hours, required prep work, conditions that might affect data collection, meeting-arranging procedures, and needed and available office space, cars, equipment, and local services (e.g., translators and interviewers).]
VII. REPORTING AND DISSEMINATION PLAN
A. Evaluation Report [In subsection VII-A, describe the layout and content you plan for the evaluation report.]
B. Dissemination Plan [In subsection VII-B, describe the different approaches and channels you will use to disseminate the evaluation findings to different stakeholders and audiences. Cover how you will organize the evaluation report, identifying major findings—what works, what does not, and key lessons—and developing clear, specific, evidence-based recommendations and proposals to address key findings. Use the template and matrix as guide and organizing aid.]
The report will include a review of _____________ and themes drawn from _________. Additional summaries will be posted or sent to ______________________ for comment. The evaluation team will involve the following people in identifying implications and drafting recommendations. The final report will be sent to __________________________________ by _____ [date].
STAKEHOLDER KEY FINDINGS CHANNEL OF COMMUNICATION PRODUCT TO SHARE Donor Quality of service
Sustainability Dissemination meeting Abstract
PowerPoint slides
APPENDIX 1 | EVALUATION TERMS OF REFERENCE TEMPLATE | PAGE 94
VIII. BUDGET [In section VIII, spell out the evaluation’s finances. Focus on explaining the costs associated with salaries; per diems and expenses; international and in-country travel; stipends to others; payment for translators, data collectors, data processors, and secretarial services; equipment, etc.]
IX. TIMELINE [In section IX, present the schedule for implementation, analysis, and reporting on the evaluation, as in the example.]
ACTION STEPS TARGET DATES TO COMPLETE DD/MM/YYYY–DD/MM/YYYY
Review literature TOR approved Develop interview questions (participatory) Schedule interviews Conduct interviews Analyze data Prepare report Review findings with evaluation team Present and disseminate final report
X. ETHICAL CONSIDERATION [In section X, describe the ethical considerations connected with the evaluation and how they will be addressed. Note that evaluation participants/respondents will first receive an explanation of the purpose of the evaluation and that only participants who have formally consented and agreed to participation, following text similar to the example, below, will be enrolled and interviewed.]
Consent to Participate in the Evaluation
You are being invited to volunteer as a subject in an evaluation being conducted at _______________. This consent form provides you with the information you will need when considering whether to participate in this evaluation. This evaluation carried out by _______________ is governed by national and provincial laws regulating human subjects research. If you decide to participate, you will be asked to sign this consent form or give us your verbal consent which states that you have read the Summary of the Study, that any questions you have about the evaluation have been answered, and that you agree to participate.
Evaluation Purpose: The purpose of the evaluation is ________________________.
Evaluation Procedures: If you decide to participate in the evaluation you will be asked to provide information.
Evaluation Study Risks: Your participation in this evaluation involves no physical risk. We are maintaining strict control over all data. We will not be asking for names, to reduce the risk that any answer you give can be tracked back to you.
Evaluation Benefits: Benefits to you may include a better understanding of your own development as a child or individuals and first-hand experience with an evaluation study. Benefits to society may include a better understanding of whether and how the xxx program contributes to the development of the community that we all live in.
APPENDIX 1 | EVALUATION TERMS OF REFERENCE TEMPLATE | PAGE 95

Costs to the Subject: There are no costs for participating in this evaluation.
Confidentiality: If you consent to participate, your personal information will be kept confidential.
Voluntary Participation in, and Withdrawal from, the Evaluation: The decision whether to be in this evaluation is entirely up to you. Participation is voluntary. You can refuse to participate, or can withdraw from the evaluation at any time; such a decision will not affect your relationship with ______________ [organization], either now or in the future. Nor will a refusal or withdrawal of participation result in the loss of any other benefits to which you are otherwise entitled. Signing this form does not waive any of your legal rights.
Contacts: If you have any questions, please ask, and we will do our best to answer them. If you have additional questions in the future, please contact ______________ [full name], at ______________ [email address] or at ______________ [phone number]. Copies of this consent form are available on request.
Statement of Consent I have reviewed the evaluation purpose outlined above and have had any questions I have about the evaluation answered to my satisfaction. I understand that my participation is voluntary and that I can withdraw from the evaluation at any time without prejudice. Signing this form does not waive any of my legal rights.
By signing below, you are indicating that this form has been explained to you, that you understand it, and any questions you have about the evaluation have been answered. You are indicating that you understand the ways the evaluation data may be used and how your privacy will be protected.
By signing this form, you are agreeing to participate in the evaluation at this time only.
I ACKNOWLEDGE THAT I HAVE READ THE ABOVE EXPLANATION OF THIS EVALUATION THAT ALL OF MY QUESTIONS HAVE BEEN SATISFACTORILY ANSWERED, AND I AGREE TO PARTICIPATE IN THIS EVALUATION.
______________________________________ Date _______________ Signature of the Participant ______________________________________ Printed Name of Participant I CERTIFY THAT I HAVE EXPLAINED FULLY TO THE ABOVE SUBJECT THE NATURE AND PURPOSE, PROCEDURES, AND POSSIBLE RISK AND POTENTIAL BENEFITS OF THIS EVALUATION. ______________________________ Date _______________ Signature of Interviewer PRINCIPAL INVESTIGATORS Name: [Name of the organization] Email: [email protected] Tel: 000 0000 0000
APPENDIX 1 | EVALUATION TERMS OF REFERENCE TEMPLATE | PAGE 96