Embed Size (px)
Citation preview

1
EDUCATION
2015
FIELD GUIDE to
in CONNECTICUT

2

EDUCATIONFIELD GUIDE to
in CONNECTICUT
twitter.com/conncan facebook.com/conncan
2015

CONNECTICUT
EDUCATIONLaNDsCapE
field guide
2015
STUDENTresults
field guide 2015
QUALITYEDUCATOR
SCHOOLFINANCE
field guide 2015
earLyCHiLdHOOd
EDUCATIONfield guide
2015
EDUCATIONFIELD GUIDE to
in CONNECTICUT
2015
SChOOL turnarounds
FIELD GUIDE 2015
Table of Contents
EDUCATIONFIELD GUIDE to
in CONNECTICUT
2015
Connecticut Education Landscape 1
Student Results 8
Success Story Schools 29
Educator Quality 33
School Finance 39
Early Childhood Education 42
School Turnarounds 45
QUALITY


1
CONNECTICUT
EDUCATIONLaNDsCapE
field guide
2015

CT public school students, 2013-2014
Note: Low-income is defined as students who are eligible for free or reduced lunch.Source: Conn. State Dept. of Educ., Public District Enrollment by Race and Gender: 2013-2014, www.sde.ct.gov; Conn. Open Data, 2013-2014 Indicators of Educational Need by District, https://data.ct.gov.
Male280,981
51%
White319,088
58%
American Indian/Alaska Native
1,548<1%
Native Hawaiian/Pacific Islander
511 <1%
Two or MoreRaces12,859
2%
Asian25,436
5%Black/African
American70,62613%
Hispanic/Latino
115,54521%
Female264,633
49%
0
60,000
120,000
180,000
240,000
31,093
6%
English Language Learners (ELL)
Low-income (Free/Reduced Lunch)
Students withDisabilities
37%
12%
202,623
66,273
Gender
student Group
Race
Total public school students: 545,614
CT education Landscape2

CONNCAN FIELD GUIDE TO EDUCATION IN CONNECTICUT
CT education Landscape 3
Notes: 1) Each interdistrict magnet school is also included in either the traditional or RESC school count based on the school’s operator. 2) The maximum grade range for each category is included in parentheses; schools may not have all grades that fall under each range. 3) Total only includes unique schools.Source: Conn. State Dept. of Educ., The Condition of Education in Connecticut: 2013-2014, www.sde.ct.gov; Conn. Open Data, 2014 Education Directory, https://data.ct.gov.
public school Types, 2013-2014
School Type1 Number of Schools
Traditional Public Schools 1,040
regional educational Service Centers (reSCs)
58
Technical High Schools 17
Public-Private Schools 3
State agency Facilities 25
Charter Schools 18
interdistrict Magnet Schools 80
Grade Level2 Number of Schools
Pre-K Only 36
elementary/Middle Schools (PK-8) 819
High Schools (9-12) 229
Combined elementary/Middle & High Schools
(PK-12 or 6-12)77
Total3 1,161

school Districts, 2013-2014
districtNumber of Students
Number of districts
% of all Students
5,000 and Over 273,313 28 50%
3,000 - 4,999 114,510 29 21%
2,000 - 2,999 78,962 32 14%
1,000 - 1,999 44,336 30 8%
500 - 999 20,566 26 4%
Under 500 13,927 52 3%
Total 545,614 197 100%
CT education Landscape4
Top Five Districts by Enrollment
district Number of Students % of all Students in CT
New Haven 21,304 3.9%
Hartford 21,250 3.9%
Bridgeport 20,710 3.8%
Waterbury 18,611 3.4%
Stamford 15,811 2.9%
Total 97,686 17.9%
Source: Conn. State Dept. of Educ., Public District Enrollment by Race and Gender: 2013-2014, www.sde.ct.gov.

CONNCAN FIELD GUIDE TO EDUCATION IN CONNECTICUT
CT education Landscape 5
Connecticut’s public school options include charter schools, interdistrict magnet schools, agricultural science centers, technical high schools, and the Open Choice program.
Parents Demand School Options
• There were more than 3,600 students on waiting lists for charter
schools in 2013-2014.
• in 2013-2014, 20,000 students applied for just 5,000 seats in Hartford’s magnet schools.
Public Charter Schools: High-Quality Options for Historically Underserved Student Populations
• Charter schools serve a predominantly low-income and minority population, reflecting the communities in which they are located. More than 85% of students in Connecticut’s charter schools are Black/african american or Hispanic/Latino and more than 70% of charter school students are low-income.
• according to the State department of education, during the 2012-2013 school year, 86% of Connecticut’s charter schools outperformed their host district on the Connecticut Mastery Test (CMT) and 83% on the Connecticut academic Performance Test (CaPT).
school Options
Note: The Open Choice program allows urban students to attend public schools in nearby suburban towns, and suburban and rural students to attend public schools in a nearby urban center. Source: Conn. State Dept. of Educ., Choose Success!, Nov. 2013, www.sde.ct.gov; Conn. State Dept. of Educ., 2015 Char-ter School Accountability & Renewal Presentation to the Connecticut State Board of Education, www.sde.ct.gov; Conn. State Dept. of Educ., 2014 Biennial Report on the Operation of Charter Schools in Connecticut, www.sde.ct.gov; Conn. State Dept. of Educ., 2012-2013 School & District Performance Reports, www.sde.ct.gov; Hartford Courant, Navigating the Magnet-Open Choice Lottery System, Nov. 2014, www.courant.com.

DIaNNa R. WENTzELL - COmmIssIONER OF EDUCaTION
myRa JONEs-TayLOR - COmmIssIONER OF ThE OFFICE OF EaRLy ChILDhOOD
sTaTE BOaRD OF EDUCaTION mEmBERs
allan B. Taylor – Chairperson
Theresa Hopkins-Staten – Vice Chairperson
erin d. Benham Gregory W. Gray
Terry H. Jones estela López
Maria i. Mojica robert Trefry
Joseph J. Vrabely, Jr. Stephen P. Wright
Student Members (2)
MOre iNFOrMaTiON:
State department of education Website: www.sde.ct.gov
General assembly education Committee Website: www.cga.ct.gov/ED
Office of early Childhood Website: www.ct.gov/oec
Note: Two non-voting student members are selected each year to serve a one-year term.Source: Conn. State Dept. of Educ., State Department of Education Home, Apr. 2015, www.sde.ct.gov; Conn. State Dept. of Educ., State Board of Education Home, Apr. 2015, www.sde.ct.gov; Conn. Office of Early Childhood Home, Apr. 2015, http://www.ct.gov/oec.
state Education Leadership
CT education Landscape6

CONNCAN FIELD GUIDE TO EDUCATION IN CONNECTICUT
GeNeraL aSSeMBLy edUCaTiON COMMiTTee LeaderSHiP
SeNaTe HOUSe OF rePreSeNTaTiVeS
Sen. Gayle SlossbergCo-Chair
rep. andrew Fleischmann Co-Chair
Sen. Toni Boucherranking Member
rep. Gail Lavielleranking Member
Sen. Gary WinfieldVice Chair
rep. robert Sanchez Vice Chair
GeNeraL aSSeMBLy edUCaTiON COMMiTTee MeMBerS
Sen. danté Bartolomeo
rep. Mitch Bolinsky
rep. Henry Genga
rep. douglas McCrory
Sen. art Linares
rep. aundré Bumgardner
rep. Susan Johnson
rep. Brandon McGee
Sen. Beth Bye
rep. Juan Candelaria
rep. Noreen Kokoruda
rep. Patricia Billie Miller
rep. Tim ackert
rep. dan Carter
rep. Timothy LeGeyt
rep. Gayle Mulligan
rep. andre F. Baker
rep. Michelle Cook
rep. roland Lemar
rep. Jason rojas
rep. Sam Belsito
rep. Jeff Currey
rep. Kathleen McCarty
rep. Pam Staneski
Source: Conn. Gen. Assembly, Education Committee, http://www.cga.ct.gov/ed.
state Education Leadership
CT education Landscape 7
rep. eric C. Berthel
rep. Michael d’agostino
rep. Cristin McCarthy Vahey

8 CT education Landscape 8
STUDENTresults
field guide 2015

CONNCAN FIELD GUIDE TO EDUCATION IN CONNECTICUT
Student results 9
CmT & CapT
Until 2013-2014, the state administered the Connecticut Mastery Test (CMT) for grades 3-8 and the Connecticut academic Performance Test (CaPT) in 10th grade to assess Math, reading, Writing, and Science in all public schools and districts statewide. The State department of education reports scores for schools and districts as the percentage of students scoring at one of five possible levels: advanced, goal, proficient, basic, and below basic. ConnCaN reports on the “goal” standard, which is more rigorous than “proficient” because “goal” is the state’s best estimate of students meeting or exceeding grade-level expectations.
smarter Balanced assessment
Created in 2009 and currently adopted by 43 states, the Common Core State Standards are a set of college and career ready standards for kindergarten through 12th grade in english Language arts/Literacy and Mathematics. Connecticut adopted the Standards in 2010 and administered the Smarter Balanced assessment statewide in 2014-2015. The Smarter Balanced assessment is a comprehensive accountability measure aligned to the Common Core. The state requires all students to take the tests in grades 3-8 and in 11th grade to assess english Language arts/Literacy and Math. in 2013-2014, approximately 90% of districts administered the Smarter Balanced field test in place of the CMT and CaPT for math and reading, but results are not yet available.
The most recent publicly available assessment data in math and reading is from the 2013 CMT and CaPT as reported in this publication.
Overview of state assessments
Source: Conn. State Dept. of Educ., CMT, www.sde.ct.gov; Conn. State Dept. of Educ., CAPT, www.sde.ct.gov; Conn. State Dept. of Educ., 2010 Connecticut Mastery Test Fourth Generation Interpretive Guide, www.sde.ct.gov.

Student results10
Description of assessments
Test Name Grade Level Subjects additional information
National
National assessment
of educational Progress(NaeP)
4th, 8th, 12th Grades
Math, reading, Science, Social
Studies, and the arts
www.nces.ed.gov/nationsreportcard
SaT High School Math, reading, and Writing www.sat.collegeboard.org
advanced Placement exams
(aP)High School
Math, reading, Science, Social Studies, World
Languages, and the arts
www.apstudent.collegeboard.org
Connecticut
Connecticut Mastery Test
(CMT)3rd-8th Grades
reading, Math, Writing for all grades, Science for
grades 5 and 8 only
www.sde.ct.govwww.cmtreports.com
Connecticut academic
Performance Test(CaPT)
10th Gradereading,
Math, Writing, Science
www.sde.ct.govwww.captreports.com
Smarter Balanced assessment
(SBaC)
3rd-8th and 11th Grades
english Language arts/Literacy, Math
www.smarterbalanced.orgwww.ctcorestandards.org
Source: Nat’l Assessment of Educ. Progress, http://nces.ed.gov/nationsreportcard/about/; SAT, https://sat.collegeboard.org/about-tests/sat/faq; Advanced Placement Exams, https://apstudent.collegeboard.org/home; Connecticut Mastery Test, www.sde.ct.gov; Connecticut Academic Performance Test, www.sde.ct.gov.

CONNCAN FIELD GUIDE TO EDUCATION IN CONNECTICUT
student Results, 2013 NaEp
SubjectCT: Percent at or above Proficient
Nationwide: Percent at or above Proficient
4th Grade
Math 45.1 41.3
reading 42.6 34.0
8th Grade
Math 37.1 34.4
reading 45.1 34.3
12th Grade
Math 32.5 24.6
reading 49.5 36.0
The overall percent of Connecticut students performing at or above proficient is higher than the national percentage in math and reading at all tested grade levels. However, students of color and low-income students lag behind other states’ proficiency levels.
Student results 11
Note: Nationwide NAEP scores are those of public school students only.Source: Nat’l Assessment of Educ. Progress (NAEP), 2013 NAEP Data Explorer, http://nces.ed.gov/nationsreportcard/naepdata.

Student results12
math proficiency Rates, 2013 NaEp4th Grade Math, Hispanic/Latino Students
0 10 20 30 40 50
SDUTCTCAID
ORNEOKTNMIRI
ALWINYWAPANV
ILSC
NMNATL. AVG.
MSNDDEAZ
MOLA
WYNJKYCOTXIA
ARKSVA
MAMDGAAK
MNMTNHNCOHFLINHI 42.5
26.1 National Avg.
Percent At or Above Proficient
PerFOrMaNCe SPOTLiGHT
Highest: Hawaii 42.5%
National average 26.1%
Connecticut 18.6%
Lowest: South dakota 16.2%
16.2
Hawaii
Connecticut had the third lowest percentage of 4th grade Hispanic/Latino students score proficient or above in math. Low-income Hispanic/Latino students performed even lower in math, with the second lowest percentage of students scoring proficient or above.
South Dakota
Connecticut18.6
Note: Some states not included due to insufficient sample size. Low-income is defined as students who are eligible for free or reduced lunch.Source: Nat’l Assessment of Educ. Progress (NAEP), 2013 NAEP Data Explorer, http://nces.ed.gov/nationsreportcard/naepdata.

CONNCAN FIELD GUIDE TO EDUCATION IN CONNECTICUT
Reading achievement Gaps, 2013 NaEp4th Grade reading, Low-income & Non Low-income Students
3.2
2.9 National Avg.
Connecticut
Performance Gap (Grade Level)
PerFOrMaNCe SPOTLiGHT
Smallest: West Virginia 1.4
National average 2.9
Connecticut 3.2
Largest: alaska 3.3
Connecticut’s achievement gap on the 2013 NaeP reading test between 4th grade low-income and non low-income students is larger than all but four states.
0 1 2 3 4 5
AKILRI
CTTNCAMAVAMSCOSCNJORAL
OHKS
NATL. AVGWA
HITXGAWI
MNAZ
NMPALANV
MDNYNCSDVTIAMI
MONEARFLKYDEUTNHIN
OKID
MTMEWYNDWV
3.3
1.4 West Virginia
Alaska
Student results 13
Note: Grade levels are calculated using the general principle that 10 points on the NAEP equals one year of growth. Low-income is defined as students who are eligible for free or reduced lunch.Source: Nat’l Assessment of Educ. Progress (NAEP), 2013 NAEP Data Explorer, http://nces.ed.gov/nationsreportcard/naepdata; ERIC, Validity Issues Involved in Cross-Grade Statements about NAEP Results, Jan. 2012, http://eric.ed.gov.

Student results14
Connecticut achievement Gaps, 2013 NaEp
Gap Between
4th Grade Math
4th Grade reading
8th Grade Math
8th Grade reading
12th Grade Math
12th Grade reading
Low-income and Non
Low-income
LarGeST GaP
in bottom
8%
LarGeST GaP
LarGeST GaP
LarGeST GaP
LarGeST GaP
Black/african
american and White
in bottom
9%
in bottom 16%
in bottom 16%
in bottom
33%
in bottom
30%
in top
30%
Hispanic/ Latino
and White
LarGeST GaP
in bottom 11%
LarGeST GaP
in bottom
7%
LarGeST GaP
LarGeST GaP
english Language Learners (eLL) and Non-eLL
in bottom 18%
in bottom 18%
LarGeST GaP
inbottom
6%
Not applicable
Not applicable
Connecticut has some of the largest achievement gaps in the country, ranking in the bottom 10% or lower in 14 out of 22 measures.
elementary/Middle School: Largest gap in 6 out of 16 measures.High School: Largest gap in 4 out of 6 measures.
Note: Connecticut data is not reported for English Language Learner students on the 12th grade NAEP. Low-income is defined as students who are eligible for free or reduced lunch. For more information, visit www.conncan.org/standards.Source: Nat’l Assessment of Educ. Progress (NAEP), 2013 NAEP Data Explorer, http://nces.ed.gov/nationsreportcard/naepdata.

CONNCAN FIELD GUIDE TO EDUCATION IN CONNECTICUT
CapT
GradePercent at or
above Goal (%)
Math
10 52.6
reading
10 48.5
Note: For more information, visit www.conncan.org/standards. Source: Conn. State Dept. of Educ., 2013 Data Interaction for CMT, www.cmtreports.com; Conn. State Dept. of Educ., 2013 Data Interaction for CAPT, www.captreports.com.
CmT
student Results, 2013 CmT & CapT
Percent at or above Goal (%)
Grade Math reading
3 61.6 56.9
4 65.4 62.7
5 69.4 66.9
6 67.2 73.3
7 65.7 78.9
8 65.2 76.3
Student results 15
increase from previous grade
decrease from previous grade

3 4 5 6 7 8
0
10
20
30
40
50
60
70
80
90
Grade
Aver
age
Perc
ent o
f Stu
dent
s At
or A
bove
Goa
l 34.1Gap
36.2Gap
37.0Gap
36.8Gap
34.6Gap
35.1Gap
Black/african american
White
Gap
student Results by Race, 2013 CmT
Note: Averages include all subjects at each tested grade level. Achievement gap refers to the disparity in educational outcomes between student groups, especially groups that differ by income level, race/ethnicity, or native language. Source: Conn. State Dept. of Educ., 2013 Data Interaction for CMT, www.cmtreports.com.
Student results16
3 4 5 6 7 8
0
10
20
30
40
50
60
70
80
90

CONNCAN FIELD GUIDE TO EDUCATION IN CONNECTICUT
Note: Averages include all subjects at each tested grade level. Achievement gap refers to the disparity in educational outcomes between student groups, especially groups that differ by income level, race/ethnicity, or native language. Source: Conn. State Dept. of Educ., 2013 Data Interaction for CMT, www.cmtreports.com.
student Results by Race, 2013 CmT
3 4 5 6 7 8
0
10
20
30
40
50
60
70
80
90
Grade
Aver
age
Perc
ent o
f Stu
dent
s At
or A
bove
Goa
l
34.0Gap
33.4Gap
36.9Gap
34.5Gap
34.3Gap
34.5Gap
Hispanic/Latino
White
Gap
Student results 17
3 4 5 6 7 8
0
10
20
30
40
50
60
70
80
90

3 4 5 6 7 8
0
10
20
30
40
50
60
70
80
90
Note: Averages include all subjects at each tested grade level. Low-income is defined as students who are eligible for free or reduced lunch. Achievement gap refers to the disparity in educational outcomes between student groups, especially groups that differ by income level, race/ethnicity, or native language. Source: Conn. State Dept. of Educ., 2013 Data Interaction for CMT, www.cmtreports.com.
Grade
Aver
age
Perc
ent o
f Stu
dent
s At
or A
bove
Goa
l
34.2Gap35.8
Gap37.2Gap
36.1Gap
35.0Gap36.8
Gap
Low-income
Non Low-income
Gap
student Results by Income Level, 2013 CmT
Student results18
3 4 5 6 7 8
0
10
20
30
40
50
60
70
80
90

CONNCAN FIELD GUIDE TO EDUCATION IN CONNECTICUT
ELL
3 4 5 6 7 8
0
10
20
30
40
50
60
70
80
90
56.1Gap
62.1Gap
57.3Gap
49.4Gap
53.5Gap
43.9Gap
eLL
Non-eLL
Gap
Grade
Aver
age
Perc
ent o
f Stu
dent
s At
or A
bove
Goa
lstudent Results by ELL status,
2013 CmT
Note: Averages include all subjects at each tested grade level. English Language Learners is abbreviated as ELL. Achievement gap refers to the disparity in educational outcomes between student groups, especially groups that differ by income level, race/ethnicity, or native language. Source: Conn. State Dept. of Educ., 2013 Data Interaction for CMT, www.cmtreports.com.
Student results 19
3 4 5 6 7 8
0
10
20
30
40
50
60
70
80
90

0
10
20
30
40
50
60
70
80
90
48.0Gap40.0
Gap40.4Gap
43.8Gap
Gap
White White Non Low- income
Non-ELL
Black/ african
american
hispanic/Latino
Low-income
ELL
Aver
age
Perc
ent o
f Stu
dent
s At
or A
bove
Goa
l10th Grade student Results
2013 CapT
Note: Averages include all tested subjects on the CAPT. Low-income is defined as students who are eligible for free or reduced lunch. English Language Learners is abbreviated as ELL. Achievement gap refers to the disparity in educational outcomes between student groups, especially groups that differ by income level, race/ethnicity, or native language. Source: Conn. State Dept. of Educ., 2013 Data Interaction for CAPT, www.captreports.com.
Student Group
Student results20
3 4 5 6 7 8
0
10
20
30
40
50
60
70
80
90
CONNCAN FIELD GUIDE TO EDUCATION IN CONNECTICUT
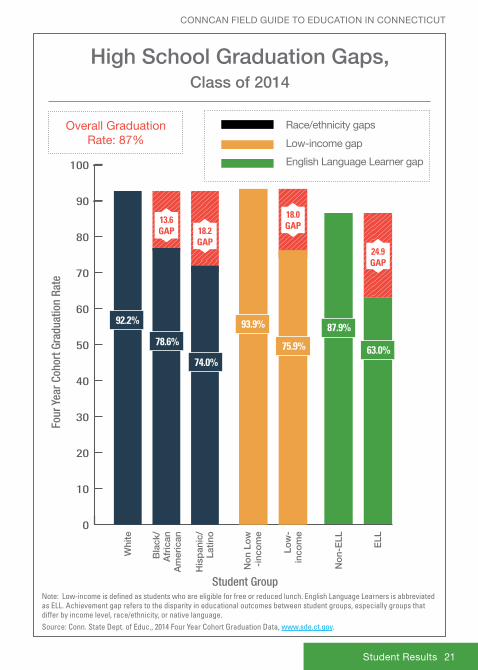
Note: Low-income is defined as students who are eligible for free or reduced lunch. English Language Learners is abbreviated as ELL. Achievement gap refers to the disparity in educational outcomes between student groups, especially groups that differ by income level, race/ethnicity, or native language. Source: Conn. State Dept. of Educ., 2014 Four Year Cohort Graduation Data, www.sde.ct.gov.
0
10
20
30
40
50
60
70
80
90
100
Student Group
Four
Yea
r Coh
ort G
radu
atio
n Ra
te
Bla
ck/
afr
ican
am
eric
an
No
n-E
LL
No
n Lo
w
-inc
om
e
Whi
te
his
pan
ic/
Latin
o
ELL
Low
- in
com
e
13.6GAP 18.2
GAP24.9GAP
18.0GAP
93.9%
78.6%
92.2%
75.9%
74.0%
high school Graduation Gaps, Class of 2014
Overall Graduation rate: 87%
Student results 21
87.9%
63.0%
race/ethnicity gaps
Low-income gap
english Language Learner gap

Student results22
0 20 40 60 80 100
White
Hispanic/Latino
Black/African American
Asian, Asian-American, or
Paci�c Islander
American Indianor Alaska Native
Overall
Percent of Seniors Who Took the SAT and Scored at the College and Career Ready Benchmark
in 2014, less than half (45%) of all students who took the SaT were ready for college.
College Readiness Results by Race, 2014 saT
45% = Overall
Note: The College Board considers a composite score of 1550 (out of a possible 2400) as representative of college and career readiness because it indicates a likelihood of achieving a B- average or higher during the first year of college.Source: Conn. State Dept. of Educ., The Condition of Education in Connecticut: 2013-2014, www.sde.ct.gov. College Board, SAT Data, http://research.collegeboard.org; College Board, 2015 About SAT Scores, https://satscore.collegeboard.org.

CONNCAN FIELD GUIDE TO EDUCATION IN CONNECTICUT
Student results 23
0.0 0.5 1.0 1.5 2.0 2.5 3.0 3.5 4.0
Total
White
Asian
Black/AfricanAmerican
OtherHispanic
PuertoRican
MexicanAmerican
AmericanIndian
Average AP Score (possible score of 5)
3 = Qualified
in 2014, Connecticut ranked second nationwide with more than 30% of high school graduates scoring 3 or better on at least one aP exam.
College Readiness Results by Race, 2014 ap
Note: “Qualified” signifies the ability to complete introductory-level course work in a particular college-level subject. Low-income is defined as students who are eligible for free or reduced lunch. English Language Learners is abbreviated as ELL. Source: Conn. State Dept. of Educ., The Condition of Education in Connecticut: 2013-2014, www.sde.ct.gov. College Board, AP Data http://research.collegeboard.org; College Board, 2015 About AP Scores, https://apscore.collegeboard.org.

if 90% of Connecticut high school students from the Class of 2012 had graduated instead of 76% (an increase of
5,900 graduates), Connecticut would have 450 new jobs and:
$14 million in increased annual state/local tax revenues
$108 million in increased annual gross state product
$9.7 million in increased annual auto sales
$57 million in increased annual spending
$86 million in increased annual earnings
$293 million in increased home sales
The Economic Impact
Source: Alliance for Excellent Educ., Economic Benefits of Increasing the High School Graduation Rate for Public School Students in Connecticut, Oct. 2013, www.all4ed.org/publications.
Student results24
each icon represents $20 million

CONNCAN FIELD GUIDE TO EDUCATION IN CONNECTICUT
Student results 25
• More than 75% of the Connecticut inmate population is without a high school diploma or Ged.
• Nearly 40% of inmates are between the ages of 14-30.
annual Cost of incarceration Per inmate vs.
annual Per-Pupil Spending
$35,000
$15,000
high school Dropouts & Incarceration Costs
it costs Connecticut more than twice as much to incarcerate an individual than to educate one.
high school Dropouts Cost Connecticut Billions• a 5% increase in the state’s male high school graduation rate would lead
to approximately $141 million in crime related savings.
• dropouts of the Connecticut high school class of 2011 will lose more than $1.4 billion in lifetime earnings because they lack a high school diploma.
• in 2013, high school dropouts age 25 and older in Connecticut were unemployed at a rate of 18% compared to 4% with a bachelor’s degree or higher.
Note: Annual per-inmate cost of incarceration and per-pupil spending is approximated based on data from the 2012-2013 fiscal and school years, respectively. Source: Conn. Dept. of Corr., 2013 Annual Report, http://www.ct.gov; Conn. Dept. of Corr., Jan. 2015 Research Unit Monthly Statistics, http://www.ct.gov; Conn. State Dept. of Educ., 2012-2013 Bureau of Grants Management: NCEP, www.sde.ct.gov; Alliance for Excellent Educ., The High Cost of High School Dropouts: What the Nation Pays for Inadequate High Schools, Nov. 2011, www.all4ed.org; U.S. Census Bureau, 2013 Table S2301: Employment Status American Community Survey 5-Year Estimates, http://factfinder.census.gov; Alliance For Excellent Education, Saving Futures, Saving Dollars: The Impact of Education on Crime Reduction and Earnings, Sept. 2013, www.all4ed.org.

Source: Conn. State Dept. of Educ., 2014 College Entrance, Remediation, and Credit Earning: Results from P20WIN for the Grad-uation Cohort of 2010, www.sde.ct.gov; Conn. State Dept. of Educ., 2009-2012 College Enrollment, Persistence, and Graduation: Statewide Results, www.sde.ct.gov.
0
10
20
30
40
50
60
Student GroupBla
ck/a
fric
an
am
eric
an
Non
-eLL
Non
Low
-i
ncom
e
Whi
te
His
pan
ic/
Latin
o
eLL
Low
- in
com
e
Overall 6-year College Completion rate: 46%
Lack of college readiness increases the need for college remediation and creates dramatic gaps in college completion rates between student groups.
Overall, 48% of students from the 2010 graduating cohort who enrolled in CT Community Colleges or CT State Universities took remedial courses. More than 64% of minority, low-income, and eLL students needed remedial courses.
53%
21.5%
52.2%46.6%
19.6% 18.7%17.2%
31.5GAP
33.4GAP
33.5GAP
29.4GAP
College CompletionPe
rcen
t Ear
ning
a C
olle
ge D
egre
e in
Six
Yea
rs, C
lass
of 2
007
Student results26
race/ethnicity gaps
Low-income gap
english Language Learner gap

CONNCAN FIELD GUIDE TO EDUCATION IN CONNECTICUT
Student results 27
$22,270
$33,524
$40,152
$59,515
$77,705
0
$10,000
$20,000
$30,000
$40,000
$50,000
$60,000
$70,000
$80,000
Less than high school
graduate
High school graduate or equivalent
Some college or
associate's degree
Bachelor's degree
Graduate or professional
degree
State Median individual income:
$44,592
in Connecticut, high school dropouts make about $22,000 less than the statewide Median individual income.
Income Levels by Education Level, 2013M
edia
n In
divi
dual
Ear
ning
s Ov
er 1
2 M
onth
s
By 2020, 70% of Connecticut jobs will require some form of higher education.
Note: Median individual income is reported for the population 25 years and over. Source: U.S. Census Bureau, 2013 Table S2001: Earnings in the Past 12 Months American Community Survey 5-Year Estimates, http://factfinder.census.gov; Georgetown Univ., Recovery: Job Growth and Education Requirements Through 2020, June 2013, http://cew.georgetown.edu.

Student achievement gaps mirror the earnings gap of Connecticut’s adults.
28
Source: U.S. Census Bureau, 2013 Table S1903: Median Income in the Past 12 Months American Community Survey 5-Year Estimates, http://factfinder.census.gov.
0
$15,000
$30,000
$45,000
$60,000
$75,000
$90,000
Race/Ethnicity
Med
ian
Hous
ehol
d In
com
e
Black/africanamerican
Hispanic/Latino
White
$77,900
$42,208
$39,852
State Median Household income: $69,461
48.8%LESS
45.8%LESS
achievement Gaps Lead to Earnings Gaps
Student results28

29

Overview
ConnCaN’s School report Cards project assigns letter grades to every Connecticut public school based on student achievement. Using data from the project, ConnCaN identifies Success Story schools, schools that provide a high-quality education to Connecticut’s most underserved students regardless of race, wealth, or ZiP code.
To qualify, a school must enroll more minority students and more low-income students than the state average and at least one group (Black/african american, Latino/Hispanic, or low-income students) must perform above the overall state average. These schools must also ensure that the performance of one single group does not fall far below the rest of the students at their school, since all groups must receive a grade of “C” or higher.
School Grade Key: A B C D F
Success Story Schools30
Success Story Schools
Note: Performance is measured by the Conn. State Dept. of Educ. School Performance Index (SPI) for the 2012-2013 school year. Low-income is defined as students who are eligible for free or reduced lunch. For more information, visit www.reportcards.conncan.org.

CONNCAN FIELD GUIDE TO EDUCATION IN CONNECTICUT
Success Story Schools 31
success story school List
Name of School Type of School Town
elementary/Middle Schools
amistad academy Charter New Haven
Carmen arace intermediate School Traditional Bloomfield
Carmen arace Middle School Traditional Bloomfield
eli Whitney School Traditional Stratford
elm City College Preparatory School
Charter New Haven
engineering - Science University Magnet School
Magnet New Haven
High Horizons Magnet School* Magnet Bridgeport
House of arts Letters and Science (HaLS) academy*
Magnet New Britain
Jefferson Magnet School Magnet Norwalk
Maloney interdistrict Magnet School
Magnet Waterbury
Medical Professions and Teacher Preparation academy*
Magnet - CreC Windsor
Metropolitan Learning Center Magnet - CreC Bloomfield
Montessori Magnet School Magnet - CreC Hartford
Multicultural Magnet School* Magnet Bridgeport
Nathan Hale Middle School Traditional Norwalk
Noah Webster Micro Society School
Magnet Hartford
Note: An asterisk (*) denotes magnet schools with selective admissions. Engineering - Science Magnet School is part of New Haven Public Schools but is geographically located in Hamden. CREC stands for Capiol Region Education Council, a Regional Education Service Center (RESC) that operates interdistrict magnet schools in the Hartford metro region. Source: ConnCAN, School Report Cards, www.reportcards.conncan.org/Success-Stories.

success story school List
Success Story Schools32
Name of School Type of School Town
elementary/Middle Schools
Northend School Traditional New Britain
Odyssey Community School Charter Manchester
Park City Magnet School Magnet Bridgeport
Park City Prep Charter School Charter Bridgeport
renzulli academy Magnet Hartford
rotella interdistrict Magnet School Magnet Waterbury
roton Middle School Traditional Norwalk
Scofield Middle School Magnet Stamford
Shelter rock School Traditional danbury
Thomas Hooker School Traditional Meriden
University of Hartford Multiple intelligences Magnet School
Magnet - CreC West Hartford
Waterbury arts Magnet School (Middle)
Magnet Waterbury
Wendell L. Cross School Traditional Waterbury
Worthington Hooker School Traditional New Haven
High Schools
amistad academy Charter New Haven
W. F. Kaynor Technical High SchoolTechnical High
SchoolWaterbury
Note: An asterisk (*) denotes magnet schools with selective admissions. Students who attend middle school at Amistad Academy, Elm City College Preparatory, or Achievement First Bridgeport may attend Amistad Academy High School. CREC stands for Capitol Region Education Council, a Regional Education Service Center (RESC) that operates interdis-trict magnet schools in the Hartford metro region. Source: ConnCAN, School Report Cards, www.reportcards.conncan.org/Success-Stories.

CONNCAN FIELD GUIDE TO EDUCATION IN CONNECTICUT
QUALITYEDUCATOR

Total Staff % of Total
Gender
Female 27,057 73.5%
Male 9,766 26.5%
ethnicity
Black/african american 1,119 3.0%
asian 413 1.1%
Hispanic/Latino 1,310 3.6%
White 33,933 92.2%
Native american 48 0.1%
experience
average Number of years of experience 14 N/a
average age 43 N/a
Has at Least a Master’s degree 29,053 78.9%
Total 36,823 100%
Gender
Female 1,897 58.5%
Male 1,345 41.5%
ethnicity
Black/african american 258 8.0%
asian 20 0.6%
Hispanic/Latino 122 3.8%
White 2,838 87.5%
Native american 4 0.1%
experience
average Number of years of experience 22 N/a
average age 50 N/a
Has at Least a 6th year degree 1,913 59.0%
Total 3,242 100%
Ge
Ne
ra
L e
dU
CaT
iON
Te
aC
He
rS
Teacher & administrator profiles, 2012-2013a
dM
iNiS
Tr
aTO
rS
, CO
Or
diN
aTO
rS
, a
Nd
de
Pa
rT
Me
NT
CH
air
S
QUALITY
educator Quality34

CONNCAN FIELD GUIDE TO EDUCATION IN CONNECTICUT
educator Quality 35
Teacher preparation, 2011-2012
Teacher Preparation Program Total Number of Graduates
% of all Graduates
Southern Connecticut State University 270 12.9%
Central Connecticut State University 256 12.2%
University of Connecticut 209 10.0%
University of Bridgeport 189 9.0%
Sacred Heart University 183 8.7%
alternate route to Certification 151 7.2%
University of New Haven 132 6.3%
eastern Connecticut State University 129 6.2%
Fairfield University 121 5.8%
Quinnipiac University 100 4.8%
Western Connecticut State University 86 4.1%
University of Saint Joseph 82 3.9%
Teach for america 72 3.4%
University of Hartford 68 3.3%
Connecticut College 22 1.1%
Charter Oak State College 11 0.5%
Mitchell College 6 0.3%
albertus Magnus College 5 0.2%
Total 2,092 100%
(Previous page) Source: State Dept. of Educ., 2012-2013 CEDaR Data Tables Staff Count, http://sdeportal.ct.gov.Source: Conn. State Dept. of Educ., 2011-2012 Teacher Preparation Program Data, obtained by direct request, www.sde.ct.gov.

educator Quality36
QUALITY
41%Overall percent of minority students
8%Overall percent of minority general
education teachers
minority Teachers, 2012-2013
Note: Minority includes Asian, Black/African American, Hispanic/Latino, and Native American general education teachers. Public charter schools are each classified as one unique school district according to the Connecticut State Department of Education. Figures represent a total count of staff, not a Full-Time Equivalent (FTE) count. Source: State Dept. of Educ., 2012-2013 CEDaR Data Tables Staff Count, http://sdeportal.ct.gov.
districts with the highest percent of minority general education teachers:
Jumoke Academy 58.1% Bridgeport 24.9%
New Beginnings Family Academy
29.6% The Bridge Academy 23.5%
Achievement First Bridgeport Academy
26.5% Hartford 22.8%
Bloomfield 26.5% New London 21.8%
Achievement First Hartford Academy
25.0% New Haven 21.3%

CONNCAN FIELD GUIDE TO EDUCATION IN CONNECTICUT
minority school & District administrators, 2012-2013
12%Overall percent of minority school
and district administrators
Note: Minority includes Asian, Black/African American, Hispanic/Latino, and Native American administrators, coordinators, and department chairs. Public charter schools are each classified as one unique school district according to the Connecticut State Department of Education. Figures represent a total count of staff, not a Full-Time Equivalent (FTE) count. Source: State Dept. of Educ., 2012-2013 CEDaR Data Tables Staff Count, http://sdeportal.ct.gov.
64% of districts have ZERO minority administrators
educator Quality 37
districts with the highest percent of minority administrators:
Jumoke Academy 100.0% Bridgeport 46.1%
New Haven 56.1% Bloomfield 41.2%
Park City Prep Charter School
50.0% New London 36.8%
New Beginnings Family Academy
50.0%Achievement First Hartford Academy
33.3%
Highville Charter School
50.0%Integrated Day Charter
School33.3%
Hartford 49.6% Norwalk 30.0%

educator Quality38
QUALITY
Note: This average assumes no salary step freezes. A step freeze refers to an agreement between the district and the union to hold teacher salaries for a given school year or years. For more information, visit www.teachercontracts.conncan.org. Source: ConnCAN, Teacher & Administrator Contract Database, www.contracts.conncan.org.
Compensation:
• Salaries vary greatly across districts for teachers with similar degrees and experience levels. For example, the highest-possible salary for teachers with a master’s degree varies by more than $36,000 per year depending on the district.
• Connecticut teachers with a bachelor’s degree make an average starting salary of $44,149.
• On average, the highest salary for teachers is $89,757.
• it takes an average of 14 years to reach the highest salary step.
Job Performance:
• Less than 5% of school districts offer compensation based on a teacher’s job performance.
• Seniority, not job effectiveness, remains the determining factor in 87% of teacher layoff provisions.
Work Conditions:
• Teachers must contractually work an average of 186 days per work year and 7 hours 14 minutes per workday.
• The average class size is between 26 and 28 students, depending on the school level.
• Nearly half (46%) of districts tie a teacher’s annual pay increases to job performance. in these districts, teachers may have their salary step increases withheld from one year to the next based on unsatisfactory performance.
Key Facts from Teacher Contracts, 2014-2015
SCHOOLFINANCE
field guide 2015

Note: NAEP scores included are math and reading for 4th and 8th grade.Source: Conn. State Dept. of Educ., 2007-2013 Bureau of Grants Management, CT Public School Expenditures Report, www.sde.ct.gov; Conn. State Dept. of Educ., 2007-2013 CEDaR Enrollment Data, http://sdeportal.ct.gov; 2009, 2011, 2013 Nat’l Assessment of Educ. Progress (NAEP), CT State Profile, http://nces.ed.gov/nationsreportcard/states.
Perc
ent C
hang
e fr
om 2
007
Per-Pupil Spending, Enrollment, and NAEP Scores
Per-Pupil Spending NaeP Scoresenrollment
historical spending per student, 2007-2013
Increased spending does not necessarily result in better outcomes. despite declining enrollment and increases to education spending over time, Connecticut student achievement gaps consistently remain among the worst in the nation.
40 School Finance40
-5%
0%
5%
10%
15%
20%
25%
2007 2008 2009 2010 2011 2012 2013
-5%
0%
5%
10%
15%
20%
25%
2007 2008 2009 2010 2011 2012 2013
5.5%
-0.7% -3.2% -4.3% -4.2%
10.5%
14.4%
17.9%19.1%
22.2%
5.5%
1.3%1.2%1.6%
10.5%
14.4%
17.9%
19.1%
22.2%
-2.0% -2.0%

CONNCAN FIELD GUIDE TO EDUCATION IN CONNECTICUT
Note: For more information, visit www.conncan.org/schoolfinance.Source: Conn. State Dept. of Educ., The Condition of Education in Connecticut: 2013-2014, www.sde.ct.gov; Conn. State Dept. of Educ., Bureau of Grants Management Grant Calculations, Reports and Analyses, www.sde.ct.gov; Conn. State Dept. of Educ., 2015 Bureau of Grants Management Education Cost Sharing Entitlements, www.sde.ct.gov; Conn. Gen. Assembly, 2012 Office of Legislative Research Education Cost Sharing Formula, http://www.cga.ct.gov/ed; Conn. Gen. Assembly: 2013 Task Force to Study Education Funding Final Report, www.cga.ct.gov; Conn. Gen. Stat. § 10-65 (2015), Conn. Gen. Stat. § 10-66ee (2015), http://www.cga.ct.gov/current/pub/titles.htm.
School Finance 41
• in 2013-2014, Connecticut spent $8.4 billion on elementary and secondary education.
• The average expenditure per pupil was $15,196 in 2013-2014.
• Public school expenditures vary greatly from district to district. For example, in 2013-2014, Bridgeport spent $13,883 per student, whereas Hartford spent $18,734. differing amounts of funding coming into the district, to some extent, determine towns’ ability to spend on public education.
• Most statewide education revenue comes from local sources. in 2012-2013, the majority (52%) of statewide education revenue came from local sources (i.e. taxes), while about 43% came from the state and 5% from the federal government.
• Connecticut uses 11 different ways to distribute per-pupil funding for public education.
The education Cost Sharing (eCS) formula was originally designed to account for enrollment and town wealth to drive more funding to towns with greater student learning needs and less ability to raise local revenue. after years of flat funding and stop-loss provisions, the state is no longer using this formula.
• The eCS grant accounts for approximately 60% of state funding.
• The formula has been changed several times since it was created more than 25 years ago. These changes have caused significant inequities in school funding across the state.
• Students participating in public school choice programs aren’t funded equitably or consistently because some programs (e.g. state charters and technical high schools) are left out of the eCS formula and because all students are funded differently depending on the school they attend.
school Funding

42
earLyCHiLdHOOd
EDUCATIONfield guide
2015

CONNCAN FIELD GUIDE TO EDUCATION IN CONNECTICUT
Without Early Childhood Education:• Children from low-income families are less likely to be read to
regularly, exposed to rich vocabulary, or taken to libraries and museums as compared to their middle class and more affluent peers.
• By age 3, children from low-income families have heard 30 million fewer words than children from high-income families.
• achievement gaps by race and ethnicity exist as early as kindergarten. Up to 50% of the Black/african american and White achievement gap at high school completion already exists before children start first grade and gaps by socioeconomic status are similarly large.
Long-Term Benefits:• Studies show that students who attend preschool have higher iQ
scores at age 5, higher educational achievement at age 14, and are more likely to graduate from high school than children who did not attend preschool.
• Children who attend preschool have higher earnings and are less likely to be on welfare or engaged in criminal activity as adults.
• Other benefits of early childhood education include reduced teen pregnancy and tobacco use.
Source: Economic Policy Institute, Inequality at the Starting Gate, Nov. 2002, www.epi.org/publications; Brookes Publishing, Meaningful Differences in the Everyday Experiences of Young Children, 1995, http://www.brookespublishing.com; Brook-ings, The Black-White Test Score Gap, Aug. 1998, http://www.brookings.edu; Society for Research in Child Development, Investing in Our Future: The Evidence Base on Preschool Education, Oct. 2013, www.srcd.org; HighScope, Lifetime Effects: The HighScope Perry Preschool Study Through Age 40, 2005, www.highscope.org.
Early Childhood Education matters
early Childhood education 43

Early Childhood Education in Connecticut, 2012-2013
83.1% of Connecticut kindergarteners have
Pre-K experience.
But only 39.3% of all kindergarteners consistently
demonstrate literacy skills on the Kindergarten entrance assessment.
83.1% 39.3%
Supporting early learning makes economic sense:
• investments in early childhood programs yield significant long-term benefits. research shows a potential 7-10% annual return on initial public investments in preschool programs.
• Savings range between $2.62 to more than $10 per every dollar spent on preschool programs.
• every dollar spent on childcare in Connecticut yields $2 in increased economic activity for the state.
Currently there is no integrated system that measures and reports on the quality of Connecticut preschools.
Source: Conn. State Dept. of Educ., 2012-2013 Percent of Kindergarten Students with PreK Experience, obtained by direct request, www.sde.ct.gov; Conn. State Dept. of Educ., 2012-2013 Kindergarten Inventory by District All Skills, obtained by direct request, www.sde.ct.gov; Heckman, Invest in Early Childhood Development: Reduce Deficits, Strengthen the Economy, Dec. 2012, http://heckmanequation.org; Reynolds, Arthur and Judy Temple, Cost-Effective Early Childhood Development Programs from Preschool to Third Grade, April 2008, www.annualreviews.org; RAND, The Economics of Investing in Universal Preschool in California, 2005, http://www.rand.org; Zhilin Liu, Rosaria Ribeiro and Mildred Warner, Child Care Multipliers: Analysis from Fifty States, Linking Economic Development and Child Care, Cornell University, 2004, www.cornell.edu.
early Childhood education44

SChOOL turnarounds
FIELD GUIDE 2015

Commissioner’s Network
Note: Commissioner’s Network schools are identified and funded by the state. School Improvement Grant (SIG) schools are identified by the state to receive federal funding and are not included in the count of Commissioner’s Network schools above. For more information, visit www.conncan.org/turnarounds. Source: Conn. State Dept. of Educ., Turnaround Office: The Commissioner’s Network System of Supports, July 2014, www.sde.ct.gov.
School Turnarounds46
in 2012, the Connecticut General assembly created the Commissioner’s Network, a program designed to provide interventions and additional funding to improve the state’s lowest-performing schools.
• The Network allows the Commissioner of education to select and intervene in up to 25 of the state’s lowest-performing schools.
• Schools in the Network apply to the State Board of education to participate (in partnership with their district) and receive additional financial resources and school-level autonomy in exchange for increased accountability to the state. Schools in the Network remain part of their local district.
• Schools stay in the Network for 3 years and can remain for up to 5 years, in accordance with their approved turnaround plan, and then transition back to the local district’s full control.
• So far, a total of $35 million in state funding has been appropriated to the Network. annual grants ranged from approximately $420,000 to $1.2 million per school for the 2014-2015 school year.
Today, the Network serves more than 9,000 students in 16 schools across 9 districts.

47
The Connecticut Coalition for achievement Now (ConnCaN) believes that all of Connecticut’s children deserve a high-quality education and works to change state and local policy to make that vision a reality. We conduct research and work with communities to inform and advocate for policies that will lead to excellent schools for all students. We are committed to promoting student-focused policies that ensure all students have equal opportunity and access to an excellent education.
Who are We?
www.conncan.org/fieldguide

48
www.conncan.org · (203) 772-4017 · 85 Willow St. New Haven CT 06511
www.conncan.org


![AGREEMENT - ConnCAN · certified professional emp]oyees of the Board, employed in positions requiring a teaching or special services certificate or durational shortage area permit,](https://img.pdfslide.net/doc/110x75/5f59404ba822df13b7440ef9/agreement-conncan-certified-professional-empoyees-of-the-board-employed-in-positions.jpg)