Embed Size (px)
Citation preview


Field Indicator MethodExample of EA-Approved Alternative for Measuring
Physical Contaminants
18 TH TECHNICAL TRAINING SERIES
MONTEREY HYAT T
MONTEREY, CALIFORNIA
DECEMBER 5, 2018
KEN DECIO
DEPARTMENT OF RESOURCES RECYCLING AND RECOVERY (CALRECYCLE)

Background

Land Application or Illegal Disposal?

Physical Contaminants

Physical Contamination Limits in Compostable Material• Total physical contaminants: No more than 0.5% by dry weight
greater than 4 mm
• Film plastic: No more than 20% of 0.5% (0.1%) by dry weight greater than 4 mm
• Regulation became effective on January 1, 2018

Physical Contaminants: Compost Operations and Facilities
Compost•Operators sample at least once every 5000 cubic yards
•Operators determine the percentage of physical contaminants using a method that provides accurate results and has been approved by the EA
•Operators record the test results generated

Physical Contaminants: Chipping and Grinding Operations and Facilities
Chipped and Ground Material to be Land Applied•Operators sample at least once every 5000 cubic yards
•Operators determine the percentage of physical contaminants using a method that provides accurate results and has been approved by the EA
•Operators record the test results generated

What Are Physical Contaminants? Physical Contaminants: Human-made inert material contained within compostable material, digestate, or compost, including, but not limited to glass, metal, and plastic
Film Plastic: Sheet plastic

Sampling
Why Do We Need To Learn About Sampling?Operator is required to determine % of physical contaminants using an accurate methodology
To obtain accurate results, random & representative samples are needed
So now let’s learn sampling 101…
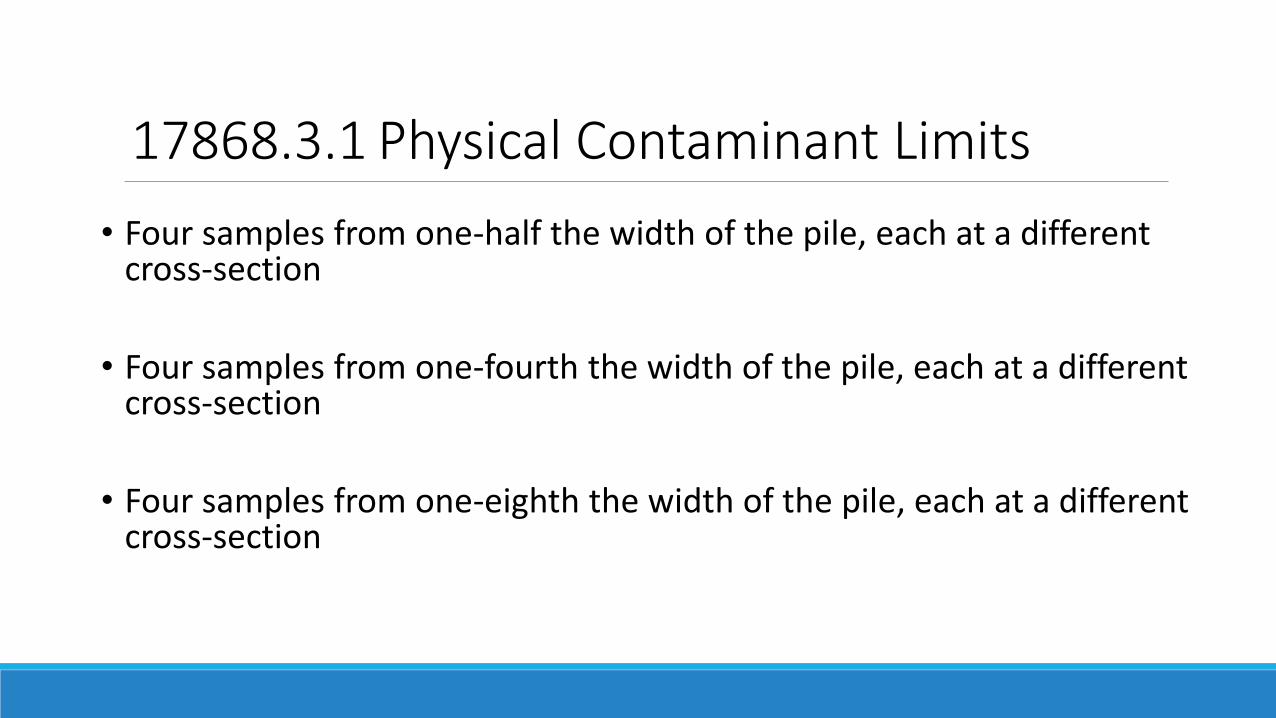
• Four samples from one-half the width of the pile, each at a different cross-section
• Four samples from one-fourth the width of the pile, each at a different cross-section
• Four samples from one-eighth the width of the pile, each at a different cross-section
17868.3.1 Physical Contaminant Limits

Windrow Sampling

Alternative Sampling MethodPost-screened pile
Screening and pouring process will mix cross sections and widths
Sample 8-12” beneath surface
Samples collected around entire pile at various heights

At least 8” into pile
Random & Representative?

Sampling Video

Summary (Fine Materials)
Composite Sample
Determine Physical Contamination Level
Regulation Language Suggested Alternative
17862.1 Chipping and GrindingOperations and Facilities
Operators determine the percentage of physical contaminants using a method that provides accurate results and has been approved by the EA

Summary (Coarse Materials)
Composite Sample
Determine Physical Contamination Level
Approved Sampling Method
Field Indicator Method

Measuring Physical Contaminants in
Compostable Material

Other Methods We ExploredField screen method – counting wire interceptions, identifying contaminants, and calculating correlation between “counts” and weights of each contaminant type

Test Development: Other Methods We ExploredScreen coarse material on ½” or ¼” screen to separate “fine” and “coarse” particles
◦ Pull contaminants out of both “fine” and “coarse” particles
Due to nature of material, contaminants are contained within clumps of material and won’t screen out

Field Indicator Method
FOR COARSE MATERIALS SUCH AS CHIPPED AND GROUND MATERIAL AND COMPOST OVERS
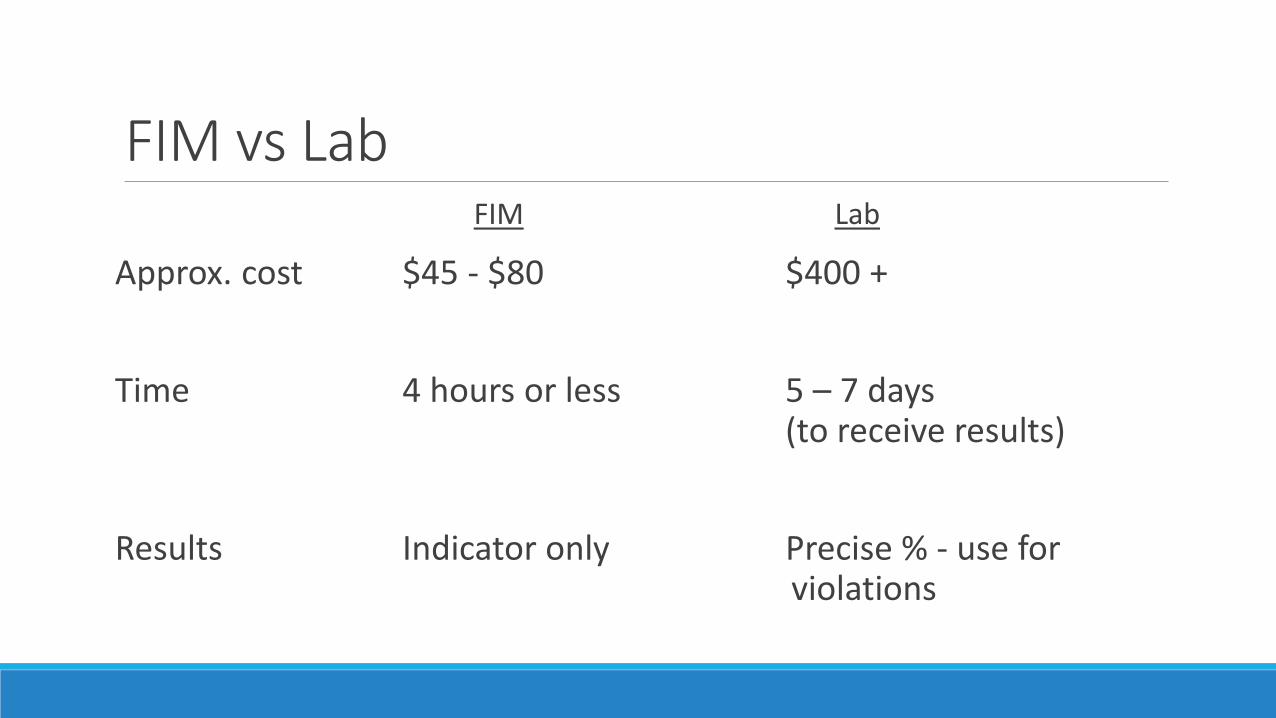
FIM vs LabFIM Lab
Approx. cost $45 - $80 $400 +
Time 4 hours or less 5 – 7 days (to receive results)
Results Indicator only Precise % - use for violations

Getting Started - Supplies Needed◦ Bins and/or buckets to collect material
◦ Shovel
◦ PPE (gloves, dust masks, & safety glasses)
◦ Folding table
◦ Tarps
◦ Kitchen scale (or similar)
◦ Large scale (for weight of all material)
◦ Gallon size bag for weighing contaminants

Composite Sample of 60 Gallons12 samples from at least 8” into pile from various locations around pile and at different heights
Each sample should be 5 gallons

Weigh Material (Entire 60 Gallons)Scale on-site or bathroom scale


Moisture ContentAssume 50% moisture content
Operator should prove moisture content to LEA otherwise◦ Dry a small sample (1 gallon overnight), compare weights before and after
Take into account seasonal differences
Moisture ContentExample:
60 gallons = 60 pounds (wet weight)
Multiply by 0.5 (50% moisture)
60 gallons = 30 pounds (dry weight)
60 pounds x 0.5 = 30 pounds

Dry Weight – Now You Determine!
Wet weight – 80 pounds◦ Assume 50% moisture
Wet weight – 80 pounds◦ Assume 30% moisture
Wet weight – 90 pounds◦ Assume 30% moisture
(Sample weight) X (1 - percent moisture) = dry weight

Pick Out Physical ContaminantsContaminants larger than 4mm (easily visible)
Focus on glass, metal, plastic, film plastic

Pick Out Physical ContaminantsEasier to sort through half the material at a time (30 gallons)
Material should be near eye-level◦ Table
◦ Sit on ground
Learning Curve


Weigh Physical Contaminants o Weigh total contaminants
o Sort out film plastics
o Weigh film plastics

Calculate Percentage of Physical ContaminantsTotal contaminants
(Total contaminant weight/dry weight of material) x 100% = % of total contamination
9.0 oz. / 480 oz. (30 lbs. in oz.) x 100% =1.88%
Film plastic
(Film plastic weight/dry weight of material) x 100% = % of film plastic
1.0 oz. / 480 oz. (30 lbs. in oz.) x 100% = .21%
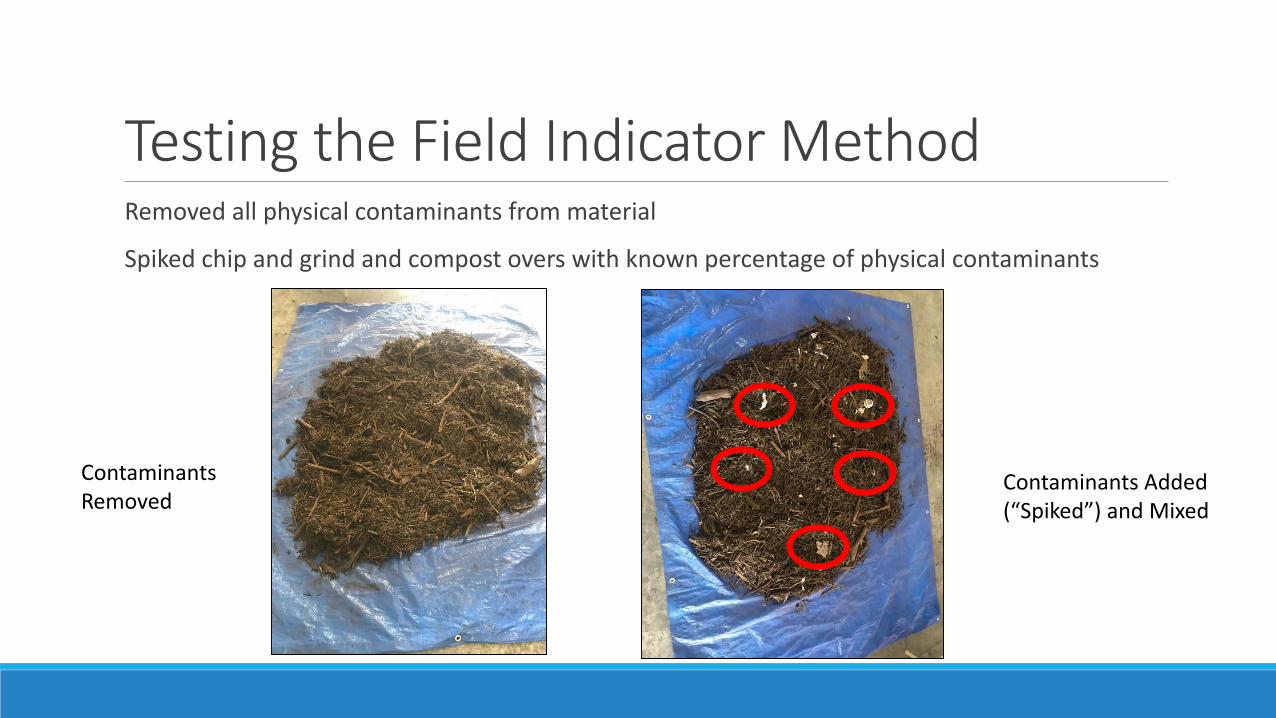
Testing the Field Indicator MethodRemoved all physical contaminants from material
Spiked chip and grind and compost overs with known percentage of physical contaminants
Contaminants Removed
Contaminants Added (“Spiked”) and Mixed

Examples of Physical Contaminants RemovedFilm Plastic Other Contaminants

Our Results 40 minutes for four people to pick out contaminants in chip and grind ◦ Pulled out exact spiked percentage
33 minutes for four people to pick out contaminants in compost overs◦ Pulled out exact spiked percentage

Our Conclusions Diminishing returns – processing material multiple times did not make much difference in final contaminants percentage
Learning curve for pulling out contaminants – easy to spot, and shorter time frame after only a couple of times
Sorting material near eye level very important for accuracy
Need adequate lighting to easily spot materials

Interpreting Results: Green
Total contaminants: (0% - 0.5%)
Film plastic: (0% - 0.1%)
Reasonably certain material meets physical contamination standards

Interpreting Results: Yellow Total Contaminants: (> 0.5%)
Film Plastic: (> 0.1%)
Possible steps:
o Sort through contaminants and remove anything that’s not glass, metal, plastic, or film plastic
o Remove organic material from contaminants
o Re-screen
o Take another 60 gallon sample and average

Interpreting Results: Yellow
If results are still in yellow:
o Now you are in red
o Send sample to the lab or follow red steps

Interpreting Results: Red
Reasonably certain it does not meet physical contaminant standards
o Re-processo Re-screeno Disposal

Potential Site-Specific EA-Approved AlternativesUse the field indicator method to establish a baseline
If facility shows consistent results, EA may consider approving:
o Less frequent contaminant testing (> than every 5,000 cubic yards)
o No separation and weighing of film plastic (if operator can consistently show material does not exceed 0.1% limit)
o Use dry weight calculations seasonally (instead of each sampling)

Questions