Embed Size (px)
Citation preview

FIELD MEASUREMENT OF AQUIFER-SYSTEM COMPACTION, SAN JOAQUIN VALLEY, CALIFORNIA, USA’
Ben E. LOFGREN U.S. Geological Survey, Sacramento, California
ABSTRACT Two types of field measurements have been successfully used to monitor aquifer-
system compaction, and accompanying land subsidence in California: (1) periodic releveling of a network of surface bench marks, referenced to distant stable bedrock, and (2) continu- ous recording of vertical shortening of the water-bearing deposits, using extensometers installed in cased wells at selected locations.
The compacting deposits of the aquifer system are readily compressible and sensitive to change in overburden stress. Imposed hydraulic stresses, caused by the extracting of fluids, results in immediate strain in the aquifer system. Both elastic compression and inelastic rearrangement of the intergranular structure are caused by a stress increase; however, the elastic expansion during a stress decrease is small compared to ultimate plastic compaction for a comparable stress increase. The subsidence/stress-change ratio ranges from 0.5 to 10 x 10-2 feet of subsidence per foot of hydraulic stress change during the first prolonged cycle of water-level decline.
RESUME Deux types de mesure sur place ont été utilisés avec succès pour contrôler Ia compac-
tion des nappes aquifères accompagnant les affaissements de terrain en Californie : (1) renivellement périodique d’un réseau de bornes-repères, par rapport à un lit de rochers éloigné et stable, et (2) enregistrement constant de ia diminution verticale des alluvions détenteurs d’eau, en utilisant des extensomètres installés dans les trous de forages tubés, à des endroits déterminés.
Les alluvions compressibles des nappes aquifères sont facilement sensibles à tout changement de pression. Les pressions hydrauliques imposées, résultant de l’extraction des fluides, provoquent une tension immédiate dans lcs nappes aquifères. La compression élastique et la reconstitution non-élastique de la structure granulaire des couches sont causées par une augmentation de pression ; cependant, l’expansion élastique, lors d’une diminution de pression, est faible si on ia compare à ia compaction plastique définitive pour une augmentation équivalente de pression. La proportion affaissementlchangement de pression varie de 0,5 à 10 X 10-2 pieds d’affaissement par mètre de changement de niveau de pression hydraulique pendant le premier cycle prolongé de diminution du niveau d’eau.
INTRODUCTION
Land subsidence affects 3,500 square miles of productive farm land in the San Joaquin Valley, California, as the intensive pumping of ground water continues. Locally, 28 feet of subsidence has occurred, and subsidence rates have exceeded 1.2 feet per year. Nowhere has man produced more extensive subsidence of this magnitude.
Subsidence was first recognized in the valley in 1935, when surveys discovered differen- tial settlements in areas of intensive pumping. With the accelerated use of ground water for agriculture, particularly since World War II, subsidence has continued to the present. Today one-third of the entire valley is subsiding, and damage costs and remedial expendi- tures represent many millions of dollars. Damage caused by subsidence has been restricted principally to significant changes in gradients of canals, aqueducts and drainage systems, and the breakage of thousands of deep water-well casings.
The San Joaquin Valley, the southern half of the Great Valley of California (fig. 1) is bounded on the east by the lofty Sierra Nevada, on the west by the Coast Ranges, on the
1. Publication authorized by the Director, U.S. Geological Survey.
272

Field measurement of aquifer-system compaction, San Joaquin Valley, California, USA
south by the Tehachapi Mountains, and on the north it opens into the Sacramento Valley. The valley is a northwest-trending structural trough that has accumulated thick sedimen- tary sequences from the surrounding mountains. Although basement rocks underlie the valley floor at great depth, the effects of ground-water pumping are limited to the upper few thousand feet of unconsolidated alluvial, lacustrine, and marine deposits.
AREA AND NATURE OF SUBSIDENCE
Within the San Joaquin Valley (fig. i), subsidence is concentrated in the southern part and west side of the valley where annual rainfall is sparse and ground-water recharge is minimal.
FIGURE 1. Physiographic map of California showing principal areas of subsidence due to ground- water decline (solid black areas)
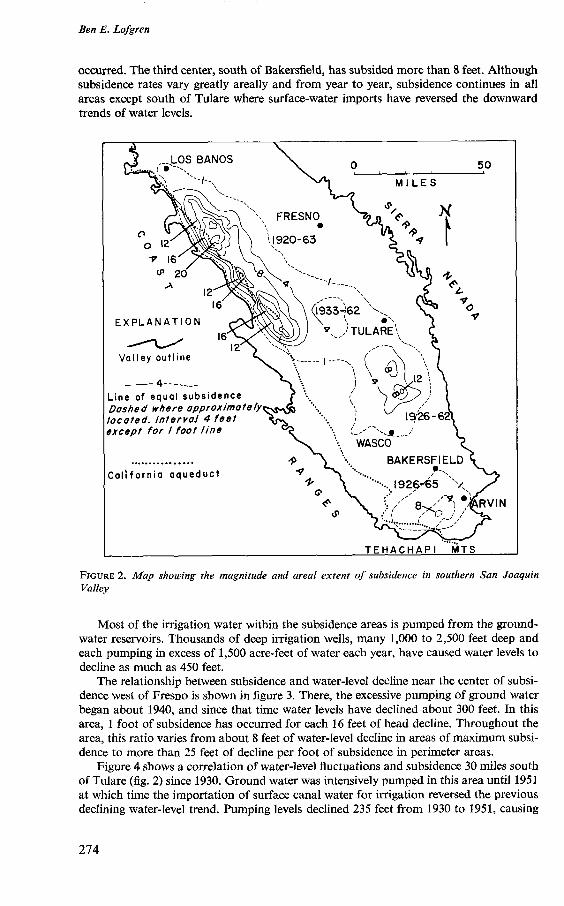
Figure 2 shows the magnitude and areal extent of subsidence during extended periods of available record. ïhe subsidence has been greatest in three areas. Maximum subsidence is an elongate trough close to the mountains west of Fresno, where more than 20 feet of subsidence cccurred between 1920 and 1963 and total subsidence to 1969 is about 28 feet. A second center is 30 miles south of Tulare, where more than 12 feet of subsidence has
273
Ben E. Lofgren
occurred. The third center, south of Bakersfield, has subsided more than 8 feet. Although subsidence rates vary greatly areally and from year to year, subsidence continues in all areas except south of Tulare where surface-water imports have reversed the downward trends of water levels.
FIGURE 2. M a p showing the magnitude und aren1 extent of subsidence in southern San Jouquin Valley
Most of the irrigation water within the subsidence areas is pumped from the ground- water reservoirs. Thousands of deep irrigation wells, many 1,000 to 2,500 feet deep and each pumping in excess of 1,500 acre-feet of water each year, have caused water levels to decline as much as 450 feet.
The relationship between subsidence and water-level decline near the center of subsi- dence west of Fresno is shown in figure 3. There, the excessive pumping of ground water began about 1940, and since that time water levels have declined about 300 feet. In this area, 1 foot of subsidence has occurred for each 16 feet of head decline. Throughout the area, this ratio varies from about 8 feet of water-level decline in areas of maximum subsi- dence to more than 25 feet of decline per foot of subsidence in perimeter areas.
Figure 4 shows a correlation of water-level fluctuations and subsidence 30 miles south of Tulare (fig. 2) since 1930. Ground water was intensively pumped in this area until 1951 at which time the importation of surface canal water for irrigation reversed the previous declining water-level trend. Pumping levels declined 235 feet from 1930 to 1951, causing
274

Field measurement of aquifer-system compaction, San Joaquin Valley, California, USA
nearly 9 feet of subsidence, for an overall rate of 1 foot of subsidence for 26 feet of water- level decline. Since 1951, water levels have risen to their pre-1930 levels, and land subsi- dence has virtually stopped. This is one of the few localities where water levels have recovered appreciably.
200 ,280
pumping levels, from 2ocitic Gar ond Electric Co
FIGURE 3. Correlation between subsidence and change in artesian head near center of subsidence west of Fresno
240 - I- w - ? 280- z -
320- w - e
360- o t t .,.,.I
FIGURE 4. Correlation of water-level juctuations and subsidence near center of subsidence south of Tulare
THEORY
Subsidence is attributed to the compaction of the compressible deposits of the aquiter system as intergranular stresses are increased by water-level changes. Effective stresses are changed in two principal ways (Lofgren, 1968): (I) Water-table fluctuations change the buoyant support of grains in the zone of the change, and (2) a change of the water table or of the piezometric head, or both, may induce hydraulic gradients and seepage stresses in the deposits. These stress changes are additive in their effect, and together cause compaction. In most of the subsidence areas, the changes in effective stress are roughly equal to changes in head in the principal aquifers of the confined aquifer system.
Compaction results from the slow escape of pore water from the stressed deposits, accompanied by a gradual transfer of stress from the pore water to the granular structure
275

Ben E. Lofgren
of the deposits. Effective stress increases and compaction occurs in a water-bearing bed only as rapidly as water can move out. A slowly draining aquitard may take weeks or years to adjust to an applied stress increase, whereas a coarse-grained aquifer will adjust quickly. In either case, one-dimensional consolidation results, which is directly related to the change in effective grain-to-grain stress.
Depending on the nature of the deposits, compaction may be (1) largely elastic, in which case stress and strain are proportional, independent of time, and reversible, or (2) principally nonelastic, resulting from a rearrangement of the granular structure in such a way that the volume of the deposits is permanently decreased. In general, if the deposits are coarse sand and gravel, the compaction will be small and chiefly elastic and reversible, whereas if they contain fine-grained clayey beds, the compaction will be much greater and chiefly inelastic and permanent. In either case, a one-directional compression of the deposits occurs which results in a subsidence of the land surface.
FIELD MEASUREMENTS
Two types of field measurements were initiated early in the subsidence study to monitor the effects of continuing changes in ground-water levels: (1) Periodic releveling of a net- work of surface bench marks, and (2) continuous record of compaction as obtained from specially designed compaction recorders. In addition, continuous water-level recorders were installed in selected observation wells to determine changes in applied stress causing subsidence. These field measurements are the most direct approach to obtaining the “stress-strain’’ parameters for subsidence occurring in the San Joaquin Valley.
RELEVELING* OF SURFACE BENCH MARKS
Figure 5 shows the network of level lines laid out to traverse the subsidence areas of the San Joaquin Valley. Surface bench marks at about 1-mile spacing along these lines have been releveled at 2- to 6-year intervals by the Coast and Geodetic Survey, US Department of Commerce.
Bench marks within the subsidence areas are considered floating, and are necessarily referenced to distant unchanging bench marks. Primary circuits in the San Joaquin Valley are tied to stable bench marks set in bedrock around the perimeter of the valley (fig. 5). Insofar as possible, leveling has been done during the winter months of least subsidence.
From the comparative elevations of bench marks, the rate of subsidence of the various bench marks (figs. 3 and 4) and the areal extent and magnitude of subsidence between successive periods of leveling (fig. 2) are obtained. Also, profiles of subsidence along selected lines across the subsidence area (fig. 6) are an effective means of illustrating the magnitude and distribution of subsidence.
COMPACTION RECORDERS
Subsidence is caused by the compaction of the water-tearing deposits at depth, and continuous measurements of the magnitude and rate of subsidence at a location can be obtained by a specially designed bore-hole extensometer (fig. 7). About 30 of these record- ers are now operating in the San Joaquin Valley. The equipment is simple in design and yet has proved highly successful and accurate in measuring the vertical shortening of the aquifer system (Lofgren, 1961).
The compaction recorder consists of a heavy anchor weight emplaced in the formation below the bottom of a well casing, with an attached cable stretched upward in the casing, and counterweighted at the land surface to maintain constant tension. A modified hydro-
276

Field measurement of aquifer-system compaction, San Jouquin Valley, California, USA
graphic recorder mounted over the open casing measures directly the amount of cable that appears above the casing as subsidence occurs. At the land surface, it appears as if the bottom-hole weight is rising; actually, the land surface is settling with respect to the bottom weight.
FIGURE 5. Subsidence areas und level net in southern Sun Joaquin Valley
The success of this recorder depends largely on the durability and stretch character- istics of the down-hole cable and on minimizing down-hole friction between the cable and the well casing. The cable must remain at constant length during the period of record. If the cable changes in length, due to temperature changes, fatigue elongation, or un- twisting, this change is indistinguishable from the record of compaction. After considerable experimentation, a 1/8-inch, stainless steel, 1 x 19 stranded, reverse-lay cable was selected which meets the rigorous demands of the installation very well. Compaction recorders have been installed in unused irrigation wells, and also in specially drilled wells to depths as great as 2,200 feet.
In order to minimize frictional drag of the surface sheaves, a “teeter-bar’’ on a knife- edge fulcrum (fig. 8) has been designed. Changes as small as a few ten thousandths of a foot in thickness of the aquifer system can be detected with this equipment during both the compaction and expansion phases of the annual loading cycle.
277

Ben E. Lofgren
, 1-
, U'
2 u
'3: a212
EU
C 'W
I." "O"2
8 *=
r "'
278

Field measurement of aquifer-system compaction, San Joaquin Valley, California, USA
Recorder
Metal table on concrete platform
Sheaves
Cable clamp
c Stainless steel cable 1/8 inch, stranded
J
FIGURE 7. Diagram of compaction-recorder installation
COMPRESSIBILITIES OF DEPOSITS
Figure 9 shows the depth relationship of four compaction recorders installed at different depths in four wells near Pixley, at the center of the subsidence area south of Tulare. Each recorder measures the vertical shortening between the land surface and the subsurface anchor. By comparing the records of the four recorders, the magnitude and rate of compac- tion in each of four depth zones can be computed. Also, by knowing the total subsidence of the land surface, the amount of compaction occurring below the deepest anchor can be determined. The annual specific unit compaction rate in these deposits varied from 0.7 to 2.5 x foot of compaction per foot of thickness per foot of water-level decline from 1960 to 1964 (Lofgren and Klausing, 1969).
As shown in figure 10, the deposits to a depth of 760 feet at the Pixley site south of Tulare (fig. 9) are intimately reponsive to water-level changes. The upper graph shows the water-level fluctuations in the 430-foot observation well tapping the confined aquifer system. The center graph is a 1:l record of measured compaction to a depth of 760 feet, and the lower graph is a 24:l amplification of this same compaction record. Of particular interest are the excellent correlation between compaction and water-level changes, and, also, the magnitudes of compaction and expansion that accompany changes in water
279

Ben E. Lofgren
FIGURE 8. Compaction-recorder assembly
UNIT COMPACTION, IN FT/FT/YR.
O O
Semiconlined opuitw iystem
¶O0
c W W U
5 400 I c W o a
600
ao0
A. Relation of multiple recorders io the B. Measured compaction rate in four depth zones for hydrologic units 5 years of record
FIGURE 9. Annual rate of compaction of deposits in four depth zones in center of subsidence south of Tulare, 1960-1964
280

Field measurement of aquifer-system compaction, San Joaquin Valley, California, USA
01 FOOT
&:;[ I C
I
' I I Y 220
4 WATER-LEVEL FLUCTUATIONS-WELL 23/25-16N3
1 I ~ ! I I 1
o t;e L I
:.I a I o
1963
C. COMPACTION RECORD-24:I VERTICAL AMPLIFICATION
FIGURE 10. Observed compaction and expansion south of Tulare
levei. During February, for example, a water-level rise of 11 feet resulted in a measured expansion of about 8 x foot per foot of water-levei rise. From March 9 to March 21, a water-level decline of roughly 50 feet produced an abrupt compaction of 0.034 foot or 0.68x10⁻³ foot of compaction per foot of water-levei decline. The delicate sensitivity of the aquifer system to changes in effective stress is readily apparent. Compaction frequently begins within minutes after pumping effects are observed in the observation well. Less than 5 percent of the compaction is elastic in nature, and results in rebound when stresses are decreased. Most of the compaction is nonelastic, representing a permanent decrease in the volume of the stressed deposits.
Figure 1 1 shows the interrelationship between compaction, water-levei fluctuations in the semiconfined (hydrograph, 16N4) and confined (hydrograph, 16N3) aquifer systems, and changes in applied stress at this same recorder site near Pixley for 9 years of record. During this period, measured compaction to a depth of 760 feet was 75 percent of the total subsidence. Thus, 25 percent of the vertical shortening was due to compaction below 760 feet.
Comparison of the compaction rate with fluctuations in water level in the semiconfined and confined aquifer systems indicates that compaction began each year during the period of rapid head decline in the aquifer system, continued through the pumping season, and ceased during the early stages of head recovery. Although the correlation between com- paction and artesian-head change in the confined aquifer system is good, the correlation with changes in effective stress in the confined aquifer system is closer. A special computer program has been written whereby the relationships of figure 1 i
are calculated and graphed by computer. Field data from the deep and shallow water-level and compaction recorders are supplied to the computer in digital form, and from these various stress-strain parameters are obtained.
foot or about 7.5 x
28 1

Ben E. Lofgren
FiGu= 11. center of subsidence south of Tulare
Correlation of water-level fluctuations, change in efective stress, and compaction at the
C O N C L U S I O N S
The extent and magnitude of subsidence in the San Joaquin Valley has been defined by repeated leveling over an extensive network of surface bench marks. Direct evidence that aquifer-system compaction is the cause of subsidence is obtained from compaction recorders, which give a continuous record of vertical compression and expansion of the water-producing strata. Compaction recorders that span the full compacting section furnish a continuous record of land subsidence, and serve at any time as bench marks of known elevation for control in running local surveys. Where several compaction recorders span different depth intervals at the same location, the compression characteristics of specific intervals are obtained. If changes of water level (stress changes) are also available, the stress-strain characteristics of the deposits, both the elastic and the plastic parameters, can often be derived (see Riley, 1969). Stress-strain relationship derived from compaction and water-level recorders are the most specific parameters for estimating future subsidence.
REFERENCES
LOFGREN, B. E. (1961): Measurement of compaction of aquifer systems in areas of land subsidence in Geological Survey Research 1961, U.S. Geol. Survey Prof. Paper 424-8, pp. B49-B52.
LOFGREN, B.E. (1968): Analysis of stresses causing land subsidence, in Geological Survey Research 1968, U.S. Geol. Survey Prof. Paper 600-B, pp. B219-B225.
LOFGREN, B. E. and KLAUSING, R. L. (1969): Land subsidence due to ground-water withdrawal, Tulare-Wasco area, California, U.S. Geol. Suruey Prof. Paper 437-B, 103 p.
RILEY, F. S. (1970): Analysis of borehole extensometer data from central California Inter- nat. Symposium on Land Subsidence, Tokyo, Japan, Proceedings.
282
Field measurement of aquifer-system compaction, San Joaquin Valley, California, USA
DISC USSION
Intervention of Prof. George V. CHILINGAR (U. S. A.) Question. In your excellent paper you have been continuously using the term “compaction”. Yet, many civil engineers violently object against using this term; they prefer the term “conso- lidation”. To them, “compaction” has a different meaning. Would you please comment on this ?
Answer of Mr. LOFGREN: W e use “compaction” as the decrease in thickness of sediments as a result of increase in vertical compressive stress. It is synonomous with “ one-dimensional consolidation” as used by engineers. The term “compaction” is applied both to the process and to the measured change in thickness.
Intervention of Mr. Dennis R. ALLEN (U. S. A.) Comment: Regarding the definition and use of the terms “compaction” and “consolidation”: the commonly used term in the oil business is “compaction”, meaning either or both proces- ses. The terms are sometimes confusing.
Intervention of Mr. Herbert H. SCHUSMANN (U. S. A.) Question: Have you observed surface fissures in the subsiding areas of California of the type associated with subsidence in the adjacent State of Arizona ? Answer of Mr. LOFGREN: One fissure has opened up in the San Joaquin Valley similar to the Arizona fissures. As of six months ago, no surface fissuring was recognized in our subsidence areas. During March 1969, a half-mile long earth fissure opened up in a flooded area. The fissure represents a small graben in which the surface dropped 6 to 10 feet. The dropped block is roughly 10 feet wide. This is a very interesting feature and we are studying the hydro- geologic environment in detail.
Intervention of Dr. Naomi MIYABE (Japan) Question: Is there any change or difference in responses due to periodic or cyclical changes in the groundwater level ?
Answer of Mr. LOFGREN: Very good. There will be a paper tomorrow that discusses this question in detail. Paper No. 45 by Mr. Riley will be presented by Mr. Poland, and should be of interest in answering this question.
W e find that the first time the water levei is drawn down, rapid subsidence occurs because the stresses are great. If the water level recovers and then is drawn down a second time, the second application of that same stress results in much less compaction or subsidence. For the third and fourth stress applications the compaction is further decreased, and eventually all of the compaction for that load change will have come out of the system. This process is demonstrated for nine years of record of cyclic loading at Pixley. During the first cycle of loading, the compaction is largely nonelastic, non- recoverable. O n the last cycle, as we will see on tomorrow’s slide, the compaction is mostly
283

Ben E. Lofgren
elastic. The delay for full compaction to occur is attributed to the slow drainage of the fine-grained deposits.
Intervention by Dr. Joseph F. ENSLIN (Republic of South Africa) Question: Is there a change in the specific yield of the ground-water reservoir caused by the subsidence ?
Answer of Mr. LOFGREN: Most of the compaction occurs in the fine-grained beds; very little occurs in coarse- grained aquifers. The amount of change in the overall system is quite small. The total storage characteristic of the system are not appreciably changed by subsidence.
Question of Dr. ENSLIN: What is the initial storage coefficient and how much is it altered?
Answer of Mr. LOFGREN: The coefficient of storage varies considerably throughout the valley. At Pixley, we have good confinement. W e bave a low value of coefficient of storage-in the general range of 0.003, as determined by short-term pumping tests. But during long periods of water-level decline, much of the water pumped comes from the permanent compaction of the beds. The long-term inelastic component may be 100 times the elastic coefficient. In other words, the water derived from the elastic response of the beds represents only 1 to 5 percent of the total water derived during a long-term drawdown cycle.
Question of Dr. ENSLIN: But it does seem your subsidence is a function of the depth of the water-bearing deposits. You said the specific yield varies from 1/8 to 1/28. That is larger than your storage coefficient.
Answer of Mr. LOFGREN: The thickness of the water-bearing section is an important element in the subsidence equation. T w o factors must be considered. One is the compressibility of the material; the other is the total thickness undergoing a stress change. A system twice as thick as another, but with the same compressibility value, would yield twice the water of compaction, and result in twice as much subsidence, for a given water-level change. These values vary considerably throughout the valley.
284