Embed Size (px)
Citation preview

FIELD MEASUREMENTS OF ELECTROKINETIC POTENTIAL DURING A PUMPING TEST
Sukhyoun Kim, Graham Heinson and John Joseph
CRC LEME, School of Earth and Environmental Sciences, University of Adelaide, SA 5005
INTRODUCTION The aim of this work is to develop a new and efficient geophysical method of investigating hydro geological properties without the requirement of having piezometers. Electrokinetic potentials (EP) are mainly generated by fluid flows and heat fluxes in the ground. Fluid flow through pores and fractures in the ground produce an electric field called electrokinetic potential. It can, therefore, be used as a tool to detect groundwater flow (Kim et al, 2005). This means that the electrokinetic potential method can be an alternative to conventional methods to determine permeability of fracture systems (Darnet et al. 2003). There are two main reasons for the electrokinetic potential method not being widely used. The first one is that extracting electrode drift and background noise from the signal is not easy. The second one is the difficulty of interpretation and quantification of the signals as a function of ground water flow. However, if these problems are effectively addressed, it will represent a definite alternative to conventional methods. EXPERIMENT The measurement of the electrokinetic potential during a pumping test was carried out in Balhannah, about 30 km east of Adelaide on the 27th of July 2006 (Figure 1). In March 2003, 12 wells were developed at this site. The maximum yield at one of these wells, P2 is 2.3 L/s. For the electrokinetic measurements, a multi electrode logging system with 36 non-polarized electrodes was deployed around well P1 in a circle with a radius of 15 m (Figure 2). The electrode No.1 was placed to the magnetic south direction of the pumping well and the other electrodes were placed at ten degree spacings in an anti-clock wise direction. Though we used 15 m radial distance to form the circle-shaped electrode array, different electrode configurations can be used. For example, the system can be utilised for different radii within 20 meters and also with two circled lines or six electrodes on a line of every 60 degrees spacing. The reference electrode was buried approximately 140 m east of the pumping well and was assumed to be unaffected by the pumping. To stabilize the electrodes, they were buried to a depth of 12 cm from the surface 60 minutes prior to the start of data logging. The data were collected with a sampling rate of 1 Hz and a resolution of 0.1mV. The pumping test was carried out at two different wells because of a shortage of water in the first pumping well P1 (Figure 2). Hydraulic pumps may have an advantage over normal electrically powered pumps in minimising electrical disturbances or noise. Hence we used a hydraulic motor-pump capable of pumping at a rate of 8 L/s, which was mounted on a truck. To compare the results with drawdown values, the drawdown was measured at four wells during pumping tests, and they are shown as O 04, O 06 (same well as P2), O 07 and O10 in Figure 3. After pumping started, the water level at P1 dropped down to 50 m from the surface in seven minutes as seen in Fig. 3. The same process was repeated after 33 minutes (Figure 4). The data shown in Figure 4 were filtered with a low pass filter for 12 seconds. The pump was then moved to the most productive well, which is shown as P2. The pumping started with an initial rate of 2 L/s, and then increased by 1 L/s every 30 minutes up to a rate of 5 L/s. The pumping was stopped after 117 minutes and signals corresponding to the drawdown are shown in Figure 5. The data were recorded from 60 minutes prior to pumping to 50minutes after the pumping.
Figure 1: The location of Balhannah.
Regolith 2006 - Consolidation and Dispersion of Ideas
196

Figure 2: Electrode and well locations at Balhannah. P1 and P2 were used as pumping wells and during pumping at P1, P2 was used as an observation well (O 06).
Figure 3: Drawdown in the observation wells during pumping at P1.
Regolith 2006 - Consolidation and Dispersion of Ideas
197

Figure 4: Electrokinetic potential as a function of time at Balhannah during pumping at P1.
Figure 5: Drawdown in the observation wells during pumping at P2. RESULTS AND DISSCUSSION General results of the field work are: 1. The pumping well P1 did not have enough water to run the pumping test for more than seven minutes at the rate of 2 L/s. The maximum drawdown of the observation wells was at O 06 and it was less than
a meter from the initial water table height. In general, the hydraulic conductivity is low at the
Regolith 2006 - Consolidation and Dispersion of Ideas
198
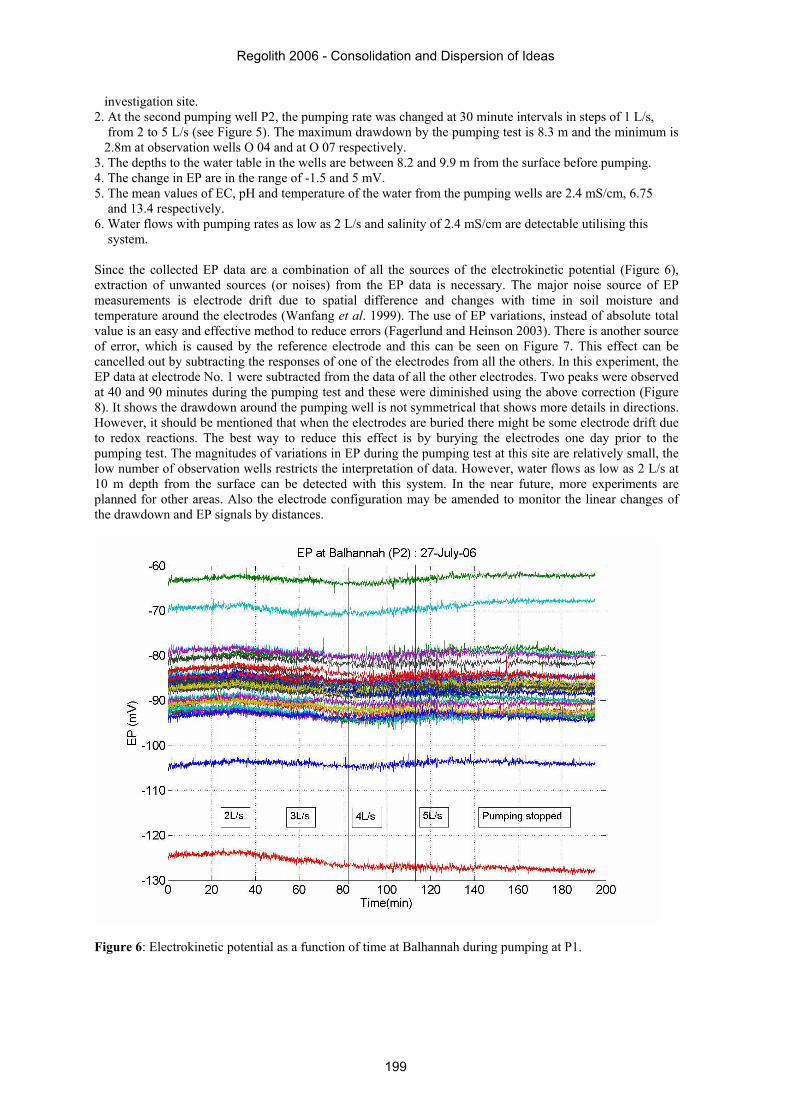
investigation site. 2. At the second pumping well P2, the pumping rate was changed at 30 minute intervals in steps of 1 L/s, from 2 to 5 L/s (see Figure 5). The maximum drawdown by the pumping test is 8.3 m and the minimum is
2.8m at observation wells O 04 and at O 07 respectively. 3. The depths to the water table in the wells are between 8.2 and 9.9 m from the surface before pumping. 4. The change in EP are in the range of -1.5 and 5 mV. 5. The mean values of EC, pH and temperature of the water from the pumping wells are 2.4 mS/cm, 6.75 and 13.4 respectively. 6. Water flows with pumping rates as low as 2 L/s and salinity of 2.4 mS/cm are detectable utilising this system. Since the collected EP data are a combination of all the sources of the electrokinetic potential (Figure 6), extraction of unwanted sources (or noises) from the EP data is necessary. The major noise source of EP measurements is electrode drift due to spatial difference and changes with time in soil moisture and temperature around the electrodes (Wanfang et al. 1999). The use of EP variations, instead of absolute total value is an easy and effective method to reduce errors (Fagerlund and Heinson 2003). There is another source of error, which is caused by the reference electrode and this can be seen on Figure 7. This effect can be cancelled out by subtracting the responses of one of the electrodes from all the others. In this experiment, the EP data at electrode No. 1 were subtracted from the data of all the other electrodes. Two peaks were observed at 40 and 90 minutes during the pumping test and these were diminished using the above correction (Figure 8). It shows the drawdown around the pumping well is not symmetrical that shows more details in directions. However, it should be mentioned that when the electrodes are buried there might be some electrode drift due to redox reactions. The best way to reduce this effect is by burying the electrodes one day prior to the pumping test. The magnitudes of variations in EP during the pumping test at this site are relatively small, the low number of observation wells restricts the interpretation of data. However, water flows as low as 2 L/s at 10 m depth from the surface can be detected with this system. In the near future, more experiments are planned for other areas. Also the electrode configuration may be amended to monitor the linear changes of the drawdown and EP signals by distances.
Figure 6: Electrokinetic potential as a function of time at Balhannah during pumping at P1.
Regolith 2006 - Consolidation and Dispersion of Ideas
199

Figure 7: The changes in electrokinetic potentials of 36 electrodes.
Figure 8: The electrokinetic potentials after subtraction the values of the electrode No. 1 from others with the changes in electrokinetic potentials.
Regolith 2006 - Consolidation and Dispersion of Ideas
200

REFERENCE DARNET, M., G. MARQUIS AND P. SAILHAC (2003). Estimating aquifer hydraulic properties from the inversion
of surface Streaming Potential (SP) anomalies. Geophysical Research Letters 30(13): 1679. FAGERLUND, F. AND G. HEINSON (2003). Detecting subsurface groundwater flow in fractured rock using self-
potential (SP) methods. Environmental Geology (Berlin) 43(7): 782-794. KIM, S., G. HEINSON AND J. JOSEPH (2005). Laboratory measurements of electrokinetic potential from fluid
flow in porous media. In: ROACH I.C ed. Regolith 2005. CRC LEME, pp.176-178. WANFANG, Z., F. BARRY, BECK AND B. J, STEPHENSON (1999). Investigation of groundwater flow in karst
areas using component separation of natural potential measurements. Environmental Geology 37(1-2): 19-25.
Acknowledgements: This work was done with support of DWLBC as a part of NWI project and CRC LEME.
Regolith 2006 - Consolidation and Dispersion of Ideas
201