Embed Size (px)
Citation preview

Chapter 3 Biological Data Collection
Field Methods for Hydrologic and Environmental Studies
Chapter 3
Biological Data Collection
Mitchell A. Harris
136

Chapter 3 Biological Data Collection
Section 3: Biological Data Collection ..................................................................................................................136
Ecology and Biological Monitoring......................................................................................................................138 Goals for Class .................................................................................................................................................138 Ecological Units of Organization.....................................................................................................................138 Taxonomy ........................................................................................................................................................138 Phylogeny ........................................................................................................................................................138 Aquatic Ecosystems .........................................................................................................................................138 Freshwater Systems..........................................................................................................................................139 Aquatic Communities ......................................................................................................................................139 Hierarchical Nature of Stream Systems ...........................................................................................................140 Lotic Habitat Types..........................................................................................................................................141 Biological monitoring ......................................................................................................................................142 Factors that effect biological communities ......................................................................................................142 Food Web.........................................................................................................................................................143 River Continuum Concept................................................................................................................................145 Sampling Considerations .................................................................................................................................145 Communities vary in space and time ...............................................................................................................145 Life History......................................................................................................................................................145 Exotic (nonnative) Species...............................................................................................................................145 Endangered or Threatened Species ..................................................................................................................145 Commonness and Rarity ..................................................................................................................................145
Fish .......................................................................................................................................................................146 A. Some Common Groups of Fishes................................................................................................................146 B. Habitat, Sampling Methods, Variables........................................................................................................146 C. Sample Analyses and the Index of Biotic Integrity (IBI) ............................................................................147
Invertebrates .........................................................................................................................................................150 A. Identification ...............................................................................................................................................150 B. Sampling......................................................................................................................................................151 C. Sample Processing, Analyses, and Assessment...........................................................................................153
Algae.....................................................................................................................................................................156
Habitat Assessment and Physicochemical Parameters.........................................................................................157
Bibliography .........................................................................................................................................................159 Algae................................................................................................................................................................159 Biological Monitoring......................................................................................................................................159 Fish...................................................................................................................................................................159 Insects, Invertebrates........................................................................................................................................159 Stream Ecology ................................................................................................................................................159 Hydrology, Physical Parameters, and Stream Geomorphology .......................................................................159
137
Chapter 3 Biological Data Collection
Ecology and Biological Monitoring Goals for Class
Look at stream from biologist’s point of view Explore some biological sampling techniques with focus on biological assessment of water quality using fish and benthic macroinvertebrates.
Ecological Units of Organization
Individual single organism or unit
Population group of organisms of one species, occupying a defined area and usually isolated to some degree from similar groups
Community Assemblage of species that co-occur in the same habitat or area and interact through trophic and spatial relationships; typically characterized by reference to one or more dominant species Properties: richness diversity (relative composition of species abundance) morphological and physiological attributes trophic structure
Ecosystem community of organisms and their physical environment (abiotic such as climate, soil) interacting as an ecological unit
Taxonomy Science of classification and naming
Phylogeny Study of evolutionary history of and relationship among taxonomic groups.
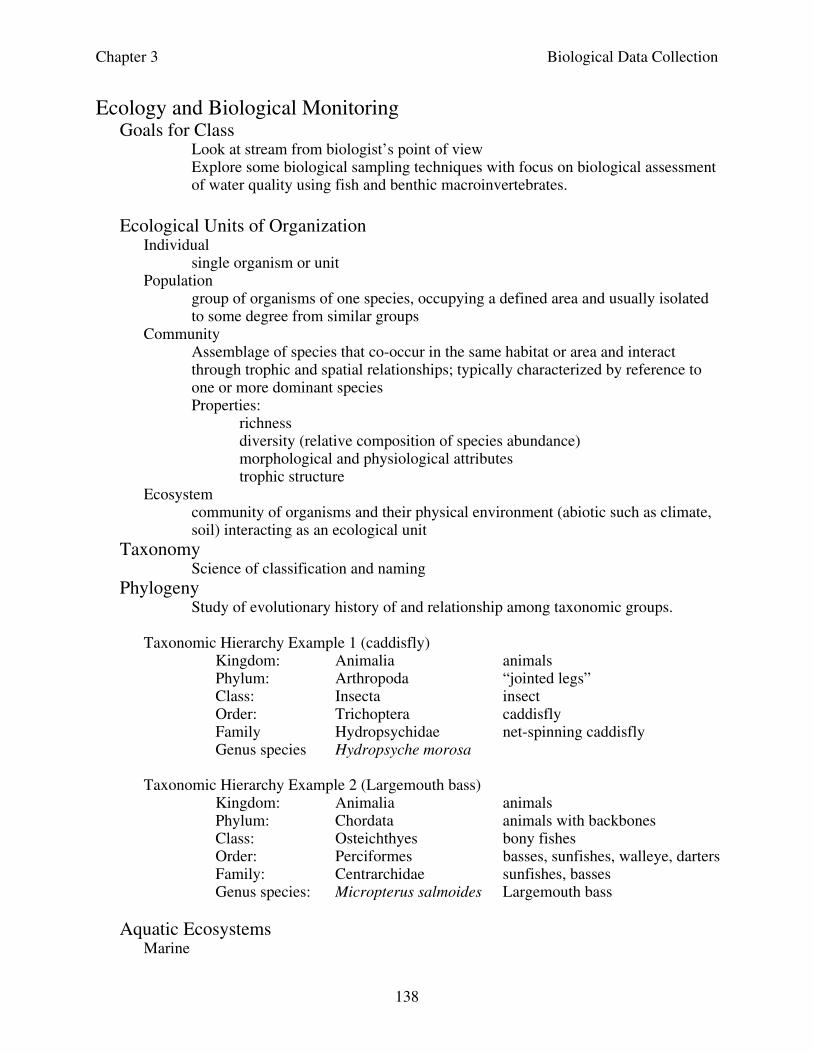
Taxonomic Hierarchy Example 1 (caddisfly) Kingdom: Animalia animals Phylum: Arthropoda “jointed legs” Class: Insecta insect Order: Trichoptera caddisfly Family Hydropsychidae net-spinning caddisfly Genus species Hydropsyche morosa
Taxonomic Hierarchy Example 2 (Largemouth bass)
Kingdom: Animalia animals Phylum: Chordata animals with backbones Class: Osteichthyes bony fishes Order: Perciformes basses, sunfishes, walleye, darters Family: Centrarchidae sunfishes, basses Genus species: Micropterus salmoides Largemouth bass
Aquatic Ecosystems
Marine
138

Chapter 3 Biological Data Collection
Brackish Freshwater
Freshwater Systems
Lentic standing water (lakes and ponds)
Lotic flowing water (rivers and streams)
Aquatic Communities Benthos
collectively all organisms that live on or in the bottom, e.g. worms, insects, diatoms, protists
Plankton organisms that are suspended in the water column; movement depends on water currents, includes Phytoplankton (plants), Zooplankton (animals)
Nekton free swimming organisms, e.g. fish, snakes, diving beetles, newts
Neuston organisms that live on water surface; never break surface tension, e.g. water striders,
Madricoles organisms that live on rock faces in waterfalls or seepages
139

Chapter 3 Biological Data Collection
Hierarchical Nature of Stream Systems (figure from Fitzpatrick and others, 1998)
Basin Segment Reach
140

Chapter 3 Biological Data Collection
Lotic Habitat Types (figure from Fitzpatrick and others, 1998) Riffle
faster flowing, well-oxygenated water, coarse sediments Run
Intermediate characteristics Pool
slower currents, deeper water, and finer, more homogeneous sediments
141

Chapter 3 Biological Data Collection
Biological monitoring Systematic use of biological resources to evaluate changes in the environment with the intent to use this information in a quality control program. The primary objective of the National Clean Water Act (CWA) is to “restore and maintain the chemical, physical and biological integrity of the nation’s waters”. In a multimetric evaluation, reference conditions are used to scale an assessment to the “best attainable” situation. A station of interest is classified on the basis of its similarity to expected conditions (reference condition), and its apparent potential to support an acceptable level of biological health. Outside the scope of this class are toxicological studies and bioassays. These studies are traditionally laboratory studies where the response of a test organism is measured after exposure to a chemical or effluent.
Factors that effect biological communities Water Quality
temperature turbidity dissolved oxygen acidity alkalinity organic and inorganic chemical heavy metals toxic substances
Habitat structure substrate type water depth and current velocity spatial and temporal complexity of physical habitat flow regime water volume temporal distribution of flows
Energy source type, amount, and particle size of organic material entering stream seasonal pattern of energy availability
Biotic interactions competition predation disease parasitism mutualism
142

Chapter 3 Biological Data Collection
Food Web Functional description of a community. Study of organic matter processing and community interactions. (Figure is adapted from “The Living Stream,” a slide show by Bert Cushing, North American Benthological Society <www.benthos.org/info/conserv/consslides.htm>).
143

Chapter 3 Biological Data Collection
144

Chapter 3 Biological Data Collection
River Continuum Concept Describes changes in structure and function of a stream along a longitudinal gradient. (Figure is adapted from The Living Stream,” a slide show by Bert Cushing, North American Benthological Society <www.benthos.org/info/conserv/consslides.htm>).
Changes are a function of changes in geomorphic, physical, and biotic variables such as: stream flow channel morphology (especially width and depth) organic matter transport use of energy by the streams functional feeding groups thermal regimes autotrophic production nutritional sources
Sampling Considerations
quantitative #/area relative abundance (%) qualitative presence/absence
Communities vary in space and time spatial variation temporal variation (seasonal and annual)
Life History
events that govern the survival and reproduction of a species or population
Exotic (nonnative) Species organism that is outside its native range
Endangered or Threatened Species legislative designation for a species that is threatened with extinction or extirpation
Commonness and Rarity
145

Chapter 3 Biological Data Collection
Fish A. Some Common Groups of Fishes B. Habitat, Sampling Methods, Variables C. Sample Analyses and the Index of Biotic Integrity (IBI)
A. Some Common Groups of Fishes (Page and Burr, 1991)
“Ancient Fishes” Lampreys, sturgeons, gars, paddlefish, bowfin, shad, eel. An artificial collection of orders and families of fishes that are unrelated to each other. There are a number of interesting and distinctive species in these groups. These orders are evolutionarily older than others that we will look at.
Salmoniformes
Salmonidae (salmon, trout, whitefish). Live in cool streams, many commercially important species. Recognized by fleshy adipose fin.
Esocidae (pickerel, muskellunge). Elongate, predatory fish, with “duck bill” mouth.
Cypriniformes
Cyprinidae (minnows and carps). Minnows are largest family (have the most species) of freshwater fishes. Varied both ecologically and morphologically.
Catostomidae (suckers). Suckers have a small mouths and large thick lips which are used in most species to “vacuum” invertebrates from stream and lake bottoms. Many suckers are large in size and they are usually abundant, so in many water bodies suckers account for the largest biomass of any group.
Siluriformes
Ictaluridae (catfishes, bullheads, madtoms). These fish are recognized by having no scales, four pairs of barbels, an adipose fin, and fins with spines. Madtoms feed on aquatic invertebrates and tend to be found in clean, flowing water. Madtom fin spines have a mild venom (watch out for these when collecting!).
Perciformes
Centrarchidae (sunfishes, basses, crappies). These are laterally compressed fishes. They have two joined dorsal fins, the first with spines and the second with rays. Many popular sportfishes are in this family. Centrarchids typically construct circular nests in the gravel, where the male guards the eggs
Percidae (walleye, sauger, yellow perch, darters). The second most diverse freshwater fish family in North America (after Cyprinidae). All but a few species in this family are darters. Darters do not have swim bladders, and they frequent the bottom of riffles where they ingest insects and crustaceans. Breeding males can be colorful.
B. Habitat, Sampling Methods, Variables
146

Chapter 3 Biological Data Collection
Variables that effect what you fish you find geographic location, fish distribution stream size and depth habitat margin, substrate size stream morphology pools, run, riffle
Factors Responsible For Disappearance Of Native Fish Species (Smith, 1971)
Excessive siltation loss of water clarity, disappearance of aquatic vegetation, deposition of silt over rock or sand substrates Drainage loss of wetlands Desiccation
lowering of water table causes small streams, seeps, and spring to dry up, and relatively larger rivers become smaller
Species interaction introduced species, ecologically labile native species Pollution industrial, domestic, agricultural Dams and impoundments habitat loss, blocking migration Temperature higher temps due to channelization, loss of riparian vegetation
Sampling Methods
seine electrofishing net visual (snorkling, SCUBA) toxicants hook and line
C. Sample Analyses and the Index of Biotic Integrity (IBI)
Properties of fish community Richness number of species Diversity relative composition of species abundances Trophic structure Morphological and physical attributes
147

Chapter 3 Biological Data Collection
Table: Fish trophic structure
148

Chapter 3 Biological Data Collection
Multimetric indexes An index created from multiple measures or metrics. Different metrics are sensitive to different perturbations. For example, municipal effluents may alter the trophic structure of a community, while habitat modifications may first effect the darters.
Metrics used in the Original Index of Biotic Integrity (Karr and others, 1986)
Species Richness and Composition Metrics 1. Total number of fish species 2. Number of darter species 3. Number of sunfish species 4. Number of sucker species 5. Number of intolerant species 6. Percent green sunfish
Trophic Composition Metrics 7. Percent omnivores 8. Percent insectivorous cyprinids 9. Percent piscivores (top carnivores)
Abundance and Condition Metrics 10. Number of individuals 11. Percent hybrids 12. Health and condition: percent individuals with disease, tumors, fin damage, skeletal anomalies
149

Chapter 3 Biological Data Collection
Invertebrates A. Identification B. Sampling C. Sample Processing, Analyses, and Assessment
A. Identification
Life Cycle (of an insect) eggs larvae (multiple instars) pupae (in holometabolous orders) adults
Identification of Macroinvertebrates
Taxonomy can be at any level, but should be consistent among samples. Genus/species will provide more accurate information on ecological/environmental relationships and sensitivity to impairment. Most organisms are identified to the lowest practical level (generally genus or species) by a qualified taxonomist using a dissecting microscope. Midges (Diptera: Chironomidae) are mounted on slides in an appropriate medium and identified using a compound microscope. Family level will provide a higher degree of precision among samples and taxonomists, requires less expertise to perform, and accelerates assessment results.
Representative Invertebrates
Phylum Class Order Porifera sponges Platyhelminthes Turbellaria flatworms Mollusca Gastropoda snails Bivalvia clams, mussels Annelida Oligochaeta aquatic worms Hirudinea leeches Arthropoda
Insecta (approximate number of aquatic and semiaquatic species in North America north of Mexico) (McCafferty, 1981)
Ephemeroptera (700) mayflies Odonata (450) damselflies, dragonflies Plecoptera (500) stoneflies Hemiptera (400) water bugs Megaloptera (50) fishflies, dobsonflies, alderflies Neuroptera (6) spongillaflies Trichoptera (1200) caddisflies
150

Chapter 3 Biological Data Collection
Coleoptera (1000) beetles Lepidoptera (50) aquatic moths Diptera (350) midges, mosquitoes, aquatic gnats and flies Malacostracta Amphipoda scuds, sideswimmers Isopoda aquatic sow bugs Decapoda crayfish, shrimps
B. Sampling
Habitat Types (Barbour and others, 1999) The major stream habitat types used here are in reference to those that are colonized by macroinvertebrates and generally support the diversity of the macroinvertebrate assemblage in stream ecosystems. Some combination of these habitats would be sampled in a multihabitat approach to benthic sampling.
Cobble (hard substrate) - Cobble is prevalent in the riffles (and runs), which are a common feature throughout most mountain and piedmont streams. In many high-gradient streams, this habitat type will be dominant. However, riffles are not a common feature of most coastal or other low-gradient streams. Sample shallow areas with coarse (mixed gravel, cobble or larger) substrates by holding the bottom of the dip net against the substrate and dislodging organisms by kicking the substrate for 0.5 m upstream of the net.
Snags - Snags and other woody debris that have been submerged for a relatively long period (not recent deadfall) provide excellent colonization habitat. Sample submerged woody debris by jabbing in medium-sized snag material (sticks and branches). The snag habitat may be kicked first to help dislodge organisms, but only after placing the net downstream of the snag. Accumulated woody material in pool areas is considered snag habitat. Large logs should be avoided because they are generally difficult to sample adequately.
Vegetated Banks - When lower banks are submerged and have roots and emergent plants associated with them, they are sampled in a fashion similar to snags. Submerged areas of undercut banks are good habitats to sample. Sample banks with protruding roots and plants by jabbing into the habitat. Bank habitat can be kicked first to help dislodge organisms, but only after placing the net downstream.
Submerged macrophytes - Submerged macrophytes are seasonal in their occurrence and may not be a common feature of many streams, particularly those that are high-gradient. Sample aquatic plants that are rooted on the bottom of the stream in deep water by drawing the net through the vegetation from the bottom to the surface of the water (maximum of 0.5 m each jab). In shallow water sample by bumping or jabbing the net along the bottom in the rooted area, avoiding sediments where possible.
Sand (and other fine sediment) - Usually the least productive macroinvertebrate habitat in streams, this habitat may be the most prevalent in some streams. Sample banks of unvegetated or soft soil by bumping the net along the surface of the
151

Chapter 3 Biological Data Collection
substrate rather than dragging the net through soft substrates; this reduces the amount of debris in the sample.
Some important variables influencing invertebrate distribution.
permanence of aquatic habitat size of habitat water depth presence vegetation for protection and habitat bottom composition current water temperature food predators
Videotape: Sampling Aquatic Insects (Resh and others, 1990)
Devices that can be used for sampling aquatic insects in lotic and lentic habitats are demonstrated in this video. This provides an introduction to the process of selecting samplers for aquatic insect studies. The appropriate habitat and methods of operation for the various samplers are discussed. In designing a research project or sampling program, the overall study design, appropriate statistical analyses, as well as the advantages and limitations of specific samplers should be given careful consideration.
The following samplers are demonstrated in video: In-Flow These samplers utilize the current to carry organisms into a net. Typically they are used in riffles in shallow streams. Surber Sampler Hess Sampler T- Sampler Kick Screen Multihabitat D-frame net
The D-frame dip net can be used in many habitats and can be used like a kick net or by “jabbing”, “dipping”, or “sweeping”. It is often useful for qualitative collecting. Dimensions of frame are 0.3 m width and 0.3 m height and shaped as a “D” where frame attaches to long pole. Net is cone or bag-shaped for capture of organisms.
Drift A net suspended in the water column may sample drift, an activity where organisms enter the water column and are transported downstream. Studies of drift may examine macroinvertebrate colonization and dispersal.
Drift Net Hyporheic Many invertebrates spend some or all of their lives beneath the stream bottom substrate.
Hyporheic Corer
152

Chapter 3 Biological Data Collection
Lentic, Deep water Grab samplers are used in lentic and deep-water habitats, and typically have jaws that snap shut.
Ekman Grab Ponar Grab
Vegetation Typically, vegetation is a difficult habitat to sample.
Pull-up Vegetation Sampler Moosejaw Vegetation Sampler
Mosquito Mosquito Dipper
Visual Benthic View Box
Artificial Substrates These samplers provide a standard substrate for sample comparison. They must be left in the stream for a colonization period.
Clay Quarry Tiles Substrate Implants Hyporheic Pot Sampler
Adult Insects These samplers are used to sample the adult stages of aquatic insects. Adult stages of insects are usually easier to identify than immature stage. These samplers are used for studies of reproductive behavior, dispersal, and species distribution.
Sweep Net Beating Sheet Pan Trap Pyramid Emergence Trap Pheromone Trap Malaise Trap Light Trap
C. Sample Processing, Analyses, and Assessment
Sample Processing Sorting Identification
Metrics (measures) used for Benthic Macroinvertebrate Communities (Barbour and
others, 1999) Metrics used in multimetric indices evaluate elements and processes within a macroinvertebrate assemblage. Metrics and protocols need to be calibrated for different regions, and sometimes, for different impact types (stressors) and metrics are typically evaluated with respect to reference conditions.
Taxa richness, or the number of distinct taxa, reflect the diversity of the aquatic assemblage. Taxa richness usually consists of species level identifications but can also be evaluated as designated groupings of taxa, often as higher taxonomic groups (i.e., genera, families, orders, etc.) in assessment of invertebrate
153

Chapter 3 Biological Data Collection
assemblages. Increasing diversity correlates with increasing health of the assemblage and suggests that niche space, habitat, and food source are adequate to support survival and propagation of many species. Measures of composition (or relative abundance) provide information on the make-up of the assemblage and the relative contribution of the populations to the total fauna. The premise is that a healthy and stable assemblage will be relatively consistent in its proportional representation, though individual abundances may vary in magnitude.
Tolerance/Intolerance measures are intended to be representative of relative sensitivity to perturbation and may include numbers of pollution-tolerant and -intolerant taxa or percent composition. Tolerance may or may not be focused on a specific type of stressor, such as organic pollution or sedimentation. Example: Hilsenhoff Family Biotic Index
(1/N) * •niti
N - number of individuals in sample n - number of individuals in family t - tolerance score of family
Feeding measures or trophic dynamics, provide information on the balance of feeding strategies (food acquisition and morphology) in the benthic assemblage. Invertebrates are classified by their feeding orientation into functional feeding groups (scrapers, shredders, gatherers, filterers, and predators). Invertebrates may also be classified by their food types, including the relative abundance of herbivores, carnivores, omnivores, and detritivores. Without relatively stable food dynamics, an imbalance in functional feeding groups will result and reflect stressed conditions.
154

Chapter 3 Biological Data Collection
Table: Invertebrate trophic relations
155

Chapter 3 Biological Data Collection
Algae Algae (Alga – singular; algae – plural) is an umbrella term for a number of groups of photosynthetic organisms. These groups include diatoms (Bacillariophyta), green algae (Chlorophyta), blue-green algae (Cyanophyta or Cyanobacteria), yellow-green algae (Chrysophyta) and red algae (Rhodophyta). Algae are found on almost any surface receiving light including rocks (epilithic), plants (epiphytic), wood (epidendric), fine sediment (epipelic), sand (epipsammic), and animals (epizooic). Benthic algae take on a variety of sizes and growth forms. As primary producers they form a base of the aquatic food chain. Periphyton (attached algae) are primary producers and are sensitive indicators of environmental change in lotic waters. Because periphyton is attached to the substrate, this assemblage integrates physical and chemical disturbances to the stream reach. The periphyton assemblage serves as a good biological indicator because of naturally high number of species and a rapid response time to both exposure and recovery. Diatoms in particular are useful indicators of biological condition because they are ubiquitous and found in all lotic systems. In addition, most periphyton taxa can be identified to species by experienced biologists, and tolerance or sensitivity to specific changes in environmental condition are known for many species. By using algal data in association with macroinvertebrate and fish data, the strength of biological assessments is optimized. The objectives of periphyton sampling could include assessment of biomass (chlorophyll a or ash-free dry mass), species composition, and biological condition of periphyton assemblages (Barbour and others, 1999). Other photosynthesizing groups are phytoplankton (algae suspended in water column) and aquatic vascular plants.
156

Chapter 3 Biological Data Collection
Habitat Assessment and Physicochemical Parameters (Adapted from Barbour and others, 1999)
An evaluation of habitat quality is critical to any assessment of ecological integrity and should be performed at each site at the time of the biological sampling. In the truest sense, “habitat” incorporates all aspects of physical and chemical constituents along with the biotic interactions. Often the definition of “habitat” is narrowed to the quality of the instream and riparian habitat that influences the structure and function of the aquatic community in a stream. The presence of a degraded habitat can sometimes obscure investigations on the effects of toxicity and/or pollution. The assessments performed by many water resource agencies include a general description of the site, a physical characterization and water quality assessment, and a visual assessment of instream and riparian habitat quality. Some states include quantitative measurements of physical parameters in their habitat assessment. Together these data provide a comprehensive and integrated picture of the biological condition of a stream system. Habitat assessment is defined as the evaluation of the structure of the surrounding physical habitat that influences the quality of the water resource and the condition of the resident aquatic community. For streams, an encompassing approach to assessing structure of the habitat includes an evaluation of the variety and quality of the substrate, channel morphology, bank structure, and riparian vegetation. Habitat parameters pertinent to the assessment of habitat quality include those that characterize the stream micro-scale habitat (e.g., estimation of embeddeddness), the macro-scale features (e.g., channel morphology), and the riparian and bank structure features that are most often influential in affecting the other parameters. When streams lose their ability to dissipate flow energy, there will be accelerated rates of channel erosion. The stability of channel morphology is influenced by these interrelated factors: channel width, channel depth, flow velocity, discharge, channel slope, roughness of channel materials, sediment load and sediment particle size distribution. Some of the habitat structural components that function to dissipate flow energy are sinuosity, roughness of bed and bank materials, presence of point bars (slope is an important characteristic), vegetative conditions of stream banks and the riparian zone, condition of the floodplain (accessibility from bank overflow and size are important characteristics). Two types of habitat assessment approaches have been developed. The first type provides a relatively comprehensive characterization of the physical structure of the stream sampling reach and its surrounding floodplain by measuring various features of the instream, channel, and bank morphology. An example of this type of assessment are the methods used by the U.S. Geological Survey National Water Quality Assessment Program (Fitzpatrick and others, 1998). The second type is a more rapid and qualitative habitat assessment approach that was developed to describe the overall quality of the physical habitat. In this rapid assessment approach all parameters are evaluated and scored. The totals for a sampling reach are compared to a reference condition to provide a final habitat
157

Chapter 3 Biological Data Collection
ranking. An example of this type of assessment may be found in the U.S. EPA Rapid Bioassessment Protocols (Barbour and others, 1999).
158

Chapter 3 Biological Data Collection
BibliographyAlgae
Stephenson, R.J., Bothwell, M.L., and Lowe, R.L., 1996, Algal ecology, freshwater benthic ecosystems: New York, Academic Press, 753 p.
Biological Monitoring
Barbour, M.T., Gerritsen, Jeroen, Snyder, B.D., and Stribling, J.B., 1999, Rapid Bioassessment Protocols for Use in Streams and Wadeable Rivers: Periphyton, Benthic Macroinvertebrates and Fish, Second Edition. EPA 841-B-99-002. U.S. Environmental Protection Agency; Office of Water; Washington, D.C. Also, web site <www.epa.gov/owow/monitoring/rbp/>.
Davis, W.S., and Simon, T.P., eds, 1994, Biological assessment and criteria, tools for water resource planning and decision making: Boca Raton, Florida, Lewis Publishers, 415 p.
Karr, J.R., and Chu, E.W., 1999, Restoring life in running waters, better biological monitoring: Washington, D.C., Island Press, 206 p.
Karr, J.R., Fausch, K.D., Angermeier, P.L., Yant, P.R. , and Schlosser, I.J., 1986, Assessing biological integrity in running waters, a method and its rational: Champaign, Illinois Natural History Survey. Special Publication 5, 28 p.
Fish Page, L.M., and Burr, B.M., 1991, A field guide to freshwater fishes, North America,
north of Mexico: Boston, Houghton Mifflin Company, 432 p. Smith, P.W., 1979, The fishes of Illinois: Urbana, University of Illinois Press, 314 p.
Insects, Invertebrates Kellogg, L.L., 1994, Save our streams, Monitor’s guide to aquatic macroinvertebrates:
Izaak Walton League of America, 60 p. McCafferty, W.P., 1981, Aquatic entomology, the fishermen’s and ecologists’ illustrated
guide to insects and their relatives: Boston, Jones and Bartlett Publishers, 448 p. Merritt, R.W., and Cummins, K.W., eds., 1996, An introduction to the aquatic insects of
North America, Third Edition: Dubuque, Iowa, Kendall/Hunt Publishing Company, 862 p.
Resh, V.H., Feminella, J.W., and McElravy, E.P., 1990, Sampling aquatic insects:
Videotape, Office of Media Services, University of California, Berkeley. Thorp, J. H., and Covich, A.P., 1991, Ecology and classification of North American
freshwater invertebrates: New York, Academic Press, 911 p.
Stream Ecology Allan, J.D., 1995, Stream ecology, structure and function of running waters: New York,
Chapman and Hall, 388 p. Hauer, F.R. and Lamberti, G.A., eds., 1996, Methods in stream ecology: New York,
Academic Press, 674 p.
Hydrology, Physical Parameters, and Stream Geomorphology Fitzpatrick, F.A., Waite, I.R., D’Arconte, P.J., Meador, M.R., Maupin, M.A., and Gurtz,
M.E., 1998, Revised methods for characterizing stream habitat in the National
159

Chapter 3 Biological Data Collection
Water-Quality Assessment Program: U.S. Geological Survey Water-Resources Investigations Report 98-4052, 67 p
Gordon, N.D., McMahon, T.A., Finlayson, B.L., 1992, Stream hydrology, an introduction for ecologists: New York, John Wiley & Sons, 526 p.
Leopold, L.B., 1994, A view of the river: Cambridge, Massachusetts, Harvard University Press, 298 p.
Waters, T.F., 1995, Sediment in streams: sources, biological effects, and control: American Fisheries Society Monograph 7.
160