Embed Size (px)
Citation preview
FIELD TEST FOR MEASURING VO2PEAK IN PARKOUR: A
PILOT STUDY
Mika Vuoriainen
Exercise physiology
Master’s Thesis
Biology of Physical Activity
Faculty of Sport and Health Sciences
University of Jyväskylä
Spring 2019
Supervisor: Heikki Kyröläinen
ABSTRACT
Mika Vuoriainen (2019). Field test for measuring VO2peak in parkour: A pilot study. Faculty
of Sport and Health Sciences, University of Jyväskylä, Master’s thesis in Exercise
Physiology, 52 pp.
Introduction. Parkour has become a widely followed physical activity and there are plans
by Federation Internationale de Gymnasticque for it to become an Olympic event. However,
the physical demands of the activity have not been thoroughly examined. The purpose of this
study was to examine the physical demands of parkour from the perspective of oxygen
consumption in an obstacle course and to develop a field test to estimate oxygen consumption
of parkour movement at different velocities. Movement on the obstacle course consisted of
vaulting and running. Vaulting is a parkour specific way to move over obstacles.
Methods. A total of 10 male parkour athletes (mean age 26.3 ± 4.2 years) volunteered for
the study. The subjects completed a test to voluntary exhaustion on a specifically designed
obstacle course and testing protocol, while their oxygen consumption was measured with a
portable measuring device. The obstacle course was designed, so that it can be used as a field
test and the design was adapted from 20m shuttle-run test. Validity of the designed testing
protocol for cardiovascular fitness testing was assessed by achievement of VO2max criteria
(plateau in oxygen consumption, RER > 1.1, maximal heart rate and lactate values > 8). Data,
from individual subjects, was pooled to create a regression line for the estimation of oxygen
consumption in vaulting.
Results. Designed testing protocol met VO2max testing criteria. All subjects achieved RER
>1.1, lactate > 8 and maximal heart rate. In addition, in 89% of measurements a VO2 plateau
was observed. The mean test duration was 12 minutes and 12 seconds. Mean RER-values
increased to a level above 1.0 at speed 7.0 km/h. Mean VO2peak was 44.0 ± 1.65 ml/kg/min
and a regression line followed formula y = 4.15 + 3.73x.
Conclusion. The achievement of VO2max criteria and suitable test duration indicates that the
field test protocol is valid for assessing cardiovascular fitness. The linear increase in oxygen
consumption with increasing velocity, suggests that the achieved final speed could be used
to estimate oxygen consumption in parkour field test. The observation that oxygen
consumption was high for any given speed, indicates that vaulting requires more oxygen than
what is usually observed in running at similar speeds. The results also indicate a large demand
for anaerobic energy production in vaulting, even at low speeds.
Key words: VO2max, parkour, vaulting, field test, cardiovascular fitness, VO2peak
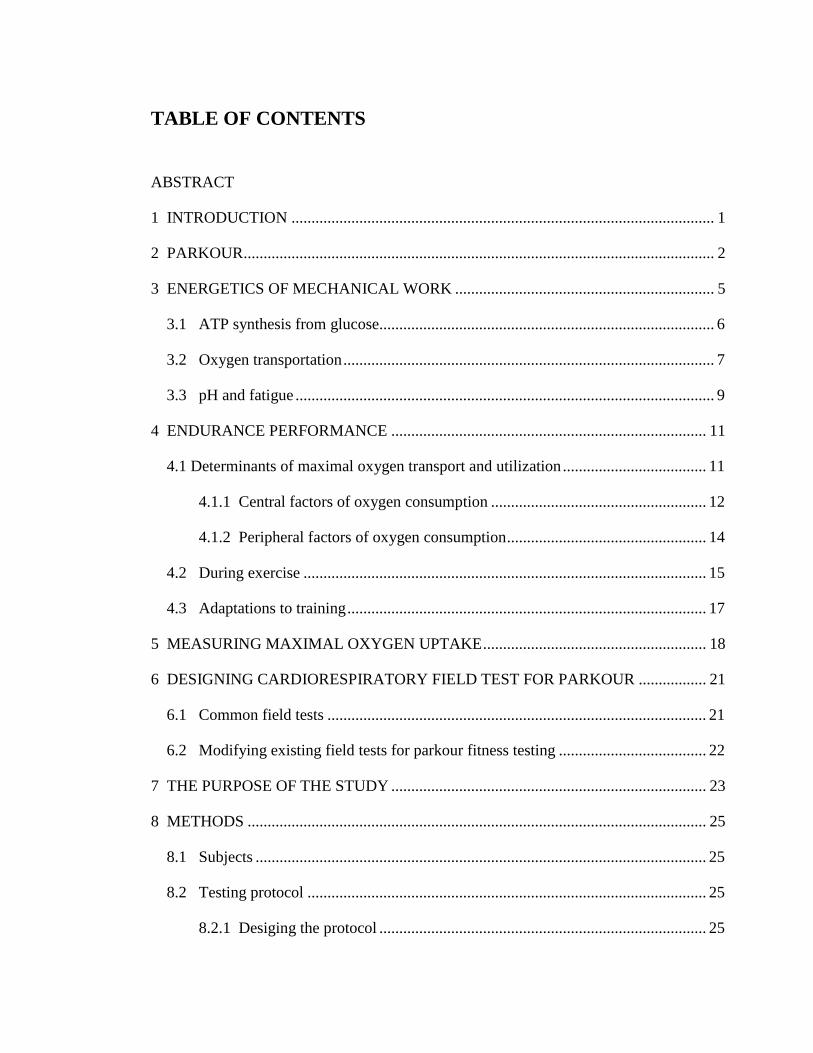
TABLE OF CONTENTS
ABSTRACT
1 INTRODUCTION .......................................................................................................... 1
2 PARKOUR ...................................................................................................................... 2
3 ENERGETICS OF MECHANICAL WORK ................................................................. 5
3.1 ATP synthesis from glucose.................................................................................... 6
3.2 Oxygen transportation ............................................................................................. 7
3.3 pH and fatigue ......................................................................................................... 9
4 ENDURANCE PERFORMANCE ............................................................................... 11
4.1 Determinants of maximal oxygen transport and utilization .................................... 11
4.1.1 Central factors of oxygen consumption ...................................................... 12
4.1.2 Peripheral factors of oxygen consumption .................................................. 14
4.2 During exercise ..................................................................................................... 15
4.3 Adaptations to training .......................................................................................... 17
5 MEASURING MAXIMAL OXYGEN UPTAKE ........................................................ 18
6 DESIGNING CARDIORESPIRATORY FIELD TEST FOR PARKOUR ................. 21
6.1 Common field tests ............................................................................................... 21
6.2 Modifying existing field tests for parkour fitness testing ..................................... 22
7 THE PURPOSE OF THE STUDY ............................................................................... 23
8 METHODS ................................................................................................................... 25
8.1 Subjects ................................................................................................................. 25
8.2 Testing protocol .................................................................................................... 25
8.2.1 Desiging the protocol .................................................................................. 25
8.2.2 The pilot test ................................................................................................ 29
8.3 Measuring devices and outcome measures ........................................................... 31
8.4 Statistical analysis ................................................................................................. 31
9 RESULTS ..................................................................................................................... 33
10 DISCUSSION .............................................................................................................. 38
10.1 Validity of pilot test for VO2max testing ................................................................ 38
10.2 Oxygen consumption in vaulting .......................................................................... 39
10.3 Strengths and limitations ....................................................................................... 42
10.4 Conclusion and practical implications .................................................................. 43
11 REFERENCES ............................................................................................................. 45
1
1 INTRODUCTION
In the advent of new aspiring sports, it is evident that old methods of field testing are not suitable
for measuring athletes’ capabilities. A new standardized field test is required for measuring
cardiorespiratory fitness in parkour and similar movement disciplines. Sports (locomotion) in
2019 is more varied than running, cycling or swimming, and testing methods should better be
able to assess individuals’ fitness in a more varied movement setting. Many new laboratory
tests have been made to accommodate this. Scientists have developed a treadmill for climbing
(vertically rotating mat with climbing holds on it) and wide enough treadmills for cross-country
skiing tests. However, there is a demand for field tests to assess cardiorespiratory fitness in the
absence of laboratory equipment. Estimation of cardiorespiratory fitness can help coaches and
athletes to modify training accordingly. Currently, there is no cardiovascular field test suitable
for parkour. Parkour athletes can choose from existing fields tests to measure strength or power
required in their discipline. For example, a standing jump test is adequate enough for assessing
jumping power in parkour. However, a field measurement for VO2peak is needed. A typical
shuttle run or walking assessments for VO2peak are not descriptive of oxygen consumption in
parkour activities.
The aim of this thesis is to pilot a field test for assessing cardiorespiratory fitness in parkour
activities. The results of the pilot test are used to validate the testing protocol and to get
preliminary information on energy demands of parkour. In this thesis, the existing knowledge
of cardiorespiratory field tests on other movement modalities is adapted for creation of the pilot
protocol. Furthermore, the data obtained in this study is used to create preliminary norms for
estimating VO2peak in parkour based on field test performance. To ensure encompassing and
representative data, top-level parkour athletes are recruited from all over Europe. Therefore, the
results are not skewed by local training culture, but instead can be generalized to broad spectrum
of parkour athletes.
2
2 PARKOUR
Parkour is defined as ”The activity or sport of moving rapidly through an area, typically in an
urban environment, negotiating obstacles by running, jumping, and climbing” (Oxford
Dictionaries 2019) or ”the sport of traversing environmental obstacles by running, climbing, or
leaping rapidly and efficiently” (Merriam-Webster 2019). However, it started as a game for
teenagers in Paris suburbs. Game that soon developed philosophical aspects to it. Mainly to
train parkour was to train to be strong both physically and mentally. This philosophy culminates
in the phrase “be strong to be useful”. Other ideals for how one should move while doing
parkour include being as efficient and as controlled as humanly possible. (Angel 2011, 9 – 42.)
Angel (2011, 9) carries on to define parkour as “physical training methodology and a particular
approach and way of thinking about movement and creative spatial mapping. It is physical and
emotional activity that involves only the body to overcome obstacles within a route. This may
involve running; climbing; vaulting; jumping; traversing; balancing, or any other physical
means to get from one point to another. Some simplify this stating it as finding a way of getting
from ‘point A’ to ‘point B’.”
Currently parkour is an emerging sport, and the The Fédération Internationale de Gymnastique
(FIG) has planned world championships for parkour in 2020 (FIG council 2018) and parkour
to be added to the Olympic program for 2024 (Butler 2017). It is next to impossible to estimate
the number of practitioners parkour currently has, because it can be practiced informally
without equipment and it does not require individuals to be part of any organizations. The
interest in parkour can be represented by popularity on internet platforms like Youtube. For
example, parkour practitioner group “Storror” has 3.92 million subscribers on Youtube (Storror
Youtube channel 2019) and their three most watched videos have 87 million views, 73 million
views and 32 million views respectively. In contrast on official Olympic games Youtube-
channel there are 3.32 million subscribers and their top three sports related videos have 27
million, 23 million and 17 million views (Olympic Youtube channel 2019). The most popular
video on Olympic games channel is Usain Bolt’s 100m world record run, which is viewed 27
million times on Youtube, whereas many Parkour related videos have multitudes of more views.
3
Locomotion in parkour is hard to define with strict attributes attached to it, this is because of
the playful characteristics of the parkour game. Individuals set goals for themselves for each
training session and there is great variance in what a single session might involve. Parkour
training is an individual journey, where one challenges his physical and mental abilities and
gets to know himself better (Henry 2017). Common characteristics to parkour locomotion
include leaping, swinging, vaulting, climbing and running. These modalities of movement are
used to go over, through and around obstacles in an urban environment (Angel 2011, 273-287;
Atkinson 2009; DeFreitas 2011; Pihlaja & Junttila 2012). The movements have been influenced
by variety of sports including for example gymnastics, track & field, army obstacle courses,
martial arts, climbing and acrobatics (Pihlaja & Junttila 2012).
This thesis approaches parkour training from the view point of the Yamakasi (founding
members of parkour and Art du deplacement). The author of this thesis has trained with the
originators of the sport and have acquired knowledge on how it was originally trained. Typical
training session with the Yamakasi include long strenuous repetitive actions i.e. running the
stairs, crawling or hanging. Usually, these activities are done to collective exhaustion to a point
where continuing would be next to impossible. The nature in which parkour was originally
trained can be characterized as an endurance exercise. Therefore, in this thesis the focus is on
the endurance aspect of Parkour.
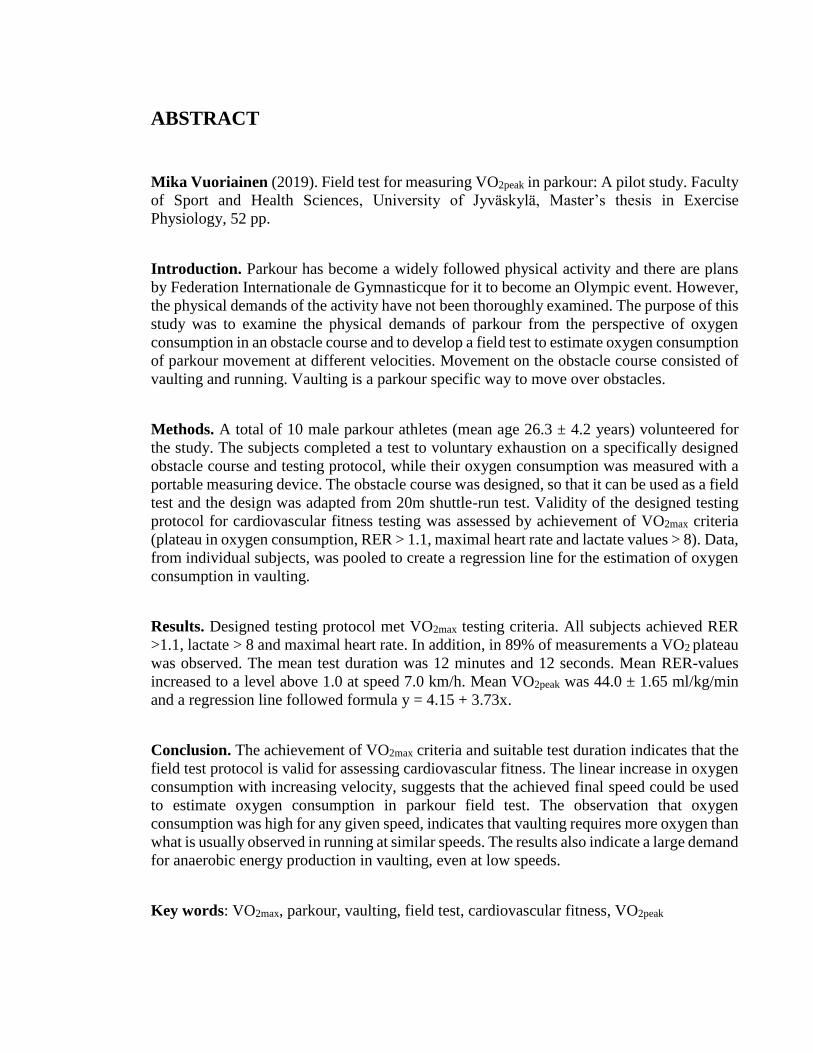
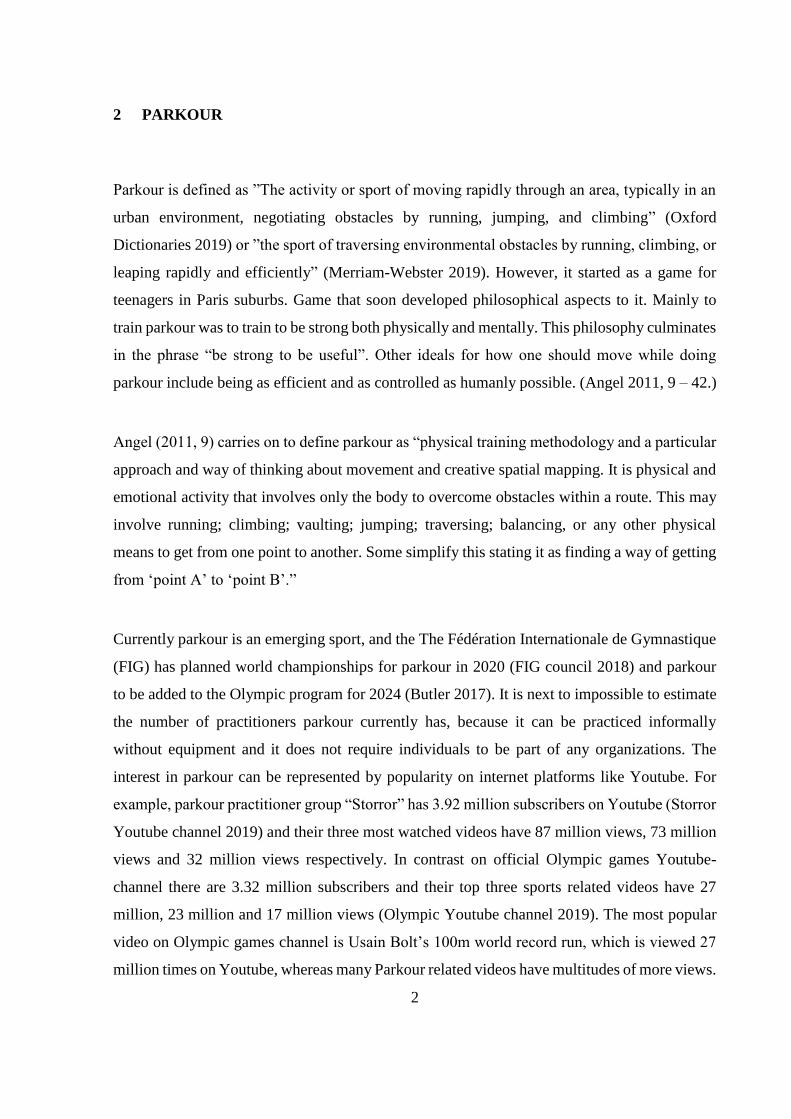
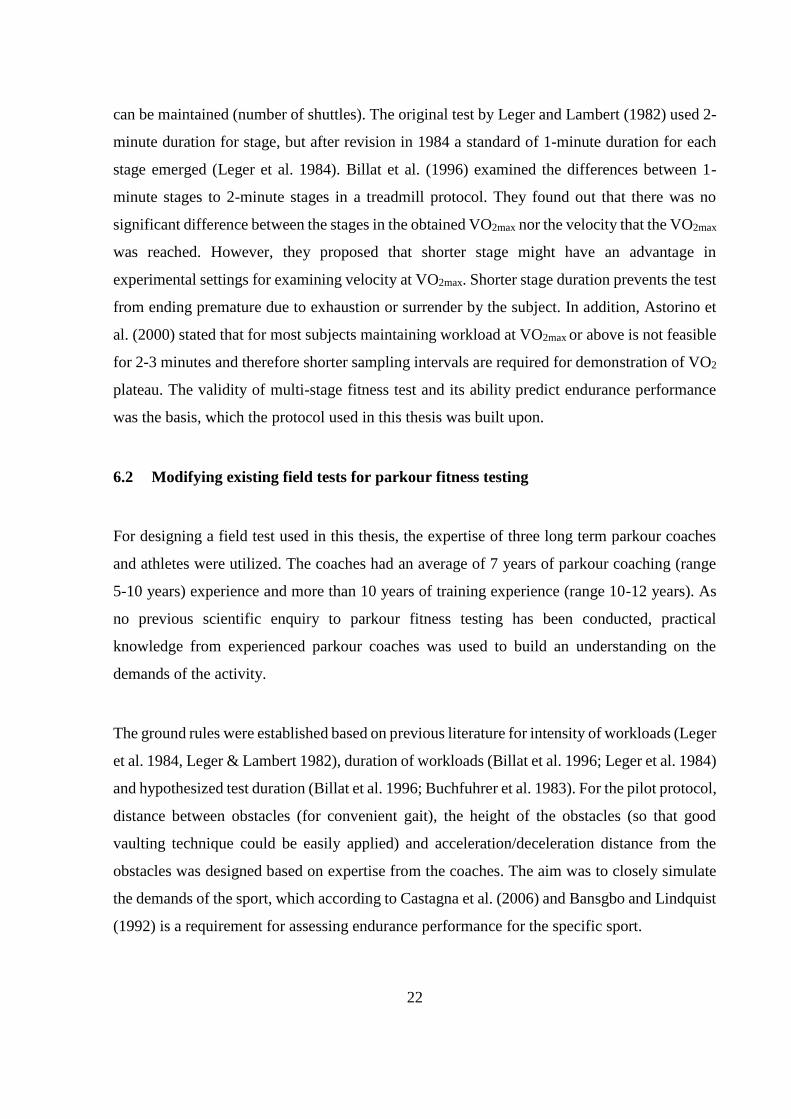
One of the most typical movement types in parkour is going over obstacles by vaulting e.g
jumping or stepping over. Vaulting involves placing a body part on the obstacle, typically one
or both hands, whilst going over it (for illustration see, Figure 1). There are various ways of
vaulting that have become more or less standard ways to move over obstacles (Murray 2010;
Pihlaja & Junttila 2012). These include for example step vault, monkey vault, turn vault and
speed vault (Angel 2011, 273-287; Pihlaja & Junttila 2012). Efficiency is often the goal of
parkour techniques and when it comes to vaulting, most common techniques adhere to this
ideal. In practise, vaulting should not reduce your forward momentum (similar to hurdling) and
it should aim to minimize the energy cost of going over the obstacle (economy).
4
FIGURE 1: Example of vaulting (speed vault) on the obstacle course.
While in training sessions, vaults are often trained as individual movements, they can be applied
as parts of parkour courses. Efficient completion of a parkour course sets other demands on
individual movements. For example, one must control the landing from a vault to be able to
face desired direction. Similarly, as with many track and field events the fluidity and speed
comes from how many steps are taken between the obstacles. Currently there are no premade
or set courses for parkour. It is all up to the practitioner where he/she wants to take his/her
movement in a creative endeavour (Angel 2011).
In this thesis, a pilot of a simple standardisable obstacle course is designed and tested. The
designed course is not aimed as a model to be used in a competition. Instead it is designed to
be used as a tool for assessing energy demands of vaulting and assessing parkour practitioners’
cardiovascular fitness. Golden standard for cardiovascular fitness is VO2max measurements
(Beltz et al. 2016). VO2 is oxygen consumption [litres/minute] and indicates how much energy
can be synthesised from oxygen to produce mechanical work for movement. Currently there is
no reliable means to assess maximal oxygen consumption in parkour.
5
3 ENERGETICS OF MECHANICAL WORK
Mammalian locomotion is generated by contracting muscle cells. Contracting muscle cells
produce force, and the amount of force being produced per unit of time is known as mechanical
work (McArdle et al. 2010, 123). Contraction of muscle cells require energy. This energy is
generated by hydrolysis of adenosine triphosphate (ATP)
ATP ADP + Pi + energy
in which ADP is adenosine diphosphate and Pi is inorganic phosphate. This process is
reversible, which allows for quick resynthesis of ATP when abundance of energy is present.
Human muscle cells store limited amount of ATP, which is depleted in 1-2 seconds of maximal
contracting work. For prolonged work the muscle cells need to resynthesize ATP via various
metabolic processes. (Glaister 2005; McArdle et al. 2010, 135 – 138.)
Phosphocreatine (PCr) can be used to resynthesize ATP. This process is catalysed by creatine
kinase and results in a reversible reaction in which phosphate from PCr is attached to ADP.
PCr + ADP + H+ → ATP + Cr
Musce cells store approximately 80 mmol/kg of PCr in dry muscle tissue. During maximal work
these stores are depleted rapidly, in an exponential pattern of decay, lasting around 10 seconds.
(Glaister 2005; McArdle et al. 2010, 163.)
More than 90% of ATP synthesis happen in a coupled reaction called oxidative phosphorylation
in which electrons are transferred from NADH (NAD = nicotinamide adenine dinucleotide) and
FADH2 (FAD = flavin adenine dinucleotide) to oxygen molecules (McArdle et al. 2010, 139 -
141).
6
In endurance events lasting 5 - 20 minutes, such as the pilot field test employed in this thesis,
the main source of energy (ATP) comes from breakdown of carbohydrates (McArdle et al.
2010, 170). Humans store carbohydrates in the form of glycogen in their muscle cells. These
glycogen storages can be depleted as fast as 15 minutes during very high intensity exercise, but
on the other hand can last for over 180 minutes in low intensity exercise (McArdle et al. 2010,
232-233). The process of breaking down carbohydrates starts with glycolysis.
3.1 ATP synthesis from glucose
In glycolysis carbohydrates (glucose) are degraded to pyruvate, water, free protons and NADH.
Glucose + 2 NAD+ + 2 ADP + 2 Pi → 2 Pyruvate + 2 NADH + 2 H+ + 2 ATP + 2 H2O
The end products pyruvate and NADH are in anaerobic conditions fermented (lactic acid
fermentation) to lactate and NAD+.
Pyruvate + NADH + H+ → Lactate + NAD+
In anaerobic conditions, the energy production stops here. Lactate is not further processed for
energy, while pyruvate can still be used in energy metabolism. Only 2 molecules of ATP is
produced from 1 molecule of glucose in anaerobic conditions.
While in aerobic conditions pyruvate is converted into acetyl-CoA (Acetyl coenzyme A), CO2
and NADH + H+.
Pyruvate + NAD+ + CoA-SH → Acetyl-CoA + NADH + CO2
These molecules are required for oxidative phosphorylation and citric acid cycle (kerbs cycle).
(Guyton & Hall 2016, 856; McArdle et al. 2010, 145-147.) The degradation of glucose
7
continues in citric acid cycle, in which the acetyl portion of acetyl-CoA is degraded into carbon
dioxide and hydrogen atoms.
2 acetyl-CoA + 6 H2O + 2 ADP → 4 CO2 + 16 H + 2 CoA + 2 ATP
As can be seen, only 4 ATP molecules per 1 molecule of glucose is formed in glycolysis and
citric acid cycle. However, the reactions in glycolysis and citric acid cycle are necessary to
make the hydrogen of the glucose molecule available for oxidation. The available hydrogen is
oxidized in a process called oxidative phosphorylation. Oxidative phosphorylation produces a
large quantity of ATP, to be precise 34 molecules of ATP per 1 molecule of glucose. Oxidative
phosphorylation functions by transferring electrons from electron donors to electron acceptors
such as oxygen, in redox reactions. These redox reactions release energy, which is used to
synthesize ATP. (Guyton & Hall 2016, 856 – 858.)
Finally, for 1 molecule of glucose 38 molecules of ATP are synthesized, which can be used to
fuel muscle contractions to do mechanical work (Guyton & Hall 2016, 859). In addition to
glycolysis, oxidative phosphorylation can be fuelled by beta-oxidation (breaking down fatty
acids) or proteolysis (protein degradation). However, these metabolic pathways have much
lower ATP turnover rate than aerobic glycolysis, and thus are not sufficient for maintaining
high intensity muscle work for short durations (McArdle et al., 2010, 159-161). In conclusion,
during exercise the amount of work that can be done is limited by the amount of ATP that the
cells can synthesize. This in turn is limited by the availability of oxygen for oxidative
phosphorylation.
3.2 Oxygen transportation
The amount of oxygen the cells have available for energy production depends on oxygen
transportation capacity of the circulatory system (Docherty & Sporer 2000). Oxygen is
absorbed from the air through lungs into circulating blood. Oxygen concentration of systemic
blood depends on multiple factors: the partial pressure of inspired oxygen, the concentration of
haemoglobin in the blood, the binding potential of oxygen molecules for haemoglobin and
8
sufficiency of gas exchange in the lungs. Only a miniscule portion of oxygen dissolves into the
blood plasma, while large majority of oxygen molecules in the circulation are bound to the
haemoglobin molecules. (Barrett et al. 2009, 523-527; Collins et al. 2015; McArdle et al. 2010,
275-280).
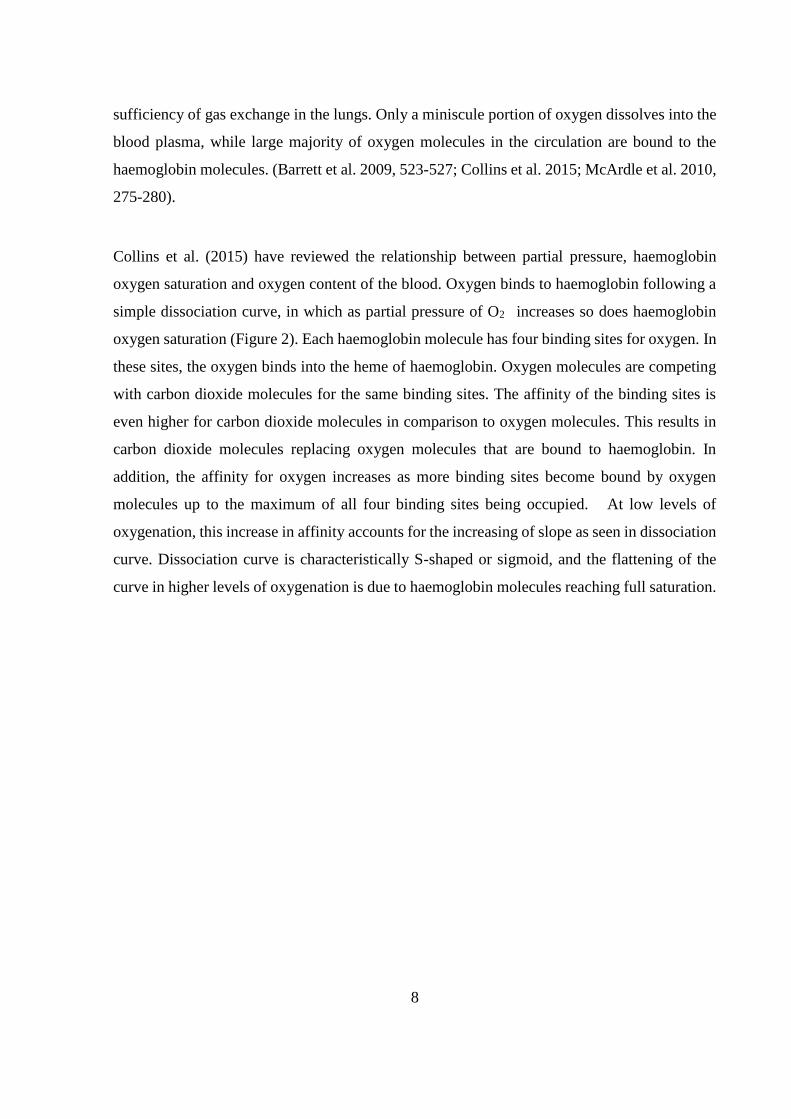
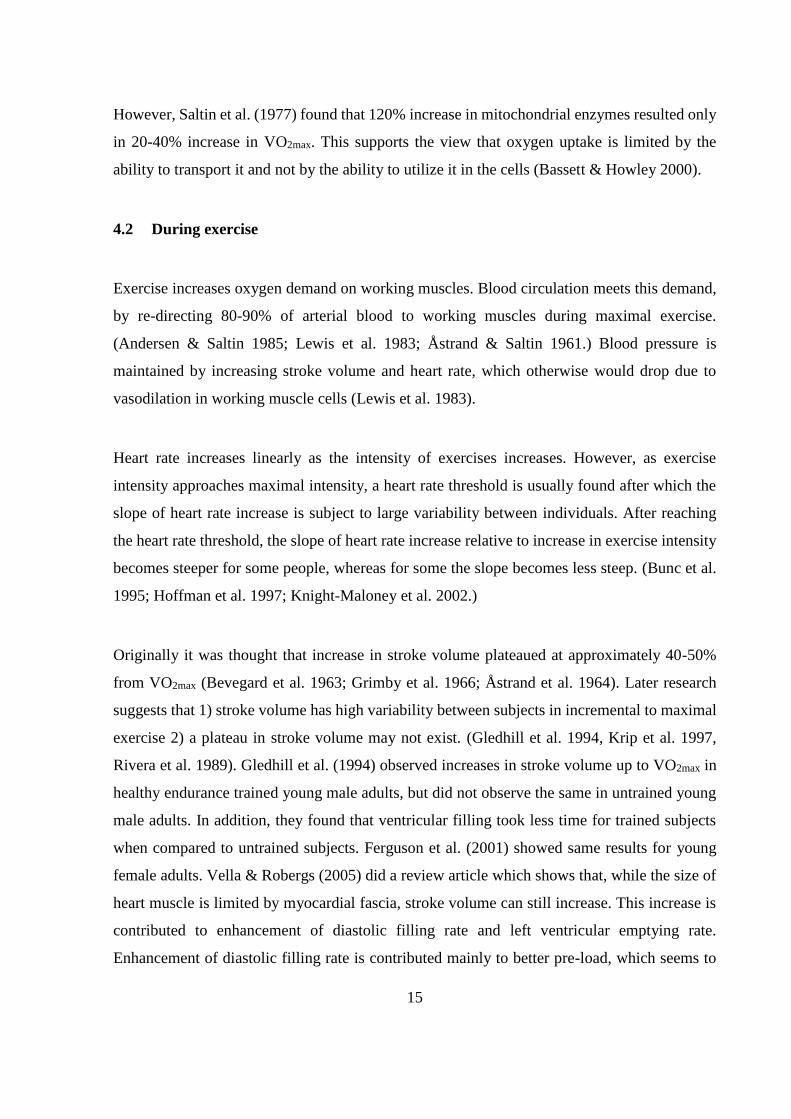
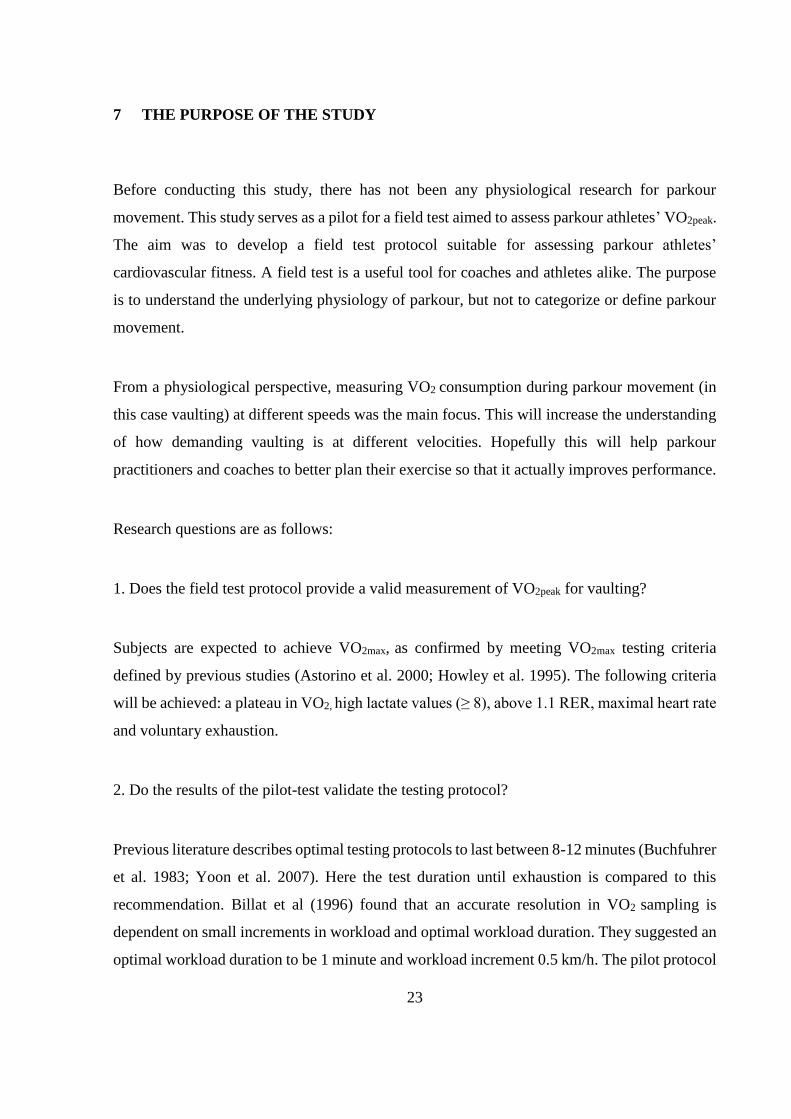
Collins et al. (2015) have reviewed the relationship between partial pressure, haemoglobin
oxygen saturation and oxygen content of the blood. Oxygen binds to haemoglobin following a
simple dissociation curve, in which as partial pressure of O2 increases so does haemoglobin
oxygen saturation (Figure 2). Each haemoglobin molecule has four binding sites for oxygen. In
these sites, the oxygen binds into the heme of haemoglobin. Oxygen molecules are competing
with carbon dioxide molecules for the same binding sites. The affinity of the binding sites is
even higher for carbon dioxide molecules in comparison to oxygen molecules. This results in
carbon dioxide molecules replacing oxygen molecules that are bound to haemoglobin. In
addition, the affinity for oxygen increases as more binding sites become bound by oxygen
molecules up to the maximum of all four binding sites being occupied. At low levels of
oxygenation, this increase in affinity accounts for the increasing of slope as seen in dissociation
curve. Dissociation curve is characteristically S-shaped or sigmoid, and the flattening of the
curve in higher levels of oxygenation is due to haemoglobin molecules reaching full saturation.
9
FIGURE 2. Theoretical Oxygen-haemoglobin dissociation curve. The Y-axis can be plotted as
either % saturation of haemoglobin (Hb saturation) or oxygen concentration (O2 concentration).
The X-axis represents partial oxygen pressure (PO2 mmHg). (Collins et al. 2015).
Dissociation curve is vulnerable to changes in environment. Increase in carbon dioxide partial
pressure (Pco2), increase in acidity (decrease of pH) and increase in temperature shift the curve,
so that higher partial pressure of oxygen is required for the same amount of Hb-saturation.
(Collins et al. 2015.)
3.3 pH and fatigue
The ability for cells to produce energy is inhibited by acidosis. Suleymanlar et al. (1992)
showed a 35% decrease in oxygen consumption following a pH drop from 7.4 to 6.8 in working
10
muscle. During exercise, the main source of acidity is the accumulation of H+ (Robergs, 2001b).
Robergs (2017) showed that glycolytic pathway, especially Glyceraldehyde-3 phosphate
dehydrogenase reaction, produces the majority of H+ in breaking down of glucose. This is in
contrast to commonly thought idea, that production of lactate causes acidity. Robergs also
showed that Lactate dehydrogenase is actually an alkaline reaction, since it removes H+.
pH balance is maintained by buffering accumulating H+, transmembrane and transepithelial ion
transfer processes and the adjustment of Pco2 (Heisler 2004). Buffering happens on the
intracellular level, where H+ is bound to buffering molecules like bicarbonate or protein
complexes. Buffered ions are transferred through cell membrane by diffusion, however the
transmembrane transfer process suffers from equilibrium limitations and rate of perfusion for
fluids. Rate of perfusion can be affected by capillary transit capacity and adjustment of Pco2.
(Heisler 2004.)
Fatigue was thought to be caused by acidosis (Fabiato & Fabiato 1978), by reduction of Ca2+
sensitivity. However, Pate et al. (1995) showed that changes in pH did not affect isometric force
of rabbit’s psoas muscles, suggesting that acidosis might not be the only contributor to fatigue.
Allen et al. (2008) suggests that ATP, ADP, PCr, Mg and reactive oxygen and nitrogen species
play a role in skeletal muscle fatigue. In addition, Pi has been shown to inhibit muscle
contractions by reducing Ca2+ sensitivity and Ca2+-activated force (Allen & Trajanovska 2012).
Pi accumulates from hydrolysis of ATP, which happens in all energy production. Fatigue and
acidosis seem to be the result of high energy demand, which cannot be met without cells
producing inhibiting metabolites and acidity (H+) (Robergs 2001).
11
4 ENDURANCE PERFORMANCE
Endurance is the ability to resist fatigue (Zatsiorsky & Kraemer 2006, 162). The ability to resist
fatigue is dependent on the locomotion performed and the duration of the locomotion. For
events lasting under 5 minutes, endurance performance is limited by anaerobic capacity
(Keskinen et al. 2010, 51). As the duration of the events increase, endurance performance
becomes more dependent on aerobic capacity. The role of aerobic capacity becomes increasing
important after 2 minutes of work. (McArdle et al. 2010, 452.) In addition, intensity of work
being done affects how much energy is required. High intensity work requires fast turnover rate
of ATP, which can only be produced anaerobically. (McArdle et al. 2010, 163-165.)
Cardiorespiratory fitness testing aims to assess aerobic capacity which is determined by
maximal oxygen uptake (VO2max), aerobic endurance, economy of the movement and the ability
of neuromuscular system to produce force (Mero et al. 2007, 333). VO2max testing is one of the
most widely used ways of assessing aerobic fitness (Beltz et al. 2016).
4.1 Determinants of maximal oxygen transport and utilization
The idea of maximal oxygen uptake originated in the work of Hill and Lupton in the early
1900s. Bassett and Howley (2000) have described the VO2max paradigm formulated by Hill and
Lupton. The paradigm suggests that 1) there is an upper limit to oxygen intake, 2) there are
differences between individuals in VO2max, 3) High VO2max is necessary for succeeding in
endurance competitions (distance running) and 4) VO2max is limited by the respiratory and
circulatory systems. (Bassett & Howley 2000.)
Maximal oxygen uptake indicates how much oxygen the body can use for energy metabolism.
Energy production is limited by blood’s capacity to transport oxygen to the cells and muscle
cells’ ability to utilize oxygen (Docherty & Sporer 2000.) Maximal oxygen uptake is commonly
interpreted as an index of cardiorespiratory fitness (Rowell 1974.) When observing over a
period of time, oxygen uptake can be seen as cardiac output [Q] (per minute) multiplied by the
difference of oxygen concentration of arterial blood compared to venous blood (a-vO2diff). This
12
dependency is more commonly known as Fick’s equation and it was first published by Adolf
Eugen Fick in 1870 (McArdle et al. 2010, 341).
VO2 = Q x a-vO2diff
According to Beltz et al. (2016) the cardiac output is determined in this equation by heart rate
(HR) and left ventricular (LV) stroke volume (SV). The stroke volume is presented as the
difference of left ventricle end-diastolic volume (EDV) and end-systolic volume (ESV).
Expanded formula can be described as:
VO2 = HR x (EDV-ESV) x a-vO2diff
Fick’s equation represents central (Q) and peripheral (avO2diff) factors of oxygen consumption.
Central components are understood as factors impacting oxygen diffusion from external
environment into arterial blood and the transportation of oxygenated blood to exercising muscle
cells. While peripheral components refer to intracellular and molecular mechanisms that diffuse
oxygen from blood into the cell and transport it to mitochondria for the use of energy
metabolism. (Beltz et al. 2016.)
4.1.1 Central factors of oxygen consumption
It has been established that when oxygen consumption (VO2) raises the cardiac output (Q) also
raises in linear fashion (Crisafulli et al. 2005). Cardiac output seems to be the limiting factor
for oxygen consumption. Andersen and Saltin (1985) suggested that blood flow to exercising
muscles is limited by finite cardiac output rather than muscles’ capability to use oxygen. This
was demonstrated in their study, in which they had subjects exercising the quadriceps muscle
group, while restricting blood flow to the working muscles. They measured consumed oxygen
after unrestricting blood flow. The quadriceps muscle group consumed 0.8 L/min of oxygen for
2.3 kg of muscle mass. This amount of consumed oxygen far exceeds the muscles’ rate of
oxygen uptake during whole body exercise.
13
Heart rate is a limiting factor for cardiac output. Maximal heart rate is age- and genetics related
attribute and training has little effect on it (McArdle et al. 2010, 343). Heart rate increases
linearly along with the increase of workload (Karvonen & Vuorimaa, 1988). Changes in heart
rate are controlled by autonomous nervous system. As sympathetic nervous activity increases
and parasympathetic decreases heart rate goes up. While opposite changes in autonomous
nervous system activity result in decrease of heart rate. (Robinson et al. 1966). Exercise affects
the autonomous nervous system by decreasing parasympathetic nervous system activity while
simultaneously increasing sympathetic nervous system activity. This change is mediated
through baroreceptors, chemoreceptors and vascular tone. (Beltz et al 2016; Robinson et al.
1966).
Stroke volume is affected by the volume of the left ventricle, and also acutely affected by
diastole filling of the heart (Blomqvist & Saltin 1983). Blomqvist and Saltin (1983) reviewed
previous research and found no association between heart size and VO2max, but instead the
volume of the left ventricle and VO2max were correlated. Diastole filling stretches the heart
muscle resulting in more force being produced when heart pumps blood into the aorta, this is
also known as Frank-Starling mechanism (Guyton & Hall 2016, 119). Blood volume in
circulation increases diastole filling, resulting in higher stroke volume (Levine 2008). Repeated
stretching of the heart muscle by maximal diastole filling increases the volume of blood that
fits into its ventricles (Guyton & Hall 2016, 119; Levine 2008.)
Force that the heart can exert is dependent on the number of contractile proteins (actin and
myosin) it has. Actin and myosin form cross-bridges between each other which pull the muscle
into contraction. The more cross-bridges are formed the more force is produced. More force
allows the heart to pump more blood with a single stroke. (Guyton & Hall 2016, 119; Levine
2008.)
During incremental to maximal exercise autonomous neural activity becomes more sympathetic
nervous dominant, which increases chronotropic activity and inotropic response. This shift in
neural activity enhances myocardial contractibility, which reduces end-systolic volume and
increases the volume of venous return to the heart (Beltz et al. 2016). This also allows left
14
ventricle to stretch more and according to Frank-Starling mechanism to contract with additional
force (Allen & Kentish 1985). All this results in increased stroke volume and thus increased
cardiac output (Beltz et al. 2016).
4.1.2 Peripheral factors of oxygen consumption
Arteriovenous oxygen difference (a-vO2diff) simply means the difference of oxygen
concentration in arterial and venous blood. However, this difference is caused by oxygen
diffusing from arterial blood into the muscle cells, therefore resulting in lesser oxygen
concentration in venous blood. The amount of oxygen that diffuses to cells is dependent on the
rate of diffusion and utilization of oxygen. (Honig et al. 1992.)
Circulating oxygen is transported through muscle cell membrane by diffusion, in which small
particles move across the cell membrane from higher concentration (higher partial pressure of
O2) to lower concentration. This effect is also known as Fick’s law of diffusion. (McArdle et
al. 2010, 256-257.) Oxygen in the muscle cells is bound to myoglobin, much like oxygen binds
into haemoglobin in the bloodstream. Myoglobin serves as a storage for oxygen particles. As
oxygen binds into myoglobin, the concentration gradient is altered. Altered concentration
gradient facilitates diffusion of oxygen into the cells. (Jürgens et al. 2000.) Honig et al. (1992)
confirmed that the PO2 in bloodstream was not the only determining factor for oxygen diffusion
into the muscle cells, but there also needed to be a demand for the oxygen (low PO2 inside the
cell). As the muscle cells use oxygen for energy, PO2 inside the cell decreases, this results in
more diffusion of oxygen into the cell.
Cells ability to utilize oxygen is in turn limited by its capacities for oxidative phosphorylation.
In oxidative phosphorylation cells use enzymes to oxidize nutrients, thereby releasing energy
which is used to resynthesize ATP (adenosine triphosphate). Oxidative phosphorylation takes
place in cell’s mitochondria and is, therefore, limited by the number of mitochondria in the
cells. Mitochondria serve as the site where the final step of electron transport chain takes place
and in which O2 is consumed to make ATP. So in theory doubling the number of mitochondrial
enzymes should double the capacity of oxygen consumption (Mitchell & Moyle 1967.)
15
However, Saltin et al. (1977) found that 120% increase in mitochondrial enzymes resulted only
in 20-40% increase in VO2max. This supports the view that oxygen uptake is limited by the
ability to transport it and not by the ability to utilize it in the cells (Bassett & Howley 2000).
4.2 During exercise
Exercise increases oxygen demand on working muscles. Blood circulation meets this demand,
by re-directing 80-90% of arterial blood to working muscles during maximal exercise.
(Andersen & Saltin 1985; Lewis et al. 1983; Åstrand & Saltin 1961.) Blood pressure is
maintained by increasing stroke volume and heart rate, which otherwise would drop due to
vasodilation in working muscle cells (Lewis et al. 1983).
Heart rate increases linearly as the intensity of exercises increases. However, as exercise
intensity approaches maximal intensity, a heart rate threshold is usually found after which the
slope of heart rate increase is subject to large variability between individuals. After reaching
the heart rate threshold, the slope of heart rate increase relative to increase in exercise intensity
becomes steeper for some people, whereas for some the slope becomes less steep. (Bunc et al.
1995; Hoffman et al. 1997; Knight-Maloney et al. 2002.)
Originally it was thought that increase in stroke volume plateaued at approximately 40-50%
from VO2max (Bevegard et al. 1963; Grimby et al. 1966; Åstrand et al. 1964). Later research
suggests that 1) stroke volume has high variability between subjects in incremental to maximal
exercise 2) a plateau in stroke volume may not exist. (Gledhill et al. 1994, Krip et al. 1997,
Rivera et al. 1989). Gledhill et al. (1994) observed increases in stroke volume up to VO2max in
healthy endurance trained young male adults, but did not observe the same in untrained young
male adults. In addition, they found that ventricular filling took less time for trained subjects
when compared to untrained subjects. Ferguson et al. (2001) showed same results for young
female adults. Vella & Robergs (2005) did a review article which shows that, while the size of
heart muscle is limited by myocardial fascia, stroke volume can still increase. This increase is
contributed to enhancement of diastolic filling rate and left ventricular emptying rate.
Enhancement of diastolic filling rate is contributed mainly to better pre-load, which seems to
16
be the result of larger blood volume. They showed that adaptations to endurance training
enhance stroke volume via increase in blood volume, increase in the size of left ventricle,
improvement of left ventricle compliance, increase of myocardial contractility and reduced
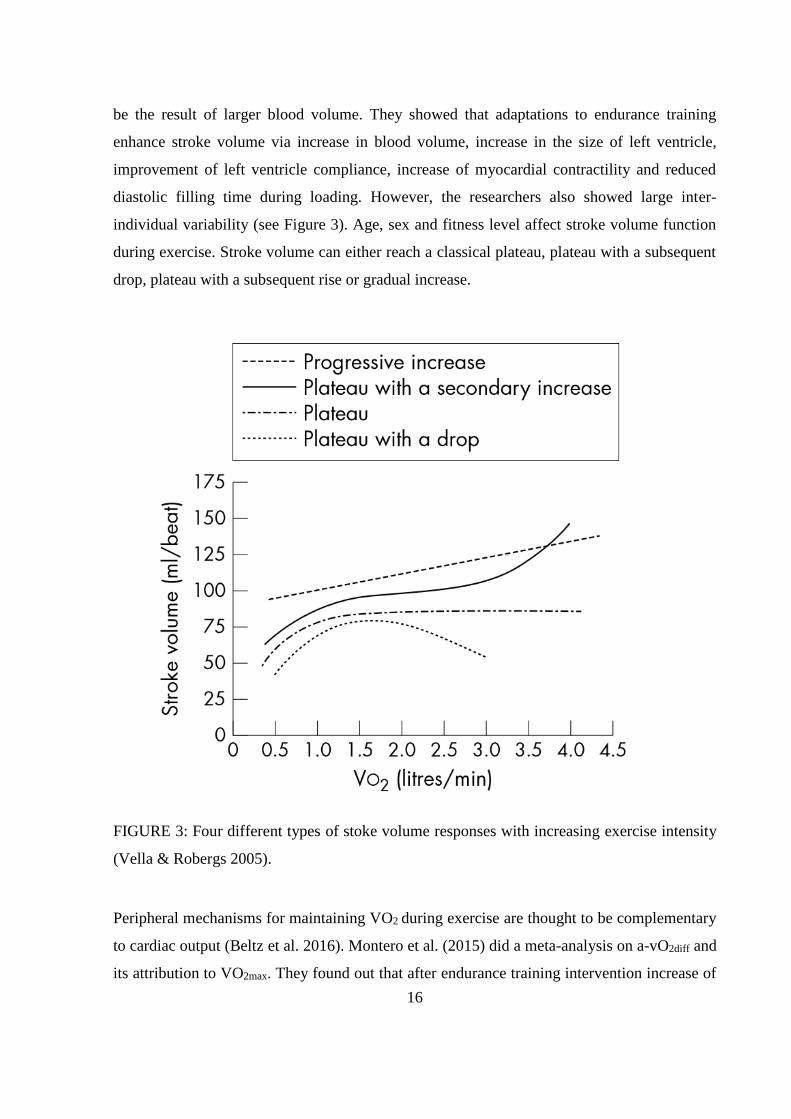
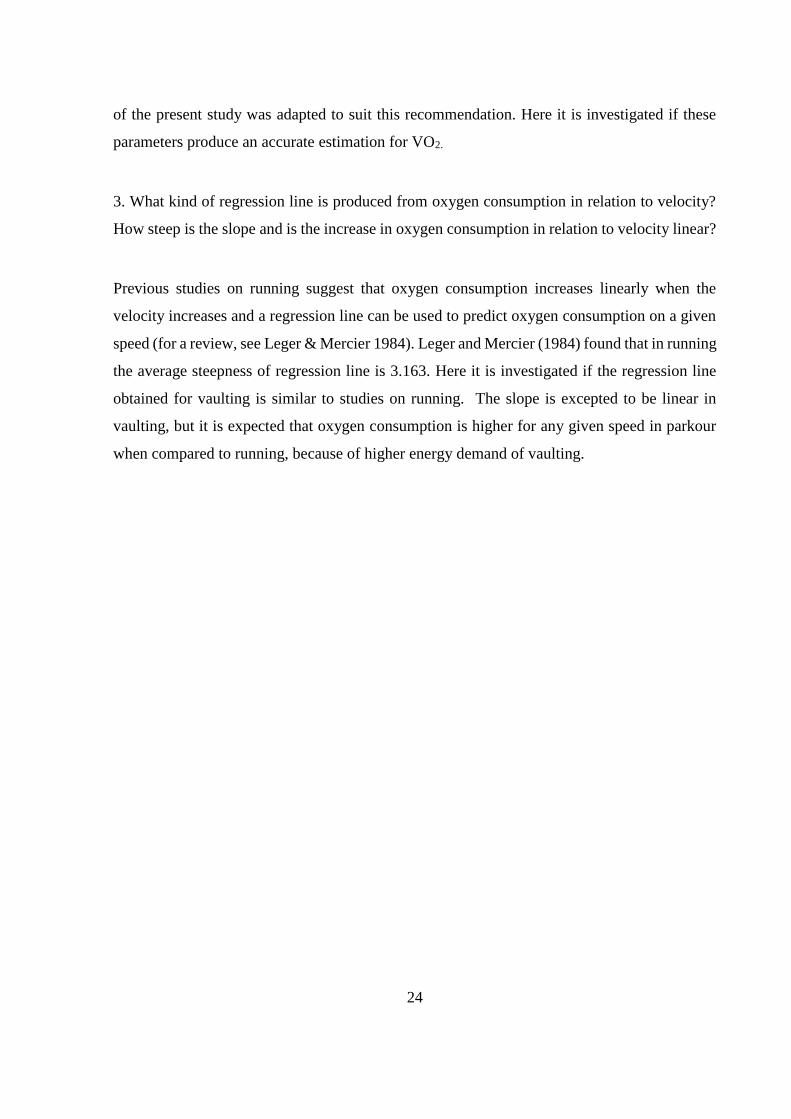
diastolic filling time during loading. However, the researchers also showed large inter-
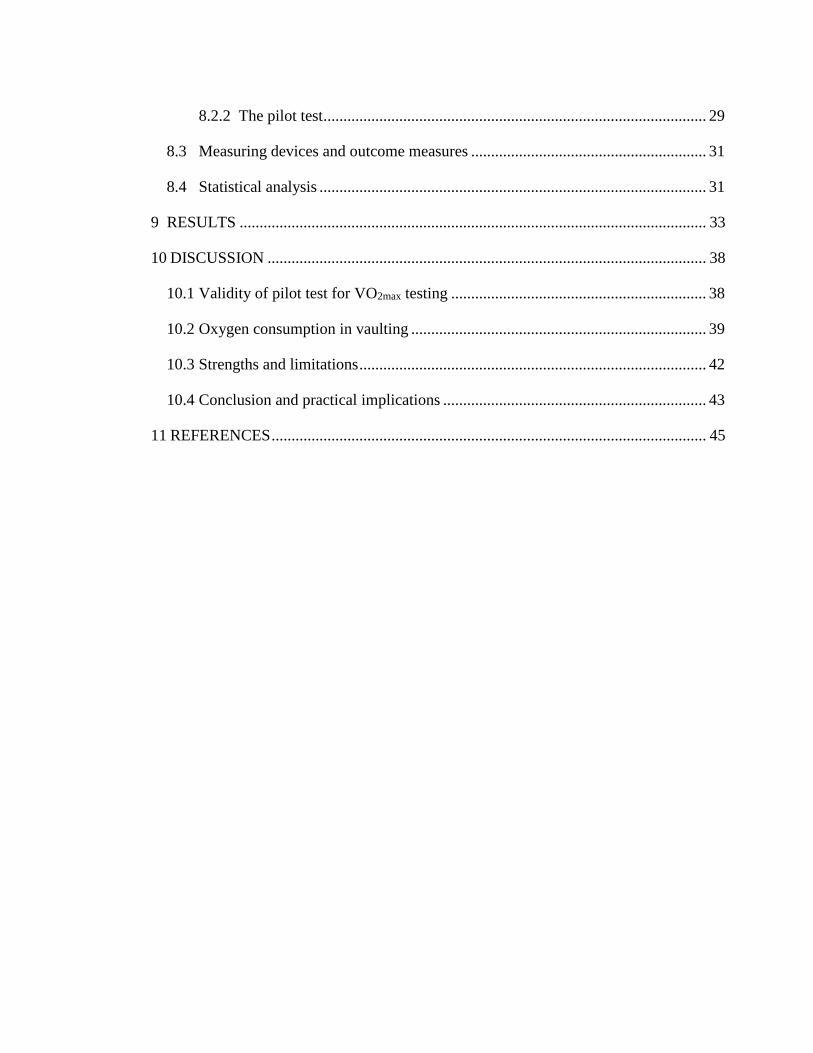
individual variability (see Figure 3). Age, sex and fitness level affect stroke volume function
during exercise. Stroke volume can either reach a classical plateau, plateau with a subsequent
drop, plateau with a subsequent rise or gradual increase.
FIGURE 3: Four different types of stoke volume responses with increasing exercise intensity
(Vella & Robergs 2005).
Peripheral mechanisms for maintaining VO2 during exercise are thought to be complementary
to cardiac output (Beltz et al. 2016). Montero et al. (2015) did a meta-analysis on a-vO2diff and
its attribution to VO2max. They found out that after endurance training intervention increase of
17
Qmax was linearly correlated with increase of VO2max, however changes in a-vO2diff did not
correlate with changes in VO2max. In case of longer interventions (12-13 weeks), the results
showed significant increase in a-vO2diff whereas shorter interventions (5-8 weeks) did not seem
to affect a-vO2iff. The researchers carried on to conclude that peripheral factors are adapting to
increase in cardiac output, but are not responsible for increases in VO2max.
4.3 Adaptations to training
Large physiological differences can be observed between untrained and endurance trained men.
On the level of muscle cells, McArdle et al. (2010, 457) have described the differences: in
comparison to untrained men the endurance trained men have larger glycogen storages (41%)
and more mitochondria (103%), ATP (100%), phosphocreatine (64%), glycolytic enzymes
(60%) and aerobic enzymes (133%). In addition, endurance trained men have larger stroke
volume (50%), larger cardiac output (75%), lower resting heart rate (-43%), lower maximal
heartrate (-5%), increased heart volume (27%) and blood volume (28%) compared to untrained
men. These all result to higher VO2max (107%) in trained men.
Adaptations in peripheral factors do not seem to be the bottle neck in endurance performance
(Bassett & Howley 2000). However, adaptations in cardiac output, especially stroke volume,
seem to be of utmost importance in regards to endurance performance (Blomqvist & Saltin
1983). To increase stroke volume, not only size of the left ventricle has to grow, but there also
needs to be larger supply of blood to accompany the increased pumping capability. Sawka et
al. (2000) concluded in their review article that endurance training increases blood volume,
blood plasma volume and erythrocyte volume by 10% within 30 days of endurance training.
They pointed out a significant correlation between total blood volume and VO2max.
Another adaptation to training happens in capillaries. Capillary density increases in peripheral
muscles as a result of endurance training (Andersen & Henriksson 1977; Brodal et al. 1977).
Capillary density is thought to affect VO2max by elongating mean transit time and decreasing
peripheral resistance (Bassett & Howley 2000).
18
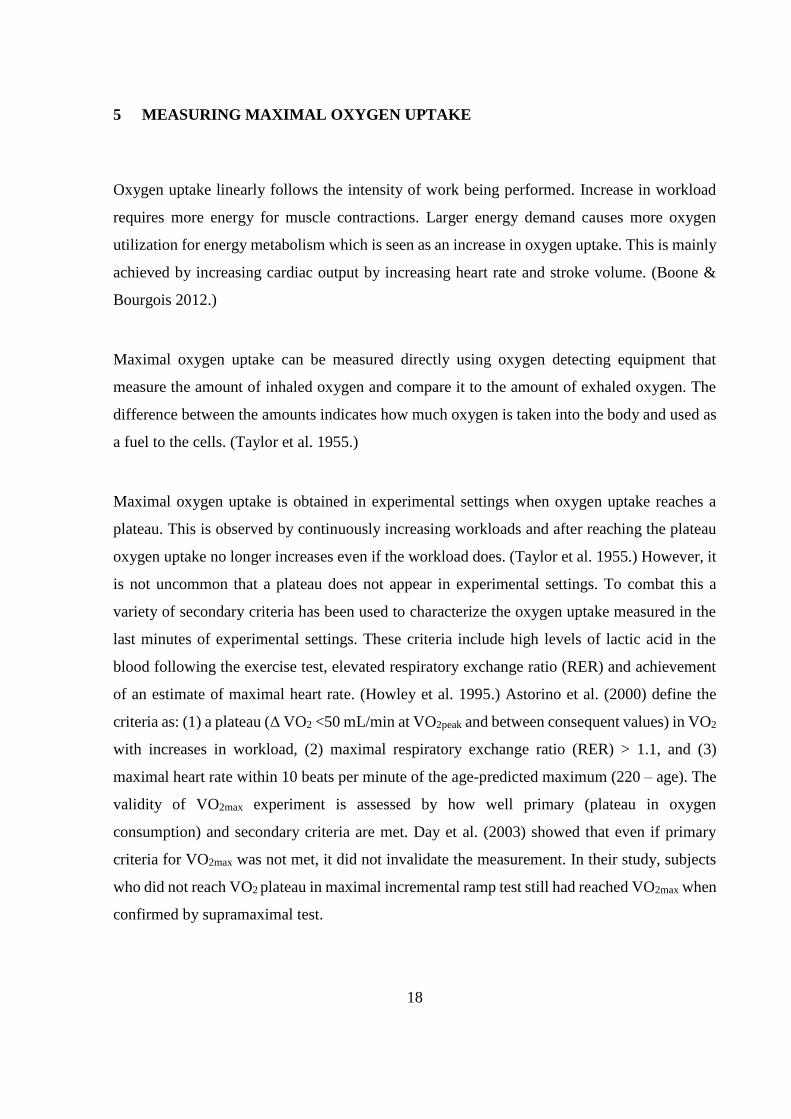
5 MEASURING MAXIMAL OXYGEN UPTAKE
Oxygen uptake linearly follows the intensity of work being performed. Increase in workload
requires more energy for muscle contractions. Larger energy demand causes more oxygen
utilization for energy metabolism which is seen as an increase in oxygen uptake. This is mainly
achieved by increasing cardiac output by increasing heart rate and stroke volume. (Boone &
Bourgois 2012.)
Maximal oxygen uptake can be measured directly using oxygen detecting equipment that
measure the amount of inhaled oxygen and compare it to the amount of exhaled oxygen. The
difference between the amounts indicates how much oxygen is taken into the body and used as
a fuel to the cells. (Taylor et al. 1955.)
Maximal oxygen uptake is obtained in experimental settings when oxygen uptake reaches a
plateau. This is observed by continuously increasing workloads and after reaching the plateau
oxygen uptake no longer increases even if the workload does. (Taylor et al. 1955.) However, it
is not uncommon that a plateau does not appear in experimental settings. To combat this a
variety of secondary criteria has been used to characterize the oxygen uptake measured in the
last minutes of experimental settings. These criteria include high levels of lactic acid in the
blood following the exercise test, elevated respiratory exchange ratio (RER) and achievement
of an estimate of maximal heart rate. (Howley et al. 1995.) Astorino et al. (2000) define the
criteria as: (1) a plateau (Δ VO2 <50 mL/min at VO2peak and between consequent values) in VO2
with increases in workload, (2) maximal respiratory exchange ratio (RER) > 1.1, and (3)
maximal heart rate within 10 beats per minute of the age-predicted maximum (220 – age). The
validity of VO2max experiment is assessed by how well primary (plateau in oxygen
consumption) and secondary criteria are met. Day et al. (2003) showed that even if primary
criteria for VO2max was not met, it did not invalidate the measurement. In their study, subjects
who did not reach VO2 plateau in maximal incremental ramp test still had reached VO2max when
confirmed by supramaximal test.
19
The validity of these secondary criteria have been questioned. It has been suggested that these
criteria do not guarantee that a true VO2max has been reached (Howley et al. 1995; Midgley et
al. 2007; Midgley et al. 2009). According to Beltz et al. (2016) review article, the critique boils
down to high inter-individual variability in meeting these criteria. This variability in attaining
VO2max criteria allows submaximal efforts to be perceived as maximal efforts, thus not
guaranteeing that true VO2max has been reached. (Beltz et al. 2016.)
Testing protocols vary between the intensity of workloads, progression of the workloads,
duration of the workloads and total test duration. Common characteristic of direct testing
protocols is that they all end in exhaustion (inability to continue testing). However, it needs to
be noted that different protocols produce different VO2max values. (Beltz et al. 2016.) Muscat et
al. (2015) measured VO2max by treadmill and cycle ergometer and the treadmill results were up
to 20% higher in comparison to cycle ergometer. Previous studies imply that the differences
occur due to running requiring higher cardiac output (Q), running involving more muscle mass
and requiring higher vascular conductance and a-vO2diff (Buchfuhrer et al. 1983; Hermansen et
al. 1970; Holmer et al. 1974; Tanner et al. 2014). These studies also suggest that in cycling,
there appears to be lower rate of carbohydrate oxidation, which leads to less acidosis. Same
phenomenon was observed in swimming by Holmer et al. (1974) in their study in which elite
swimmers performed VO2max test by both methods; swimming and running on a treadmill.
VO2max appears to be task specific and thus it is important that the testing protocol is suited to
the demands of the activity being performed.
Even the treadmill protocols vary. Pollock et al. (1976) compared four commonly used
treadmill testing protocols: Balke protocol, Bruce procotol, Ellestad protocol and modified
Åstrand protocol. These protocols differed in increases of workload. Åstrand protocol does not
alter running speed but increases the incline of the treadmill by 2.5% every 2 minutes. Balke
also maintains constant speed but increases the incline of the treadmill by 1% every minute.
Bruce protocol increases speed and grade of incline every 3 minutes. Finally Ellestad protocol
increases speed until 10 minutes’ mark is met, after which the grade of incline is increased by
5% followed by subsequent increases in speed. Pollock et al. (1976) found, that the individual
characteristics of above mentioned testing protocols, did not affect measured VO2max. However,
20
differences in obtaining VO2 plateau were shown. Plateau obtainment varied between the
protocols from 59% (Ellestad) to 80% (Åstrand) of subjects reaching VO2 plateau.
The above mentioned treadmill protocols follow stepwise increase in workload, however with
assistance of technology, it is possible to increase the workload continuously. For example,
Whipp et al. (1981) used electronically braking cycle ergometers to increase the workload
continuously as expressed by watts/min. This method of continuous increase in workload seems
to reduce error in predicting metabolic cost at individual workloads and gives higher correlation
between VO2 and the workload (Myers et al. 1991). This does not mean that incremental ramp
test is better at assessing VO2max. Zhang et al. (1991) compared incremental ramp test to more
traditional stepwise tests and found no difference between obtained VO2max.
Test protocols also vary in their duration. Buchfuhrer et al. (1983) examined protocol duration
on the achievement of VO2max. This study originated the recommendation for test duration of
8-12 minutes, based on obtaining highest VO2max values around this range. Yoon et al. (2007)
re-examined this premise and found out that protocols lasting 8-minutes were best suited for
assessing VO2max in men.
21
6 DESIGNING CARDIORESPIRATORY FIELD TEST FOR PARKOUR
In field tests, it is impractical and often impossible to use laboratory criteria whether VO2max is
reached or not. Instead, field tests are based on information derived from laboratory tests in
which a large volume of subjects have been measured. Fitness level for each subject is gained
from the laboratory test, which is used to create an average of oxygen consumption for any
given speed. Field tests check the final stage (workload) or speed that the subject achieves and
the achieved workload is checked against a point in a trend line (regression line) built from
laboratory results. This gives an approximation of the fitness level of the subject. (Ramsbottom
et al. 1988.)
6.1 Common field tests
Ramsbottom et al. (1988) correlated multi-stage fitness test (also known as the beep test or 20m
shuttle run test) to direct uphill treadmill VO2max test. They found out that multi-stage fitness
test can be used to estimate VO2max (r= 0.92, p < 0.01). Since then the validity of multi-stage
fitness test in estimating VO2max has been confirmed many times (Cooper et al. 2005; Leger &
Gadoury 1989; McVeigh et al. 1995). In addition, multi-stage fitness test has been shown to
predict endurance performance in running events (Noakes et al.1990; Scott & Houmard 1994).
Other field tests, such as, yo-yo intermittent test, cooper walk run 12-minute test and
submaximal cycle ergometer test have proven to be good predictors of VO2max (Castagna et al.
2006; Grant et al. 1995). However, predicting performance in sports requires a testing pattern
to meet the demands of the activity being performed (Castagna et al. 2006). In practice, this
means testing should take into account physiological demands of the activity, movement
patterns should be similar to the ones used during the activity and technical skills should be
included in the test patterns (Bangsbo & Lindquist 1992; Castagna et al 2006).
In multi-stage fitness test the subject runs between two markers placed 20m from each other
with increasing speeds. Speed increases 0.14m/s in step-like fashion once every minute. The
test is evaluated by based on which speed (level or stage) is obtained and how long the speed
22
can be maintained (number of shuttles). The original test by Leger and Lambert (1982) used 2-
minute duration for stage, but after revision in 1984 a standard of 1-minute duration for each
stage emerged (Leger et al. 1984). Billat et al. (1996) examined the differences between 1-
minute stages to 2-minute stages in a treadmill protocol. They found out that there was no
significant difference between the stages in the obtained VO2max nor the velocity that the VO2max
was reached. However, they proposed that shorter stage might have an advantage in
experimental settings for examining velocity at VO2max. Shorter stage duration prevents the test
from ending premature due to exhaustion or surrender by the subject. In addition, Astorino et
al. (2000) stated that for most subjects maintaining workload at VO2max or above is not feasible
for 2-3 minutes and therefore shorter sampling intervals are required for demonstration of VO2
plateau. The validity of multi-stage fitness test and its ability predict endurance performance
was the basis, which the protocol used in this thesis was built upon.
6.2 Modifying existing field tests for parkour fitness testing
For designing a field test used in this thesis, the expertise of three long term parkour coaches
and athletes were utilized. The coaches had an average of 7 years of parkour coaching (range
5-10 years) experience and more than 10 years of training experience (range 10-12 years). As
no previous scientific enquiry to parkour fitness testing has been conducted, practical
knowledge from experienced parkour coaches was used to build an understanding on the
demands of the activity.
The ground rules were established based on previous literature for intensity of workloads (Leger
et al. 1984, Leger & Lambert 1982), duration of workloads (Billat et al. 1996; Leger et al. 1984)
and hypothesized test duration (Billat et al. 1996; Buchfuhrer et al. 1983). For the pilot protocol,
distance between obstacles (for convenient gait), the height of the obstacles (so that good
vaulting technique could be easily applied) and acceleration/deceleration distance from the
obstacles was designed based on expertise from the coaches. The aim was to closely simulate
the demands of the sport, which according to Castagna et al. (2006) and Bansgbo and Lindquist
(1992) is a requirement for assessing endurance performance for the specific sport.
23
7 THE PURPOSE OF THE STUDY
Before conducting this study, there has not been any physiological research for parkour
movement. This study serves as a pilot for a field test aimed to assess parkour athletes’ VO2peak.
The aim was to develop a field test protocol suitable for assessing parkour athletes’
cardiovascular fitness. A field test is a useful tool for coaches and athletes alike. The purpose
is to understand the underlying physiology of parkour, but not to categorize or define parkour
movement.
From a physiological perspective, measuring VO2 consumption during parkour movement (in
this case vaulting) at different speeds was the main focus. This will increase the understanding
of how demanding vaulting is at different velocities. Hopefully this will help parkour
practitioners and coaches to better plan their exercise so that it actually improves performance.
Research questions are as follows:
1. Does the field test protocol provide a valid measurement of VO2peak for vaulting?
Subjects are expected to achieve VO2max, as confirmed by meeting VO2max testing criteria
defined by previous studies (Astorino et al. 2000; Howley et al. 1995). The following criteria
will be achieved: a plateau in VO2, high lactate values (≥ 8), above 1.1 RER, maximal heart rate
and voluntary exhaustion.
2. Do the results of the pilot-test validate the testing protocol?
Previous literature describes optimal testing protocols to last between 8-12 minutes (Buchfuhrer
et al. 1983; Yoon et al. 2007). Here the test duration until exhaustion is compared to this
recommendation. Billat et al (1996) found that an accurate resolution in VO2 sampling is
dependent on small increments in workload and optimal workload duration. They suggested an
optimal workload duration to be 1 minute and workload increment 0.5 km/h. The pilot protocol
24
of the present study was adapted to suit this recommendation. Here it is investigated if these
parameters produce an accurate estimation for VO2.
3. What kind of regression line is produced from oxygen consumption in relation to velocity?
How steep is the slope and is the increase in oxygen consumption in relation to velocity linear?
Previous studies on running suggest that oxygen consumption increases linearly when the
velocity increases and a regression line can be used to predict oxygen consumption on a given
speed (for a review, see Leger & Mercier 1984). Leger and Mercier (1984) found that in running
the average steepness of regression line is 3.163. Here it is investigated if the regression line
obtained for vaulting is similar to studies on running. The slope is excepted to be linear in
vaulting, but it is expected that oxygen consumption is higher for any given speed in parkour
when compared to running, because of higher energy demand of vaulting.
25
8 METHODS
8.1 Subjects
The subjects were recruited from all over Europe. Inclusion criteria for this study was at least
five years of parkour practice with average of two training session of parkour in a week. These
inclusion criteria were placed to make sure that the subjects would meet the sport specific
requirements and be able to push themselves to exhaustion on the obstacle course VO2max test.
To ensure the best quality of subjects, the research team organized recruitment of subjects with
Finnish Parkour Association. Finnish Parkour Association held an annual parkour event of year
2015, in which coaches were recruited from all over the Europe. The coaches volunteered for
this study, and they were available for the sole purpose of research for one day.
Ten male volunteer subjects participated in this study. They were between 18 to 32 years of age
(mean age 26.3 ± 4.2). Their height varied between 171 cm to 194 cm and their weight was
between 63 kg and 87 kg. The subjects had the right to terminate the test at any given time and
also the right to refuse some parts or all of the testing. Before the VO2max test to voluntary
exhaustion, the subjects were briefed about the testing protocols and what data was collected
from them. The subjects gave an informed consent to participation. In addition, they were
advised to avoid excessive physical activity for two days prior to testing.
8.2 Testing protocol
8.2.1 Desiging the protocol
There were several key factors when designing the testing protocol for oxygen consumption in
vaulting. Firstly, the safety of the subjects was of utmost importance. To accommodate the need
for safety, we had to make sure that subjects were of adequate skill level in the sport to ensure
a safe completion of the obstacle course. In addition, the measuring equipment was tested so
26
that it did not hinder a safe completion of the test and surrounding area from the test
environment was cleaned from all obstructions.
Secondly, the testing was limited to one day, due to availability of participants being limited to
one day. This prevented additional tests to be performed on different days, like a treadmill
running test to exhaustion, which would have brought a greater understanding of energy
demands of vaulting. Due to the nature of this unique opportunity (access to top level parkour
athletes), it was also decided that concurrent tests would be done on the subjects while doing
the test to a voluntary exhaustion. Concurrent tests involved biomechanical examination of
vaulting at different speeds. This was accomplished by 3d motion capture tools and force plates
that monitored jumping forces and landing forces from the obstacles. As a part of another
research project conducted on the same day, the subjects had to undergo three maximal speed
runs through the obstacle course before the test to a voluntary exhaustion. To mitigate the
fatigue caused by this, the subjects had 15 minutes break before starting the test to voluntary
exhaustion. In addition, after the test to voluntary exhaustion the subjects were taken blood
lactate and after ten minutes, the subjects did one more maximal speed runs through the obstacle
course. This designed allowed to see effects of fatigue in both maximal speed of the subjects
and in vaulting technique. In this thesis, only the results from the test to a voluntary exhaustion
is reported.
The voluntary test to exhaustion was modified from 20m shuttle-run test. Starting speed of the
test was decided to be 6 km/h to make sure the test would start below lactate threshold 1.
Increases in speed were kept the same as in 20m shuttle-run test. Each individual speed was
maintained for at least one minute. Each speed consisted of at least two shuttles. If a shuttle was
unfinished before the one-minute mark, the speed was maintained until 50 meters’ shuttle was
completed. In field testing environment, it is impractical or impossible to increase running
speed in the middle of a shuttle, so before increasing speed the subject must finish whole shuttle.
Therefore, stage duration was not constant due to nature of the field test. Stage duration and
corresponding number of shuttles are presented in Table 1.
27
Increase in workload was more troublesome, as it was unclear how large increments of
workloads are suitable in vaulting. In the end, it was decided that the increase in workload
should be done similarly to 20m shuttle-run test and increase of 0.5km/h for each stage was
decided on. However, increase in workload might or might not be linear with this testing
protocol, because as the speed increases, the subjects have more obstacles to vault during each
stage. Unlike 20m shuttle-run test, in this protocol a 50m shuttles were used. This allowed for
more obstacle to be placed in each shuttle, instead of just having one in the middle of 20m track.
In addition, this allowed for acceleration phase before first obstacle in each shuttle and
deceleration phase after the last obstacle in each stage. After pre-piloting the obstacle course
with expert parkour coaches, five obstacles were observed to work well in a 50m shuttle. Five
obstacles placed evenly along the course allowed for examination of gait characteristics and
provided enough variation from regular running tests. Five obstacles allowed for measuring
oxygen consumption in vaulting.
After deciding the starting speed, increases of speed and the shuttle distance, an audio cue was
required so that the subjects could pace their movement. Audio track was made with cues to
start each shuttle and cues for each obstacle to keep even pace.
28
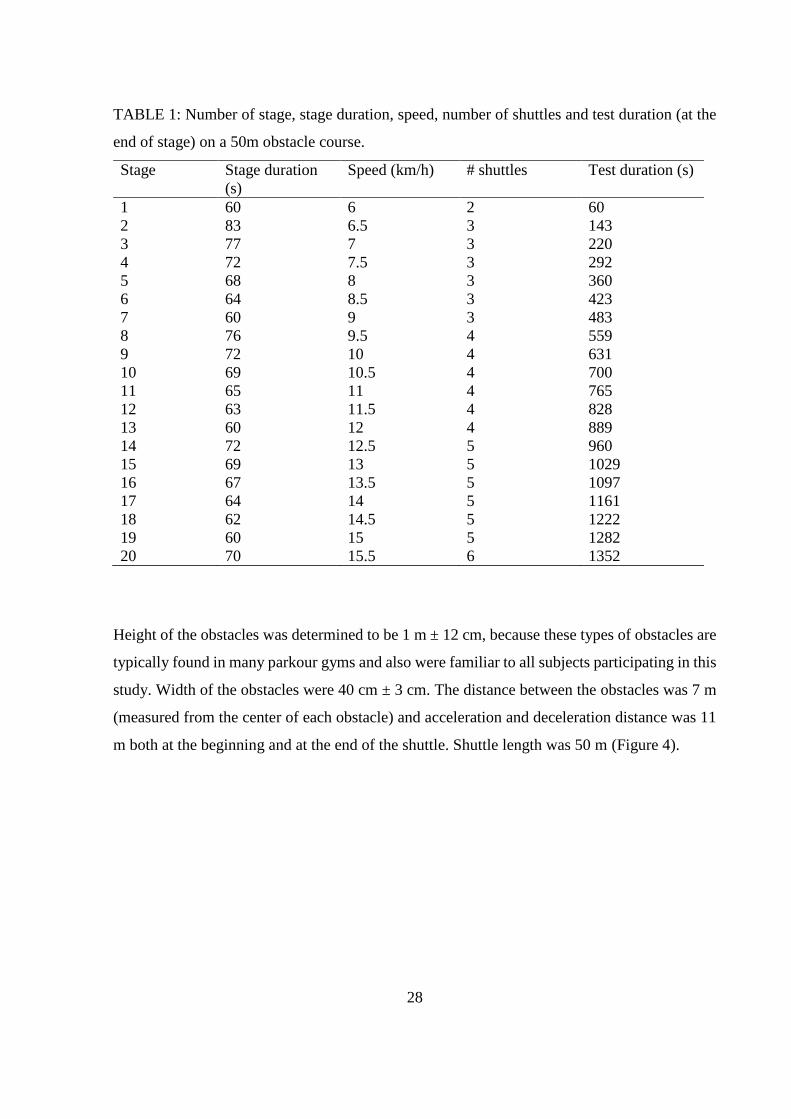
TABLE 1: Number of stage, stage duration, speed, number of shuttles and test duration (at the
end of stage) on a 50m obstacle course.
Stage Stage duration
(s)
Speed (km/h) # shuttles Test duration (s)
1 60 6 2 60
2 83 6.5 3 143
3 77 7 3 220
4 72 7.5 3 292
5 68 8 3 360
6 64 8.5 3 423
7 60 9 3 483
8 76 9.5 4 559
9 72 10 4 631
10 69 10.5 4 700
11 65 11 4 765
12 63 11.5 4 828
13 60 12 4 889
14 72 12.5 5 960
15 69 13 5 1029
16 67 13.5 5 1097
17 64 14 5 1161
18 62 14.5 5 1222
19 60 15 5 1282
20 70 15.5 6 1352
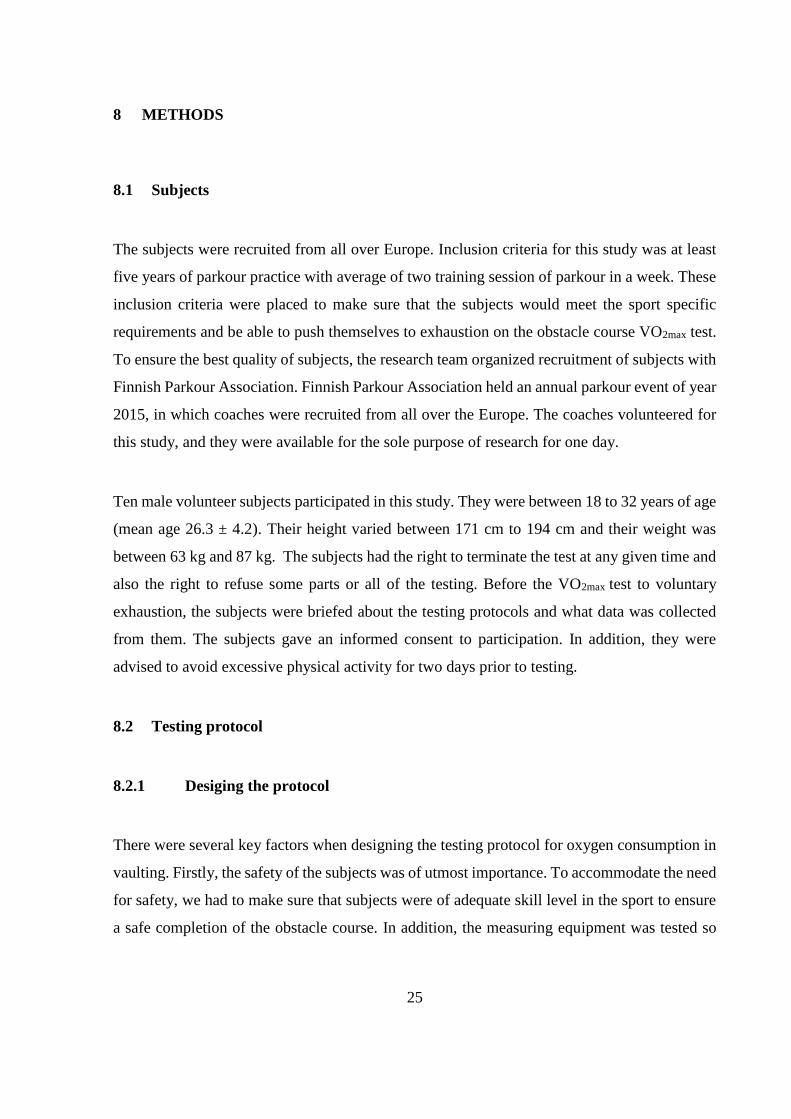
Height of the obstacles was determined to be 1 m ± 12 cm, because these types of obstacles are
typically found in many parkour gyms and also were familiar to all subjects participating in this
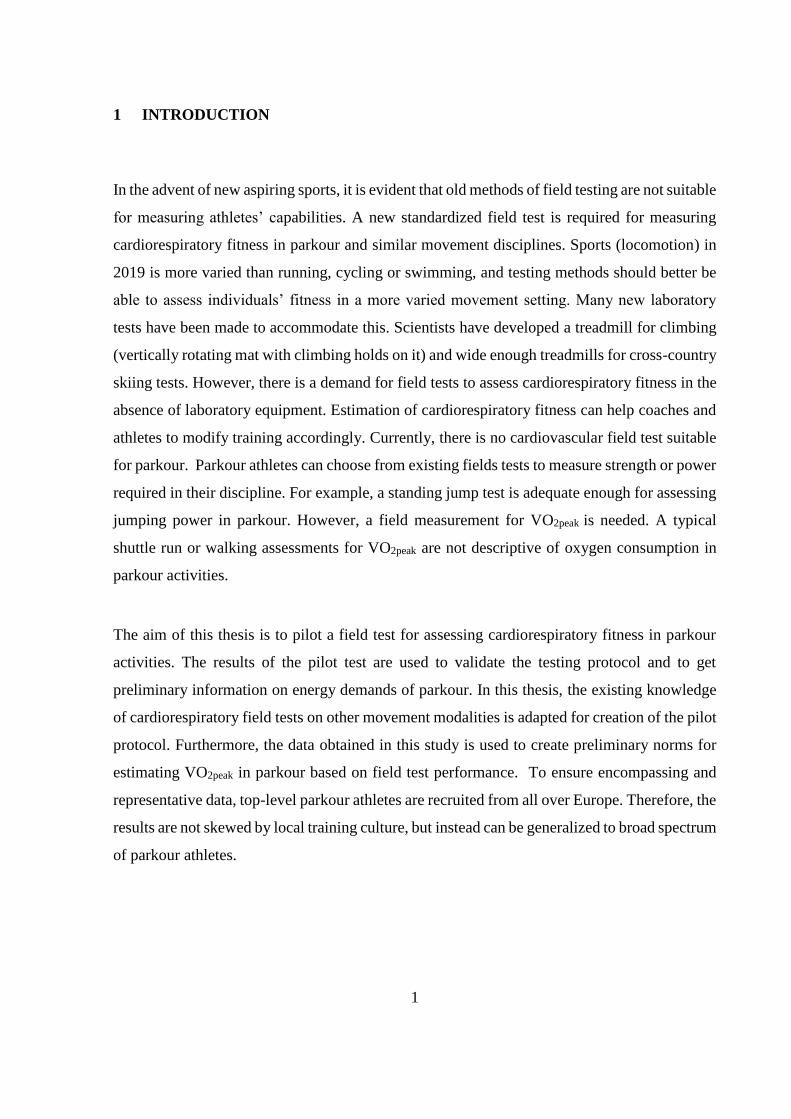
study. Width of the obstacles were 40 cm ± 3 cm. The distance between the obstacles was 7 m
(measured from the center of each obstacle) and acceleration and deceleration distance was 11
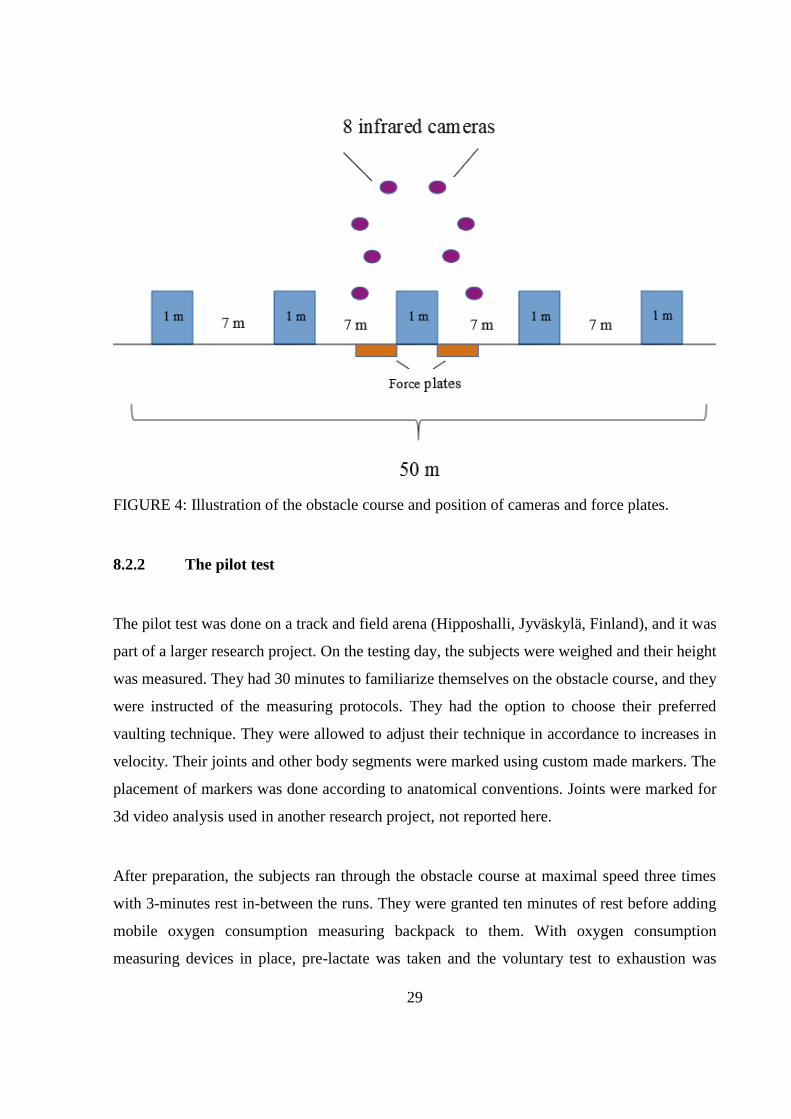
m both at the beginning and at the end of the shuttle. Shuttle length was 50 m (Figure 4).
29
FIGURE 4: Illustration of the obstacle course and position of cameras and force plates.
8.2.2 The pilot test
The pilot test was done on a track and field arena (Hipposhalli, Jyväskylä, Finland), and it was
part of a larger research project. On the testing day, the subjects were weighed and their height
was measured. They had 30 minutes to familiarize themselves on the obstacle course, and they
were instructed of the measuring protocols. They had the option to choose their preferred
vaulting technique. They were allowed to adjust their technique in accordance to increases in
velocity. Their joints and other body segments were marked using custom made markers. The
placement of markers was done according to anatomical conventions. Joints were marked for
3d video analysis used in another research project, not reported here.
After preparation, the subjects ran through the obstacle course at maximal speed three times
with 3-minutes rest in-between the runs. They were granted ten minutes of rest before adding
mobile oxygen consumption measuring backpack to them. With oxygen consumption
measuring devices in place, pre-lactate was taken and the voluntary test to exhaustion was
30
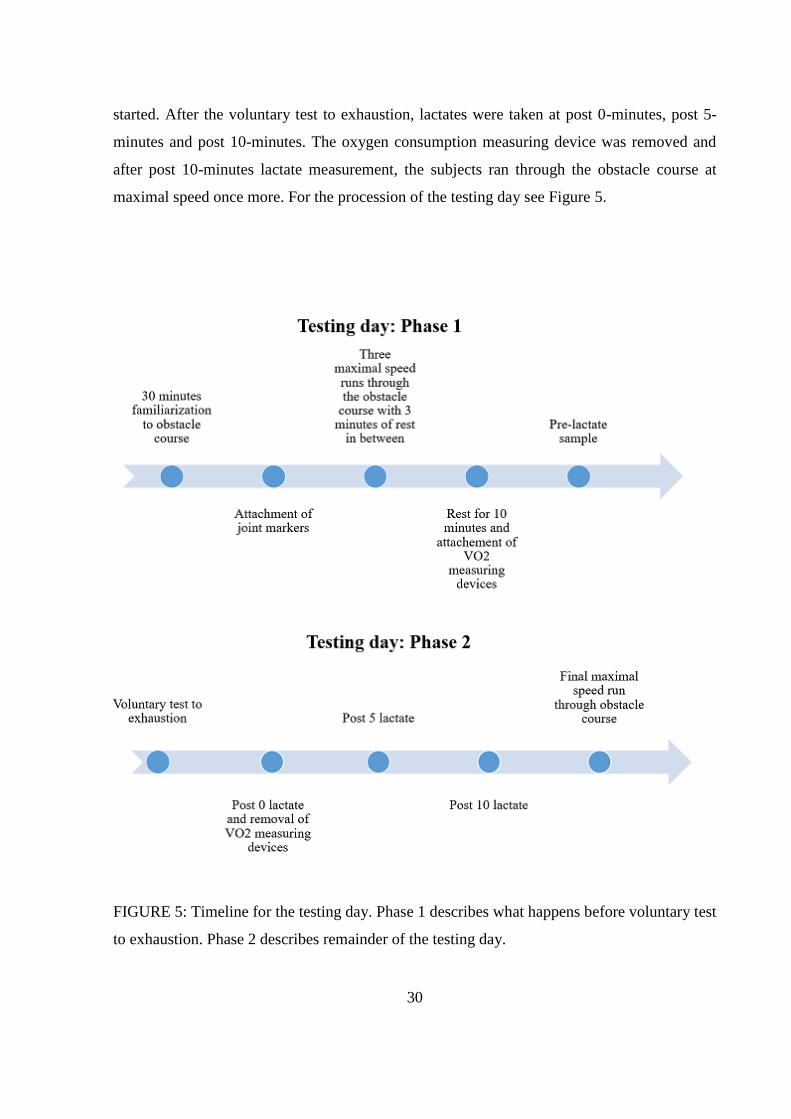
started. After the voluntary test to exhaustion, lactates were taken at post 0-minutes, post 5-
minutes and post 10-minutes. The oxygen consumption measuring device was removed and
after post 10-minutes lactate measurement, the subjects ran through the obstacle course at
maximal speed once more. For the procession of the testing day see Figure 5.
FIGURE 5: Timeline for the testing day. Phase 1 describes what happens before voluntary test
to exhaustion. Phase 2 describes remainder of the testing day.
31
8.3 Measuring devices and outcome measures
Oxygen consumption was measured using ergospirometer (Oxycon Mobile jaerger, Viasys
Healtcare, inc., Höchberg, Germany), which allowed for measurement of whole voluntary test
to exhaustion. Ergospirometer consists of breathing mask, which attaches to a portable breath-
by-breath data collector and wireless signal transmitter. Collector and transmitter is carried on
person in a wearable body vest. The transmitted data from the breath-by-breath data collector
is wirelessly transmitted to a computer for analysis of oxygen consumption. Before each
measurement the breathing mask and its censors were cleaned and dried, and the measuring
devices were calibrated via calibrating gas. Oxygen consumption data was averaged over time
period of 30 seconds and breath-by-breath data was not used for analysis. The highest reached
VO2-value was determined to be the VO2peak. Term VO2peak is used here to describe to maximal
obtained oxygen consumption. VO2peak is used instead of VO2max to describe obtained results in
this study to emphasize that there is uncertainty whether the values obtained represent the true
VO2max. RER-value was obtained from breath-by-breath data, and it was averaged for each
speed for each individual. Maximal heart rate was gained from heart rate monitor (Suunto
Quest, Amer Sports, OYJ., Vantaa, Finland). Lactate samples were drawn to capillaries and
mixed into hydrolysate. Analysis of lactate samples were done on Biosen C-line Glucose and
Lactate analyzer (EKF diagnostic, Cardiff, United Kingdom). The criteria for obtaining VO2max
was based on previous studies: I) a plateau (fluctuations smaller than ≤1.5 ml∙kg-1 ∙min-1
between VO2peak and consequent VO2 values) in VO2, II) Maximal RER-value >1.1, III)
maximal heart rate within 10 beats per minute of age-predicted maximum (220 – age) and IV)
lactate values ≥ 8 (for review see Howley et al. 1995).
8.4 Statistical analysis
SPSS-program (version 24.0.0, SPSS, Inc., Chicago, US) was used for statistical analysis.
Means and standard deviations were calculated over the participants for oxygen consumption
and RER. A linear regression was calculated to investigate whether oxygen consumption
linearly increases with the increase of workload. Regression was calculated by fitting a
regression curve over oxygen consumption derived from all the participants and speeds. In

32
addition, a Spearman correlation was calculated between VO2 and velocity. To investigate the
anaerobic demands of the activity, a Spearman correlation was calculated between RER and
velocity. The Spearman correlation was used because the variables were not normally
distributed. For significance values lower than 0.05 were considered significant.
33
9 RESULTS
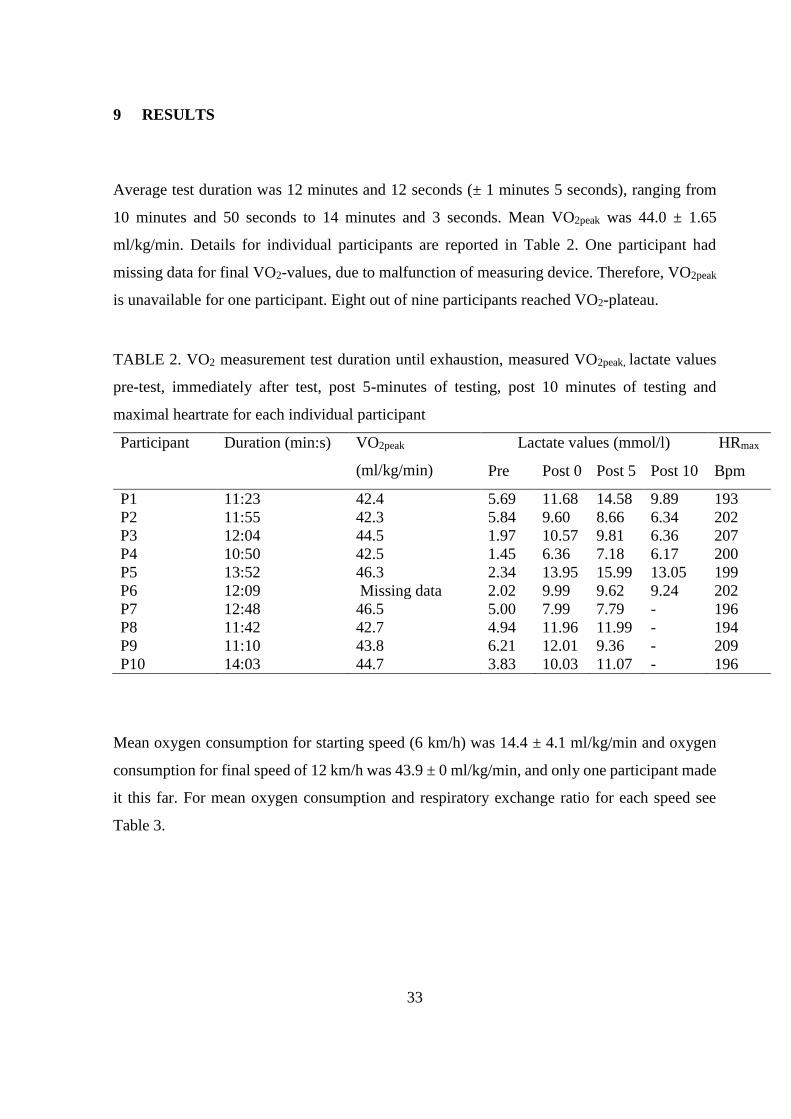
Average test duration was 12 minutes and 12 seconds (± 1 minutes 5 seconds), ranging from
10 minutes and 50 seconds to 14 minutes and 3 seconds. Mean VO2peak was 44.0 ± 1.65
ml/kg/min. Details for individual participants are reported in Table 2. One participant had
missing data for final VO2-values, due to malfunction of measuring device. Therefore, VO2peak
is unavailable for one participant. Eight out of nine participants reached VO2-plateau.
TABLE 2. VO2 measurement test duration until exhaustion, measured VO2peak, lactate values
pre-test, immediately after test, post 5-minutes of testing, post 10 minutes of testing and
maximal heartrate for each individual participant
Participant Duration (min:s) VO2peak
(ml/kg/min)
Lactate values (mmol/l) HRmax
Pre Post 0 Post 5 Post 10 Bpm
P1 11:23 42.4 5.69 11.68 14.58 9.89 193
P2 11:55 42.3 5.84 9.60 8.66 6.34 202
P3 12:04 44.5 1.97 10.57 9.81 6.36 207
P4 10:50 42.5 1.45 6.36 7.18 6.17 200
P5 13:52 46.3 2.34 13.95 15.99 13.05 199
P6 12:09 Missing data 2.02 9.99 9.62 9.24 202
P7 12:48 46.5 5.00 7.99 7.79 - 196
P8 11:42 42.7 4.94 11.96 11.99 - 194
P9 11:10 43.8 6.21 12.01 9.36 - 209
P10 14:03 44.7 3.83 10.03 11.07 - 196
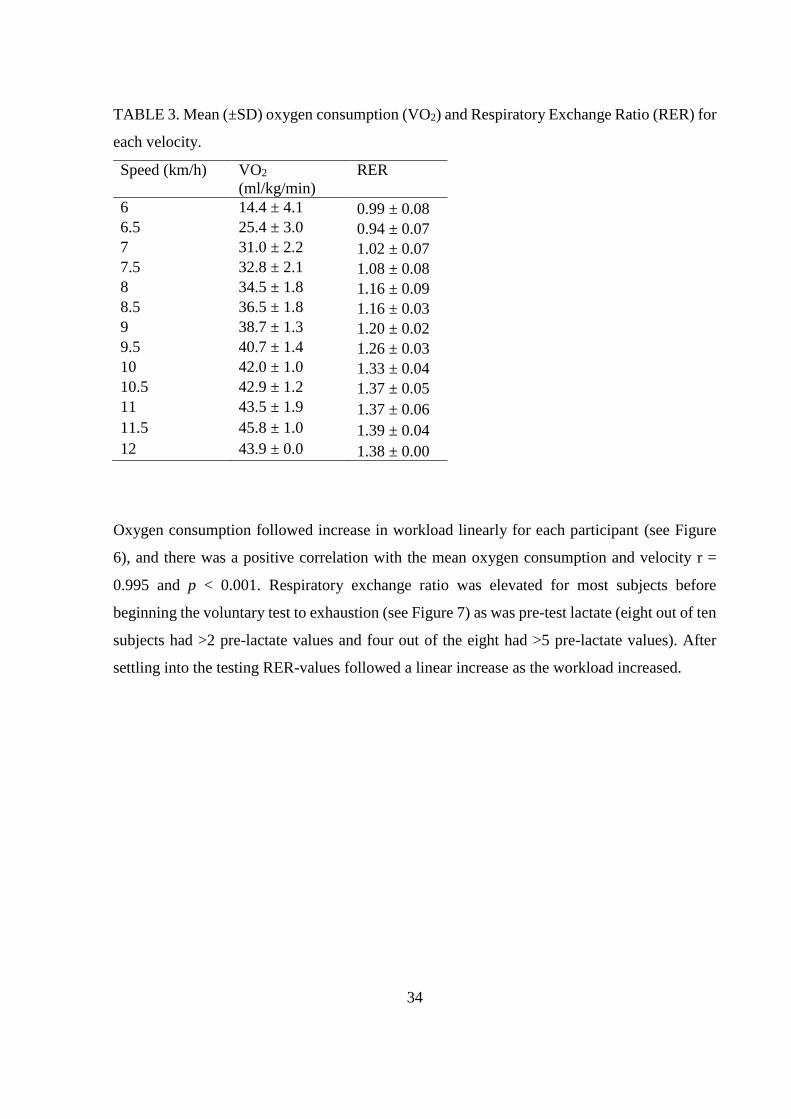
Mean oxygen consumption for starting speed (6 km/h) was 14.4 ± 4.1 ml/kg/min and oxygen
consumption for final speed of 12 km/h was 43.9 ± 0 ml/kg/min, and only one participant made
it this far. For mean oxygen consumption and respiratory exchange ratio for each speed see
Table 3.
34
TABLE 3. Mean (±SD) oxygen consumption (VO2) and Respiratory Exchange Ratio (RER) for
each velocity.
Speed (km/h) VO2
(ml/kg/min)
RER
6 14.4 ± 4.1 0.99 ± 0.08
6.5 25.4 ± 3.0 0.94 ± 0.07
7 31.0 ± 2.2 1.02 ± 0.07
7.5 32.8 ± 2.1 1.08 ± 0.08
8 34.5 ± 1.8 1.16 ± 0.09
8.5 36.5 ± 1.8 1.16 ± 0.03
9 38.7 ± 1.3 1.20 ± 0.02
9.5 40.7 ± 1.4 1.26 ± 0.03
10 42.0 ± 1.0 1.33 ± 0.04
10.5 42.9 ± 1.2 1.37 ± 0.05
11 43.5 ± 1.9 1.37 ± 0.06
11.5 45.8 ± 1.0 1.39 ± 0.04
12 43.9 ± 0.0 1.38 ± 0.00
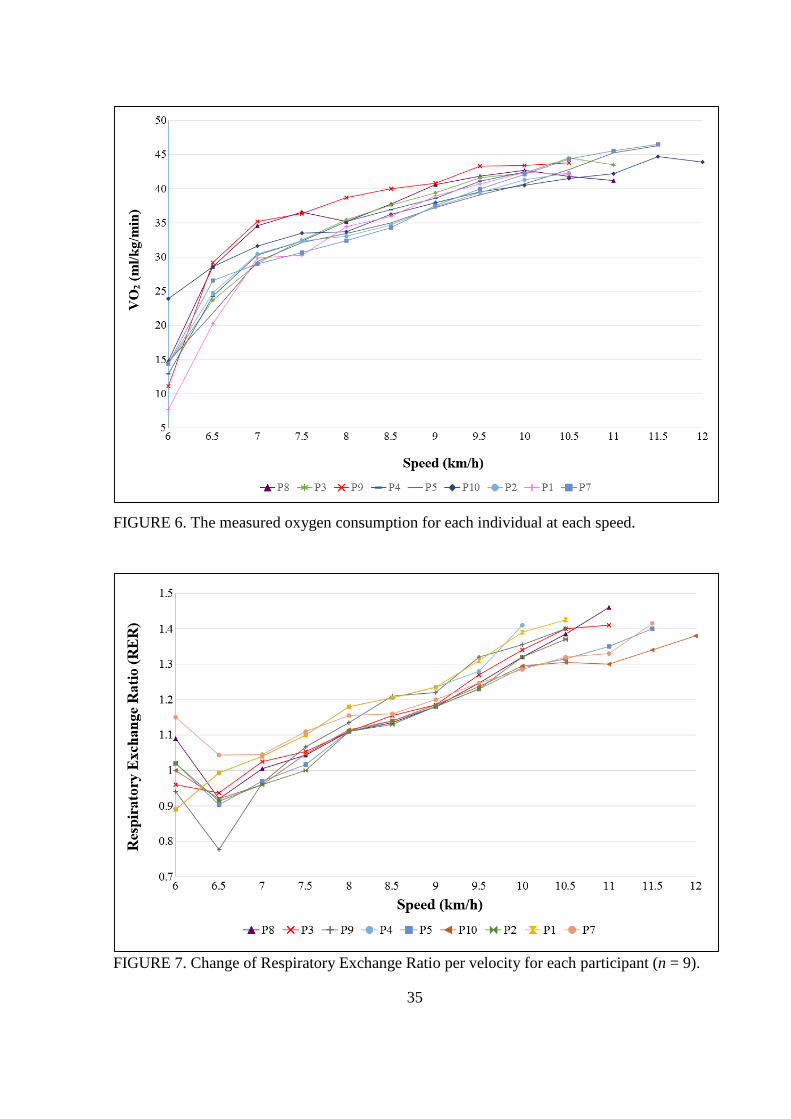
Oxygen consumption followed increase in workload linearly for each participant (see Figure
6), and there was a positive correlation with the mean oxygen consumption and velocity r =
0.995 and p < 0.001. Respiratory exchange ratio was elevated for most subjects before
beginning the voluntary test to exhaustion (see Figure 7) as was pre-test lactate (eight out of ten
subjects had >2 pre-lactate values and four out of the eight had >5 pre-lactate values). After
settling into the testing RER-values followed a linear increase as the workload increased.
35
FIGURE 6. The measured oxygen consumption for each individual at each speed.
FIGURE 7. Change of Respiratory Exchange Ratio per velocity for each participant (n = 9).
36
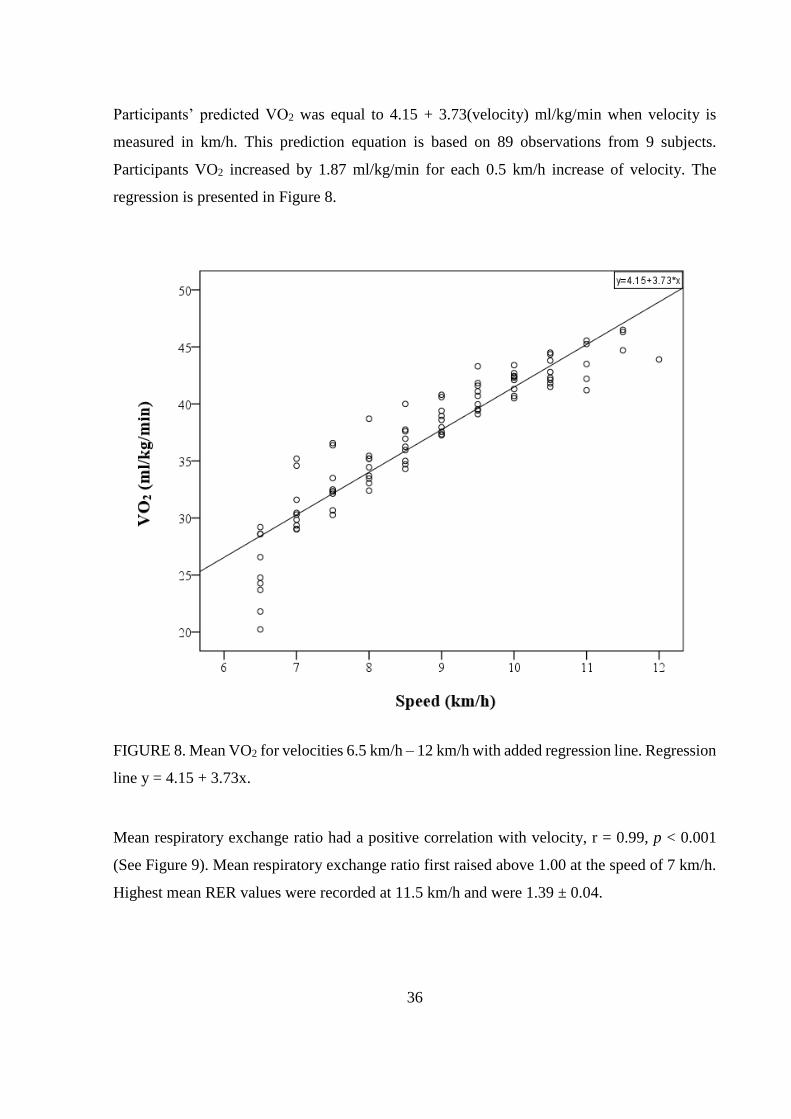
Participants’ predicted VO2 was equal to 4.15 + 3.73(velocity) ml/kg/min when velocity is
measured in km/h. This prediction equation is based on 89 observations from 9 subjects.
Participants VO2 increased by 1.87 ml/kg/min for each 0.5 km/h increase of velocity. The
regression is presented in Figure 8.
FIGURE 8. Mean VO2 for velocities 6.5 km/h – 12 km/h with added regression line. Regression
line y = 4.15 + 3.73x.
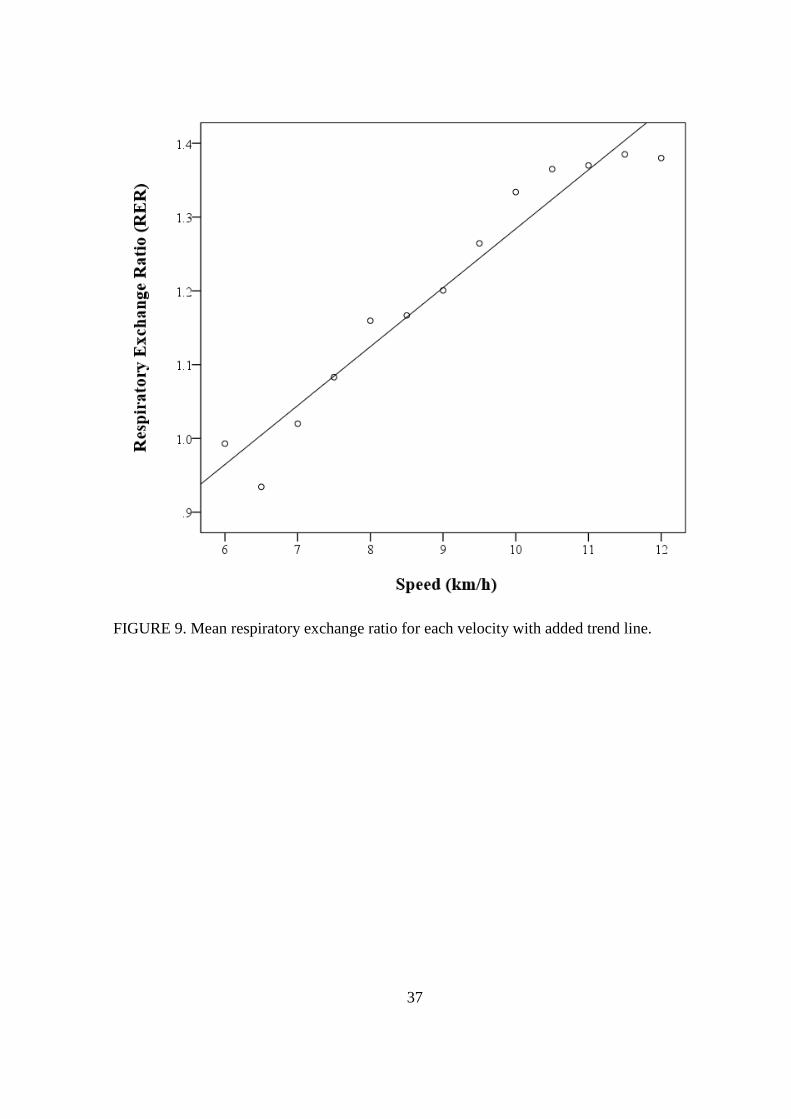
Mean respiratory exchange ratio had a positive correlation with velocity, r = 0.99, p < 0.001
(See Figure 9). Mean respiratory exchange ratio first raised above 1.00 at the speed of 7 km/h.
Highest mean RER values were recorded at 11.5 km/h and were 1.39 ± 0.04.
37
FIGURE 9. Mean respiratory exchange ratio for each velocity with added trend line.
38
10 DISCUSSION
This is the first study to examine cardiovascular fitness in parkour athletes on an obstacle
course. The main finding indicated that the pilot protocol was suitable for VO2max testing as
validated by the achievement of traditional VO2max criteria. The study deepens the
understanding of how movement modality is reflected in energy metabolism, since aerobic
capacity is rarely tested in other activities besides running. Previous studies employing different
testing protocols, have shown that VO2max is task specific (Buchfuhrer et al. 1983; Hermansen
et al. 1970; Holmer et al. 1974; Tanner et al. 2014) and thus it is important to develop testing
protocols to suit different tasks. In addition, preliminary norms were obtained for estimating
VO2max based on vaulting performance on an obstacle course.
10.1 Validity of pilot test for VO2max testing
In the pilot test, all subjects reached maximal heart rate and RER values above 1.1. In addition,
8 out of 9 subjects reached post-test lactate values ≥ 8. Furthermore, 8 out of 9 subjects (89%)
reached a plateau in oxygen consumption, as defined by a change less than ≤1.5 ml∙kg-1 ∙min-1.
Meeting these criteria indicates that VO2max was achieved in the pilot test (Docherty et al. 2003;
Howley et al. 1995). The appearance of plateau in this high percentage of subjects is
uncommon. Froelicher et al. (1974) report as low as 7-33% of tests to voluntary exhaustion
ending in a plateau in running when comparing different testing protocols. More recently,
Edvardsen et al. (2014) measured 861 subjects to voluntary exhaustion and found out that in
only 42% of tests a plateau in oxygen consumption was reached. One explanation for the results
of the pilot test could be that in this study a short sampling interval (30s) was used and it might
have proved to be beneficial for obtaining VO2 plateau as suggested by Astorino et al. (2000).
However, according to Beltz et al. (2016) an existence of plateau in oxygen consumption is an
inconsistent phenomenon and thus its validity as a VO2max criteria can be questioned.
However, these results should be interpreted with caution. It is unclear whether acidosis from
vaulting over the obstacles prevented the subjects from reaching their true capabilities of
oxygen consumption. Acidosis has been shown to hinder energy metabolism, by inhibiting
39
glycolysis and thus resulting in less substrates for oxidative phosphorylation (Dietl et al. 2010;
Heisler 2004; Suleymanlar et al. 1992). Increased metabolic acidosis has also been linked to
peripheral fatigue, which in turn could also terminate the test before true VO2max has been
reached (Robergs 2001a).
The mean test duration was 12 minutes and 12 seconds, which is approximately within 8-12
minutes as suggested by Buchfuhrer et al. (1983) to be the best length for measuring maximal
oxygen uptake. This indicates that the starting speed of 6 km/h suited this set of subjects
perfectly. However, a higher starting speed would be more appropriate for subjects that are
known to be in good cardiovascular fitness level. It must also be noted that RER values
increased rapidly to a level above 1.0. In some subjects this happened already at the second
workload (speed 7 km/h). Therefore, to make sure there is an aerobic phase in the testing
protocol, a starting speed of 6 km/h is recommended based on these results. Duration for each
workload, 1-minute to 1.5-minutes, was within good testing protocol parameters as suggested
by Billat and Koralsztein (1996).
The increment for the increase in workload was 0.5km/h which resulted in average VO2 increase
of 1.87 ml/kg/min. This step increment was recommended by Billat and Koralsztein (1996) to
obtain good accuracy in determining VO2max in running. The obtained resolution is very precise
indicating that the increment was suitable for vaulting. In contrast, if a very large VO2 increase
would have been found, it could indicate too sharp increase in the workload and therefore
imprecise VO2peak measurement. However, if the increase were smaller than 1.05 ml/kg/min for
0.5 km/h increase in speed, the result could be mistaken for plateau in oxygen consumption,
even though the subjects could still increase their oxygen consumption (Taylor 1955).
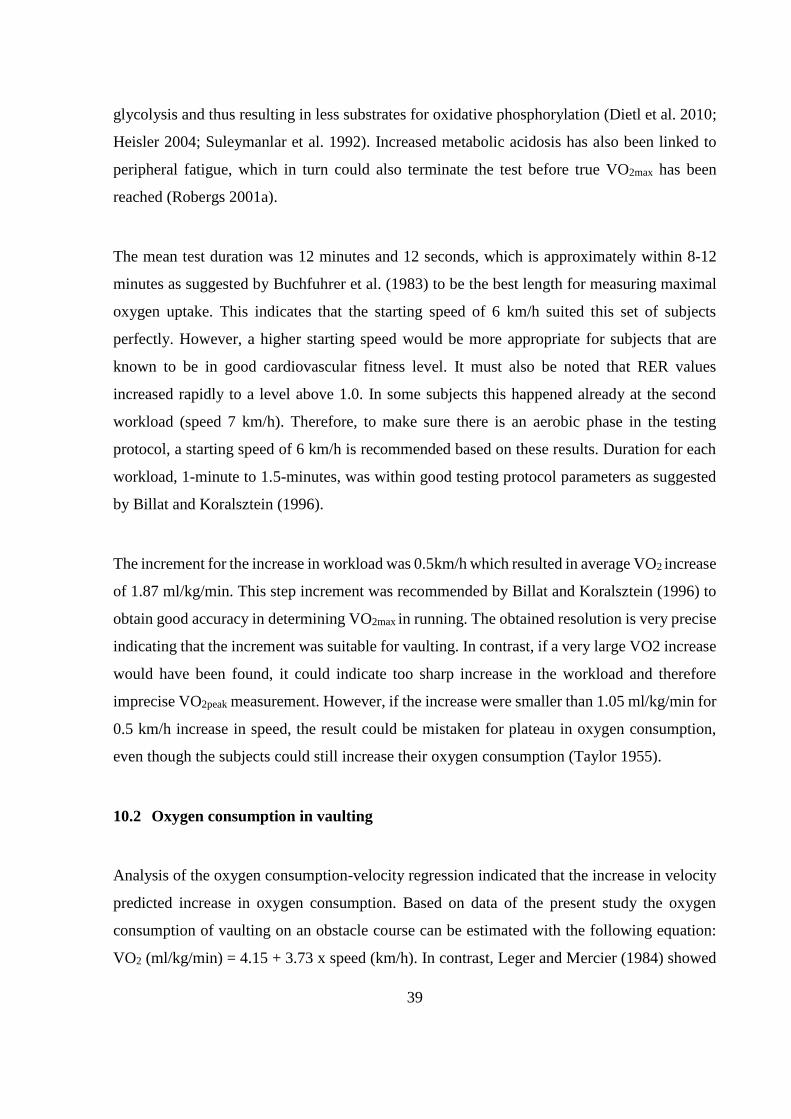
10.2 Oxygen consumption in vaulting
Analysis of the oxygen consumption-velocity regression indicated that the increase in velocity
predicted increase in oxygen consumption. Based on data of the present study the oxygen
consumption of vaulting on an obstacle course can be estimated with the following equation:
VO2 (ml/kg/min) = 4.15 + 3.73 x speed (km/h). In contrast, Leger and Mercier (1984) showed
40
that in running, the oxygen consumption can be estimated with the formula VO2 (ml/kg/min) =
2.209 + 3.163 x speed (km/h). The slope of the increase seems to be similar in vaulting and
running. However, the larger constant in the equation of vaulting, indicates that vaulting does
indeed require more oxygen than running at the same speed, as was expected. The differences
between oxygen consumption of running and vaulting is visually represented in Figure 10.
FIGURE 10. The difference between oxygen consumption at varying speed between vaulting
and running on a treadmill as presented by regression lines. Regression line for running is based
on Leger and Mercier (1984) and regression line for vaulting is based on data from present
study.
In practice, oxygen consumption of running is enhanced by additional energy demands from
vaulting the obstacles. It is likely that vaulting requires more work to be performed in
comparison to just running. Increase in workload results in linearly increased oxygen
consumption (Boone & Bourgois 2012). Comparison of oxygen consumption in vaulting to
results obtained previously from running (Leger & Mercier 1984) show that the difference
remains fairly constant even as the workload increases, which indicates that vaulting has a fixed
energy cost that is not affected by speed. However, the energy producing mechanisms of
vaulting remain unclear, as anaerobic energy metabolism was not directly measured in this
41
study. This study aimed to develop means to assess VO2peak in field environment and thus was
not suited for anaerobic power assessment. In the future, energy demands of vaulting should be
assessed separately. Data from present study seems to indicate a large demand for anaerobic
energy production. This is demonstrated by high ending lactates and more importantly quick
rise of RER values to above 1.0 (the mean RER is higher than 1.0 at speed 7.0 km/h). RER
values above 1.0 indicate that energy is being produced anaerobically (Issekutz et al. 1962).
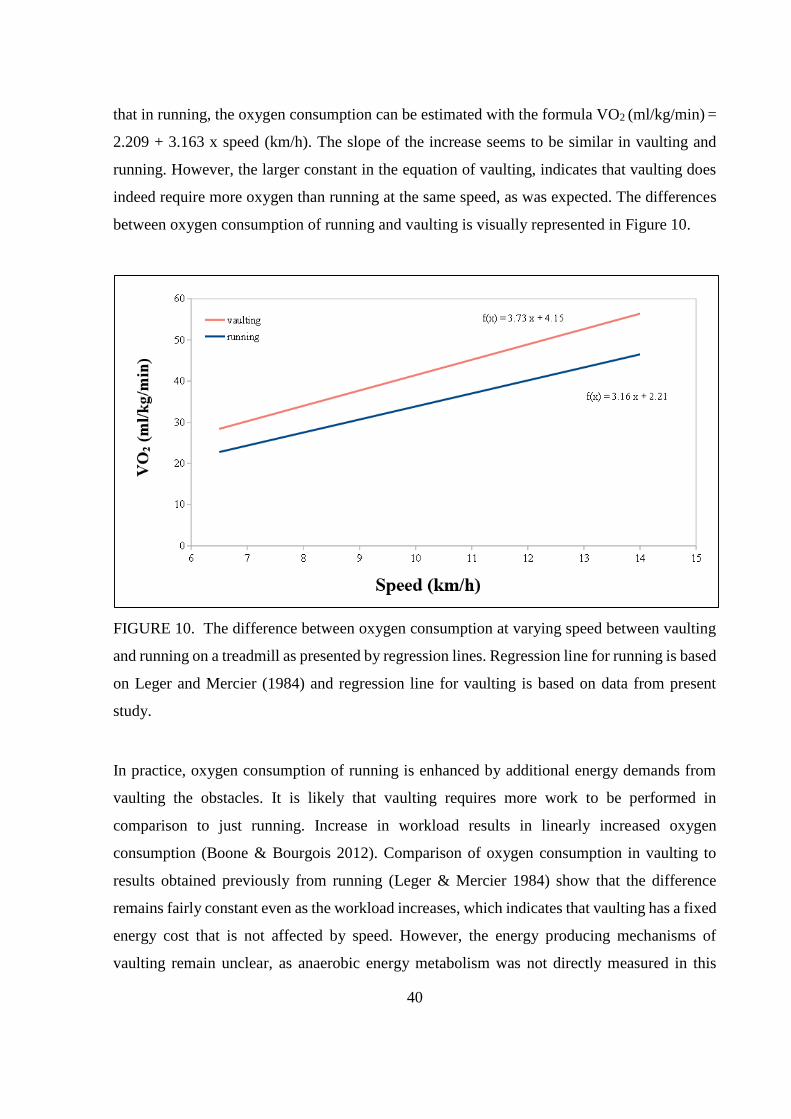
Further comparison to 20m shuttle-run test support the notion that vaulting requires more
oxygen than running at similar speeds. Leger et al. (1988) lists estimated VO2max values for each
individual speed obtained from 20m shuttle-run test (Table 4). Comparison to 20m shuttle-run
test is meaningful as the field test protocol is very similar to one used in this study, the main
difference coming from the modality of movement (vaulting over obstacles versus running).
TABLE 4. Predicted VO2max for 20m shuttle-run test derived from Leger et al. (1988) and mean
oxygen consumption for vaulting for each individual speed. Difference is calculated between
vaulting VO2 and 20m shuttle-run VO2max.
Speed (km/h) 20m shuttle-run VO2max Vaulting VO2 Difference
8.5 23.60 36.50 12.90
9 26.60 38.72 12.12
9.5 29.60 40.73 11.13
10 32.60 41.98 9.38
10.5 35.60 42.89 7.29
11 38.60 43.54 4.94
11.5 41.60 45.83 4.23
Individual variation in measured oxygen consumption in vaulting, as expressed by standard
deviation, is relatively small between the subjects. When individual regression lines were
inspected, oxygen consumption increased linearly with the increases in workload for all
subjects. This finding indicates that an averaged regression line between VO2 and speed
represent data from individual subjects quite well.

42
10.3 Strengths and limitations
This study demonstrated that VO2peak can be measured in Parkour. The designed testing protocol
produced seemingly valid measurement of individual subjects VO2peak and the obtained data
allowed the synthesis of regression line. This regression line allows for estimation of VO2max in
parkour athletes, without the need of laboratory testing equipment or expensive measuring
devices. However, this should be approached with caution, since the pilot test and subsequent
regression line suffers from small sample size. In addition, the obtained VO2peak was not
confirmed with a verification phase nor was a comparison done with results from different
testing protocols. In the future, to combat these limitations, a verification phase could be done
in addition to the pilot protocol. Verification phase could be similar to what is commonly done
in running tests (for review see Beltz et al. 2016). In practice, this would mean going through
the obstacle course at a supramaximal speed, as determined from the initial testing protocol,
and comparing the obtained VO2-values to the VO2peak obtained from the final workload from
the initial protocol. In addition, a direct comparison between another VO2max testing protocol
and this pilot protocol should be done. This kind of comparison would result in greater
understanding of how the energy demands vary in parkour compared to running.
The study was also limited to measuring oxygen consumption. To better understand the energy
demands of vaulting, a testing protocol that takes into account anaerobic energy production
should be designed.
In future, the pilot protocol needs to go through series of scrutiny. This involves, doing the test
for a large population of parkour athletes and more direct comparisons to other testing
protocols. Furthermore, to ensure the reliability of the protocol, the same test should be repeated
with same individuals on different occasions. Also differences between individual subjects
could be illustrated for example by analyzing their economy of vaulting or conducting maximal
anaerobic power test. It is possible that the economy and efficiency of vaulting varies greatly
between subjects and therefore, the obtained velocity in the pilot protocol could be affected by
other factors than VO2max.

43
Due to being part of a bigger research project, the subjects did not start the pilot protocol totally
recovered. Prior to pilot protocol the subjects completed three maximal speed runs through the
obstacle course, after which the subjects had 15 minutes of rest before starting the pilot protocol.
Subjects showed signs of insufficient recovery before testing, as demonstrated by elevated
resting lactate and RER-values However, as the testing started the oxygen consumption
stabilized to a steady-state and RER-values dropped to aerobic range. Due to these factors, it
can be concluded that the prior exhaustion did not play a major role in the results of the VO2max
test.
The pilot protocol was planned in detail based on previous literature and ethical considerations.
The testing was conducted with high safety standards, which guided subject recruitment and
obstacle course design. For example, only experienced athletes were recruited to minimize
hazardous accidents during testing. In addition, the athletes were briefed thoroughly and they
had time to practice on the obstacle course prior to testing.
10.4 Conclusion and practical implications
The study showed that oxygen consumption can be measured in a field test with parkour
movement. However, the oxygen consumption captures only one aspect of energy demands in
parkour movement while anaerobic energy production and its contribution to parkour
performance remains unclear. The protocol used in this thesis describes a very simple parkour
movement (vaulting or going over obstacles), future protocols should aim to incorporate
climbing, jumping, change of direction and other unique movements typical to parkour. Doing
this would grant a better approximation what energy metabolism is actually like during bouts
of parkour practice.
The subjects in this thesis were recruited from all over Europe, therefore representing athletes
from various training cultures. Surprisingly, there was not much individual variation in oxygen
consumption. Overall the athletes in this study portrayed mediocre to good cardiovascular
fitness and they were not in excellent endurance shape as could have been expected based on a
long training history in parkour. The subjects had at least 5 years of parkour experience and in
44
this case their practice had not made them elite endurance athletes. Therefore, if the aim for
parkour athlete is to improve physical performance in all its aspects, it can be suggested that
practitioners should train cardiovascular fitness separately from regular training. Regular
parkour training does not seem to induce endurance adaptations beyond a certain point.
However, all subjects were highly motivated and achieved exhaustion in the pilot testing. This
could indicate familiarity with training until exhaustion.
To further enhance the understanding on limiting factors in parkour movement, a new testing
protocols needs to be developed. New protocols should take into consideration lactate
measurements during the testing phases and observe at lower speeds whether a steady state of
oxygen consumption is actually achieved. It is possible that even at low speeds, going over
obstacles causes anaerobic energy metabolism which could result in inability to sustain even
low speeds for long durations.
In summary, the achievement of VO2max criteria indicates that the field test protocol is well
suited for assessing cardiovascular fitness. The linear increase in oxygen consumption with
increasing velocity, suggests that the achieved final speed could be used to estimate oxygen
consumption in parkour field test. The observation that oxygen consumption was high for any
given speed, indicates that vaulting requires more oxygen than what is usually observed in
running at similar speeds. Results also indicate a large demand for anaerobic energy production
in vaulting, even at low speeds
45
11 REFERENCES
Allen, D. G. & Kentish, J. C. 1985. The cellular basis of the length-tension relation in cardiac
muscle, Journal of Molecular and Cellular Cardiology 17 (9), 821–840.
Allen, D. G., Lamb, G. D. & Westerblad, H. 2008. Skeletal muscle fatigue: cellular
mechanisms. Physiological reviews 88 (1), 287-332.
Allen, D. G. & Trajanovska, S. 2012. The multiple roles of phosphate in muscle
fatigue. Frontiers in physiology, 3, 463.
Andersen, P. & Henriksson, J. 1977. Capillary supply of the quadriceps femoris muscle of man:
adaptive response to exercise. The Journal of Physiology 270 (3), 677-690.
Andersen, P. & Saltin, B. 1985. Maximal perfusion of skeletal muscle in man. The Journal of
Physiology, 366 (1), 233-249.
Angel, J. 2011. Ciné parkour. A cinematic and theoretical contribution to the understanding of
the practice of parkour. Brunel University, Screen Media Research Centre.
Astorino, T.A., Robergs, R.A., Ghiasvand, F., Marks, D. & Burns, S. 2000. Incidence of The
Oxygen Plateau at VO2max During Exercise Testing To Volitional Fatigue. Journal of
Exercise Physiology 3 (4), 1-12.
Atkinson, M. 2009. Parkour, anarcho-environmentalism, and poiesis. Journal of Sport and
Social issues 33 (2), 169-194.
Bangsbo, J. & Lindquist, F. 1992. Comparison of various exercise tests with endurance
performance during soccer in professional players. International Journal of Sports
Medicine 13 (02), 125-132.
Barrett, K. E., Barman, S. M., Boitano, S. & Brooks, H. L. 2009. Ganong’s review of medical
physiology. 23th edition. NY. McGraw-Hill Medical.
Bassett, D. R. & Howley, E. T. 2000. Limiting factors for maximum oxygen uptake and
determinants of endurance performance. Medicine and science in sports and exercise 32
(1), 70-84.
Beltz, N. M., Gibson, A. L., Janot, J. M., Kravitz, L., Mermier, C. M. & Dalleck, L. C. 2016.
Graded exercise testing protocols for the determination of VO2max: historical perspectives,
progress, and future considerations. Journal of Sports Medicine. doi:
10.1155/2016/3968393
46
Bevegård S, Holmgren A. & Jonsson B. 1963. Circulatory studies in well trained athletes at rest
and during heavy exercise, with special reference to stroke volume and the influence of
body position. Acta Physiologica Scandinavica 57 (1-2), 26–50.
Billat, V. L., Hill, D. W., Pinoteau, J., Petit, B. & Koralsztein, J. P. 1996. Effect of protocol on
determination of velocity at VO2 max and on its time to exhaustion. Archives of
Physiology and Biochemistry 104 (3), 313-321.
Billat, L. V. & Koralsztein, J. P. 1996. Significance of the velocity at VO 2max and time to
exhaustion at this velocity. Sports Medicine 22 (2), 90-108.
Blomqvist, C. G. & Saltin, B. 1983. Cardiovascular adaptations to physical training. Annual
Review of Physiology 45(1), 169-189.
Boone, J. & Bourgois, J. 2012. The oxygen uptake response to incremental ramp exercise.
Sports Medicine 42(6), 511-526.
Brodal, P., Ingjer, F. & Hermansen, L. 1977. Capillary supply of skeletal muscle fibers in
untrained and endurance-trained men. American Journal of Physiology-Heart and
Circulatory Physiolog. 232 (6): H705-H712.
Buchfuhrer, M. J., Hansen, J. E., Robinson, T. E., Sue, D. Y., Wasserman, K.. & Whipp, B. J.
1983. Optimizing the exercise protocol for cardiopulmonary assessment. Journal of
Applied physiology 55 (5), 1558-1564.
Bunc, V., Hofmann, P., Leitner, H. & Gaisl, G. 1995. Verification of the heart rate threshold.
European Journal of Applied Physiology 70, 263-269.
Butler, N. 2017. FIG target Paris 2024 for parkour Olympic inclusion but opposition to plan
remains. Referenced 27.1.2019. https://www.insidethegames.biz.
Castagna, C., Impellizzeri, F. M., Chamari, K., Carlomagno, D. & Rampinini, E. 2006. Aerobic
fitness and yo-yo continuous and intermittent tests performances in soccer players: a
correlation study. Journal of Strength and Conditioning Research 20(2), 320.
Collins, J. A., Rudenski, A., Gibson, J., Howard, L. & O’Driscoll, R. 2015. Relating oxygen
partial pressure, saturation and content: the haemoglobin–oxygen dissociation
curve. Breathe 11(3), 194-201.
Cooper, S. M., Baker, J. S., Tong, R. J., Roberts, E. & Hanford, M. 2005. The repeatability and
criterion related validity of the 20 m multistage fitness test as a predictor of maximal
oxygen uptake in active young men. British Journal of Sports Medicine 39(4), e19-e19.
47
Crisafulli, A., Melis, F., Tocco, F., Santoboni, U. M., Frongia, F., Carta, C., Caddeo, M. &
Concu, A. 2005. Anaerobic threshold and the oxygen consumption–cardiac output
relationship during exercise. Sport Sciences for Health 1 (2), 75-80.
Day, J. R., Rossiter, H. B., Coats, E. M., Skasick, A. & Whipp, B. J. 2003. The maximally-
attainable VO2 during exercise in humans: the peak vs. maximum issue. Journal of
Applied Physiology 95 (5), 1901-1907.
De Freitas, E. 2011. Parkour and the Build Environment: Spatial Practices and the Plasticity of
School Buildings. Journal of Curriculum Theorizing, 27 (3).
Dietl, K., Renner, K., Dettmer, K., Timischl, B., Eberhart, K., Dorn, C., Hellebrand, C.,
Kastenberger, M. Kunz-Schughart, L. A., Oefner, P. J. & Andreesen, R. 2010. Lactic acid
and acidification inhibit TNF secretion and glycolysis of human monocytes. The Journal
of Immunology 184 (3), 1200-1209.
Docherty, M., Nobbs, L. & Noakes, T. D. 2003. Low frequency of the" plateau phenomenon"
during maximal exercise in elite British athletes. European journal of applied
physiology 89(6), 619-623.
Docherty, D. & Sporer, B. 2000. A Proposed Model of Examining the Interference Phenomenon
between Concurrent Aerobic and Strength Training. Sports Medicine 30 (6), 385–394.
Edvardsen, E., Hem, E. & Anderssen, S. A. 2014. End criteria for reaching maximal oxygen
uptake must be strict and adjusted to sex and age: a cross-sectional study. PloS ONE 9(1):
e85276. doi:10.1371/journal.pone.0085276.
Fabiato, A. & Fabiato, F. 1978. Effects of pH on the myofilaments and the sarcoplasmic
reticulum of skinned cells from cardiace and skeletal muscles. The Journal of
physiology 276 (1), 233-255.
Ferguson, S., Gledhill, N., Jamnik, V.K., Wiebe, C. & Payne, N. 2001.Cardiac performance in
endurance trained and moderately active young women. Medicine and Science in Sports
and Exercise 33 (7), 1114–1119.
FIG council. 2018. Main decisions from the 18th FIG Council in Istanbul. Referenced
27.1.2019 http://www.gymnastics.sport/site/news/displaynews.php?idNews=2057.
Froelicher, V., Brammell, H., Davis, G., Nogera, I., Steward, A. & Lancaster, MC. 1974. A
comparison of three maximal treadmill exercise protocols. Journal of Applied Physiology
36 (6), 720–725.
Glaister, M. 2005. Multiple sprint work. Sports Medicine 35 (9), 757-777.
48
Gledhill, N., Cox, D. & Jamnik, R. 1994. Endurance athletes' stroke volume does not plateau:
major advantage is diastolic function. Medicine and science in sports and exercise 26 (9),
1116-1121.
Grant, S., Corbett, K., Amjad, A. M., Wilson, J. & Aitchison, T. 1995. A comparison of
methods of predicting maximum oxygen uptake. British journal of sports medicine 29
(3), 147-152.
Grimby, G., Nilsson, N. J. & Saltin, B. 1966. Cardiac output during submaximal and maximal
exercise in active middle-aged athletes. Journal of Applied Physiology 21, 1150–6.
Guyton, A. C. & Hall, J. E. 2016. Textbook of medical physiology. 13th. edition. Philadelphia,
PA: W. B. Saunders Elsevier
Jürgens, K. D., Papadopoulos, S., Peters, T. & Gros, G. 2000. Myoglobin: just an oxygen store
or also an oxygen transporter? Physiology 15 (5), 269-274.
Heisler, N. 2004. Buffering and H+ ion dynamics in muscle tissues. Respiratory Physiology &
Neurobiology 144 (2-3), 161–172.
Henry, M. 2017. The Parkour Roadmap. Referenced 18.05.2019.
http://www.parkourroadmap.com.
Hermansen, L., Ekblom, B. & Saltin, B. 1970. Cardiac output during submaximal and maximal
treadmill and bicycle exercise. Journal of Applied Physiology 29 (1), 82-86.
Hoffman, P., Pokan, R., Seibert, F. J., Zweiker, R. & Schmid, P. 1997. Heart rate performance
curve during incremental cycle ergometer in healthy young male subjects. Medicine and
Science in Sports and Exercise 29, 762-768.
Holmer, I., Lundin, A. & Eriksson, B. O. 1974. Maximum oxygen uptake during swimming
and running by elite swimmers. Journal of Applied Physiology 36 (6), 711-714.
Honig, C. R., Connett, R. J. & Gayeski, T. 1992. O2 transport and its interaction with
metabolism; a systems view of aerobic capacity. Medicine and science in sports and
exercise 24 (1), 47-53.
Howley, E. T., Bassett, D. R. & Welch, H. G. 1995. Criteria for maximal oxygen uptake: review
and commentary. Medicine and science in sports and exercise 27, 1292-1292.
Issekutz, B., Birkhead, N.C. & Rodahl, K. 1962. The use of respiratory quotients in assessment
of aerobic work capacity. Journal of Applied Physiology 17, 47–50.
49
Karvonen, J. & Vuorimaa, T. 1988. Heart rate and exercise intensity during sports
activities. Sports Medicine 5 (5), 303-311.
Keskinen, K. L., Häkkinen, K. & Kallinen, M. 2010. Kuntotestauksen käsikirja. 2nd. revised
edition. Tampere: Tammerprint Oy.
Knight-Maloney, M., Robergs, R. A., Gibson, A. & Ghiasvand, F. 2002. Threshold changes in
blood lactate, beat-to-cardiovascular function, and breath-by-breath VO2 during
incremental exercise. Journal of Exercise Physiology Online 5(3), 39-53.
Krip, B.., Gledhill, N., Jamnik, V. & Warburton, D. 1997. Effect of alterations in blood volume
on cardiac function during maximal exercise. Medicine and Science in Sports and
Exercise 29 (11), 1469-1476.
Leger, L. & Gadoury, C. 1989. Validity of the 20m shuttle run test with 1 minute stages to
predict VO2max in adults. Canadian Journal of Sport Science 14 (1), 21-26.
Leger, L. & Lambert, J. 1982. A maximal multistage 20-m shuttle run test to predict. European
Journal of Applied Physiology 49, 1-12.
Leger, L., Lambert, J., Goulet, A., Rowan, C. & Dinelle, Y. 1984. Aerobic capacity of 6 to 17-
year-old Quebecois--20 meter shuttle run test with 1 minute stages. Canadian journal of
applied sport sciences. Journal Canadien des Sciences Appliquees au Sport, 9 (2), 64-69.
Leger, L. & Mercier, D. 1984. Gross energy cost of horizontal treadmill and track
running. Sports medicine 1 (4), 270-277.
Leger, L., Mercier, D., Gadoury, C. & Lambert, J. 1988. The multistage 20 metre shuttle run
test for aerobic fitness. Journal of sports sciences 6 (2), 93-101.
Levine, B. D. 2008. VO2max: what do we know, and what do we still need to know?. The Journal
of physiology 586 (1), 25-34.
Lewis, S. F., Taylor, W. F., Graham, R. M., Pettinger, W. A., Schutte, J. E. & Blomqvist, C. G.
1983. Cardiovascular responses to exercise as functions of absolute and relative work
load. Journal of Applied Physiology, 54 (5), 1314-1323.
McArdle, W. D., Katch, F. I. & Katch, V. L. 2010. Exercise physiology: nutrition, energy, and
human performance. 7th edition. Baltimore, MD: Lippincott Williams & Wilkins.
McVeigh, S. K., Payne, A. C. & Scott, S. 1995. The reliability and validity of the 20-meter
shuttle test as a predictor of peak oxygen uptake in Edinburgh school children, age 13 to
14 years. Pediatric Exercise Science 7 (1), 69–79.
50
Mero, A., Nummela, A., Keskinen, K. & Häkkinen, K. 2007. Urheiluvalmennus. 2nd. edition.
Lahti: VK-kustannus.
Merriam-Webster. 2019. Parkour. Referenced 27.01.2019. https://www.merriam-
webster.com/dictionary/parkour.
Midgley, A. W., Carroll, S., Marchant, D., McNaughton, L. R. & Siegler, J. 2009. Evaluation
of true maximal oxygen uptake based on a novel set of standardized criteria. Applied
Physiology, Nutrition, and Metabolism 34 (2), 115-123.
Midgley, A. W., McNaughton, L. R., Polman, R. & Marchant, D. 2007. Criteria for
determination of maximal oxygen uptake. Sports medicine 37 (12), 1019-1028.
Mitchell, P. & Moyle, J. 1967. Respiration-driven proton translocation in rat liver
mitochondria. Biochemical Journal 105 (3), 1147-1162.
Montero, D., Diaz-Cañestro, C. & Lundby, C. 2015. Endurance Training and V˙ O2max: Role
of Maximal Cardiac Output and Oxygen Extraction. Medicine and Science in Sports and
Exercise 47 (10), 2024-2033.
Murray, J. B. 2010. Knowing Obstacles: Urban Dialogues in ParkourPractice. Central European
University. Department of Sociology and Social Anthropology. Master’s thesis.
Muscat, K. M., Kotrach, H. G., Wilkinson-Maitland, C. A., Schaeffer, M. R., Mendonca, C. T.
& Jensen, D. 2015. Physiological and perceptual responses to incremental exercise testing
in healthy men: effect of exercise test modality. Applied physiology, nutrition, and
metabolism 40 (11), 1199-1209.
Myers, J., Buchanan, N., Walsh, D., Kraemer, M., McAuley, P., Hamilton-Wessler, M. &
Froelicher, V. F. 1991. Comparison of the ramp versus standard exercise protocols.
Journal of the American College of Cardiology 17 (6), 1334-1342.
Noakes, T., Myburgh, K. & Schall, R. 1990. Peak treadmill running velocity during the VO2max
test predicts running performance. Journal of Sports Science 8(1), 35–45.
Pate, E., Bhimani, M., Franks-Skiba, K. & Cooke, R. 1995. Reduced effect of pH on skinned
rabbit psoas muscle mechanics at high temperatures: implications for fatigue. The Journal
of Physiology 486 (3), 689-694.
Pihlaja, P. & Junttila, J. 2012. Parkour. Hyppimisen lyhyt oppimäärä. Keuruu: Otavan
kirjapaino Oy.
51
Pollock, M. L., Bohannon, R. L., Cooper, K. H., Ayres, J. J., Ward, A., White, S. R. & Linnerud,
A. C. 1976. A comparative analysis of four protocols for maximal treadmill stress
testing. American heart journal 92 (1), 39-46.
Olympic Youtube channel. 2019. Referenced 24.03.2019.
https://www.youtube.com/user/olympic/videos?view=0&sort=p&flow=grid.
Oxford Dictionaries. 2019. Parkour. Referenced 27.01.2019.
https://en.oxforddictionaries.com/definition/parkour.
Ramsbottom, R., Brewer, J. & Williams, C. 1988. A progressive shuttle run test to estimate
maximal oxygen uptake. British journal of sports medicine 22 (4), 141-144.
Rivera, A. M, Pels, A. E, Sady, S. P, Sady M. A, Cullinane, E. M. & Thompson P. D. 1989.
Physiological factors associated with the lower maximal oxygen consumption of master
runners. Journal of Applied Physiology 66, 949–954.
Robergs, R. A. 2001a. An exercise physiologist's "contemporary" interpretations of the "ugly
and creaking edifices" of the VO2max concept. Journal of Exercise Physiology Online 4
(1), 1-44.
Robergs, R. A. 2001b. Exercise-induced metabolic acidosis: where do the protons come
from. Sportscience 5 (2), 1-20.
Robergs, R. A. 2017. Competitive cation binding computations of proton balance for reactions
of the phosphagen and glycolytic energy systems within skeletal muscle. PloS one, 12
(12), e0189822. Doi: /10.1371/journal.pone.0189822
Robinson, B. F., Epstein, S. E., Beiser, G. D. & Braunwald, E. 1966. Control of heart rate by
the autonomic nervous system: studies in man on the interrelation between baroreceptor
mechanisms and exercise. Circulation Research 19 (2), 400-411.
Rowell, L. B. 1974. Human cardiovascular adjustments to exercise and thermal
stress. Physiological reviews 54 (1), 75-159.
Saltin, B., Henriksson, E., Nygaard, E. & Andersen P. 1977. Fiber types and metabolic
potentials of skeletal muscles in sedentary man and endurance runners. Annals of the New
York Academy of Sciences 301 (1), 3-29.
Sawka, M. N., Convertino, V.A., Eichner, E.R., Schnieder, S.M. & Young, A.J. 2000 Blood
volume: importance and adaptations to exercise training, environmental stresses, and
trauma/sickness. Medicine & Science in Sports & Exercise 32 (2), 332.
52
Scott, B. K. & Houmard, J. A. 1994. Peak running velocity is highly related to distance running
performance. International Journal of Sports Medicine 15 (08), 504-507.
Storror Youtube channel. 2019. Referenced 24.03.2019.
https://www.youtube.com/user/StorrorBlog/videos?flow=grid&sort=p&view=0.
Suleymanlar, G., Zhou, H. Z., McCormack, M., Elkins, N., Kucera, R., Reiss, O. K., & Shapiro,
J. I. 1992. Mechanism of impaired energy metabolism during acidosis: role of oxidative
metabolism. American Journal of Physiology-Heart and Circulatory Physiology 262 (6),
H1818-H1822.
Tanner, D. A., Duke, J. W. & Stager, J. M. 2014. Ventilatory patterns differ between maximal
running and cycling. Respiratory physiology & neurobiology 191, 9-16.
Taylor, H. L., Buskirk, E. & Henschel, A. 1955. Maximal oxygen intake as an objective
measure of cardio-respiratory performance. Journal of applied physiology 8 (1), 73-80.
Vella, C. A. & Robergs, R. A. 2005. A review of the stroke volume response to upright exercise
in healthy subjects. British journal of sports medicine 39 (4), 190-195.
Whipp, B. J., Davis, J. A., Torres, F. & Wasserman, K. 1981. A test to determine parameters of
aerobic function during exercise. Journal of Applied Physiology 50 (1), 217-221.
Yoon, B. K., Kravitz, L., & Robergs, R. 2007. VO2max, protocol duration, and the VO2 plateau.
Medicine & Science in Sports & Exercise 39 (7), 1186-1192.
Zatsiorsky, V. M. & Kraemer, W. J. 2006. Science and practice of strength training. Second
edition. Champaign, IL: Human Kinetics Publishers.
Zhang, Y. Y., Chow, N. & Wasserman, K. 1991. Effect of exercise testing protocol on
parameters of aerobic function. Medicine and science in sports and exercise 23 (5), 625-
630.
Åstrand, P. O. & Saltin, B. 1961. Maximal oxygen uptake and heart rate in various types of
muscular activity. Journal of Applied Physiology 16 (6), 977.
Åstrand, P. O., Cuddy, T. E., Saltin, B. & Stenberg, J. 1964. Cardiac output during submaximal
and maximal work. Journal of Applied Physiology 19 (2), 268-274.