Embed Size (px)
Citation preview
U.S. Department of the InteriorU.S. Geological Survey
Fieldwork
http://soundwaves.usgs.gov/
(Exploring Mars continued on page 2)
Sound Waves Volume FY 2013, Issue No. 142142September/October 2012
Editor’s Note: Why does a newsletter about coastal and ocean science contain articles about fi eld-work on Mars? Well, when sedimentary geologist Dave Rubin of the U.S. Geological Survey’s Pa-cifi c Coastal and Marine Science Center was selected to contribute his expert knowledge of marine, riverborne, and windblown sediment to the Mars Science Laboratory (MSL), the opportunity was too exciting to pass up. So we’re leading off this issue with an article about the mission and, be-cause maps are central to what we do, a companion article about the high-resolution mapping that makes the mission possible. Although Mars is cold and dry now, studies in recent decades indicate that before about 3.7 billion years ago, the planet underwent a warm and wet phase, with rivers, lakes, and possibly oceans. MSL scientists recently found evidence of an ancient streambed (see photograph below) and are eager to make more exciting discoveries as the mission progresses.
Three U.S. Geological Survey (USGS) researchers—astrogeologist Ken Herken-hoff, Shoemaker Postdoctoral Fellow Ryan Anderson, and sedimentary geolo-gist David Rubin—were among the ju-bilant scientists at NASA’s Jet Propulsion Laboratory in Pasadena, California, on August 5, 2012, as incoming data showed that the rover Curiosity had landed safely on Mars. Having survived an intricate series of landing maneuvers—referred to by some NASA engineers as “7 minutes of terror”—Curiosity was poised to begin its mission: exploring and assessing the re-
USGS Scientists Exploring Mars as Part of NASA’s Mars Science LaboratoryBy Helen Gibbons
gion around the landing site as a potential habitat for life, past or present.
Curiosity landed in Gale crater near Mars’ equator. The site was chosen partly
because data from Mars orbiters show evi-dence of past water there, increasing the chances that the rover might fi nd evidence of past life. Scientists working with Curi-osity are particularly interested in Aeolis Mons, known informally as Mount Sharp. This mountain of layered material in the middle of the crater may be the eroded remnant of sedimentary layers that once fi lled the crater completely. Some of these layers may have originally been deposited on a lakebed. With an array of scientifi c instruments for observing its surroundings and for acquiring and analyzing samples of rock, soil, and atmosphere, the rover will gradually make its way to and up the moun-tain, studying the makeup and structure of the layers to investigate how they formed.
Living on Mars Time
Directing the rover’s activities are Herkenhoff, Anderson, Rubin, and the many other scientists working on Mars Science Laboratory—the name of the mission using Curiosity to explore Mars (http://mars.jpl.nasa.gov/msl/). For ap-proximately 3 months after the landing, the scientists will be living on “Mars time.” Although they are directing the rover’s daylight operations, their work shift is during Mars night. In Mars afternoon, the
Rounded gravel fragments on Mars (left) and in a stream deposit on Earth (right). Fragments of rock are rounded by abrasion as they bounce against each other during transport by wind or water. Gravel fragments are too large to be transported by wind. Scientists consider the Martian fragments, like their counterparts on Earth, to have been rounded by water transport in a stream. Mars outcrop imaged by 100-mm Mast Camera on September 2, 2012. From NASA/JPL-Caltech/MSSS and PSI. Learn more at http://mars.jpl.nasa.gov/msl/news/whatsnew/index.cfm?FuseAction=ShowNews&NewsID=1360.
2September/October 2012 Sound Waves
Sound Waves
EditorHelen Gibbons
Santa Cruz, CaliforniaTelephone: (831) 460-7418
E-mail: [email protected]: (831) 427-4709
Print Layout EditorsSusan Mayfi eld, Sara Boore
Menlo Park, CaliforniaTelephone: (650) 329-5066
E-mail: smayfi [email protected]; [email protected]: (650) 329-5051
Web Layout EditorJolene Gittens
St. Petersburg, FloridaTelephone: (727) 803-8747 Ext. 3038
E-mail: [email protected]: (727) 803-2032
SOUND WAVES (WITH ADDITIONAL LINKS) IS AVAILABLE ONLINE AT URLhttp://soundwaves.usgs.gov/
Fieldwork
Fieldwork, continued
Submission Guidelines
Deadline: The dead line for news items and pub li ca tion lists for the January/February is-sue of Sound Waves is Thursday, November 1. Publications: When new publications or prod ucts are re leased, please no ti fy the ed i tor with a full reference and a bulleted sum ma ry or description.Images: Please sub mit all images at pub li ca- tion size (col umn, 2-column, or page width). Resolution of 200 to 300 dpi (dots per inch) is best. Ado be Illustrator© fi les or EPS fi les work well with vector fi les (such as graphs or di a grams). TIFF and JPEG fi les work well with ras ter fi les (pho to graphs or rasterized vec tor fi les).
Any use of trade, fi rm, or product names is for descriptive purposes only and does not imply endorsement by the U.S. Gov ern ment.
U.S. Geological Survey Earth Science Information Sources:
Need to fi nd natural-science data orinformation? Visit the USGS Frequently Asked Ques tions (FAQ’s) at URL http://www.usgs.gov/faq/
Can’t fi nd the answer to your question on the web? Call 1-888-ASK-USGS
Want to e-mail your question to the USGS?Send it to this address: [email protected]
Contents
Fieldwork 1Research 9Outreach 13Meetings 15Staff and Center News 18Publications 18
(Exploring Mars continued from page 1)
(Exploring Mars continued on page 3)
rover starts sending its data to Earth, where the scientists study the incoming images and analyses. (The time it takes informa-tion to travel between Earth and Mars at the speed of light varies with the distance between the two planets; when Curios-ity landed on August 5, data transfer from Mars to Earth took about 14 minutes.) Each of three groups of scientists—focused on geology, environment, and mineral-ogy—comes up with a plan for what it would like the rover to do on the following day. The plans are discussed and integrated into a single plan, which the rover drivers convert into a list of commands to be sent to the rover by Mars dawn.
Days on Mars, called “sols,” are 24 hours, 39 minutes, and 35.2 seconds
long—not much different from days on Earth, but different enough that each Earth day the scientists start work about 40 minutes later than the day before, and so sometimes they are working in the middle of Earth’s night. As the mission progresses—it is expected to last at least 1 Martian year, or 687 Earth days—the MSL scientists will transition to “Earth shifts” that allow them to consistently work dur-ing Earth’s daylight hours.
Eyes on Mars—Specialized Cameras
Ken Herkenhoff is a research geolo-gist from the USGS Astrogeology Science Center in Flagstaff, Arizona, with a par-ticular interest in using specialized cameras to study landforms and surface processes
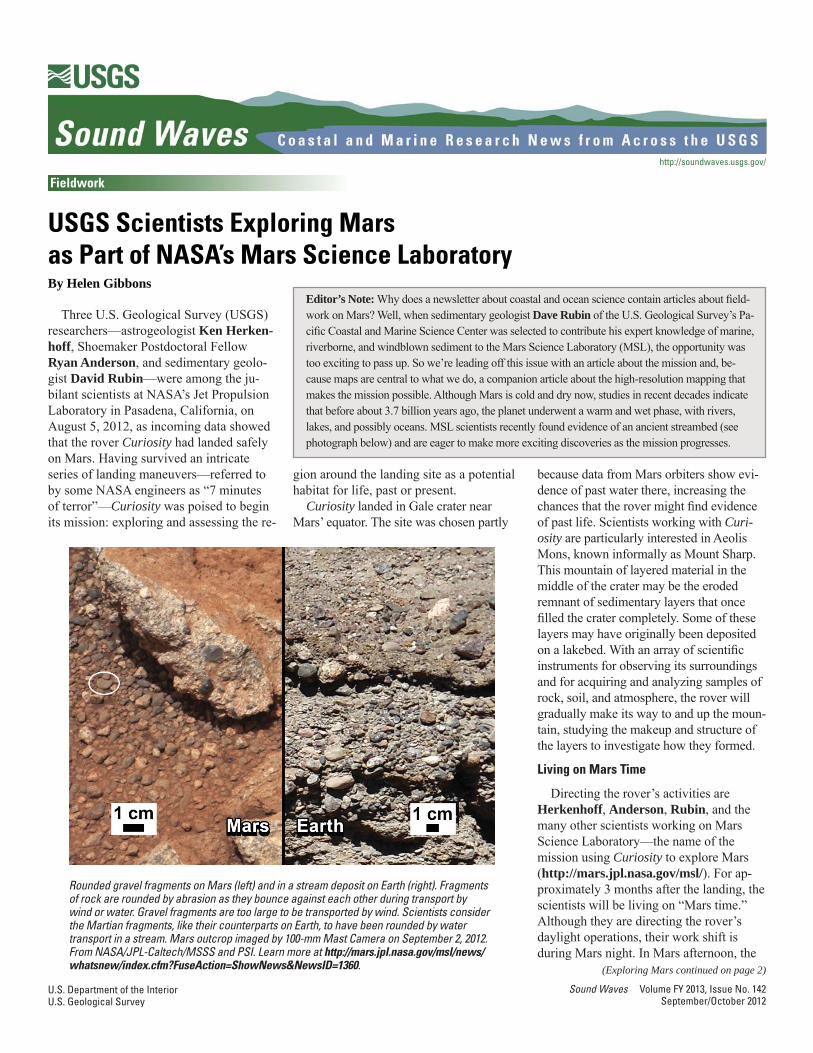
Oblique, southward-looking view of Gale crater, showing landing point (white dot), which is well within targeted landing ellipse (outlined in yellow). Inside crater is mountain of layered rock that NASA’s rover Curiosity will explore. Gale crater is 154 kilometers (96 miles) in diameter; layered mountain rises about 5.5 kilometers (3.4 miles) above crater fl oor. View derived from a combination of elevation and imaging data from three Mars orbiters; no vertical exaggeration. From NASA/JPL-Caltech/ESA/DLR/FU Berlin/MSSS (slightly modifi ed from image at http://www.nasa.gov/mission_pages/msl/multimedia/pia16058.html) .
Orthographic map of Mars, centered on Curiosity’s landing site (green label “MSL” stands for Mars Science Labo-ratory). Yellow dot marks point at which the Sun was directly overhead when screenshot was taken (approx 10:55 a.m. PDT August 29, 2012); blue dot marks point at which the Earth was di-rectly overhead. Slightly modifi ed from Mars24 Sunclock application, http://www.giss.nasa.gov/tools/mars24/.
3 Sound Waves September/October 2012Fieldwork
Fieldwork, continued
(Exploring Mars continued from page 2)
on Mars (see http://astrogeology.usgs.gov/people/ken-herkenhoff). During 7 years as a research scientist at the Jet Pro-pulsion Laboratory, Herkenhoff took part in numerous Mars exploration and map-ping projects, including the 1997 Mars Pathfi nder mission, the fi rst U.S. mission to put a rover (Sojourner) on Mars. After joining the USGS in 1998, Herkenhoff continued his Mars work, including leading the Microscopic Imager team for the Mars Exploration Rover (MER) mission, which landed two rovers, Spirit and Opportunity, on Mars in 2004. A Co-Investigator on the current mission since instruments were selected in December 2004, Herkenhoff works with several instruments on Curiosity: the Mastcam, MAHLI, and MARDI cameras and the ChemCam spectrometer and remote mi-croscopic imager.
The Mastcam (short for Mast Camera) takes high-defi nition videos of the Mar-tian terrain, as well as color photographs, including stereopairs—photographs taken from slightly different angles whose combination produces three-dimensional views. These images will be used to study the Martian landscape, rocks, and soils; to view frost and weather phenomena; and to support the rover’s driving and sampling operations.
in shadow and even at night. In addition to white-light sources, like the light from a fl ashlight, MAHLI has ultraviolet-light sources, like the light from a tanning lamp. The ultraviolet light is used to in-duce fl uorescence in order to help detect carbonate and evaporite minerals, both of which would indicate that water helped shape the landscape. MAHLI’s lens has a focusing mechanism that allows images to be acquired at a range of target distances, from less than an inch (resolution better than the MER Microscopic Imager) to infi nity.
The MARDI, or Mars Descent Imager, took color video during the rover’s de-scent, providing an “astronaut’s view” of the landing site to help Curiosity’s driv-ers steer it around loose debris, boulders, cliffs, and other potential obstacles, as well as to provide geologic context for the rover’s early investigations. Shot at 4 frames per second, the video supplements high-resolution digital topographic models of the study area prepared by USGS astro-geologist Randy Kirk (see related article, this issue). The video frames, which have very large fi le sizes, are gradually being transferred to Earth; some of them have
been combined into a movie posted at http://www.youtube.com/watch?v=e1ebHThBdlY&feature=channel&list=UL. Although MARDI has completed its main task—imaging the ground during the rover’s descent—it can still take useful pictures of Mars, looking straight down at the surface just behind Curiosity’s left front wheel. Eventually the scientists hope to use MARDI to take images as the rover drives.
The ChemCam (short for Chemistry and Camera) fi res a laser at rocks and soils and analyzes the elemental composi-tion of vaporized materials from surface areas smaller than 1 millimeter. From as far away as 7 meters (23 feet), the Chem-Cam can rapidly identify rock types (for example, determine whether rocks are volcanic or salty), measure the abundance of most chemical elements, recognize ice and minerals with water molecules in their crystal structures, and much more. The ChemCam contains a remote microscopic imager to capture detailed images of the spot analyzed by the laser and the sur-rounding area. If Curiosity cannot reach a rock or outcrop of interest, the ChemCam
(Exploring Mars continued on page 4)
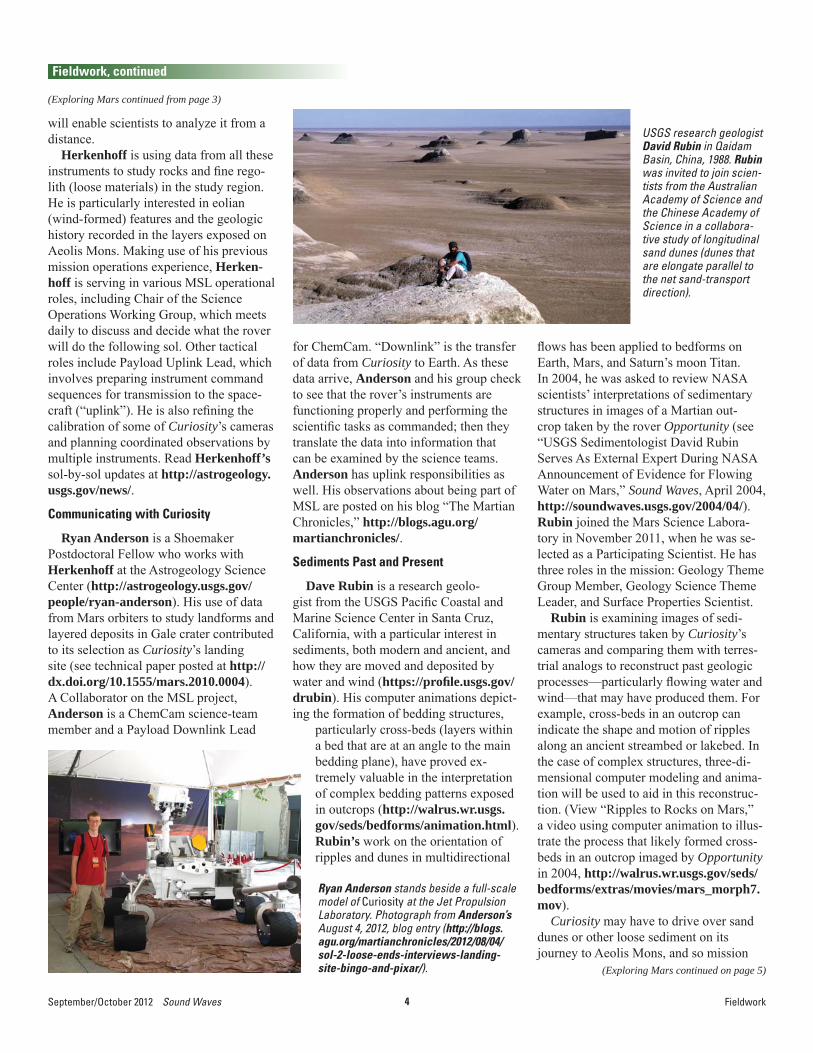
Ken Herkenhoff
The MAHLI, or Mars Hand Lens Im-ager, functions like a geologist’s hand lens, providing closeup views of the min-erals, structures, and textures in Martian rocks and dust. MAHLI is similar to the Microscopic Imager used by Spirit and Opportunity but has more capabilities; for example, MAHLI takes color rather than monochrome images, and it has its own light sources, enabling it to take images
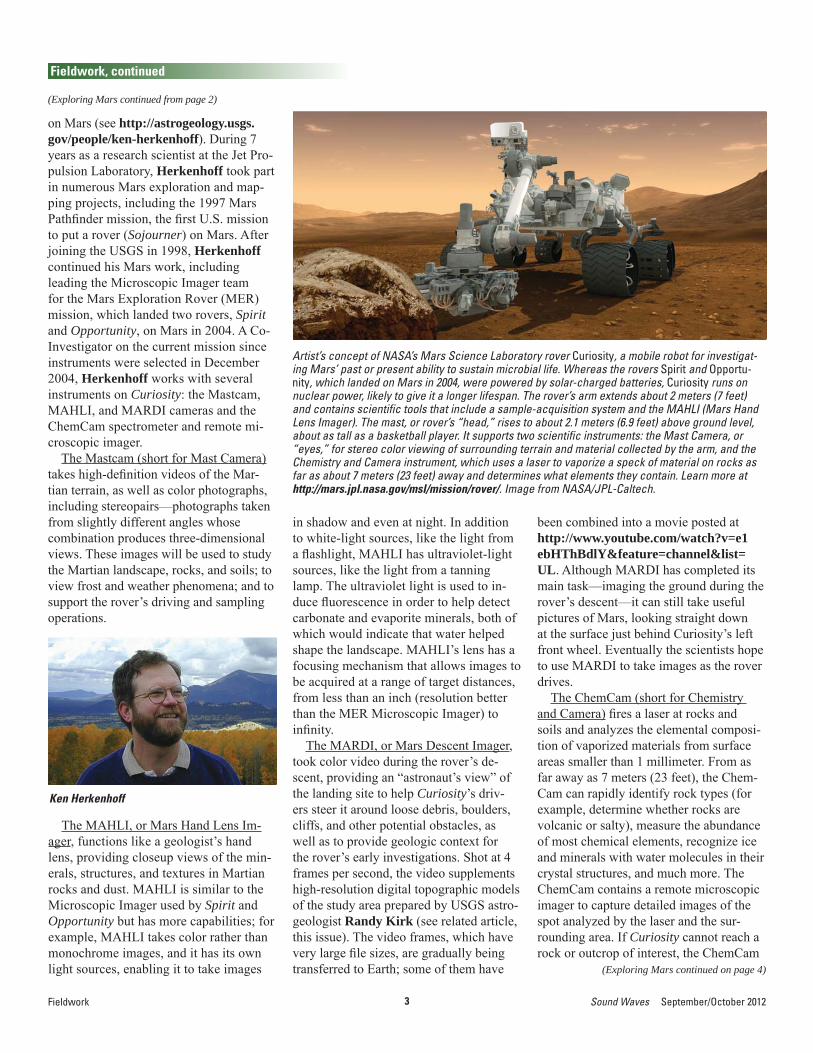
Artist’s concept of NASA’s Mars Science Laboratory rover Curiosity, a mobile robot for investigat-ing Mars’ past or present ability to sustain microbial life. Whereas the rovers Spirit and Opportu-nity, which landed on Mars in 2004, were powered by solar-charged batteries, Curiosity runs on nuclear power, likely to give it a longer lifespan. The rover’s arm extends about 2 meters (7 feet) and contains scientifi c tools that include a sample-acquisition system and the MAHLI (Mars Hand Lens Imager). The mast, or rover’s “head,” rises to about 2.1 meters (6.9 feet) above ground level, about as tall as a basketball player. It supports two scientifi c instruments: the Mast Camera, or “eyes,” for stereo color viewing of surrounding terrain and material collected by the arm, and the Chemistry and Camera instrument, which uses a laser to vaporize a speck of material on rocks as far as about 7 meters (23 feet) away and determines what elements they contain. Learn more at http://mars.jpl.nasa.gov/msl/mission/rover/. Image from NASA/JPL-Caltech.
4September/October 2012 Sound Waves
Fieldwork, continued
Fieldwork
(Exploring Mars continued from page 3)
(Exploring Mars continued on page 5)
will enable scientists to analyze it from a distance.
Herkenhoff is using data from all these instruments to study rocks and fi ne rego-lith (loose materials) in the study region. He is particularly interested in eolian (wind-formed) features and the geologic history recorded in the layers exposed on Aeolis Mons. Making use of his previous mission operations experience, Herken-hoff is serving in various MSL operational roles, including Chair of the Science Operations Working Group, which meets daily to discuss and decide what the rover will do the following sol. Other tactical roles include Payload Uplink Lead, which involves preparing instrument command sequences for transmission to the space-craft (“uplink”). He is also refi ning the calibration of some of Curiosity’s cameras and planning coordinated observations by multiple instruments. Read Herkenhoff’s sol-by-sol updates at http://astrogeology.usgs.gov/news/.
Communicating with Curiosity
Ryan Anderson is a Shoemaker Postdoctoral Fellow who works with Herkenhoff at the Astrogeology Science Center (http://astrogeology.usgs.gov/people/ryan-anderson). His use of data from Mars orbiters to study landforms and layered deposits in Gale crater contributed to its selection as Curiosity’s landing site (see technical paper posted at http://dx.doi.org/10.1555/mars.2010.0004). A Collaborator on the MSL project, Anderson is a ChemCam science-team member and a Payload Downlink Lead
for ChemCam. “Downlink” is the transfer of data from Curiosity to Earth. As these data arrive, Anderson and his group check to see that the rover’s instruments are functioning properly and performing the scientifi c tasks as commanded; then they translate the data into information that can be examined by the science teams. Anderson has uplink responsibilities as well. His observations about being part of MSL are posted on his blog “The Martian Chronicles,” http://blogs.agu.org/martianchronicles/.
Sediments Past and Present
Dave Rubin is a research geolo-gist from the USGS Pacifi c Coastal and Marine Science Center in Santa Cruz, California, with a particular interest in sediments, both modern and ancient, and how they are moved and deposited by water and wind (https://profi le.usgs.gov/drubin). His computer animations depict-ing the formation of bedding structures,
fl ows has been applied to bedforms on Earth, Mars, and Saturn’s moon Titan. In 2004, he was asked to review NASA scientists’ interpretations of sedimentary structures in images of a Martian out-crop taken by the rover Opportunity (see “USGS Sedimentologist David Rubin Serves As External Expert During NASA Announcement of Evidence for Flowing Water on Mars,” Sound Waves, April 2004, http://soundwaves.usgs.gov/2004/04/). Rubin joined the Mars Science Labora-tory in November 2011, when he was se-lected as a Participating Scientist. He has three roles in the mission: Geology Theme Group Member, Geology Science Theme Leader, and Surface Properties Scientist.
Rubin is examining images of sedi-mentary structures taken by Curiosity’s cameras and comparing them with terres-trial analogs to reconstruct past geologic processes—particularly fl owing water and wind—that may have produced them. For example, cross-beds in an outcrop can indicate the shape and motion of ripples along an ancient streambed or lakebed. In the case of complex structures, three-di-mensional computer modeling and anima-tion will be used to aid in this reconstruc-tion. (View “Ripples to Rocks on Mars,” a video using computer animation to illus-trate the process that likely formed cross-beds in an outcrop imaged by Opportunity in 2004, http://walrus.wr.usgs.gov/seds/bedforms/extras/movies/mars_morph7.mov).
Curiosity may have to drive over sand dunes or other loose sediment on its journey to Aeolis Mons, and so mission
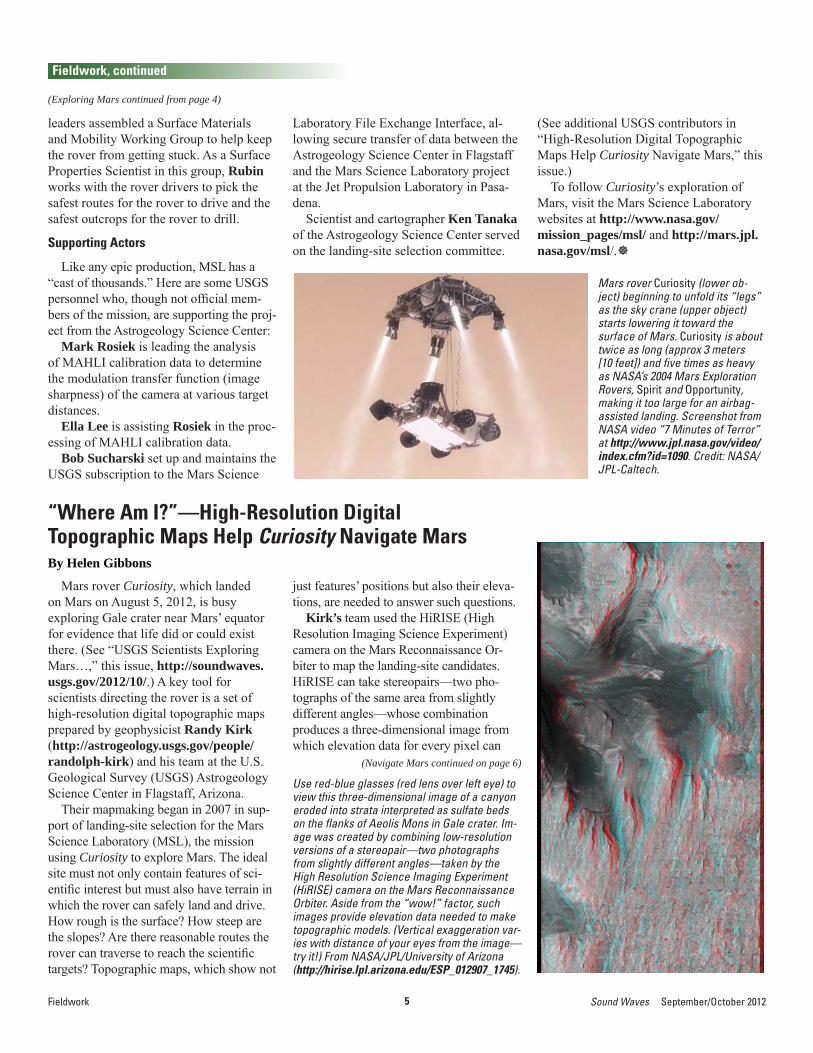
USGS research geologist David Rubin in Qaidam Basin, China, 1988. Rubin was invited to join scien-tists from the Australian Academy of Science and the Chinese Academy of Science in a collabora-tive study of longitudinal sand dunes (dunes that are elongate parallel to the net sand-transport direction).
particularly cross-beds (layers within a bed that are at an angle to the main bedding plane), have proved ex-tremely valuable in the interpretation of complex bedding patterns exposed in outcrops (http://walrus.wr.usgs.gov/seds/bedforms/animation.html). Rubin’s work on the orientation of ripples and dunes in multidirectional
Ryan Anderson stands beside a full-scale model of Curiosity at the Jet Propulsion Laboratory. Photograph from Anderson’s August 4, 2012, blog entry (http://blogs.agu.org/martianchronicles/2012/08/04/sol-2-loose-ends-interviews-landing-site-bingo-and-pixar/).
5 Sound Waves September/October 2012Fieldwork
Fieldwork, continued
(Exploring Mars continued from page 4)
(Navigate Mars continued on page 6)
leaders assembled a Surface Materials and Mobility Working Group to help keep the rover from getting stuck. As a Surface Properties Scientist in this group, Rubin works with the rover drivers to pick the safest routes for the rover to drive and the safest outcrops for the rover to drill.
Supporting Actors
Like any epic production, MSL has a “cast of thousands.” Here are some USGS personnel who, though not offi cial mem-bers of the mission, are supporting the proj-ect from the Astrogeology Science Center:
Mark Rosiek is leading the analysis of MAHLI calibration data to determine the modulation transfer function (image sharpness) of the camera at various target distances.
Ella Lee is assisting Rosiek in the proc-essing of MAHLI calibration data.
Bob Sucharski set up and maintains the USGS subscription to the Mars Science
Mars rover Curiosity, which landed on Mars on August 5, 2012, is busy exploring Gale crater near Mars’ equator for evidence that life did or could exist there. (See “USGS Scientists Exploring Mars…,” this issue, http://soundwaves.usgs.gov/2012/10/.) A key tool for scientists directing the rover is a set of high-resolution digital topographic maps prepared by geophysicist Randy Kirk (http://astrogeology.usgs.gov/people/randolph-kirk) and his team at the U.S. Geological Survey (USGS) Astrogeology Science Center in Flagstaff, Arizona.
Their mapmaking began in 2007 in sup-port of landing-site selection for the Mars Science Laboratory (MSL), the mission using Curiosity to explore Mars. The ideal site must not only contain features of sci-entifi c interest but must also have terrain in which the rover can safely land and drive. How rough is the surface? How steep are the slopes? Are there reasonable routes the rover can traverse to reach the scientifi c targets? Topographic maps, which show not
“Where Am I?”—High-Resolution Digital Topographic Maps Help Curiosity Navigate MarsBy Helen Gibbons
just features’ positions but also their eleva-tions, are needed to answer such questions.
Kirk’s team used the HiRISE (High Resolution Imaging Science Experiment) camera on the Mars Reconnaissance Or-biter to map the landing-site candidates. HiRISE can take stereopairs—two pho-tographs of the same area from slightly different angles—whose combination produces a three-dimensional image from which elevation data for every pixel can
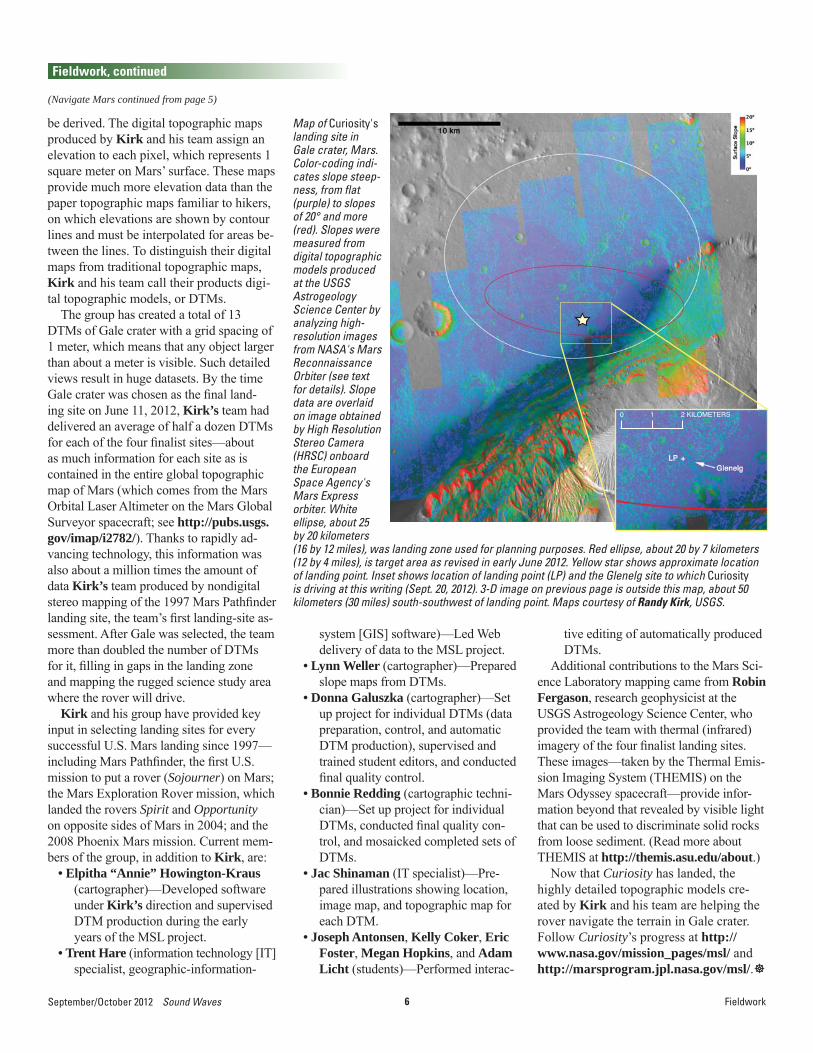
Use red-blue glasses (red lens over left eye) to view this three-dimensional image of a canyon eroded into strata interpreted as sulfate beds on the fl anks of Aeolis Mons in Gale crater. Im-age was created by combining low-resolution versions of a stereopair—two photographs from slightly different angles—taken by the High Resolution Science Imaging Experiment (HiRISE) camera on the Mars Reconnaissance Orbiter. Aside from the “wow!” factor, such images provide elevation data needed to make topographic models. (Vertical exaggeration var-ies with distance of your eyes from the image—try it!) From NASA/JPL/University of Arizona (http://hirise.lpl.arizona.edu/ESP_012907_1745).
Mars rover Curiosity (lower ob-ject) beginning to unfold its “legs” as the sky crane (upper object) starts lowering it toward the surface of Mars. Curiosity is about twice as long (approx 3 meters [10 feet]) and fi ve times as heavy as NASA’s 2004 Mars Exploration Rovers, Spirit and Opportunity, making it too large for an airbag-assisted landing. Screenshot from NASA video “7 Minutes of Terror” at http://www.jpl.nasa.gov/video/index.cfm?id=1090. Credit: NASA/JPL-Caltech.
Laboratory File Exchange Interface, al-lowing secure transfer of data between the Astrogeology Science Center in Flagstaff and the Mars Science Laboratory project at the Jet Propulsion Laboratory in Pasa-dena.
Scientist and cartographer Ken Tanaka of the Astrogeology Science Center served on the landing-site selection committee.
(See additional USGS contributors in “High-Resolution Digital Topographic Maps Help Curiosity Navigate Mars,” this issue.)
To follow Curiosity’s exploration of Mars, visit the Mars Science Laboratory websites at http://www.nasa.gov/mission_pages/msl/ and http://mars.jpl.nasa.gov/msl/.
6September/October 2012 Sound Waves
Fieldwork, continued
(Navigate Mars continued from page 5)
Fieldwork
be derived. The digital topographic maps produced by Kirk and his team assign an elevation to each pixel, which represents 1 square meter on Mars’ surface. These maps provide much more elevation data than the paper topographic maps familiar to hikers, on which elevations are shown by contour lines and must be interpolated for areas be-tween the lines. To distinguish their digital maps from traditional topographic maps, Kirk and his team call their products digi-tal topographic models, or DTMs.
The group has created a total of 13 DTMs of Gale crater with a grid spacing of 1 meter, which means that any object larger than about a meter is visible. Such detailed views result in huge datasets. By the time Gale crater was chosen as the fi nal land-ing site on June 11, 2012, Kirk’s team had delivered an average of half a dozen DTMs for each of the four fi nalist sites—about as much information for each site as is contained in the entire global topographic map of Mars (which comes from the Mars Orbital Laser Altimeter on the Mars Global Surveyor spacecraft; see http://pubs.usgs.gov/imap/i2782/). Thanks to rapidly ad-vancing technology, this information was also about a million times the amount of data Kirk’s team produced by nondigital stereo mapping of the 1997 Mars Pathfi nder landing site, the team’s fi rst landing-site as-sessment. After Gale was selected, the team more than doubled the number of DTMs for it, fi lling in gaps in the landing zone and mapping the rugged science study area where the rover will drive.
Kirk and his group have provided key input in selecting landing sites for every successful U.S. Mars landing since 1997—including Mars Pathfi nder, the fi rst U.S. mission to put a rover (Sojourner) on Mars; the Mars Exploration Rover mission, which landed the rovers Spirit and Opportunity on opposite sides of Mars in 2004; and the 2008 Phoenix Mars mission. Current mem-bers of the group, in addition to Kirk, are:
• Elpitha “Annie” Howington-Kraus (cartographer)—Developed software under Kirk’s direction and supervised DTM production during the early years of the MSL project.
• Trent Hare (information technology [IT] specialist, geographic-information-
tive editing of automatically produced DTMs.
Additional contributions to the Mars Sci-ence Laboratory mapping came from Robin Fergason, research geophysicist at the USGS Astrogeology Science Center, who provided the team with thermal (infrared) imagery of the four fi nalist landing sites. These images—taken by the Thermal Emis-sion Imaging System (THEMIS) on the Mars Odyssey spacecraft—provide infor-mation beyond that revealed by visible light that can be used to discriminate solid rocks from loose sediment. (Read more about THEMIS at http://themis.asu.edu/about.)
Now that Curiosity has landed, the highly detailed topographic models cre-ated by Kirk and his team are helping the rover navigate the terrain in Gale crater. Follow Curiosity’s progress at http://www.nasa.gov/mission_pages/msl/ and http://marsprogram.jpl.nasa.gov/msl/.
system [GIS] software)—Led Web delivery of data to the MSL project.
• Lynn Weller (cartographer)—Prepared slope maps from DTMs.
• Donna Galuszka (cartographer)—Set up project for individual DTMs (data preparation, control, and automatic DTM production), supervised and trained student editors, and conducted fi nal quality control.
• Bonnie Redding (cartographic techni-cian)—Set up project for individual DTMs, conducted fi nal quality con-trol, and mosaicked completed sets of DTMs.
• Jac Shinaman (IT specialist)—Pre-pared illustrations showing location, image map, and topographic map for each DTM.
• Joseph Antonsen, Kelly Coker, Eric Foster, Megan Hopkins, and Adam Licht (students)—Performed interac-
Map of Curiosity's landing site in Gale crater, Mars. Color-coding indi-cates slope steep-ness, from fl at (purple) to slopes of 20° and more (red). Slopes were measured from digital topographic models produced at the USGS Astrogeology Science Center by analyzing high-resolution images from NASA's Mars Reconnaissance Orbiter (see text for details). Slope data are overlaid on image obtained by High Resolution Stereo Camera (HRSC) onboard the European Space Agency's Mars Express orbiter. White ellipse, about 25 by 20 kilometers (16 by 12 miles), was landing zone used for planning purposes. Red ellipse, about 20 by 7 kilometers (12 by 4 miles), is target area as revised in early June 2012. Yellow star shows approximate location of landing point. Inset shows location of landing point (LP) and the Glenelg site to which Curiosity is driving at this writing (Sept. 20, 2012). 3-D image on previous page is outside this map, about 50 kilometers (30 miles) south-southwest of landing point. Maps courtesy of Randy Kirk, USGS.
7 Sound Waves September/October 2012
Fieldwork, continued
Fieldwork
(Methane Seep continued on page 8)
A tip from U.S. Geological Survey (USGS) scientists and their colleague at the Monterey Bay Aquarium Research Institute (MBARI) led to the discovery of a deep-sea methane seep by graduate stu-dents from Scripps Institution of Oceanog-raphy at the University of California, San Diego. Evidence for the seep was discov-ered during the San Diego Coastal Expedi-tion (http://bit.ly/sdcoastex) in July 2012.
Methane seeps are known in several areas off the coast of California, but this is the fi rst such fi nding off San Diego County. The seep was discovered about 20 miles west of Del Mar, in a fault zone known as the San Diego Trough fault zone. Methane, the most common form of natural gas, exists in sediment beneath the seafl oor along many of the world’s conti-nental margins. Faults can provide a path-way for methane to “seep” upward toward the seafl oor.
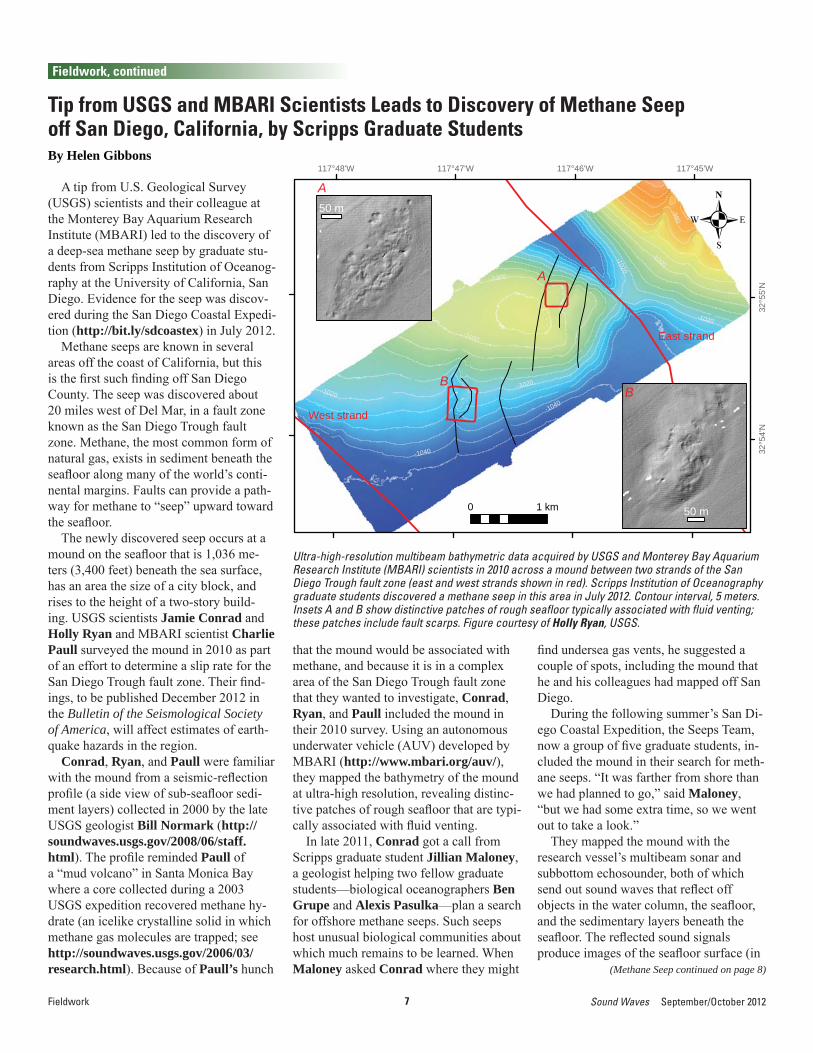
The newly discovered seep occurs at a mound on the seafl oor that is 1,036 me-ters (3,400 feet) beneath the sea surface, has an area the size of a city block, and rises to the height of a two-story build-ing. USGS scientists Jamie Conrad and Holly Ryan and MBARI scientist Charlie Paull surveyed the mound in 2010 as part of an effort to determine a slip rate for the San Diego Trough fault zone. Their fi nd-ings, to be published December 2012 in the Bulletin of the Seismological Society of America, will affect estimates of earth-quake hazards in the region.
Conrad, Ryan, and Paull were familiar with the mound from a seismic-refl ection profi le (a side view of sub-seafl oor sedi-ment layers) collected in 2000 by the late USGS geologist Bill Normark (http://soundwaves.usgs.gov/2008/06/staff.html). The profi le reminded Paull of a “mud volcano” in Santa Monica Bay where a core collected during a 2003 USGS expedition recovered methane hy-drate (an icelike crystalline solid in which methane gas molecules are trapped; see http://soundwaves.usgs.gov/2006/03/research.html). Because of Paull’s hunch
Tip from USGS and MBARI Scientists Leads to Discovery of Methane Seep off San Diego, California, by Scripps Graduate StudentsBy Helen Gibbons
that the mound would be associated with methane, and because it is in a complex area of the San Diego Trough fault zone that they wanted to investigate, Conrad, Ryan, and Paull included the mound in their 2010 survey. Using an autonomous underwater vehicle (AUV) developed by MBARI (http://www.mbari.org/auv/), they mapped the bathymetry of the mound at ultra-high resolution, revealing distinc-tive patches of rough seafl oor that are typi-cally associated with fl uid venting.
In late 2011, Conrad got a call from Scripps graduate student Jillian Maloney, a geologist helping two fellow graduate students—biological oceanographers Ben Grupe and Alexis Pasulka—plan a search for offshore methane seeps. Such seeps host unusual biological communities about which much remains to be learned. When Maloney asked Conrad where they might
fi nd undersea gas vents, he suggested a couple of spots, including the mound that he and his colleagues had mapped off San Diego.
During the following summer’s San Di-ego Coastal Expedition, the Seeps Team, now a group of fi ve graduate students, in-cluded the mound in their search for meth-ane seeps. “It was farther from shore than we had planned to go,” said Maloney, “but we had some extra time, so we went out to take a look.”
They mapped the mound with the research vessel’s multibeam sonar and subbottom echosounder, both of which send out sound waves that refl ect off objects in the water column, the seafl oor, and the sedimentary layers beneath the seafl oor. The refl ected sound signals produce images of the seafl oor surface (in
-1020
-1040
-1000
-980
-1040
-1020
-1020
-1000
-1000
-1020
0 1 km
50 m
50 m
117°45'W117°46'W117°47'W117°48'W
32°5
5'N
32°5
4'N
BB
A
A
East strand
West strand
Ultra-high-resolution multibeam bathymetric data acquired by USGS and Monterey Bay Aquarium Research Institute (MBARI) scientists in 2010 across a mound between two strands of the San Diego Trough fault zone (east and west strands shown in red). Scripps Institution of Oceanography graduate students discovered a methane seep in this area in July 2012. Contour interval, 5 meters. Insets A and B show distinctive patches of rough seafl oor typically associated with fl uid venting; these patches include fault scarps. Figure courtesy of Holly Ryan, USGS.
8September/October 2012 Sound Waves
Fieldwork, continued
Fieldwork
(Methane Seep continued from page 7)
the case of the multibeam sonar) and sub-seafl oor sedimentary layers (in the case of the sub-bottom echosounder). (Learn more about sonar-mapping methods at http://earthguide.ucsd.edu/earthguide/diagrams/sonar/sonar.html.)
“In the ‘chirp’ data [the sub-bottom data], we saw the most convincing evidence for a seep that we had seen all cruise—a distinctive disruption of the sub-surface layers that’s typical of fl uid seep-age,” said Maloney.
Ordinarily, the next step would be to send the vessel’s remotely operated vehicle (ROV) down to image the suspected seep. But at 1,036 meters (3,400 feet) below the surface, the mound was too deep for the ROV’s tether. Pasulka and Grupe decided to drop a multicore sampler, a frame that supports a ring of eight 1-meter-long cor-ers. When the sampler came back on deck, its contents added to the evidence that the team had discovered a seep.
but gain nutrition from symbiotic bacteria living inside them, and vesicomyid clams, which gain nutrition from bacteria living on their gills. The bacteria metabolize the hydrogen sulfi de produced by methane ox-idation. “These symbiotic bacteria make a lot of energy,” said Pasulka, “with enough left over to be used by their hosts.”
The various microbes that produce en-ergy from chemicals in seep fl uids form the base of food webs for these rich eco-systems, making methane seeps biological oases in seafl oor areas that otherwise are sparsely populated.
Pasulka and Grupe, who are interested in the biology of seep ecosystems, are excited to have discovered a seep so close to San Diego. The site’s relative proximity to Scripps—about 3 to 4 hours by boat—will allow repeated visits over months and years to study the ecosystem and observe
how it changes. The Seeps Team is already planning to revisit the site during the San Diego Coastal Expedition’s second leg in December 2012, when they hope to get video footage and additional samples.
To learn more about the seep dis-covery and the process that led to it, read the Scripps news release at http://scrippsnews.ucsd.edu/Releases/?releaseID=1280 and Jillian Maloney’s blog post at https://sites.google.com/site/sandiegoseafl ex/blog/methaneseepsfaultsandagiantcricket. Read additional blogs from the expedi-tion—and watch for posts during the De-cember 2012 leg—at https://sites.google.com/site/sandiegoseafl ex/blog. Visit the expedition’s Facebook page at http://www.facebook.com/sdcoastex.
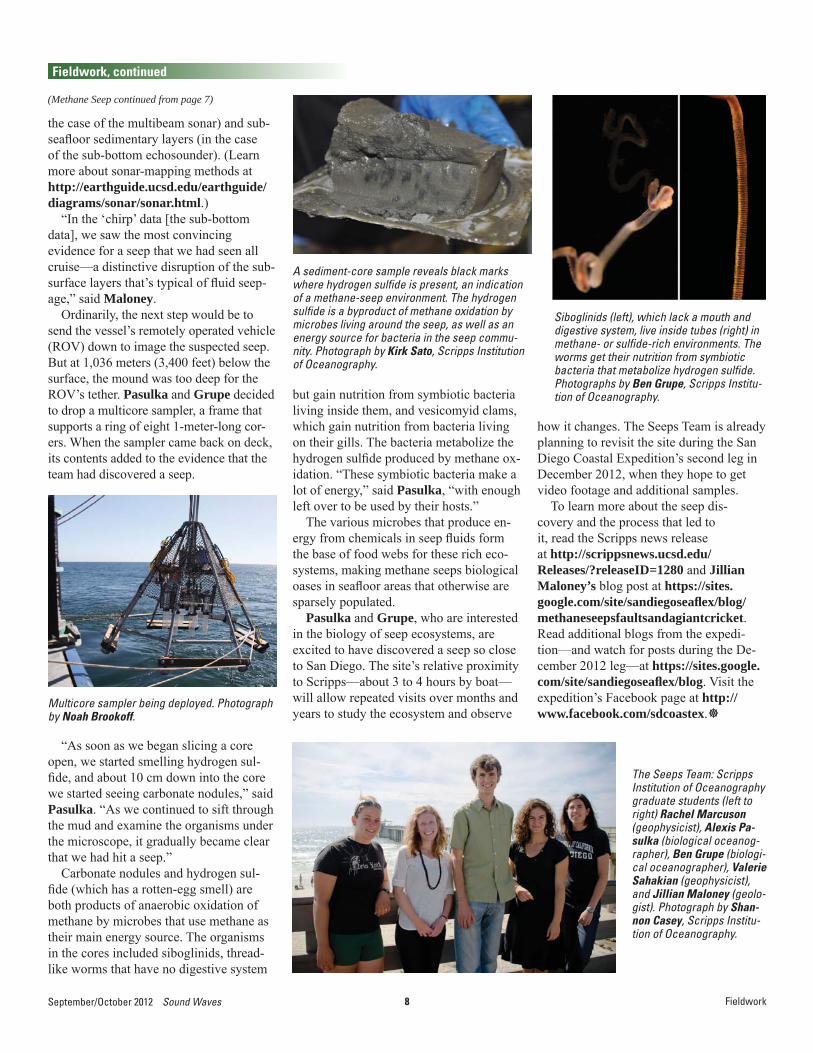
“As soon as we began slicing a core open, we started smelling hydrogen sul-fi de, and about 10 cm down into the core we started seeing carbonate nodules,” said Pasulka. “As we continued to sift through the mud and examine the organisms under the microscope, it gradually became clear that we had hit a seep.”
Carbonate nodules and hydrogen sul-fi de (which has a rotten-egg smell) are both products of anaerobic oxidation of methane by microbes that use methane as their main energy source. The organisms in the cores included siboglinids, thread-like worms that have no digestive system
Multicore sampler being deployed. Photograph by Noah Brookoff.
A sediment-core sample reveals black marks where hydrogen sulfi de is present, an indication of a methane-seep environment. The hydrogen sulfi de is a byproduct of methane oxidation by microbes living around the seep, as well as an energy source for bacteria in the seep commu-nity. Photograph by Kirk Sato, Scripps Institution of Oceanography.
Siboglinids (left), which lack a mouth and digestive system, live inside tubes (right) in methane- or sulfi de-rich environments. The worms get their nutrition from symbiotic bacteria that metabolize hydrogen sulfi de. Photographs by Ben Grupe, Scripps Institu-tion of Oceanography.
The Seeps Team: Scripps Institution of Oceanography graduate students (left to right) Rachel Marcuson (geophysicist), Alexis Pa-sulka (biological oceanog-rapher), Ben Grupe (biologi-cal oceanographer), Valerie Sahakian (geophysicist), and Jillian Maloney (geolo-gist). Photograph by Shan-non Casey, Scripps Institu-tion of Oceanography.
9 Sound Waves September/October 2012Research
Research
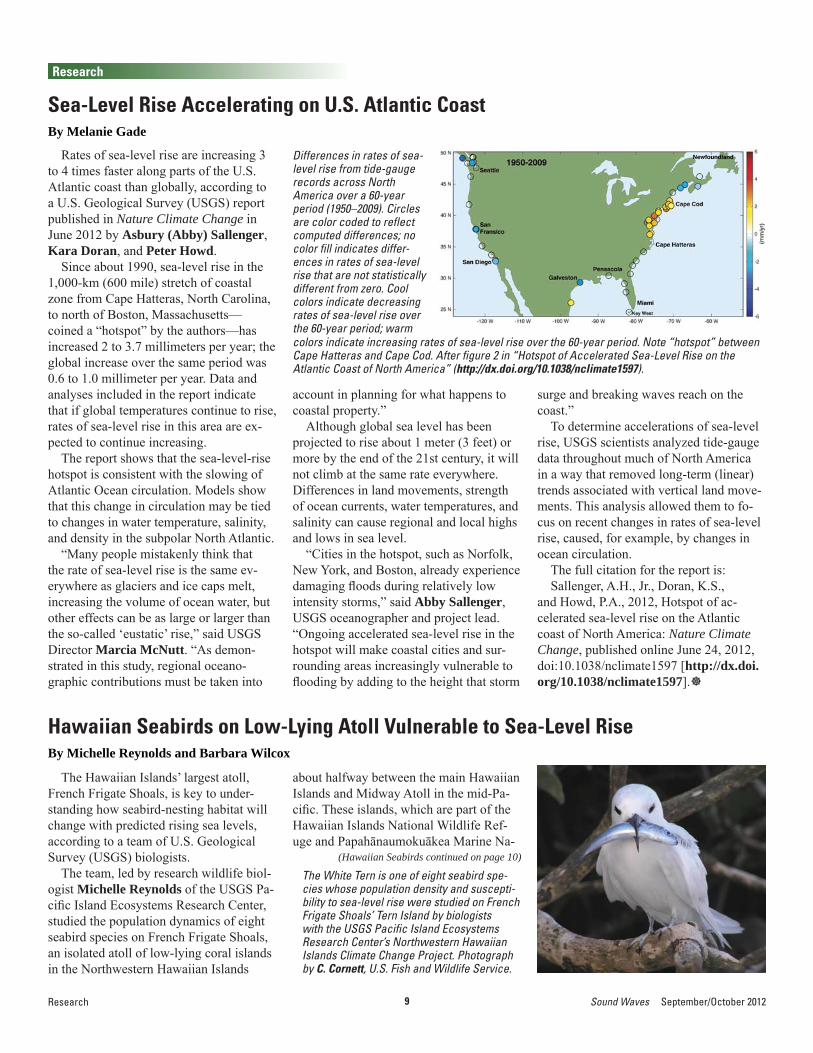
Rates of sea-level rise are increasing 3 to 4 times faster along parts of the U.S. Atlantic coast than globally, according to a U.S. Geological Survey (USGS) report published in Nature Climate Change in June 2012 by Asbury (Abby) Sallenger, Kara Doran, and Peter Howd.
Since about 1990, sea-level rise in the 1,000-km (600 mile) stretch of coastal zone from Cape Hatteras, North Carolina, to north of Boston, Massachusetts—coined a “hotspot” by the authors—has increased 2 to 3.7 millimeters per year; the global increase over the same period was 0.6 to 1.0 millimeter per year. Data and analyses included in the report indicate that if global temperatures continue to rise, rates of sea-level rise in this area are ex-pected to continue increasing.
The report shows that the sea-level-rise hotspot is consistent with the slowing of Atlantic Ocean circulation. Models show that this change in circulation may be tied to changes in water temperature, salinity, and density in the subpolar North Atlantic.
“Many people mistakenly think that the rate of sea-level rise is the same ev-erywhere as glaciers and ice caps melt, increasing the volume of ocean water, but other effects can be as large or larger than the so-called ‘eustatic’ rise,” said USGS Director Marcia McNutt. “As demon-strated in this study, regional oceano-graphic contributions must be taken into
Sea-Level Rise Accelerating on U.S. Atlantic Coast By Melanie Gade
account in planning for what happens to coastal property.”
Although global sea level has been projected to rise about 1 meter (3 feet) or more by the end of the 21st century, it will not climb at the same rate everywhere. Differences in land movements, strength of ocean currents, water temperatures, and salinity can cause regional and local highs and lows in sea level.
“Cities in the hotspot, such as Norfolk, New York, and Boston, already experience damaging fl oods during relatively low intensity storms,” said Abby Sallenger, USGS oceanographer and project lead. “Ongoing accelerated sea-level rise in the hotspot will make coastal cities and sur-rounding areas increasingly vulnerable to fl ooding by adding to the height that storm
surge and breaking waves reach on the coast.”
To determine accelerations of sea-level rise, USGS scientists analyzed tide-gauge data throughout much of North America in a way that removed long-term (linear) trends associated with vertical land move-ments. This analysis allowed them to fo-cus on recent changes in rates of sea-level rise, caused, for example, by changes in ocean circulation.
The full citation for the report is:Sallenger, A.H., Jr., Doran, K.S.,
and Howd, P.A., 2012, Hotspot of ac-celerated sea-level rise on the Atlantic coast of North America: Nature Climate Change, published online June 24, 2012, doi:10.1038/nclimate1597 [http://dx.doi.org/10.1038/nclimate1597].
Differences in rates of sea-level rise from tide-gauge records across North America over a 60-year period (1950–2009). Circles are color coded to refl ect computed differences; no color fi ll indicates differ-ences in rates of sea-level rise that are not statistically different from zero. Cool colors indicate decreasing rates of sea-level rise over the 60-year period; warm colors indicate increasing rates of sea-level rise over the 60-year period. Note “hotspot” between Cape Hatteras and Cape Cod. After fi gure 2 in “Hotspot of Accelerated Sea-Level Rise on the Atlantic Coast of North America” (http://dx.doi.org/10.1038/nclimate1597).
The Hawaiian Islands’ largest atoll, French Frigate Shoals, is key to under-standing how seabird-nesting habitat will change with predicted rising sea levels, according to a team of U.S. Geological Survey (USGS) biologists.
The team, led by research wildlife biol-ogist Michelle Reynolds of the USGS Pa-cifi c Island Ecosystems Research Center, studied the population dynamics of eight seabird species on French Frigate Shoals, an isolated atoll of low-lying coral islands in the Northwestern Hawaiian Islands
Hawaiian Seabirds on Low-Lying Atoll Vulnerable to Sea-Level Rise By Michelle Reynolds and Barbara Wilcox
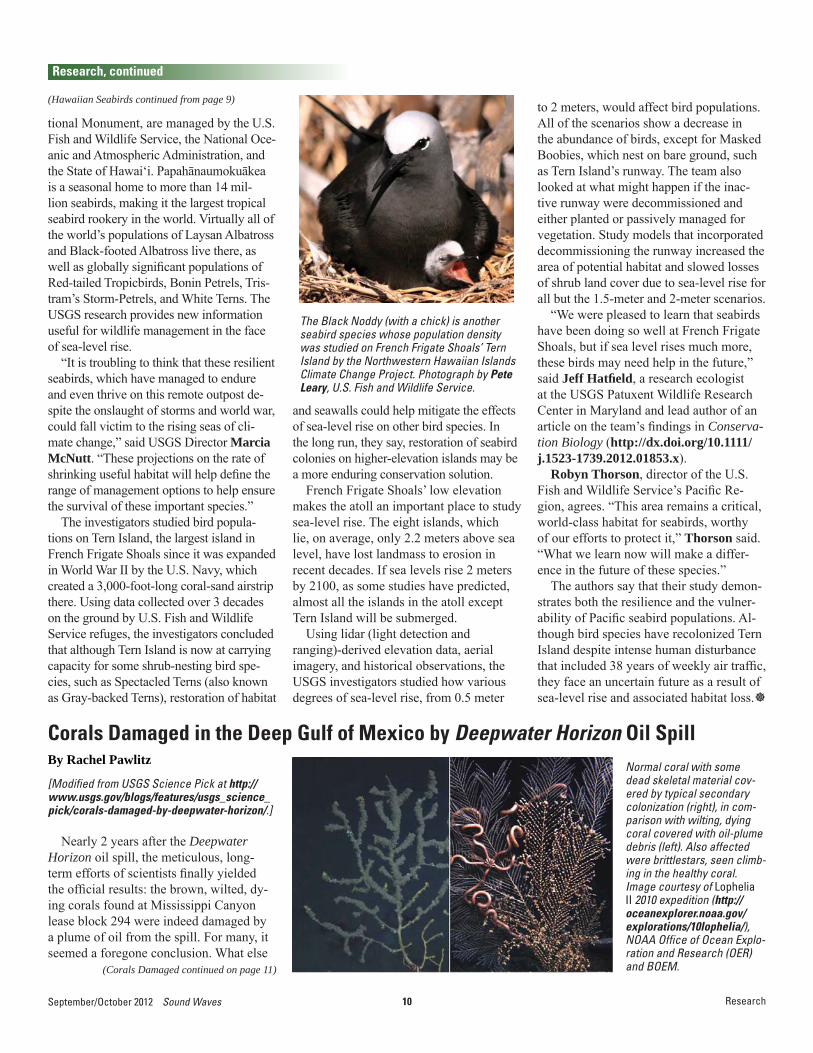
The White Tern is one of eight seabird spe-cies whose population density and suscepti-bility to sea-level rise were studied on French Frigate Shoals’ Tern Island by biologists with the USGS Pacifi c Island Ecosystems Research Center’s Northwestern Hawaiian Islands Climate Change Project. Photograph by C. Cornett, U.S. Fish and Wildlife Service.
about halfway between the main Hawaiian Islands and Midway Atoll in the mid-Pa-cifi c. These islands, which are part of the Hawaiian Islands National Wildlife Ref-uge and Papahānaumokuākea Marine Na-
(Hawaiian Seabirds continued on page 10)
10September/October 2012 Sound Waves Research
(Hawaiian Seabirds continued from page 9)
(Corals Damaged continued on page 11)
Research, continued
tional Monument, are managed by the U.S. Fish and Wildlife Service, the National Oce-anic and Atmospheric Administration, and the State of Hawai‘i. Papahānaumokuākea is a seasonal home to more than 14 mil-lion seabirds, making it the largest tropical seabird rookery in the world. Virtually all of the world’s populations of Laysan Albatross and Black-footed Albatross live there, as well as globally signifi cant populations of Red-tailed Tropicbirds, Bonin Petrels, Tris-tram’s Storm-Petrels, and White Terns. The USGS research provides new information useful for wildlife management in the face of sea-level rise.
“It is troubling to think that these resilient seabirds, which have managed to endure and even thrive on this remote outpost de-spite the onslaught of storms and world war, could fall victim to the rising seas of cli-mate change,” said USGS Director Marcia McNutt. “These projections on the rate of shrinking useful habitat will help defi ne the range of management options to help ensure the survival of these important species.”
The investigators studied bird popula-tions on Tern Island, the largest island in French Frigate Shoals since it was expanded in World War II by the U.S. Navy, which created a 3,000-foot-long coral-sand airstrip there. Using data collected over 3 decades on the ground by U.S. Fish and Wildlife Service refuges, the investigators concluded that although Tern Island is now at carrying capacity for some shrub-nesting bird spe-cies, such as Spectacled Terns (also known as Gray-backed Terns), restoration of habitat
and seawalls could help mitigate the effects of sea-level rise on other bird species. In the long run, they say, restoration of seabird colonies on higher-elevation islands may be a more enduring conservation solution.
French Frigate Shoals’ low elevation makes the atoll an important place to study sea-level rise. The eight islands, which lie, on average, only 2.2 meters above sea level, have lost landmass to erosion in recent decades. If sea levels rise 2 meters by 2100, as some studies have predicted, almost all the islands in the atoll except Tern Island will be submerged.
Using lidar (light detection and ranging)-derived elevation data, aerial imagery, and historical observations, the USGS investigators studied how various degrees of sea-level rise, from 0.5 meter
to 2 meters, would affect bird populations. All of the scenarios show a decrease in the abundance of birds, except for Masked Boobies, which nest on bare ground, such as Tern Island’s runway. The team also looked at what might happen if the inac-tive runway were decommissioned and either planted or passively managed for vegetation. Study models that incorporated decommissioning the runway increased the area of potential habitat and slowed losses of shrub land cover due to sea-level rise for all but the 1.5-meter and 2-meter scenarios.
“We were pleased to learn that seabirds have been doing so well at French Frigate Shoals, but if sea level rises much more, these birds may need help in the future,” said Jeff Hatfi eld, a research ecologist at the USGS Patuxent Wildlife Research Center in Maryland and lead author of an article on the team’s fi ndings in Conserva-tion Biology (http://dx.doi.org/10.1111/j.1523-1739.2012.01853.x).
Robyn Thorson, director of the U.S. Fish and Wildlife Service’s Pacifi c Re-gion, agrees. “This area remains a critical, world-class habitat for seabirds, worthy of our efforts to protect it,” Thorson said. “What we learn now will make a differ-ence in the future of these species.”
The authors say that their study demon-strates both the resilience and the vulner-ability of Pacifi c seabird populations. Al-though bird species have recolonized Tern Island despite intense human disturbance that included 38 years of weekly air traffi c, they face an uncertain future as a result of sea-level rise and associated habitat loss.
The Black Noddy (with a chick) is another seabird species whose population density was studied on French Frigate Shoals’ Tern Island by the Northwestern Hawaiian Islands Climate Change Project. Photograph by Pete Leary, U.S. Fish and Wildlife Service.
[Modifi ed from USGS Science Pick at http://www.usgs.gov/blogs/features/usgs_science_pick/corals-damaged-by-deepwater-horizon/.]
Nearly 2 years after the Deepwater Horizon oil spill, the meticulous, long-term efforts of scientists fi nally yielded the offi cial results: the brown, wilted, dy-ing corals found at Mississippi Canyon lease block 294 were indeed damaged by a plume of oil from the spill. For many, it seemed a foregone conclusion. What else
Corals Damaged in the Deep Gulf of Mexico by Deepwater Horizon Oil SpillBy Rachel Pawlitz Normal coral with some
dead skeletal material cov-ered by typical secondary colonization (right), in com-parison with wilting, dying coral covered with oil-plume debris (left). Also affected were brittlestars, seen climb-ing in the healthy coral. Image courtesy of Lophelia II 2010 expedition (http://oceanexplorer.noaa.gov/explorations/10lophelia/), NOAA Offi ce of Ocean Explo-ration and Research (OER) and BOEM.
11 Sound Waves September/October 2012
(Corals Damaged continued from page 10)
Research, continued
Research
(Corals Damaged continued on page 12)
could brown gunk (fl occulent matter, if you’re a scientist) covering damaged cor-als 7 miles from the Deepwater Horizon drill site be, if not oil from the spill? Yet, to this team of scientists, it was worth taking a close look at the evidence with two-dimensional gas chromatography, sediment cores, coral samples, and mosaic imagery. Why? Because so much was at stake.
To understand the damage in the deep, the scientists had to start by understanding what was down there before the spill. To support that mission, enter U.S. Geological Survey (USGS) research benthic ecologist Amanda Demopoulos (http://profi le.usgs.gov/ademopoulos), who studies life on the seafl oor to describe what types of organisms typically live together in deep-sea communities. Her work involves digging sediment cores from the ocean bottom and sorting through the many tiny life forms found there. (For example, see “Scientists Cruise Deep Into Coral Ecosystems,” Sound Waves, December 2009, http://soundwaves.usgs.gov/2009/12/fi eldwork2.html.)
In addition to deep-sea coral ecosys-tems, Demopoulos studies communities in parts of the Gulf where oil naturally seeps up from the seafl oor and is in fact a wellspring of life, not a source of damage. Chemosynthetic ecosystems—the ones where food webs are based on chemicals rather than sunlight—tend to host different life forms, such as tubeworms.
Demopoulos was on the November 2010 research expedition that fi rst discov-ered the damaged corals. Led by biology professor Charles Fisher of the Pennsyl-vania State University (http://bio.psu.edu/directory/crf2) and funded by the Bureau of Ocean and Energy Management (BOEM) and the National Oceanographic and Atmospheric Administration (NOAA), the expedition’s goal was to build a scien-tifi c understanding of the various undersea ecosystems. It was part of a decades-long collaborative effort among federal and uni-versity scientists to explore deep-sea eco-systems in order to provide sound baseline information for management decisions about how to best balance natural-resource use with protection. Demopoulos recalled
any secondary colonization, as we’d seen in the past on dead coral.”
The fact that no new animals, such as barnacles or hydroids, had begun to attach and grow on the dead corals suggested that the coral deaths had been recent, noted Demopoulos. This process, known as secondary colonization, is commonly observed on dead corals but takes time to occur.
In December 2010, barely a month after the discovery of the damaged coral, Fisher led a followup expedition to further ex-amine the damaged corals, supported by a special National Science Foundation RAP-ID grant. Fisher, along with assistant pro-fessor of chemistry Helen White of Haver-ford College (http://www.haverford.edu/faculty/hwhite), directed the coral-damage
assessment in collaboration with scientists from Woods Hole Oceanographic Institu-tion, Temple University, the USGS, and the BOEM. On the basis of her expertise with sediment samples, Demopoulos worked with White and Fisher to design the best approach for assessing the corals at the Mississippi Canyon lease block 294 for the presence of oil and the extent of damage.
“The challenge we faced in this study was piecing together what happened from multiple lines of evidence, because no one was sitting on the seafl oor when the plume went by. The corals were the only witness,” said Demopoulos. “We had to consider the proximity to the Deepwater Horizon site and the fact that a deep-water plume had recently passed over the site,
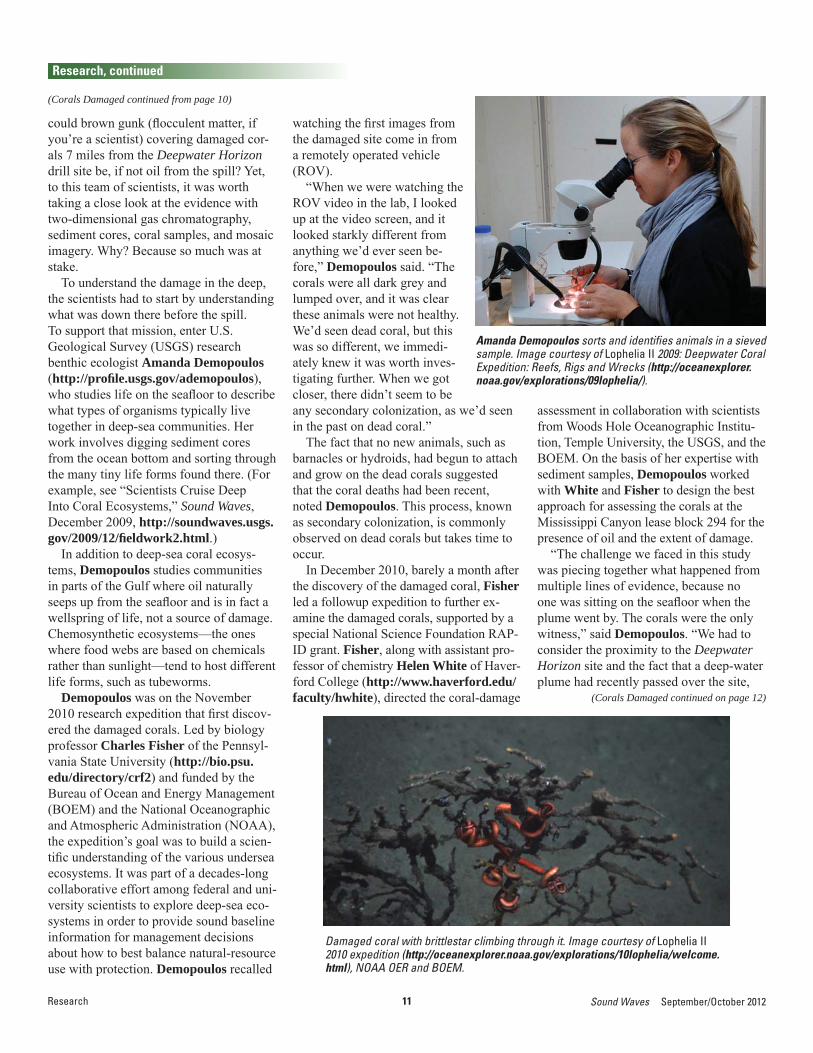
Amanda Demopoulos sorts and identifi es animals in a sieved sample. Image courtesy of Lophelia II 2009: Deepwater Coral Expedition: Reefs, Rigs and Wrecks (http://oceanexplorer.noaa.gov/explorations/09lophelia/).
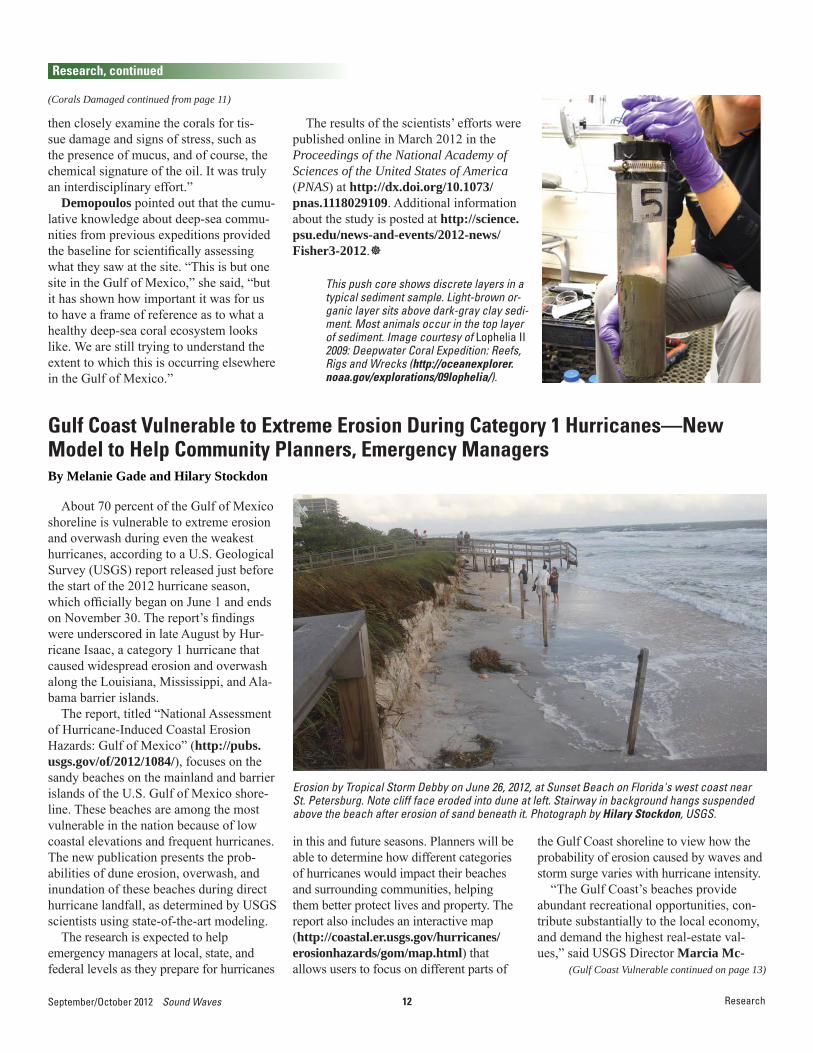
Damaged coral with brittlestar climbing through it. Image courtesy of Lophelia II 2010 expedition (http://oceanexplorer.noaa.gov/explorations/10lophelia/welcome.html), NOAA OER and BOEM.
watching the fi rst images from the damaged site come in from a remotely operated vehicle (ROV).
“When we were watching the ROV video in the lab, I looked up at the video screen, and it looked starkly different from anything we’d ever seen be-fore,” Demopoulos said. “The corals were all dark grey and lumped over, and it was clear these animals were not healthy. We’d seen dead coral, but this was so different, we immedi-ately knew it was worth inves-tigating further. When we got closer, there didn’t seem to be
12September/October 2012 Sound Waves
Research, continued
Research
(Gulf Coast Vulnerable continued on page 13)
then closely examine the corals for tis-sue damage and signs of stress, such as the presence of mucus, and of course, the chemical signature of the oil. It was truly an interdisciplinary effort.”
Demopoulos pointed out that the cumu-lative knowledge about deep-sea commu-nities from previous expeditions provided the baseline for scientifi cally assessing what they saw at the site. “This is but one site in the Gulf of Mexico,” she said, “but it has shown how important it was for us to have a frame of reference as to what a healthy deep-sea coral ecosystem looks like. We are still trying to understand the extent to which this is occurring elsewhere in the Gulf of Mexico.”
This push core shows discrete layers in a typical sediment sample. Light-brown or-ganic layer sits above dark-gray clay sedi-ment. Most animals occur in the top layer of sediment. Image courtesy of Lophelia II 2009: Deepwater Coral Expedition: Reefs, Rigs and Wrecks (http://oceanexplorer.noaa.gov/explorations/09lophelia/).
The results of the scientists’ efforts were published online in March 2012 in the Proceedings of the National Academy of Sciences of the United States of America (PNAS) at http://dx.doi.org/10.1073/pnas.1118029109. Additional information about the study is posted at http://science.psu.edu/news-and-events/2012-news/Fisher3-2012.
(Corals Damaged continued from page 11)
About 70 percent of the Gulf of Mexico shoreline is vulnerable to extreme erosion and overwash during even the weakest hurricanes, according to a U.S. Geological Survey (USGS) report released just before the start of the 2012 hurricane season, which offi cially began on June 1 and ends on November 30. The report’s fi ndings were underscored in late August by Hur-ricane Isaac, a category 1 hurricane that caused widespread erosion and overwash along the Louisiana, Mississippi, and Ala-bama barrier islands.
The report, titled “National Assessment of Hurricane-Induced Coastal Erosion Hazards: Gulf of Mexico” (http://pubs.usgs.gov/of/2012/1084/), focuses on the sandy beaches on the mainland and barrier islands of the U.S. Gulf of Mexico shore-line. These beaches are among the most vulnerable in the nation because of low coastal elevations and frequent hurricanes. The new publication presents the prob-abilities of dune erosion, overwash, and inundation of these beaches during direct hurricane landfall, as determined by USGS scientists using state-of-the-art modeling.
The research is expected to help emergency managers at local, state, and federal levels as they prepare for hurricanes
Gulf Coast Vulnerable to Extreme Erosion During Category 1 Hurricanes—New Model to Help Community Planners, Emergency ManagersBy Melanie Gade and Hilary Stockdon
in this and future seasons. Planners will be able to determine how different categories of hurricanes would impact their beaches and surrounding communities, helping them better protect lives and property. The report also includes an interactive map (http://coastal.er.usgs.gov/hurricanes/erosionhazards/gom/map.html) that allows users to focus on different parts of
the Gulf Coast shoreline to view how the probability of erosion caused by waves and storm surge varies with hurricane intensity.
“The Gulf Coast’s beaches provide abundant recreational opportunities, con-tribute substantially to the local economy, and demand the highest real-estate val-ues,” said USGS Director Marcia Mc-
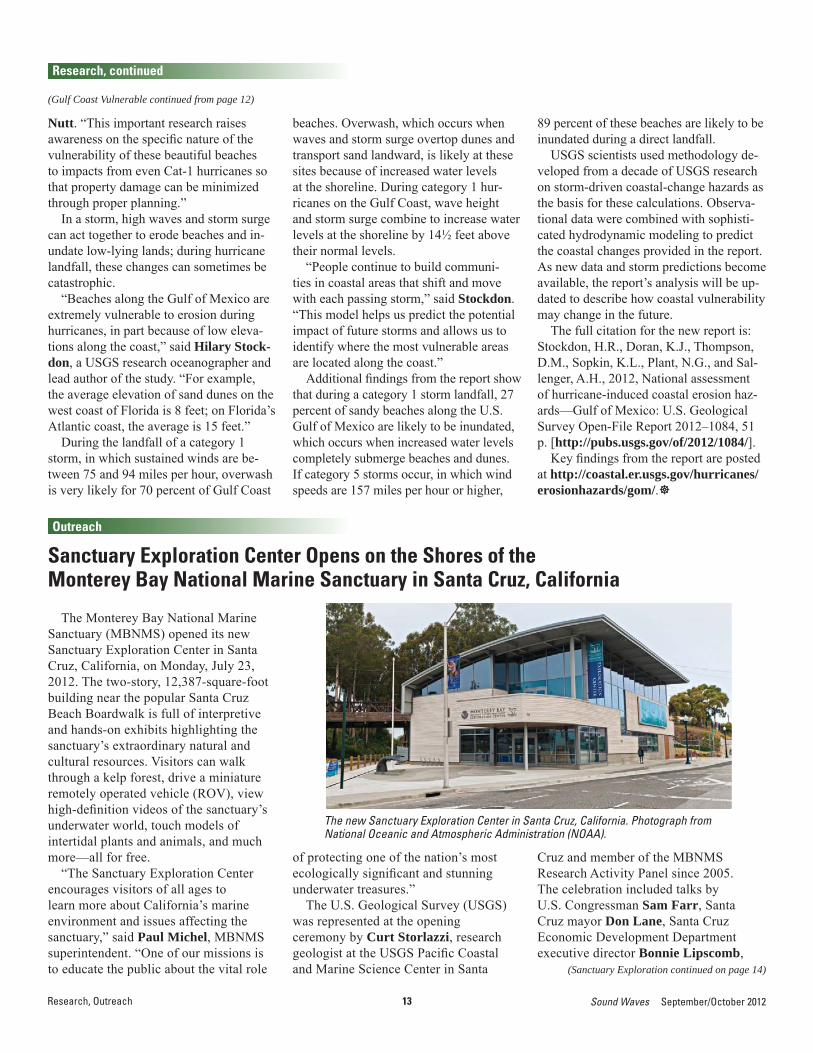
Erosion by Tropical Storm Debby on June 26, 2012, at Sunset Beach on Florida's west coast near St. Petersburg. Note cliff face eroded into dune at left. Stairway in background hangs suspended above the beach after erosion of sand beneath it. Photograph by Hilary Stockdon, USGS.
13 Sound Waves September/October 2012Research, Outreach
(Gulf Coast Vulnerable continued from page 12)
Research, continued
Nutt. “This important research raises awareness on the specifi c nature of the vulnerability of these beautiful beaches to impacts from even Cat-1 hurricanes so that property damage can be minimized through proper planning.”
In a storm, high waves and storm surge can act together to erode beaches and in-undate low-lying lands; during hurricane landfall, these changes can sometimes be catastrophic.
“Beaches along the Gulf of Mexico are extremely vulnerable to erosion during hurricanes, in part because of low eleva-tions along the coast,” said Hilary Stock-don, a USGS research oceanographer and lead author of the study. “For example, the average elevation of sand dunes on the west coast of Florida is 8 feet; on Florida’s Atlantic coast, the average is 15 feet.”
During the landfall of a category 1 storm, in which sustained winds are be-tween 75 and 94 miles per hour, overwash is very likely for 70 percent of Gulf Coast
beaches. Overwash, which occurs when waves and storm surge overtop dunes and transport sand landward, is likely at these sites because of increased water levels at the shoreline. During category 1 hur-ricanes on the Gulf Coast, wave height and storm surge combine to increase water levels at the shoreline by 14½ feet above their normal levels.
“People continue to build communi-ties in coastal areas that shift and move with each passing storm,” said Stockdon. “This model helps us predict the potential impact of future storms and allows us to identify where the most vulnerable areas are located along the coast.”
Additional fi ndings from the report show that during a category 1 storm landfall, 27 percent of sandy beaches along the U.S. Gulf of Mexico are likely to be inundated, which occurs when increased water levels completely submerge beaches and dunes. If category 5 storms occur, in which wind speeds are 157 miles per hour or higher,
89 percent of these beaches are likely to be inundated during a direct landfall.
USGS scientists used methodology de-veloped from a decade of USGS research on storm-driven coastal-change hazards as the basis for these calculations. Observa-tional data were combined with sophisti-cated hydrodynamic modeling to predict the coastal changes provided in the report. As new data and storm predictions become available, the report’s analysis will be up-dated to describe how coastal vulnerability may change in the future.
The full citation for the new report is:Stockdon, H.R., Doran, K.J., Thompson, D.M., Sopkin, K.L., Plant, N.G., and Sal-lenger, A.H., 2012, National assessment of hurricane-induced coastal erosion haz-ards—Gulf of Mexico: U.S. Geological Survey Open-File Report 2012–1084, 51 p. [http://pubs.usgs.gov/of/2012/1084/].
Key fi ndings from the report are posted at http://coastal.er.usgs.gov/hurricanes/erosionhazards/gom/.
Outreach
The Monterey Bay National Marine Sanctuary (MBNMS) opened its new Sanctuary Exploration Center in Santa Cruz, California, on Monday, July 23, 2012. The two-story, 12,387-square-foot building near the popular Santa Cruz Beach Boardwalk is full of interpretive and hands-on exhibits highlighting the sanctuary’s extraordinary natural and cultural resources. Visitors can walk through a kelp forest, drive a miniature remotely operated vehicle (ROV), view high-defi nition videos of the sanctuary’s underwater world, touch models of intertidal plants and animals, and much more—all for free.
“The Sanctuary Exploration Center encourages visitors of all ages to learn more about California’s marine environment and issues affecting the sanctuary,” said Paul Michel, MBNMS superintendent. “One of our missions is to educate the public about the vital role
Sanctuary Exploration Center Opens on the Shores of the Monterey Bay National Marine Sanctuary in Santa Cruz, California
of protecting one of the nation’s most ecologically signifi cant and stunning underwater treasures.”
The U.S. Geological Survey (USGS) was represented at the opening ceremony by Curt Storlazzi, research geologist at the USGS Pacifi c Coastal and Marine Science Center in Santa
Cruz and member of the MBNMS Research Activity Panel since 2005. The celebration included talks by U.S. Congressman Sam Farr, Santa Cruz mayor Don Lane, Santa Cruz Economic Development Department executive director Bonnie Lipscomb,
The new Sanctuary Exploration Center in Santa Cruz, California. Photograph from National Oceanic and Atmospheric Administration (NOAA).
(Sanctuary Exploration continued on page 14)
14September/October 2012 Sound Waves
Outreach, continued
Outreach
MBNMS superintendent Paul Michel, and California Secretary for Natural Resources John Laird. After speeches and a kelp-cutting ceremony, the doors of the new center were opened to the public, who swarmed in to explore the displays.
One of the exhibits, titled “Geology: The Sanctuary’s Foundation,” has as its centerpiece a contribution from the USGS Pacifi c Coastal and Marine Science Center: a sweeping (21 feet wide by 5 feet tall) perspective view of the sanctuary seafl oor and the central California coast created by scientist Pete Dartnell from data collected by the USGS and its partners. The view is the background for six panels that highlight the varied terrain in the sanctuary, from nearshore habitats to submarine canyons and undersea mountains. The USGS perspective view was requested by Lisa Uttal, marine scientist and interim director of the Sanctuary Exploration Center.
Docents stationed throughout the center answer questions about the exhibits, help visitors drive the miniature ROV, and provide information about additional ways to enjoy the sanctuary, such as whale watching and kayaking tours. Nearly a thousand visitors came through the center on opening day, and daily visitor counts have remained high ever since. “It’s a really well designed center,” said one opening-day visitor. “It’s full of inviting activities, but it’s not overwhelming. Although I could happily
(Sanctuary Exploration continued from page 13)
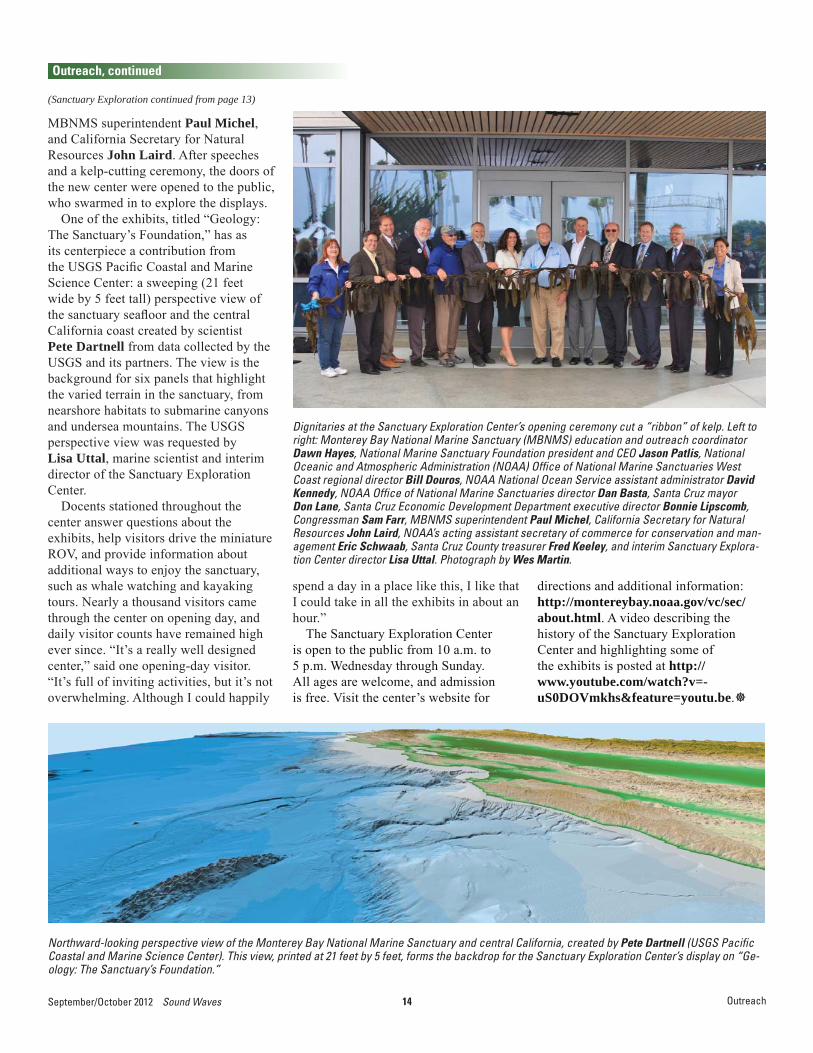
Dignitaries at the Sanctuary Exploration Center’s opening ceremony cut a “ribbon” of kelp. Left to right: Monterey Bay National Marine Sanctuary (MBNMS) education and outreach coordinator Dawn Hayes, National Marine Sanctuary Foundation president and CEO Jason Patlis, National Oceanic and Atmospheric Administration (NOAA) Offi ce of National Marine Sanctuaries West Coast regional director Bill Douros, NOAA National Ocean Service assistant administrator David Kennedy, NOAA Offi ce of National Marine Sanctuaries director Dan Basta, Santa Cruz mayor Don Lane, Santa Cruz Economic Development Department executive director Bonnie Lipscomb, Congressman Sam Farr, MBNMS superintendent Paul Michel, California Secretary for Natural Resources John Laird, NOAA’s acting assistant secretary of commerce for conservation and man-agement Eric Schwaab, Santa Cruz County treasurer Fred Keeley, and interim Sanctuary Explora-tion Center director Lisa Uttal. Photograph by Wes Martin.
Northward-looking perspective view of the Monterey Bay National Marine Sanctuary and central California, created by Pete Dartnell (USGS Pacifi c Coastal and Marine Science Center). This view, printed at 21 feet by 5 feet, forms the backdrop for the Sanctuary Exploration Center’s display on “Ge-ology: The Sanctuary’s Foundation.”
spend a day in a place like this, I like that I could take in all the exhibits in about an hour.”
The Sanctuary Exploration Center is open to the public from 10 a.m. to 5 p.m. Wednesday through Sunday. All ages are welcome, and admission is free. Visit the center’s website for
directions and additional information: http://montereybay.noaa.gov/vc/sec/about.html. A video describing the history of the Sanctuary Exploration Center and highlighting some of the exhibits is posted at http://www.youtube.com/watch?v=-uS0DOVmkhs&feature=youtu.be.
15 Sound Waves September/October 2012
(ECS Workshop continued on page 16)
Meetings
Meetings
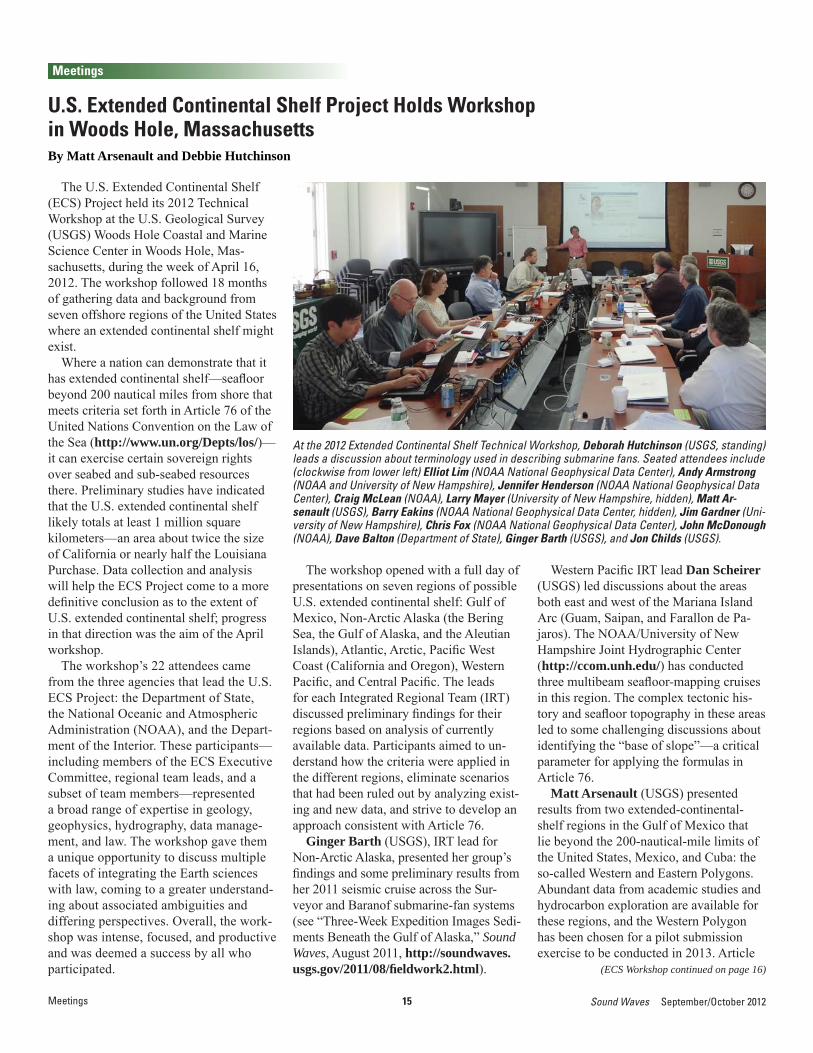
The U.S. Extended Continental Shelf (ECS) Project held its 2012 Technical Workshop at the U.S. Geological Survey (USGS) Woods Hole Coastal and Marine Science Center in Woods Hole, Mas-sachusetts, during the week of April 16, 2012. The workshop followed 18 months of gathering data and background from seven offshore regions of the United States where an extended continental shelf might exist.
Where a nation can demonstrate that it has extended continental shelf—seafl oor beyond 200 nautical miles from shore that meets criteria set forth in Article 76 of the United Nations Convention on the Law of the Sea (http://www.un.org/Depts/los/)—it can exercise certain sovereign rights over seabed and sub-seabed resources there. Preliminary studies have indicated that the U.S. extended continental shelf likely totals at least 1 million square kilometers—an area about twice the size of California or nearly half the Louisiana Purchase. Data collection and analysis will help the ECS Project come to a more defi nitive conclusion as to the extent of U.S. extended continental shelf; progress in that direction was the aim of the April workshop.
The workshop’s 22 attendees came from the three agencies that lead the U.S. ECS Project: the Department of State, the National Oceanic and Atmospheric Administration (NOAA), and the Depart-ment of the Interior. These participants—including members of the ECS Executive Committee, regional team leads, and a subset of team members—represented a broad range of expertise in geology, geophysics, hydrography, data manage-ment, and law. The workshop gave them a unique opportunity to discuss multiple facets of integrating the Earth sciences with law, coming to a greater understand-ing about associated ambiguities and differing perspectives. Overall, the work-shop was intense, focused, and productive and was deemed a success by all who participated.
U.S. Extended Continental Shelf Project Holds Workshop in Woods Hole, MassachusettsBy Matt Arsenault and Debbie Hutchinson
The workshop opened with a full day of presentations on seven regions of possible U.S. extended continental shelf: Gulf of Mexico, Non-Arctic Alaska (the Bering Sea, the Gulf of Alaska, and the Aleutian Islands), Atlantic, Arctic, Pacifi c West Coast (California and Oregon), Western Pacifi c, and Central Pacifi c. The leads for each Integrated Regional Team (IRT) discussed preliminary fi ndings for their regions based on analysis of currently available data. Participants aimed to un-derstand how the criteria were applied in the different regions, eliminate scenarios that had been ruled out by analyzing exist-ing and new data, and strive to develop an approach consistent with Article 76.
Ginger Barth (USGS), IRT lead for Non-Arctic Alaska, presented her group’s fi ndings and some preliminary results from her 2011 seismic cruise across the Sur-veyor and Baranof submarine-fan systems (see “Three-Week Expedition Images Sedi-ments Beneath the Gulf of Alaska,” Sound Waves, August 2011, http://soundwaves.usgs.gov/2011/08/fi eldwork2.html).
Western Pacifi c IRT lead Dan Scheirer (USGS) led discussions about the areas both east and west of the Mariana Island Arc (Guam, Saipan, and Farallon de Pa-jaros). The NOAA/University of New Hampshire Joint Hydrographic Center (http://ccom.unh.edu/) has conducted three multibeam seafl oor-mapping cruises in this region. The complex tectonic his-tory and seafl oor topography in these areas led to some challenging discussions about identifying the “base of slope”—a critical parameter for applying the formulas in Article 76.
Matt Arsenault (USGS) presented results from two extended-continental-shelf regions in the Gulf of Mexico that lie beyond the 200-nautical-mile limits of the United States, Mexico, and Cuba: the so-called Western and Eastern Polygons. Abundant data from academic studies and hydrocarbon exploration are available for these regions, and the Western Polygon has been chosen for a pilot submission exercise to be conducted in 2013. Article
At the 2012 Extended Continental Shelf Technical Workshop, Deborah Hutchinson (USGS, standing) leads a discussion about terminology used in describing submarine fans. Seated attendees include (clockwise from lower left) Elliot Lim (NOAA National Geophysical Data Center), Andy Armstrong (NOAA and University of New Hampshire), Jennifer Henderson (NOAA National Geophysical Data Center), Craig McLean (NOAA), Larry Mayer (University of New Hampshire, hidden), Matt Ar-senault (USGS), Barry Eakins (NOAA National Geophysical Data Center, hidden), Jim Gardner (Uni-versity of New Hampshire), Chris Fox (NOAA National Geophysical Data Center), John McDonough (NOAA), Dave Balton (Department of State), Ginger Barth (USGS), and Jon Childs (USGS).
16September/October 2012 Sound Waves
Meetings, continued
(ECS Workshop continued from page 15)
(GIS User Group continued on page 17)
Meetings
76 of the Convention on the Law of the Sea calls for coastal nations to submit data and other material concerning the limits of their extended continental shelves to the Commission on the Outer Limits of the Continental Shelf for the commission’s consideration and advice. Although the U.S. has not ratifi ed the Convention on the Law of the Sea, the ECS Project is using the Article 76 guidelines to understand and map where the U.S. could potentially have an extended continental shelf. Arsenault will work with colleagues from the NOAA National Geophysical Data Center (NGDC) and the Department of State to draft the pilot submission for the Western Polygon.
The other team leads who presented regional results were Larry Mayer (Uni-versity of New Hampshire, Atlantic IRT), Andy Armstrong (NOAA, Arctic IRT), Barry Eakins (NOAA, Central Pacifi c IRT), and Jennifer Henderson (NOAA, Pacifi c West Coast IRT).
Topical presentations throughout the week included discussions on “natural prolongation” (a scientifi c term interpreted within the legal framework of the Conven-tion), sediment fans, seamounts, trenches, the nature of downslope processes, and the use of seismic data for determining sedi-ment thickness. Jason Chaytor (USGS), a member of the Atlantic IRT, presented results from his studies of downslope processes on the Atlantic margin. Mapped features such as landslides and debris fl ows represent possible areas where a base-of-slope zone may be located.
Deborah Hutchinson (USGS) present-ed a comprehensive overview of the needs and pitfalls in collecting, processing, and interpreting seismic data and how these data are used to determine sediment thick-ness, which she illustrated with examples from the Arctic and the Atlantic. Signifi -cant seismic data have been collected in the Arctic as part of the ECS Project (for example, see Sound Waves articles at
http://soundwaves.usgs.gov/2012/02/, http://soundwaves.usgs.gov/2010/08/, and http://soundwaves.usgs.gov/2009/04/).
Among other contributions, the group benefi ted from remote participation by Rick Saltus (USGS), Pat Hart (USGS), and representatives of the NGDC and the Bureau of Ocean Energy Management (BOEM). Part of the workshop was dedi-cated to planning for data needs and future ship time.
The group met again in Washington, D.C., in late June 2012 to review decisions and recommendations from the April tech-nical workshop, engage senior government managers, and construct the roadmap for doing all the remaining work identifi ed in the April workshop.
Additional information about the proj-ect and the participating agencies is posted on the ECS Project website (http://www.continentalshelf.gov) and the USGS proj-ect website (http://walrus.wr.usgs.gov/research/projects/lawofsea.html).
The second biannual meeting of the Monterey Bay Marine GIS User Group was held Thursday, July 19, 2012, at the National Oceanic and Atmospheric Ad-ministration (NOAA) Southwest Fisheries Science Center in Santa Cruz, California. A GIS (geographic information system) is a computer-based system for storing, manipulating, analyzing, and managing all types of geographically referenced infor-mation. The goals of this user group are to foster collaboration among academic institutions, the private sector, government agencies, and nongovernmental organiza-tions (NGOs) in the Monterey Bay marine GIS science community; to facilitate hands-on GIS training; and to increase awareness of marine spatial datasets with-in the broader GIS science community in the Monterey Bay area.
Approximately 65 members of the coastal and marine community, including GIS users, marine scientists, and policy makers, gathered to hear four presenta-
Second Biannual Meeting of the Monterey Bay Marine GIS User GroupBy Nadine Golden
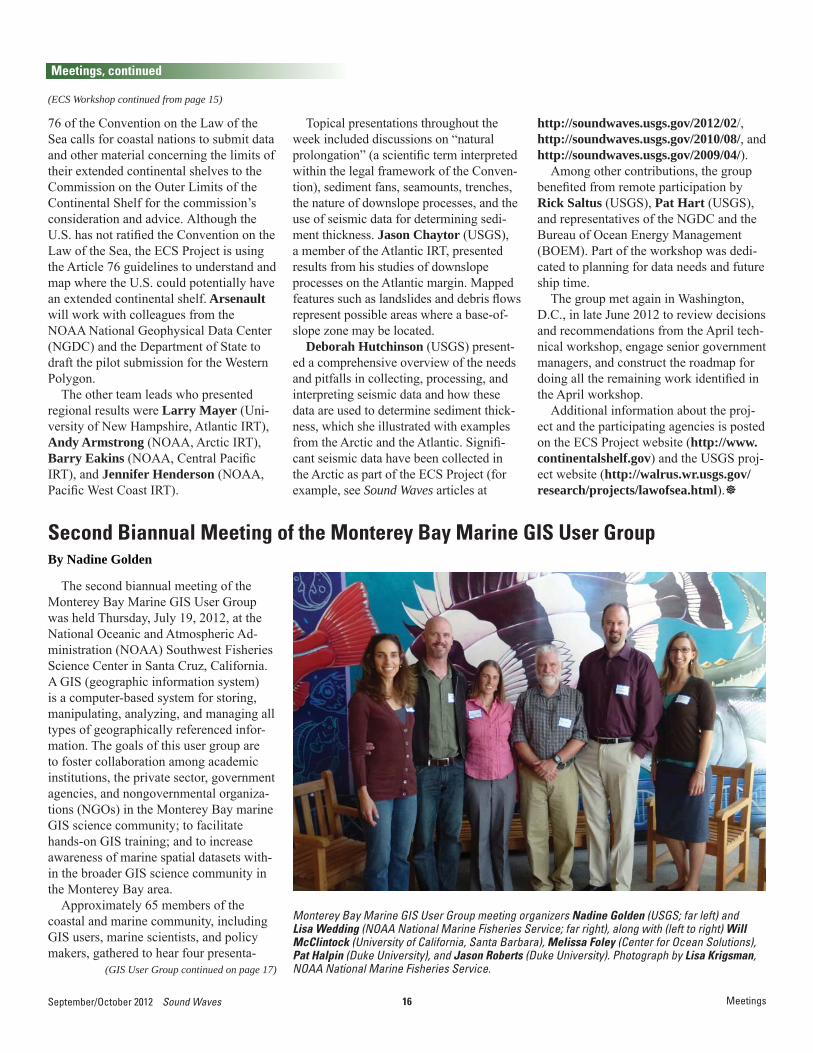
Monterey Bay Marine GIS User Group meeting organizers Nadine Golden (USGS; far left) and Lisa Wedding (NOAA National Marine Fisheries Service; far right), along with (left to right) Will McClintock (University of California, Santa Barbara), Melissa Foley (Center for Ocean Solutions), Pat Halpin (Duke University), and Jason Roberts (Duke University). Photograph by Lisa Krigsman, NOAA National Marine Fisheries Service.
17 Sound Waves September/October 2012
Meetings, continued
(GIS User Group continued from page 16)
Meetings
tions that focused on current GIS and scientifi c research and GIS tools. The keynote speaker, Patrick Halpin, director of the Marine Geospatial Ecology Lab at Duke University (http://mgel.env.duke.edu/), began the day with a talk titled “Il-luminating the Oceans: Using Geospatial Analysis to Better Understand the Marine World.” Halpin discussed the diffi culties faced by marine geospatial scientists when dealing with time and space in the open ocean, and he concluded from his own ex-perience that using the right technical tool set can help overcome these challenges.
Next, Will McClintock (University of California, Santa Barbara) introduced the group to recent advancements in SeaSketch (http://mcclintock.msi.ucsb.edu/projects/seasketch), a widely used GIS tool set specifi cally designed for solving marine geospatial issues. SeaSketch, based on a combination of open-source and Environ-mental Systems Research Institute (ESRI) technologies, provides a new platform for applying collaborative geodesign software to marine spatial planning. (“Geodesign” is an emerging fi eld that integrates geo-graphic science with spatial design; learn more at http://www.esri.com/technology-topics/geodesign/.) With the help of friends and colleagues in the audience, McClintock demonstrated the decision-support tool under development at the Marine Science Institute of the University of California, Santa Barbara. This platform for collaborative ocean planning allows public participants to contribute their ideas to the marine spatial planning discussions via a web browser and the Internet.
After a lunch of networking and social-izing, Jason Roberts (Duke University), developer of Marine Geospatial Ecology Tools (MGET; http://mgel.env.duke.edu/mget/), gave an overview of this free, open-source geoprocessing toolbox designed for coastal and marine GIS analysis. MGET can be invoked from most programming languages and includes more than 300 tools designed for and requested by marine researchers.
The closing speaker, Melissa Foley (Center for Ocean Solutions), highlighted a study that assessed the cumulative im-pact of multiple human activities in Mon-
terey Bay, California. (Learn more about quantifying cumulative impacts at http://www.centerforoceansolutions.org/initia-tives/cumulative-impacts.)
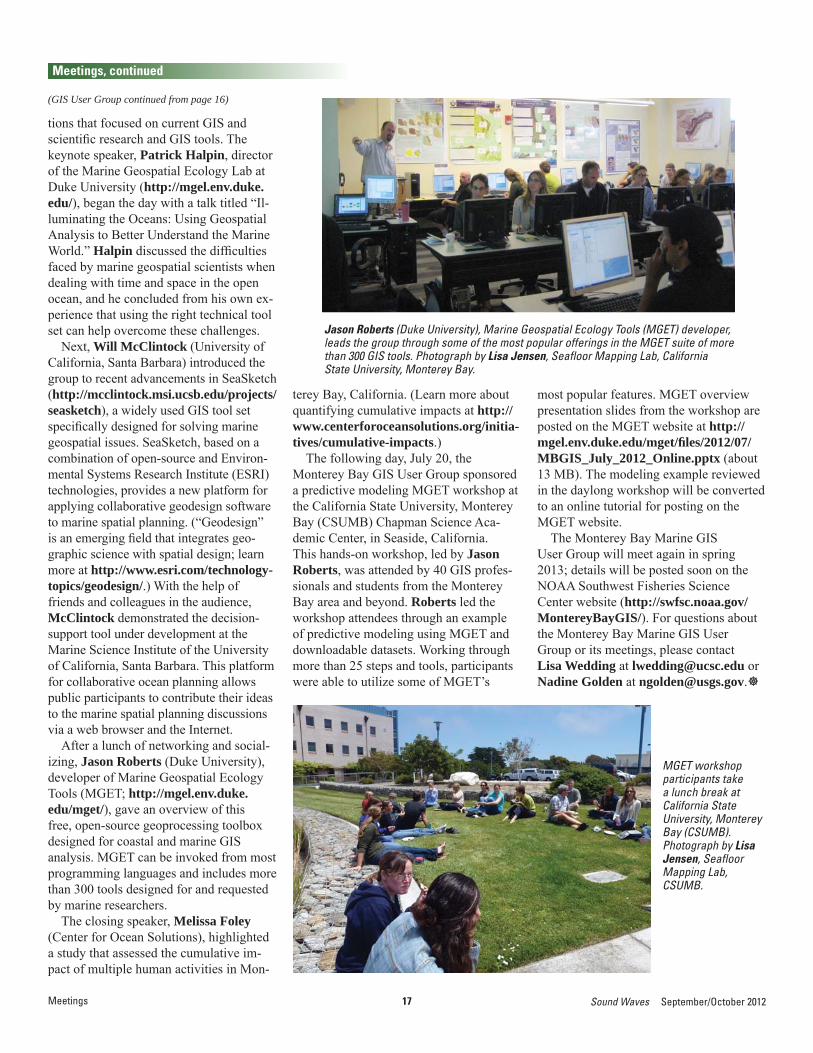
The following day, July 20, the Monterey Bay GIS User Group sponsored a predictive modeling MGET workshop at the California State University, Monterey Bay (CSUMB) Chapman Science Aca-demic Center, in Seaside, California. This hands-on workshop, led by Jason Roberts, was attended by 40 GIS profes-sionals and students from the Monterey Bay area and beyond. Roberts led the workshop attendees through an example of predictive modeling using MGET and downloadable datasets. Working through more than 25 steps and tools, participants were able to utilize some of MGET’s
most popular features. MGET overview presentation slides from the workshop are posted on the MGET website at http://mgel.env.duke.edu/mget/fi les/2012/07/MBGIS_July_2012_Online.pptx (about 13 MB). The modeling example reviewed in the daylong workshop will be converted to an online tutorial for posting on the MGET website.
The Monterey Bay Marine GIS User Group will meet again in spring 2013; details will be posted soon on the NOAA Southwest Fisheries Science Center website (http://swfsc.noaa.gov/MontereyBayGIS/). For questions about the Monterey Bay Marine GIS User Group or its meetings, please contact Lisa Wedding at [email protected] or Nadine Golden at [email protected].
Jason Roberts (Duke University), Marine Geospatial Ecology Tools (MGET) developer, leads the group through some of the most popular offerings in the MGET suite of more than 300 GIS tools. Photograph by Lisa Jensen, Seafl oor Mapping Lab, California State University, Monterey Bay.
MGET workshop participants take a lunch break at California State University, Monterey Bay (CSUMB). Photograph by Lisa Jensen, Seafl oor Mapping Lab, CSUMB.
18September/October 2012 Sound Waves
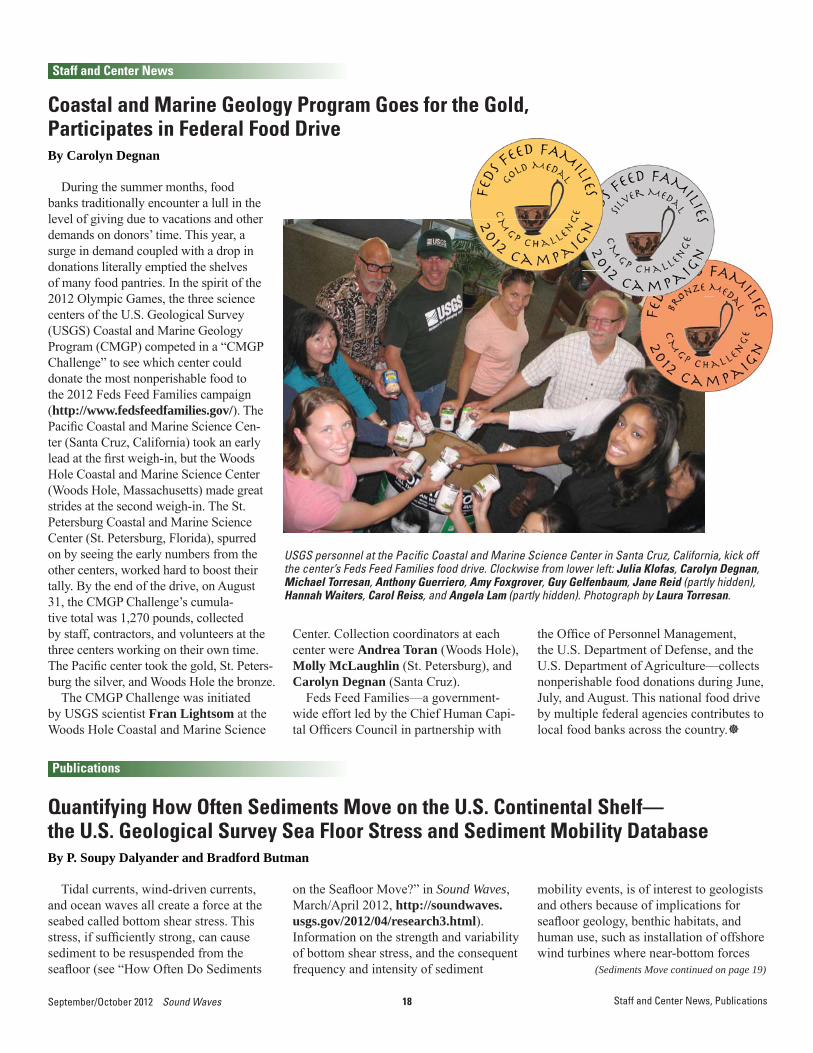
Going for...During the summer months, food banks traditionally encounter a lull in the level of giving due to vacations and other demands on donors’ time. This year, a surge in demand coupled with a drop in donations literally emptied the shelves of many food pantries. In the spirit of the 2012 Olympic Games, the three science centers of the U.S. Geological Survey (USGS) Coastal and Marine Geology Program (CMGP) competed in a “CMGP Challenge” to see which center could donate the most nonperishable food to the 2012 Feds Feed Families campaign (http://www.fedsfeedfamilies.gov/). The Pacifi c Coastal and Marine Science Cen-ter (Santa Cruz, California) took an early lead at the fi rst weigh-in, but the Woods Hole Coastal and Marine Science Center (Woods Hole, Massachusetts) made great strides at the second weigh-in. The St. Petersburg Coastal and Marine Science Center (St. Petersburg, Florida), spurred on by seeing the early numbers from the other centers, worked hard to boost their tally. By the end of the drive, on August 31, the CMGP Challenge’s cumula-tive total was 1,270 pounds, collected
Staff and Center News
(Sediments Move continued on page 19)
Coastal and Marine Geology Program Goes for the Gold, Participates in Federal Food DriveBy Carolyn Degnan
Center. Collection coordinators at each center were Andrea Toran (Woods Hole), Molly McLaughlin (St. Petersburg), and Carolyn Degnan (Santa Cruz).
Feds Feed Families—a government-wide effort led by the Chief Human Capi-tal Offi cers Council in partnership with
USGS personnel at the Pacifi c Coastal and Marine Science Center in Santa Cruz, California, kick off the center’s Feds Feed Families food drive. Clockwise from lower left: Julia Klofas, Carolyn Degnan, Michael Torresan, Anthony Guerriero, Amy Foxgrover, Guy Gelfenbaum, Jane Reid (partly hidden), Hannah Waiters, Carol Reiss, and Angela Lam (partly hidden). Photograph by Laura Torresan.
the Offi ce of Personnel Management, the U.S. Department of Defense, and the U.S. Department of Agriculture—collects nonperishable food donations during June, July, and August. This national food drive by multiple federal agencies contributes to local food banks across the country.
Tidal currents, wind-driven currents, and ocean waves all create a force at the seabed called bottom shear stress. This stress, if suffi ciently strong, can cause sediment to be resuspended from the seafl oor (see “How Often Do Sediments
Publications
Quantifying How Often Sediments Move on the U.S. Continental Shelf—the U.S. Geological Survey Sea Floor Stress and Sediment Mobility DatabaseBy P. Soupy Dalyander and Bradford Butman
on the Seafl oor Move?” in Sound Waves, March/April 2012, http://soundwaves.usgs.gov/2012/04/research3.html). Information on the strength and variability of bottom shear stress, and the consequent frequency and intensity of sediment
mobility events, is of interest to geologists and others because of implications for seafl oor geology, benthic habitats, and human use, such as installation of offshore wind turbines where near-bottom forces
Staff and Center News, Publications
by staff, contractors, and volunteers at the three centers working on their own time. The Pacifi c center took the gold, St. Peters-burg the silver, and Woods Hole the bronze.
The CMGP Challenge was initiated by USGS scientist Fran Lightsom at the Woods Hole Coastal and Marine Science
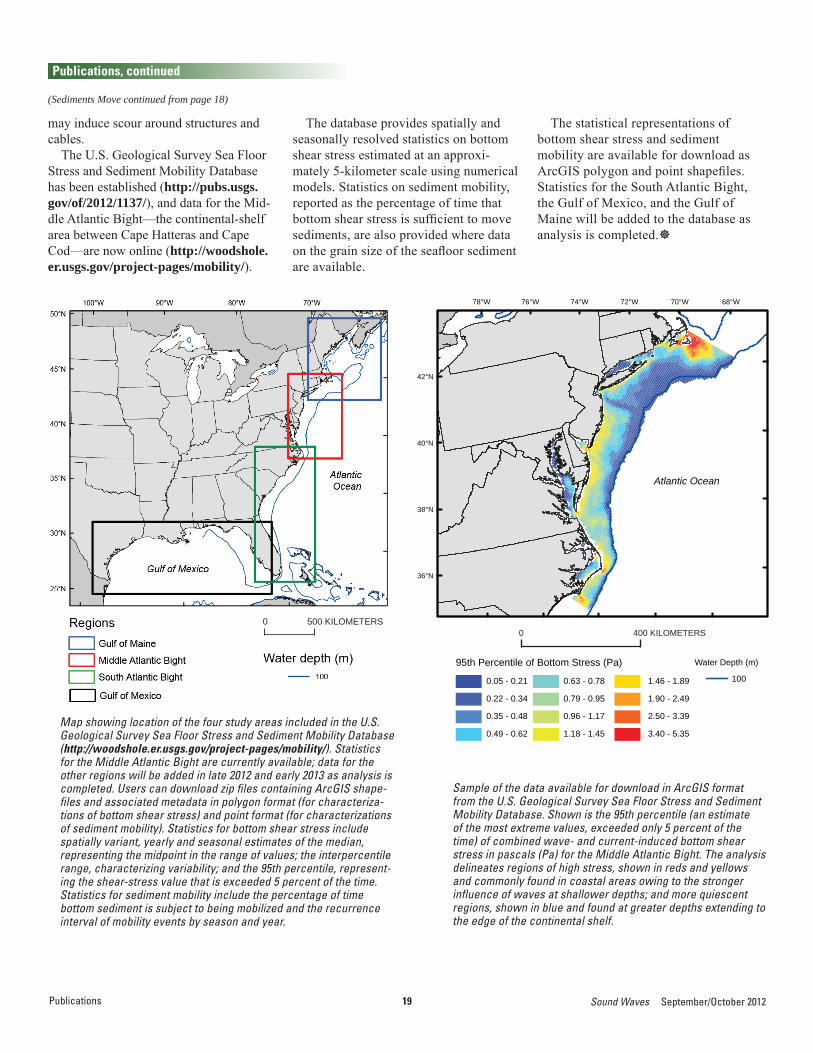
19 Sound Waves September/October 2012
may induce scour around structures and cables.
The U.S. Geological Survey Sea Floor Stress and Sediment Mobility Database has been established (http://pubs.usgs.gov/of/2012/1137/), and data for the Mid-dle Atlantic Bight—the continental-shelf area between Cape Hatteras and Cape Cod—are now online (http://woodshole.er.usgs.gov/project-pages/mobility/).
Publications, continued
(Sediments Move continued from page 18)
0 500 KILOMETERS
68°W70°W72°W74°W76°W78°W
42°N
40°N
38°N
36°N
95th Percentile of Bottom Stress (Pa)
0.05 - 0.21
0.22 - 0.34
0.35 - 0.48
0.49 - 0.62
0.63 - 0.78
0.79 - 0.95
0.96 - 1.17
1.18 - 1.45
1.46 - 1.89
1.90 - 2.49
2.50 - 3.39
3.40 - 5.35
Water Depth (m)
100
Atlantic Ocean
0 400 KILOMETERS
Map showing location of the four study areas included in the U.S. Geological Survey Sea Floor Stress and Sediment Mobility Database (http://woodshole.er.usgs.gov/project-pages/mobility/). Statistics for the Middle Atlantic Bight are currently available; data for the other regions will be added in late 2012 and early 2013 as analysis is completed. Users can download zip fi les containing ArcGIS shape-fi les and associated metadata in polygon format (for characteriza-tions of bottom shear stress) and point format (for characterizations of sediment mobility). Statistics for bottom shear stress include spatially variant, yearly and seasonal estimates of the median, representing the midpoint in the range of values; the interpercentile range, characterizing variability; and the 95th percentile, represent-ing the shear-stress value that is exceeded 5 percent of the time. Statistics for sediment mobility include the percentage of time bottom sediment is subject to being mobilized and the recurrence interval of mobility events by season and year.
Sample of the data available for download in ArcGIS format from the U.S. Geological Survey Sea Floor Stress and Sediment Mobility Database. Shown is the 95th percentile (an estimate of the most extreme values, exceeded only 5 percent of the time) of combined wave- and current-induced bottom shear stress in pascals (Pa) for the Middle Atlantic Bight. The analysis delineates regions of high stress, shown in reds and yellows and commonly found in coastal areas owing to the stronger infl uence of waves at shallower depths; and more quiescent regions, shown in blue and found at greater depths extending to the edge of the continental shelf.
The database provides spatially and seasonally resolved statistics on bottom shear stress estimated at an approxi-mately 5-kilometer scale using numerical models. Statistics on sediment mobility, reported as the percentage of time that bottom shear stress is suffi cient to move sediments, are also provided where data on the grain size of the seafl oor sediment are available.
The statistical representations of bottom shear stress and sediment mobility are available for download as ArcGIS polygon and point shapefi les. Statistics for the South Atlantic Bight, the Gulf of Mexico, and the Gulf of Maine will be added to the database as analysis is completed.
Publications
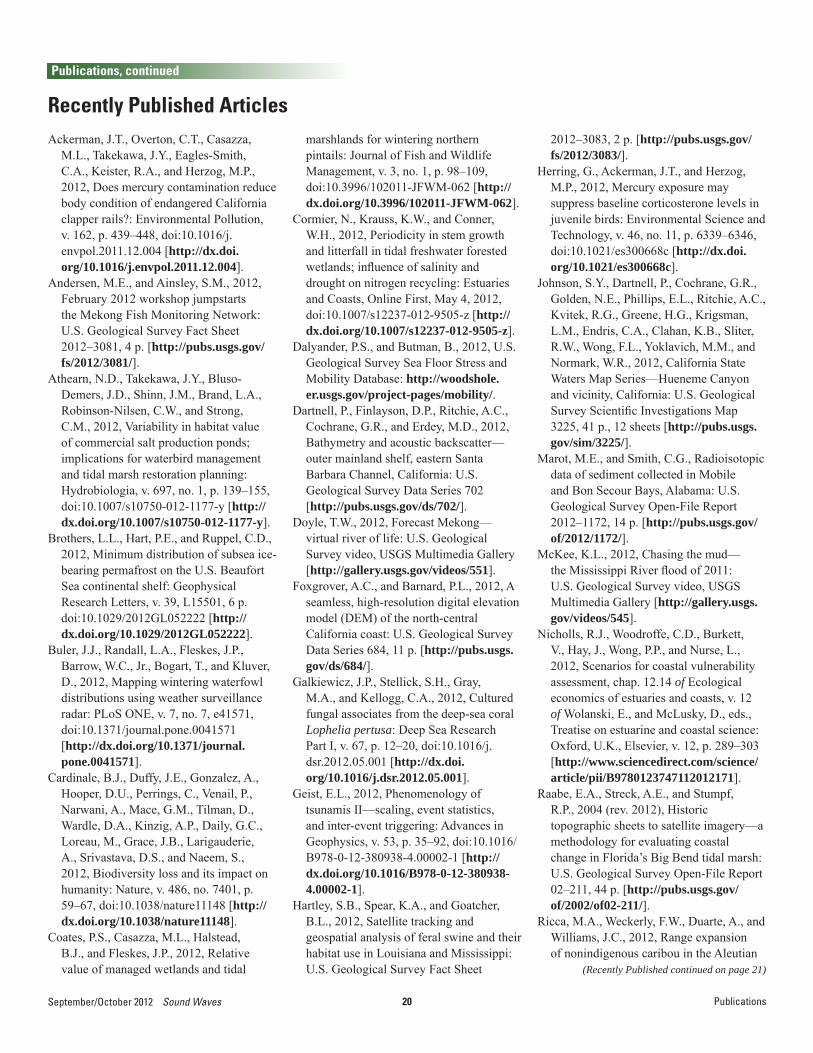
20September/October 2012 Sound Waves
Publications, continued
Ackerman, J.T., Overton, C.T., Casazza, M.L., Takekawa, J.Y., Eagles-Smith, C.A., Keister, R.A., and Herzog, M.P., 2012, Does mercury contamination reduce body condition of endangered California clapper rails?: Environmental Pollution, v. 162, p. 439–448, doi:10.1016/j.envpol.2011.12.004 [http://dx.doi.org/10.1016/j.envpol.2011.12.004].
Andersen, M.E., and Ainsley, S.M., 2012, February 2012 workshop jumpstarts the Mekong Fish Monitoring Network: U.S. Geological Survey Fact Sheet 2012–3081, 4 p. [http://pubs.usgs.gov/fs/2012/3081/].
Athearn, N.D., Takekawa, J.Y., Bluso-Demers, J.D., Shinn, J.M., Brand, L.A., Robinson-Nilsen, C.W., and Strong, C.M., 2012, Variability in habitat value of commercial salt production ponds; implications for waterbird management and tidal marsh restoration planning: Hydrobiologia, v. 697, no. 1, p. 139–155, doi:10.1007/s10750-012-1177-y [http://dx.doi.org/10.1007/s10750-012-1177-y].
Brothers, L.L., Hart, P.E., and Ruppel, C.D., 2012, Minimum distribution of subsea ice-bearing permafrost on the U.S. Beaufort Sea continental shelf: Geophysical Research Letters, v. 39, L15501, 6 p. doi:10.1029/2012GL052222 [http://dx.doi.org/10.1029/2012GL052222].
Buler, J.J., Randall, L.A., Fleskes, J.P., Barrow, W.C., Jr., Bogart, T., and Kluver, D., 2012, Mapping wintering waterfowl distributions using weather surveillance radar: PLoS ONE, v. 7, no. 7, e41571, doi:10.1371/journal.pone.0041571 [http://dx.doi.org/10.1371/journal.pone.0041571].
Cardinale, B.J., Duffy, J.E., Gonzalez, A., Hooper, D.U., Perrings, C., Venail, P., Narwani, A., Mace, G.M., Tilman, D., Wardle, D.A., Kinzig, A.P., Daily, G.C., Loreau, M., Grace, J.B., Larigauderie, A., Srivastava, D.S., and Naeem, S., 2012, Biodiversity loss and its impact on humanity: Nature, v. 486, no. 7401, p. 59–67, doi:10.1038/nature11148 [http://dx.doi.org/10.1038/nature11148].
Coates, P.S., Casazza, M.L., Halstead, B.J., and Fleskes, J.P., 2012, Relative value of managed wetlands and tidal
Recently Published Articlesmarshlands for wintering northern pintails: Journal of Fish and Wildlife Management, v. 3, no. 1, p. 98–109, doi:10.3996/102011-JFWM-062 [http://dx.doi.org/10.3996/102011-JFWM-062].
Cormier, N., Krauss, K.W., and Conner, W.H., 2012, Periodicity in stem growth and litterfall in tidal freshwater forested wetlands; infl uence of salinity and drought on nitrogen recycling: Estuaries and Coasts, Online First, May 4, 2012, doi:10.1007/s12237-012-9505-z [http://dx.doi.org/10.1007/s12237-012-9505-z].
Dalyander, P.S., and Butman, B., 2012, U.S. Geological Survey Sea Floor Stress and Mobility Database: http://woodshole.er.usgs.gov/project-pages/mobility/.
Dartnell, P., Finlayson, D.P., Ritchie, A.C., Cochrane, G.R., and Erdey, M.D., 2012, Bathymetry and acoustic backscatter—outer mainland shelf, eastern Santa Barbara Channel, California: U.S. Geological Survey Data Series 702 [http://pubs.usgs.gov/ds/702/].
Doyle, T.W., 2012, Forecast Mekong—virtual river of life: U.S. Geological Survey video, USGS Multimedia Gallery [http://gallery.usgs.gov/videos/551].
Foxgrover, A.C., and Barnard, P.L., 2012, A seamless, high-resolution digital elevation model (DEM) of the north-central California coast: U.S. Geological Survey Data Series 684, 11 p. [http://pubs.usgs.gov/ds/684/].
Galkiewicz, J.P., Stellick, S.H., Gray, M.A., and Kellogg, C.A., 2012, Cultured fungal associates from the deep-sea coral Lophelia pertusa: Deep Sea Research Part I, v. 67, p. 12–20, doi:10.1016/j.dsr.2012.05.001 [http://dx.doi.org/10.1016/j.dsr.2012.05.001].
Geist, E.L., 2012, Phenomenology of tsunamis II—scaling, event statistics, and inter-event triggering: Advances in Geophysics, v. 53, p. 35–92, doi:10.1016/B978-0-12-380938-4.00002-1 [http://dx.doi.org/10.1016/B978-0-12-380938-4.00002-1].
Hartley, S.B., Spear, K.A., and Goatcher, B.L., 2012, Satellite tracking and geospatial analysis of feral swine and their habitat use in Louisiana and Mississippi: U.S. Geological Survey Fact Sheet
2012–3083, 2 p. [http://pubs.usgs.gov/fs/2012/3083/].
Herring, G., Ackerman, J.T., and Herzog, M.P., 2012, Mercury exposure may suppress baseline corticosterone levels in juvenile birds: Environmental Science and Technology, v. 46, no. 11, p. 6339–6346, doi:10.1021/es300668c [http://dx.doi.org/10.1021/es300668c].
Johnson, S.Y., Dartnell, P., Cochrane, G.R., Golden, N.E., Phillips, E.L., Ritchie, A.C., Kvitek, R.G., Greene, H.G., Krigsman, L.M., Endris, C.A., Clahan, K.B., Sliter, R.W., Wong, F.L., Yoklavich, M.M., and Normark, W.R., 2012, California State Waters Map Series—Hueneme Canyon and vicinity, California: U.S. Geological Survey Scientifi c Investigations Map 3225, 41 p., 12 sheets [http://pubs.usgs.gov/sim/3225/].
Marot, M.E., and Smith, C.G., Radioisotopic data of sediment collected in Mobile and Bon Secour Bays, Alabama: U.S. Geological Survey Open-File Report 2012–1172, 14 p. [http://pubs.usgs.gov/of/2012/1172/].
McKee, K.L., 2012, Chasing the mud—the Mississippi River fl ood of 2011: U.S. Geological Survey video, USGS Multimedia Gallery [http://gallery.usgs.gov/videos/545].
Nicholls, R.J., Woodroffe, C.D., Burkett, V., Hay, J., Wong, P.P., and Nurse, L., 2012, Scenarios for coastal vulnerability assessment, chap. 12.14 of Ecological economics of estuaries and coasts, v. 12 of Wolanski, E., and McLusky, D., eds., Treatise on estuarine and coastal science: Oxford, U.K., Elsevier, v. 12, p. 289–303 [http://www.sciencedirect.com/science/article/pii/B9780123747112012171].
Raabe, E.A., Streck, A.E., and Stumpf, R.P., 2004 (rev. 2012), Historic topographic sheets to satellite imagery—a methodology for evaluating coastal change in Florida’s Big Bend tidal marsh: U.S. Geological Survey Open-File Report 02–211, 44 p. [http://pubs.usgs.gov/of/2002/of02-211/].
Ricca, M.A., Weckerly, F.W., Duarte, A., and Williams, J.C., 2012, Range expansion of nonindigenous caribou in the Aleutian
(Recently Published continued on page 21)
Publications
21 Sound Waves September/October 2012
archipelago of Alaska: Biological Invasions, v. 14, no. 9, p. 1779–1784, doi:10.1007/s10530-012-0195-z [http://dx.doi.org/10.1007/s10530-012-0195-z].
Richwine, K.A., and Osterman, L.E., 2012, Benthic foraminiferal census data from Mobile Bay, Alabama; counts of surface samples and box cores: U.S. Geological Survey Data Series 704 [http://pubs.usgs.gov/ds/704/].
Ringelman, K.M., Eadie, J.M., and Ackerman, J.T., 2012, Density-dependent nest predation in waterfowl; the relative importance of nest density versus nest dispersion: Oecologia, v. 169, no. 3, p. 695–702, doi:10.1007/s00442-011-2228-1 [http://dx.doi.org/10.1007/s00442-011-2228-1].
Sallenger, A.H., Jr., Doran, K.S., and Howd, P.A., 2012, Hotspot of accelerated sea-level rise on the Atlantic coast of North America: Nature Climate Change, published online June 24, 2012, doi:10.1038/NCLIMATE1597 [http://dx.doi.org/10.1038/NCLIMATE1597].
Sherwood, C.R., Dickhudt, P.J., Martini, M.A., Montgomery, E.T., and Boss, E.S, 2012, Profi le measurements and data from the 2011 Optics, Acoustics, and Stress In Situ (OASIS) project at the Martha’s Vineyard Coastal Observatory: U.S. Geological Survey Open File Report 2012–1178 [http://pubs.usgs.gov/of/2012/1178/].
Stidolph, S.R., Sterrenburg, F.A.S., Smith, K.E.L., and Kraberg, A., 2012, Stuart R. Stidolph Diatom Atlas: U.S. Geological Survey Open-File Report 2012–1163 [http://pubs.usgs.gov/of/2012/1163/].
Snedden, G.A., and Swenson, E.M., 2012, Hydrologic index development and application to selected Coastwide Reference Monitoring System sites and Coastal Wetlands Planning, Protection and Restoration Act projects: U.S. Geological Survey Open-File Report 2012–1122, 25 p. [http://pubs.usgs.gov/of/2012/1122/].
Stockdon, H.F., 2012, Tropical Storm Debby [assessment of potential coastal-change impacts], in Coastal change hazards—
Publications, continued
(Recently Published continued from page 20)
Hurricanes and extreme storms: http://coastal.er.usgs.gov/hurricanes/debby/.
Turnipseed, D.P., 2012, Science implementation of Forecast Mekong for food and environmental security: U.S. Geological Survey Fact Sheet 2012–3086, 4 p. [http://pubs.usgs.gov/fs/2012/3086/].
Wong, F.L., Phillips, E.L., Johnson, S.Y., and Sliter, R.W., 2012, Modeling of depth to base of Last Glacial Maximum and seafl oor sediment thickness for the California State Waters Map Series, eastern Santa Barbara Channel, California: U.S. Geological Survey Open-File Report 2012–1161, 16 p. [http://pubs.usgs.gov/of/2012/1161/].
Woo, I., and Takekawa, J.Y., 2012, Will inundation and salinity levels associated with projected sea level rise reduce the survival, growth, and reproductive capacity of Sarcocornia pacifi ca (pickleweed)?: Aquatic Botany, v. 102, p. 8–14, doi:10.1016/j.aquabot.2012.03.014 [http://dx.doi.org/10.1016/j.aquabot.2012.03.014].
(Publications Submitted continued on page 22)
Barnard, P.L., Foxgrover, A., Elias, E., Erikson, L.H., Hein, J.R., McGann, M., Rosenbauer, R., Runtzel, K., Swarzenski, P., Takesue, R., Wong, F., and Woodrow, D., Identifying beach sand sources and pathways in the San Francisco Bay coastal system through the intergration of bed characteristics, geochemical tracers, current measurements, and numerical modeling [abs.]: American Geophysical Union Fall Meeting, San Francisco, Calif., December 3–7, 2012.
Barth, G.A., Scheirer, D.S., Christeson, G.L., Stern, R.J., and Scholl, D.W., New geophysical constraints on the tectonic history of the Bering Sea [abs.]: American Geophysical Union Fall Meeting, San Francisco, Calif., December 3–7, 2012.
Beeson, J.W., Goldfi nger, C., and Johnson, S.Y., Investigation of the offshore section of the northern San Andreas fault; slip partitioning, shallow deformation, and fault trend infl uence [abs.]: American Geophysical Union Fall Meeting, San Francisco, Calif., December 3–7, 2012.
Publications Submitted for Bureau ApprovalBonisteel-Cormier, J.M., Wright, C.W.,
Fredericks, X., Klipp, E.S., Nagle, D.B., Sallenger, A.H., and Brock, J.C., EAARL coastal topography and imagery—western Louisiana, post-Hurricane Rita, 2005; fi rst surface: U.S. Geological Survey Data Series, DVD.
Calderon, K., Dadisman, S.V., Wiese, D.S., and Phelps, D.C., Archive of digital boomer seismic refl ection data collected in the Atlantic Ocean offshore northeast Florida during USGS cruises 03FGS01 and 03FGS02 in September and October of 2003: U.S. Geological Survey Data Series 670, DVD.
Cochrane, G., Hodson, T., Allee, R.J., Cicchetti, G., Finkbeiner, M.A., Goodin, K.L., Handley, L.R., Madden, C.J., Mayer, G.F., and Shumchenia, E., Use of the Coastal and Marine Ecological Classifi cation Standard (CMECS) for geological studies in the West Arm of Glacier Bay, Alaska [abs.]: American Geophysical Union Fall Meeting, San Francisco, Calif., December 3–7, 2012.
Conrad, J.E., Lee, H.J., Edwards, B.D., McGann, M., and Sliter, R.W., Newly recognized submarine slide complexes in the southern California Bight [abs.]: American Geophysical Union Fall Meeting, San Francisco, Calif., December 3–7, 2012.
Conrad, T.A., Hein, J.R., and Paytan, A., Off-shore to near-shore transects of ferromanganese crusts adjacent to the California margin [abs.]: American Geophysical Union Fall Meeting, San Francisco, Calif., December 3–7, 2012.
Dai, S., Santamarina, J.C., Waite, W.F., and Kneafsey, T.J., Hydrate morphology; patchy hydrate saturation in sands: Journal of Geophysical Research.
Draut, A.E., Logan, J.B., Mastin, M.C., and Ritchie, A.C., Sedimentary deposits and processes in the lower Elwha River, Washington, USA, during dam removal [abs.]: American Geophysical Union Fall Meeting, San Francisco, Calif., December 3–7, 2012.
Publications
22September/October 2012 Sound Waves
Forde, A.S., Dadisman, S.V., Wiese, D.S., and Phelps, D.C., Archive of digital boomer subbottom data collected during USGS cruise 05FGS01 offshore east-central Florida, July 17–29, 2005: U.S. Geological Survey Data Series 647, DVD.
Foxgrover, A.C., and Barnard, P.L., Surfi cial sediment characteristics of the San Francisco Bay coastal system [abs.]: American Geophysical Union Fall Meeting, San Francisco, Calif., December 3–7, 2012.
Ganju, N.K., Dickhudt, P.J., Montgomery, E.T., Brennand, P., Derby, R.K., Brooks, T.W., Guntenspergen, G.R., Martini, M.A., Borden, J., and Baldwin, S., Summary of oceanographic and water-quality measurements near the Blackwater National Wildlife Refuge, 2011: U.S. Geological Survey Open-File Report 2012–1099.
Geist, E.L., and Parsons, T., In search of the largest tsunami—example following the 2011 Japan tsunami [abs.]: American Geophysical Union Fall Meeting, San Francisco, Calif., December 3–7, 2012.
Geist, E.L., Parsons, T., and ten Brink, U.S., Statistical tests of the PTHA Poisson assumption for submarine landslides [abs.]: American Geophysical Union Fall Meeting, San Francisco, Calif., December 3–7, 2012.
Gelfenbaum, G., Stevens, A.W., Miller, I., and Warrick, J.A., Initial coastal morphologic response to dam removal on the Elwha River, WA [abs.]: American Geophysical Union Fall Meeting, San Francisco, Calif., December 3–7, 2012.
He, R., Wooller, J.J., Pohlman, J.W., Quensen, J., Tiedje, J.M., and Leigh, M.B., Shifts in identity and activity of methanotrophs in arctic lake sediments in response to temperature changes: Applied and Environmental Microbiology.
Hoover, D.J., and Barnard, P.L., Recent patterns of morphologic evolution within a structurally controlled littoral cell [abs.]: American Geophysical Union Fall Meeting, San Francisco, Calif., December 3–7, 2012.
Ishii, M., Kiser, E., and Geist, E., A rare seaward expression of oblique subduction; the Mw 8.6 Sumatran earthquake of April 11, 2012 [abs.]: American Geophysical
Union Fall Meeting, San Francisco, Calif., December 3–7, 2012.
Jaffe, B., Gelfenbaum, G., Richmond, B., and Watt, S., Anatomies of sandy tsunami and storm deposits [abs.]: American Geophysical Union Fall Meeting, San Francisco, Calif., December 3–7, 2012.
Johnson, S.Y., and Watt, J.T., Active tectonics and shallow structure of the Hosgri strike-slip fault, offshore central California: Geosphere.
Johnson, S.Y., Watt, J.T., and Hartwell, S.R., Infl uence of fault trend, bends, and convergence on shallow structure, geomorphology, and hazards, Hosgri strike-slip fault, offshore central California [abs.]: American Geophysical Union Fall Meeting, San Francisco, Calif., December 3–7, 2012.
Kratzmann, M.G., Himmelstoss, E.A., Ruggiero, P., Thieler, E.R., and Reid, D., National Assessment of Shoreline Change; a GIS compilation of vector shorelines and associated shoreline change data for the Pacifi c Northwest coast: U.S. Geological Survey Open-File Report 2012–1008.
Kuffner, I.B., Jokiel, P.L., Rodgers, K.S., Andersson, A.J., and Mackenzie, F.T., An apparent “vital” effect of calcifi cation rate on the Sr/Ca temperature proxy in the reef coral Montipora capitata: Geochemistry, Geophysics, Geosystems.
Lacy, J.R., Rubin, D.M., and Buscombe, D., Currents, drag, and sediment transport induced by a tsunami [abs.]: American Geophysical Union Fall Meeting, San Francisco, Calif., December 3–7, 2012.
Lacy, J.R., Rubin, D.M., and Buscombe, D., Currents, drag, and sediment transport induced by a tsunami: Journal of Geophysical Research–Oceans.
LeVoir, M., Gulick, S., Reece, B., and Barth, G., Deposition and evolution of the Baranof Fan, Gulf of Alaska [abs.]: American Geophysical Union Fall Meeting, San Francisco, Calif., December 3–7, 2012.
Lidz, B.H., Reich, C.D., and Shinn, E.A., 2007 [rev.], Systematic mapping of bedrock and habitats along the Florida Reef Tract—Central Key Largo to Halfmoon Shoal (Gulf of Mexico); GIS data: U.S. Geological Survey Professional Paper 1751.
Lorenson, T.D., Hester, K.C., and Collett, T.S., Geochemical monitoring of the gas hydrate production by CO2/CH4 exchange in the Ignik Sikumi Gas Hydrate Production Test Well, Alaska North Slope [abs.]: American Geophysical Union Fall Meeting, San Francisco, Calif., December 3–7, 2012.
Martini, M.A., Warner, J.C., List, J.H., Armstrong, B., and Montgomery, E., Observations of ocean circulation and sediment transport processes offshore of Fire Island, NY: OCEANS Conference, Hampton Roads, Va., October 14–19, 2012, proceedings.
McGann, M., Erikson, L., Wan, E., Powell, C., II, and Maddocks, R.F., Distribution of biologic, anthropogenic, and volcanic constituents as a proxy for sediment transport in the San Francisco Bay coastal system, California [abs.]: American Geophysical Union Fall Meeting, San Francisco, Calif., December 3–7, 2012.
Nosal, A.P., Cartamil, D.C., Long, J.W., Luhrmann, M., Wegner, N.C., and Graham, J.B., Demographic composition, movement patterns, and putative causes of leopard sharks (Triakis semifasciata) aggregating in a marine reserve along the open coast of southern California, USA: Marine Ecology Progress Series.
Ohman, K.A., and Erikson, L.H., Vulnerability of a subarctic barrier spit to global warming induced changes in storm surge and wave runup; Shaktoolik, Alaska [abs.]: American Geophysical Union Fall Meeting, San Francisco, Calif., December 3–7, 2012.
Olabarrieta, M., Warner, J., Zambon, J.B., and He, R., Effects of ocean-wave-atmosphere coupling on wind and wave simulations during Hurricane Isabel: Monthly Weather Review.
Osterman, L.E., Environmental impacts of a shipping channel on foraminifers and sediments in Mobile Bay, AL, USA [abs.]: Geological Society of America Annual Meeting, Charlotte, N.C., November 4–7, 2012.
Osterman, L.E., and Smith, C.G., Over 100 years of environmental change recorded by foraminifers and sediments in a large Gulf of Mexico estuary, Mobile Bay, AL,
Publications, continued
(Publications Submitted continued from page 21)
(Publications Submitted continued on page 23)
Publications
23 Sound Waves September/October 2012
USA: Estuarine and Continental Shelf Science.
Poore, B.S., Wolf, E.B., Korris, E.M., Walter, J.L., and Matthews, G.D., Structures data collection for the National Map using volunteered geographic information: U.S. Geological Survey Open-File Report.
Ralston, D.K., Geyer, W.R., and Warner, J.C., Bathymetric controls on sediment transport in the Hudson River estuary; lateral asymmetry and frontal trapping: Journal of Geophysical Research.
Reece, R., Christeson, G., Gulick, S., Barth, G., and VanAvendonk, H., The effect of plate structure on intraplate volcanism, Kodiak-Bowie Seamount Chain, Gulf of Alaska [abs.]: American Geophysical Union Fall Meeting, San Francisco, Calif., December 3–7, 2012.
Reich, C., Flocks, J., and Davis, J., Geophysical investigation of sentinel lakes in Lake, Seminole, Orange, and Volusia Counties, Florida: U.S. Geological Survey Open-File Report.
Richmond, B., Szczuciński, W., Goto, K., Sugawara, D., Witter, R., Tappin, D., Jaffe, B., Fujino, S., Nishimura, Y., Chagué-Goff, C., Goff, J., and Gelfenbaum, G., Do tsunami depostis thin landward? Observations from the 11 March 2011 Tohoku-oki tsunami on
the Sendai coastal plain [abs.]: American Geophysical Union Fall Meeting, San Francisco, Calif., December 3–7, 2012.
Rubin, D.M., and Newman, C.E., Morphologic and dynamic similarities between polygonal dunes on Mars and interference ripples on Earth [abs.]: American Geophysical Union Fall Meeting, San Francisco, Calif., December 3–7, 2012.
Ryan, H.F., Conrad, J.E., Paull, C.K., and McGann, M., Slip rate on the San Diego Trough fault zone, inner California Borderland, and the 1986 Oceanside earthquake swarm revisited: Seismological Society of America Bulletin.
Ryan, H.F., Draut, A.E., Keranen, K., and Scholl, D.W., Infl uence of the Amlia fracture zone on the evolution of the Aleutian Terrace forearc basin, central Aleutian subduction zone: Geosphere.
Ryan, K., Oglesby, D., and Geist, E., Modelling rupture through stable-sliding zones and implications for an Alaskan-Aleutian megathrust earthquake [abs.]: American Geophysical Union Fall Meeting, San Francisco, Calif., December 3–7, 2012.
Scholl, D.W., Wood, W.T., Barth, G.A., and Childs, J.R., The Bering Sea Basin—new drilling and geophysical observations and evidence for an important contribution
Publications, continued
(Publications Submitted continued from page 22)
of thermogenic methane to interstitial deposits of methane hydrate [abs.]: International Conference on Gas in Marine Sediments, 11th, Nice, France, September 4–6, 2012.
Stern, R.J., Scholl, D.W., Scheirer, D.S., and Barth, G.A., Did the Bering Sea form as a Cenozoic backarc basin? [abs.]: American Geophysical Union Fall Meeting, San Francisco, Calif., December 3–7, 2012.
Takesue, R.K., and Barnard, P.L., Geochemical fi ne-sediment tracers in San Francisco Bay and its outer coast; the role of local watersheds [abs.]: American Geophysical Union Fall Meeting, San Francisco, Calif., December 3–7, 2012.
Wong, F.L., Woodrow, D.L., and McGann, M., Heavy mineral analysis for assessing the provenance of sandy sediment in the San Francisco Bay coastal system [abs.]: American Geophysical Union Fall Meeting, San Francisco, Calif., December 3–7, 2012.
Wood, W.T., Barth, G.A., and Scholl, D.W., Constraints on gas and gas hydrate distribution in the Bering Sea from seismic refl ection data [abs.]: American Geophysical Union Fall Meeting, San Francisco, Calif., December 3–7, 2012.
Xu, J.P., Barry, J.P., and Paull, C.K., Small-scale turbidity currents in a big submarine canyon: Geology.
Publications