Embed Size (px)
Citation preview
March 2020
Fifty States, Fifty Stories: A Decade
of Health Care Reform Under the
Affordable Care Act
Health Care Cost Trends
2
Copyright © 2020 Society of Actuaries
Fifty States, Fifty Stories: A Decade of Health Care Reform Under the Affordable Care Act
Caveat and Disclaimer
The opinions expressed and conclusions reached by the authors are their own and do not represent any official position or opinion of the Society of Actuaries or its members. The Society of Actuaries makes no representation or warranty to the accuracy of the information. Copyright © 2020 by the Society of Actuaries. All rights reserved.
AUTHORS
Paul Houchens, FSA, MAAA
Principal and Consulting Actuary
Milliman
Lindsy Kotecki, FSA, MAAA
Principal and Consulting Actuary
Milliman
Hans Leida, PhD, FSA, MAAA
Principal and Consulting Actuary
Milliman
SPONSOR
Society of Actuaries
Health Care Cost Trends
Strategic Research Program
3
Copyright © 2020 Society of Actuaries
CONTENTS
Executive Summary .................................................................................................................................................. 4
A Decade of Data ...................................................................................................................................................... 7
Uninsured Rate ......................................................................................................................................................... 7 OBSERVATION #1: THE UNINSURED RATE HAS DECLINEDIN THE YEARS SINCE THE ACA WAS PASSED,
BUT THE MEANS BY WHICH THE REDUCTION WAS ACHIEVED DIFFERS FROM CONGRESSIONAL
BUDGET OFFICE PROJECTIONS. ..................................................................................................................................... 7 OBSERVATION #2: STATE DECISIONS TO EXPAND MEDICAID ARE STRONGLY CORRELATED WITH
LARGER REDUCTIONS IN THE PERCENTAGE OF PEOPLE WHO ARE UNINSURED, BUT NON-EXPANSION
STATES ALSO ACHIEVED REDUCTIONS. ....................................................................................................................... 11
Competition in the Exchanges ................................................................................................................................. 12 OBSERVATION #3: PRICE IS A KEY CONSIDERATION (CONSUMERS IN THE INDIVIDUAL MARKET HAVE
SHOWN TO BE VERY PRICE SENSITIVE, CREATING OPPORTUNITIES FOR LOWER-PRICED INSURERS TO
CAPTURE SIGNIFICANT MARKET SHARE). ................................................................................................................... 17 OBSERVATION #4: INSURER COMPETITION IN THE EXCHANGES AND INDIVIDUAL MARKET
PROFITABILITY WERE CONSISTENT WITH THE UNDERWRITING CYCLE. ................................................................... 18
Premium Rate Level and Volatility .......................................................................................................................... 20 OBSERVATION #5: INITIAL EXCHANGE PREMIUM RATES WERE UNSUSTAINABLE. .................................................. 20 OBSERVATION #6: SUBSTANTIAL PREMIUM RATE INCREASES WERE ASSOCIATED WITH POOR
FINANCIAL EXPERIENCE, DECREASES IN COMPETITION, AND POLITICAL UNCERTAINTY. ....................................... 21 OBSERVATION #7: WITH A FEW EXCEPTIONS, INSURERS’ STATE-LEVEL FINANCIAL RESULTS WERE
CONSISTENT WITH NATIONAL TRENDS. ..................................................................................................................... 22 OBSERVATION #8: SUBSIDIZED EXCHANGE CONSUMERS EXPERIENCED LOWER OUT-OF-POCKET
PREMIUM COSTS AS PREMIUM RATES INCREASED IN 2017 AND 2018, WHILE NON-SUBSIDIZED
INDIVIDUAL MARKET ENROLLMENT HAS DROPPED SUBSTANTIALLY AS A RESULT OF DECREASED
COVERAGE AFFORDABILITY. ........................................................................................................................................ 24 OBSERVATION #9: PREMIUMS PLATEAUED WITH GROWTH IN THE NUMBER OF STATES
IMPLEMENTING SECTION 1332 STATE INNOVATION WAIVERS AND IMPROVEMENTS IN INSURER
FINANCIALS................................................................................................................................................................... 27 OBSERVATION #10: THE VAST MAJORITY OF THE REMAINING 30 MILLION UNINSURED PERSONS IN
THE U.S. HAVE INCOME BELOW 250% FPL. ................................................................................................................ 29 OBSERVATION #11: MEDICAID-FOCUSED INSURERS ACHIEVED THE LARGEST MARKET SHARE GAINS IN
THE INDIVIDUAL HEALTH INSURANCE MARKET. ........................................................................................................ 30
Lessons Learned ...................................................................................................................................................... 31
Other Considerations .............................................................................................................................................. 32
Acknowledgments ................................................................................................................................................. 33
Appendix A: Data and Methods .............................................................................................................................. 34
4
Copyright © 2020 Society of Actuaries
Fifty States, Fifty Stories: A Decade of Health Care Reform Under the Affordable Care Act
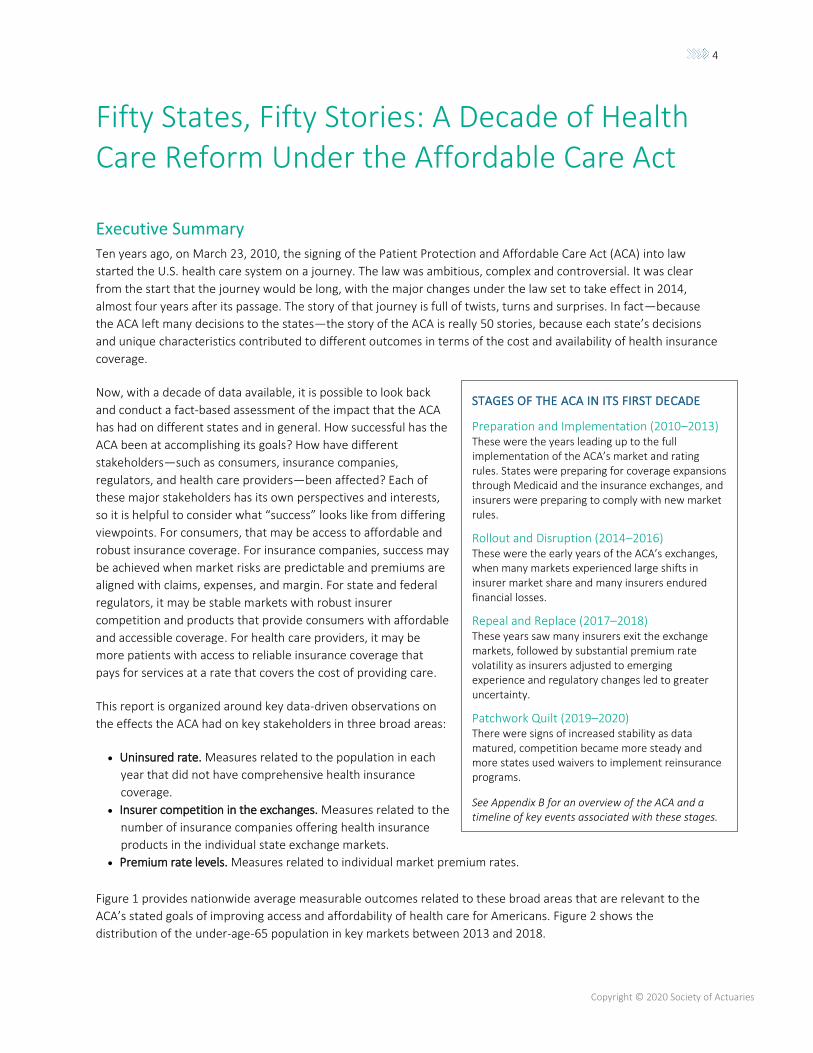
Executive Summary Ten years ago, on March 23, 2010, the signing of the Patient Protection and Affordable Care Act (ACA) into law
started the U.S. health care system on a journey. The law was ambitious, complex and controversial. It was clear
from the start that the journey would be long, with the major changes under the law set to take effect in 2014,
almost four years after its passage. The story of that journey is full of twists, turns and surprises. In fact—because
the ACA left many decisions to the states—the story of the ACA is really 50 stories, because each state’s decisions
and unique characteristics contributed to different outcomes in terms of the cost and availability of health insurance
coverage.
Now, with a decade of data available, it is possible to look back
and conduct a fact-based assessment of the impact that the ACA
has had on different states and in general. How successful has the
ACA been at accomplishing its goals? How have different
stakeholders—such as consumers, insurance companies,
regulators, and health care providers—been affected? Each of
these major stakeholders has its own perspectives and interests,
so it is helpful to consider what “success” looks like from differing
viewpoints. For consumers, that may be access to affordable and
robust insurance coverage. For insurance companies, success may
be achieved when market risks are predictable and premiums are
aligned with claims, expenses, and margin. For state and federal
regulators, it may be stable markets with robust insurer
competition and products that provide consumers with affordable
and accessible coverage. For health care providers, it may be
more patients with access to reliable insurance coverage that
pays for services at a rate that covers the cost of providing care.
This report is organized around key data-driven observations on
the effects the ACA had on key stakeholders in three broad areas:
• Uninsured rate. Measures related to the population in each
year that did not have comprehensive health insurance
coverage.
• Insurer competition in the exchanges. Measures related to the
number of insurance companies offering health insurance
products in the individual state exchange markets.
• Premium rate levels. Measures related to individual market premium rates.
Figure 1 provides nationwide average measurable outcomes related to these broad areas that are relevant to the
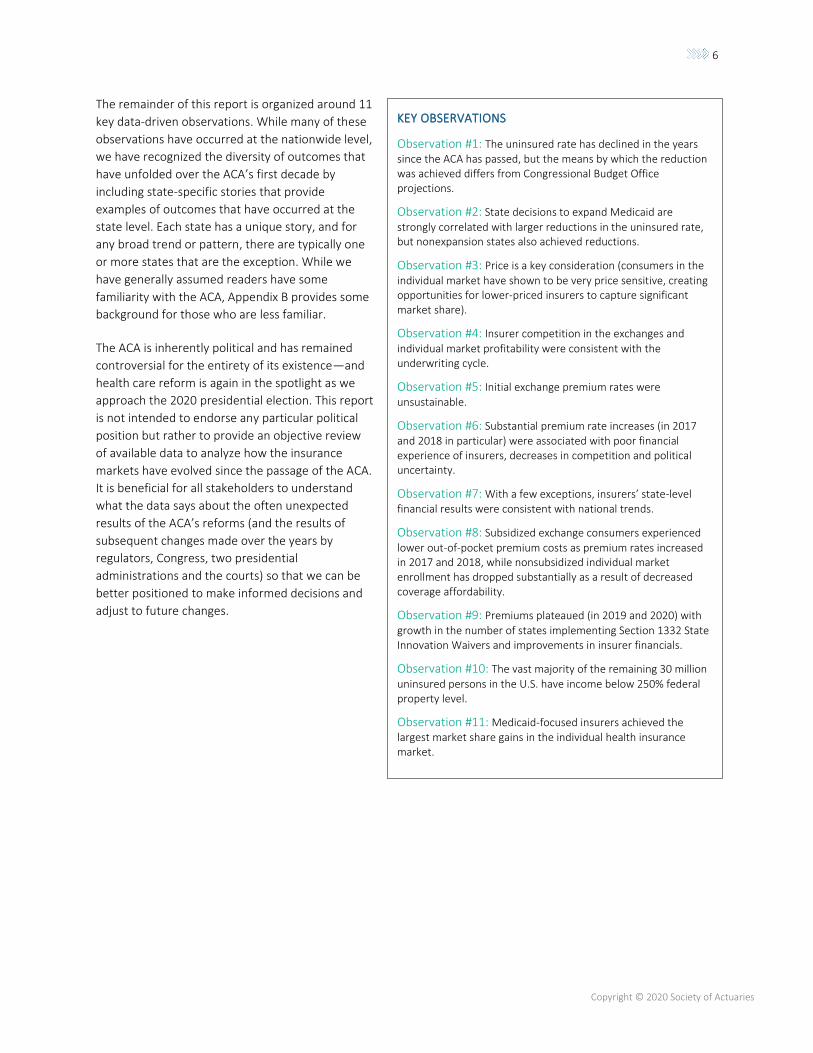
ACA’s stated goals of improving access and affordability of health care for Americans. Figure 2 shows the
distribution of the under-age-65 population in key markets between 2013 and 2018.
STAGES OF THE ACA IN ITS FIRST DECADE
Preparation and Implementation (2010–2013) These were the years leading up to the full implementation of the ACA’s market and rating rules. States were preparing for coverage expansions through Medicaid and the insurance exchanges, and insurers were preparing to comply with new market rules.
Rollout and Disruption (2014–2016) These were the early years of the ACA’s exchanges, when many markets experienced large shifts in insurer market share and many insurers endured financial losses.
Repeal and Replace (2017–2018) These years saw many insurers exit the exchange markets, followed by substantial premium rate volatility as insurers adjusted to emerging experience and regulatory changes led to greater uncertainty.
Patchwork Quilt (2019–2020) There were signs of increased stability as data matured, competition became more steady and more states used waivers to implement reinsurance programs.
See Appendix B for an overview of the ACA and a timeline of key events associated with these stages.
5
Copyright © 2020 Society of Actuaries
Figure 1
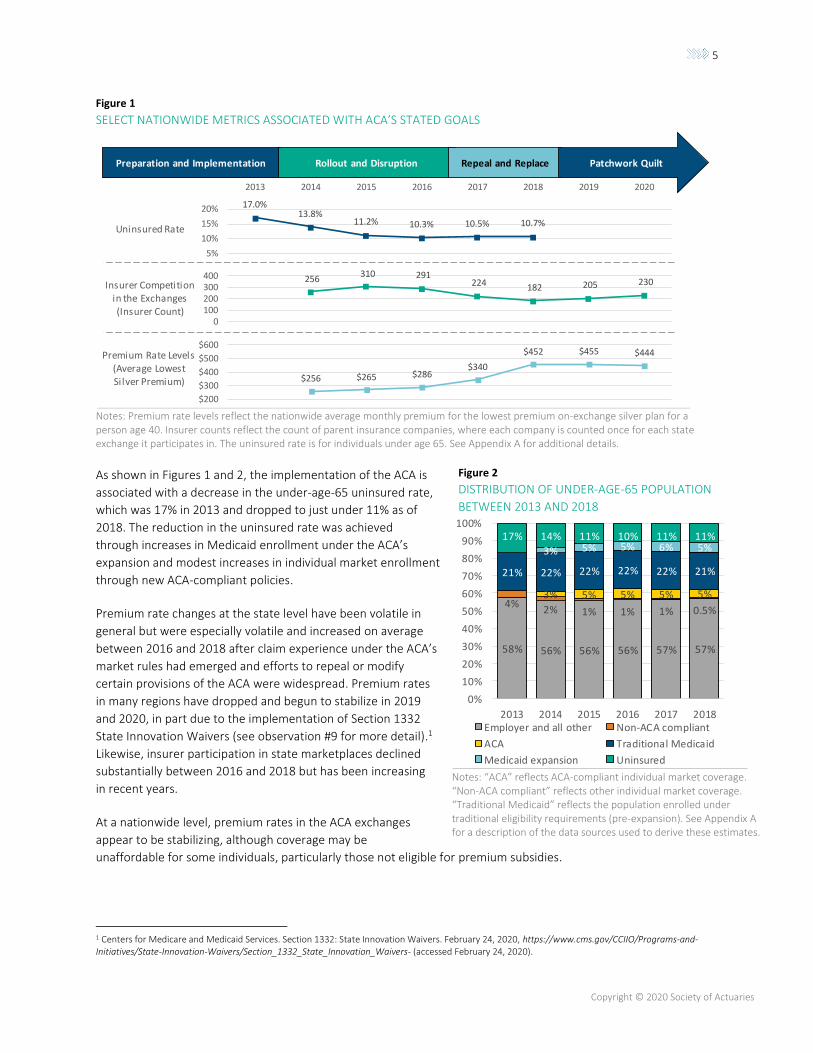
SELECT NATIONWIDE METRICS ASSOCIATED WITH ACA’S STATED GOALS
Notes: Premium rate levels reflect the nationwide average monthly premium for the lowest premium on-exchange silver plan for a person age 40. Insurer counts reflect the count of parent insurance companies, where each company is counted once for each state exchange it participates in. The uninsured rate is for individuals under age 65. See Appendix A for additional details.
As shown in Figures 1 and 2, the implementation of the ACA is
associated with a decrease in the under-age-65 uninsured rate,
which was 17% in 2013 and dropped to just under 11% as of
2018. The reduction in the uninsured rate was achieved
through increases in Medicaid enrollment under the ACA’s
expansion and modest increases in individual market enrollment
through new ACA-compliant policies.
Premium rate changes at the state level have been volatile in
general but were especially volatile and increased on average
between 2016 and 2018 after claim experience under the ACA’s
market rules had emerged and efforts to repeal or modify
certain provisions of the ACA were widespread. Premium rates
in many regions have dropped and begun to stabilize in 2019
and 2020, in part due to the implementation of Section 1332
State Innovation Waivers (see observation #9 for more detail).1
Likewise, insurer participation in state marketplaces declined
substantially between 2016 and 2018 but has been increasing
in recent years.
At a nationwide level, premium rates in the ACA exchanges
appear to be stabilizing, although coverage may be
unaffordable for some individuals, particularly those not eligible for premium subsidies.
1 Centers for Medicare and Medicaid Services. Section 1332: State Innovation Waivers. February 24, 2020, https://www.cms.gov/CCIIO/Programs-and-Initiatives/State-Innovation-Waivers/Section_1332_State_Innovation_Waivers- (accessed February 24, 2020).
$256 $265 $286 $340
$452 $455 $444
$200
$300
$400
$500
$600
Preparation and Implementation Rollout and Disruption Repeal and Replace Patchwork Quilt
256 310 291
224 182 205 230
0100200300400
17.0%13.8%
11.2% 10.3% 10.5% 10.7%
5%
10%
15%
20%
2013 2014 2015 2016 2017 2018 2019 2020
Insurer Competition in the Exchanges (Insurer Count)
Uninsured Rate
Premium Rate Levels(Average Lowest Silver Premium)
Notes: “ACA” reflects ACA-compliant individual market coverage. “Non-ACA compliant” reflects other individual market coverage. “Traditional Medicaid” reflects the population enrolled under traditional eligibility requirements (pre-expansion). See Appendix A for a description of the data sources used to derive these estimates.
Figure 2
DISTRIBUTION OF UNDER-AGE-65 POPULATION
BETWEEN 2013 AND 2018
58% 56% 56% 56% 57% 57%
4%2% 1% 1% 1% 0.5%
3% 5% 5% 5% 5%
21% 22% 22% 22% 22% 21%
3% 5% 5% 6% 5%17% 14% 11% 10% 11% 11%
0%
10%
20%
30%
40%
50%
60%
70%
80%
90%
100%
2013 2014 2015 2016 2017 2018Employer and all other Non-ACA compliant
ACA Traditional Medicaid
Medicaid expansion Uninsured
6
Copyright © 2020 Society of Actuaries
The remainder of this report is organized around 11
key data-driven observations. While many of these
observations have occurred at the nationwide level,
we have recognized the diversity of outcomes that
have unfolded over the ACA’s first decade by
including state-specific stories that provide
examples of outcomes that have occurred at the
state level. Each state has a unique story, and for
any broad trend or pattern, there are typically one
or more states that are the exception. While we
have generally assumed readers have some
familiarity with the ACA, Appendix B provides some
background for those who are less familiar.
The ACA is inherently political and has remained
controversial for the entirety of its existence—and
health care reform is again in the spotlight as we
approach the 2020 presidential election. This report
is not intended to endorse any particular political
position but rather to provide an objective review
of available data to analyze how the insurance
markets have evolved since the passage of the ACA.
It is beneficial for all stakeholders to understand
what the data says about the often unexpected
results of the ACA’s reforms (and the results of
subsequent changes made over the years by
regulators, Congress, two presidential
administrations and the courts) so that we can be
better positioned to make informed decisions and
adjust to future changes.
KEY OBSERVATIONS
Observation #1: The uninsured rate has declined in the years since the ACA has passed, but the means by which the reduction was achieved differs from Congressional Budget Office projections.
Observation #2: State decisions to expand Medicaid are
strongly correlated with larger reductions in the uninsured rate, but nonexpansion states also achieved reductions.
Observation #3: Price is a key consideration (consumers in the
individual market have shown to be very price sensitive, creating opportunities for lower-priced insurers to capture significant market share).
Observation #4: Insurer competition in the exchanges and
individual market profitability were consistent with the underwriting cycle.
Observation #5: Initial exchange premium rates were
unsustainable.
Observation #6: Substantial premium rate increases (in 2017 and 2018 in particular) were associated with poor financial experience of insurers, decreases in competition and political uncertainty.
Observation #7: With a few exceptions, insurers’ state-level financial results were consistent with national trends.
Observation #8: Subsidized exchange consumers experienced
lower out-of-pocket premium costs as premium rates increased in 2017 and 2018, while nonsubsidized individual market enrollment has dropped substantially as a result of decreased coverage affordability.
Observation #9: Premiums plateaued (in 2019 and 2020) with
growth in the number of states implementing Section 1332 State Innovation Waivers and improvements in insurer financials.
Observation #10: The vast majority of the remaining 30 million
uninsured persons in the U.S. have income below 250% federal property level.
Observation #11: Medicaid-focused insurers achieved the largest market share gains in the individual health insurance market.
7
Copyright © 2020 Society of Actuaries
A Decade of Data
We collected a time series of publicly available data on a number of metrics associated with the ACA’s stated goals
of reducing the uninsured rate, increasing competition in the individual health insurance market, and promoting
premium stability and affordability.2 Table 1 outlines the primary outcome metrics we analyzed for each goal, along
with considerations that may be used to assess whether those outcomes were indicative of success in achieving the
goal.
Table 1
OUTCOME MEASURES ASSOCIATED WITH THE ACA’S STATED GOALS
ACA Goal Outcome Metrics Assessment Criteria
Reducing the uninsured rate
▪ Uninsured rate—percentage of the population that does not have comprehensive health insurance coverage
▪ Enrollment in Medicaid and the individual market
Reductions in the uninsured rate and increases in Medicaid and individual market enrollment would suggest improvements in access and/or the affordability of coverage.
Competition in the exchanges
▪ Change in the number of insurers participating in the exchanges
More insurers participating in the exchange fosters competition and more coverage options for consumers. Reductions in the number of insurers signals instability and fewer choices for consumers.
Premium rate level and volatility
▪ Individual market premium rate levels
▪ Changes in individual market premium rates over time
Substantial increases or variability in premium rates indicate growth in health care spending, lack of market stability, or both. Low or moderate premium changes (reflecting changes in health care costs more than changes in the risk profile of consumers or the competitive landscape) are indicative of more stable markets.
After synthesizing and evaluating the data we gathered, we made a number of broad observations, which we
describe throughout the remainder of this report.
Uninsured Rate
OBSERVATION #1: THE UNINSURED RATE HAS DECLINED
IN THE YEARS SINCE THE ACA WAS PASSED, BUT THE
MEANS BY WHICH THE REDUCTION WAS ACHIEVED
DIFFERS FROM CONGRESSIONAL BUDGET OFFICE
PROJECTIONS.
A primary tenet of the ACA was to reduce the uninsured rate
through Medicaid expansion and available federal premium
assistance offered through the public insurance exchanges.
In July 2012, the Congressional Budget Office (CBO)
estimated the national under-age-65 uninsured rate would be 10% in 2018,3 a result that was nearly achieved.4
2 National Conference of State Legislators. 2011. “The Affordable Care Act: A Brief Summary.” State Implement Health News, March, https://www.ncsl.org/portals/1/documents/health/HRACA.pdf (accessed February 24, 2020). 3 Congressional Budget Office. Estimates for Insurance Coverage Provisions of the Affordable Care Act Updated for the Recent Supreme Court Decisions. July 2012, http://www.cbo.gov/sites/default/files/cbofiles/attachments/43472-07-24-2012-CoverageEstimates.pdf (accessed February 24, 2020). 4 The American Community Survey estimates the national uninsured rate for the under-age-65 population was approximately 11% in 2018. This is consistent with values from the National Health Interview Survey. National Center for Health Statistics, National Health Interview Survey Early Release Program. Health Insurance Coverage: Early Release of Estimates From the National Health Interview Survey, 2018. May 2019, https://www.cdc.gov/nchs/data/nhis/earlyrelease/insur201905.pdf (accessed February 24, 2020).
ACA PROVISION NOTE: The ACA expanded Medicaid coverage to most low-income adults up to 133% federal poverty level. In 2012, the Supreme Court ruled the ACA’s mandatory Medicaid expansion provision unconstitutional, while upholding the rest of the law. States were no longer required to expand coverage (or risk the loss of federal funding for their existing programs), though they could still expand voluntarily.
8
Copyright © 2020 Society of Actuaries
However, the means by which the uninsured rate reduction was achieved differs substantially from the CBO’s 2012
projections.
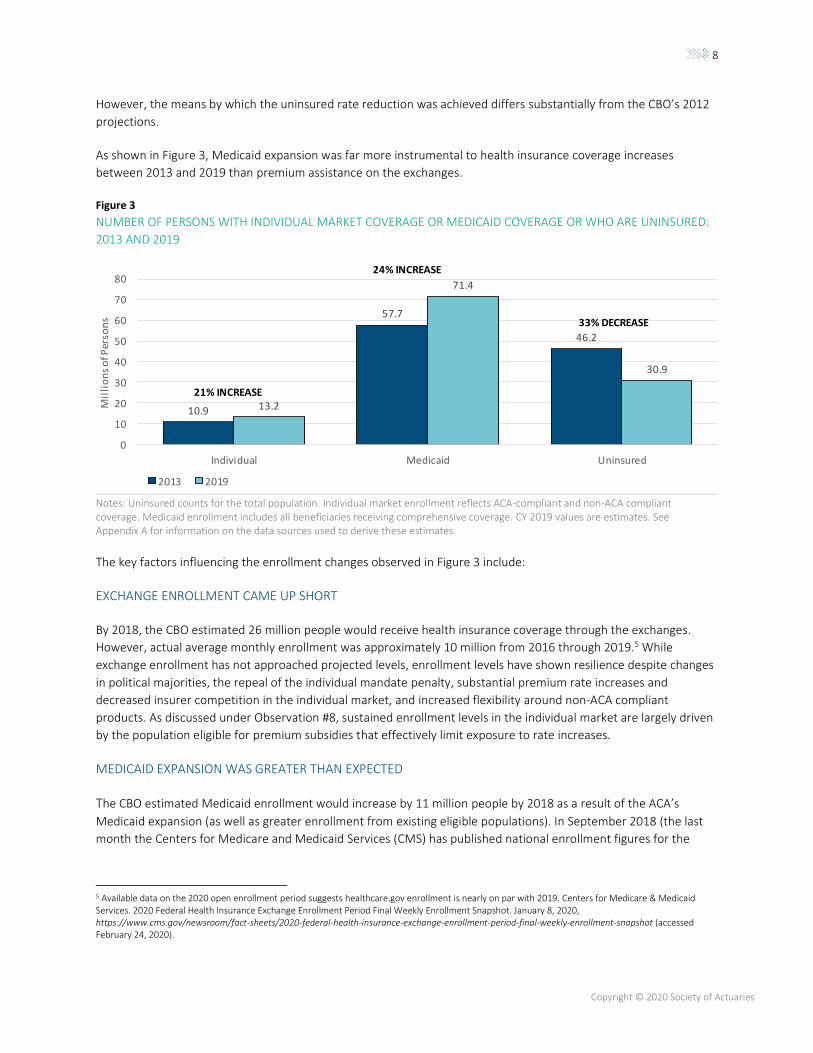
As shown in Figure 3, Medicaid expansion was far more instrumental to health insurance coverage increases
between 2013 and 2019 than premium assistance on the exchanges.
Figure 3
NUMBER OF PERSONS WITH INDIVIDUAL MARKET COVERAGE OR MEDICAID COVERAGE OR WHO ARE UNINSURED:
2013 AND 2019
Notes: Uninsured counts for the total population. Individual market enrollment reflects ACA-compliant and non-ACA compliant coverage. Medicaid enrollment includes all beneficiaries receiving comprehensive coverage. CY 2019 values are estimates. See Appendix A for information on the data sources used to derive these estimates.
The key factors influencing the enrollment changes observed in Figure 3 include:
EXCHANGE ENROLLMENT CAME UP SHORT
By 2018, the CBO estimated 26 million people would receive health insurance coverage through the exchanges.
However, actual average monthly enrollment was approximately 10 million from 2016 through 2019.5 While
exchange enrollment has not approached projected levels, enrollment levels have shown resilience despite changes
in political majorities, the repeal of the individual mandate penalty, substantial premium rate increases and
decreased insurer competition in the individual market, and increased flexibility around non-ACA compliant
products. As discussed under Observation #8, sustained enrollment levels in the individual market are largely driven
by the population eligible for premium subsidies that effectively limit exposure to rate increases.
MEDICAID EXPANSION WAS GREATER THAN EXPECTED
The CBO estimated Medicaid enrollment would increase by 11 million people by 2018 as a result of the ACA’s
Medicaid expansion (as well as greater enrollment from existing eligible populations). In September 2018 (the last
month the Centers for Medicare and Medicaid Services (CMS) has published national enrollment figures for the
5 Available data on the 2020 open enrollment period suggests healthcare.gov enrollment is nearly on par with 2019. Centers for Medicare & Medicaid Services. 2020 Federal Health Insurance Exchange Enrollment Period Final Weekly Enrollment Snapshot. January 8, 2020, https://www.cms.gov/newsroom/fact-sheets/2020-federal-health-insurance-exchange-enrollment-period-final-weekly-enrollment-snapshot (accessed February 24, 2020).
10.9
57.7
46.2
13.2
71.4
30.9
0
10
20
30
40
50
60
70
80
Individual Medicaid Uninsured
Mil
lio
ns
of P
erso
ns
2013 2019
21% INCREASE
24% INCREASE
33% DECREASE
9
Copyright © 2020 Society of Actuaries
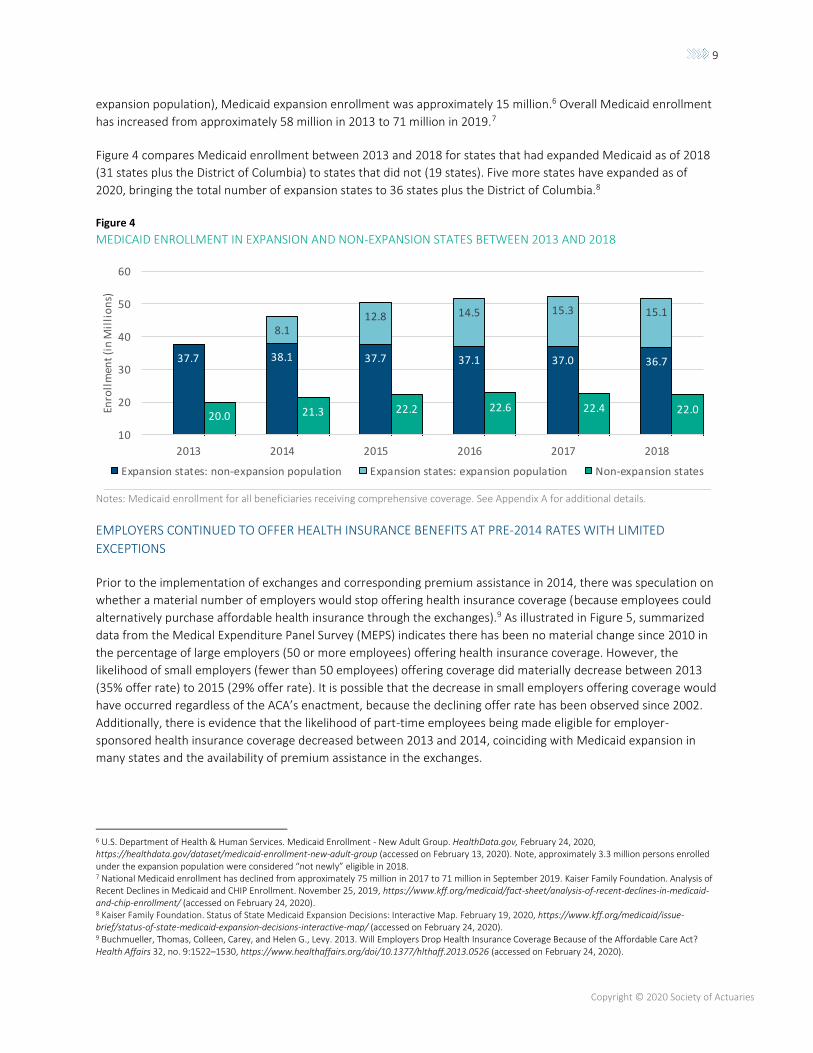
expansion population), Medicaid expansion enrollment was approximately 15 million.6 Overall Medicaid enrollment
has increased from approximately 58 million in 2013 to 71 million in 2019.7
Figure 4 compares Medicaid enrollment between 2013 and 2018 for states that had expanded Medicaid as of 2018
(31 states plus the District of Columbia) to states that did not (19 states). Five more states have expanded as of
2020, bringing the total number of expansion states to 36 states plus the District of Columbia.8
Figure 4
MEDICAID ENROLLMENT IN EXPANSION AND NON-EXPANSION STATES BETWEEN 2013 AND 2018
Notes: Medicaid enrollment for all beneficiaries receiving comprehensive coverage. See Appendix A for additional details.
EMPLOYERS CONTINUED TO OFFER HEALTH INSURANCE BENEFITS AT PRE-2014 RATES WITH LIMITED
EXCEPTIONS
Prior to the implementation of exchanges and corresponding premium assistance in 2014, there was speculation on
whether a material number of employers would stop offering health insurance coverage (because employees could
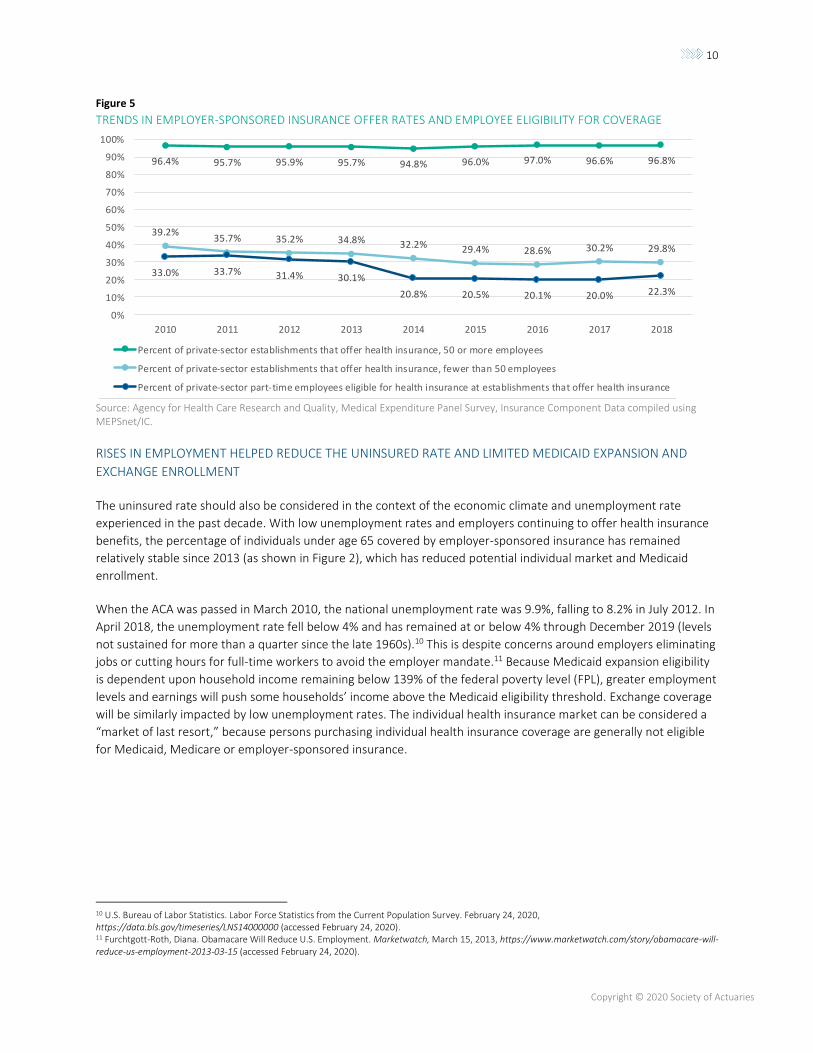
alternatively purchase affordable health insurance through the exchanges).9 As illustrated in Figure 5, summarized
data from the Medical Expenditure Panel Survey (MEPS) indicates there has been no material change since 2010 in
the percentage of large employers (50 or more employees) offering health insurance coverage. However, the
likelihood of small employers (fewer than 50 employees) offering coverage did materially decrease between 2013
(35% offer rate) to 2015 (29% offer rate). It is possible that the decrease in small employers offering coverage would
have occurred regardless of the ACA’s enactment, because the declining offer rate has been observed since 2002.
Additionally, there is evidence that the likelihood of part-time employees being made eligible for employer-
sponsored health insurance coverage decreased between 2013 and 2014, coinciding with Medicaid expansion in
many states and the availability of premium assistance in the exchanges.
6 U.S. Department of Health & Human Services. Medicaid Enrollment - New Adult Group. HealthData.gov, February 24, 2020, https://healthdata.gov/dataset/medicaid-enrollment-new-adult-group (accessed on February 13, 2020). Note, approximately 3.3 million persons enrolled under the expansion population were considered “not newly” eligible in 2018. 7 National Medicaid enrollment has declined from approximately 75 million in 2017 to 71 million in September 2019. Kaiser Family Foundation. Analysis of Recent Declines in Medicaid and CHIP Enrollment. November 25, 2019, https://www.kff.org/medicaid/fact-sheet/analysis-of-recent-declines-in-medicaid-and-chip-enrollment/ (accessed on February 24, 2020). 8 Kaiser Family Foundation. Status of State Medicaid Expansion Decisions: Interactive Map. February 19, 2020, https://www.kff.org/medicaid/issue-brief/status-of-state-medicaid-expansion-decisions-interactive-map/ (accessed on February 24, 2020). 9 Buchmueller, Thomas, Colleen, Carey, and Helen G., Levy. 2013. Will Employers Drop Health Insurance Coverage Because of the Affordable Care Act? Health Affairs 32, no. 9:1522–1530, https://www.healthaffairs.org/doi/10.1377/hlthaff.2013.0526 (accessed on February 24, 2020).
37.7 38.1 37.7 37.1 37.0 36.7
8.112.8 14.5 15.3 15.1
20.0 21.3 22.2 22.6 22.4 22.0
10
20
30
40
50
60
2013 2014 2015 2016 2017 2018
Enro
llm
ent
(in
Mil
lio
ns)
Expansion states: non-expansion population Expansion states: expansion population Non-expansion states
10
Copyright © 2020 Society of Actuaries
Figure 5
TRENDS IN EMPLOYER-SPONSORED INSURANCE OFFER RATES AND EMPLOYEE ELIGIBILITY FOR COVERAGE
Source: Agency for Health Care Research and Quality, Medical Expenditure Panel Survey, Insurance Component Data compiled using MEPSnet/IC.
RISES IN EMPLOYMENT HELPED REDUCE THE UNINSURED RATE AND LIMITED MEDICAID EXPANSION AND
EXCHANGE ENROLLMENT
The uninsured rate should also be considered in the context of the economic climate and unemployment rate
experienced in the past decade. With low unemployment rates and employers continuing to offer health insurance
benefits, the percentage of individuals under age 65 covered by employer-sponsored insurance has remained
relatively stable since 2013 (as shown in Figure 2), which has reduced potential individual market and Medicaid
enrollment.
When the ACA was passed in March 2010, the national unemployment rate was 9.9%, falling to 8.2% in July 2012. In
April 2018, the unemployment rate fell below 4% and has remained at or below 4% through December 2019 (levels
not sustained for more than a quarter since the late 1960s).10 This is despite concerns around employers eliminating
jobs or cutting hours for full-time workers to avoid the employer mandate.11 Because Medicaid expansion eligibility
is dependent upon household income remaining below 139% of the federal poverty level (FPL), greater employment
levels and earnings will push some households’ income above the Medicaid eligibility threshold. Exchange coverage
will be similarly impacted by low unemployment rates. The individual health insurance market can be considered a
“market of last resort,” because persons purchasing individual health insurance coverage are generally not eligible
for Medicaid, Medicare or employer-sponsored insurance.
10 U.S. Bureau of Labor Statistics. Labor Force Statistics from the Current Population Survey. February 24, 2020, https://data.bls.gov/timeseries/LNS14000000 (accessed February 24, 2020). 11 Furchtgott-Roth, Diana. Obamacare Will Reduce U.S. Employment. Marketwatch, March 15, 2013, https://www.marketwatch.com/story/obamacare-will-reduce-us-employment-2013-03-15 (accessed February 24, 2020).
96.4% 95.7% 95.9% 95.7% 94.8% 96.0% 97.0% 96.6% 96.8%
39.2%35.7% 35.2% 34.8% 32.2% 29.4% 28.6% 30.2% 29.8%
33.0% 33.7% 31.4% 30.1%
20.8% 20.5% 20.1% 20.0% 22.3%
0%
10%
20%
30%
40%
50%
60%
70%
80%
90%
100%
2010 2011 2012 2013 2014 2015 2016 2017 2018
Percent of private-sector establishments that offer health insurance, 50 or more employees
Percent of private-sector establishments that offer health insurance, fewer than 50 employees
Percent of private-sector part-time employees eligible for health insurance at establishments that offer health insurance
11
Copyright © 2020 Society of Actuaries
OBSERVATION #2: STATE DECISIONS TO EXPAND MEDICAID ARE STRONGLY CORRELATED WITH LARGER
REDUCTIONS IN THE PERCENTAGE OF PEOPLE WHO ARE UNINSURED, BUT NON-EXPANSION STATES ALSO
ACHIEVED REDUCTIONS.
When the Supreme Court ruled that the mandatory Medicaid expansion provision of the ACA was unconstitutional,
states were able to choose whether to expand. The decision to expand Medicaid supports a state’s ability to drive
reductions in the uninsured rate, and the data speaks for itself.
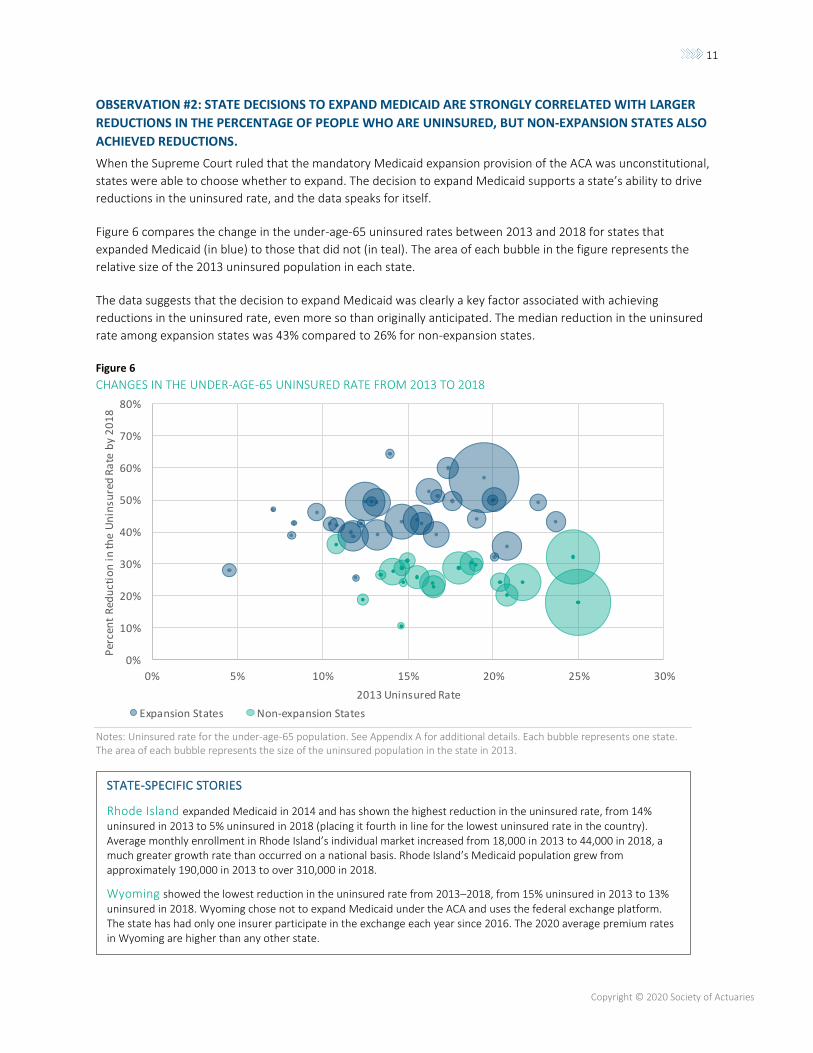
Figure 6 compares the change in the under-age-65 uninsured rates between 2013 and 2018 for states that
expanded Medicaid (in blue) to those that did not (in teal). The area of each bubble in the figure represents the
relative size of the 2013 uninsured population in each state.
The data suggests that the decision to expand Medicaid was clearly a key factor associated with achieving
reductions in the uninsured rate, even more so than originally anticipated. The median reduction in the uninsured
rate among expansion states was 43% compared to 26% for non-expansion states.
Figure 6
CHANGES IN THE UNDER-AGE-65 UNINSURED RATE FROM 2013 TO 2018
Notes: Uninsured rate for the under-age-65 population. See Appendix A for additional details. Each bubble represents one state. The area of each bubble represents the size of the uninsured population in the state in 2013.
0%
10%
20%
30%
40%
50%
60%
70%
80%
0% 5% 10% 15% 20% 25% 30%
Per
cen
t R
edu
ctio
n i
n th
e U
nin
sure
d R
ate
by
20
18
2013 Uninsured Rate
Expansion States Non-expansion States
STATE-SPECIFIC STORIES
Rhode Island expanded Medicaid in 2014 and has shown the highest reduction in the uninsured rate, from 14% uninsured in 2013 to 5% uninsured in 2018 (placing it fourth in line for the lowest uninsured rate in the country). Average monthly enrollment in Rhode Island’s individual market increased from 18,000 in 2013 to 44,000 in 2018, a much greater growth rate than occurred on a national basis. Rhode Island’s Medicaid population grew from approximately 190,000 in 2013 to over 310,000 in 2018.
Wyoming showed the lowest reduction in the uninsured rate from 2013–2018, from 15% uninsured in 2013 to 13% uninsured in 2018. Wyoming chose not to expand Medicaid under the ACA and uses the federal exchange platform. The state has had only one insurer participate in the exchange each year since 2016. The 2020 average premium rates in Wyoming are higher than any other state.
12
Copyright © 2020 Society of Actuaries
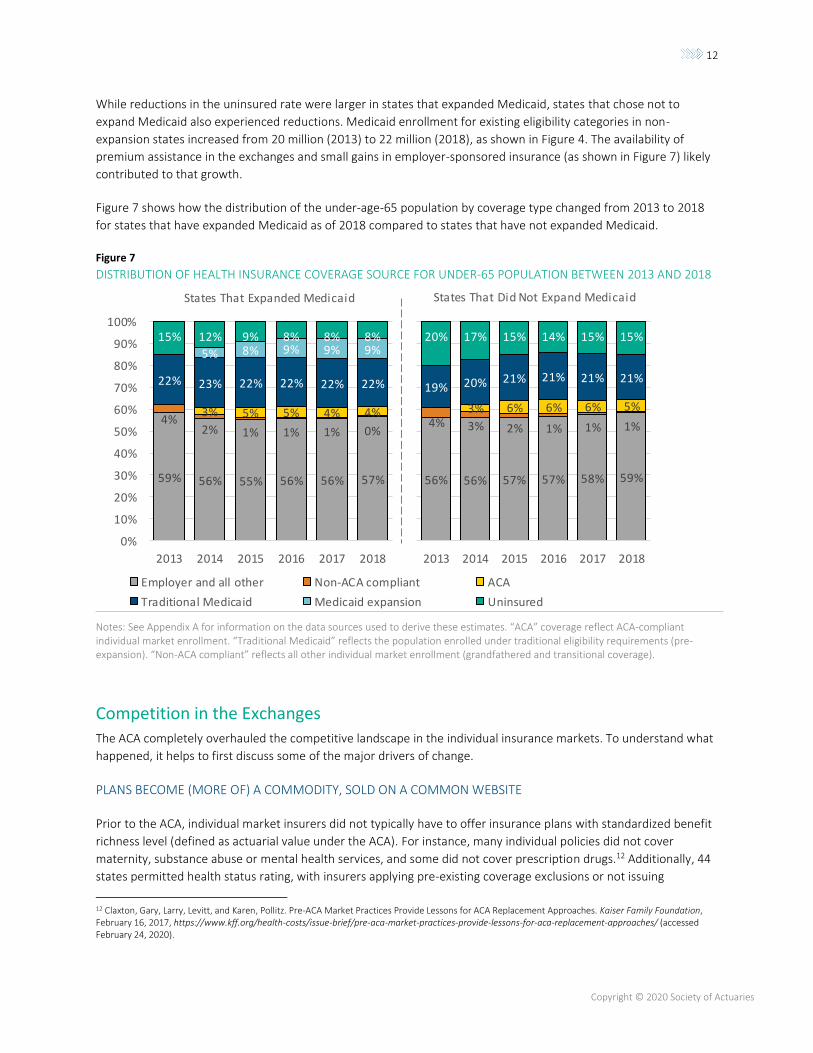
While reductions in the uninsured rate were larger in states that expanded Medicaid, states that chose not to
expand Medicaid also experienced reductions. Medicaid enrollment for existing eligibility categories in non-
expansion states increased from 20 million (2013) to 22 million (2018), as shown in Figure 4. The availability of
premium assistance in the exchanges and small gains in employer-sponsored insurance (as shown in Figure 7) likely
contributed to that growth.
Figure 7 shows how the distribution of the under-age-65 population by coverage type changed from 2013 to 2018
for states that have expanded Medicaid as of 2018 compared to states that have not expanded Medicaid.
Figure 7
DISTRIBUTION OF HEALTH INSURANCE COVERAGE SOURCE FOR UNDER-65 POPULATION BETWEEN 2013 AND 2018
Notes: See Appendix A for information on the data sources used to derive these estimates. “ACA” coverage reflect ACA-compliant individual market enrollment. “Traditional Medicaid” reflects the population enrolled under traditional eligibility requirements (pre-expansion). “Non-ACA compliant” reflects all other individual market enrollment (grandfathered and transitional coverage).
Competition in the Exchanges The ACA completely overhauled the competitive landscape in the individual insurance markets. To understand what
happened, it helps to first discuss some of the major drivers of change.
PLANS BECOME (MORE OF) A COMMODITY, SOLD ON A COMMON WEBSITE
Prior to the ACA, individual market insurers did not typically have to offer insurance plans with standardized benefit
richness level (defined as actuarial value under the ACA). For instance, many individual policies did not cover
maternity, substance abuse or mental health services, and some did not cover prescription drugs.12 Additionally, 44
states permitted health status rating, with insurers applying pre-existing coverage exclusions or not issuing
12 Claxton, Gary, Larry, Levitt, and Karen, Pollitz. Pre-ACA Market Practices Provide Lessons for ACA Replacement Approaches. Kaiser Family Foundation, February 16, 2017, https://www.kff.org/health-costs/issue-brief/pre-aca-market-practices-provide-lessons-for-aca-replacement-approaches/ (accessed February 24, 2020).
59% 56% 55% 56% 56% 57%
4%
2% 1% 1% 1% 0%
3% 5% 5% 4% 4%
22% 23% 22% 22% 22% 22%
5% 8% 9% 9% 9%
15% 12% 9% 8% 8% 8%
20%
30%
40%
50%
60%
70%
80%
90%
100%
59% 56% 55% 56% 56% 57%
4%2% 1% 1% 1% 0%
3% 5% 5% 4% 4%
22% 23% 22% 22% 22% 22%
5% 8% 9% 9% 9%15% 12% 9% 8% 8% 8%
0%
10%
20%
30%
40%
50%
60%
70%
80%
90%
100%
2013 2014 2015 2016 2017 2018
56% 56% 57% 57% 58% 59%
4% 3% 2% 1% 1% 1%
3% 6% 6% 6% 5%
19% 20% 21% 21% 21% 21%
20% 17% 15% 14% 15% 15%
2013 2014 2015 2016 2017 2018
States That Expanded Medicaid States That Did Not Expand Medicaid
59% 56% 55% 56% 56% 57%
4%
2% 1% 1% 1% 0%
3% 5% 5% 4% 4%
22% 23% 22% 22% 22% 22%
5% 8% 9% 9% 9%
15% 12% 9% 8% 8% 8%
0%
10%
20%
30%
40%
50%
60%
70%
80%
90%
100%
2013 2014 2015 2016 2017 2018
Employer and all other Non-ACA compliant ACA
Traditional Medicaid Medicaid expansion Uninsured
13
Copyright © 2020 Society of Actuaries
insurance coverage to certain persons.13 From a consumer perspective, it was difficult to make a direct comparison
between insurance options resulting from these variations in benefit design and rating rules.
In its November 2009 analysis of potential ACA premium rate impacts, the CBO stated, “The exchanges would
enhance competition among insurers in the non-group market by providing a centralized marketplace in which
consumers could compare the premiums of relatively standardized insurance products.”14 Specifically, insurers
offering coverage in the individual and small-group market under the ACA are only permitted to offer essential
health benefits coverage with plan designs tied to specific benefit levels, the ACA’s bronze (60% actuarial value15),
silver (70% actuarial value), gold (80% actuarial value) and platinum (90% actuarial value).16 Additionally, the ACA
only allows insurers to vary premium by age (limited to 3:1 ratio) and tobacco usage (limited to 1.5:1).17 Finally, from
an insurer perspective, risk adjustment transfer payments were intended to mitigate the financial impacts of varying
member morbidity levels among competing insurers. In effect, the ACA sought to at least partially commoditize
coverage by making it more standard and to force insurers to compete on price, customer service, administrative
efficiency and other factors rather than risk selection through marketing or underwriting.
SUBSIDY LEVERAGING ENHANCES THE IMPACT OF PREMIUM RATE DIFFERENTIALS
A substantial underlying factor impacting competition in the insurance exchanges is the ACA’s subsidy structure. The
details of how the subsidies work can amplify the relative impact of premium changes for subsidized individuals,
potentially making it more likely that they will switch insurance companies when rates change.
Federal premium assistance, available only through the insurance exchanges, is tied to the premium rate for the
second-lowest cost silver plan (benchmark silver plan) offered on the exchange. For subsidy-qualifying households,
the ACA guarantees the household will be able to purchase the benchmark silver plan for less than a specified
percentage of the household’s income. The household’s available subsidy is equal to the difference between the
benchmark silver plan’s full premium and the maximum monthly net premium for the household specified by the
ACA’s subsidy formula. For example, if the total monthly premium was $500 and the maximum post-subsidy
premium was $100, the subsidy value would equal $400. The $400 can be used toward the purchase of the
benchmark silver plan or any other qualified health plan (QHP) offered through the exchange.18 Because the
premium subsidy amount does not vary based on the plan that is purchased (with the exception of cases where the
subsidy value is greater than the plan’s total premium), every exchange enrollee is exposed to the total difference in
premium amount among offered plans.
13 Houchens, Paul. 2010. Commercial Health Insurance Market: New Financial and Enrollment Data Available from the Supplemental Exhibit. Milliman Research Report, October, https://milliman-cdn.azureedge.net/-/media/milliman/importedfiles/uploadedfiles/insight/health-published/healthinsurancemarket103111pdf.ashx (accessed February 24, 2020). 14 Congressional Budget Office. An Analysis of Health Insurance Premiums Under the Patient Protection and Affordable Care Act. November 30, 2009, https://www.cbo.gov/sites/default/files/111th-congress-2009-2010/reports/11-30-premiums.pdf (accessed February 24, 2020). 15 Actuarial value is the percentage of the total average cost of covered essential health benefits paid for by the health plan (excluding premiums) - https://www.healthcare.gov/glossary/actuarial-value/. For example, a 60% actuarial value means that the plan is expected to pay 60% of the cost of covered essential health benefits on average across the population enrolled. The Patient Protection and Affordable Care Act. Pub. L. 111-148. 124 Stat. 119. March 23, 2010. https://www.govinfo.gov/content/pkg/PLAW-111publ148/pdf/PLAW-111publ148.pdf (accessed March 5, 2020) 16 Catastrophic plans can also be offered in the individual market to persons under age 30 or with a hardship exemption. These plans are allowed to have an actuarial value below 60%.Ibid. 17 States have discretion to mandate a more narrow age band and disallow tobacco rating. Ibid. 18 A qualified health plan is a major medical health insurance plan offering minimum essential coverage (that is, coverage of all essential health benefits at a bronze level or higher). Premium assistance cannot be applied to the purchase of catastrophic coverage. Ibid.
14
Copyright © 2020 Society of Actuaries
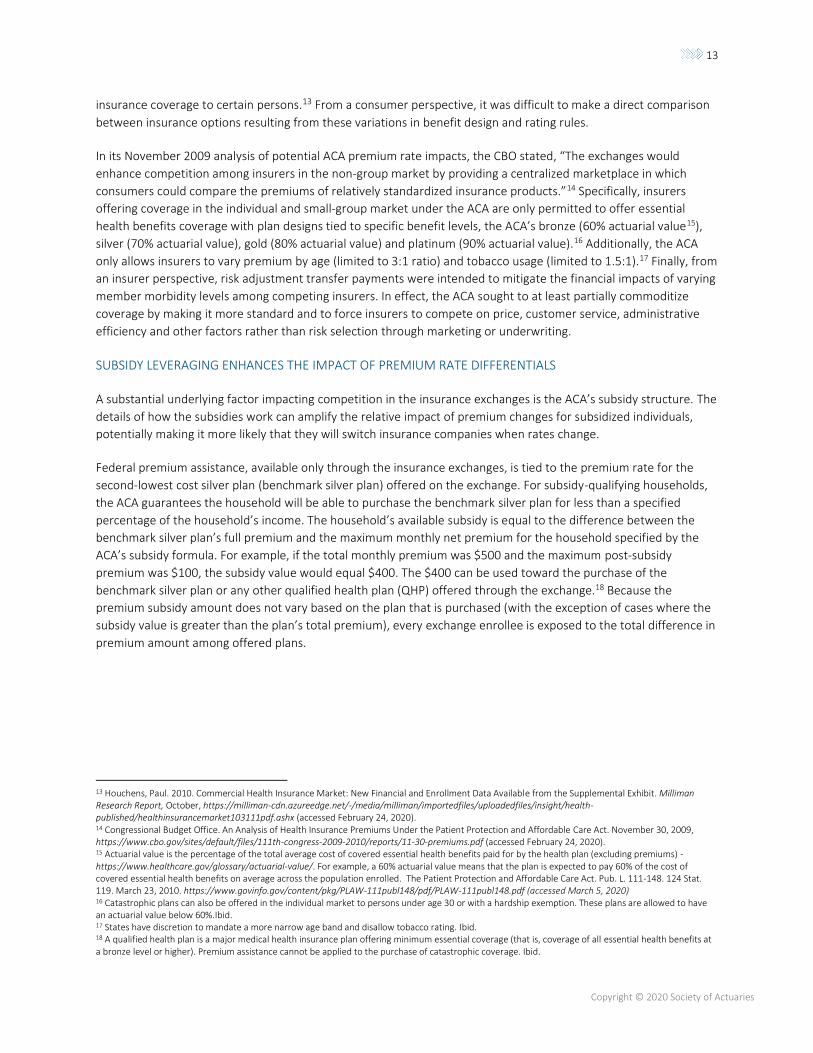
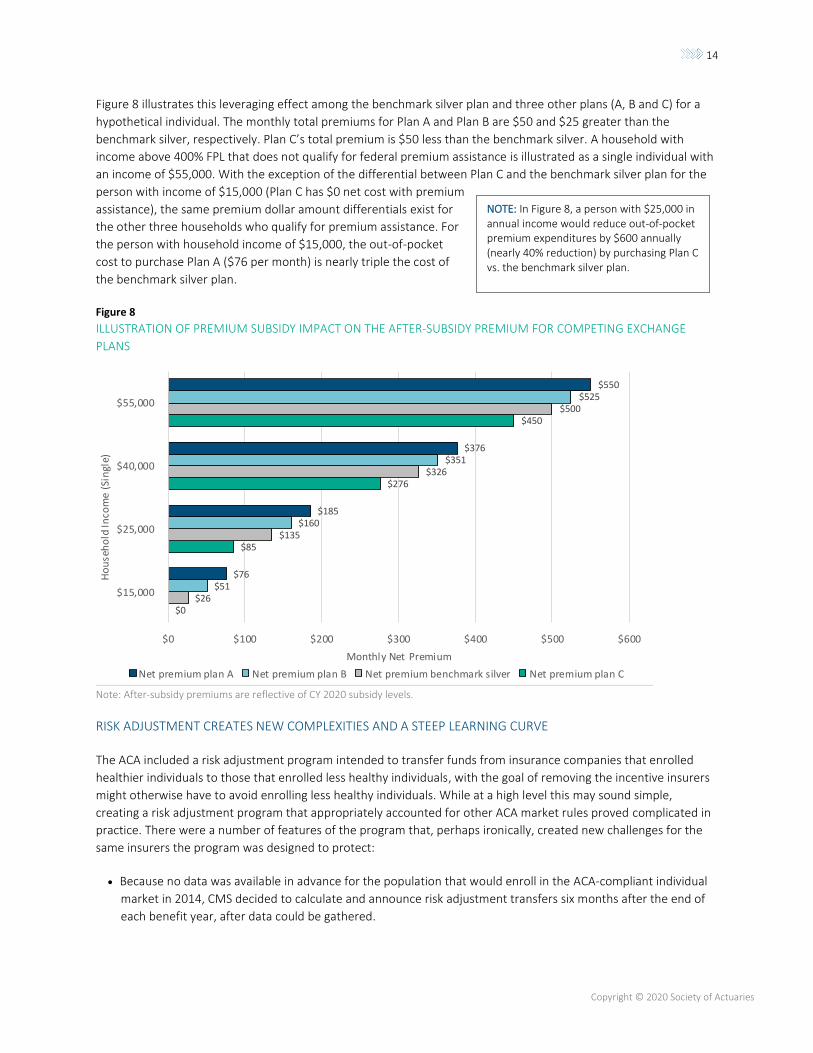
Figure 8 illustrates this leveraging effect among the benchmark silver plan and three other plans (A, B and C) for a
hypothetical individual. The monthly total premiums for Plan A and Plan B are $50 and $25 greater than the
benchmark silver, respectively. Plan C’s total premium is $50 less than the benchmark silver. A household with
income above 400% FPL that does not qualify for federal premium assistance is illustrated as a single individual with
an income of $55,000. With the exception of the differential between Plan C and the benchmark silver plan for the
person with income of $15,000 (Plan C has $0 net cost with premium
assistance), the same premium dollar amount differentials exist for
the other three households who qualify for premium assistance. For
the person with household income of $15,000, the out-of-pocket
cost to purchase Plan A ($76 per month) is nearly triple the cost of
the benchmark silver plan.
Figure 8
ILLUSTRATION OF PREMIUM SUBSIDY IMPACT ON THE AFTER-SUBSIDY PREMIUM FOR COMPETING EXCHANGE
PLANS
Note: After-subsidy premiums are reflective of CY 2020 subsidy levels.
RISK ADJUSTMENT CREATES NEW COMPLEXITIES AND A STEEP LEARNING CURVE
The ACA included a risk adjustment program intended to transfer funds from insurance companies that enrolled
healthier individuals to those that enrolled less healthy individuals, with the goal of removing the incentive insurers
might otherwise have to avoid enrolling less healthy individuals. While at a high level this may sound simple,
creating a risk adjustment program that appropriately accounted for other ACA market rules proved complicated in
practice. There were a number of features of the program that, perhaps ironically, created new challenges for the
same insurers the program was designed to protect:
• Because no data was available in advance for the population that would enroll in the ACA-compliant individual
market in 2014, CMS decided to calculate and announce risk adjustment transfers six months after the end of
each benefit year, after data could be gathered.
$0
$85
$276
$450
$26
$135
$326
$500
$51
$160
$351
$525
$76
$185
$376
$550
$0 $100 $200 $300 $400 $500 $600
$15,000
$25,000
$40,000
$55,000
Monthly Net Premium
Ho
use
ho
ld In
com
e (S
ingl
e)
Net premium plan A Net premium plan B Net premium benchmark silver Net premium plan C
NOTE: In Figure 8, a person with $25,000 in annual income would reduce out-of-pocket premium expenditures by $600 annually (nearly 40% reduction) by purchasing Plan C vs. the benchmark silver plan.
15
Copyright © 2020 Society of Actuaries
• Transfers could be large in relation to an insurer’s revenue—sometimes much larger than target profit margins.
This was particularly true for smaller insurers.19
• Transfers depended on both an insurer’s own data and also data for the insurer’s competitors in the market.
• Risk adjustment models and transfer calculations were revised significantly each year.20
Taken together, this meant that insurers often found it very difficult to reliably predict their risk adjustment
transfers for a given year when setting rates for the following year. Often, insurers may not even know for sure if
they had made a profit or loss on the prior year or not until after rates were set for the following two years.
Operationally, the program required insurers to report detailed data used by the government to calculate
transfers,21 which some insurers struggled with—particularly those without other experience in risk-adjusted
markets. Thus, the program created new uncertainty and risks for insurers even as it mitigated others.
RISK CORRIDORS MAY HAVE DEEPENED THE TROUGH IN THE UNDERWRITING CYCLE
The last major component of the competitive dynamics in the initial years of the insurance exchange was the risk
corridor program. As part of the ACA’s “3R” premium stabilization programs, a risk corridor program was established
for insurers offering ACA-compliant coverage in the individual and small-group markets, with an intention of limiting
excessive losses and profits from insurers in a new and uncertain market. At the time of 2014 rate development,
federal government regulations indicated the risk corridor program “is not statutorily required to be budget neutral,
and that payments will be made regardless of the balance between receipts and payments.”22
In addition to the competitive forces created by the ACA’s framework, the concept of an underwriting cycle has
existed in health insurance long before the ACA’s implementation.23 The underwriting cycle can be characterized by
the following competitive stages.
19 Houchens, Paul, Jason, Clarkson, Jill, Herbold, and Colin, Gray. 2016. 2014 Commercial Health Insurance, Overview of Financial Results. Milliman Research Report, March, https://millimanazurecdn-test2.azureedge.net/-/media/milliman/importedfiles/uploadedfiles/insight/2016/2014-commercial-health-insurance.ashx (accessed February 24, 2020). 20 Busch, Frederick, Jason, Karcher, Jason, Petroske, and Kaitlin, Fink. 2016. On Second Thought: Initial Insights From Year 2 of the ACA Risk Adjustment Program. Milliman White Paper, August, https://us.milliman.com/-/media/Milliman/importedfiles/uploadedFiles/insight/2016/2281hdp_20160825.ashx (accessed February 24, 2020). 21 Millen, Brandy, and Jason, Petroske. ACA risk adjustment management: Higher EDGE-ucation. Milliman, December 22, 2017, https://www.milliman.com/insight/2017/ACA-risk-adjustment-management-Higher-EDGE-ucation# (accessed February 24, 2020). 22 Creten, Mary, Hans, Leida, and Doug, Norris. Risk Corridors Under the ACA. Milliman, October 1, 2013, https://us.milliman.com/en/Insight/risk-corridors-under-the-aca (accessed February 24, 2020). 23 Richard, Kipp, Cookson, John, and Mattie, Lisa. 2003. Health Insurance Underwriting Cycle Effect on Health Plan Premiums and Profitability. Milliman, April 10. https://docplayer.net/854855-Health-insurance-underwriting-cycle-effect-on-health-plan-premiums-and-profitability.html
16
Copyright © 2020 Society of Actuaries
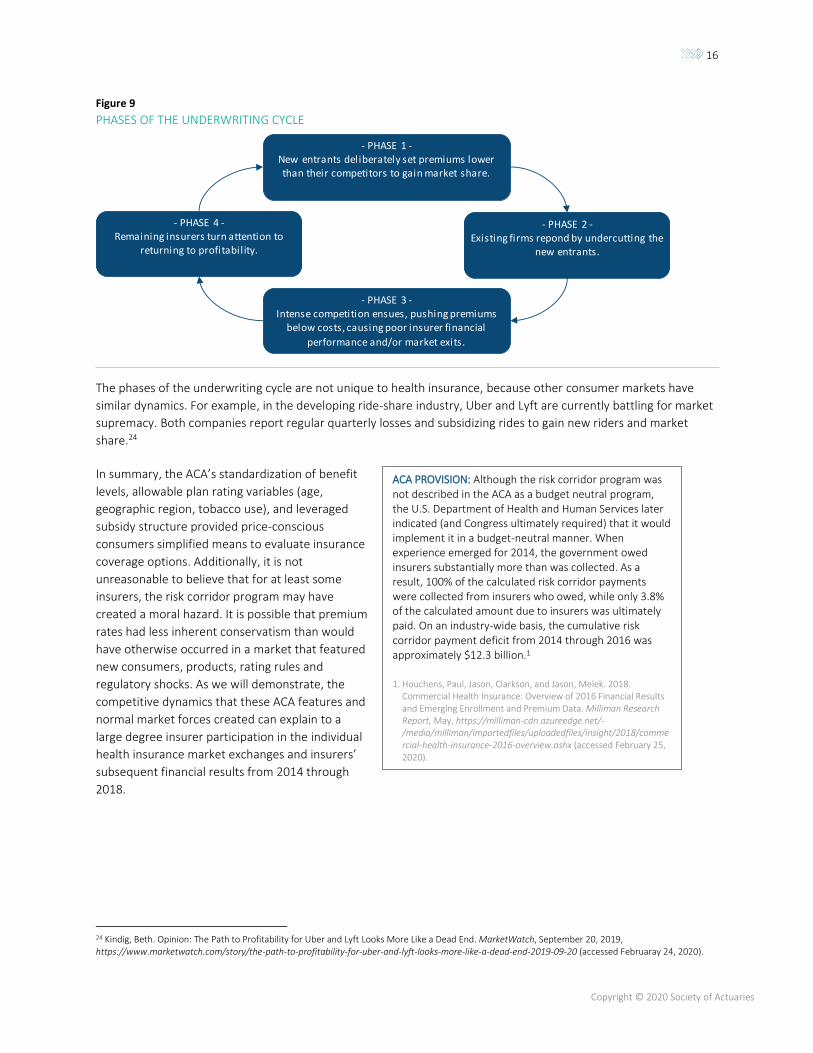
Figure 9
PHASES OF THE UNDERWRITING CYCLE
The phases of the underwriting cycle are not unique to health insurance, because other consumer markets have
similar dynamics. For example, in the developing ride-share industry, Uber and Lyft are currently battling for market
supremacy. Both companies report regular quarterly losses and subsidizing rides to gain new riders and market
share.24
In summary, the ACA’s standardization of benefit
levels, allowable plan rating variables (age,
geographic region, tobacco use), and leveraged
subsidy structure provided price-conscious
consumers simplified means to evaluate insurance
coverage options. Additionally, it is not
unreasonable to believe that for at least some
insurers, the risk corridor program may have
created a moral hazard. It is possible that premium
rates had less inherent conservatism than would
have otherwise occurred in a market that featured
new consumers, products, rating rules and
regulatory shocks. As we will demonstrate, the
competitive dynamics that these ACA features and
normal market forces created can explain to a
large degree insurer participation in the individual
health insurance market exchanges and insurers’
subsequent financial results from 2014 through
2018.
24 Kindig, Beth. Opinion: The Path to Profitability for Uber and Lyft Looks More Like a Dead End. MarketWatch, September 20, 2019, https://www.marketwatch.com/story/the-path-to-profitability-for-uber-and-lyft-looks-more-like-a-dead-end-2019-09-20 (accessed Februaray 24, 2020).
- PHASE 2 -Existing firms repond by undercutting the
new entrants.
- PHASE 1 -New entrants deliberately set premiums lower than their competitors to gain market share.
- PHASE 3 -Intense competition ensues, pushing premiums
below costs, causing poor insurer financial
performance and/or market exits.
- PHASE 4 -Remaining insurers turn attention to
returning to profitability.
ACA PROVISION: Although the risk corridor program was not described in the ACA as a budget neutral program, the U.S. Department of Health and Human Services later indicated (and Congress ultimately required) that it would implement it in a budget-neutral manner. When experience emerged for 2014, the government owed insurers substantially more than was collected. As a result, 100% of the calculated risk corridor payments were collected from insurers who owed, while only 3.8% of the calculated amount due to insurers was ultimately paid. On an industry-wide basis, the cumulative risk corridor payment deficit from 2014 through 2016 was approximately $12.3 billion.1
1. Houchens, Paul, Jason, Clarkson, and Jason, Melek. 2018. Commercial Health Insurance: Overview of 2016 Financial Results and Emerging Enrollment and Premium Data. Milliman Research Report, May, https://milliman-cdn.azureedge.net/-/media/milliman/importedfiles/uploadedfiles/insight/2018/commercial-health-insurance-2016-overview.ashx (accessed February 25, 2020).
17
Copyright © 2020 Society of Actuaries
OBSERVATION #3: PRICE IS A KEY CONSIDERATION
(CONSUMERS IN THE INDIVIDUAL MARKET HAVE
SHOWN TO BE VERY PRICE SENSITIVE, CREATING
OPPORTUNITIES FOR LOWER-PRICED INSURERS TO
CAPTURE SIGNIFICANT MARKET SHARE).
In the early days of the ACA, at least some stakeholders
believed that consumers would exhibit brand loyalty and
be resistant to switching insurers. This notion was based
on experience in the pre-ACA markets, where consumers
often valued keeping the benefit plan and provider
network they were familiar with. However, this
intuition proved to be untrue to a large degree. Due to
the ACA’s subsidy structure and the household income
distribution of exchange enrollees, even insurers new
to the individual health insurance market were able to
capture substantial market share if they offered
competitive premium rates—exchange consumers
proved to be extremely price sensitive in general.
Based on 2014 plan selections made through
healthcare.gov, 64% of consumers selected the lowest-
cost or second-lowest-cost plan offered across metallic
tiers.25 Based on 2019 federally facilitated insurance
exchange selection data, approximately 65% of plan
selections were made by persons with income between
100% and 250% FPL (equivalent to annual income for
single households between approximately $12,000 and
$30,000).26 As discussed previously, the ACA’s subsidy
structure exposes low-income households to the full
premium rate differences among available QHPs, so
individuals may need to select new plans each year to
keep the lowest option and maintain perceived
affordability.
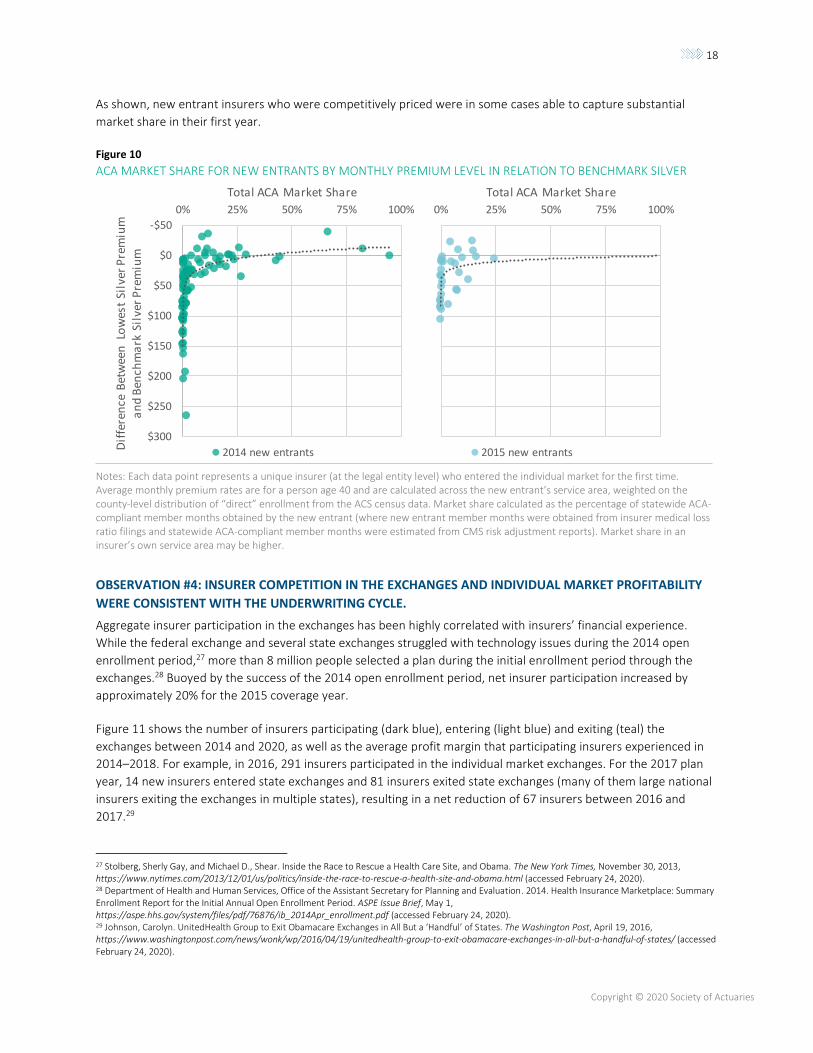
Figure 10 shows the percentage of ACA-compliant
individual market membership that insurers new to a
state’s individual market in 2014 and 2015 were able to
obtain in their first year. Each data point plots the
percentage of statewide ACA-compliant individual
market membership the new entrant obtained in
relation to the difference between the average
premium rate for the lowest-cost premium silver plan
they offered in their service area and the average
benchmark silver premium offered in their service area.
25 Burke, Amy, Arpit, Misra, and Steven, Sheingold. 2014. Premium Affordability, Competition, And Choice In The Health Insurance Marketplace, 2014. ASPE Research Brief, June 18, https://aspe.hhs.gov/system/files/pdf/76896/2014MktPlacePremBrf.pdf (accessed February 24, 2020). 26 Center for Medicare and Medicaid Services. Health Insurance Exchanges 2019 Open Enrollment Period: State-Level Public Use File. 2019, https://www.cms.gov/Research-Statistics-Data-and-Systems/Statistics-Trends-and-Reports/Marketplace-Products/Downloads/2019OEPStateLevelPublicUseFile.zip (accessed February 24, 2020).
STATE-SPECIFIC STORIES
West Virginia had only one national insurer,
Highmark, operating on the exchange in 2014 and 2015. In 2016, CareSource, a national Medicaid managed care organization, entered the market. CareSource offered plans in 10 of the state’s 55 counties that year, expanded its service area to 32 counties in 2017 and 2018 (including the state’s most populated county) and to 35 counties in 2019. As of 2020, CareSource offers plans alongside Highmark in 44 counties.
In 2017, CareSource was offering silver plans with premiums that ranged from 2% to nearly 30% lower than Highmark’s lowest premium silver plan in every rating area it participated in, though Highmark still maintained over 80% market share statewide (including both ACA-compliant and non-ACA-compliant individual market business). CareSource premiums remained lower than Highmark in 2018, and while CareSource market share increased by another 10% that year, Highmark still maintained nearly 75% market share.
Maine had two insurers offer plans on the
exchange in 2014. One of them, Anthem Health Plans of Maine, was an established insurer with 55% market share in Maine’s individual market in 2013. The other, Maine Community Health Options (MCHO), entered the individual market for the first time in 2014 and offered plans statewide. Silver premium rates for plans that MCHO offered were from 5% to 16% lower than the lowest silver premium that Anthem Health Plans of Maine offered in that year, gaining MCHO nearly 85% market share in its first year. As of 2018, MCHO has maintained approximately 60% market share.
ACA PROVISION NOTE: In November 2013, the U.S. Department of Health and Human Services gave states the option to permit individual market plans that were not ACA-compliant to renew in 2014 under the transitional policy. This guidance was released after insurers had already filed 2014 ACA-compliant individual market premium rates under the assumption that all individual market members (excluding persons enrolled in grandfathered coverage) would be included in the same risk pool.
18
Copyright © 2020 Society of Actuaries
As shown, new entrant insurers who were competitively priced were in some cases able to capture substantial
market share in their first year.
Figure 10
ACA MARKET SHARE FOR NEW ENTRANTS BY MONTHLY PREMIUM LEVEL IN RELATION TO BENCHMARK SILVER
Notes: Each data point represents a unique insurer (at the legal entity level) who entered the individual market for the first time. Average monthly premium rates are for a person age 40 and are calculated across the new entrant’s service area, weighted on the county-level distribution of “direct” enrollment from the ACS census data. Market share calculated as the percentage of statewide ACA-compliant member months obtained by the new entrant (where new entrant member months were obtained from insurer medical loss ratio filings and statewide ACA-compliant member months were estimated from CMS risk adjustment reports). Market share in an insurer’s own service area may be higher.
OBSERVATION #4: INSURER COMPETITION IN THE EXCHANGES AND INDIVIDUAL MARKET PROFITABILITY
WERE CONSISTENT WITH THE UNDERWRITING CYCLE.
Aggregate insurer participation in the exchanges has been highly correlated with insurers’ financial experience.
While the federal exchange and several state exchanges struggled with technology issues during the 2014 open
enrollment period,27 more than 8 million people selected a plan during the initial enrollment period through the
exchanges.28 Buoyed by the success of the 2014 open enrollment period, net insurer participation increased by
approximately 20% for the 2015 coverage year.
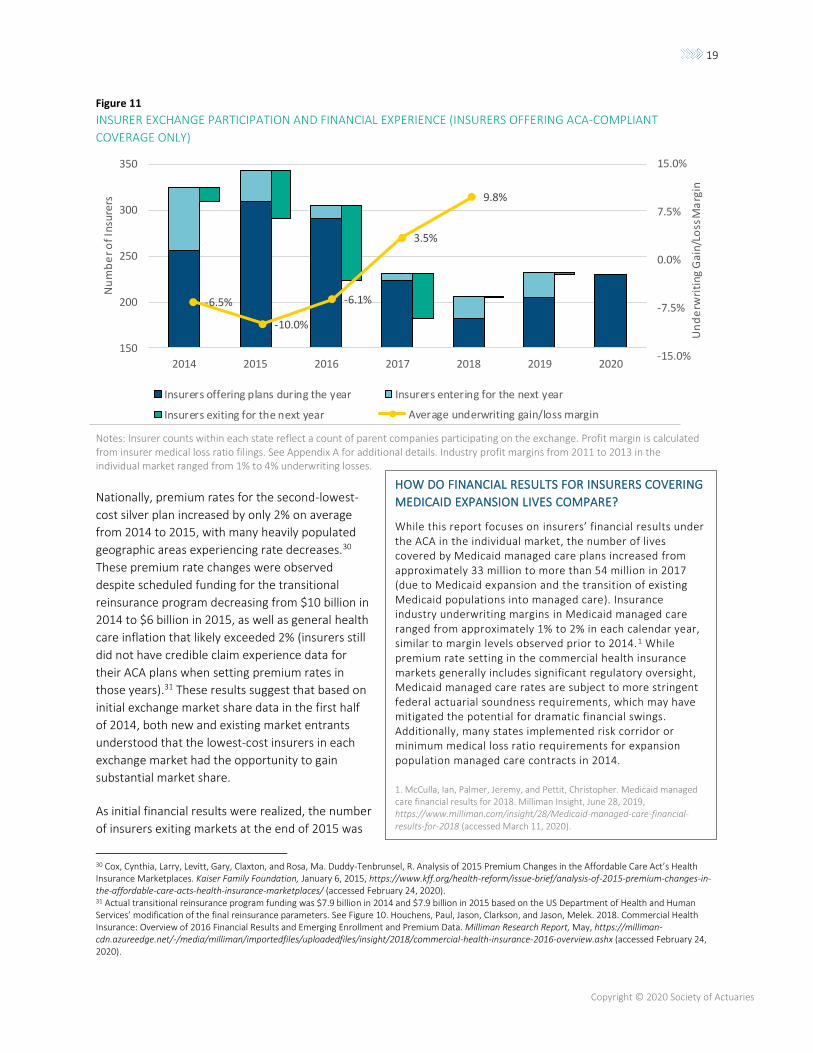
Figure 11 shows the number of insurers participating (dark blue), entering (light blue) and exiting (teal) the
exchanges between 2014 and 2020, as well as the average profit margin that participating insurers experienced in
2014–2018. For example, in 2016, 291 insurers participated in the individual market exchanges. For the 2017 plan
year, 14 new insurers entered state exchanges and 81 insurers exited state exchanges (many of them large national
insurers exiting the exchanges in multiple states), resulting in a net reduction of 67 insurers between 2016 and
2017.29
27 Stolberg, Sherly Gay, and Michael D., Shear. Inside the Race to Rescue a Health Care Site, and Obama. The New York Times, November 30, 2013, https://www.nytimes.com/2013/12/01/us/politics/inside-the-race-to-rescue-a-health-site-and-obama.html (accessed February 24, 2020). 28 Department of Health and Human Services, Office of the Assistant Secretary for Planning and Evaluation. 2014. Health Insurance Marketplace: Summary Enrollment Report for the Initial Annual Open Enrollment Period. ASPE Issue Brief, May 1, https://aspe.hhs.gov/system/files/pdf/76876/ib_2014Apr_enrollment.pdf (accessed February 24, 2020). 29 Johnson, Carolyn. UnitedHealth Group to Exit Obamacare Exchanges in All But a ‘Handful’ of States. The Washington Post, April 19, 2016, https://www.washingtonpost.com/news/wonk/wp/2016/04/19/unitedhealth-group-to-exit-obamacare-exchanges-in-all-but-a-handful-of-states/ (accessed February 24, 2020).
-$50
$0
$50
$100
$150
$200
$250
$300
0% 25% 50% 75% 100%
Dif
fere
nce
Bet
wee
n L
ow
est
Silv
er P
rem
ium
a
nd
Ben
chm
ark
Sil
ver
Pre
miu
m
Total ACA Market Share
2014 new entrants
0% 25% 50% 75% 100%
Total ACA Market Share
2015 new entrants
19
Copyright © 2020 Society of Actuaries
Figure 11
INSURER EXCHANGE PARTICIPATION AND FINANCIAL EXPERIENCE (INSURERS OFFERING ACA-COMPLIANT
COVERAGE ONLY)
Notes: Insurer counts within each state reflect a count of parent companies participating on the exchange. Profit margin is calculated from insurer medical loss ratio filings. See Appendix A for additional details. Industry profit margins from 2011 to 2013 in the individual market ranged from 1% to 4% underwriting losses.
Nationally, premium rates for the second-lowest-
cost silver plan increased by only 2% on average
from 2014 to 2015, with many heavily populated
geographic areas experiencing rate decreases.30
These premium rate changes were observed
despite scheduled funding for the transitional
reinsurance program decreasing from $10 billion in
2014 to $6 billion in 2015, as well as general health
care inflation that likely exceeded 2% (insurers still
did not have credible claim experience data for
their ACA plans when setting premium rates in
those years).31 These results suggest that based on
initial exchange market share data in the first half
of 2014, both new and existing market entrants
understood that the lowest-cost insurers in each
exchange market had the opportunity to gain
substantial market share.
As initial financial results were realized, the number
of insurers exiting markets at the end of 2015 was
30 Cox, Cynthia, Larry, Levitt, Gary, Claxton, and Rosa, Ma. Duddy-Tenbrunsel, R. Analysis of 2015 Premium Changes in the Affordable Care Act’s Health Insurance Marketplaces. Kaiser Family Foundation, January 6, 2015, https://www.kff.org/health-reform/issue-brief/analysis-of-2015-premium-changes-in-the-affordable-care-acts-health-insurance-marketplaces/ (accessed February 24, 2020). 31 Actual transitional reinsurance program funding was $7.9 billion in 2014 and $7.9 billion in 2015 based on the US Department of Health and Human Services’ modification of the final reinsurance parameters. See Figure 10. Houchens, Paul, Jason, Clarkson, and Jason, Melek. 2018. Commercial Health Insurance: Overview of 2016 Financial Results and Emerging Enrollment and Premium Data. Milliman Research Report, May, https://milliman-cdn.azureedge.net/-/media/milliman/importedfiles/uploadedfiles/insight/2018/commercial-health-insurance-2016-overview.ashx (accessed February 24, 2020).
150
200
250
300
350
2014 2015 2016 2017 2018 2019 2020
Nu
mb
er
of
Insu
rers
Insurers offering plans during the year Insurers entering for the next year
Insurers exiting for the next year
-6.5%
-10.0%
-6.1%
3.5%
9.8%
-15.0%
-7.5%
0.0%
7.5%
15.0%
Un
de
rwri
ting
Gai
n/Lo
ss M
arg
in
Average underwriting gain/loss margin
HOW DO FINANCIAL RESULTS FOR INSURERS COVERING
MEDICAID EXPANSION LIVES COMPARE?
While this report focuses on insurers’ financial results under the ACA in the individual market, the number of lives covered by Medicaid managed care plans increased from approximately 33 million to more than 54 million in 2017 (due to Medicaid expansion and the transition of existing Medicaid populations into managed care). Insurance industry underwriting margins in Medicaid managed care ranged from approximately 1% to 2% in each calendar year, similar to margin levels observed prior to 2014.1 While premium rate setting in the commercial health insurance markets generally includes significant regulatory oversight, Medicaid managed care rates are subject to more stringent federal actuarial soundness requirements, which may have mitigated the potential for dramatic financial swings. Additionally, many states implemented risk corridor or minimum medical loss ratio requirements for expansion population managed care contracts in 2014.
1. McCulla, Ian, Palmer, Jeremy, and Pettit, Christopher. Medicaid managed care financial results for 2018. Milliman Insight, June 28, 2019, https://www.milliman.com/insight/28/Medicaid-managed-care-financial-results-for-2018 (accessed March 11, 2020).
20
Copyright © 2020 Society of Actuaries
slightly higher than the number of market entrants, for a net decrease of 19 insurers participating on state
exchanges. This insurer participation trend was magnified for the 2017 and 2018 coverage years as financial results
were fully realized. By 2018, insurer participation had decreased by 30% relative to the 2014 coverage year.
However, as insurers’ financial margins swung from substantial losses in 2014 through 2016 to profitability in 2017
and 2018 (associated with large premium rate increases discussed in the next section), insurer exchange
participation began to rebound for the 2019 and 2020 coverage years.
Premium Rate Level and Volatility
OBSERVATION #5: INITIAL EXCHANGE PREMIUM RATES WERE UNSUSTAINABLE.
Consistent with the initial stage of the underwriting cycle, premium rates in the early years of the ACA were lower
than the CBO originally anticipated.32 Some even suggested that premium rates were lower than they were in 2013
after accounting for differences in covered benefits and cost sharing.33 We estimate that the nationwide average
premium for the lowest premium silver plan for a person age 40 was $256 per month in 2014, before any premium
subsidies available to low-income consumers. The nationwide average rate increase for the lowest premium silver
plans was approximately 4% in 2015 and approximately 8% in 2016.34
The low and relatively stable premiums in 2014 and 2015 compared to later years can be largely attributed to the
competitive dynamics and anticipated risk corridor protections noted above, along with the transitional reinsurance
program that covered approximately $8 billion in reimbursable claims for the 2014 and 2015 plan years.35 Insurers
also did not have credible claim experience data for their ACA plans when setting premium rates in those years.
32 Congressional Budget Office. Updated Estimates of the Effects of the Insurance Coverage Provisions of the Affordable Care Act. April 2014, https://www.cbo.gov/sites/default/files/113th-congress-2013-2014/reports/45231-acaestimatesonecolumn.pdf (accessed February 24, 2020). 33 Alder, Loren, and Paul Ginsburg. Obamacare Premiums Are Lower Than You Think. Health Affairs Blog, July 21, 2016, https://www.healthaffairs.org/do/10.1377/hblog20160721.055898/full/ (accessed on January 8, 2019). 34 See Appendix A for information on how these estimates were derived. 35 Houchens, Paul, Jason, Clarkson, and Jason, Melek. 2018. Commercial Health Insurance: Overview of 2016 Financial Results and Emerging Enrollment and Premium Data. Milliman Research Report, May, https://milliman-cdn.azureedge.net/-/media/milliman/importedfiles/uploadedfiles/insight/2018/commercial-health-insurance-2016-overview.ashx (accessed February 24, 2020).
STATE-SPECIFIC STORIES
Minnesota had the lowest exchange rates in the country in 2014. The lowest silver premium rate in the state’s most
populated rating region was more than 10% lower than the lowest silver premium rate in the most populated rating regions of any other state in the nation. The insurer offering the lowest rates in 2014 experienced substantial losses and left the exchange in 2015. Premiums for the lowest silver plan in the most populated region increased by 18% that year, but that still wasn’t enough to save insurers from large losses. The average preliminary medical loss ratio for insurers offering ACA-compliant plans in Minnesota was 107% in 2014 and rose to 120% in 2015. The average lowest silver rates increased by 25% in 2016 and nearly 60% in 2017. In 2018, Minnesota implemented a state-based reinsurance program under an approved Section 1332 Waiver, and rates have decreased each year since then.
Minnesota was one of 121 states that required all nongrandfathered plans to become ACA-compliant in 2014 and one of two states (the other being New York) to adopt the Basic Health Program in 2015. Minnesota had al ready expanded Medicaid to up to 200% FPL for adults and higher for pregnant women and children long before the ACA through its MinnesotaCare program. However, eligibility requirements have become more lenient and the provisions of the plan have become more generous with the passage of the ACA and the federal expansion. With Medicaid
expanded to 200% of FPL, silver cost-sharing reduction (CSR) plans through the exchange are only available to individuals between 200% and 250% FPL. As a result, the removal of direct federal funding for CSR subsidies had very little impact on silver premium rates in Minnesota.
1. California; Connecticut; Washington, D.C.; Delaware; Massachussets; Maryland; Montana; Nevada; New York; Rhode Island; and Washington also did not adopt the transitional policy for the 2014 plan year. Norris, Louis. 2019. Should I keep my grandmothered health plan? June. https://www.healthinsurance.org/obamacare-enrollment-guide/should-i-keep-my-grandmothered-health-plan/ (accessed March 5, 2020).
21
Copyright © 2020 Society of Actuaries
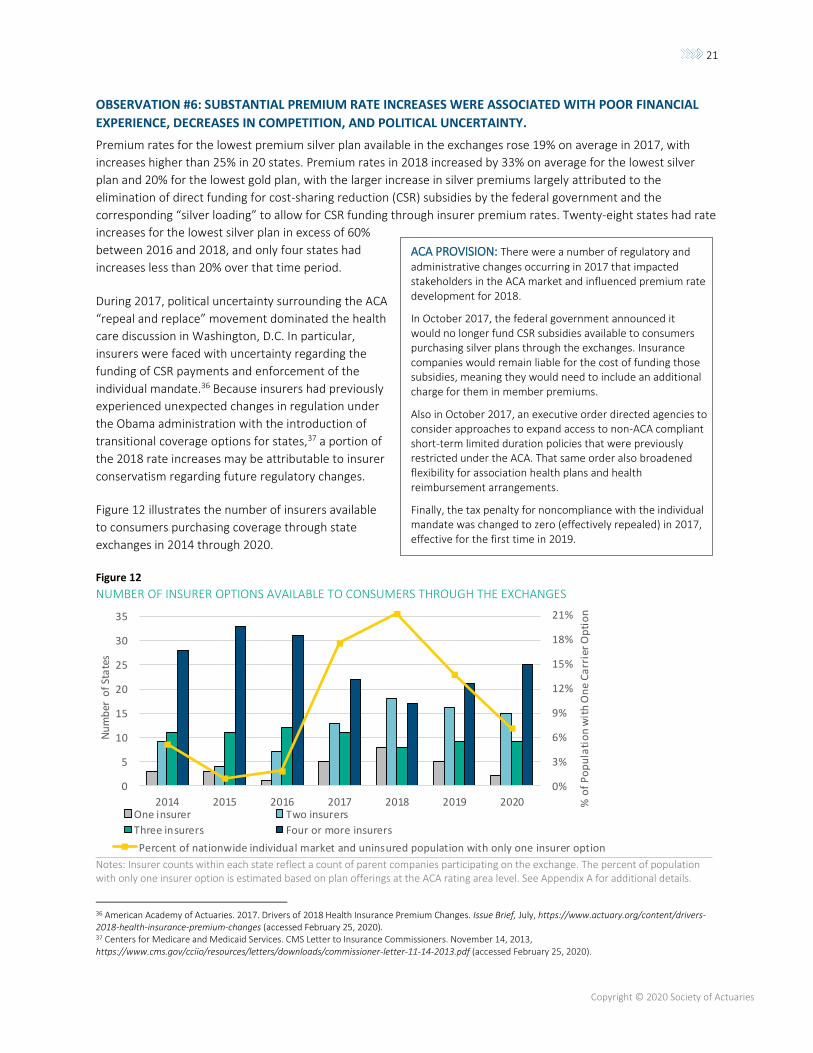
OBSERVATION #6: SUBSTANTIAL PREMIUM RATE INCREASES WERE ASSOCIATED WITH POOR FINANCIAL
EXPERIENCE, DECREASES IN COMPETITION, AND POLITICAL UNCERTAINTY.
Premium rates for the lowest premium silver plan available in the exchanges rose 19% on average in 2017, with
increases higher than 25% in 20 states. Premium rates in 2018 increased by 33% on average for the lowest silver
plan and 20% for the lowest gold plan, with the larger increase in silver premiums largely attributed to the
elimination of direct funding for cost-sharing reduction (CSR) subsidies by the federal government and the
corresponding “silver loading” to allow for CSR funding through insurer premium rates. Twenty-eight states had rate
increases for the lowest silver plan in excess of 60%
between 2016 and 2018, and only four states had
increases less than 20% over that time period.
During 2017, political uncertainty surrounding the ACA
“repeal and replace” movement dominated the health
care discussion in Washington, D.C. In particular,
insurers were faced with uncertainty regarding the
funding of CSR payments and enforcement of the
individual mandate.36 Because insurers had previously
experienced unexpected changes in regulation under
the Obama administration with the introduction of
transitional coverage options for states,37 a portion of
the 2018 rate increases may be attributable to insurer
conservatism regarding future regulatory changes.
Figure 12 illustrates the number of insurers available
to consumers purchasing coverage through state
exchanges in 2014 through 2020.
Figure 12
NUMBER OF INSURER OPTIONS AVAILABLE TO CONSUMERS THROUGH THE EXCHANGES
Notes: Insurer counts within each state reflect a count of parent companies participating on the exchange. The percent of population with only one insurer option is estimated based on plan offerings at the ACA rating area level. See Appendix A for additional details.
36 American Academy of Actuaries. 2017. Drivers of 2018 Health Insurance Premium Changes. Issue Brief, July, https://www.actuary.org/content/drivers-2018-health-insurance-premium-changes (accessed February 25, 2020). 37 Centers for Medicare and Medicaid Services. CMS Letter to Insurance Commissioners. November 14, 2013, https://www.cms.gov/cciio/resources/letters/downloads/commissioner-letter-11-14-2013.pdf (accessed February 25, 2020).
0%3%6%9%12%15%18%21%
05101520253035
20
14
20
15
20
16
20
17
20
18
20
19
20
20
Percent of nationwide individual market and uninsured population with only one insurer option
0%
3%
6%
9%
12%
15%
18%
21%
0
5
10
15
20
25
30
35
2014 2015 2016 2017 2018 2019 2020 % o
f P
op
ula
tio
n w
ith
On
e C
arr
ier
Op
tio
n
Nu
mb
er o
f St
ate
s
One insurer Two insurers
Three insurers Four or more insurers
ACA PROVISION: There were a number of regulatory and
administrative changes occurring in 2017 that impacted stakeholders in the ACA market and influenced premium rate development for 2018.
In October 2017, the federal government announced it would no longer fund CSR subsidies available to consumers purchasing silver plans through the exchanges. Insurance companies would remain liable for the cost of funding those subsidies, meaning they would need to include an additional charge for them in member premiums.
Also in October 2017, an executive order directed agencies to consider approaches to expand access to non-ACA compliant short-term limited duration policies that were previously restricted under the ACA. That same order also broadened flexibility for association health plans and health reimbursement arrangements.
Finally, the tax penalty for noncompliance with the individual mandate was changed to zero (effectively repealed) in 2017, effective for the first time in 2019.
22
Copyright © 2020 Society of Actuaries
As shown in Figure 12, the number of state exchanges with three or more insurers peaked in 2015 at 44 and
dropped by more than 40% in 2018 to 17. In addition, insurers participating in the exchanges often have different
service areas that may not overlap, so the number of insurers available to consumers within each state can vary by
region. We estimate that the percentage of the population with only one insurer option was under 10% for the first
three years of the exchanges and rose to more than 20% by 2018.
OBSERVATION #7: WITH A FEW EXCEPTIONS, INSURERS’ STATE-LEVEL FINANCIAL RESULTS WERE
CONSISTENT WITH NATIONAL TRENDS.
As shown in Figure 11, the insurance industry’s aggregate financial results for the individual market went from bad
to worse from 2014 to 2015, with some improvement in 2016. This financial result pattern was largely consistent in
each state market, with a few exceptions.
Shortfalls in funding of the risk corridor program
were a major contributor to insurers’ losses at both
the state and national level. The risk corridor
shortfall contributed to industry losses as a
percentage of risk corridor-eligible premium
revenue of approximately 6% in 2014, nearly 10% in
2015 and approximately 5% in 2016.38 If instead the
risk corridor program had been fully funded
between 2014 and 2016, insurers’ aggregate profit
margins would have been substantially improved in
each year.
38 Houchens, Paul, Jason, Clarkson, and Jason, Melek. 2018. Commercial Health Insurance: Overview of 2016 Financial Results and Emerging Enrollment and Premium Data. Milliman Research Report, May, https://milliman-cdn.azureedge.net/-/media/milliman/importedfiles/uploadedfiles/insight/2018/commercial-health-insurance-2016-overview.ashx (accessed February 25, 2020).
STATE-SPECIFIC STORIES
California adopted an active purchaser model in 2014, meaning that it implemented a vetting process for selecting insurers to participate on the exchange. California also required all insurers to offer prescribed benefit plans, promoting competition based primarily on network, premium and quality.1 Insurers in California did not experience the same steep financial losses reported in other states.
1. Quinn, Mattie. How California Keeps Health Premiums Down Like No Other State. Governing, May 10, 2016, https://www.governing.com/topics/health-human-services/gov-covered-california-health-insurance-premiums.html (accessed February 25, 2020).
STATE-SPECIFIC STORIES
New York has unique market dynamics that set it apart from many other states. New York implemented certain
ACA-style insurance provisions in 1992, some of which exceeded ACA requirements. Coverage was guaranteed issue, there were no laws requiring individuals to obtain health insurance, and there were little to no restrictions on when individuals needed to enroll. Premiums were also community rated, meaning that all health plan enrollees received the same premium rate regardless of their age, gender, health status or occupation.1 When the ACA was implemented, open enrollment restrictions were introduced, the individual mandate went into effect, and subsidies became available to consumers. New York also expanded Medicaid in 2014 and implemented a Basic Health Program in 2016.
The provisions in place before the ACA made New York’s transition to the ACA very different from most other states. In fact, premium rates in New York’s individual market declined in 2014, and the NY Department of Financial Services asserts that rates still remain well below pre-ACA levels in 2020 (after adjusting for inflation). 2 New York’s under-age-65 uninsured rate has been reduced by nearly half since 2013 to 6.3% as of 2018.
1. Coughlin, Teresa, Randall, Bovbjerg, and Shanna, Rifkin. 2012. ACA Implementation—Monitoring and Tracking, New York. The Urban Institute, April 12, https://www.urban.org/sites/default/files/publication/25286/412545-ACA-Implementation-Monitoring-and-Tracking-New-York-Site-Visit-Report.PDF (accessed February 25, 2020).
2. Department of Financial Services. DFS Announces 2020 Premium Rates: Lowers Overall Requested Rates for Individuals and Small Businesses to Protect Consumers and Fuel A Competitive Health Insurance Marketplace. August 9, 2019, https://www.dfs.ny.gov/reports_and_publications/press_releases/pr1908091 (accessed February 25, 2020).
23
Copyright © 2020 Society of Actuaries
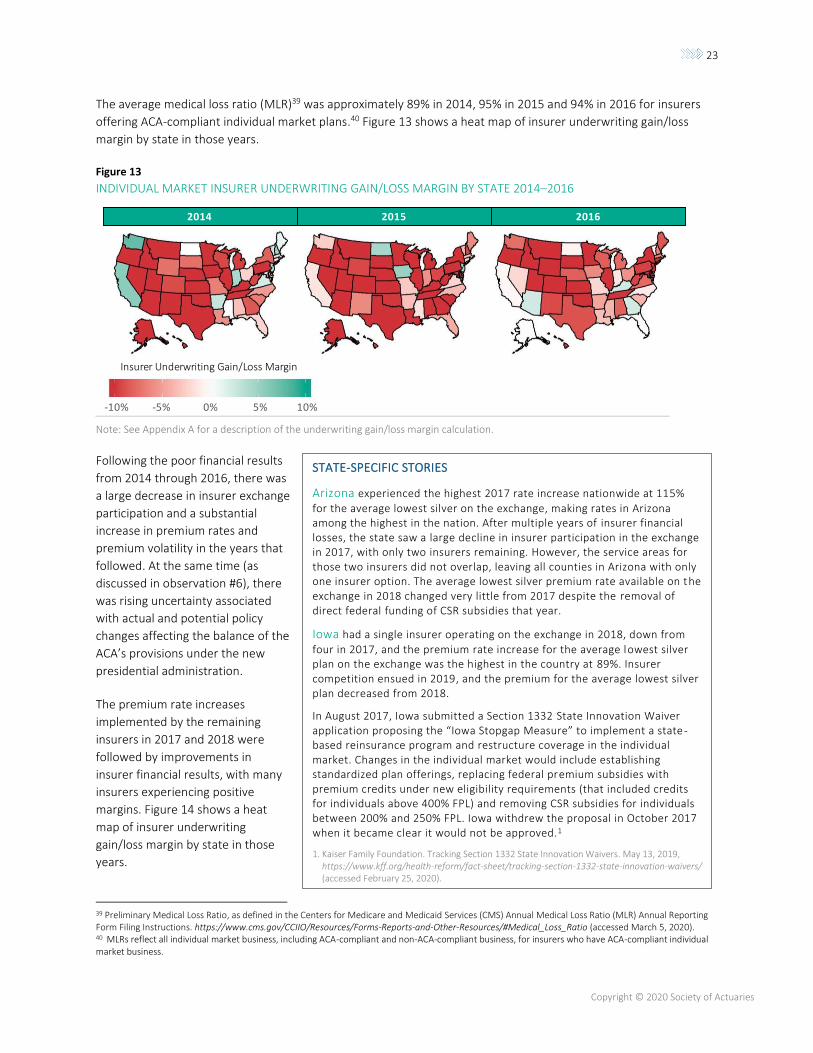
The average medical loss ratio (MLR)39 was approximately 89% in 2014, 95% in 2015 and 94% in 2016 for insurers
offering ACA-compliant individual market plans.40 Figure 13 shows a heat map of insurer underwriting gain/loss
margin by state in those years.
Figure 13
INDIVIDUAL MARKET INSURER UNDERWRITING GAIN/LOSS MARGIN BY STATE 2014–2016
Note: See Appendix A for a description of the underwriting gain/loss margin calculation.
Following the poor financial results
from 2014 through 2016, there was
a large decrease in insurer exchange
participation and a substantial
increase in premium rates and
premium volatility in the years that
followed. At the same time (as
discussed in observation #6), there
was rising uncertainty associated
with actual and potential policy
changes affecting the balance of the
ACA’s provisions under the new
presidential administration.
The premium rate increases
implemented by the remaining
insurers in 2017 and 2018 were
followed by improvements in
insurer financial results, with many
insurers experiencing positive
margins. Figure 14 shows a heat
map of insurer underwriting
gain/loss margin by state in those
years.
39 Preliminary Medical Loss Ratio, as defined in the Centers for Medicare and Medicaid Services (CMS) Annual Medical Loss Ratio (MLR) Annual Reporting Form Filing Instructions. https://www.cms.gov/CCIIO/Resources/Forms-Reports-and-Other-Resources/#Medical_Loss_Ratio (accessed March 5, 2020). 40 MLRs reflect all individual market business, including ACA-compliant and non-ACA-compliant business, for insurers who have ACA-compliant individual market business.
STATE-SPECIFIC STORIES
Arizona experienced the highest 2017 rate increase nationwide at 115%
for the average lowest silver on the exchange, making rates in Arizona among the highest in the nation. After multiple years of insurer financial losses, the state saw a large decline in insurer participation in the exchange in 2017, with only two insurers remaining. However, the service areas for those two insurers did not overlap, leaving all counties in Arizona with only one insurer option. The average lowest silver premium rate available on the exchange in 2018 changed very little from 2017 despite the removal of direct federal funding of CSR subsidies that year.
Iowa had a single insurer operating on the exchange in 2018, down from
four in 2017, and the premium rate increase for the average lowest silver plan on the exchange was the highest in the country at 89%. Insurer competition ensued in 2019, and the premium for the average lowest silver plan decreased from 2018.
In August 2017, Iowa submitted a Section 1332 State Innovation Waiver application proposing the “Iowa Stopgap Measure” to implement a state -based reinsurance program and restructure coverage in the individual market. Changes in the individual market would include establishing standardized plan offerings, replacing federal premium subsidies with premium credits under new eligibility requirements (that included credits for individuals above 400% FPL) and removing CSR subsidies for individuals between 200% and 250% FPL. Iowa withdrew the proposal in October 2017 when it became clear it would not be approved.1
1. Kaiser Family Foundation. Tracking Section 1332 State Innovation Waivers. May 13, 2019, https://www.kff.org/health-reform/fact-sheet/tracking-section-1332-state-innovation-waivers/ (accessed February 25, 2020).
Insurer Underwriting Gain/Loss Margin
2014 2015 2016
-10% -5% 0% 5% 10%
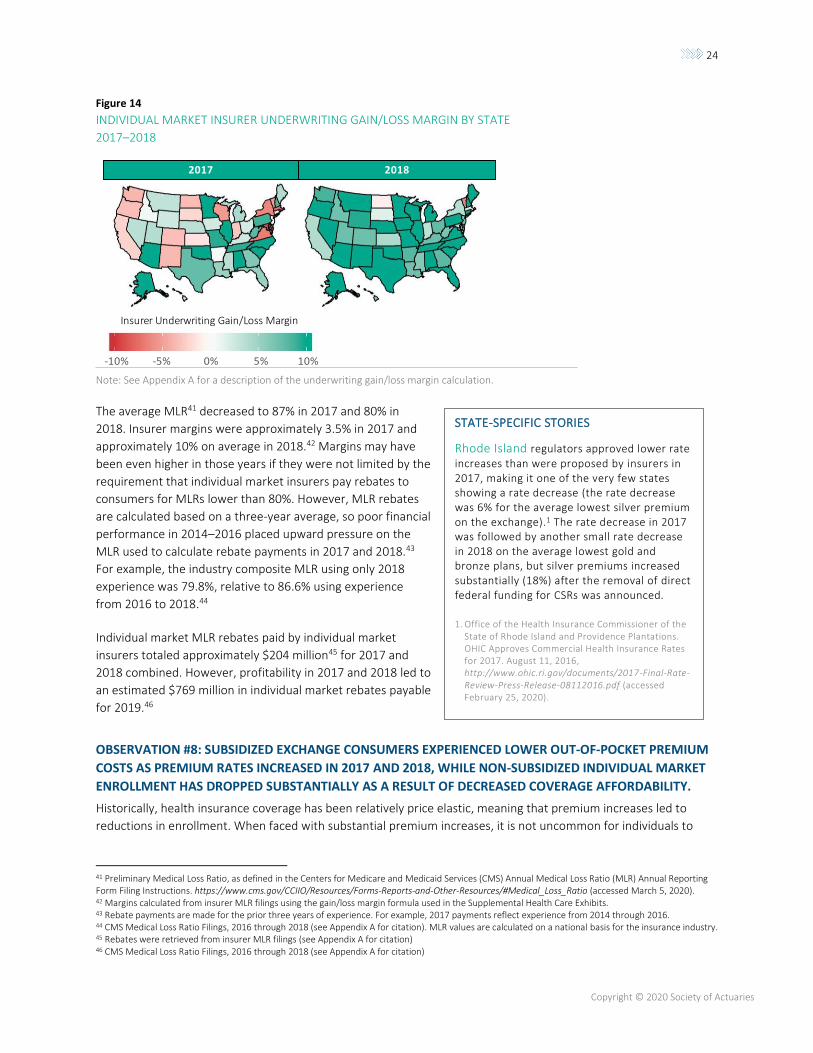
24
Copyright © 2020 Society of Actuaries
Figure 14
INDIVIDUAL MARKET INSURER UNDERWRITING GAIN/LOSS MARGIN BY STATE
2017–2018
Note: See Appendix A for a description of the underwriting gain/loss margin calculation.
The average MLR41 decreased to 87% in 2017 and 80% in
2018. Insurer margins were approximately 3.5% in 2017 and
approximately 10% on average in 2018.42 Margins may have
been even higher in those years if they were not limited by the
requirement that individual market insurers pay rebates to
consumers for MLRs lower than 80%. However, MLR rebates
are calculated based on a three-year average, so poor financial
performance in 2014–2016 placed upward pressure on the
MLR used to calculate rebate payments in 2017 and 2018.43
For example, the industry composite MLR using only 2018
experience was 79.8%, relative to 86.6% using experience
from 2016 to 2018.44
Individual market MLR rebates paid by individual market
insurers totaled approximately $204 million45 for 2017 and
2018 combined. However, profitability in 2017 and 2018 led to
an estimated $769 million in individual market rebates payable
for 2019.46
OBSERVATION #8: SUBSIDIZED EXCHANGE CONSUMERS EXPERIENCED LOWER OUT-OF-POCKET PREMIUM
COSTS AS PREMIUM RATES INCREASED IN 2017 AND 2018, WHILE NON-SUBSIDIZED INDIVIDUAL MARKET
ENROLLMENT HAS DROPPED SUBSTANTIALLY AS A RESULT OF DECREASED COVERAGE AFFORDABILITY.
Historically, health insurance coverage has been relatively price elastic, meaning that premium increases led to
reductions in enrollment. When faced with substantial premium increases, it is not uncommon for individuals to
41 Preliminary Medical Loss Ratio, as defined in the Centers for Medicare and Medicaid Services (CMS) Annual Medical Loss Ratio (MLR) Annual Reporting Form Filing Instructions. https://www.cms.gov/CCIIO/Resources/Forms-Reports-and-Other-Resources/#Medical_Loss_Ratio (accessed March 5, 2020). 42 Margins calculated from insurer MLR filings using the gain/loss margin formula used in the Supplemental Health Care Exhibits. 43 Rebate payments are made for the prior three years of experience. For example, 2017 payments reflect experience from 2014 through 2016. 44 CMS Medical Loss Ratio Filings, 2016 through 2018 (see Appendix A for citation). MLR values are calculated on a national basis for the insurance industry. 45 Rebates were retrieved from insurer MLR filings (see Appendix A for citation) 46 CMS Medical Loss Ratio Filings, 2016 through 2018 (see Appendix A for citation)
STATE-SPECIFIC STORIES
Rhode Island regulators approved lower rate increases than were proposed by insurers in 2017, making it one of the very few states showing a rate decrease (the rate decrease was 6% for the average lowest silver premium on the exchange).1 The rate decrease in 2017 was followed by another small rate decrease in 2018 on the average lowest gold and bronze plans, but silver premiums increased substantially (18%) after the removal of direct federal funding for CSRs was announced.
1. Office of the Health Insurance Commissioner of the State of Rhode Island and Providence Plantations. OHIC Approves Commercial Health Insurance Rates for 2017. August 11, 2016, http://www.ohic.ri.gov/documents/2017-Final-Rate-Review-Press-Release-08112016.pdf (accessed February 25, 2020).
Insurer Underwriting Gain/Loss Margin
2017 2018
-10% -5% 0% 5% 10%
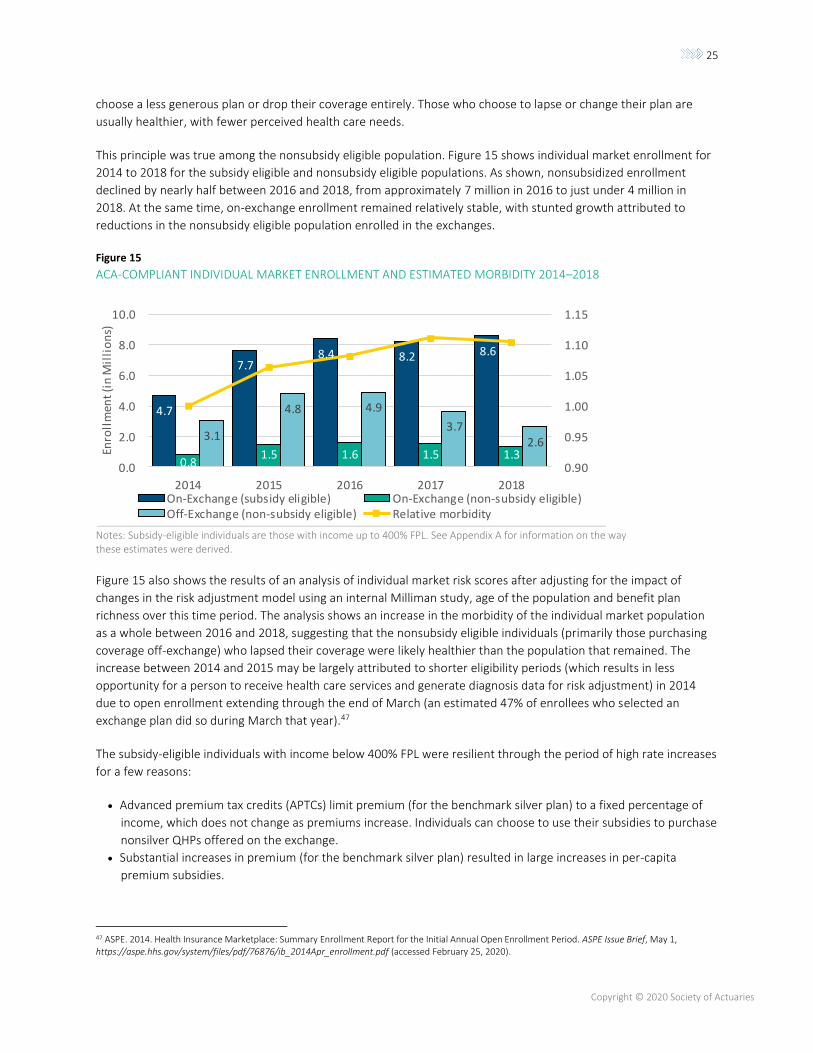
25
Copyright © 2020 Society of Actuaries
choose a less generous plan or drop their coverage entirely. Those who choose to lapse or change their plan are
usually healthier, with fewer perceived health care needs.
This principle was true among the nonsubsidy eligible population. Figure 15 shows individual market enrollment for
2014 to 2018 for the subsidy eligible and nonsubsidy eligible populations. As shown, nonsubsidized enrollment
declined by nearly half between 2016 and 2018, from approximately 7 million in 2016 to just under 4 million in
2018. At the same time, on-exchange enrollment remained relatively stable, with stunted growth attributed to
reductions in the nonsubsidy eligible population enrolled in the exchanges.
Figure 15
ACA-COMPLIANT INDIVIDUAL MARKET ENROLLMENT AND ESTIMATED MORBIDITY 2014–2018
Notes: Subsidy-eligible individuals are those with income up to 400% FPL. See Appendix A for information on the way these estimates were derived.
Figure 15 also shows the results of an analysis of individual market risk scores after adjusting for the impact of
changes in the risk adjustment model using an internal Milliman study, age of the population and benefit plan
richness over this time period. The analysis shows an increase in the morbidity of the individual market population
as a whole between 2016 and 2018, suggesting that the nonsubsidy eligible individuals (primarily those purchasing
coverage off-exchange) who lapsed their coverage were likely healthier than the population that remained. The
increase between 2014 and 2015 may be largely attributed to shorter eligibility periods (which results in less
opportunity for a person to receive health care services and generate diagnosis data for risk adjustment) in 2014
due to open enrollment extending through the end of March (an estimated 47% of enrollees who selected an
exchange plan did so during March that year).47
The subsidy-eligible individuals with income below 400% FPL were resilient through the period of high rate increases
for a few reasons:
• Advanced premium tax credits (APTCs) limit premium (for the benchmark silver plan) to a fixed percentage of
income, which does not change as premiums increase. Individuals can choose to use their subsidies to purchase
nonsilver QHPs offered on the exchange.
• Substantial increases in premium (for the benchmark silver plan) resulted in large increases in per-capita
premium subsidies.
47 ASPE. 2014. Health Insurance Marketplace: Summary Enrollment Report for the Initial Annual Open Enrollment Period. ASPE Issue Brief, May 1, https://aspe.hhs.gov/system/files/pdf/76876/ib_2014Apr_enrollment.pdf (accessed February 25, 2020).
4.7
7.78.4 8.2 8.6
0.81.5 1.6 1.5 1.3
3.1
4.8 4.9
3.72.6
0.90
0.95
1.00
1.05
1.10
1.15
0.0
2.0
4.0
6.0
8.0
10.0
2014 2015 2016 2017 2018
Enro
llm
ent
(in
Mil
lio
ns)
On-Exchange (subsidy eligible) On-Exchange (non-subsidy eligible)Off-Exchange (non-subsidy eligible) Relative morbidity
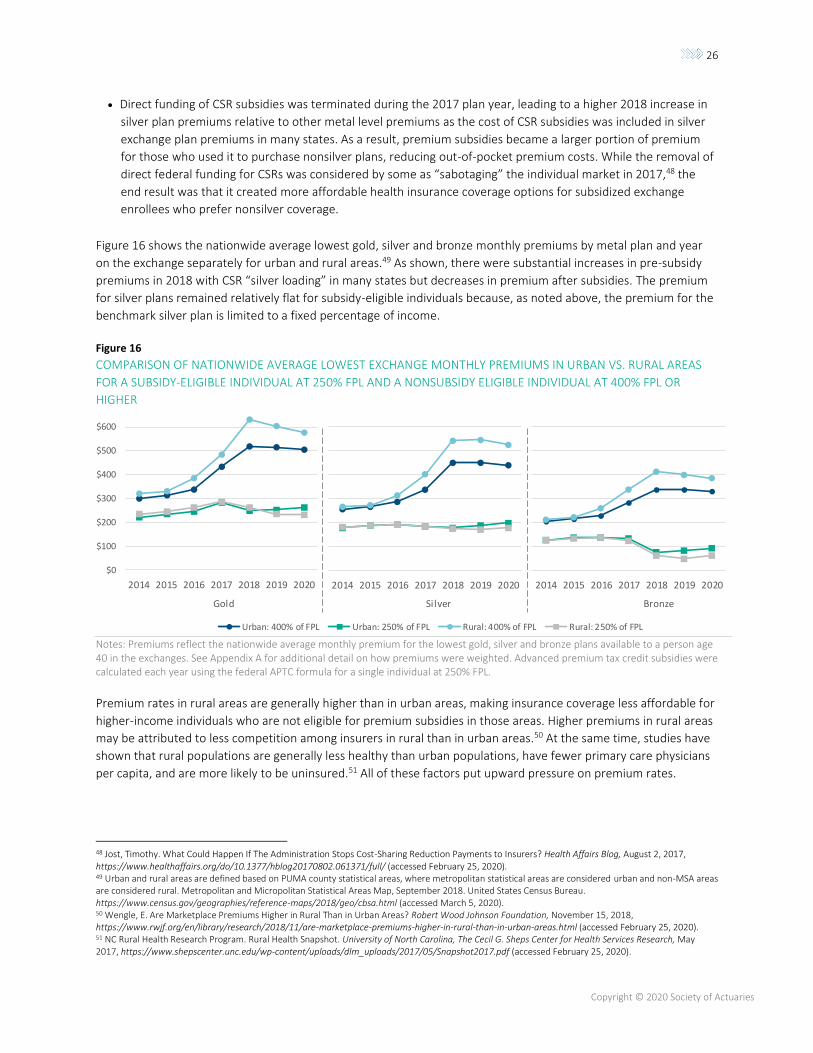
26
Copyright © 2020 Society of Actuaries
• Direct funding of CSR subsidies was terminated during the 2017 plan year, leading to a higher 2018 increase in
silver plan premiums relative to other metal level premiums as the cost of CSR subsidies was included in silver
exchange plan premiums in many states. As a result, premium subsidies became a larger portion of premium
for those who used it to purchase nonsilver plans, reducing out-of-pocket premium costs. While the removal of
direct federal funding for CSRs was considered by some as “sabotaging” the individual market in 2017,48 the
end result was that it created more affordable health insurance coverage options for subsidized exchange
enrollees who prefer nonsilver coverage.
Figure 16 shows the nationwide average lowest gold, silver and bronze monthly premiums by metal plan and year
on the exchange separately for urban and rural areas.49 As shown, there were substantial increases in pre-subsidy
premiums in 2018 with CSR “silver loading” in many states but decreases in premium after subsidies. The premium
for silver plans remained relatively flat for subsidy-eligible individuals because, as noted above, the premium for the
benchmark silver plan is limited to a fixed percentage of income.
Figure 16
COMPARISON OF NATIONWIDE AVERAGE LOWEST EXCHANGE MONTHLY PREMIUMS IN URBAN VS. RURAL AREAS
FOR A SUBSIDY-ELIGIBLE INDIVIDUAL AT 250% FPL AND A NONSUBSIDY ELIGIBLE INDIVIDUAL AT 400% FPL OR
HIGHER
Notes: Premiums reflect the nationwide average monthly premium for the lowest gold, silver and bronze plans available to a person age 40 in the exchanges. See Appendix A for additional detail on how premiums were weighted. Advanced premium tax credit subsidies were calculated each year using the federal APTC formula for a single individual at 250% FPL.
Premium rates in rural areas are generally higher than in urban areas, making insurance coverage less affordable for
higher-income individuals who are not eligible for premium subsidies in those areas. Higher premiums in rural areas
may be attributed to less competition among insurers in rural than in urban areas.50 At the same time, studies have
shown that rural populations are generally less healthy than urban populations, have fewer primary care physicians
per capita, and are more likely to be uninsured.51 All of these factors put upward pressure on premium rates.
48 Jost, Timothy. What Could Happen If The Administration Stops Cost-Sharing Reduction Payments to Insurers? Health Affairs Blog, August 2, 2017, https://www.healthaffairs.org/do/10.1377/hblog20170802.061371/full/ (accessed February 25, 2020). 49 Urban and rural areas are defined based on PUMA county statistical areas, where metropolitan statistical areas are considered urban and non-MSA areas are considered rural. Metropolitan and Micropolitan Statistical Areas Map, September 2018. United States Census Bureau. https://www.census.gov/geographies/reference-maps/2018/geo/cbsa.html (accessed March 5, 2020). 50 Wengle, E. Are Marketplace Premiums Higher in Rural Than in Urban Areas? Robert Wood Johnson Foundation, November 15, 2018, https://www.rwjf.org/en/library/research/2018/11/are-marketplace-premiums-higher-in-rural-than-in-urban-areas.html (accessed February 25, 2020). 51 NC Rural Health Research Program. Rural Health Snapshot. University of North Carolina, The Cecil G. Sheps Center for Health Services Research, May 2017, https://www.shepscenter.unc.edu/wp-content/uploads/dlm_uploads/2017/05/Snapshot2017.pdf (accessed February 25, 2020).
2014 2015 2016 2017 2018 2019 2020
Urban: 400% of FPL Urban: 250% of FPL Rural: 400% of FPL Rural: 250% of FPL
$0
$100
$200
$300
$400
$500
$600
2014 2015 2016 2017 2018 2019 2020 2014 2015 2016 2017 2018 2019 2020 2014 2015 2016 2017 2018 2019 2020
Gold Silver Bronze
27
Copyright © 2020 Society of Actuaries
OBSERVATION #9: PREMIUMS PLATEAUED WITH GROWTH IN THE NUMBER OF STATES IMPLEMENTING
SECTION 1332 STATE INNOVATION WAIVERS AND IMPROVEMENTS IN INSURER FINANCIALS.
For many persons previously uninsured, particularly low-income households, the ACA has provided comprehensive
health insurance coverage through Medicaid expansion or the exchanges, along with substantially decreasing out-
of-pocket health insurance premiums and cost sharing. However, for some consumers, particularly those not
qualifying for federal premium assistance or Medicaid coverage, an argument could be made that individual market
premium rates under the ACA are simply unaffordable.
For example, Figure 16 shows that the national average annual premium for the lowest-cost bronze plan is
approximately $4,000 in 2020 before subsidies for a person age 40. For a single person with annual income of
approximately $52,000 (just over the 400% FPL threshold for premium subsidy eligibility in CY 202052), monthly
premiums represent 8% of income.53 In CY 2020, the average deductible (combined medical and pharmacy) for
bronze coverage plans is approximately $6,500.54 Between the monthly premiums and deductible requirement, this
individual may incur expenses in excess of 20% of annual income before a benefit is received from the insurance
plan.
For effective dates beginning January 1, 2017, Section 1332 of the ACA permits a state to apply for a State
Innovation Waiver. For a state to receive federal approval for its Section 1332 State Innovation Waiver, it must
demonstrate through an actuarial certification and economic analysis that its proposal will provide access to health
insurance that is as affordable and comprehensive as under the standard ACA structure, insure at least the same
number of persons and not increase the federal deficit. To the extent the state’s proposal reduces federal
expenditures on federal premium assistance provided through the exchanges, a state may also be eligible to receive
federal pass-through funding. For example, if without the waiver the federal government’s annual premium
assistance expenditures would total $500 million for the state but under the waiver the premium assistance
expenditures are reduced to $400 million, the state would be eligible to recapture the reduction in premium
assistance expenditures ($100 million) in pass-through funding.
Twelve states55 have successfully applied for a Section 1332 State Innovation Waiver to implement a state-based
reinsurance program that is supported, in part, by federal pass-through funding. Two states, New Jersey and Rhode
Island, have also implemented state-based insurance coverage mandates to assist in the funding of the reinsurance
program.
Figure 17 shows how monthly premium rates for the lowest-premium silver plan available in these state exchanges
that received the waiver changed from 2014 through 2020. Premium rates declined in the first year Section 1332
State Innovation Waivers were implemented in all states except Oregon and Rhode Island.56
52 For the 48 contiguous states and the District of Columbia. Note that FPL levels are higher in Hawaii and Alaska. Poverty Guidelines 2020. Office of the Assistant Secretary for Planning and Evaluation, January 8, 2020. https://aspe.hhs.gov/poverty-guidelines (accessed on March 5, 2020). 53 Kaiser Family Foundation. Health Insurance Marketplace Calculator. October 31, 2019, https://www.kff.org/interactive/subsidy-calculator/ (accessed February 25, 2020). 54 Kaiser Family Foundation. Cost-Sharing for Plans Offered in the Federal Marketplace, 2014-2020. December 9, 2019, https://www.kff.org/slideshow/cost-sharing-for-plans-offered-in-the-federal-marketplace-2014-2020/ (accessed February 25, 2020). 55 States successfully applying for a Section 1332 State Innovation Waivers to implement a state-based reinsurance program are Alaska, Colorado, Delaware, Maryland, Maine, Minnesota, Montana, North Dakota, New Jersey, Oregon, Rhode Island and Wisconsin. 56 While premium rates did not decline in Oregon and Rhode Island, premium rate increases would have been larger without a state-based reinsurance program (see state specific stories in this section for Oregon and Rhode Island).
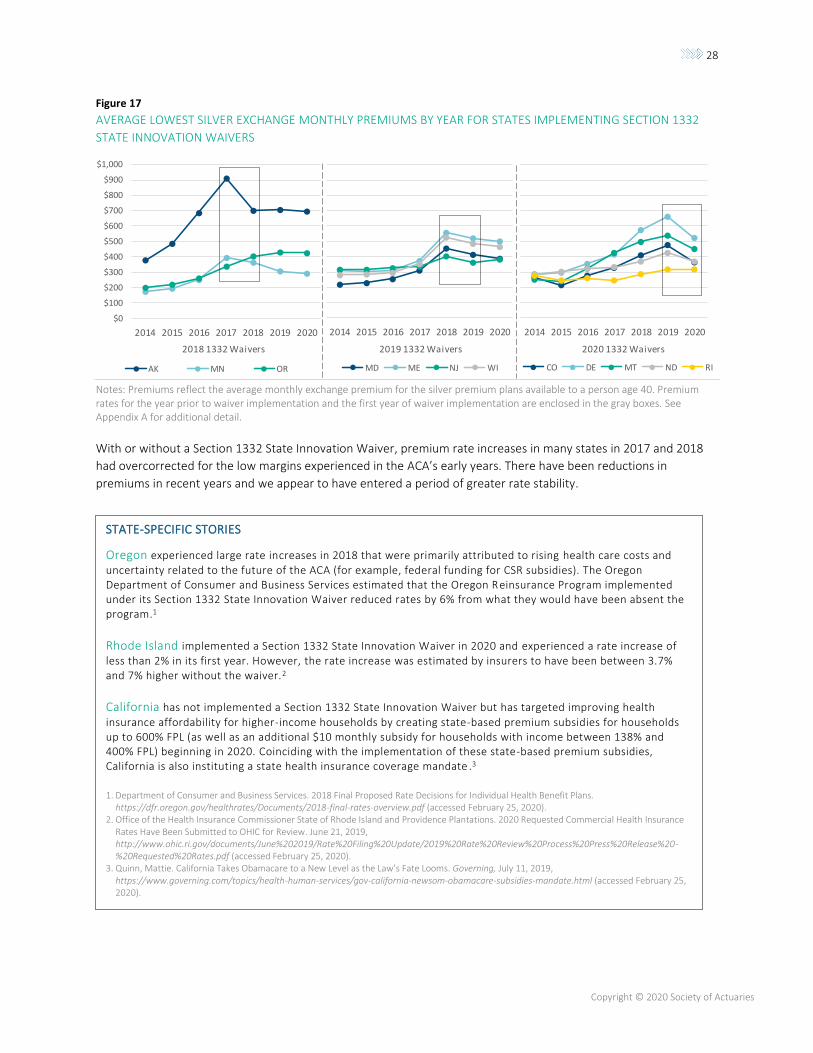
28
Copyright © 2020 Society of Actuaries
Figure 17
AVERAGE LOWEST SILVER EXCHANGE MONTHLY PREMIUMS BY YEAR FOR STATES IMPLEMENTING SECTION 1332
STATE INNOVATION WAIVERS
Notes: Premiums reflect the average monthly exchange premium for the silver premium plans available to a person age 40. Premium rates for the year prior to waiver implementation and the first year of waiver implementation are enclosed in the gray boxes. See Appendix A for additional detail.
With or without a Section 1332 State Innovation Waiver, premium rate increases in many states in 2017 and 2018
had overcorrected for the low margins experienced in the ACA’s early years. There have been reductions in
premiums in recent years and we appear to have entered a period of greater rate stability.
$0
$100
$200
$300
$400
$500
$600
$700
$800
$900
$1,000
2014 2015 2016 2017 2018 2019 2020
AK MN OR
2014 2015 2016 2017 2018 2019 2020
MD ME NJ WI
2014 2015 2016 2017 2018 2019 2020
CO DE MT ND RI
2018 1332 Waivers 2019 1332 Waivers 2020 1332 Waivers
STATE-SPECIFIC STORIES
Oregon experienced large rate increases in 2018 that were primarily attributed to rising health care costs and uncertainty related to the future of the ACA (for example, federal funding for CSR subsidies). The Oregon Department of Consumer and Business Services estimated that the Oregon Reinsurance Program implemented under its Section 1332 State Innovation Waiver reduced rates by 6% from what they would have been absent the program.1
Rhode Island implemented a Section 1332 State Innovation Waiver in 2020 and experienced a rate increase of less than 2% in its first year. However, the rate increase was estimated by insurers to have been between 3.7% and 7% higher without the waiver.2
California has not implemented a Section 1332 State Innovation Waiver but has targeted improving health
insurance affordability for higher-income households by creating state-based premium subsidies for households up to 600% FPL (as well as an additional $10 monthly subsidy for households with income between 138% and 400% FPL) beginning in 2020. Coinciding with the implementation of these state-based premium subsidies, California is also instituting a state health insurance coverage mandate .3
1. Department of Consumer and Business Services. 2018 Final Proposed Rate Decisions for Individual Health Benefit Plans. https://dfr.oregon.gov/healthrates/Documents/2018-final-rates-overview.pdf (accessed February 25, 2020).
2. Office of the Health Insurance Commissioner State of Rhode Island and Providence Plantations. 2020 Requested Commercial Health Insurance Rates Have Been Submitted to OHIC for Review. June 21, 2019, http://www.ohic.ri.gov/documents/June%202019/Rate%20Filing%20Update/2019%20Rate%20Review%20Process%20Press%20Release%20-%20Requested%20Rates.pdf (accessed February 25, 2020).
3. Quinn, Mattie. California Takes Obamacare to a New Level as the Law’s Fate Looms. Governing, July 11, 2019, https://www.governing.com/topics/health-human-services/gov-california-newsom-obamacare-subsidies-mandate.html (accessed February 25, 2020).
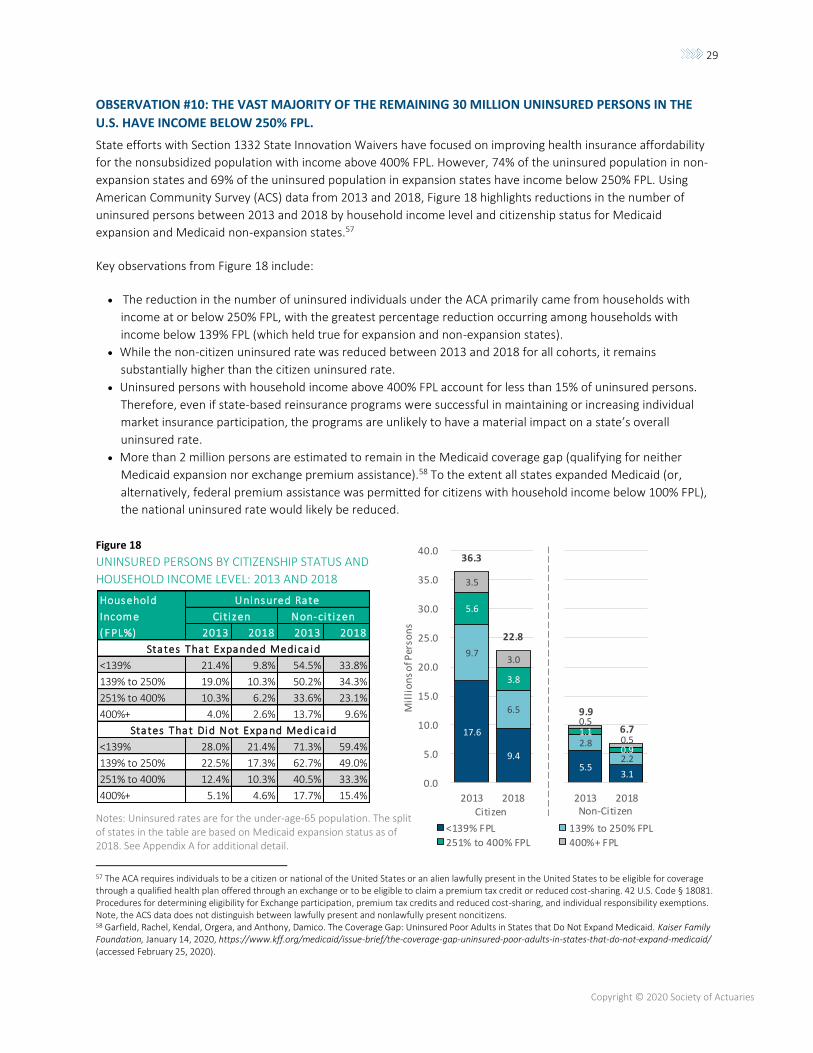
29
Copyright © 2020 Society of Actuaries
OBSERVATION #10: THE VAST MAJORITY OF THE REMAINING 30 MILLION UNINSURED PERSONS IN THE
U.S. HAVE INCOME BELOW 250% FPL.
State efforts with Section 1332 State Innovation Waivers have focused on improving health insurance affordability
for the nonsubsidized population with income above 400% FPL. However, 74% of the uninsured population in non-
expansion states and 69% of the uninsured population in expansion states have income below 250% FPL. Using
American Community Survey (ACS) data from 2013 and 2018, Figure 18 highlights reductions in the number of
uninsured persons between 2013 and 2018 by household income level and citizenship status for Medicaid
expansion and Medicaid non-expansion states.57
Key observations from Figure 18 include:
• The reduction in the number of uninsured individuals under the ACA primarily came from households with
income at or below 250% FPL, with the greatest percentage reduction occurring among households with
income below 139% FPL (which held true for expansion and non-expansion states).
• While the non-citizen uninsured rate was reduced between 2013 and 2018 for all cohorts, it remains
substantially higher than the citizen uninsured rate.
• Uninsured persons with household income above 400% FPL account for less than 15% of uninsured persons.
Therefore, even if state-based reinsurance programs were successful in maintaining or increasing individual
market insurance participation, the programs are unlikely to have a material impact on a state’s overall
uninsured rate.
• More than 2 million persons are estimated to remain in the Medicaid coverage gap (qualifying for neither
Medicaid expansion nor exchange premium assistance).58 To the extent all states expanded Medicaid (or,
alternatively, federal premium assistance was permitted for citizens with household income below 100% FPL),
the national uninsured rate would likely be reduced.
Figure 18
UNINSURED PERSONS BY CITIZENSHIP STATUS AND
HOUSEHOLD INCOME LEVEL: 2013 AND 2018
Notes: Uninsured rates are for the under-age-65 population. The split of states in the table are based on Medicaid expansion status as of 2018. See Appendix A for additional detail.
57 The ACA requires individuals to be a citizen or national of the United States or an alien lawfully present in the United States to be eligible for coverage through a qualified health plan offered through an exchange or to be eligible to claim a premium tax credit or reduced cost-sharing. 42 U.S. Code § 18081. Procedures for determining eligibility for Exchange participation, premium tax credits and reduced cost-sharing, and individual responsibility exemptions. Note, the ACS data does not distinguish between lawfully present and nonlawfully present noncitizens. 58 Garfield, Rachel, Kendal, Orgera, and Anthony, Damico. The Coverage Gap: Uninsured Poor Adults in States that Do Not Expand Medicaid. Kaiser Family Foundation, January 14, 2020, https://www.kff.org/medicaid/issue-brief/the-coverage-gap-uninsured-poor-adults-in-states-that-do-not-expand-medicaid/ (accessed February 25, 2020).
17.6
9.4
9.7
6.5
5.6
3.8
3.5
3.0
36.3
22.8
0.0
5.0
10.0
15.0
20.0
25.0
30.0
35.0
40.0
2013 2018
Mil
lio
ns
of P
erso
ns
<139% FPL 139% to 250% FPL
251% to 400% FPL 400%+ FPL
5.5 3.1
2.8
2.2
1.1
0.9
0.5
0.5
9.9
6.7
0.0
5.0
10.0
15.0
20.0
25.0
30.0
35.0
40.0
2013 2018Citizen Non-Citizen
Household Uninsured Rate
Incom e Ci t i zen Non-ci t i zen
( F PL%) 2013 2018 2013 2018
States That Expanded Medica id
<139% 21.4% 9.8% 54.5% 33.8%
139% to 250% 19.0% 10.3% 50.2% 34.3%
251% to 400% 10.3% 6.2% 33.6% 23.1%
400%+ 4.0% 2.6% 13.7% 9.6%
States That Did Not Expand Medica id
<139% 28.0% 21.4% 71.3% 59.4%
139% to 250% 22.5% 17.3% 62.7% 49.0%
251% to 400% 12.4% 10.3% 40.5% 33.3%
400%+ 5.1% 4.6% 17.7% 15.4%
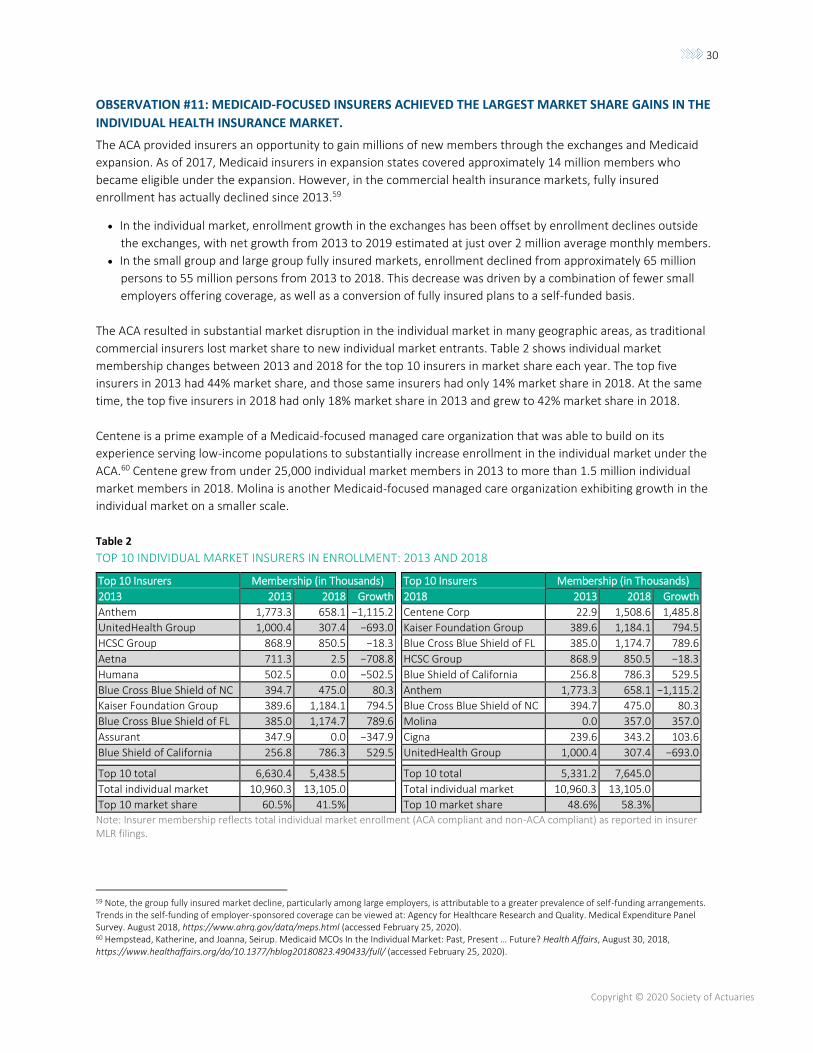
30
Copyright © 2020 Society of Actuaries
OBSERVATION #11: MEDICAID-FOCUSED INSURERS ACHIEVED THE LARGEST MARKET SHARE GAINS IN THE
INDIVIDUAL HEALTH INSURANCE MARKET.
The ACA provided insurers an opportunity to gain millions of new members through the exchanges and Medicaid
expansion. As of 2017, Medicaid insurers in expansion states covered approximately 14 million members who
became eligible under the expansion. However, in the commercial health insurance markets, fully insured
enrollment has actually declined since 2013.59
• In the individual market, enrollment growth in the exchanges has been offset by enrollment declines outside
the exchanges, with net growth from 2013 to 2019 estimated at just over 2 million average monthly members.
• In the small group and large group fully insured markets, enrollment declined from approximately 65 million
persons to 55 million persons from 2013 to 2018. This decrease was driven by a combination of fewer small
employers offering coverage, as well as a conversion of fully insured plans to a self-funded basis.
The ACA resulted in substantial market disruption in the individual market in many geographic areas, as traditional
commercial insurers lost market share to new individual market entrants. Table 2 shows individual market
membership changes between 2013 and 2018 for the top 10 insurers in market share each year. The top five
insurers in 2013 had 44% market share, and those same insurers had only 14% market share in 2018. At the same
time, the top five insurers in 2018 had only 18% market share in 2013 and grew to 42% market share in 2018.
Centene is a prime example of a Medicaid-focused managed care organization that was able to build on its
experience serving low-income populations to substantially increase enrollment in the individual market under the
ACA.60 Centene grew from under 25,000 individual market members in 2013 to more than 1.5 million individual
market members in 2018. Molina is another Medicaid-focused managed care organization exhibiting growth in the
individual market on a smaller scale.
Table 2
TOP 10 INDIVIDUAL MARKET INSURERS IN ENROLLMENT: 2013 AND 2018
Top 10 Insurers Membership (in Thousands) Top 10 Insurers Membership (in Thousands)
2013 2013 2018 Growth 2018 2013 2018 Growth
Anthem 1,773.3 658.1 −1,115.2 Centene Corp 22.9 1,508.6 1,485.8
UnitedHealth Group 1,000.4 307.4 −693.0 Kaiser Foundation Group 389.6 1,184.1 794.5
HCSC Group 868.9 850.5 −18.3 Blue Cross Blue Shield of FL 385.0 1,174.7 789.6
Aetna 711.3 2.5 −708.8 HCSC Group 868.9 850.5 −18.3
Humana 502.5 0.0 −502.5 Blue Shield of California 256.8 786.3 529.5
Blue Cross Blue Shield of NC 394.7 475.0 80.3 Anthem 1,773.3 658.1 −1,115.2
Kaiser Foundation Group 389.6 1,184.1 794.5 Blue Cross Blue Shield of NC 394.7 475.0 80.3
Blue Cross Blue Shield of FL 385.0 1,174.7 789.6 Molina 0.0 357.0 357.0
Assurant 347.9 0.0 −347.9 Cigna 239.6 343.2 103.6
Blue Shield of California 256.8 786.3 529.5 UnitedHealth Group 1,000.4 307.4 −693.0
Top 10 total 6,630.4 5,438.5 Top 10 total 5,331.2 7,645.0
Total individual market 10,960.3 13,105.0 Total individual market 10,960.3 13,105.0
Top 10 market share 60.5% 41.5% Top 10 market share 48.6% 58.3%
Note: Insurer membership reflects total individual market enrollment (ACA compliant and non-ACA compliant) as reported in insurer MLR filings.
59 Note, the group fully insured market decline, particularly among large employers, is attributable to a greater prevalence of self-funding arrangements. Trends in the self-funding of employer-sponsored coverage can be viewed at: Agency for Healthcare Research and Quality. Medical Expenditure Panel Survey. August 2018, https://www.ahrq.gov/data/meps.html (accessed February 25, 2020). 60 Hempstead, Katherine, and Joanna, Seirup. Medicaid MCOs In the Individual Market: Past, Present … Future? Health Affairs, August 30, 2018, https://www.healthaffairs.org/do/10.1377/hblog20180823.490433/full/ (accessed February 25, 2020).

31
Copyright © 2020 Society of Actuaries
As shown in Table 2, while the ACA has disrupted national market share, it has not disrupted the concentration of
market share among the top 10 insurers. Despite the changing insurer landscape, the 10 insurers with the largest
market share represented approximately 60% of national market share in both 2013 and 2018.
Lessons Learned
Looking back, some of the ACA’s outcomes that seemed surprising at the time may seem less so now. Many of them
were the result of insurance market dynamics and economic principles that have occurred before. However, it is
hard to overstate how quickly things were changing in the rollout of the law and how challenging that rapid pace
was for the insurers, regulators and others who were charged with implementing and adapting to the post-reform
world. Looking forward, we ask what lessons may be drawn to inform the next 10 years under the ACA—or
whatever new programs or reforms follow after it?
LEARN TO EMBRACE CHANGE—OR AT LEAST MANAGE IT
Access to affordable health care has remained a central policy issue for much of the past decade, and that seems
likely to continue for the foreseeable future. Whatever happens in the 2020 elections, it is likely that more changes
to U.S. health care financing are coming. The most successful states and insurers under the ACA have learned to
adapt to rapid changes and use forward looking strategies versus simply assuming recent historical trends will
continue.
INSURANCE MARKETS REMAIN FUNDAMENTALLY LOCAL
Despite the steps toward standardization under the ACA, each state and locality is different in terms of laws and
regulations, competitive landscape, health care provider systems and practice patterns, and the underlying
backdrop of economic conditions and culture which intersect with the social determinants of health.
INSURERS AND REGULATORS WERE ABLE TO ADAPT—EVENTUALLY
While the subsidized ACA markets have proven to be relatively resilient to significant disruptors, such as the
introduction of transitional policies, nonpayment of risk corridors, and removal of the individual mandate, they have
also proven vulnerable to both overpricing and underpricing in times of change. Regulators and insurers will need to
continue to work together to protect markets from both of these problems going forward.
ACTIONS INTENDED TO STABILIZE MARKETS CAN DESTABILIZE THEM (AND VICE VERSA)
Many attempts to stabilize markets, including the ACA’s risk adjustment and risk corridor programs, came at a
substantial cost—a cost of complexity, potential for unforeseen consequences or unexpected program changes,
and, ultimately, delays in the determination of final financial outcomes. This cost is not insignificant and in the
extreme can result in markets that are inherently unpredictable for insurers and regulators alike.61
These lessons are important learnings for all stakeholders in the ACA markets, not just actuaries. Policymakers,
stakeholders and, ultimately, the public need an appropriate understanding of market risks and market dynamics to
balance the competing priorities that are inevitably in tension, such as providing consumers with many choices and
strong protections while avoiding potential selection effects that could make coverage unaffordable or markets
unstable. Actuaries can help provide advice grounded in data and can help anticipate potential unintended
61 Kurt Wrobel has written about this issue several times. Wrobel, Kurt. 2014. The ACA Cost Predictability Question. The Actuary Magazine, 11, no. 5: 14–19, https://www.soa.org/globalassets/assets/library/newsletters/the-actuary-magazine/2014/october/act-2014-vol11-iss5-wrobel.pdf (accessed February 25, 2020). Wrobel, Kurt. A Review of Emerging Data. The Actuary Magazine, https://theactuarymagazine.org/review-emerging-data/ (accessed February 25, 2020).
32
Copyright © 2020 Society of Actuaries
consequences. No matter what comes in the next decade, it is certain that there will be new chapters in each of the
50 stories left to be written.
Other Considerations The Society of Actuaries (SOA) retained Milliman, Inc. to conduct fact-based, data-driven research on measurable
outcomes in the individual and Medicaid markets 10 years following the inception of the Patient Protection and
Affordable Care Act.
We relied on publicly available data and other information for this analysis. We have performed a limited review of
the data and other information and checked for reasonableness and consistency, and we have not found material
defects in the data or information used. If there are material defects in the data or other information, it is possible
that they would be uncovered by a detailed, systematic review and comparison of the data to search for data values
that are questionable or for relationships that are materially inconsistent. Such a review was beyond the scope of
this assignment.
Differences between estimates in this analysis and actual amounts depend on the extent to which estimated
outcomes conform to the assumptions made for this analysis. It is certain that actual amounts will not conform
exactly to the assumptions used in this analysis. Actual amounts will differ from estimated outcomes to the extent
the assumptions in this analysis are not realized. This analysis of historical data and outcomes may differ materially
from future outcomes.
Guidelines issued by the American Academy of Actuaries require actuaries to include their professional
qualifications in actuarial communications. Paul Houchens, Lindsy Kotecki and Hans Leida are members of the
American Academy of Actuaries and meet its qualification standards to perform the analysis and render any
actuarial opinions contained herein.
33
Copyright © 2020 Society of Actuaries
Acknowledgments
The authors would like to acknowledge and sincerely thank the professionals on the SOA’s Project Oversight Group
who contributed valuable ideas, thoughtful guidance and diligent review throughout the development of this
research. We would also like to thank the SOA’s research coordinators for their efforts in organizing and supporting
the project.
We would also like to recognize and thank Stan Westrom, ASA, MAAA, and Ian McCulla FSA, MAAA, for their
valuable contributions to the analysis and figures throughout the report.
Project Oversight Group Members
Ken Avner, FSA, MAAA
Joan Barrett, FSA, MAAA
Elaine Corrough, FSA, MAAA
Ian Duncan, FSA, MAAA, CERA
Geof Hileman, FSA, MAAA
Olga Jacobs, FSA, MAAA
Enver Karadayi, ASA, MAAA
Rebecca Owen, FSA, MAAA
Margie Rosenberg, PhD, FSA
Kurt Wrobel, FSA, MAAA (POG Chair)
SOA Project Coordinators
Achilles Natsis, FSA, MAAA, FLMI
Erika Schulty

34
Copyright © 2020 Society of Actuaries
Appendix A: Data and Methods
DATA SOURCES
The data in this report was generally compiled publicly available sources. Table A-1 includes a list of the information
and data sources used in this analysis. Table A-2 shows which data sources from Table A-1 were used in the
development of each figure and table in this report.
Table A-1
DATA SOURCES
Source Data Link62
A CMS ACA Enrollment Public Use Files (PUF) https://www.cms.gov/Research-Statistics-Data-and -Systems/Statistics-Trends-and-Reports/Marketplace-Products (retrieved September 26, 2019)
B CMS Medical Loss Ratio PUF https://www.cms.gov/CCIIO/Resources/Data-Resources/mlr (retrieved December 16, 2019)
C CMS Effectuated Enrollment Summaries https://www.cms.gov/newsroom/fact-sheets/early-2019-effectuated -enrollment-snapshot (retrieved August 13, 2019)
D CMS Risk Adjustment Reports https://www.cms.gov/CCIIO/Programs-and-Initiatives/Premium -Stabilization-Programs (retrieved January 8, 2020)
E Office of the Assistant Secretary for Planning and Evaluation (ASPE) marketplace summary enrollment reports and data for 2014 and 2015
https://aspe.hhs.gov/report/health-insurance-marketplace-2015 -open-enrollment-period-january-enrollment-report (retrieved September 4, 2019) https://aspe.hhs.gov/profiles-affordable-care-act-coverage -expansion-enrollment-medicaid-chip-and-health-insurance -marketplace-10-1-2013-3-31-2014 (retrieved October 8, 2019)
F HIX Compare database sponsored by the Robert Woods Johnson Foundation, providing plan design and premium rate data for 2014 (states on the federal exchange platform only) and 2015–2020 (all states)
https://hixcompare.org (retrieved November 5, 2019)
G Healthcare.gov premium database for states participating on federal marketplace
https://www.healthcare.gov/health-and-dental-plan-datasets-for -researchers-and-issuers (retrieved August 12, 2019, and January 27, 2020)
H Milliman internal database of plan design and premium rates for 2014 state-based exchanges
N/A
I Medicaid enrollment, budget and expenditure data provided on Medicaid.gov
https://www.medicaid.gov/index.html (retrieved October 10, 2019)
J Medical Expenditure Panel Survey through the Agency for Healthcare Research and Quality
https://www.ahrq.gov/data/meps.html (retrieved November 1, 2019)
K US Census Bureau’s American Community Survey data
https://www.census.gov/programs-surveys/acs (retrieved November 14, 2019)
L National Association of Insurance Commissioners (NAIC) annual financial statements
https://www.naic.org/insdata_home.htm (retrieved November 1, 2019)
62 Retrieval dates listed. Links may become outdated.
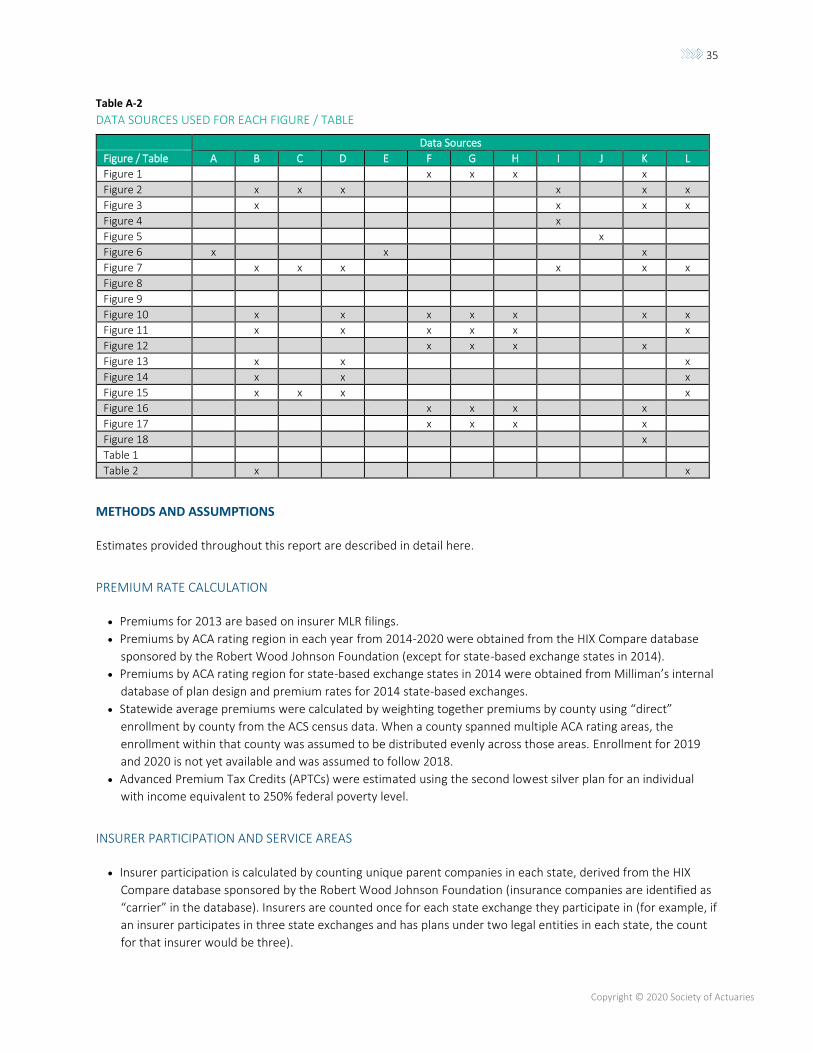
35
Copyright © 2020 Society of Actuaries
Table A-2
DATA SOURCES USED FOR EACH FIGURE / TABLE
Data Sources
Figure / Table A B C D E F G H I J K L
Figure 1 x x x x
Figure 2 x x x x x x
Figure 3 x x x x
Figure 4 x
Figure 5 x
Figure 6 x x x
Figure 7 x x x x x x
Figure 8
Figure 9
Figure 10 x x x x x x x
Figure 11 x x x x x x
Figure 12 x x x x
Figure 13 x x x
Figure 14 x x x
Figure 15 x x x x
Figure 16 x x x x
Figure 17 x x x x
Figure 18 x
Table 1
Table 2 x x
METHODS AND ASSUMPTIONS
Estimates provided throughout this report are described in detail here.
PREMIUM RATE CALCULATION
• Premiums for 2013 are based on insurer MLR filings.
• Premiums by ACA rating region in each year from 2014-2020 were obtained from the HIX Compare database
sponsored by the Robert Wood Johnson Foundation (except for state-based exchange states in 2014).
• Premiums by ACA rating region for state-based exchange states in 2014 were obtained from Milliman’s internal
database of plan design and premium rates for 2014 state-based exchanges.
• Statewide average premiums were calculated by weighting together premiums by county using “direct”
enrollment by county from the ACS census data. When a county spanned multiple ACA rating areas, the
enrollment within that county was assumed to be distributed evenly across those areas. Enrollment for 2019
and 2020 is not yet available and was assumed to follow 2018.
• Advanced Premium Tax Credits (APTCs) were estimated using the second lowest silver plan for an individual
with income equivalent to 250% federal poverty level.
INSURER PARTICIPATION AND SERVICE AREAS
• Insurer participation is calculated by counting unique parent companies in each state, derived from the HIX
Compare database sponsored by the Robert Wood Johnson Foundation (insurance companies are identified as
“carrier” in the database). Insurers are counted once for each state exchange they participate in (for example, if
an insurer participates in three state exchanges and has plans under two legal entities in each state, the count
for that insurer would be three).
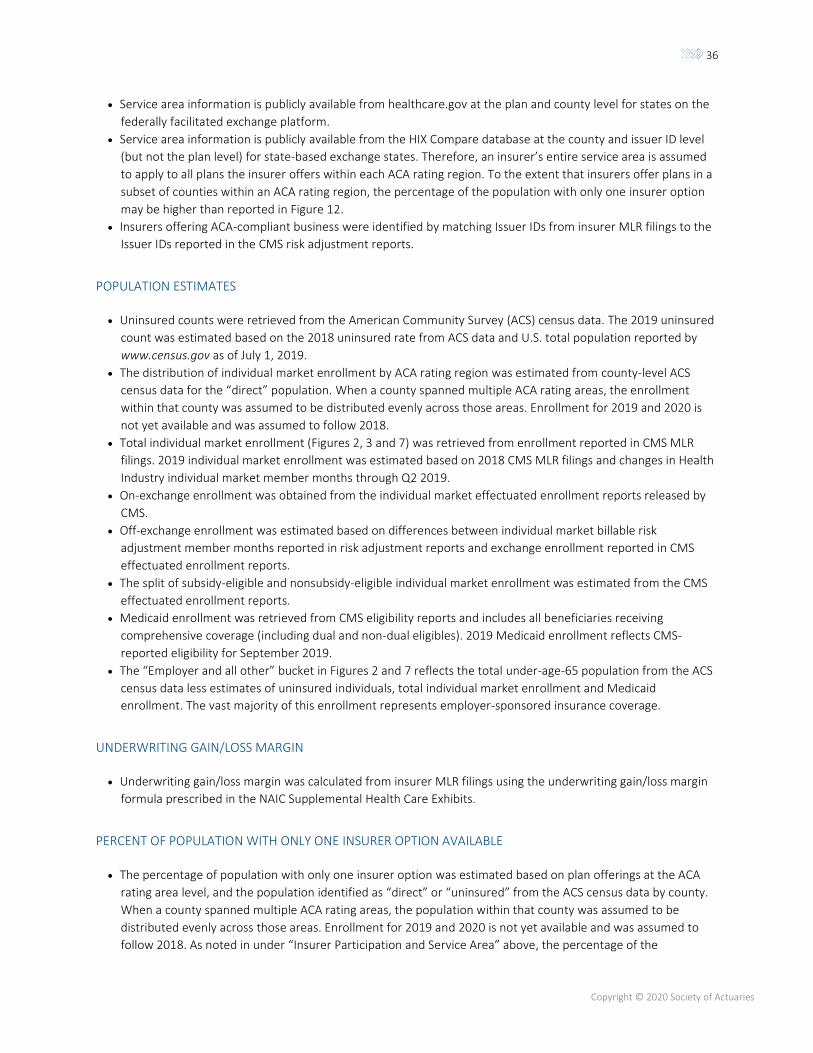
36
Copyright © 2020 Society of Actuaries
• Service area information is publicly available from healthcare.gov at the plan and county level for states on the
federally facilitated exchange platform.
• Service area information is publicly available from the HIX Compare database at the county and issuer ID level
(but not the plan level) for state-based exchange states. Therefore, an insurer’s entire service area is assumed
to apply to all plans the insurer offers within each ACA rating region. To the extent that insurers offer plans in a
subset of counties within an ACA rating region, the percentage of the population with only one insurer option
may be higher than reported in Figure 12.
• Insurers offering ACA-compliant business were identified by matching Issuer IDs from insurer MLR filings to the
Issuer IDs reported in the CMS risk adjustment reports.
POPULATION ESTIMATES
• Uninsured counts were retrieved from the American Community Survey (ACS) census data. The 2019 uninsured
count was estimated based on the 2018 uninsured rate from ACS data and U.S. total population reported by
www.census.gov as of July 1, 2019.
• The distribution of individual market enrollment by ACA rating region was estimated from county-level ACS
census data for the “direct” population. When a county spanned multiple ACA rating areas, the enrollment
within that county was assumed to be distributed evenly across those areas. Enrollment for 2019 and 2020 is
not yet available and was assumed to follow 2018.
• Total individual market enrollment (Figures 2, 3 and 7) was retrieved from enrollment reported in CMS MLR
filings. 2019 individual market enrollment was estimated based on 2018 CMS MLR filings and changes in Health
Industry individual market member months through Q2 2019.
• On-exchange enrollment was obtained from the individual market effectuated enrollment reports released by
CMS.
• Off-exchange enrollment was estimated based on differences between individual market billable risk
adjustment member months reported in risk adjustment reports and exchange enrollment reported in CMS
effectuated enrollment reports.
• The split of subsidy-eligible and nonsubsidy-eligible individual market enrollment was estimated from the CMS
effectuated enrollment reports.
• Medicaid enrollment was retrieved from CMS eligibility reports and includes all beneficiaries receiving
comprehensive coverage (including dual and non-dual eligibles). 2019 Medicaid enrollment reflects CMS-
reported eligibility for September 2019.
• The “Employer and all other” bucket in Figures 2 and 7 reflects the total under-age-65 population from the ACS
census data less estimates of uninsured individuals, total individual market enrollment and Medicaid
enrollment. The vast majority of this enrollment represents employer-sponsored insurance coverage.
UNDERWRITING GAIN/LOSS MARGIN
• Underwriting gain/loss margin was calculated from insurer MLR filings using the underwriting gain/loss margin
formula prescribed in the NAIC Supplemental Health Care Exhibits.
PERCENT OF POPULATION WITH ONLY ONE INSURER OPTION AVAILABLE
• The percentage of population with only one insurer option was estimated based on plan offerings at the ACA
rating area level, and the population identified as “direct” or “uninsured” from the ACS census data by county.
When a county spanned multiple ACA rating areas, the population within that county was assumed to be
distributed evenly across those areas. Enrollment for 2019 and 2020 is not yet available and was assumed to
follow 2018. As noted in under “Insurer Participation and Service Area” above, the percentage of the

37
Copyright © 2020 Society of Actuaries
population with only one insurer option may be higher in state-based exchange states to the extent that
insurers offer plans in a subset of counties within an ACA rating area.
RELATIVE MORBIDITY
• Relative morbidity was calculated using the plan liability risk scores from the CMS risk adjustment reports,
adjusted for estimated changes in the U.S. Department of Health and Human Services-Hierarchical Condition
Categories (HHS-HCC) risk adjustment model, and the average age rating factor and actuarial value reported in
the risk adjustment reports. Note that Massachusetts will not be included in the calculation of relative
morbidity for 2014-2016 (the years when the state operated its own risk adjustment program), and that data
from the CMS risk adjustment reports for Massachusetts (2017-2018) and Vermont (2014-2018) will reflect
merged individual and small group markets.
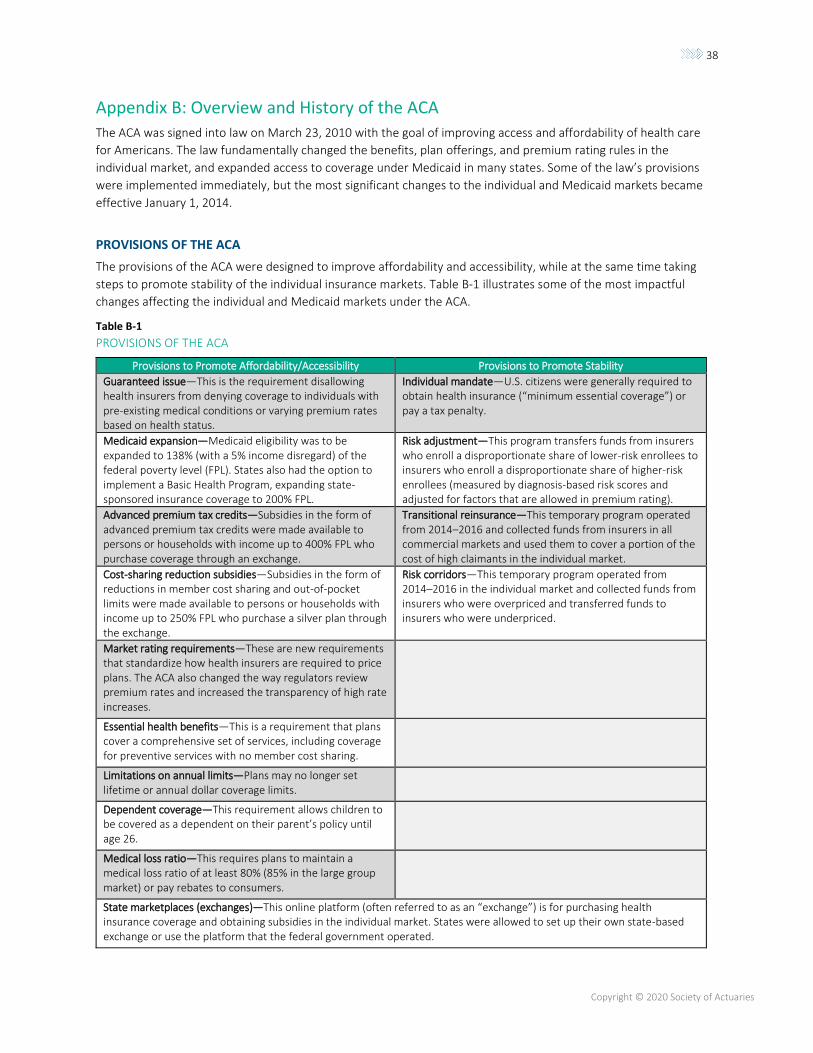
38
Copyright © 2020 Society of Actuaries
Appendix B: Overview and History of the ACA
The ACA was signed into law on March 23, 2010 with the goal of improving access and affordability of health care
for Americans. The law fundamentally changed the benefits, plan offerings, and premium rating rules in the
individual market, and expanded access to coverage under Medicaid in many states. Some of the law’s provisions
were implemented immediately, but the most significant changes to the individual and Medicaid markets became
effective January 1, 2014.
PROVISIONS OF THE ACA
The provisions of the ACA were designed to improve affordability and accessibility, while at the same time taking
steps to promote stability of the individual insurance markets. Table B-1 illustrates some of the most impactful
changes affecting the individual and Medicaid markets under the ACA.
Table B-1
PROVISIONS OF THE ACA
Provisions to Promote Affordability/Accessibility Provisions to Promote Stability
Guaranteed issue—This is the requirement disallowing health insurers from denying coverage to individuals with pre-existing medical conditions or varying premium rates based on health status.
Individual mandate—U.S. citizens were generally required to obtain health insurance (“minimum essential coverage”) or pay a tax penalty.
Medicaid expansion—Medicaid eligibility was to be expanded to 138% (with a 5% income disregard) of the federal poverty level (FPL). States also had the option to implement a Basic Health Program, expanding state-sponsored insurance coverage to 200% FPL.
Risk adjustment—This program transfers funds from insurers who enroll a disproportionate share of lower-risk enrollees to insurers who enroll a disproportionate share of higher-risk enrollees (measured by diagnosis-based risk scores and adjusted for factors that are allowed in premium rating).
Advanced premium tax credits—Subsidies in the form of advanced premium tax credits were made available to persons or households with income up to 400% FPL who purchase coverage through an exchange.
Transitional reinsurance—This temporary program operated from 2014–2016 and collected funds from insurers in all commercial markets and used them to cover a portion of the cost of high claimants in the individual market.
Cost-sharing reduction subsidies—Subsidies in the form of reductions in member cost sharing and out-of-pocket limits were made available to persons or households with income up to 250% FPL who purchase a silver plan through the exchange.
Risk corridors—This temporary program operated from 2014–2016 in the individual market and collected funds from insurers who were overpriced and transferred funds to insurers who were underpriced.
Market rating requirements—These are new requirements that standardize how health insurers are required to price plans. The ACA also changed the way regulators review premium rates and increased the transparency of high rate increases.
Essential health benefits—This is a requirement that plans cover a comprehensive set of services, including coverage for preventive services with no member cost sharing.
Limitations on annual limits—Plans may no longer set lifetime or annual dollar coverage limits.
Dependent coverage—This requirement allows children to be covered as a dependent on their parent’s policy until age 26.
Medical loss ratio—This requires plans to maintain a medical loss ratio of at least 80% (85% in the large group market) or pay rebates to consumers.
State marketplaces (exchanges)—This online platform (often referred to as an “exchange”) is for purchasing health insurance coverage and obtaining subsidies in the individual market. States were allowed to set up their own state-based exchange or use the platform that the federal government operated.
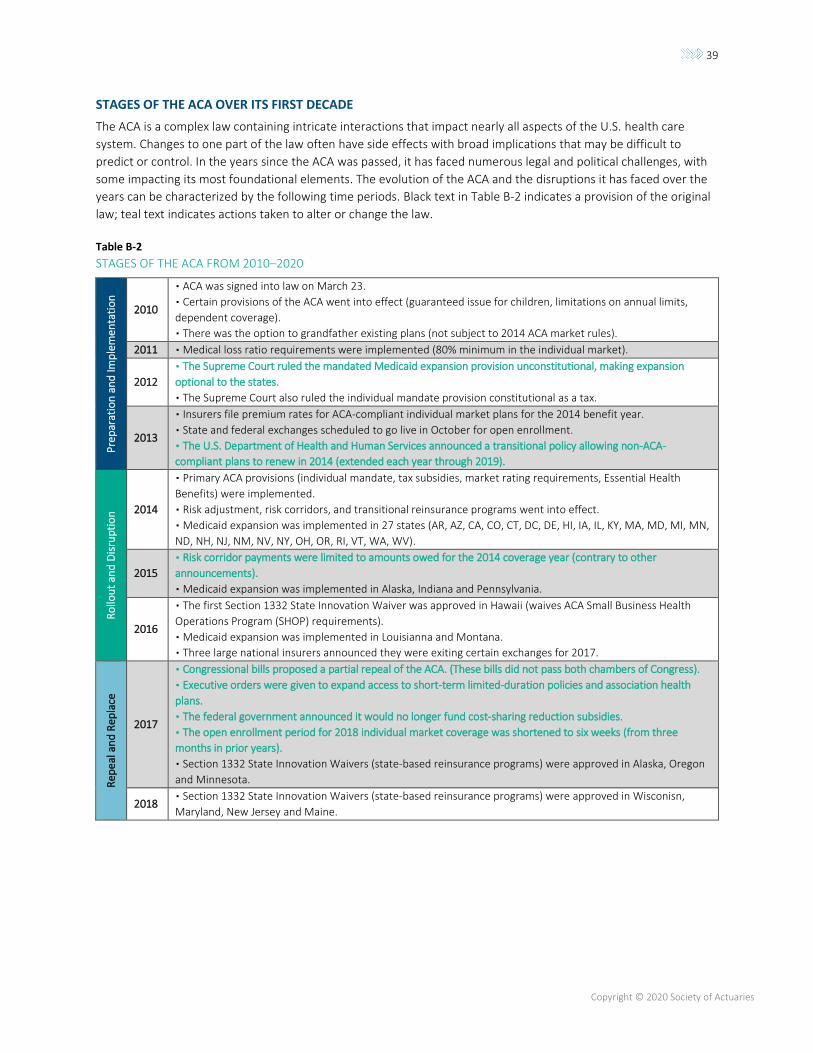
39
Copyright © 2020 Society of Actuaries
STAGES OF THE ACA OVER ITS FIRST DECADE
The ACA is a complex law containing intricate interactions that impact nearly all aspects of the U.S. health care
system. Changes to one part of the law often have side effects with broad implications that may be difficult to
predict or control. In the years since the ACA was passed, it has faced numerous legal and political challenges, with
some impacting its most foundational elements. The evolution of the ACA and the disruptions it has faced over the
years can be characterized by the following time periods. Black text in Table B-2 indicates a provision of the original
law; teal text indicates actions taken to alter or change the law.
Table B-2
STAGES OF THE ACA FROM 2010–2020
Pre
par
atio
n a
nd
Imp
lem
enta
tio
n
2010
▪ ACA was signed into law on March 23.
▪ Certain provisions of the ACA went into effect (guaranteed issue for children, limitations on annual limits,
dependent coverage).
▪ There was the option to grandfather existing plans (not subject to 2014 ACA market rules).
2011 ▪ Medical loss ratio requirements were implemented (80% minimum in the individual market).
2012
▪ The Supreme Court ruled the mandated Medicaid expansion provision unconstitutional, making expansion
optional to the states.
▪ The Supreme Court also ruled the individual mandate provision constitutional as a tax.
2013
▪ Insurers file premium rates for ACA-compliant individual market plans for the 2014 benefit year.
▪ State and federal exchanges scheduled to go live in October for open enrollment.
▪ The U.S. Department of Health and Human Services announced a transitional policy allowing non-ACA-
compliant plans to renew in 2014 (extended each year through 2019).
Ro
llou
t an
d D
isru
pti
on
2014
▪ Primary ACA provisions (individual mandate, tax subsidies, market rating requirements, Essential Health
Benefits) were implemented.
▪ Risk adjustment, risk corridors, and transitional reinsurance programs went into effect.
▪ Medicaid expansion was implemented in 27 states (AR, AZ, CA, CO, CT, DC, DE, HI, IA, IL, KY, MA, MD, MI, MN,
ND, NH, NJ, NM, NV, NY, OH, OR, RI, VT, WA, WV).
2015
▪ Risk corridor payments were limited to amounts owed for the 2014 coverage year (contrary to other
announcements).
▪ Medicaid expansion was implemented in Alaska, Indiana and Pennsylvania.
2016
▪ The first Section 1332 State Innovation Waiver was approved in Hawaii (waives ACA Small Business Health
Operations Program (SHOP) requirements).
▪ Medicaid expansion was implemented in Louisianna and Montana.
▪ Three large national insurers announced they were exiting certain exchanges for 2017.
Rep
eal
an
d R
epla
ce
2017
▪ Congressional bills proposed a partial repeal of the ACA. (These bills did not pass both chambers of Congress).
▪ Executive orders were given to expand access to short-term limited-duration policies and association health
plans.
▪ The federal government announced it would no longer fund cost-sharing reduction subsidies.
▪ The open enrollment period for 2018 individual market coverage was shortened to six weeks (from three
months in prior years).
▪ Section 1332 State Innovation Waivers (state-based reinsurance programs) were approved in Alaska, Oregon
and Minnesota.
2018 ▪ Section 1332 State Innovation Waivers (state-based reinsurance programs) were approved in Wisconisn,
Maryland, New Jersey and Maine.
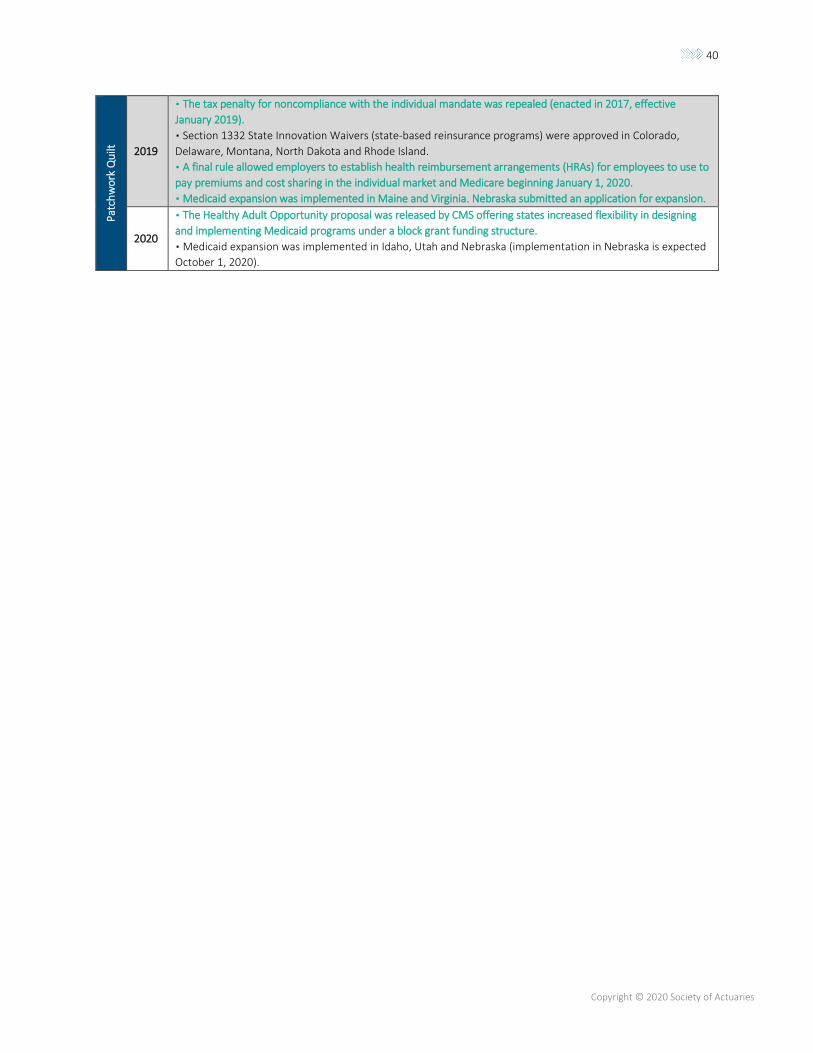
40
Copyright © 2020 Society of Actuaries
Pat
chw
ork
Qu
ilt
2019
▪ The tax penalty for noncompliance with the individual mandate was repealed (enacted in 2017, effective
January 2019).
▪ Section 1332 State Innovation Waivers (state-based reinsurance programs) were approved in Colorado,
Delaware, Montana, North Dakota and Rhode Island.
▪ A final rule allowed employers to establish health reimbursement arrangements (HRAs) for employees to use to
pay premiums and cost sharing in the individual market and Medicare beginning January 1, 2020.
▪ Medicaid expansion was implemented in Maine and Virginia. Nebraska submitted an application for expansion.
2020
▪ The Healthy Adult Opportunity proposal was released by CMS offering states increased flexibility in designing
and implementing Medicaid programs under a block grant funding structure.
▪ Medicaid expansion was implemented in Idaho, Utah and Nebraska (implementation in Nebraska is expected
October 1, 2020).
41
Copyright © 2020 Society of Actuaries
About the Society of Actuaries
The Society of Actuaries (SOA), formed in 1949, is one of the largest actuarial professional organizations in the world
dedicated to serving more than 31,000 actuarial members and the public in the United States, Canada and
worldwide. In line with the SOA Vision Statement, actuaries act as business leaders who develop and use
mathematical models to measure and manage risk in support of financial security for individuals, organizations and
the public.
The SOA supports actuaries and advances knowledge through research and education. As part of its work, the SOA
seeks to inform public policy development and public understanding through research. The SOA aspires to be a
trusted source of objective, data-driven research and analysis with an actuarial perspective for its members,
industry, policymakers and the public. This distinct perspective comes from the SOA as an association of actuaries,
who have a rigorous formal education and direct experience as practitioners as they perform applied research. The
SOA also welcomes the opportunity to partner with other organizations in our work where appropriate.
The SOA has a history of working with public policymakers and regulators in developing historical experience studies
and projection techniques as well as individual reports on health care, retirement and other topics. The SOA’s
research is intended to aid the work of policymakers and regulators and follow certain core principles:
Objectivity: The SOA’s research informs and provides analysis that can be relied upon by other individuals or
organizations involved in public policy discussions. The SOA does not take advocacy positions or lobby specific policy
proposals.
Quality: The SOA aspires to the highest ethical and quality standards in all of its research and analysis. Our research
process is overseen by experienced actuaries and nonactuaries from a range of industry sectors and organizations. A
rigorous peer-review process ensures the quality and integrity of our work.
Relevance: The SOA provides timely research on public policy issues. Our research advances actuarial knowledge
while providing critical insights on key policy issues, and thereby provides value to stakeholders and decision
makers.
Quantification: The SOA leverages the diverse skill sets of actuaries to provide research and findings that are driven
by the best available data and methods. Actuaries use detailed modeling to analyze financial risk and provide
distinct insight and quantification. Further, actuarial standards require transparency and the disclosure of the
assumptions and analytic approach underlying the work.
Society of Actuaries 475 N. Martingale Road, Suite 600
Schaumburg, Illinois 60173 www.SOA.org