Embed Size (px)
Citation preview

Fifty Years After Brown v. Board of Education:A Two-Tiered Education System
Prepared for the National Commission on Teaching and America’s Future By Thomas G. Carroll, PresidentKathleen Fulton, Karen Abercrombie, and Irene Yoon

Fifty Years After Brown v. Board of Education:A Two-Tiered Education System
Prepared for the National Commission on Teaching and America’s Future
By Thomas G. Carroll, President
Kathleen Fulton, Karen Abercrombie, and Irene Yoon
National Commission on Teaching and America’s Future
Washington, DC • May 13, 2004
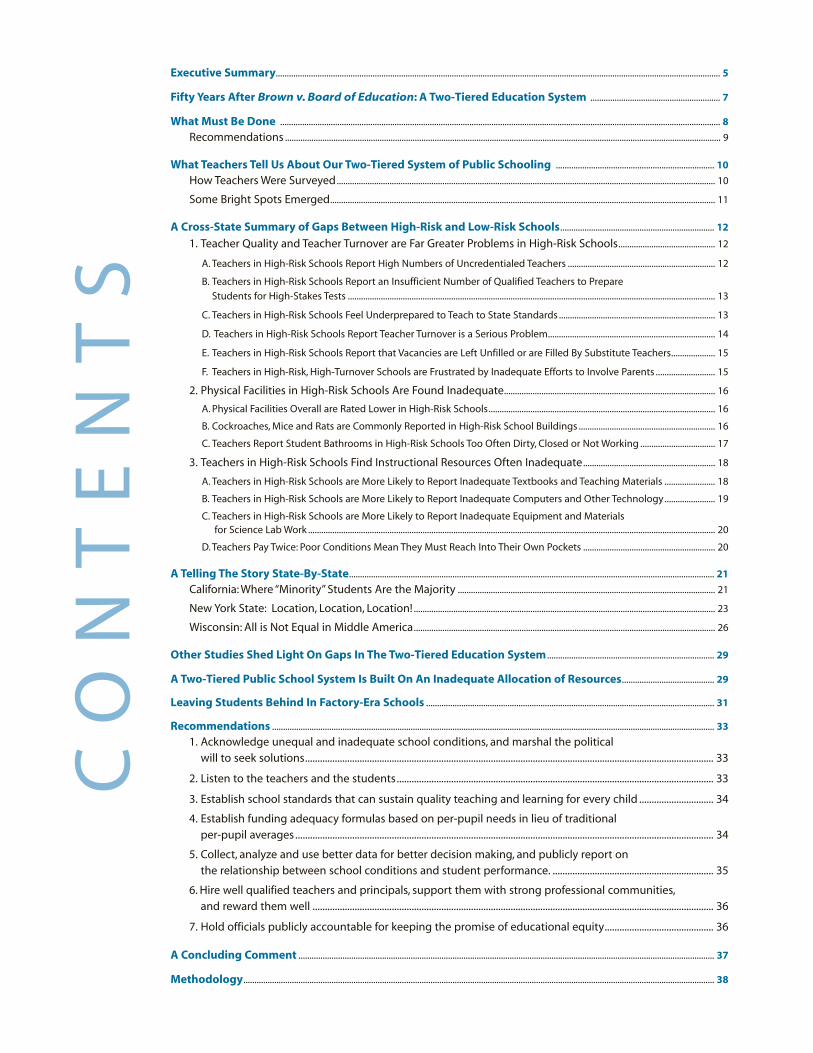
Executive Summary.......................................................................................................................................................................................................... 5
Fifty Years After Brown v. Board of Education: A Two-Tiered Education System ........................................................... 7
What Must Be Done ........................................................................................................................................................................................................ 8
Recommendations ...................................................................................................................................................................................................... 9
What Teachers Tell Us About Our Two-Tiered System of Public Schooling ........................................................................ 10
How Teachers Were Surveyed............................................................................................................................................................................ 10
Some Bright Spots Emerged............................................................................................................................................................................... 11
A Cross-State Summary of Gaps Between High-Risk and Low-Risk Schools...................................................................... 12
1. Teacher Quality and Teacher Turnover are Far Greater Problems in High-Risk Schools............................................ 12
A. Teachers in High-Risk Schools Report High Numbers of Uncredentialed Teachers ................................................................... 12
B. Teachers in High-Risk Schools Report an Insufficient Number of Qualified Teachers to Prepare
Students for High-Stakes Tests ....................................................................................................................................................................... 13
C. Teachers in High-Risk Schools Feel Underprepared to Teach to State Standards ....................................................................... 13
D. Teachers in High-Risk Schools Report Teacher Turnover is a Serious Problem............................................................................ 14
E. Teachers in High-Risk Schools Report that Vacancies are Left Unfilled or are Filled By Substitute Teachers.................... 15
F. Teachers in High-Risk, High-Turnover Schools are Frustrated by Inadequate Efforts to Involve Parents ........................... 15
2. Physical Facilities in High-Risk Schools Are Found Inadequate................................................................................................ 16
A. Physical Facilities Overall are Rated Lower in High-Risk Schools....................................................................................................... 16
B. Cockroaches, Mice and Rats are Commonly Reported in High-Risk School Buildings .............................................................. 16
C. Teachers Report Student Bathrooms in High-Risk Schools Too Often Dirty, Closed or Not Working .................................. 17
3. Teachers in High-Risk Schools Find Instructional Resources Often Inadequate............................................................ 18
A. Teachers in High-Risk Schools are More Likely to Report Inadequate Textbooks and Teaching Materials ....................... 18
B. Teachers in High-Risk Schools are More Likely to Report Inadequate Computers and Other Technology....................... 19
C. Teachers in High-Risk Schools are More Likely to Report Inadequate Equipment and Materialsfor Science Lab Work ......................................................................................................................................................................................... 20
D. Teachers Pay Twice: Poor Conditions Mean They Must Reach Into Their Own Pockets ............................................................ 20
A Telling The Story State-By-State...................................................................................................................................................................... 21
California: Where “Minority” Students Are the Majority ..................................................................................................................... 21
New York State: Location, Location, Location! ......................................................................................................................................... 23
Wisconsin: All is Not Equal in Middle America......................................................................................................................................... 26
Other Studies Shed Light On Gaps In The Two-Tiered Education System ............................................................................ 29
A Two-Tiered Public School System Is Built On An Inadequate Allocation of Resources.......................................... 29
Leaving Students Behind In Factory-Era Schools ................................................................................................................................... 31
Recommendations ......................................................................................................................................................................................................... 33
1. Acknowledge unequal and inadequate school conditions, and marshal the political will to seek solutions..................................................................................................................................................................... 33
2. Listen to the teachers and the students................................................................................................................................ 33
3. Establish school standards that can sustain quality teaching and learning for every child .............................. 34
4. Establish funding adequacy formulas based on per-pupil needs in lieu of traditional per-pupil averages......................................................................................................................................................................... 34
5. Collect, analyze and use better data for better decision making, and publicly report on the relationship between school conditions and student performance. ................................................................. 35
6. Hire well qualified teachers and principals, support them with strong professional communities,and reward them well .................................................................................................................................................................. 36
7. Hold officials publicly accountable for keeping the promise of educational equity............................................ 36
A Concluding Comment ............................................................................................................................................................................................. 37
Methodology...................................................................................................................................................................................................................... 38
CO
NT
EN
TS

5
Aswe mark the fiftieth anniversary of Brown v. Board of Education, millions of low
income students and children of color are concentrated in separate and unequal
schools. Many are being taught by unqualified teachers, with insufficient
instructional materials and a limited supply of textbooks and inadequate technology, in
crumbling buildings - with vermin and broken bathrooms. These substandard teaching and
learning conditions are rarely found in schools where the majority of students come from
more affluent backgrounds and have a low risk of school failure. We have a two-tiered
education system.
It is unacceptable to hold students accountable for meeting high standards that their schools
are not equipped to help them reach. As a nation we say that our goal is to leave no child
behind, but the schools we provide for some children say otherwise. Students from diverse
racial and ethnic backgrounds constitute an emerging majority in this country – the future
health of our economy hinges on the knowledge and skills they will acquire in the schools we
provide for them today. But the deck is too often stacked against low income students and
children of color – conditions in their schools are just not adequate to support quality
teaching and learning.
To understand the extent of this problem, NCTAF staff analyzed the responses of 3,336
teachers randomly surveyed by the Peter Harris Research Group for Lou Harris in California,
Wisconsin, and New York. When compared with their colleagues in more affluent communities,
teachers in schools serving large numbers of low income students and children of color
reported:
y Higher numbers of uncredentialed teachers;
y An insufficient number of teachers who are qualified to prepare students for
high stakes tests;
y Serious teacher turnover problems;
y Unfilled teacher vacancies and large numbers of substitute teachers;
y Low levels of parental involvement;
y Inadequate physical facilities;
y Evidence of vermin (cockroaches, mice, and rats) in school buildings;
y Dirty, closed, or inoperative student bathrooms;
y Inadequate textbooks and materials for students to use in class or to take home;
y Inadequate computers and limited Internet access;
y Inadequate science equipment and materials; and
y Higher personal expenditures to compensate for insufficient classroom materials
and supplies.
[ExecutiveSummary
As a nation we say that
our goal is to leave no
child behind, but the
schools we provide for
some children say
otherwise.

6
As a nation, we have called on our teachers and students to meet demanding standards. Now we
must give them the schools they need to succeed. To close the student achievement gap, we must
close the teaching quality gap, and to do that, we must ensure that every school provides an equal
opportunity for successful teaching and learning. To live up to the promise of Brown v. Board of
Education, we must:
y Acknowledge unequal school conditions and marshal the political will to seek solutions;
y Listen to what teachers and students tell us about conditions in their schools;
y Establish school standards that sustain quality teaching and learning for every child;
y Establish funding adequacy formulas based on per-pupil needs in lieu of per-pupil
averages;
y Use better data to report on the relationship between school conditions and student
performance;
y Hire well qualified teachers and principals, support them and reward them for performance;
and
y Hold officials publicly accountable for keeping the promise of educational equity.
We must give our
teachers and
students the
schools they need
to succeed.

7
TheBrown decision, a half-century ago, was a promise that every child would
have access to the same quality public education. It is a promise we must
keep. Competent, caring, qualified teaching in schools organized for
success should be every child’s birthright. To better understand what must be done to close the
teaching quality gap for low income students and children of color, the staff of the National
Commission on Teaching and America’s Future (NCTAF) analyzed three large-scale surveys of
school conditions reported by teachers in California, Wisconsin, and New York. The Peter Harris
Research Group conducted these random surveys of 3,336 public school teachers for Lou Harris,
one of the nation’s most well-respected pioneers in polling public school teachers.1
The findings paint a chilling picture of inequitable school conditions that can overwhelm even
the best efforts of our teachers and their students. Harris describes “… a two-tiered public
school system: one for the more affluent, who enjoy the privileges of a relatively healthy
educational environment, and the other for the least privileged, who suffer an educational
environment that virtually forecloses their chance of learning.”2
The evidence cited by the teachers, school by school, proves beyond any
shadow of a doubt that children at risk, who come from families with poorer
economic backgrounds, are not being given an opportunity to learn that is
equal to that offered to children from the most privileged families. The
obvious cause of this inequality lies in the finding that the most
disadvantaged children attend schools that do not have basic facilities and
conditions conducive to providing them with a quality education. Without
such facilities and conditions, both the teachers and the students will be
hard-put to achieve any semblance of quality education.3
Conditions in these schools deprive children of their most basic civil right: an equal opportunity
to learn.
Fifty Years After Brown v. Board of Education:A Two-Tiered Education System[
Competent, caring,
qualified teaching in
schools organized for
success should be every
child’s birthright.

8
Well prepared teachers in schools organized for success are the most valuable resources a
community can provide for its young people. Thousands of public school districts across the
country are giving their children excellent teachers and supporting them with top quality teaching
conditions in classrooms that meet high standards. Many of their schools deliver an education that
ranges from good to world-class, and their students are achieving at high levels. But we cannot be
content as long as a significant number of teachers and students are struggling in schools with
unacceptable teaching and learning conditions.
We know that public schools can do the job; high need does not have to mean low quality. A
growing number of studies provide portraits of schools that do an exemplary job of educating
large numbers of high need students. In its study of “High Flying Schools,” the Education Trust
reported that it found good student achievement in many public schools that enroll higher
proportions of poor and minority children than the nation’s public schools as a whole.4 Research
on high performing, high poverty schools reveals that they are consistently staffed by well
qualified teachers and principals who work in a professional environment that supports sound
instructional practices and high standards.5
Why are some schools able to rise to the challenge, while many others do not? The conventional
wisdom has been that we can’t find enough teachers to do the job. But the truth is that we can’t
keep them. The problem is not that we have too few teachers entering high-risk schools; it is that
too many good teachers are leaving. They leave because conditions in their schools do not meet
even the most basic requirements for successful teaching and learning.
We have reached a troubling conclusion. As a nation we are committed to improving teaching
quality by increasing the supply of qualified teachers for hard-to-staff schools, but an over reliance
on teacher supply strategies is protecting the status quo in dysfunctional schools. The heavy
emphasis on keeping these schools supplied with teachers is focusing the energy for improvement
on recruitment strategies instead of on the need to change the conditions that make these
schools so hard to staff in the first place. In too many cases idealistic new teachers are treated
like cannon fodder – thrown into schools with the most challenging assignments, given little
support, and even less chance for success. A few individuals emerge as heroes who are heralded for
their personal ability to succeed in the face of dysfunctional conditions. But when the majority of
new teachers drop out, after being worn down by overwhelming odds, they are cast aside to be
quickly replaced by the next cohort of novices. Better preparation programs and incentives to
attract more teachers to hard-to-staff schools are important, but they are not enough – we must
change the conditions that make these schools such difficult places for teaching and learning.
Faced with substandard conditions, it should be no surprise that teachers and students drop out in
droves. As the teachers leave, they are replaced by inexperienced individuals who are even less
equipped to deal with obstacles that stand in the way of effective teaching. The teachers come and
go, and the students with the greatest needs are left behind to be taught by a passing parade of
under qualified and inexperienced individuals. Teaching quality declines, student achievement
suffers, and the cycle of educational inequality is repeated from one generation to the next. It is
time to break this cycle.
What MustBe Done
Faced with substandard
conditions, it should be
no surprise that
teachers and students
drop out in droves.
[

9
Recommendations
As a nation, we have called on our teachers and students to meet demanding standards. Now is the time to give them the
schools they need to succeed. It is time to let our teachers and students know that we will not let them down as they prepare
to face the complex challenges of a diverse world and a global economy in the 21st Century. We must form a strong chain of
support, steering clear of finger pointing and top-down mandates, to make every school a place that can deliver on the
promise of Brown v. Board of Education. Our findings and recommendations are summarized below (a full discussion of
recommendations appears on pages 33-36).
1 Acknowledge inadequate school conditions and marshal the political will to seek solutions.
This report paints a grim picture of inequities that deny the civil rights of our most vulnerable citizens. The
nation’s leaders will not like what they see – but this picture will not change unless we acknowledge these
conditions and summon the political will to put things right. Until we take this step, nothing else will
matter. We call upon Governors and other leading policymakers at the state and local levels to convene the
business and education leadership in their states to publicize this report and plan ways that states and
school districts can act on its recommendations.
2 Listen to the teachers and the students. Teachers and students are telling us that their schools are
inadequate when they walk away in droves – with dropout rates that can be 50% or higher. They are telling
us that teaching and learning conditions in their schools are impossible. It is time to listen, and to act on
what we know to be true.
3 Establish school standards that can sustain quality teaching and learning for every child.
To ensure that our schools offer a sound education for every child, they should provide the following
resources: highly qualified teachers and principals; appropriate class sizes in sound facilities; sufficient
books, supplies and equipment; modern information technologies and Internet access; a curriculum that
meets high standards; adequate resources for special learning needs; and a safe, orderly, clean and well
maintained environment.
4 Establish funding adequacy formulas based on per-pupil needs in lieu of per-pupil averages.
School financing policies should be based on an analysis of what it will cost to raise the bar and close the
gaps in student achievement – bringing teaching and learning conditions in all schools up to a high
standard.
5 Collect, analyze and use better data for better decision making, and publicly report on the
relationship between school conditions and student performance. Set standards for school
conditions that are aligned with teaching and learning standards, and use data collection systems to
measure and report on the extent to which they are being met.
6 Hire well qualified teachers and principals, support them with strong professional communities,
and reward them well. Create incentives that attract strong principals and teams of promising and
accomplished teachers to high-risk schools, and reward them for turning around low performance.
7 Hold officials publicly accountable for keeping the promise of educational equity.
A basic determinant of our success in realizing the dream of Brown v. Board of Education has become
clear – we must have strong lines and structures of accountability for quality teaching in schools organized
for success. Adequate resources and rewards for performance should be tied to a reciprocal obligation to
remove teachers, principals, and school leaders who are not performing adequately. Our education leaders
and publicly elected officials at every level also should be judged by their commitment to ending two-tiered
public education systems.
10
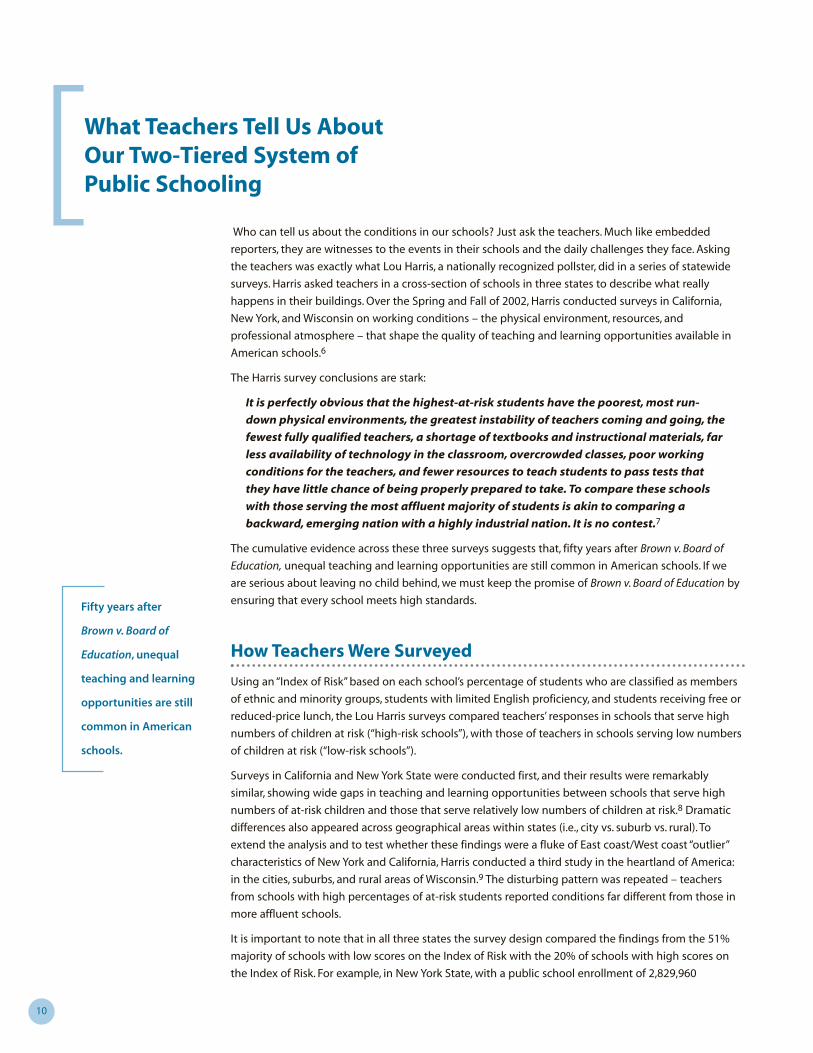
Who can tell us about the conditions in our schools? Just ask the teachers. Much like embedded
reporters, they are witnesses to the events in their schools and the daily challenges they face. Asking
the teachers was exactly what Lou Harris, a nationally recognized pollster, did in a series of statewide
surveys. Harris asked teachers in a cross-section of schools in three states to describe what really
happens in their buildings. Over the Spring and Fall of 2002, Harris conducted surveys in California,
New York, and Wisconsin on working conditions – the physical environment, resources, and
professional atmosphere – that shape the quality of teaching and learning opportunities available in
American schools.6
The Harris survey conclusions are stark:
It is perfectly obvious that the highest-at-risk students have the poorest, most run-
down physical environments, the greatest instability of teachers coming and going, the
fewest fully qualified teachers, a shortage of textbooks and instructional materials, far
less availability of technology in the classroom, overcrowded classes, poor working
conditions for the teachers, and fewer resources to teach students to pass tests that
they have little chance of being properly prepared to take. To compare these schools
with those serving the most affluent majority of students is akin to comparing a
backward, emerging nation with a highly industrial nation. It is no contest.7
The cumulative evidence across these three surveys suggests that, fifty years after Brown v. Board of
Education, unequal teaching and learning opportunities are still common in American schools. If we
are serious about leaving no child behind, we must keep the promise of Brown v. Board of Education by
ensuring that every school meets high standards.
How Teachers Were Surveyed
Using an “Index of Risk” based on each school’s percentage of students who are classified as members
of ethnic and minority groups, students with limited English proficiency, and students receiving free or
reduced-price lunch, the Lou Harris surveys compared teachers’ responses in schools that serve high
numbers of children at risk (“high-risk schools”), with those of teachers in schools serving low numbers
of children at risk (“low-risk schools”).
Surveys in California and New York State were conducted first, and their results were remarkably
similar, showing wide gaps in teaching and learning opportunities between schools that serve high
numbers of at-risk children and those that serve relatively low numbers of children at risk.8 Dramatic
differences also appeared across geographical areas within states (i.e., city vs. suburb vs. rural). To
extend the analysis and to test whether these findings were a fluke of East coast/West coast “outlier”
characteristics of New York and California, Harris conducted a third study in the heartland of America:
in the cities, suburbs, and rural areas of Wisconsin.9 The disturbing pattern was repeated – teachers
from schools with high percentages of at-risk students reported conditions far different from those in
more affluent schools.
It is important to note that in all three states the survey design compared the findings from the 51%
majority of schools with low scores on the Index of Risk with the 20% of schools with high scores on
the Index of Risk. For example, in New York State, with a public school enrollment of 2,829,960
Fifty years after
Brown v. Board of
Education, unequal
teaching and learning
opportunities are still
common in American
schools.
What Teachers Tell Us About Our Two-Tiered System ofPublic Schooling[

11
students, there are 1,400,000 students in the lowest-risk schools and 566,000 in the highest-risk schools. So the
numbers in this report tell us that a large number of students and teachers in America’s public are in schools
where conditions are generally good. This makes it all the more reprehensible that thousands of low income and
minority students are being left behind in high-risk schools where conditions are simply not adequate to support
quality teaching and learning.
The basic questions in the three studies were the same across the three states. Teachers, chosen through random
sampling (with an over-sampling of teachers in low income areas), were asked about the status of their working
conditions, including:
y The number of qualified and fully credentialed teachers in each school;
y The amount of professional development and training available to teachers;
y The ways in which schools involved parents;
y The quality and availability of textbooks, instructional materials, and technology; and
y The adequacy of physical facilities, including cleanliness of school bathrooms and evidence of vermin.
There were also a few questions on some state surveys that were not asked in other state surveys. For example,
questions on testing (their quality, appropriateness, and fairness) and questions on out-of-pocket expenses
teachers spend for supplies and materials were asked in both the New York and Wisconsin surveys but not in the
California survey.
Some Bright Spots Emerged
As we report what NCTAF found in its analysis of the Lou Harris surveys, it is important to remember that, in the
majority of the schools represented in these surveys, teachers say that their working conditions are fairly good.
There are indeed bright spots to report. In the Wisconsin survey, for example, in 16 critical areas, representing
approximately 40% of the survey items, most schools are in relatively good condition, as judged by the teachers
who work in them. For example, in more than 90% of the schools in the Wisconsin survey, discipline is not seen as
a major problem. Teachers there report a high degree of home support from parents, and they give generally
positive ratings to the quality of textbooks and instructional materials they work with, as well as to the availability
of technology.
In New York State, there were fewer items with overall positive ratings statewide, but teachers did give positive
ratings to their job satisfaction (37% rated job satisfaction excellent; 47% rated it good), and most are satisfied
with the textbooks and other instructional materials they work with (76% positive ratings statewide).10 They also
generally gave good marks to ways in which their schools involve parents (73% positive ratings statewide).11 In
California, only slightly fewer teachers felt that they were teaching in overcrowded classrooms in the higher-risk
schools (15%) than the low-risk schools (18%).12
In general then, across the three surveys, we found that large numbers of teachers report positive conditions in
their schools. But it is important to recognize that these bright spots in the surveys are heavily weighted in favor
of the greater numbers of teachers who work in low-risk, more advantaged schools. When we compare their
responses to the responses of teachers working in high-risk schools, a disturbing picture of overwhelmingly
inadequate conditions emerges.

12
Across the three states, and within each state, the pattern was clear: teachers in schools with the
highest numbers of at-risk students report their schools are beset by a host of problems, largely beyond
the teachers’ control. In fact, in many of these schools, conditions would make it nearly impossible for
the teachers to provide their students with a quality education.
While there are variations in what was found across the three states surveyed, the discussion below
summarizes important areas where the gaps are consistent and substantial between high-risk schools
and low-risk schools.
1 Teacher Quality and Teacher Turnover are Far Greater Problems in High-Risk Schools
Each of the three state surveys asked teachers to report on the qualifications of teachers in their
schools, and the impact of teacher turnover in their schools. The results point to a discouraging
teaching quality gap between high- and low-risk schools.
The number of uncertified teachers in a school is a strong indicator of teaching quality and student
achievement in that school. The ability of teachers to teach to state standards and to prepare students
for tests may also be taken as an indicator of teaching quality. Low-performing schools tend to have a
high percentage of teachers who are uncertified or teaching out-of-field. Research has shown
convincingly that variations in teaching quality make an enormous difference in student academic
growth. In studies conducted in Tennessee, Dallas, and Boston, students who are unfortunate enough to
have had an ineffective teacher for the school year test fully one year behind peers taught by an
effective teacher. Those with weak teachers for three or more years in a row may never catch up.13 The
teachers in the Harris survey report that the number of unqualified teachers in many high-risk schools
is so high that the students in these schools are certain to have a series of unqualified teachers year
after year in their classrooms.
A. Teachers in High-Risk Schools Report High Numbers of Uncredentialed Teachers
(20% or more)
In California, only 4% of the teachers in
low-risk schools report that their schools
have high numbers of uncredentialed
teachers. But in high-risk schools, this
figure rises sharply to 48% (Figure 1).
Teachers in high-risk schools in California
are 12 times more likely to report that 20%
or more of the teachers in their schools are
on some form of emergency teaching
permit. The odds are very high that a
student in one of these schools will be
taught by a succession of unqualified
teachers.Figure 1:Teachers Reporting High Numbers of UncredentialedTeachers (CA)
Low-Risk Schools High-Risk Schools0%
10%
20%
30%
40%
50%
4%
48%
Percentage of teachers who report that 20% or more of the teachers in their school are on some form of emergency permit
A Cross-State Summary of Gaps Between High-Risk and Low-Risk Schools[

13
B. Teachers in High-Risk Schools Report an Insufficient Number of
Qualified Teachers to Prepare Students for High-Stakes Tests
Under the glare of NCLB, when student test results are the basis for
Adequate Yearly Progress, the ability of teachers to prepare students for
effective performance on high- stakes tests has tremendous
consequences. When teachers in Wisconsin were asked about barriers to
students’ doing better on tests, 56% of teachers in high-risk schools cited a
lack of qualified teachers as a barrier. In contrast, only 29% of teachers in
low-risk schools cited teacher qualifications as a barrier to student test
performance. In New York, 70% of teachers in the high-risk schools cited
this barrier, almost double the percentage (37%) of teachers in low-risk
schools who said the lack of qualified teachers was a barrier to preparing
students for exams (Figure 2).
C. Teachers in High-Risk Schools Feel Underprepared to Teach to State
Standards
When New York teachers were asked how well prepared they themselves
felt to teach all students to the state standards, only 66% in high-risk
schools felt very well prepared, as compared with 86% of teachers in low-
risk schools – a 20% gap (Figure 3).
Figure 2:Lack of Qualified Teachers toPrepare Students for Tests (NY& WI)
Wisconsin New York0%
10%
20%
30%
40%
50%
60%
70%
29%
56%
37%
70%
Low-Risk Schools High-Risk Schools
Percentage of teachers who report that a lack of qualified teachers to prepare students for tests is a barrier to students doing better on tests
Figure 3:Teachers Feeling Prepared toTeach All Students to the StateStandards (NY)
Low-Risk Schools High-Risk Schools0%
10%
20%
30%
40%
50%
60%
70%
80%
90%
86%
66%
Percentage of teachers who report that they feel “very well prepared” to teach all students to the state standards
The Bottom Line: High-risk
schools have large numbers of
uncredentialed teachers and
teachers who are unprepared
to teach to state standards.
This puts their students at a
disadvantage when it comes
to taking tests that determine
their futures, and the future of
their schools.

14
D. Teachers in High-Risk Schools Report Teacher Turnover is a Serious Problem
Schools with high teacher turnover do not have the capacity to sustain the rigor, relevance and
relationships that are fundamental to high-performing schools. We know from organizational
change studies that workforce continuity and coherence – pulling together around a common
vision for improvement – are essential if schools are to sustain reform efforts. Schools in which
teachers are constantly coming and going cannot establish this coherence of effort to meet long-
term goals. Nor can they develop the sense of community in which students, teachers, and parents
know each other well and work together to support each child. High teacher turnover also
contributes to a self-perpetuating negative cycle that short-changes students when school leaders
rely on substitute teachers, uncredentialed teachers, or novice teachers on a continuing basis to fill
constantly recurring vacancies. On average, the national annual teacher turnover rate is 15.7%, but
teacher turnover rates are much higher in urban and high-risk schools – where they can reach as
high as 50% in some cases.14
In each of the states surveyed by Harris, teachers said that teacher turnover was a more serious
problem if they were teaching in schools with greater numbers of high-risk students (Figure 4). In
California, teachers in the high-risk schools were four times more likely than their colleagues in
low-risk schools (43% vs. 11%) to report that the rate of teacher turnover is a serious problem. In
New York, 63% of teachers in high-risk schools reported an “unacceptable” rate of teacher turnover,
compared to only 17% of teachers in low-risk schools. The gap was not quite so great in Wisconsin,
but, at 41% vs. 25%, it reflects a considerable difference between high- and low-risk schools.
A similar gap appears when we compare the responses of teachers surveyed across geographic
areas in New York State and Wisconsin. In New
York City, 51% of teachers surveyed said teacher
turnover was unacceptable; by contrast, only
16% of teachers in the New York City suburbs
voiced these concerns (Figure 5). Between these
extremes were teachers in major cities outside
the New York City area and those teaching in
other upstate schools. Similarly, 45% of teachers
in Milwaukee rated teacher turnover a serious
problem in their schools; far fewer teachers said
this was a problem in the Milwaukee suburbs
(23%), in other midsized cities (30%), or in rural
areas of Wisconsin (21%) (Figure 5).
Figure 4:Teacher Turnover Considered aSerious Problem (WI, NY, & CA)
California New York Wisconsin0%
10%
20%
30%
40%
50%
60%
70%
11%
43%
17%
63%
25%
41%
Percentage of teachers who report that teacher turnover is a serious problem in their school
Low-Risk Schools High-Risk Schools
Figure 5:Teacher Turnover RatesConsidered Unacceptable (NYCvs. NYC Suburbs and Milwaukeevs. Milwaukee Suburbs)
NYC Suburbs
New York City
Milwaukee Suburbs
Milwaukee
0%
10%
20%
30%
40%
50%
60%
16%
51%
23%
45%
Percentage of teachers who report an “unacceptable” rate of teacher turnover in their school

15
E. Teachers in High-Risk Schools Report that Vacancies are Left Unfilled or are
Filled By Substitute Teachers
The corollary of high teacher turnover is a high rate of unfilled vacancies in the
teaching staff. In New York State, 43% of teachers in high-risk schools said their
schools don’t fill long-term vacancies or must hire substitutes, as compared to 18%
of those in the low-risk schools. In Wisconsin, 46% of teachers in high-risk schools
said this was a problem, compared to 21% of those in low-risk schools (Figure 6).
F. Teachers in High-Risk, High-Turnover Schools are Frustrated by Inadequate
Efforts to Involve Parents
It is no surprise that schools with high levels of teacher turnover have less chance to
build strong, continuing relationships with parents. When parents are confronted
with a passing parade of teachers, they are unable to establish a sustainable
working relationship with the school’s staff. In New York State, 41% of teachers in
high-risk schools reported that school involvement with parents is “only fair or
poor”; but just 17% of the teachers in the low-risk schools said this was a problem
(Figure 7). In California, almost four times as many teachers in high-risk schools
(35%) said their school was failing to reach the parents, as compared to the 9% of
the teachers in low-risk schools who expressed this concern (Figure 7).
The problem of a lack of parental involvement may become a self-perpetuating
cycle. Parents who are frustrated by high teacher turnover may disengage from their
schools, and low parental
involvement, in turn, may become
a negative school condition that
drives more teacher turnover.
Among California teachers who
indicated they wanted to leave
their schools in the next three
years, 29% reported lack of
parental involvement was a
concern, and 45% of teachers
who were generally concerned
about the working conditions in
their schools reported that lack of
parental involvement was a
factor.15
Figure 6:Teacher Vacancies Go Unfilledor Are Filled by SubstituteTeachers (NY & WI)
New York Wisconsin0%
10%
20%
30%
40%
50%
18%
43%
21%
46%
Percentage of teachers who report that teacher vacancies in their school are unfilled or filled by substitute teachers
Low-Risk Schools High-Risk Schools
Figure 7:School Involvement with Parents is Low (CA & NY)
California New York0%
10%
20%
30%
40%
9%
35%
17%
41%
Teachers rating their school’s involvement with parents as “only fair or poor”
Low-Risk Schools High-Risk Schools
The Bottom Line: In high-risk
schools the constant churn of
teacher turnover undermines
teaching quality. This lack of
staff continuity makes it
difficult to establish program
rigor and frustrates efforts to
build strong learning
communities necessary to
sustain quality teaching and
learning opportunities.

16
2 Physical Facilities in High-Risk Schools Are Found Inadequate
The quality of the physical environment can vary dramatically depending on whether the school is serving
predominantly high-risk or low-risk students. Harsh indicators of these inadequate physical facilities
include evidence of vermin and closed, inoperative or dirty bathroom facilities.
A. Physical Facilities Overall are Rated Lower in High-Risk Schools
Teachers in high-risk schools in New York State are nearly twice as likely as their colleagues in low-
risk schools (51% vs. 26%) to say that their school’s overall physical facilities are inadequate. This is
true in California as well, where 47% of teachers in high-risk schools say their school physical
facilities are inadequate, compared to 22% of those in low-risk schools. In Wisconsin, 39% of
teachers in high-risk schools give physical facilities a negative rating, compared to 21% in low-risk
schools (Figure 8).
B. Cockroaches, Mice and Rats are Commonly Reported in High-Risk School Buildings
Grim conditions prevail in high-risk schools. In New York State, 63% of teachers in high-risk
schools report evidence of vermin, compared to 15% of teachers in low-risk schools. Teachers in
high-risk schools in Wisconsin and California are somewhat less likely to report evidence of
vermin in their schools, but the contrast between high-risk and low-risk schools in those states
(35% vs. 8% in Wisconsin, and 38% vs. 24% in California) remains high (Figure 9).
Figure 8:Physical Facilities RatedInadequate (CA, NY & WI)
California New York Wisconsin0%
10%
20%
30%
40%
50%
60%
22%
47%
26%
51%
21%
39%
Percentage of teachers who report their school physical facilities overall are “only fair or poor"
Low-Risk Schools High-Risk Schools
Figure 9:Evidence of Vermin* in SchoolBuildings (CA, NY, & WI)
California New York Wisconsin0%
10%
20%
30%
40%
50%
60%
70%
24%
38%
15%
63%
8%
35%
Low-Risk Schools High-Risk Schools
Percentage of teachers who report seeing evidence of vermin* in their buildings
*”Vermin” includes cockroaches, mice and rats.

17
When New York City schools are compared with those in New York City suburbs and upstate, sharp
differences were found again: 54% of teachers in New York City schools report evidence of
cockroaches, mice and rats, while in the suburbs of New York City, only 17% of teachers cite these
conditions (Figure 10).
C. Teachers Report Student Bathrooms in High-Risk Schools Too Often Dirty, Closed or Not Working
Bleak indicators of the quality of physical facilities are dirty, closed or inoperative student bathrooms,
reported almost four times as often (26% vs. 7%) in high-risk schools in New York State than in low-risk
schools (Figure 11). The situation is similar in California, where teachers in high-risk schools are twice as
likely (25% vs.12%) to report dirty, inoperative bathrooms, compared to teachers in low-risk schools
(Figure 11).
The condition of bathroom facilities appears to be a
particular problem in urban areas: 24% of teachers in
New York City and 24% of teachers in major cities
upstate report this issue, compared to 10% of
teachers in New York City suburbs and 8% of teachers
in upstate schools overall (Figure 12).
Figure 10:Evidence of Vermin* in SchoolBuildings (NYC vs. NYCSuburbs)
NYC Suburbs New York City0%
10%
20%
30%
40%
50%
60%
17%
54%
Percentage of teachers who report seeing evidence of vermin* in their buildings
*”Vermin” includes cockroaches, mice and rats.
Figure 11:Student Bathrooms Dirty,Closed, or Inoperative (CA & NY)
Figure 12:Student Bathrooms Dirty,Closed, or Inoperative (NYS byGeographic Region)
California New York0%
5%
10%
15%
20%
25%
30%
12%
25%
7%
26%
Percentage of teachers who report that student bathrooms are unclean and not open during school hours
Low-Risk Schools High-Risk Schools
NYS Other Towns Upstate
NYC Suburbs
NYS Major Cities
New York City
0%
10%
20%
30%
8%
10%
24% 24%
Percentage of teachers who report student bathrooms are unclean or not open for use throughout school day
The Bottom Line:
High-risk school
buildings can be
dismal places in
which to teach
and learn.
18
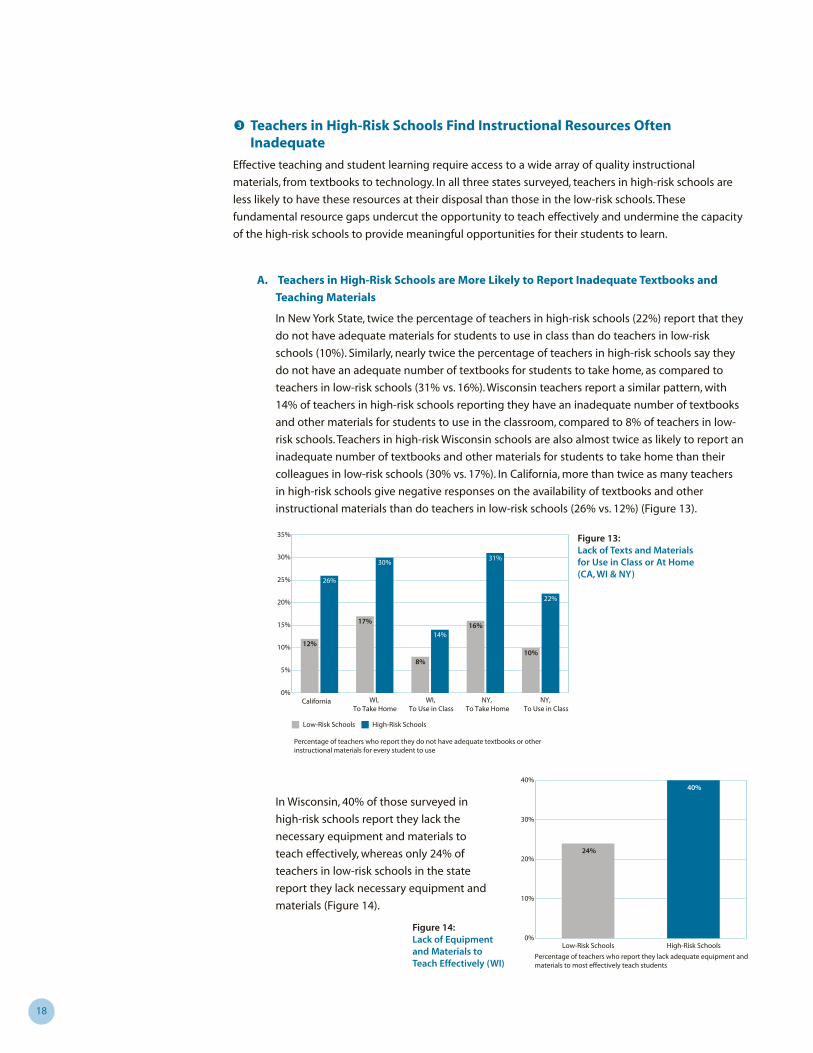
3 Teachers in High-Risk Schools Find Instructional Resources OftenInadequate
Effective teaching and student learning require access to a wide array of quality instructional
materials, from textbooks to technology. In all three states surveyed, teachers in high-risk schools are
less likely to have these resources at their disposal than those in the low-risk schools. These
fundamental resource gaps undercut the opportunity to teach effectively and undermine the capacity
of the high-risk schools to provide meaningful opportunities for their students to learn.
A. Teachers in High-Risk Schools are More Likely to Report Inadequate Textbooks and
Teaching Materials
In New York State, twice the percentage of teachers in high-risk schools (22%) report that they
do not have adequate materials for students to use in class than do teachers in low-risk
schools (10%). Similarly, nearly twice the percentage of teachers in high-risk schools say they
do not have an adequate number of textbooks for students to take home, as compared to
teachers in low-risk schools (31% vs. 16%). Wisconsin teachers report a similar pattern, with
14% of teachers in high-risk schools reporting they have an inadequate number of textbooks
and other materials for students to use in the classroom, compared to 8% of teachers in low-
risk schools. Teachers in high-risk Wisconsin schools are also almost twice as likely to report an
inadequate number of textbooks and other materials for students to take home than their
colleagues in low-risk schools (30% vs. 17%). In California, more than twice as many teachers
in high-risk schools give negative responses on the availability of textbooks and other
instructional materials than do teachers in low-risk schools (26% vs. 12%) (Figure 13).
In Wisconsin, 40% of those surveyed in
high-risk schools report they lack the
necessary equipment and materials to
teach effectively, whereas only 24% of
teachers in low-risk schools in the state
report they lack necessary equipment and
materials (Figure 14).
California WI, To Take Home
WI, To Use in Class
NY, To Take Home
NY, To Use in Class
0%
5%
10%
15%
20%
25%
30%
35%
12%
26%
17%
30%
8%
14%16%
31%
10%
22%
Percentage of teachers who report they do not have adequate textbooks or other instructional materials for every student to use
Low-Risk Schools High-Risk Schools
Low-Risk Schools High-Risk Schools0%
10%
20%
30%
40%
24%
40%
Percentage of teachers who report they lack adequate equipment and materials to most effectively teach students
Figure 14:Lack of Equipmentand Materials toTeach Effectively (WI)
Figure 13:Lack of Texts and Materialsfor Use in Class or At Home(CA, WI & NY)

19
B. Teachers in High-Risk Schools are More Likely to Report Inadequate Computers and Other
Technology
In California, 39% of teachers in high-risk schools report inadequate availability of technology,
compared to 25% of teachers in low-risk schools (Figure 15). The gap in Wisconsin is similar: 35% of
teachers in high-risk schools report inadequate technology availability, compared to 22% of those
in low-risk schools (Figure 15).
In New York State, teachers in high-risk schools
are less likely to report that they have usable
computers in their classrooms that allow students
to access the Internet. In high-risk schools, only
38% of teachers report they have Internet access
for students in their classrooms, far less than the
64% of teachers in low-risk schools. Furthermore,
while just 5% of teachers in low-risk schools
report that students in their school have no
Internet access at all anywhere in their schools,
nearly four times this percentage (19%) of
teachers in high-risk schools report their students
have no Internet access anywhere in their schools
(Figure 16).
The pattern of inequitable access to technology
holds true in New York City and major cities
upstate, when they are compared to
technological and Internet access in New York
City suburbs or in other upstate communities
(Figure 17).
Wisconsin California0%
5%
10%
15%
20%
25%
30%
35%
40%
22%
35%
25%
39%
Teachers who respond negatively to availability of computers and other technology
Low-Risk Schools High-Risk Schools
Internet Access for Students in the Classroom
No Internet Access Available in School
0%
10%
20%
30%
40%
50%
60%
70%
64%
38%
5%
19%
Percentage of teachers reporting on technology
Low-Risk Schools High-Risk Schools
NYS Other Towns NYC Suburbs NYS Major Cities New York City0%
10%
20%
30%
40%
50%
60%
70%
35% 36%
56%
63%
Percentage of teachers who report no access to computers with Internet capability in the classroom
Figure 15:Inadequate Availability ofComputers and OtherTechnology (CA & WI)
Figure 16:Inadequate Accessto Computers andthe Internet (NY)
Figure 17:InadequateClassroom Access toComputers and theInternet (NYS byGeographic Region)

20
C. Teachers in High-Risk Schools are More Likely to Report Inadequate Equipment and
Materials for Science Lab Work
Similar results appeared when science teachers were asked about science resources. In the
New York survey, 68% of science teachers in high-risk schools reported inadequate science
equipment, compared to 27% of science teachers in low-risk schools (Figure 18). In Wisconsin,
the gap was slightly smaller: 51% of science teachers in high-risk schools said they did not
have enough equipment to do science lab work, compared to 33% who reported this problem
in low-risk schools (Figure 18). The geographic breakdown in New York State puts the
spotlight on urban areas. In New York City, 54% of science teachers in high-risk schools said
they had a shortage of science equipment, closely followed by 50% of science teachers in
high-risk schools in major cities upstate. In contrast, 35% of science teachers in other upstate
schools reported this problem, and only 22% of science teachers in New York City suburbs
considered this a problem (Figure 19).
D. Teachers Pay Twice: Poor Conditions Mean They Must Reach Into Their Own Pockets
Perhaps the most poignant fact of all is that the teachers in our
schools are fighting to make up for the differences and gaps in
teaching conditions by taking money from their own pockets. In
order to acquire materials that their schools should furnish but
do not, teachers in high-need schools use more of their own
money than the better paid teachers in more advantaged
schools. Specifically, in the New York and Wisconsin studies,
teachers were asked about the average out-of-pocket amount
they spend on school materials that would normally be provided
by the local or state government. In the high-risk schools in New
York, the annual out-of-pocket expenditure by teachers for
school materials averaged $468, compared to $333 per year in
low-risk schools (Figure 20). In Wisconsin, the disparity was
between $329 spent per year by teachers in high-risk schools,
compared to $292 a year spent by teachers in low-risk schools
(Figure 20).16 This gap (a 40% difference in NY and a 13% gap in Wisconsin) appeared despite
the fact that teachers in high-risk schools rank close to the bottom in salaries, while teachers
in low-risk schools rank near the top in salaries. Thus, teachers in high-risk schools are
spending a greater proportion of their lower salaries to make up for shortages of school
materials.
Figure 18:Inadequate Science
Equipment andMaterials (NY & WI)
New York Wisconsin0%
10%
20%
30%
40%
50%
60%
70%
27%
68%
33%
51%
Percentage of teachers* who report they do not have enough science equipment and materials necessary to do science lab work
* only science teachers surveyed
Low-Risk Schools High-Risk Schools
Figure 19:Inadequate Science
Equipment to doLab Work (NYS by
Geographic Region)
NYC Suburbs
NYS Other Towns Upstate
NYS Major Cities
New York City
0%
10%
20%
30%
40%
50%
60%
22%
35%
50%
54%
Percentage of teachers* who report they do not have enough science equipment and materials necessary to do science lab work
* only science teachers surveyed
Figure 20:Teachers in High-Risk Schools Spend More (NY & WI)
$0
$50
$100
$150
$200
$250
$300
$350
$400
$450
$500
$333
$468
$292
$329
Average amount teachers report spending annually from personal funds for necessary materials and supplies not provided by the school
Low-Risk Schools High-Risk Schools
New York Wisconsin
The Bottom Line: Teachers
have inequitable access to
the kinds of instructional
materials they need to do
their jobs. Teachers in high-
risk schools, clearly caring
about what happens to their
students, typically must
reach deep into their own
wallets to try to make up for
what their classrooms lack.

21
California: Where “Minority” Students Are the Majority
The majority of California’s public school students now come from what used to be called
“minority groups”: 61% of all students attending public schools are children of color, and 25% are
classified as Limited English Proficient (LEP). Will the education of California’s new majority
guarantee that they graduate with the skills they need to compete in and contribute to the
knowledge-based media, technology, and communications industries of today? Will California’s
schools assure that the new majority is ready for productive employment that will sustain a
healthy, expanding economy? Will these citizens be prepared adequately to engage in public
debate and participate in our democratic institutions?
This report finds a troubling array of inadequate teaching and learning conditions that diminish
the educational opportunity in schools that serve large numbers of new-majority students. These
conditions place these students at a high risk of school failure, with potentially devastating
economic and social consequences for the state’s future.
Certification Differences. Teachers in high-risk schools start from behind at the get-go. To begin
with, the California teacher surveys suggest that as many as one in every five teachers entering
the high risk schools is less than fully certified to teach. Almost half (48%) of teachers in high-risk
schools report that 20% or more of the teachers in their schools are on an emergency permit,
waiver, intern credential or pre-intern credential. Only 4% of teachers in the state’s low-risk schools
report having so many teachers on any of these temporary credentials, a gap of 44% between the
“haves” and the “have nots” in California’s public school system. With California now reporting
teacher certification status on a school-by-school basis, the public can see how dramatically
schools can vary in terms of qualified teachers.17
High Turnover Rates. Teachers in high-risk schools also struggle constantly with an extraordinarily
high rate of teacher turnover, as many of their colleagues leave. The teachers left behind must
cope with insurmountable challenges and extra work; the students are left with a passing parade
of substitutes. Only 11% of teachers in low-risk schools report that high teacher turnover is a
problem, but almost four times as many (43%) in high-risk schools say it is a problem. In only 8%
of schools where the student body is primarily composed of non-Latino whites do teachers voice
concern over teacher turnover.18 Teacher turnover problems also appear to be greater at higher
grade levels. While statewide 22% of California teachers report that teacher turnover is a serious
problem, the rate jumps to 24% in middle schools and 31% in high schools.19
Lower Parental Involvement. Perhaps it is not surprising that teachers in high-risk schools with
high teacher turnover also report that parental involvement – long considered central to student
success – is a problem. Fully 47% of teachers who say their schools do not have strong parental
involvement also report a serious problem with teacher turnover.20 Parents are unable to build a
Telling The StoryState-By-State[
This analysis of findings across the three states paints a stark picture, a canvas full of gaps and inequities
between high-risk and low-risk schools. The analysis in the following sections presents a snapshot of the
conditions reported in each of the surveyed states.
The majority of
California’s public
school students now
come from what used
to be called “minority
groups”.
22
lasting relationship with teachers when the teachers in their schools are coming and going in a
continual churn that destroys the chances of building supportive relationships and a sense of
community to promote student learning. The constant change among their children’s teachers
makes it difficult for parents to discuss their children’s academic progress, problems and successes.
Poor School Facilities. Inadequate working conditions add to the likelihood that teachers will leave.
Almost half of the teachers in California’s high-risk schools give their facilities a negative rating, but
in low-risk schools, less than a quarter (22%) say physical conditions are a problem. Among teachers
who say they want to leave their current school in three years or less, 37% cite the poor conditions
of the physical plant as a major reason.21
It is easy to understand why these teachers are frustrated with the quality of their schools’ physical
facilities. Half of the California teachers who are dissatisfied with their physical facilities report
evidence of cockroaches, mice and rats in their buildings. One quarter of the teachers in high-risk
schools report that student bathrooms regularly are dirty or closed during the time students are
attending class. These teachers in high-risk schools are also much more likely to be dissatisfied with
the availability of technology, textbooks and other instructional materials. Overall, one in three
teachers in high-risk schools reports that his or her working conditions are not good, that students
do not have proper access to computers and other technological aids, or that textbooks and other
instructional materials simply are not adequate.
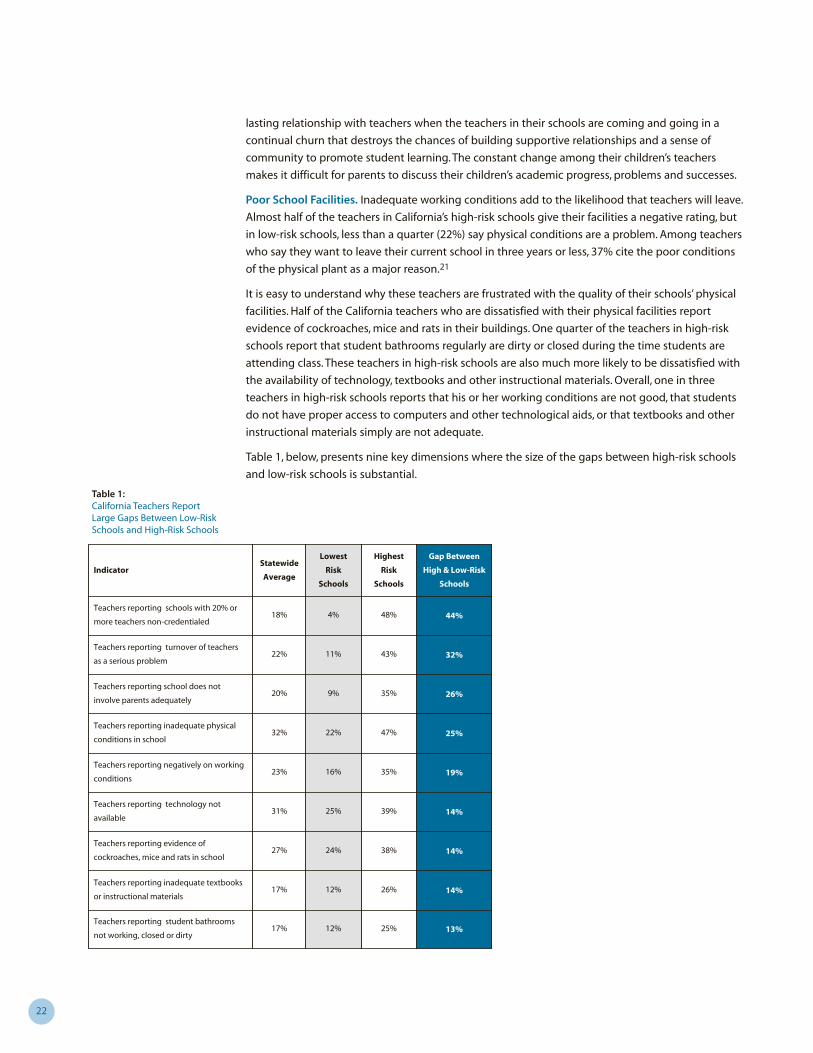
Table 1, below, presents nine key dimensions where the size of the gaps between high-risk schools
and low-risk schools is substantial.
18%
22%
20%
32%
23%
31%
27%
17%
17%
4%
11%
9%
22%
16%
25%
24%
12%
12%
48%
43%
35%
47%
35%
39%
38%
26%
25%
44%
32%
26%
25%
19%
14%
14%
14%
13%
Teachers reporting schools with 20% or
more teachers non-credentialed
Teachers reporting turnover of teachers
as a serious problem
Teachers reporting school does not
involve parents adequately
Teachers reporting inadequate physical
conditions in school
Teachers reporting negatively on working
conditions
Teachers reporting technology not
available
Teachers reporting evidence of
cockroaches, mice and rats in school
Teachers reporting inadequate textbooks
or instructional materials
Teachers reporting student bathrooms
not working, closed or dirty
Statewide
Average
Lowest
Risk
Schools
Highest
Risk
Schools
Gap Between
High & Low-Risk
Schools
Indicator
Table 1:California Teachers ReportLarge Gaps Between Low-RiskSchools and High-Risk Schools

23
New York State: Location, Location, Location!
There is a saying in real estate that there are three things that matter in terms of home value:
location, location, and location! It turns out that this may be true for schools as well. With this
idea in mind, the Harris survey in New York State looked at teacher responses across two levels
of variation: whether they taught in high-risk or low-risk schools, and whether these schools
were located in New York City, New York City suburbs, major cities upstate, or other upstate
locations that were not major urban areas.
Their findings are blunt:“New York State has a two-tiered public school system: one for the more
affluent, who enjoy the privileges of a relatively sound educational environment, and the other for
the least privileged who suffer conditions that virtually foreclose their chances of learning.”22
Furthermore, regional analysis leaves little doubt that the most favorable conditions exist in the
suburbs of New York City, while the worst are centered in New York City itself, followed closely
by those in major cities upstate.
Teacher Turnover. In New York State, 63% of teachers in high-risk schools say that teacher
turnover is a serious problem, and 43% say their schools can’t fill long-term vacancies or must
hire substitutes. But in the schools at the other end of the spectrum, those serving low numbers
of at-risk students, only 17% of teachers report problems with high turnover, and only 18% say
their schools can’t fill vacancies. The teacher turnover problem also varies greatly by region:
51% of teachers in New York City schools report high turnover, compared with 28% of teachers
in major cities upstate, 22% of upstate, non-urban teachers, and only 16% of teachers in New
York City suburbs.
Why are these teachers leaving? There is only a 10% gap between those who report that they
themselves want to leave teaching in the next three years (31% of the teachers in high-risk
schools vs. 21% in low-risk schools). However, retirement is more likely to be the reason for
leaving low-risk schools (where 67% of those planning to leave intend to retire); while in high-
risk schools, only 34% of those leaving are planning to retire. Over 75% of teachers planning to
leave high-risk schools cite non-retirement reasons, with salary, lack of school leadership, class
size/pupil load, lack of supplies and materials, or bad school facilities reported as reasons for
leaving high-risk schools.23 These factors are cited far less often as reasons for teachers
planning to leave low-risk schools.
Teachers in low-risk schools are able to make a career commitment to teaching, because
teaching conditions in their schools provide a quality opportunity for success. The exit at the
end of a career is not an escape strategy for these teachers, but rather the capping of careers of
professional service, with retirement at an appropriate age after meeting rewarding challenges.
In high-risk schools, in contrast, few teachers last long enough to build a career that leads to
retirement; negative school conditions drive teachers out of teaching in high-risk schools well
before they have served long enough to consider retirement.
Testing and Teaching. The New York survey also asked teachers about the quality and
usefulness of the tests they are required to administer. Statewide, New York teachers were
slightly positive on the value and quality of state tests, but 79% overall still felt there was an
excessive emphasis on testing that led students to spend more time on learning how to take
tests instead of on learning how to think, solve problems or learn things useful for later in life.24
Barriers to Student Testing Success. When asked about barriers to student success on
statewide tests, the biggest gap existed on whether students had funds for private tutors. While
64% of teachers in high-risk schools saw this as a major barrier, only 16% of those in low-risk
schools cited this barrier. This 48% gap, which was one of the highest recorded in these surveys,
New York State has a
two-tiered public school
system: one for the more
affluent, who enjoy the
privileges of a relatively
sound educational
environment, and the
other for the least
privileged who suffer
conditions that virtually
foreclose their chances
of learning.

24
reflects the reality that students in wealthier schools have access to extra teaching resources that are not an
option for students in poorer schools. But school conditions were also seen as substantial barriers to student
preparation for tests: 67% of teachers in high-risk schools cited “lack of time to give individual help” as a major
barrier, compared to 42% of those in low-risk schools who saw this as a problem.25
By region, it was teachers from schools in major cities upstate who were most frustrated by lack of time to
help students prepare for tests (69%), closely followed by 65% in New York City. These rates were much higher
than rates reported by other upstate teachers (48%), and about double the percentage of teachers citing this
problem in the New York City suburbs (33%). A similar barrier to student success on tests was that “classes are
too large”: 66% of New York city teachers and 59% of teachers in major cities upstate rated this a major
problem, compared with 38% of teachers upstate overall and 33% in New York suburban schools. Three other
barriers with almost twice the impact in high-risk schools were “lack of qualified teachers to prepare students
for exams” (cited by 70% of teachers in high-risk schools, compared to 37% in low-risk schools);“having no
school funds to spend for test training” (35% in high-risk; 19% in low-risk schools); and “lack of proper
preparation materials” (31% in high-risk; 19% in low-risk schools).26
Taken together, these data suggest that at-risk students, who typically need the most help to prepare well for
tests, face substantial barriers of limited resources when compared to their more affluent counterparts. The
dice are loaded against these students, and it should come as little surprise that students in these schools
continue to score lower on statewide tests than do their more privileged peers in other schools.
Tables 2 and 2a display indicators where the gaps between high and low-risk schools and across regions in
New York State were substantial.
52%
30%
32%
39%
$383
30%
57%
21%
34%
15%
17%
27%
$333
16%
47%
11%
85%
63%
63%
68%
$468
52%
80%
39%
51%
48%
46%
41%
40%
36%
33%
28%
Teachers reporting children not prepared
for school
Teachers reporting evidence of
cockroaches, mice and rats
Teachers reporting excessive teacher
turnover rates
Teachers reporting lack of equipment and
materials for science lab work
Teachers reporting average yearly out-of-
pocket expenditures for school materials
Teachers reporting negative working
conditions overall
Teachers reporting weak incentives to
remain a teacher
Teachers reporting that cuts in available
funds significantly undermine quality
Statewide
Average
Lowest
Risk
Schools
Highest
Risk
Schools
Gap Between
High & Low-Risk
Schools
Indicator
36%
26%
26%
17%
51%
41%
25%
24%
Teachers reporting physical facilities
inadequate
Teachers reporting inadequate school
involvement of parents
Table 2:New York State Teachers ReportLarge Gaps Between High-Riskand Low-Risk Schools

25
68%
54%
51%
54%
$437
48%
76%
32%
63%
48%
35%
29%
17%
16%
22%
$359
19%
32%
9%
36%
28%
17%
73%
24%
28%
50%
$421
28%
63%
31%
56%
38%
43%
48%
15%
22%
35%
$349
20%
52%
16%
35%
29%
23%
Teachers reporting children not prepared
for school
Teachers reporting evidence of
cockroaches, mice and rats
Teachers reporting excessive teacher
turnover rates
Teachers reporting lack of equipment and
materials for science lab work
Teachers reporting average yearly out-of-
pocket expenditures for school materials
Teachers reporting negative working
conditions overall
Teachers reporting weak incentives to
remain a teacher
Teachers reporting cuts in available funds
significantly undermine quality teaching
Teachers reporting computers with
internet access not available in classroom
Teachers reporting physical facilities
inadequate
Teachers reporting inadequate school
involvement of parents
NY City
Schools
Schools in
NY City
Suburbs
Schools in
Major
Cities
Upstate
Other Schools
UpstateIndicator
Table 2a:New York State Teachers ReportGaps by Region
These data suggest that
at-risk students, who
typically need the most
help to prepare well for
tests, face substantial
barriers of limited
resources when
compared to their more
affluent counterparts.
The dice are loaded
against these students.
26
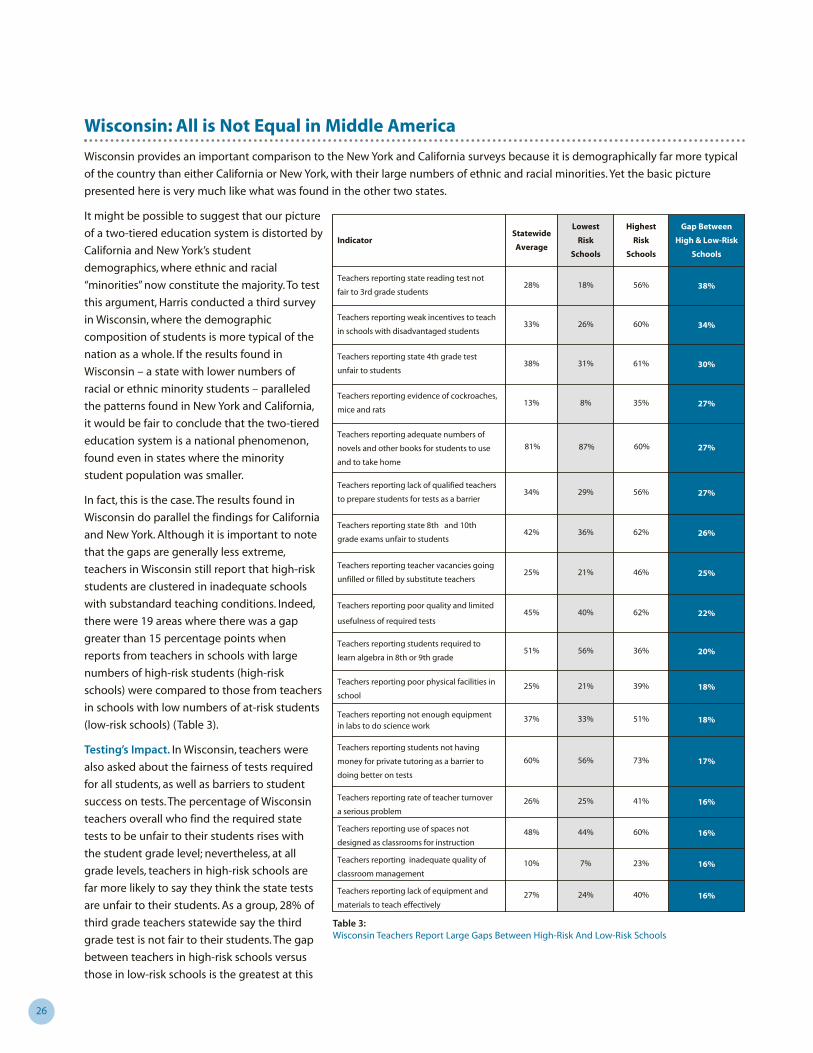
Wisconsin: All is Not Equal in Middle America
Wisconsin provides an important comparison to the New York and California surveys because it is demographically far more typical
of the country than either California or New York, with their large numbers of ethnic and racial minorities. Yet the basic picture
presented here is very much like what was found in the other two states.
It might be possible to suggest that our picture
of a two-tiered education system is distorted by
California and New York’s student
demographics, where ethnic and racial
“minorities” now constitute the majority. To test
this argument, Harris conducted a third survey
in Wisconsin, where the demographic
composition of students is more typical of the
nation as a whole. If the results found in
Wisconsin – a state with lower numbers of
racial or ethnic minority students – paralleled
the patterns found in New York and California,
it would be fair to conclude that the two-tiered
education system is a national phenomenon,
found even in states where the minority
student population was smaller.
In fact, this is the case. The results found in
Wisconsin do parallel the findings for California
and New York. Although it is important to note
that the gaps are generally less extreme,
teachers in Wisconsin still report that high-risk
students are clustered in inadequate schools
with substandard teaching conditions. Indeed,
there were 19 areas where there was a gap
greater than 15 percentage points when
reports from teachers in schools with large
numbers of high-risk students (high-risk
schools) were compared to those from teachers
in schools with low numbers of at-risk students
(low-risk schools) (Table 3).
Testing’s Impact. In Wisconsin, teachers were
also asked about the fairness of tests required
for all students, as well as barriers to student
success on tests. The percentage of Wisconsin
teachers overall who find the required state
tests to be unfair to their students rises with
the student grade level; nevertheless, at all
grade levels, teachers in high-risk schools are
far more likely to say they think the state tests
are unfair to their students. As a group, 28% of
third grade teachers statewide say the third
grade test is not fair to their students. The gap
between teachers in high-risk schools versus
those in low-risk schools is the greatest at this
28%
33%
38%
13%
81%
34%
42%
25%
45%
51%
25%
37%
60%
26%
48%
10%
27%
18%
26%
31%
8%
87%
29%
36%
21%
40%
56%
21%
33%
56%
25%
44%
7%
24%
56%
60%
61%
35%
60%
56%
62%
46%
62%
36%
39%
51%
73%
41%
60%
23%
40%
38%
34%
30%
27%
27%
27%
26%
25%
22%
20%
18%
18%
17%
16%
16%
16%
16%
Teachers reporting state reading test not
fair to 3rd grade students
Teachers reporting weak incentives to teach
in schools with disadvantaged students
Teachers reporting state 4th grade test
unfair to students
Teachers reporting evidence of cockroaches,
mice and rats
Teachers reporting adequate numbers of
novels and other books for students to use
and to take home
Teachers reporting lack of qualified teachers
to prepare students for tests as a barrier
Teachers reporting state 8th and 10th
grade exams unfair to students
Teachers reporting teacher vacancies going
unfilled or filled by substitute teachers
Teachers reporting poor quality and limited
usefulness of required tests
Teachers reporting students required to
learn algebra in 8th or 9th grade
Teachers reporting poor physical facilities in
school
Teachers reporting not enough equipmentin labs to do science work
Teachers reporting students not having
money for private tutoring as a barrier to
doing better on tests
Teachers reporting rate of teacher turnover
a serious problem
Teachers reporting use of spaces not
designed as classrooms for instruction
Teachers reporting inadequate quality of
classroom management
Teachers reporting lack of equipment and
materials to teach effectively
Statewide
Average
Lowest
Risk
Schools
Highest
Risk
Schools
Gap Between
High & Low-Risk
Schools
Indicator
Table 3:Wisconsin Teachers Report Large Gaps Between High-Risk And Low-Risk Schools

27
level: 56% of teachers in high-risk schools say the third grade reading tests are unfair to their students,
compared with only 18% of teachers in low-risk schools who voice this concern. Even more fourth grade
teachers statewide (38%) are concerned about unfairness of the Wisconsin fourth grade tests, with teachers in
high-risk schools almost twice as likely to call these tests unfair for their students than are their colleagues in
low-risk schools (61% vs. 31%). And high school teachers are the most concerned group of teachers overall
when asked about the fairness of required tests for their eighth and tenth grade students: 42% of high school
teachers statewide say these tests are unfair, with twice as many teachers in high-risk schools registering this
concern, compared to teachers in low-risk schools (62% vs. 36%) (Table 3).
Barriers to Student Testing Success. The reasons why so many teachers believed the tests are unfair can be
found in the follow-up responses. The lack of qualified teachers was viewed by many as a barrier to preparing
students for the tests they must take. When asked about barriers to student success on statewide tests, almost
twice as many teachers in the high-risk schools (56% vs. 29% in low-risk schools) reported a lack of qualified
teachers as a barrier. In the high-risk Wisconsin schools where the majority of students in the classroom were
non-white, this barrier was even more marked: 63% of those teaching high-risk students, a majority of whom
were nonwhite, said the lack of qualified teachers was a problem, as opposed to 29% of teachers with a majority
of white students in low-risk schools.27 In other words, many of these teachers are telling us that it is not the
tests themselves, but the lack of capacity of the schools to prepare students for tests that is the problem.
Geographic Differences. Harris also broke down the Wisconsin findings across geographic regions, comparing
the Milwaukee public schools to schools in Milwaukee’s suburbs, schools in mid-sized cities in Wisconsin, and
schools in the state’s rural areas. The analysis showed some dimensions on which views were generally positive
across the state, but in all cases, the ratings of teachers from Milwaukee were lower than the statewide average.
This pattern is reflected in Table 3a.
As in the New York and California surveys, teacher survey results in Wisconsin suggest that far too many children
at risk, no matter what their ethnic or racial background, are clustered in schools with environments and
conditions which make it nearly impossible for the schools to provide even a modicum of quality education.
26%
35%
20%
10%
24%
25%
45%
33%
45%
52%
35%
22%
35%
36%
68%
61%
23%
30%
8%
5%
19%
23%
41%
26%
30%
39%
26%
11%
25%
28%
44%
34%
21%
23%
18%
9%
21%
22%
41%
28%
Teachers reporting high rate of
teacher turnover
Teachers reporting overcrowding
of classrooms
Teachers reporting inadequate
parental involvement in school
Teachers reporting poor classroom
management in school
Teachers reporting inadequate
technology
Teachers reporting inadequate
physical facilities
Teachers reporting inadequate
quality and usefulness of tests
Teachers reporting weak incentives
to teach in high-risk schools
Statewide
Average
Milwaukee
Schools
Milwaukee
Suburban
Schools
Mid-Size
City
Schools
Rural
SchoolsIndicator
Table 3a:Wisconsin Teachers Report Gaps That Vary By Region In The State
The results found in
Wisconsin do
parallel the findings
for California and
New York
28
This is not the first research study to document that inadequate working conditions in low income and minority schools
can diminish teaching and learning opportunities.28 In addition to the Harris surveys that NCTAF analyzed for this report,
a 2003 survey by Public Agenda found that, while 56% of teachers nationwide gave their schools high ratings for having
“an orderly, safe, and respectful school atmosphere,” just 35% of teachers in schools with a majority of African-American
or Hispanic students said the school atmosphere was good, compared with 68% of teachers in schools with few minority
students. The urban/suburban breakdown in this survey shows disparities as well: only 41% of teachers in urban schools
described their school environments as very good, compared with 61% of those in suburban or rural areas.29 A
subsequent analysis of the Harris survey data for California confirmed that teacher turnover problems in low income and
minority schools were more strongly influenced by school conditions and salary levels than by student characteristics.30
In report after report, teachers are telling us that school conditions matter. As early as 1990, Rosenhotz and Simpson
linked teacher turnover to teachers’ commitment to the workplace, as measured by teacher absenteeism, disaffection,
and defection.31 More recently, others have begun to study how school architecture, the design and quality of buildings,
affects teachers’ decisions to stay or flee. A survey of teachers in Washington, D.C., schools, funded by the Ford
Foundation and the 21st Century School Fund, conducted in May and June 2002, found a host of school facility issues
that affected teachers’ interest in remaining in teaching. In that study, teachers were asked about indoor air quality,
thermal (temperature) control, light (both artificial and daylight), and noise levels. The quality of school facilities was
found to be an important predictor of the teachers’ decisions to leave or stay in a school.32
Two-thirds of teachers surveyed in Washington, D.C.’s predominantly urban schools reported poor indoor air quality in
their schools. In a parallel study of Chicago teachers, over one-quarter reported asthma and respiratory problems, and an
additional 16% reported problems such as sinus infections that might be related to the poor air quality in their schools.
Similarly, despite numerous studies linking appropriate lighting with improved test scores and student achievement,
21% of teachers responding to the Washington survey reported that lighting in their schools was inadequate, and one in
five said they couldn’t even see out of the windows in their classrooms! Almost 70% reported that their classrooms and
hallways were so noisy that it affected their ability to teach. And in the Spring of 2004, environmental studies in
Washington, D.C. were confirmed dangerously high lead levels in the drinking water that runs through school water
fountains, a factor that has been linked to a range of cognitive and developmental problems in children.
After finding that the probability of teacher retention increased as the perceived quality of school facilities improved, the
authors of the Ford Foundation/21st Century School Fund study offer a radical proposal – they suggest that:
…the benefits of facility improvement for retention can be equal to or even greater than
those from pay increases. Furthermore, a major facilities improvement is likely to be a one-
time expense, last for many years, and have alternative sources of state or federal funding
available. It could thus be a more cost-effective teacher retention strategy than a
permanent salary increase for teachers in the medium-to-long term.33
Citing research on facilities in developing nations, where facilities improvement has been shown to offset low wages, the
authors suggest that the investment in school facilities may be an equally compelling factor for change in the United
States.34 This conclusion is consistent with the nation’s largest national survey of teachers (conducted by the National
Center for Education Statistics), which has shown that school conditions far outweigh pay as a source of dissatisfaction
for teachers in high poverty, urban public schools.35 The survey reports and the research studies are voluminous and
complex, but the voice of teachers in high-risk schools comes through loud and clear – they are telling us that if we don’t
improve conditions, we can’t pay them enough to teach in these schools.
Other Studies Shed Light OnGaps In The Two-TieredEducation System [

29
The World Economic Forum’s Global Competitiveness Report, 2001-2002, rates the U.S. dead
last among developed countries when it comes to the difference in the quality of schools
available to rich vs. poor children. The President’s Commission on Education Resource Equity
declared in 2001,“long-standing gaps in access to educational resources exist, including
disparities based on race and ethnicity.”36 These economic reports are new, but the news is not.
Thirty years ago, the Presidential Commission on School Finance found that disparities in
educational resource distribution among public school districts resulted from a reliance on local
district financing for educational revenues. Since that time, there have been lawsuits in forty-five
states targeted at remedies for unequal and inadequate funding of public schools. It is likely that
the “most powerful policy stimulus, at least for the foreseeable future, is that the judicial system is
beginning to take state constitutions at their word.”37
In 1971, the California Supreme Court ruled that education was a fundamental constitutional
right, and, in 1976, the same court affirmed a lower court’s finding “that wealth-related disparities
in per-pupil spending generated by the state’s education finance system violated the equal
protection clause of the California constitution.”38 The Advocacy Center for Children’s Educational
Success with Standards (ACCESS) reports further that, in May 1999, several California
organizations filed a class-action “adequacy lawsuit – Williams vs. State – which cites deplorable
conditions in school districts across the state, and ask[ed] the court to require the state to ensure
the provision of certain educational basics, such as qualified teachers, safe facilities, and
textbooks.”39 Although this case has not yet been settled, in September 2002, the State adopted a
law establishing the California Quality Education Commission to develop a model for pre-K
through grade 12 that would determine the “educational components, educational resources, and
corresponding costs ‘necessary’ so that the vast majority of pupils can meet [state] academic
standards.”The court held that a sound basic education “consists of the skills that students need
to become productive citizens capable of civic engagement and sustaining competitive
employment.”40
In New York State, the Campaign for Fiscal Equity, Inc. (CFE), filed a constitutional challenge in
1993 on the grounds of an inequitable education finance system. According to the CFE report,
each year the state spends over $25 billion to educate its three million students. The 711 localities
contribute about 55% of all school funds; the state pays 40%; and the federal government pays
4%. CFE reports that “the state aid ‘formula’ is actually a haphazard collection of 48 different
formulas, funding streams, caps and hold-harmless provisions.”41 In 1996-7, low-wealth districts in
the state spent $6,681 per pupil, while high-wealth districts spent $12,752. For the last 15 years,
New York City’s per-pupil expenditures have lagged behind the state average, despite the fact
that New York City schools have over 80% of the state’s LEP students, and 62% of its students are
impoverished.
In 1999, New York ranked 48th in equity in spending per pupil among districts, according to
Education Week.42 A survey by CFE of a random selection of one out of every two schools in New
York City’s five boroughs revealed that conditions in New York City’s schools “deprive students of
their constitutional right to the opportunity for a sound basic education.”43 New York City also
has among the lowest teacher salaries in the state: teachers in New York City earned almost
A Two-Tiered Public SchoolSystem Is Built On An InadequateAllocation of Resources [
A sound basic
education “consists of
the skills that students
need to become
productive citizens
capable of civic
engagement and
sustaining competitive
employment.”

30
$2,000 below the state average, and nearly $20,000 less than the average downstate suburban teacher,
according to a 1998 report.44
On January 10, 2001, the New York Supreme Court ruled that “New York State has over the course of
many years consistently violated the State Constitution by failing to provide the opportunity for a
sound basic education to New York City public school students.”45 The court ordered that, to ensure
that public schools offer a sound basic education,“the state must take steps to ensure at least the
following resources: qualified teachers, principals and other personnel; appropriate class sizes;
adequate and accessible school buildings; sufficient and up-to-date books, supplies, libraries, and
educational technology; suitable curricula; adequate resources for special needs; and a safe orderly
environment.”46
Following the court’s ruling, the New York State legislature is responsible for creating and
implementing a comprehensive reform of the state school funding system. Governor Pataki has
appointed a special Commission on Education Reform to make recommendations by July 30, 2004 (the
Commission requested more time to do so, though on March 30, 2004, they published their
recommendations to the Governor). CFE also assembled its own Sound Basic Education Task Force that
is developing an “Adequate Foundation for All Plan” and is assembling a “Costing-Out Study” of an
adequate education with the New York State School Boards Association, called “New York Adequacy
Study Preliminary Report.”The implementation of the Court’s decision is overseen by New York State
Supreme Court Justice Leland DeGrasse, who issued the ruling in the case.
Although there is no current adequacy suit in Wisconsin, the Wisconsin Supreme Court’s “most recent
decision…holds the state accountable for ensuring schooling that ‘will equip students for their roles as
citizens and enable them to succeed economically and personally.’ The court specifies that the purpose
of an adequacy criterion is to ‘adopt a standard that will equalize outcomes, not merely inputs.’”47
The information on school conditions in this report is focused on data from California, New York State,
and Wisconsin; nonetheless, the question of school adequacy is a civil rights concern in every region of
the country. In January 2001, the outgoing U.S. Secretary of Education wrote to every state,
encouraging them to examine the adequacy of educational resources available in low income and
minority communities:
… I am concerned about long standing racial and ethnic disparities in the
distribution of education resources, including gaps in access to experienced and
qualified teachers, adequate facilities, and instructional programs and support,
including technology, as well as gaps in the funding necessary to secure these
resources…. These resource gaps are likely to be particularly acute in high-
poverty schools, including urban schools, where many students of color are
isolated and where the effect of the resource gaps may be cumulative. In other
words, students who need the most may often receive the least, and these
students often are students of color.”48
The question of
school adequacy is
a civil rights
concern in every
region of the
country.
31
Inadequate conditions in high-risk schools clearly deprive children of their most basic civil right: an
equal opportunity to learn. But these conditions also have serious implications for the economic and
social health of the country. In a 21st Century economy, many low income students are attending
19th Century schools. Designed to meet the needs of an earlier time, these factory-era schools served
as a sorting mechanism for America’s industrial economy. In the first half of the last century, those
who did not complete high school could earn an adequate income to support a family through good
jobs in manufacturing, agriculture, forestry and mining. Today, that is no longer possible. Technology
has automated much of the work of factories, farms and businesses, leaving fewer jobs for those with
a limited education, and increasing the demand for higher skill levels among all workers. During the
last decade, the percentage of jobs requiring an education beyond high school jumped from 65% to
85%.49
To succeed in today’s economy, every student must graduate ready for college, ready for productive
work in a knowledge-based economy, and well prepared for effective citizenship in a diverse
society.50 Students who drop out of school without the necessary knowledge and skills to compete in
today’s economy have few good options. High school drop-outs are typically employed in low-wage
positions with limited health care or pension benefits. Dropping out is strongly correlated with
welfare dependency and incarceration: over the last decade, the nation’s prison population has
tripled, with the largest increases among school drop-outs – more than 50% of inmates are
functionally illiterate.51
On a personal level, the student dropout rate is a tragedy, but the consequences for the nation’s
economy are just as grave. Today our national GNP is based on our GIP – Gross Intellectual Product –
the brainpower and creative genius needed to drive media, biotechnology, electronics, and other
knowledge industries yet to be dreamed. The future of America’s economy will be heavily dependent
on the educational success of racial and ethnic populations that were once called “minority groups.”
In his January 2001, New York school adequacy decision, Justice DeGrasse “rejected as insufficient for
the 21st Century a conventional state constitutional standard of ‘basic literacy,’” and specified instead
the necessity of schooling for “productive” citizenship – not just voting or sitting on a jury, but doing
so capably and knowledgeably. The judge went on to charge schools with closing “the disconnect
between the skills of the state’s and city’s labor force and the skills of the high-technology sector.”52
In 1990, non-Latino white citizens made up 74% of the U.S. population, but by the 2000 Census, this
figure had dropped to 60%. The number of racial minorities rose from 26% to 40% in this ten-year
span.53 The public schools are on the leading edge of this population shift. In California, 61% of public
school students come from what were once considered minority groups, and, in the state as a whole,
whites have become the new minority. In New York State, the minority/majority scale is just at the
tipping point: whites, excluding Latinos, now make up only 51% of the public school population. By
the 2010 U.S. Census, a majority of New York’s student population is likely to be made up of “minority
groups.”54 Wisconsin has a relatively small percentage of its public school enrollment drawn from
racial and ethnic minorities across the state as a whole (20%), but in Milwaukee, the largest
population center in the state, minority groups make up 85% of the school-age population.55
This changing demographic picture is a legacy of the nation’s vibrant multiethnic heritage. Our
economy and culture thrive on the rich backgrounds, experiences, and contributions of the ethnic
Leaving Students Behind InFactory-Era Schools[
In a 21st Century
economy, many
low income
students are
attending 19th
Century schools.
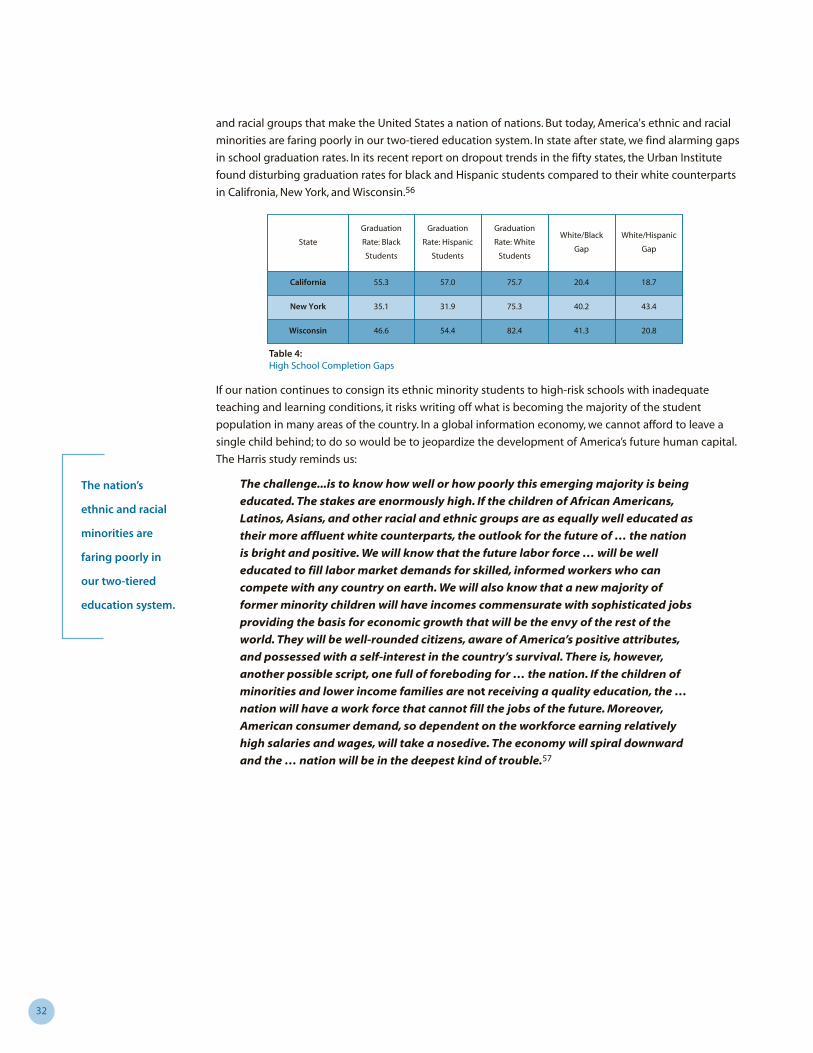
32
and racial groups that make the United States a nation of nations. But today, America's ethnic and racial
minorities are faring poorly in our two-tiered education system. In state after state, we find alarming gaps
in school graduation rates. In its recent report on dropout trends in the fifty states, the Urban Institute
found disturbing graduation rates for black and Hispanic students compared to their white counterparts
in Califronia, New York, and Wisconsin.56
If our nation continues to consign its ethnic minority students to high-risk schools with inadequate
teaching and learning conditions, it risks writing off what is becoming the majority of the student
population in many areas of the country. In a global information economy, we cannot afford to leave a
single child behind; to do so would be to jeopardize the development of America’s future human capital.
The Harris study reminds us:
The challenge...is to know how well or how poorly this emerging majority is being
educated. The stakes are enormously high. If the children of African Americans,
Latinos, Asians, and other racial and ethnic groups are as equally well educated as
their more affluent white counterparts, the outlook for the future of … the nation
is bright and positive. We will know that the future labor force … will be well
educated to fill labor market demands for skilled, informed workers who can
compete with any country on earth. We will also know that a new majority of
former minority children will have incomes commensurate with sophisticated jobs
providing the basis for economic growth that will be the envy of the rest of the
world. They will be well-rounded citizens, aware of America’s positive attributes,
and possessed with a self-interest in the country’s survival. There is, however,
another possible script, one full of foreboding for … the nation. If the children of
minorities and lower income families are not receiving a quality education, the …
nation will have a work force that cannot fill the jobs of the future. Moreover,
American consumer demand, so dependent on the workforce earning relatively
high salaries and wages, will take a nosedive. The economy will spiral downward
and the … nation will be in the deepest kind of trouble.57
55.3
35.1
46.6
57.0
31.9
54.4
75.7
75.3
82.4
20.4
40.2
41.3
18.7
43.4
20.8
California
New York
Wisconsin
Graduation
Rate: Black
Students
Graduation
Rate: Hispanic
Students
Graduation
Rate: White
Students
White/Black
Gap
White/Hispanic
GapState
The nation’s
ethnic and racial
minorities are
faring poorly in
our two-tiered
education system.
Table 4:High School Completion Gaps
33
1Acknowledge unequal and inadequate school conditions, andmarshal the political will to seek solutions.
This report paints a grim picture of inequities that deny the civil rights of our most
vulnerable citizens. The nation’s education leaders will not like what they see in this report
– but this picture will not change until we acknowledge these conditions and summon
the political will to put things right.
The Learning First Alliance has demonstrated that the courage to acknowledge negative
information is the first step toward building the will to change.58 In its study of five high-
poverty school districts that have exhibited sustained improvements in student
achievement, the Alliance found that the leaders of these districts were able to build the
political will for reform by following four steps that we recommend here.59 We reiterate
the importance of these steps. To realize the promise of Brown v. Board of Education,
federal, state, and local leaders must:
y Publicly acknowledge that teaching and learning opportunities in high-risk
schools are inadequate and unacceptable;
y Accept responsibility for the problem;
y Clearly establish that all stakeholders must be part of the solution;
y Commit to long-term improvements and innovations, and sustain these efforts
even if they do not show immediate results.
We call upon the Governors and other leading policymakers in every state to
convene the business and education leadership in their states to publicize this
report, discuss its implications in their states, and implement a plan to act
upon its recommendations.
2 Listen to the teachers and the students.
In many communities, the gap between the schools we have and the schools we need is
great. Teachers and students are telling us that their schools are inadequate as they walk
away from their classrooms, closing the door behind them, never to return. With dropout
rates that can exceed 50%, they are telling us that teaching and learning conditions in
their schools are impossible. It is time to listen to the teachers and students. Exit
interviews and surveys can tell us why so many leave, but equally important is
establishing continuing community conversations to learn from teachers, students and
parents about what needs to be improved. It is time to listen, and to act upon what we
know to be true.
Recommendations [To realize the promise of Brown v. Board of Education, we must provide every teacher and every child in
America with 21st Century schools where teaching and learning can thrive. We make the following
recommendations to achieve that goal.
Publicly
acknowledge that
teaching and
learning
opportunities in
high-risk schools
are inadequate
and unacceptable.

34
3 Establish school standards that can sustain quality teaching andlearning for every child.
As a nation, we have set a challenge for our public schools that they were never designed to meet.
We are calling on our teachers to educate every child to high standards – the standards of an
information-age economy – but in too many cases, we are asking them to do this with factory-era
methods and tools. We are wedded to public schools of the past.
In the 21st Century, we need public schools that enable teachers to act on what research tells us
about how children learn so that every student has an opportunity to succeed. To ensure that our
schools offer a sound education for each child, every school should provide the following resources:
y Highly qualified teachers, principals, and other personnel;
y Appropriate class sizes;
y Adequate and accessible school buildings – sound facilities with sufficient space to ensure
appropriate class size and implementation of a curriculum that meets high standards;
y Sufficient and current books, supplies, equipment, and other educational materials for use in
class and after school;
y Up-to-date information technologies of all kinds, including computers with high speed
Internet access, in adequate numbers in every classroom;
y A curriculum that meets high standards, with a portfolio of options and tools that enable
teachers to adapt instruction and learning activities to student needs;
y Multiple measures of student performance, supported by teacher training, instructional
strategies, and sufficient resources to meet state standards;
y Adequate resources for students with exceptional needs; and
y A safe, orderly, clean and well maintained environment.
4 Establish funding adequacy formulas based on per-pupil needs in lieuof traditional per-pupil averages.
The essential school finance task is to determine the actual cost of providing a sound education for
every child in each district and school. School financing policies should be based on an analysis of
what it will cost to raise the bar and close the gap in specific areas of student achievement –
bringing the teaching and learning conditions in all schools up to a high standard. Funding formulas
based on the average per-pupil expenditure for students in a district can mask funding inequities
between schools in low income and high-income neighborhoods.60 School adequacy funding
formulas should reflect what is required to help all students meet high standards, and they should be
based on what is necessary to meet the student learning needs within each school.
Basing district and school budgets on student learning needs is neither novel nor radical. The
Committee for Economic Development (CED), a non-partisan research and policy organization of 250
business leaders and educators, recommends decentralizing spending authority via student-based
budgets. The CED notes that “while principals and other school-level educators are now being held
accountable for improving the performance of their students, these individuals generally have little
or no control over how their school’s resources are spent. Their accountability is undermined when
authority over spending decisions lies elsewhere.”61
Canada’s city of Edmonton, Alberta, began moving to a decentralized spending authority in 1973,
and it now has 90% of its school budgets under the control of the principal.62 Based on this
We are
wedded to
public schools
of the past.
35
experience, Cincinnati, Houston, Milwaukee, Sacramento, and Seattle are experimenting with
giving schools control over their budgets. When teachers in schools become part of leadership
teams making decisions about how to allocate funds, the alignment of resources with student
learning needs can become even stronger.
Following the parameters outlined by Justice De Grasse in CFE v. State of New York, school
finance reforms at the state and district level should:
y Ensure that every school district, and every school within each district, has the
resources necessary to provide a sound education;
y Take into account variations in local costs between districts and schools;
y Provide sustained and stable funding that promotes long-term planning by districts
and schools;
y Provide as much transparency as possible, so that the public understands how the
State and district distribute school funds; and
y Ensure a system of public accountability to measure whether the allocation of funds
provides an opportunity for a sound education for each child, with particular attention
given to the question of whether inequitable distributions result from socio-economic
background or racial isolation of students.63
5Collect, analyze and use better data for better decision making,and publicly report on the relationship between school conditionsand student performance.
It is unacceptable to hold students and teachers accountable for standards that their schools
are not equipped to help them meet. It is time to align standards with data collection systems
that measure the extent to which states and districts provide their teachers and students with
adequate opportunities to teach and learn. As funding allocations become more adequate, it
also will become essential to closely monitor districts and schools to make sure they deliver
results.
Technology makes it possible to collect better data, more easily. The power of this data is lost,
however, when it is not used well. Under No Child Left Behind and its requirements for
documenting annual yearly progress, most schools today are “awash in data” – the real
challenge is “turning data into knowledge and knowledge into wise action.”64
Smart decision making and an adequate allocation of resources at all levels means knowing
what a school has to work with in terms of human, physical and financial capital, and
comparing this data with school completion and student learning outcomes to see where
gaps exist. It means collecting data that includes, but goes far beyond, information on the
race, ethnicity, language, socioeconomic status and academic achievement of students. What
is needed, in addition, are data on important characteristics of the principal and teaching staff:
training, certification, years serving in that school, and their beliefs about student potential,
strengths and needs. Publicly available data should be reported on each school’s teacher
attrition and turnover rates, including information on why teachers leave, where teachers go,
and what it costs the school each time a teacher walks out the door. School data should be
available on the quality of physical facilities, instructional resources, and access to modern
technologies. And data on community resources – commitments from parents, community
and business leaders – should complete the picture of the physical, intellectual and social
capital that are available to support teaching and learning in a school.
It is unacceptable to
hold students and
teachers accountable
for standards that
their schools are not
equipped to help
them meet.
36
6Hire well qualified teachers and principals, support them with strongprofessional communities, and reward them well.
None but the best should be encouraged to become teachers and school leaders. Every preparation
program should set and maintain high standards for entry, completion and performance of their
graduates. Certification systems should ensure that these standards are met. Good preparation pays off.
Research consistently shows that teachers who are better prepared to teach – not just those who know
what to teach, but those who know how to teach it well – will stick with teaching at a rate that can be
twice as high as those who have not had this preparation.65 Every teacher also needs solid skills for
responding to the diversity of students they will work with in today’s schools, including students from a
wide range of socioeconomic, ethnic or racial backgrounds, students whose first language may not be
English, and students with special learning needs.
Once we have hired the best teachers and principals available, we need to support their efforts to build
strong professional communities in schools that can sustain them as they work with their students in a
shared quest for excellence. An extensive body of research suggests that creating smaller, more personal
school environments that are learner-centered can improve academic achievement and social outcomes
for students, and increases teacher and parental engagement with the learning enterprise.66 Data show
that teachers are attracted to schools that have strong professional learning communities, and that the
sense of shared responsibility in these schools translates into a greater sense of professional
empowerment for improvement.
Hiring well prepared teachers is critical, but it is also essential to give them a strong start once they are in
the school. It is time to end the sink-or-swim practice of placing the most inexperienced teachers in the
most challenging schools and expecting them to cope on their own – this is a recipe for disaster. New
teachers need seasoning and time to master their craft; they should have a support network of mentors
and a community of colleagues to work with. This means giving them collegial support, strong induction
programs, and ready access to resources and assistance on an as-needed basis. High-need schools will
always be “high-need” if they are staffed by the most inexperienced teachers left to fend for themselves.
It is equally essential to develop compensation systems and staffing plans that address the needs of at-
risk schools. Districts should create incentives that attract strong principals and teams of promising and
accomplished teachers to work in the high-risk schools where they are needed most. New staffing plans
and salary systems should support and reward these teams whose mission is to turn around low-
performing schools. It is our obligation to bring the best teaching and school leadership to the students
who need it most.
7Hold officials publicly accountable for keeping the promise ofeducational equity.
A basic determinant of our success in realizing the dream of Brown v. Board of Education has become
clear – we must have strong lines and structures of accountability for quality teaching in schools
organized for success. Until now most of the high-stakes consequences for meeting state standards have
fallen on our children. To ensure that every child has equal access to a quality public education, it is time
to establish a chain of accountability – a shared commitment to school quality that links educators,
community leaders, and elected officials who have a common responsibility for ensuring that every
school provides an equal opportunity for successful teaching and learning. Everyone who has a stake in
the quality of our schools must become a strong link in the chain. Adequate resources and rewards for
performance should be tied to a reciprocal obligation to remove teachers, principals, and school leaders
who are not performing adequately. In this era of accountability, our education leaders and publicly
elected officials at every level also should be judged by their commitment to ending two-tiered public
education systems.
It is our obligation
to bring the best
teaching and school
leadership to the
students who need
it most.

37
As a nation, we have called on our teachers and students to meet demanding
standards. We must now give them the schools they need to succeed.
It is our hope that this report will serve as a wake-up call, shining a spotlight on the
inadequacy of public schools in low income neighborhoods and minority communities.
We know that public schools can work, and that in many communities they are
providing a world-class education. But we cannot be content as long as so many
teachers and students are struggling in schools with unacceptable teaching and
learning conditions. These inequitable conditions must be addressed to deliver on the
promise made a half-century ago in Brown v. Board of Education.
Our children cannot wait. They are, after all, the ones who will create America’s future.
We have made progress on setting high standards for student achievement, but until
now, most of the high-stakes consequences for failing to meet those standards have
fallen on the shoulders of our children. It is unfair and unjust to expect students to
meet expectations that their schools are not equipped to help them meet.
To put things right, we must form a strong chain of support that can overcome finger
pointing and top-down mandates. We must acknowledge that unequal and inadequate
school conditions exist and marshal the political will to seek solutions. We must
establish school standards that can sustain quality teaching and learning for every
child, and we must implement these standards with adequate funding. Because we all
have a stake in quality teaching and learning – for every child – we must all be
accountable for creating the best teaching and learning opportunities in every school.
For that, in the final analysis, is what is at stake. We are betting the future of this country
on the quality of our teachers and schools. The shape of that future is ours to decide.
A Concluding Comment [
Our children
cannot wait. They
are the ones who
will create
America’s future.
38
Three series of in-depth telephone interviews with public school teachers were conducted in
California (January 2-23, 2002), New York State (March 10-April 12, 2002), and Wisconsin (October
14-November 9, 2002), by the Peter Harris Research Group for Lou Harris.67 In each state, an “Index
of Risk” was created based on the percentage of students in each school who were receiving free
or reduced-price lunches, the number of students who could be classified as a racial or ethnic
minority, and the socioeconomic distribution of the students in each school.68 A score was
calculated for each school by measuring the percentage point distance of that school from the
statewide norm, either plus or minus. Then, the aggregated percentage score for each school was
calculated on a low-to-high basis on the Index of Risk.
The key comparison in the study is between the 51% of schools in each state survey that scored
lowest on the Index of Risk (called “low-risk schools” in this analysis), and the 20% of schools with
the highest numbers of at-risk students (called “high-risk schools”). To capture differences that also
might be of interest based on variations in the ethnic and racial composition of student
populations across geographic areas, analyses by school location were also done in the New York
and Wisconsin studies. In New York, data were analyzed by whether the schools from which
teachers were interviewed were located in New York City, the New York City suburbs, the major
cities in “Upstate New York,” and “Upstate New York” overall. For Wisconsin, these analyses looked at
schools in the city of Milwaukee, the Milwaukee suburbs, mid-size cities across the state, and rural
areas.
Teachers were reached at their homes in telephone interviews conducted by the Peter Harris
Research Group. Up to six attempts were made to reach each respondent. The numbers of calls and
completed interviews were as follows:
y California: 5,525 attempts, with 1,071 completed interviews
y New York: 7,401 attempts, with 1,009 completed interviews
y Wisconsin: 5,993 attempts, with 1,256 completed interviews
The survey questions asked in each state are found in the full reports for each state study located
at www.nctaf.org.
Methodology[

39
1 Since the 1980s, Louis Harris has conducted annual surveys of publicschool teachers.
2 Louis Harris. If You Want to Know About the Schools, Ask the Teachers: ASurvey of the Status of Public Education in New York State. Prepared forRecruiting New Teachers, Inc. (July 2002), p 37.
3 Louis Harris. If You Want to Know About the Schools, Ask the Teachers: ASurvey of the Status of Public Education in New York State (September 2002), p.viii.
4Craig Jerald. Dispelling the Myth Revisited: Preliminary Findings from aNationwide Analysis of “High-Flying” Schools. Washington, DC: The EducationTrust, Inc., 2001.
5 See, for example, U.S. Department of Education. Hope for Urban Education: AStudy of Nine High-Performing, High-Poverty, Urban Elementary Schools.Washington, DC: Author, December 1999.<http://www.ed.gov/pubs/urbanhope.execsumm.html>. Also, R. Rothman.“Closing the Achievement Gap: How Schools are Making It Happen.” TheJournal of the Annenberg Challenge 5.2, (Winter 2001/02).<http://www.annenbergchallenge.org/pubs/cj/gap_cj.htm>. Also, Councilfor Basic Education, Closing the Gap: A Report on the Wingspread Conference.Washington DC: Author, 2000. And, National Center for EducationalAccountability. Best Practices Framework.<http://www.just4kids.org/bestpractice/index.cfm>.
6 Assistance with sampling, interviewing, and computer tabulations wasprovided by Peter Harris Research Group. Dr. Mildred Hudson of RecruitingNew Teachers, Inc., also assisted with the study design.
7 Harris, New York survey (July 2002), p.20.
8 There were 1,071 completed interviews in California and 1,009 completedinterviews in New York State.
9 There were 1,256 completed interviews in Wisconsin.
10 Harris. New York survey (September 2002), p. 5.
11 Ibid., p. 5.
12 Louis Harris. If You Want to Know About the Schools, Ask the Teachers: ASurvey of the Status of Public Education in California. September 2002, p. 8.
13 William I. Sanders. Cumulative and Residual Effects of Teachers on FutureStudent Academic Achievement. Knoxville, TN: University of Tennessee Value-Added Research & Assessment Center, 1996. See also, Jeff Archer.“Students’Fortunes Rest with Assigned Teacher.” Education Week (February 18, 1998).<http://www.edweek.org/>.
14 Bob Chase.“To Hire and to Hold.”Washington, DC: National EducationAssociation, April 22, 2001. <http://www.nea.org/columns>.
15 Harris. California survey, p. 5.
16 According to the 2000-2001 survey of the National EducationAssociation’s Status of the American Public School Teacher, 97% of all teachersspend their own money to keep classrooms equipped. Teachers nationwidespent an average of $443, with minority teachers spending more than whiteteachers ($470 vs. $434) and teachers in large and medium school systemsspending more ($523 and $465 respectively) than teachers in small systems($323). National Education Association. Status of the American Public SchoolTeacher, 2000-01. Washington, DC: Author, 2003, p. 64.<http://www.nea.org/edstats/images/status.pdf>.
17 California Commission on Teacher Credentialing.“California TeacherCredential Look-up and Renewal.” Available online at<http://www.ctc.ca.gov>.
18 Harris. California survey, September 2002, p. 4.
19 Ibid., p. 5.
20 Ibid., p. 4.
21 Ibid., p. 5.
22 Harris. New York Survey (September 2002), p. 37.
23 Ibid., p. 21.
24 Ibid., p. 30.
25 Ibid., p. 30.
26 Ibid., p. 30.
27 Louis Harris. If You Want to Know About the Schools, Ask the Teachers: ASurvey of the Status of Public Education in Wisconsin. June 2003, p. 78.
28 See, for example, Carol Cash. A study of the relationship between schoolbuilding condition and student achievement and behavior. Unpublisheddoctoral dissertation. Blacksburg, VA: Virginia Polytechnic Institute and StateUniversity, 1993. Glen I. Earthman and Linda Lemasters.“Review of researchon the relationship between school buildings, student achievement, andstudent behavior.” Paper presented at the annual meeting of the Council ofEducational Facility Planners International, Tarpon Springs, FL, October 1996.(ED416666). Also, Linda M. Frazier.“Deteriorating School Facilities andStudent Learning,” ERIC Digest Number 82. Eugene, OR: ERIC Clearinghouseon Educational Management, 1993. (ED356564). Also, Lackney, J. A.“Assessingschool facilities for learning/assessing the impact of the physicalenvironment on the educational process.” Mississippi State, MS: EducationalDesign Institute, 1999. (ED441330). Also, Linda K. Lemasters.“A synthesis ofstudies pertaining to facilities, student achievement, and student behavior.”Blacksburg, VA: Virginia Polytechnic and State University, 1997. (ED447687).And Mark Schneider.“School facilities and academic outcomes.”Washington,DC: National Clearinghouse for Educational Facilities, 2002.<http://www.edfacilities.org/pubs/outcomes.pdf>.
29 Steve Farkas, Jean Johnson, and Ann Duffett, with Leslie Moye and JackieVine. Stand By Me: What Teachers Really Think About Unions, Merit Pay, andOther Professional Matters. Washington, DC: Public Agenda, 2003, p. 11.<http://www.publicagenda.org>.
30 Susanna Loeb, Linda Darling-Hammond, and John Luczak.“TeacherTurnover: The Role of Working Conditions and Salaries in Recruiting andRetaining Teachers” (forthcoming). Stanford, CA: Stanford University Schoolof Education.
31 S.J. Rosenhotz and C. Simpson.“Workplace conditions and the rise and fallof teachers’ commitment.” Sociology of Education, 63 (1990): 241-247.
32 Jack Buckley, Mark Schneider, and Yi Shang.“Fix It and They Will Stay: TheEffects of School Facility Quality on Teacher Retention in Urban SchoolsDistricts” (forthcoming). Teachers College Record. Research supported by theFord Foundation and the 21st Century School Fund through its BESTprogram. <http://www.edfacilities.org/pubs/teacherretention3.html>.
33 Ibid.
Endnotes[

40
34 Doune MacDonald.“Teacher Attrition: A Review of Literature.” Teachingand Teacher Education 15 (1999): 839-848. And Joseph P. Farrell and Joao B.Oliveira (eds.).“Teacher Costs and Teacher Effectiveness in DevelopingCountries.” Teachers in Developing Countries: Improving Effectiveness andManaging Costs. Washington, D.C.: World Bank, 1993, pp. 7-24. Citied inBuckley, Schnieder, and Shang, op. cit.
35 Richard Ingersoll. Adapted for NCTAF from “Teacher Turnover and TeacherShortages: An Organizational Analysis.” American Educational ResearchJournal 38 (Fall 2001). In National Commission on Teaching and America’sFuture. No Dream Denied: A Pledge To America’s Children. Washington, DC:Author, 2003, p. 37.
36 Executive Order 13190 SS 1, January 15, 2001; 66 Federal Register 5424.
37 James W. Guthrie.“Constructing New Finance Models that Balance Equity,Adequacy and Efficiency with Responsiveness.” Education Finance in theStates: Its Past, Present and Future (Issue Paper Series). Denver, CO: EducationCommission of the States, 2001. <http://www.ecs.org/clearinghouse>.
38 Molly A. Hunter.“Finance Litigation – California.” New York, NY: AdvocacyCenter for Children’s Educational Success with Standards, October 2003.<http://www.accessednetwork.org/litigation/lit_ca.html>.
39 Ibid.
40 Ibid.
41 Campaign for Fiscal Equity, Inc. Running on Empty: High Standards andMissing Resources in New York City’s Public Schools. New York, NY: Author, 1999,p. 2.
42 Education Week.“Grading the States.” Quality Counts 1999: Education Week18.17 (January 11, 1999): 113-121.
43 op. cit., endnote 41.
44 Ibid., p.11
45 CFE. CFE v. State of New York Remedial Order. New York, NY: Author,undated. <http://www.cfequity.org/remorder.html>.
46 Ibid.
47 op. cit., endnote 37.
48 Secretary of Education Richard W. Riley. Letter to the States. January 19,2002.
49 NationsBank Montgomery Securities. The Age of Knowing. San Francisco,CA: Author, 1998. Reported in, Web-based Education Commission. The Powerof the Internet for Learning. Washington, DC: Author, 2000, p. 4.<http://www.hpcnet.org/webcommission>.
50 Melinda F. Gates. Educating All Children Well: Do We Want to Do It BadlyEnough? Remarks by Melinda French Gates to the National Conference ofState Legislatures, July 25, 2003. <http://www.gatesfoundation.org>.
51 Linda Darling-Hammond.“Teaching for Equity and Excellence: What it WillReally Take to Leave No Child Behind.” Presentation at NCTAF Commissionersand Partner States’ Symposium, Denver, CO, July 2003.<http://www.nctaf.org>.
52 op. cit., endnote 37.
53 Harris. Wisconsin survey, p.i.
54 Harris. NY survey (September 2002), p. II.
55 Milwaukee Public Schools.“2002-2003 District Report Card for TheMilwaukee Public Schools.” Milwaukee, WI: Author, 2003, p. 5.<http://www.milwaukee.k12.wi.us/pages/MPS/Administration/Offices_of_the_Superintendent/Assessment_and_Accountability/Research_Accountability/Report_Card_of_MPS_Schools>.
56 Losing Our Future: How Minority Youth Are Being Left Behind by theGraduation Rate Crisis, the Civil Rights Project at Harvard University, theUrban Institute, Advocates for Children of New York, and the Civil SocietyInstitute (2004).
57 Harris. NY survey (September 2002), pp. II-III.
58 Learning First Alliance. Beyond Islands of Excellence: What Districts Can Doto Improve Instruction and Achievement in All Schools – A Leadership Brief.Washington, DC: Author, 2003.
59 Ibid., p. 3.
60 Marguerite Roza and Paul Hill. How Within-District Spending Inequities HelpSome Schools Fail (Working Draft). A paper for the Brookings Institutionconference,“The Teachers We Need.” Seattle, WA: Center on ReinventingPublic Education, University of Washington, 2003.
61 Committee for Economic Development. Investing in Learning: SchoolFunding Policies to Foster High Performance. Washington, DC: Author, 2004, p.9.
62 Ibid., p. 9.
63 op. cit., endnote 45.
64 Dennis P. Doyle.“Taking Education Technology Seriously.” Education Week23.26 (March 10, 2004): pp. 36, 38.
65 National Commission on Teaching and America's Future. No DreamDenied: A Pledge to America's Children. Washington, DC, 2003, p. 85
66 See: NCTAF website.“Redesign by Design.” <http://www.nctaf.org>.
67 Typically, the cooperation rates for cross-section surveys average 50%, butthe cooperation rates (63% average across the three state studies) andcompletion rates (56% average across the three studies) on these surveyswere much higher.
68 For the NY and CA surveys, students identified as having Limited EnglishProficiency, based on State Department data, were also included as elementsin constructing the Index of Risk. In California, the socio-economicdistribution was based on the percentage of students from families eligiblefor Cal Works, the state welfare program.
Fifty Years After Brown v. Board of Education: A Two-Tiered Education System is based on the survey research of
Louis Harris. We want to thank Mr. Harris and Peter Harris at the Peter Harris Research Group for providing access to
the teacher surveys conducted in California, New York, and Wisconsin. Full copies of the Lou Harris surveys that are the
basis for this report are available on NCTAF’s website at: www.nctaf.org
We particularly wish to acknowledge Tom Carroll, NCTAF President, for his leadership of this initiative, and Kathleen
Fulton, for writing this report and directing the work of the research team composed of Irene Yoon and Karen
Abercrombie.
Special thanks to Meredith Spangenberg of Moonlight & Co. for the graphic design of this report.
The full text of this report is available through NCTAF’s website: www.nctaf.org. The NCTAF website also
provides additional links to several resources related to Brown v. Board of Education and the issues of school
adequacy.
The National Commission on Teaching and America’s Future (NCTAF) is a nonprofit, nonpartisan, advocacy organization
dedicated to providing every child with competent, caring, qualified teachers in schools organized for success. With a
network of 22 partner states and links to professional educational organizations across the nation, NCTAF provides
leadership for innovation and improvement in teaching and learning in America’s schools. NCTAF’s work is supported by
grants from philanthropic organizations listed at www.nctaf.org. The analysis, recommendations, and opinions in this report
are solely the responsibility of the authors.
Portions of this report may be reproduced without permission, provided that acknowledgement is given to the
“National Commission on Teaching and America’s Future.” Limited permission is also granted for larger portions to be
reproduced by nonprofit and public agencies and institutions only, solely for noncommercial purposes and provided
that acknowledgement as expressed above is prominently given. Reproduction or storage in any form of electronic
retrieval system for any commercial purpose is prohibited without the express written permission of the authors.
Acknowledgements[
National Commission on Teaching and America’s Future www.nctaf.org