Embed Size (px)
Citation preview
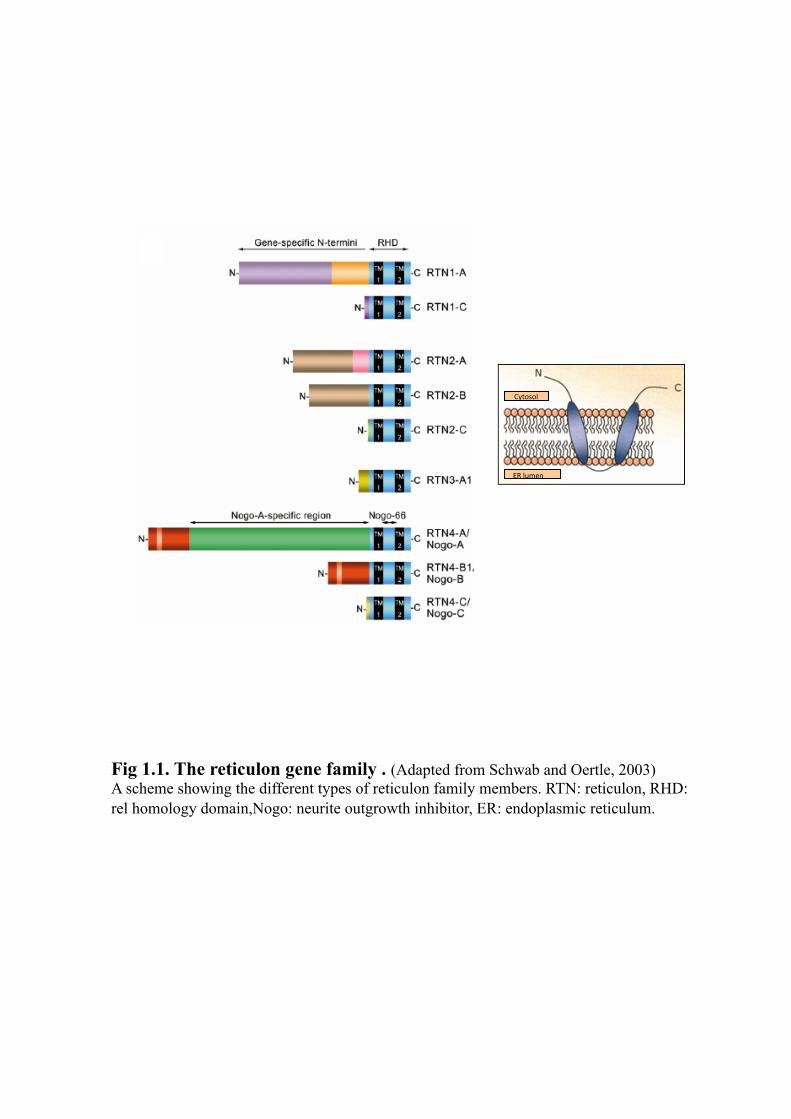
Fig 1.1. The reticulon gene family . (Adapted from Schwab and Oertle, 2003) A scheme showing the different types of reticulon family members. RTN: reticulon, RHD: rel homology domain,Nogo: neurite outgrowth inhibitor, ER: endoplasmic reticulum.
!"#$%$&'
()'&*+,-'
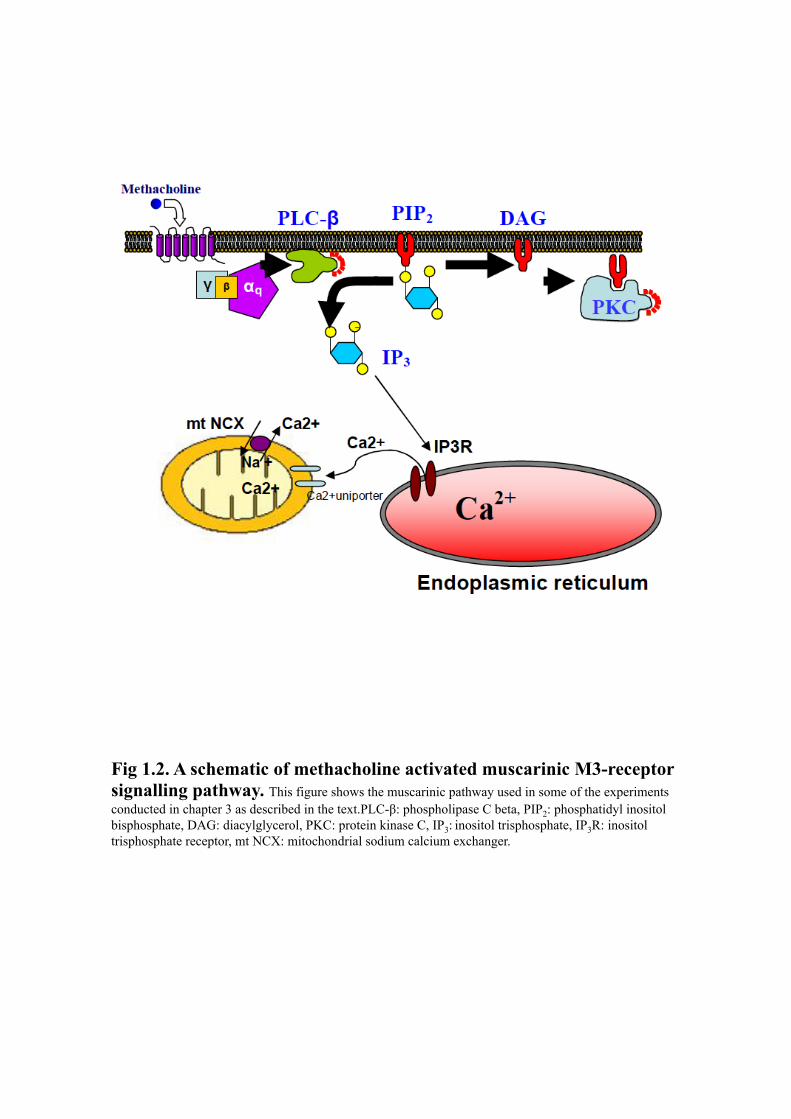
Fig 1.2. A schematic of methacholine activated muscarinic M3-receptor signalling pathway. This figure shows the muscarinic pathway used in some of the experiments conducted in chapter 3 as described in the text.PLC-!: phospholipase C beta, PIP2: phosphatidyl inositol bisphosphate, DAG: diacylglycerol, PKC: protein kinase C, IP3: inositol trisphosphate, IP3R: inositol trisphosphate receptor, mt NCX: mitochondrial sodium calcium exchanger.
Fig 1.3. A schematic of on/off mechanisms of Ca2+ dynamics in living cells. (www.cellsignallingbiology.org). This scheme describes various mechanisms through which Ca2+ influx and
efflux can occur. (RyR: ryanodine receptor, IP3R: inositol trisphosphate receptor.
'''''''''''''''''''''''''''''Sarcoplasmic/endoplasmic reticulum Ca2+- ATPase
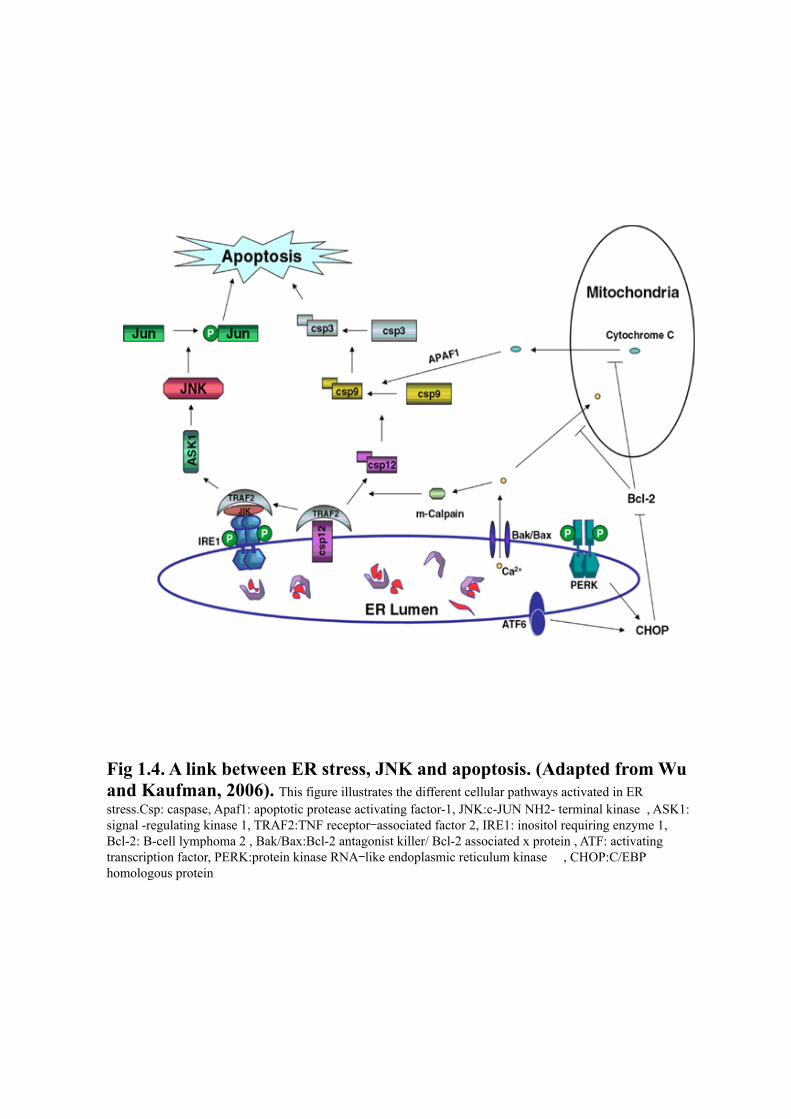
Fig 1.4. A link between ER stress, JNK and apoptosis. (Adapted from Wu and Kaufman, 2006). This figure illustrates the different cellular pathways activated in ER stress.Csp: caspase, Apaf1: apoptotic protease activating factor-1, JNK:c-JUN NH2- terminal kinase , ASK1: signal -regulating kinase 1, TRAF2:TNF receptor-associated factor 2, IRE1: inositol requiring enzyme 1, Bcl-2: B-cell lymphoma 2 , Bak/Bax:Bcl-2 antagonist killer/ Bcl-2 associated x protein , ATF: activating transcription factor, PERK:protein kinase RNA-like endoplasmic reticulum kinase' , CHOP:C/EBP homologous protein
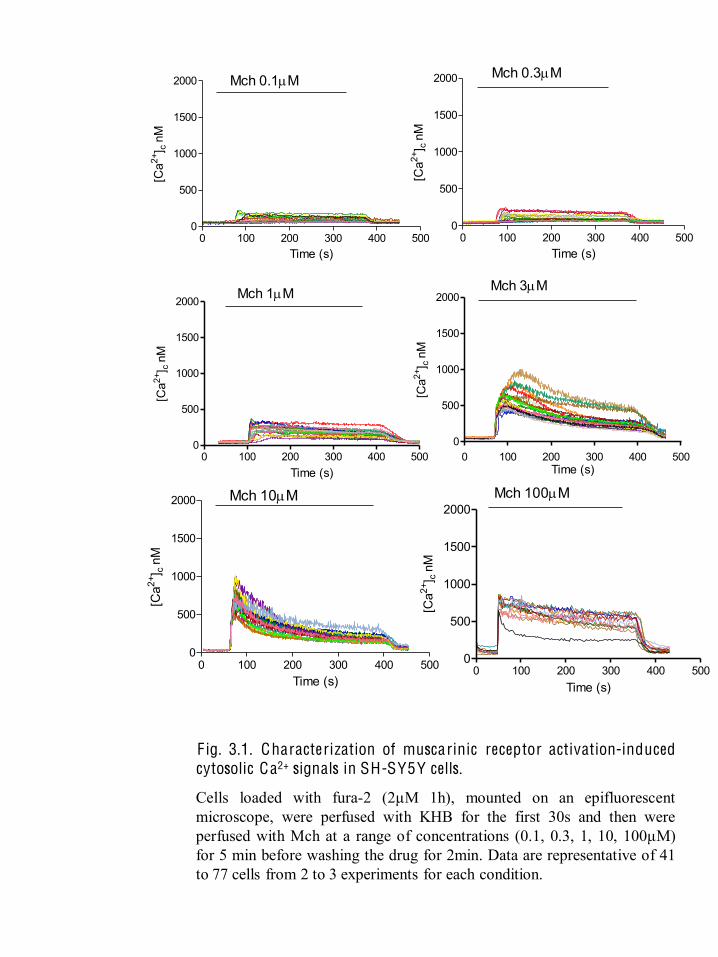
F ig. 3.1. Characterization of muscarinic receptor activation-induced cytosolic Ca2+ signals in SH-SY5Y cells.
Cells loaded with fura-2 (2µM 1h), mounted on an epifluorescent microscope, were perfused with KHB for the first 30s and then were perfused with Mch at a range of concentrations (0.1, 0.3, 1, 10, 100µM) for 5 min before washing the drug for 2min. Data are representative of 41 to 77 cells from 2 to 3 experiments for each condition.
0 100 200 300 400 5000
500
1000
1500
2000Mch 100 M
Time (s)
[Ca2+
] cnM
0 100 200 300 400 5000
500
1000
1500
2000 Mch 10 M
Time (s)
[Ca2+
] cnM
0 100 200 300 400 5000
500
1000
1500
2000Mch 3 M
Time (s)
[Ca2+
] cnM
0 100 200 300 400 5000
500
1000
1500
2000 Mch 1 M
Time (s)
[Ca2+
] cnM
0 100 200 300 400 5000
500
1000
1500
2000 Mch 0.3 M
Time (s)
[Ca2+
] cnM
0 100 200 300 400 5000
500
1000
1500
2000 Mch 0.1 M
Time (s)
[Ca2+
] cnM
0 25 50 75 100 125 150 175 2000
50
100
150
200
250
300
350 485
405
Mch 100 M
Time (s)
Fluo
resc
ence
0 25 50 75 100 125 150 175 2000
1
2
3
4
5485/405Mch 100 M
Time (s)
485/
405
A B
C D
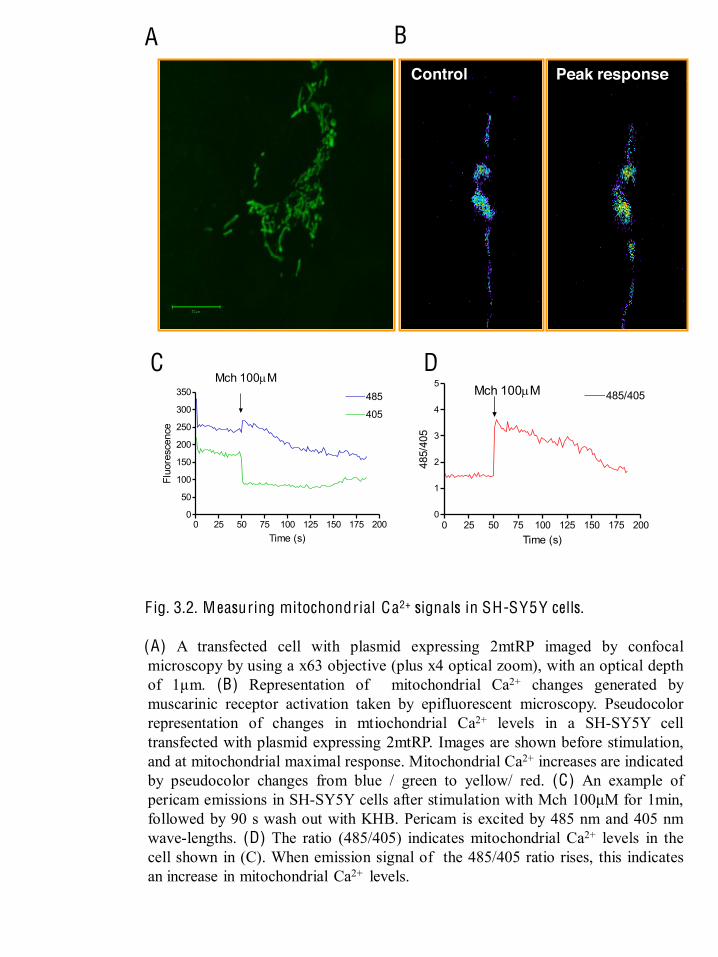
F ig. 3.2. M easuring mitochondrial Ca2+ signals in SH-SY5Y cells. (A) A transfected cell with plasmid expressing 2mtRP imaged by confocal
microscopy by using a x63 objective (plus x4 optical zoom), with an optical depth of 1µm. (B) Representation of mitochondrial Ca2+ changes generated by muscarinic receptor activation taken by epifluorescent microscopy. Pseudocolor representation of changes in mtiochondrial Ca2+ levels in a SH-SY5Y cell transfected with plasmid expressing 2mtRP. Images are shown before stimulation, and at mitochondrial maximal response. Mitochondrial Ca2+ increases are indicated by pseudocolor changes from blue / green to yellow/ red. (C) An example of pericam emissions in SH-SY5Y cells after stimulation with Mch 100 M for 1min, followed by 90 s wash out with KHB. Pericam is excited by 485 nm and 405 nm wave-lengths. (D) The ratio (485/405) indicates mitochondrial Ca2+ levels in the cell shown in (C). When emission signal of the 485/405 ratio rises, this indicates an increase in mitochondrial Ca2+ levels.
Control Peak response
-8 -7 -6 -5 -4 -30
1
2
0.0
0.5
1.0
1.5
Log [Mch]
[Ca2+
] mt (
485/
405)
[Ca
2+]cyt (340/380)
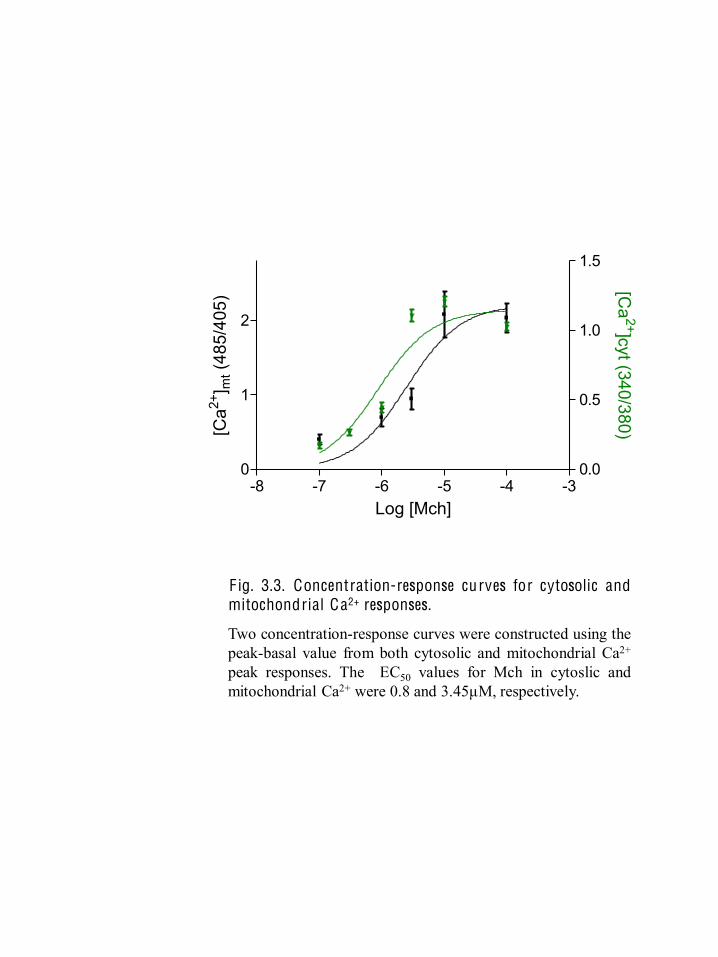
F ig. 3.3. Concentration-response curves for cytosolic and mitochondrial Ca2+ responses.
Two concentration-response curves were constructed using the peak-basal value from both cytosolic and mitochondrial Ca2+ peak responses. The EC50 values for Mch in cytoslic and mitochondrial Ca2+ were 0.8 and 3.45µM, respectively.
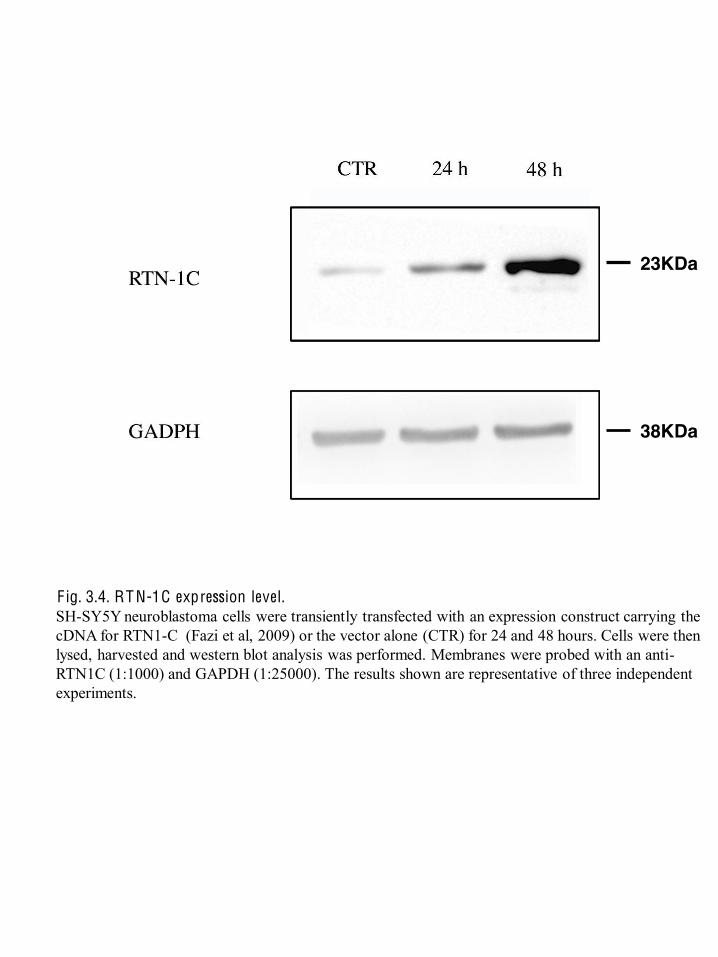
F ig. 3.4. RT N-1C expression level. SH-SY5Y neuroblastoma cells were transiently transfected with an expression construct carrying the cDNA for RTN1-C (Fazi et al, 2009) or the vector alone (CTR) for 24 and 48 hours. Cells were then lysed, harvested and western blot analysis was performed. Membranes were probed with an anti-RTN1C (1:1000) and GAPDH (1:25000). The results shown are representative of three independent experiments.
23KDa
38KDa
peak
- ba
sal
0
2
4
6
8CtrlRTN-1C
*
peak
- ba
sal
0150300450600750900
CtrlRTN-1C
*
0 100 200 300 400 500 6000
150
300
450
600
750
900 Mch 10 M CtrlRTN-1C
time (s)
[C
a2+] cy
t nM
0 100 200 300 400 500 6000
2
4
6
8 Mch 10 MRTN-1CCtrl
time (s)
Mito
Ca2+
(485
/405
) rat
io u
nits
A
C
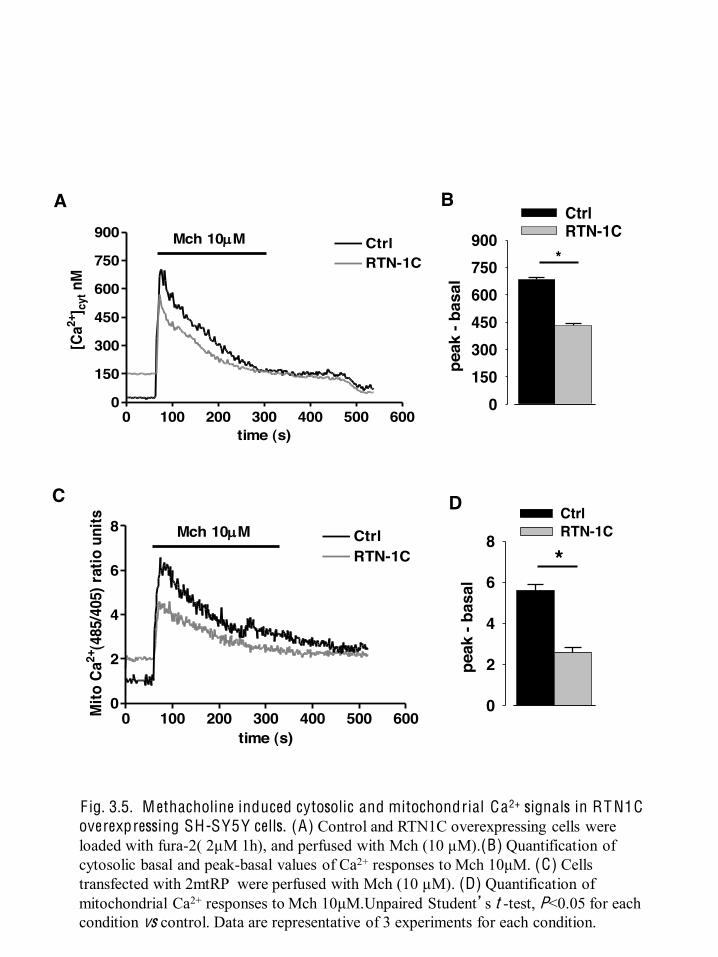
F ig. 3.5. M ethacholine induced cytosolic and mitochondrial Ca2+ signals in RT N1C overexpressing SH-SY5Y cells. (A) Control and RTN1C overexpressing cells were loaded with fura-2( 2µM 1h), and perfused with Mch (10 µM).(B) Quantification of cytosolic basal and peak-basal values of Ca2+ responses to Mch 10 M. (C) Cells transfected with 2mtRP were perfused with Mch (10 µM). (D) Quantification of mitochondrial Ca2+ responses to Mch 10 M.Unpaired Student’s t -test, P<0.05 for each condition vs control. Data are representative of 3 experiments for each condition.
B
D
0 100 200 3000
300
600
900
1200
KHB-Ca2+ free
KHB-Ca2+ 1mM
Time (s)
[C
a2+] c
nM
0 100 200 3000
300
600
900
1200
KHB-Ca2+ 1.8mM
KHB-Ca2+ free
Time (s)
[Ca2+
]cyt
o nM
0 100 200 3000
300
600
900
1200
KHB-Ca2+ 2.5 mM
KHB-Ca2+ free
Time (s)
[Ca2+
] cyto
nM
0 100 200 3000
300
600
900
1200
KHB-Ca2+ 4mM
KHB-free Ca2+
Time (s)
[Ca2+
]c n
M
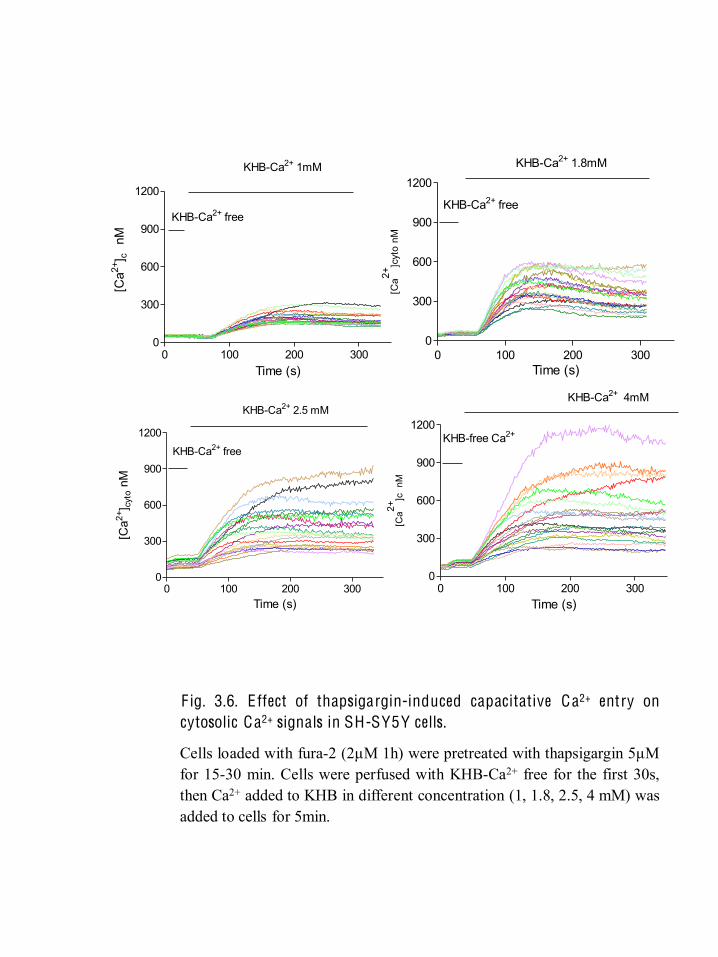
F ig. 3.6. E ffect of thapsigargin-induced capacitative Ca2+ entry on cytosolic Ca2+ signals in SH-SY5Y cells.
Cells loaded with fura-2 (2µM 1h) were pretreated with thapsigargin 5µM for 15-30 min. Cells were perfused with KHB-Ca2+ free for the first 30s, then Ca2+ added to KHB in different concentration (1, 1.8, 2.5, 4 mM) was added to cells for 5min.
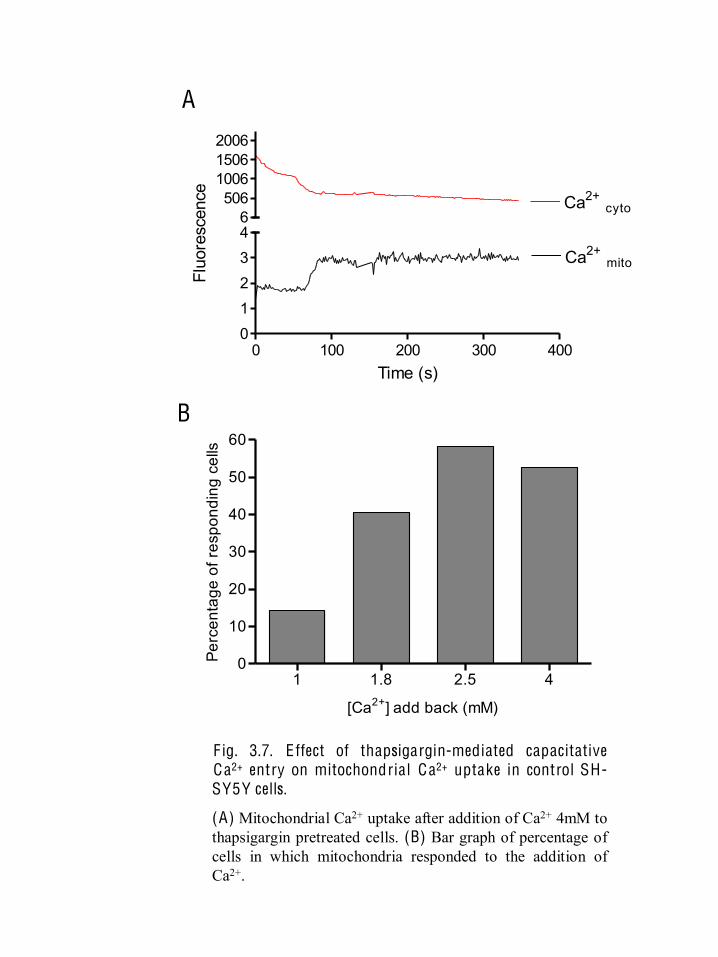
F ig. 3.7. E ffect of thapsigargin-mediated capacitative Ca2+ entry on mitochondrial Ca2+ uptake in control SH-SY5Y cells.
(A) Mitochondrial Ca2+ uptake after addition of Ca2+ 4mM to thapsigargin pretreated cells. (B) Bar graph of percentage of cells in which mitochondria responded to the addition of Ca2+.
0 100 200 300 40001234
Ca2+cyto
Ca2+mito
6506
100615062006
Time (s)
Fluo
resc
ence
1 1.8 2.5 40
10
20
30
40
50
60
[Ca2+] add back (mM)
Perc
enta
ge o
f res
pond
ing
cells
A
B
peak
- ba
sal
0
3
6
9 CtrlRTN-1C
*
peak
- ba
sal
0
150
300
450
600 CtrlRTN-1C
*
A
C
0 100 200 300 4000
100
200
300
400
500
600
2.5mM Ca2+ add back
RTN-1CCtrl
time (s)
[
Ca2+
] cytn
M
0 100 200 300 400 500 6000.0
1.5
3.0
4.5
6.0
7.5
9.0
RTN-1CCtrl2.5mM Ca2+ add back
time (s)
Mito
Ca2+
(485
/405
) rat
io u
nits
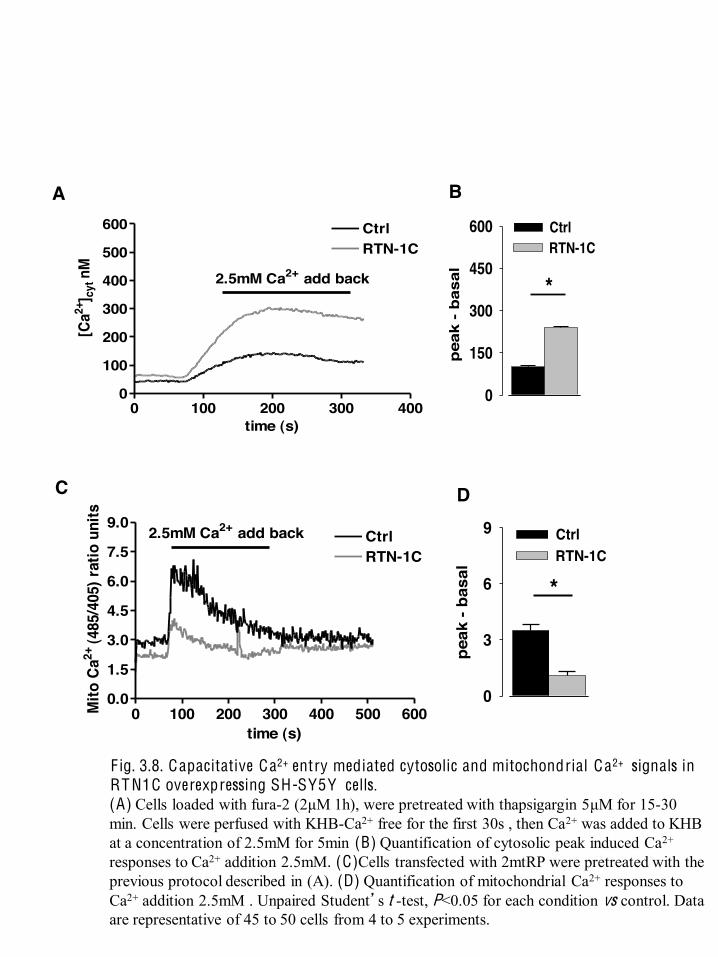
F ig. 3.8. Capacitative Ca2+ entry mediated cytosolic and mitochondrial Ca2+ signals in RT N1C overexpressing SH-SY5Y cells. (A) Cells loaded with fura-2 (2 M 1h), were pretreated with thapsigargin 5 M for 15-30 min. Cells were perfused with KHB-Ca2+ free for the first 30s , then Ca2+ was added to KHB at a concentration of 2.5mM for 5min (B) Quantification of cytosolic peak induced Ca2+ responses to Ca2+ addition 2.5mM. (C)Cells transfected with 2mtRP were pretreated with the previous protocol described in (A). (D) Quantification of mitochondrial Ca2+ responses to Ca2+ addition 2.5mM . Unpaired Student’s t -test, P<0.05 for each condition vs control. Data are representative of 45 to 50 cells from 4 to 5 experiments.
B
D
0
100
200
300
400
Mito
Are
a (
m2 )
CtrlRTN-1C
48h 96h
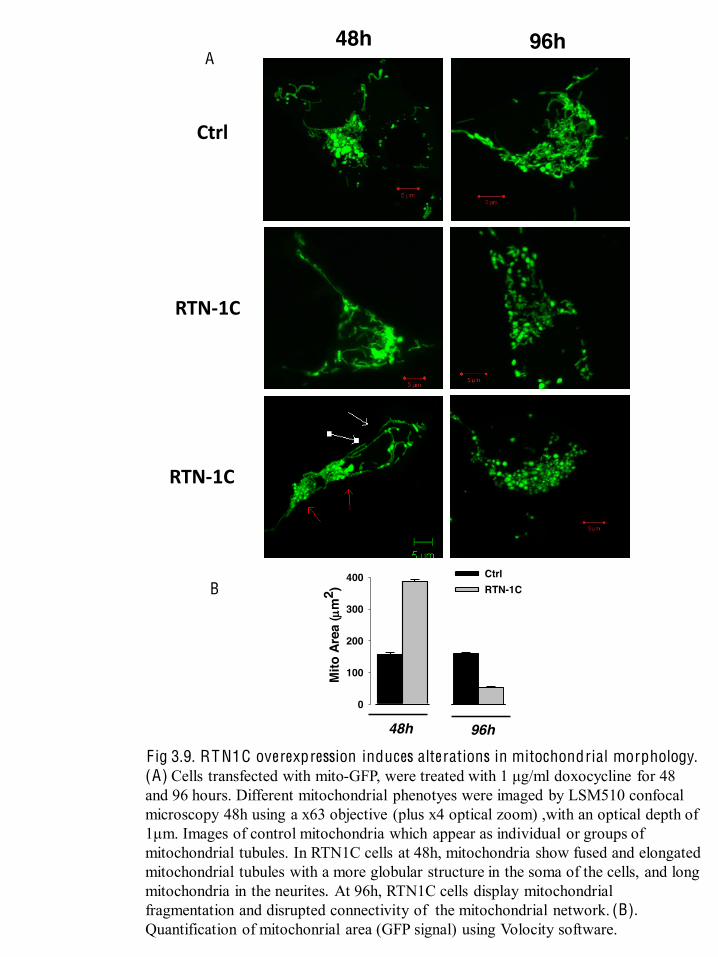
F ig 3.9. RT N1C overexpression induces alterations in mitochondrial morphology. (A) Cells transfected with mito-GFP, were treated with and 96 hours. Different mitochondrial phenotyes were imaged by LSM510 confocal microscopy 48h using a x63 objective (plus x4 optical zoom) ,with an optical depth of 1µm. Images of control mitochondria which appear as individual or groups of mitochondrial tubules. In RTN1C cells at 48h, mitochondria show fused and elongated mitochondrial tubules with a more globular structure in the soma of the cells, and long mitochondria in the neurites. At 96h, RTN1C cells display mitochondrial fragmentation and disrupted connectivity of the mitochondrial network. (B). Quantification of mitochonrial area (GFP signal) using Volocity software.
B
Drp-1
B
48h 96h
Ctrl
RTN-‐1C
RTN-‐1C
A
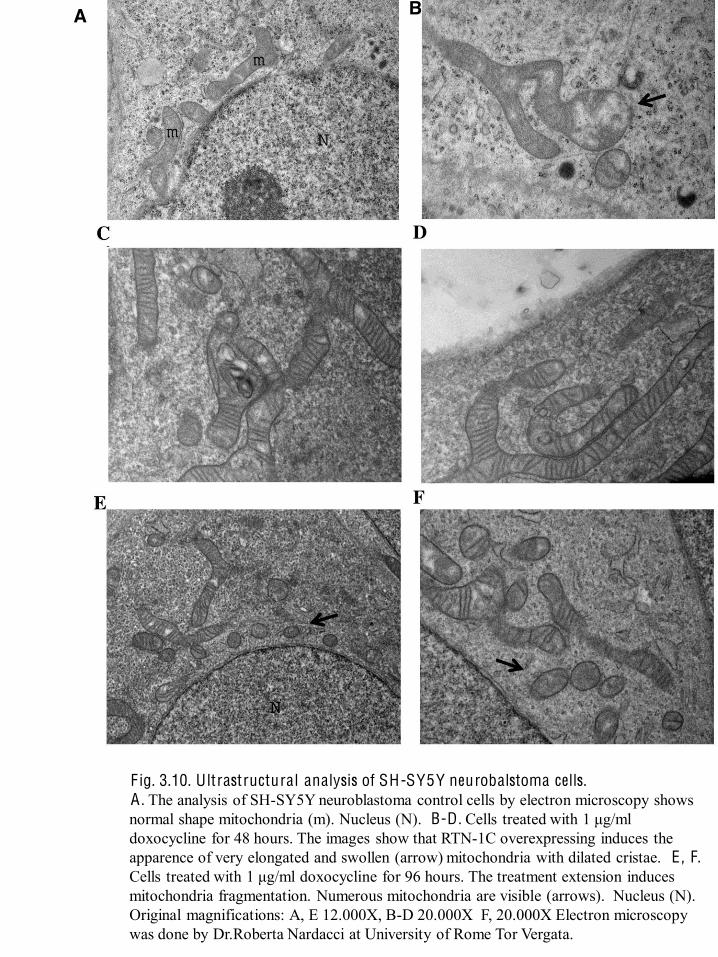
F ig. 3.10. Ultrastructural analysis of SH-SY5Y neurobalstoma cells. A . The analysis of SH-SY5Y neuroblastoma control cells by electron microscopy shows normal shape mitochondria (m). Nucleus (N). B-D . Cells treated with doxocycline for 48 hours. The images show that RTN-1C overexpressing induces the apparence of very elongated and swollen (arrow) mitochondria with dilated cristae. E , F. Cells treated with The treatment extension induces mitochondria fragmentation. Numerous mitochondria are visible (arrows). Nucleus (N). Original magnifications: A, E 12.000X, B-D 20.000X F, 20.000X Electron microscopy was done by Dr.Roberta Nardacci at University of Rome Tor Vergata.
A B
FIS1 DNML1 MFN1 MFN2
norm
mRN
A ex
pres
sion
0
2
4
6
8 24 h48 h72 h96 h
Fission Fusion
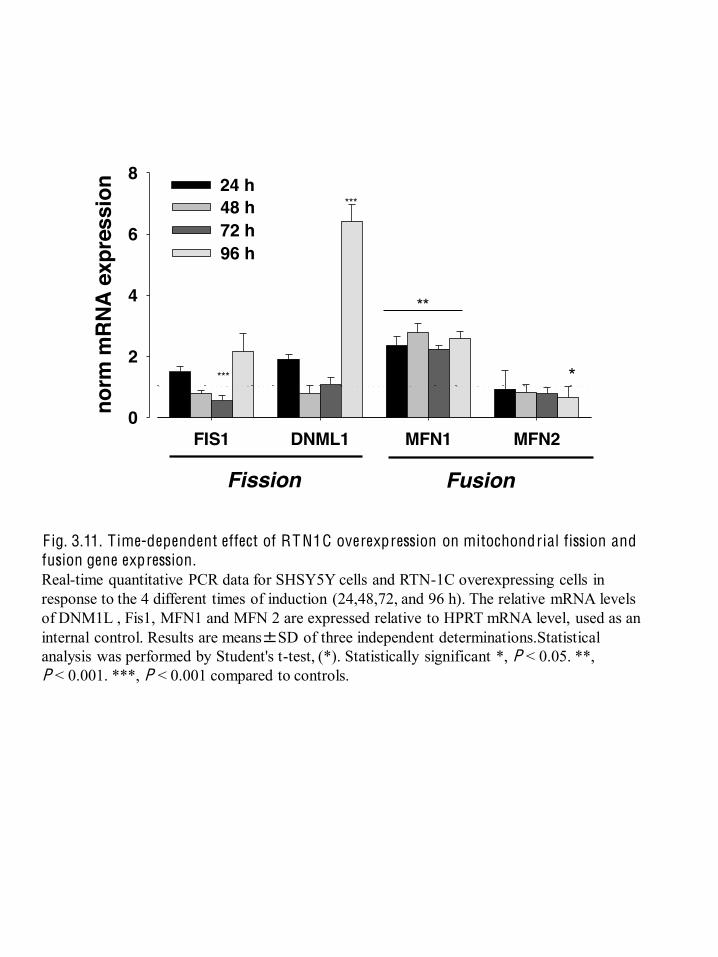
F ig. 3.11. Time-dependent effect of RT N1C overexpression on mitochondrial fission and fusion gene expression. Real-time quantitative PCR data for SHSY5Y cells and RTN-1C overexpressing cells in response to the 4 different times of induction (24,48,72, and 96 h). The relative mRNA levels of DNM1L , Fis1, MFN1 and MFN 2 are expressed relative to HPRT mRNA level, used as an internal control. Results are means±SD of three independent determinations.Statistical analysis was performed by Student's t-test, (*). Statistically significant *, P < 0.05. **, P < 0.001. ***, P < 0.001 compared to controls.
***
***
**
*
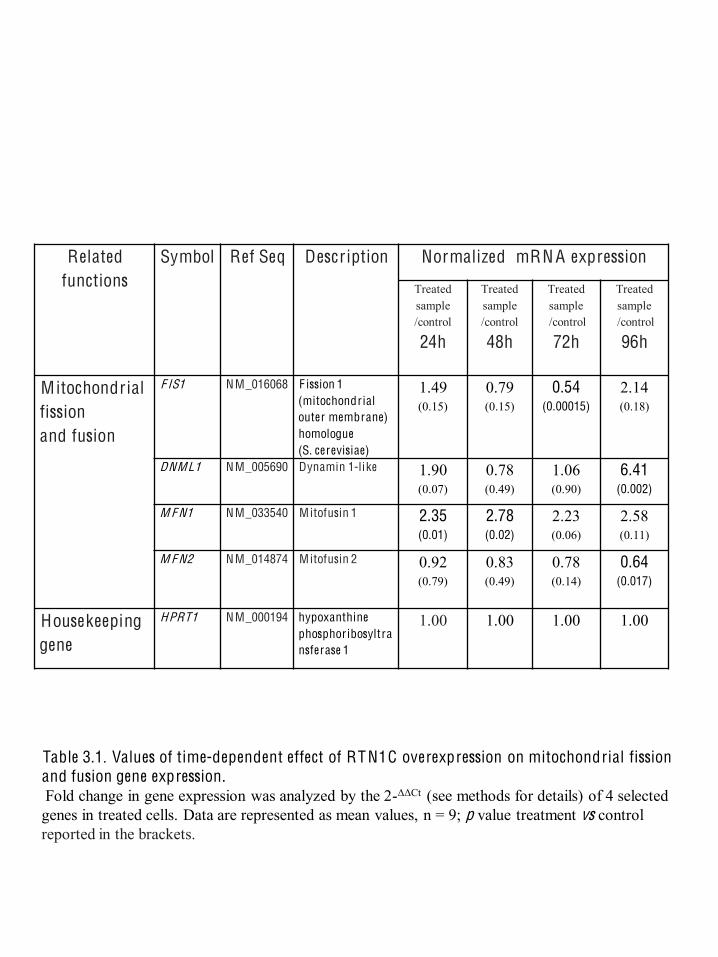
Related functions
Symbol Ref Seq Descr iption Normalized mRN A expression
Treated sample /control
24h
Treated sample /control
48h
Treated sample /control
72h
Treated sample /control
96h
Mitochondrial fission and fusion
F IS1 N M_016068 F ission 1 (mitochondrial outer membrane) homologue (S. cerevisiae)
1.49 (0.15)
0.79 (0.15)
0.54 (0.00015)
2.14 (0.18)
D N M L1 N M_005690 Dynamin 1-like 1.90 (0.07)
0.78 (0.49)
1.06 (0.90)
6.41 (0.002)
M F N1 N M_033540 Mitofusin 1 2.35 (0.01)
2.78 (0.02)
2.23 (0.06)
2.58 (0.11)
M F N2 N M_014874 Mitofusin 2 0.92 (0.79)
0.83 (0.49)
0.78 (0.14)
0.64 (0.017)
Housekeeping gene
H PRT1 N M_000194 hypoxanthine phosphoribosyltransferase 1
1.00 1.00 1.00 1.00
Table 3.1. Values of time-dependent effect of RT N1C overexpression on mitochondrial fission and fusion gene expression. Fold change in gene expression was analyzed by the 2- Ct (see methods for details) of 4 selected genes in treated cells. Data are represented as mean values, n = 9; p value treatment vs control reported in the brackets.
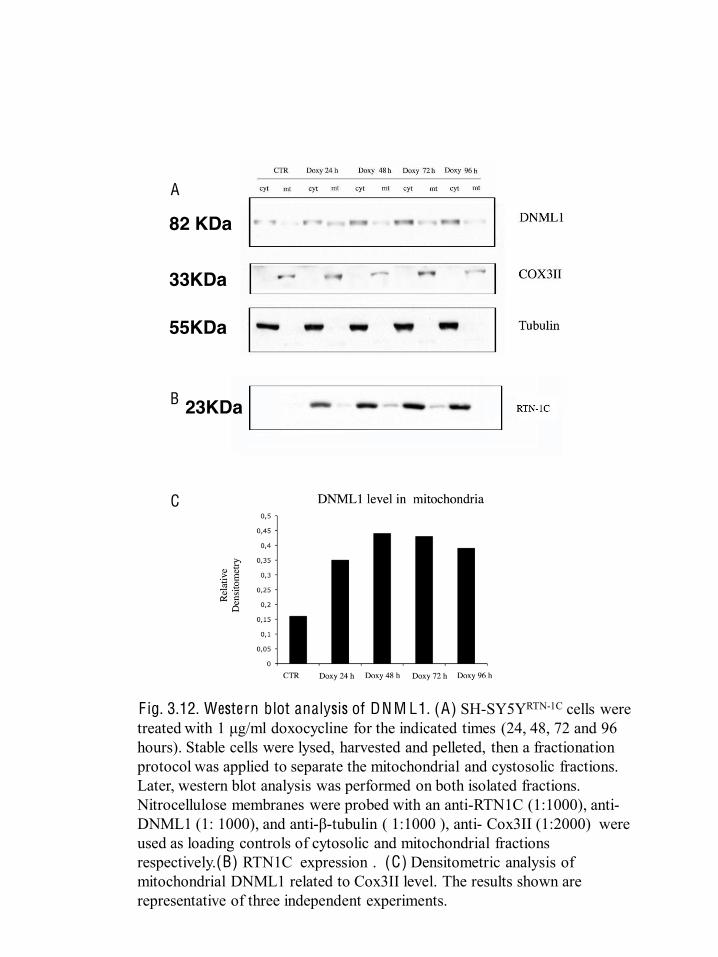
Fig. 3.12. Western blot analysis of DN M L1. (A) SH-SY5YRTN-1C cells were treated with hours). Stable cells were lysed, harvested and pelleted, then a fractionation protocol was applied to separate the mitochondrial and cystosolic fractions. Later, western blot analysis was performed on both isolated fractions. Nitrocellulose membranes were probed with an anti-RTN1C (1:1000), anti-DNML1 (1: 1000), and anti- -tubulin ( 1:1000 ), anti- Cox3II (1:2000) were used as loading controls of cytosolic and mitochondrial fractions respectively.(B) RTN1C expression . (C) Densitometric analysis of mitochondrial DNML1 related to Cox3II level. The results shown are representative of three independent experiments.
A
B
C
82 KDa
55KDa
33KDa
23KDa
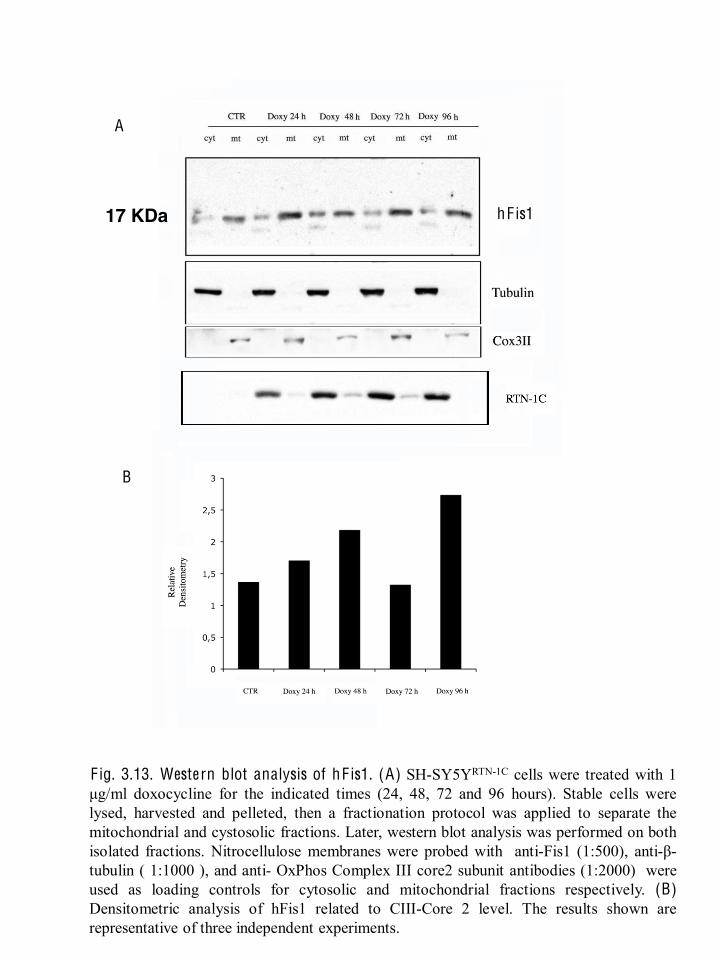
F ig. 3.13. Western blot analysis of hF is1. (A) SH-SY5YRTN-1C cells were treated with 1 doxocycline for the indicated times (24, 48, 72 and 96 hours). Stable cells were
lysed, harvested and pelleted, then a fractionation protocol was applied to separate the mitochondrial and cystosolic fractions. Later, western blot analysis was performed on both isolated fractions. Nitrocellulose membranes were probed with anti-Fis1 (1:500), anti- -tubulin ( 1:1000 ), and anti- OxPhos Complex III core2 subunit antibodies (1:2000) were used as loading controls for cytosolic and mitochondrial fractions respectively. (B) Densitometric analysis of hFis1 related to CIII-Core 2 level. The results shown are representative of three independent experiments.
A
B
hF is1 17 KDa
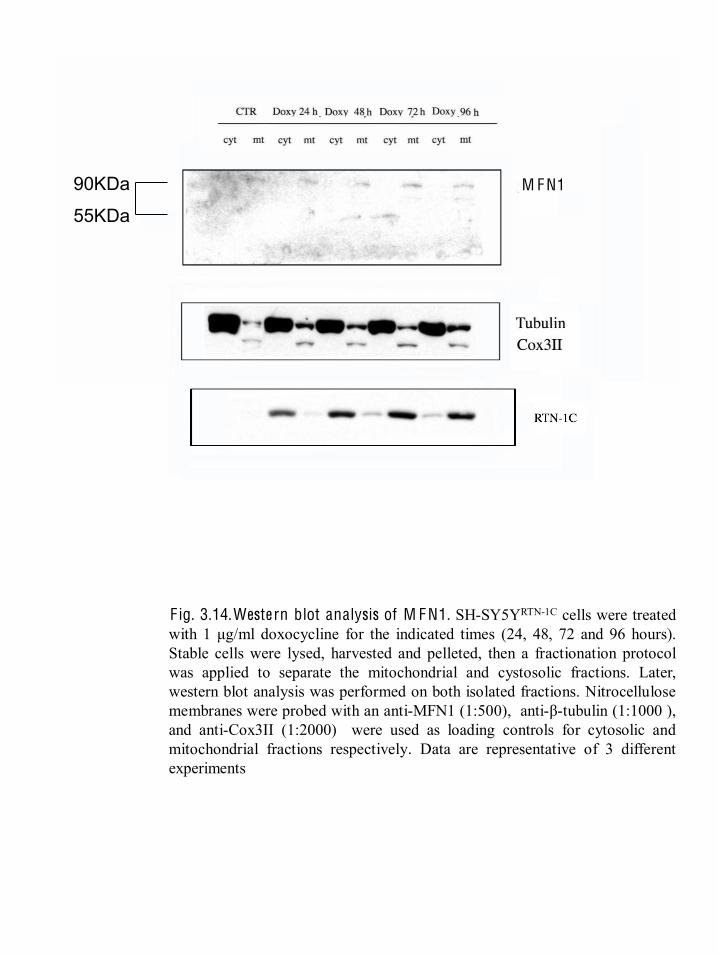
F ig. 3.14. Western blot analysis of M F N1. SH-SY5YRTN-1C cells were treated with 1 doxocycline for the indicated times (24, 48, 72 and 96 hours). Stable cells were lysed, harvested and pelleted, then a fractionation protocol was applied to separate the mitochondrial and cystosolic fractions. Later, western blot analysis was performed on both isolated fractions. Nitrocellulose membranes were probed with an anti-MFN1 (1:500), anti- -tubulin (1:1000 ), and anti-Cox3II (1:2000) were used as loading controls for cytosolic and mitochondrial fractions respectively. Data are representative of 3 different experiments
M F N1 90KDa
55KDa
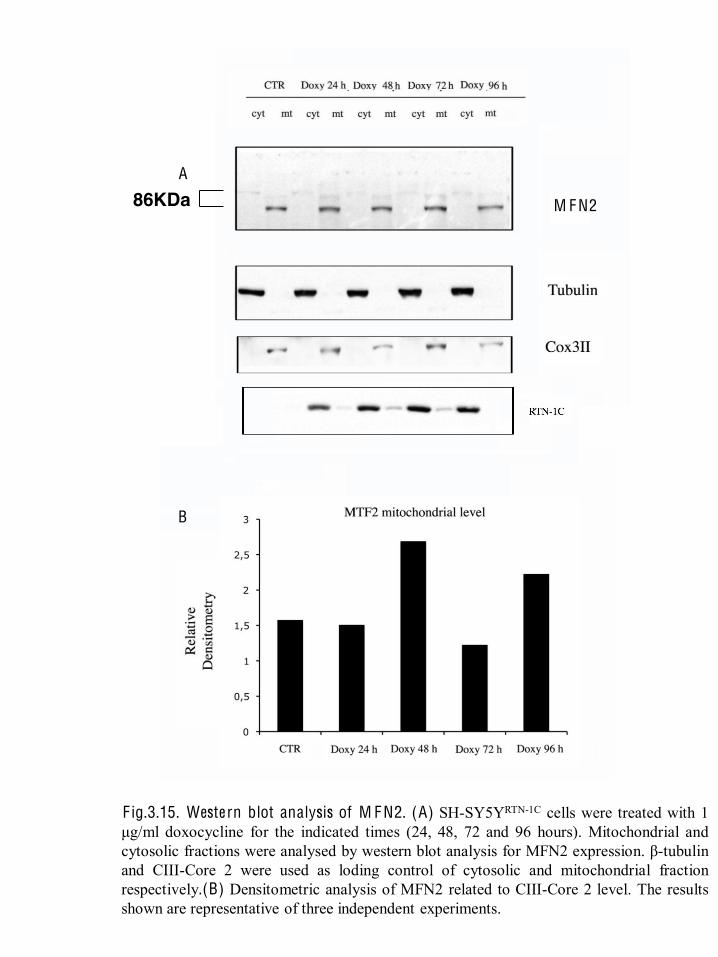
F ig.3.15. Western blot analysis of M F N2. (A) SH-SY5YRTN-1C cells were treated with 1 doxocycline for the indicated times (24, 48, 72 and 96 hours). Mitochondrial and
cytosolic fractions were analysed by western blot analysis for MFN2 expression. -tubulin and CIII-Core 2 were used as loding control of cytosolic and mitochondrial fraction respectively.(B) Densitometric analysis of MFN2 related to CIII-Core 2 level. The results shown are representative of three independent experiments.
A
B
M F N2 86KDa

control RTN1C0.000.050.100.150.200.250.300.350.400.45
***
***
LC3G
FP s
igna
l dis
trib
utio
n (S
D/M
ean)
F ig. 4.1. RT N1C overexpression induces autophagy. SH-SY5Y cells co-transfected with RTN-1C and LC3-GFP for 48h, were analyzed by LSM510 confocal microscopy using a x63 objective (plus x4 optical zoom) ,with an optical depth of 1µm. A .1 shows normal distribution of LC3GFP signal in control cell. A .2 Autophagosome formation appearing as puncta or green dots. (B) Quantification of autophagy in RTN1C cells compared to control. Mean of LC3GPP signal measurements suggest that RTN1C overexpression at 48h induces significant autophagy of which the mean of (SD/ mean) values was (0.40 ± 0.02). Data are representative of 33 cells, compared to control cells which displayed a mean of (0.27 ± 0.01) obtained from 28 cells from 3 experiments for each condition.
A .1
B
A .2
Tubulin
L C3I
C T R ST V 48h
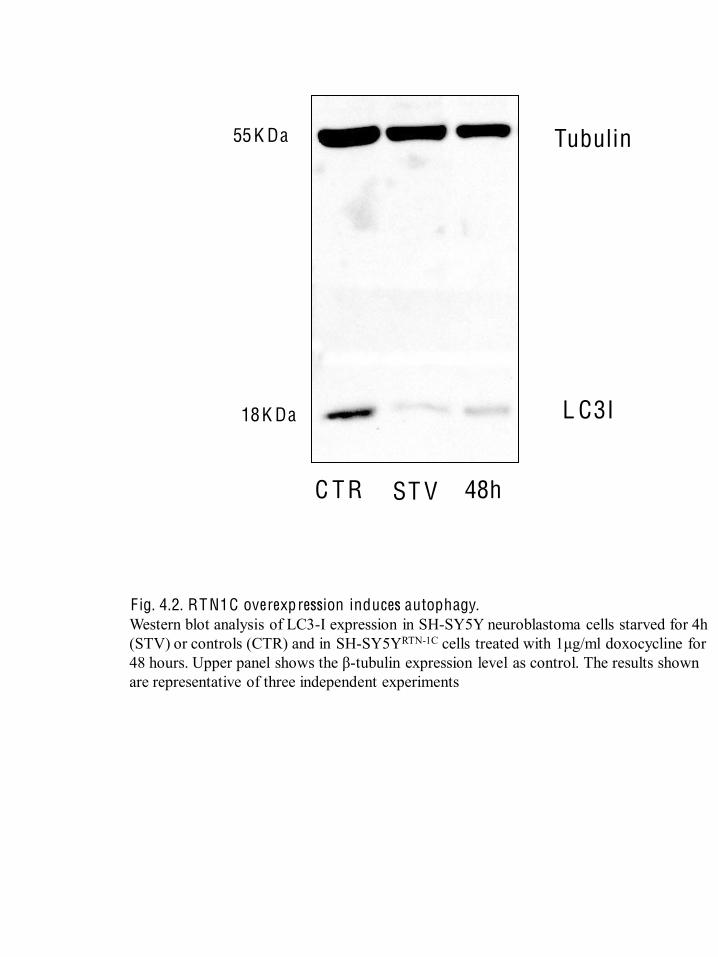
Fig. 4.2. RT N1C overexpression induces autophagy. Western blot analysis of LC3-I expression in SH-SY5Y neuroblastoma cells starved for 4h (STV) or controls (CTR) and in SH-SY5YRTN-1C cells treated with 1 g/ml doxocycline for 48 hours. -tubulin expression level as control. The results shown are representative of three independent experiments
18K Da
55K Da
RTN-1C 24 h RTN-1C 48 h
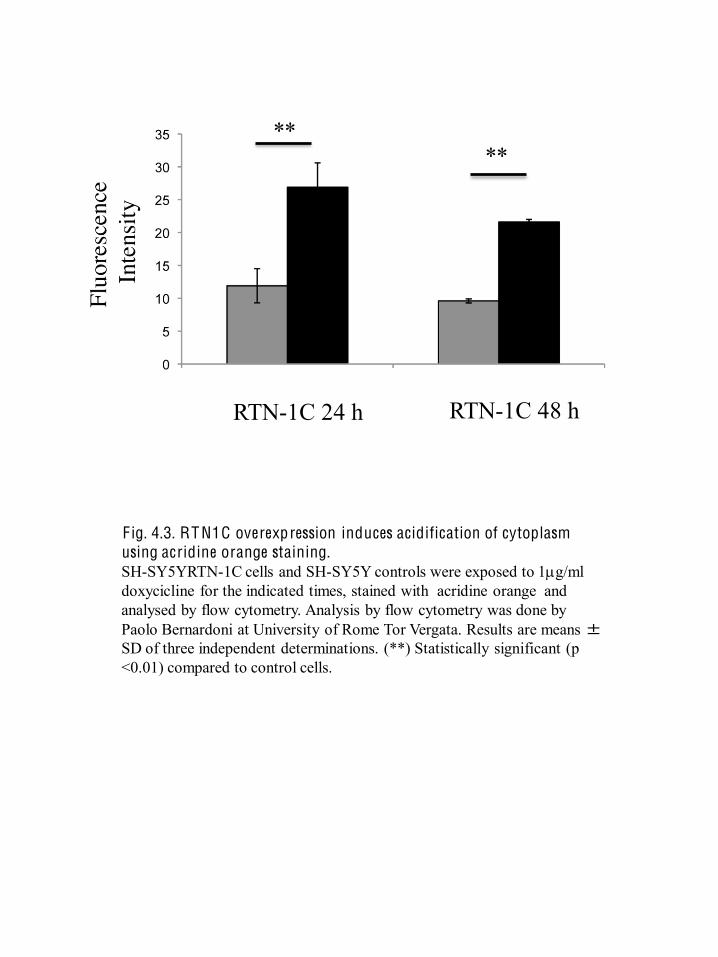
F ig. 4.3. RT N1C overexpression induces acidification of cytoplasm using acridine orange staining. SH-SY5YRTN-1C cells and SH-SY5Y controls were exposed to 1 g/ml doxycicline for the indicated times, stained with acridine orange and analysed by flow cytometry. Analysis by flow cytometry was done by Paolo Bernardoni at University of Rome Tor Vergata. Results are means ± SD of three independent determinations. (**) Statistically significant (p <0.01) compared to control cells.
** **
0.0
0.1
0.2
0.3
0.4 **
Ctrl
RTN-1C
Pre-BAPTA Post-BAPTA
Mea
n of
LC
3-G
FP s
igna
l( M
ean/
SD) v
alue
s
F ig. 4.4. RT N1C-induced autophagy is Ca2+ dependent.
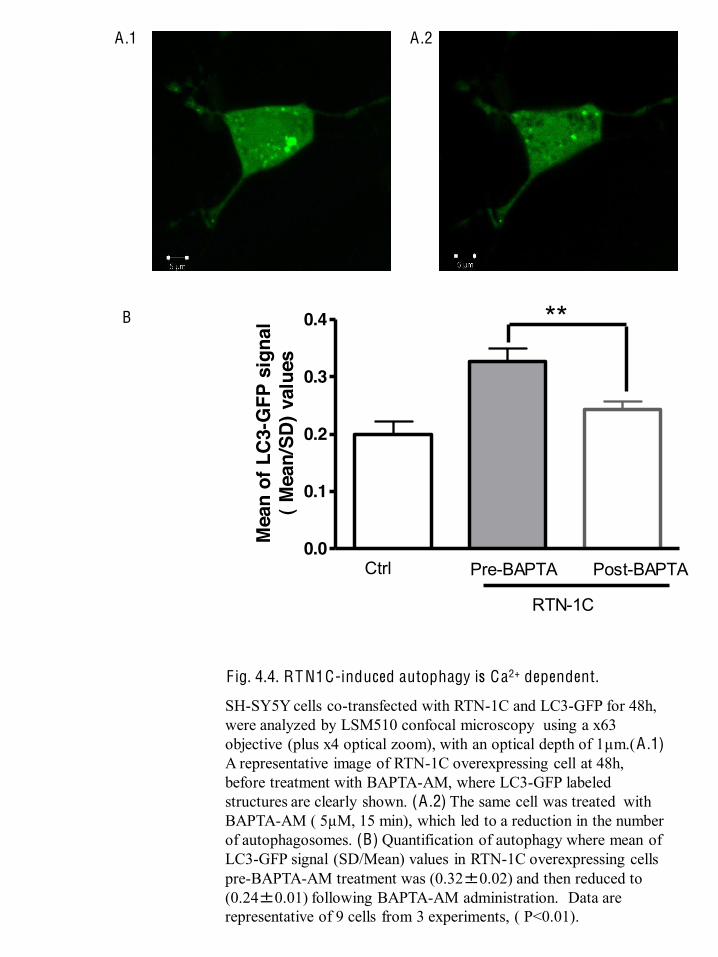
SH-SY5Y cells co-transfected with RTN-1C and LC3-GFP for 48h, were analyzed by LSM510 confocal microscopy using a x63 objective (plus x4 optical zoom), with an optical depth of 1µm.(A .1) A representative image of RTN-1C overexpressing cell at 48h, before treatment with BAPTA-AM, where LC3-GFP labeled structures are clearly shown. (A .2) The same cell was treated with BAPTA-AM ( 5µM, 15 min), which led to a reduction in the number of autophagosomes. (B) Quantification of autophagy where mean of LC3-GFP signal (SD/Mean) values in RTN-1C overexpressing cells pre-BAPTA-AM treatment was (0.32±0.02) and then reduced to (0.24±0.01) following BAPTA-AM administration. Data are representative of 9 cells from 3 experiments, ( P<0.01).
A .1 A .2
B
LC3I
GAPDH
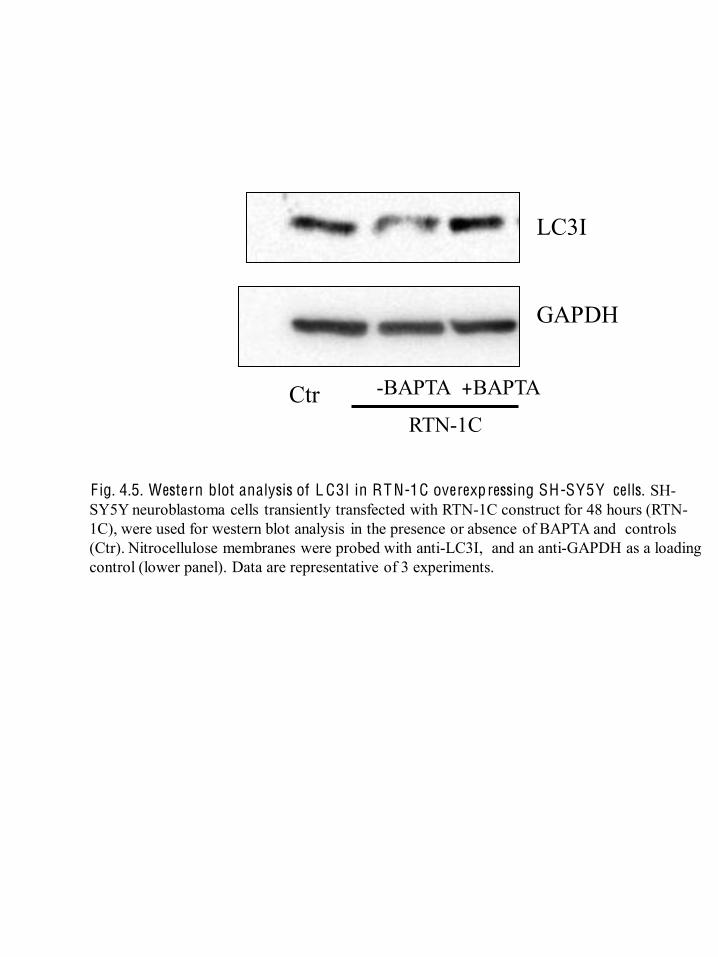
Fig. 4.5. Western blot analysis of L C3I in RT N-1C overexpressing SH-SY5Y cells. SH-SY5Y neuroblastoma cells transiently transfected with RTN-1C construct for 48 hours (RTN-1C), were used for western blot analysis in the presence or absence of BAPTA and controls (Ctr). Nitrocellulose membranes were probed with anti-LC3I, and an anti-GAPDH as a loading control (lower panel). Data are representative of 3 experiments.
RTN-1C
-BAPTA +BAPTA Ctr
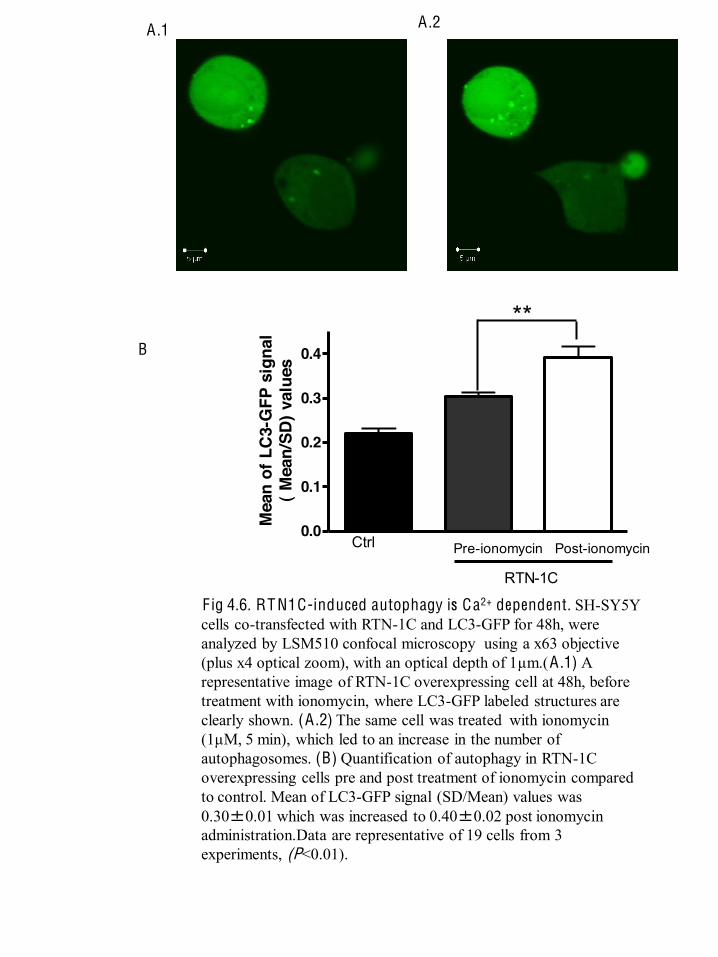
Fig 4.6. RT N1C-induced autophagy is Ca2+ dependent. SH-SY5Y cells co-transfected with RTN-1C and LC3-GFP for 48h, were analyzed by LSM510 confocal microscopy using a x63 objective (plus x4 optical zoom), with an optical depth of 1µm.(A .1) A representative image of RTN-1C overexpressing cell at 48h, before treatment with ionomycin, where LC3-GFP labeled structures are clearly shown. (A .2) The same cell was treated with ionomycin (1µM, 5 min), which led to an increase in the number of autophagosomes. (B) Quantification of autophagy in RTN-1C overexpressing cells pre and post treatment of ionomycin compared to control. Mean of LC3-GFP signal (SD/Mean) values was 0.30±0.01 which was increased to 0.40±0.02 post ionomycin administration.Data are representative of 19 cells from 3 experiments, (P<0.01).
A .2 A .1
0.0
0.1
0.2
0.3
0.4
**
Ctrl
RTN-1C
Pre-ionomycin Post-ionomycin
Mea
n of
LC
3-G
FP s
igna
l( M
ean/
SD) v
alue
s
B
A49
0
0
2
4
6
8
10
12 CtrlRTN-1C
24 h 48 h 72 h 96 h
** ***
**
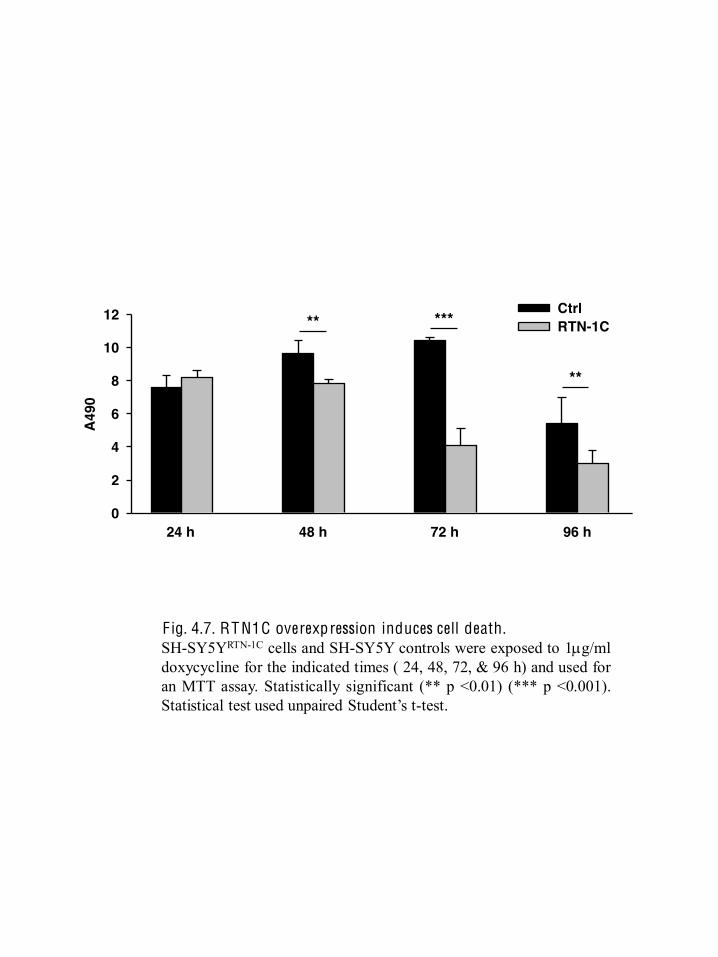
F ig. 4.7. RT N1C overexpression induces cell death. SH-SY5YRTN-1C cells and SH-SY5Y controls were exposed to 1 g/ml doxycycline for the indicated times ( 24, 48, 72, & 96 h) and used for an MTT assay. Statistically significant (** p <0.01) (*** p <0.001). Statistical test used unpaired t-test.
pJNK
JNK
actin
RTN-‐1C -‐ -‐ -‐ + + +
pJNK/JNK
(relative values)
JNK/actin
(relative values)
RTN-‐1C RTN-‐1C CTRL CTRL
* *
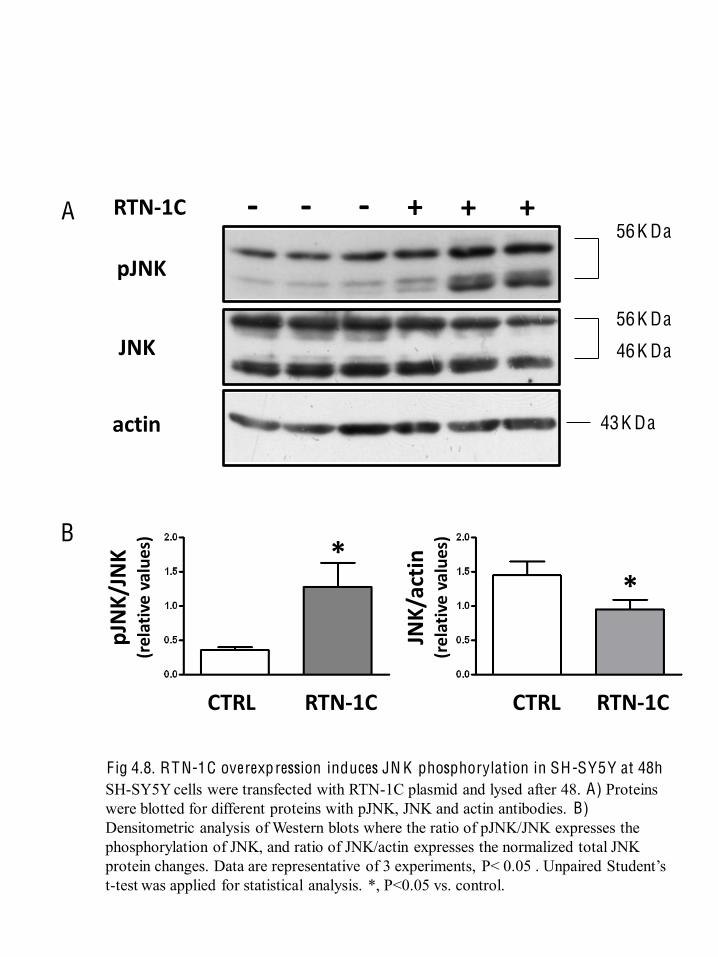
F ig 4.8. RT N-1C overexpression induces JN K phosphorylation in SH-SY5Y at 48h SH-SY5Y cells were transfected with RTN-1C plasmid and lysed after 48. A) Proteins were blotted for different proteins with pJNK, JNK and actin antibodies. B) Densitometric analysis of Western blots where the ratio of pJNK/JNK expresses the phosphorylation of JNK, and ratio of JNK/actin expresses the normalized total JNK protein changes. Data are representative of 3 experiments, t-test was applied for statistical analysis. *, P<0.05 vs. control.
A
B
56K Da
43K Da
56K Da
46K Da
pJNK
JNK
actin
RTN-‐1C -‐ -‐ -‐ + + + pJNK/JNK
(relative values)
RTN-‐1C
*
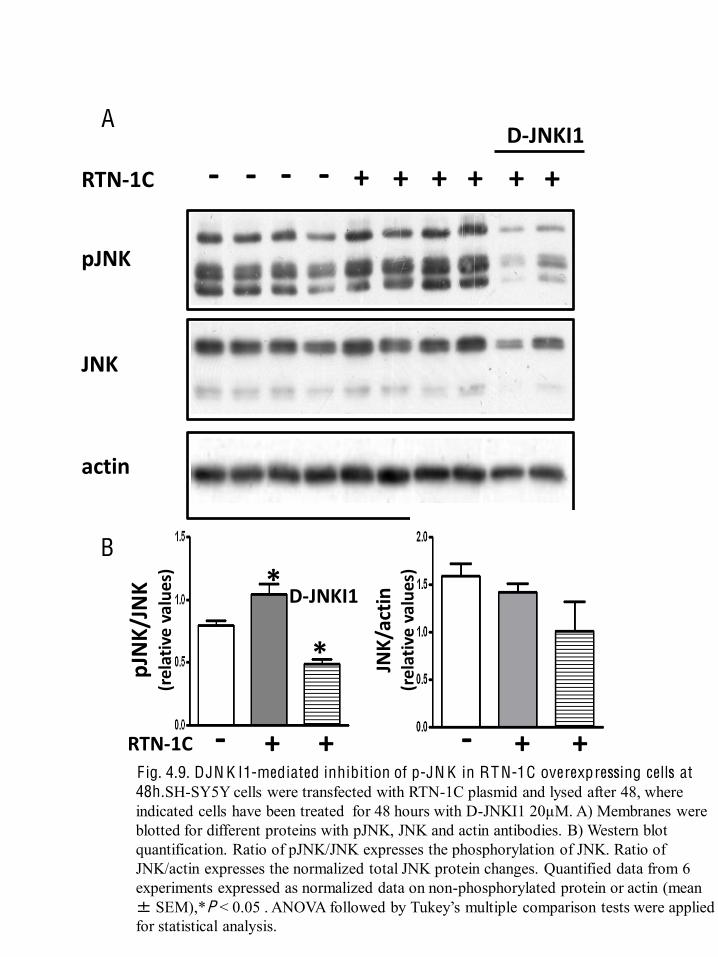
F ig. 4.9. DJN K I1-mediated inhibition of p-JN K in RT N-1C overexpressing cells at 48h.SH-SY5Y cells were transfected with RTN-1C plasmid and lysed after 48, where indicated cells have been treated for 48 hours with D-JNKI1 20µM. A) Membranes were blotted for different proteins with pJNK, JNK and actin antibodies. B) Western blot quantification. Ratio of pJNK/JNK expresses the phosphorylation of JNK. Ratio of JNK/actin expresses the normalized total JNK protein changes. Quantified data from 6 experiments expressed as normalized data on non-phosphorylated protein or actin (mean ± SEM),*P < for statistical analysis.
A
B
+ -‐ + + D-‐JNKI1
+ -‐ +
*
D-‐JNKI1
JNK/actin
(relative values)
+ -‐ +
*
RTN-1C
+ D-JN
KI
**
Ctrl
+ D-JN
KI
48 h 72 h 96 h
Cell
Viab
ility
(% o
f con
trol)
RTN-1C
+ D-JN
KICtrl
+ D-JN
KI
RTN-1C
+ D-JN
KICtrl
+ D-JN
KI
RTN-1C
+ D-JN
KICtrl
+ D-JN
KI
24 h
0
20
40
60
80
100
120** ***
**
***
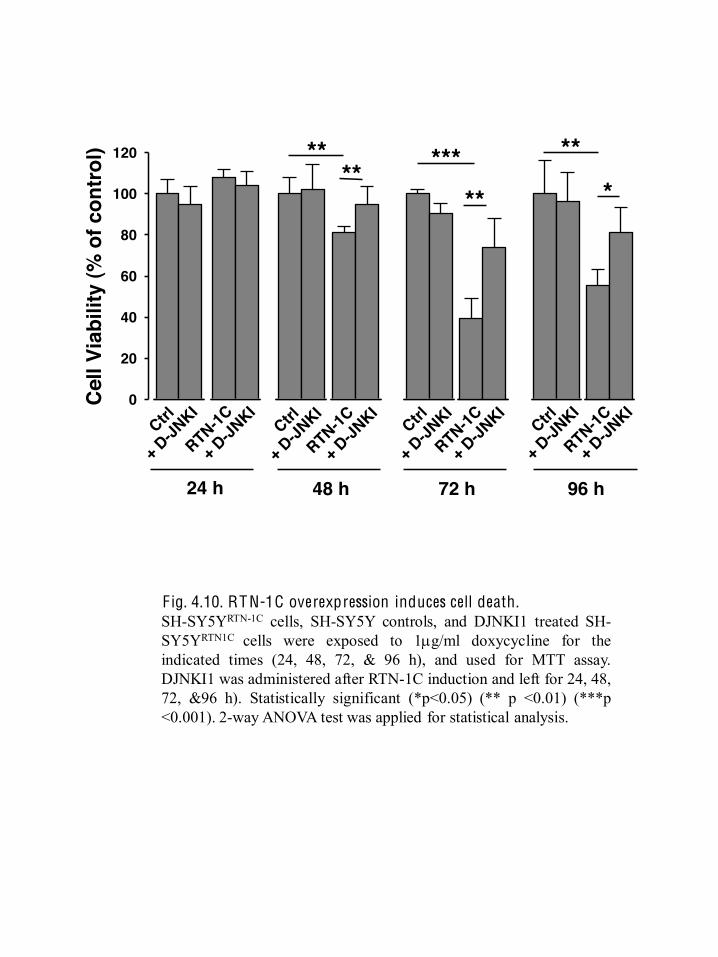
F ig. 4.10. RT N-1C overexpression induces cell death. SH-SY5YRTN-1C cells, SH-SY5Y controls, and DJNKI1 treated SH-SY5YRTN1C cells were exposed to 1 g/ml doxycycline for the indicated times (24, 48, 72, & 96 h), and used for MTT assay. DJNKI1 was administered after RTN-1C induction and left for 24, 48, 72, &96 h). Statistically significant (*p<0.05) (** p <0.01) (***p <0.001). 2-way ANOVA test was applied for statistical analysis.
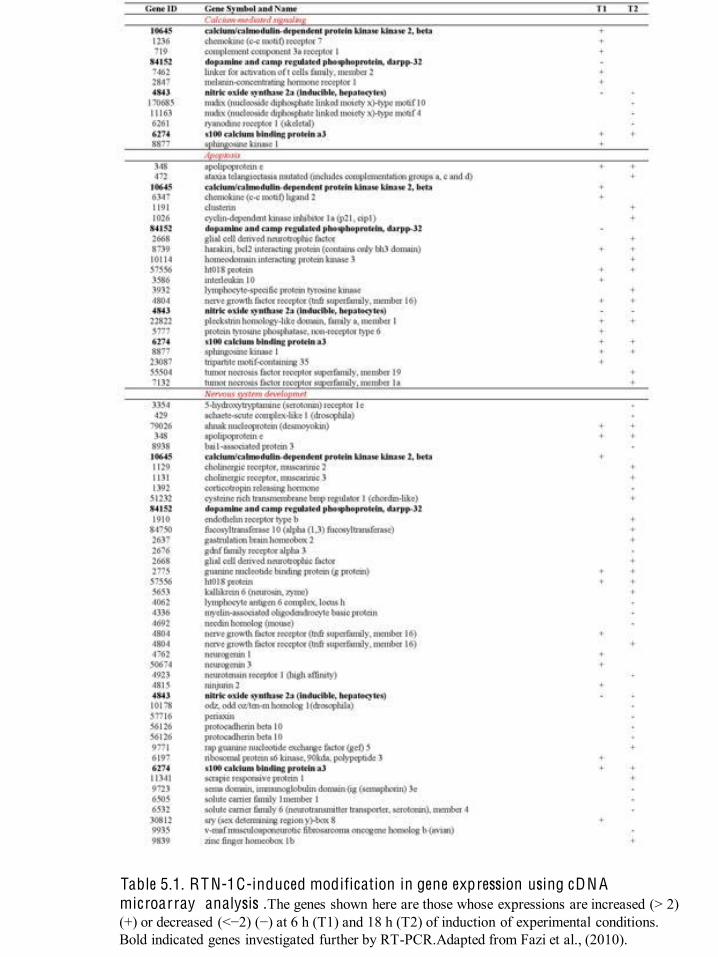
Table 5.1. RT N-1C-induced modification in gene expression using cDN A microarray analysis .The genes shown here are those whose expressions are increased (> 2)
h (T1) and 18 h (T2) of induction of experimental conditions. Bold indicated genes investigated further by RT-PCR.Adapted from Fazi et al., (2010).
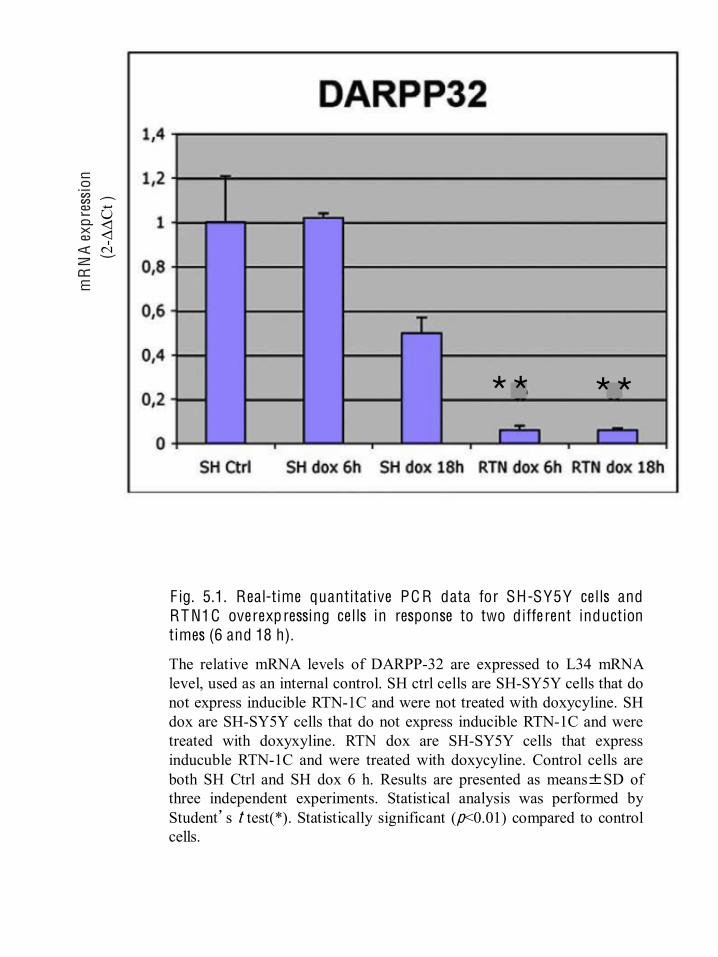
F ig. 5.1. Real-time quantitative PC R data for SH-SY5Y cells and RT N1C overexpressing cells in response to two different induction times (6 and 18 h).
The relative mRNA levels of DARPP-32 are expressed to L34 mRNA level, used as an internal control. SH ctrl cells are SH-SY5Y cells that do not express inducible RTN-1C and were not treated with doxycyline. SH dox are SH-SY5Y cells that do not express inducible RTN-1C and were treated with doxyxyline. RTN dox are SH-SY5Y cells that express inducuble RTN-1C and were treated with doxycyline. Control cells are both SH Ctrl and SH dox 6 h. Results are presented as means±SD of three independent experiments. Statistical analysis was performed by Student’s t test(*). Statistically significant (p<0.01) compared to control cells.
mR
NA
expr
essi
on
(2-
Ct )
** **
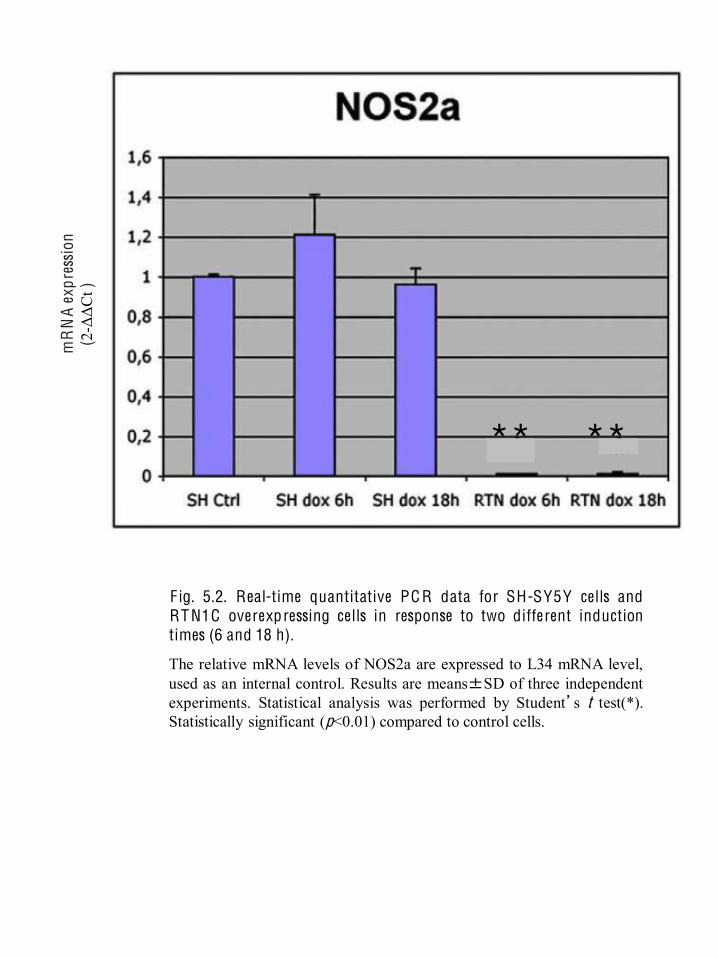
F ig. 5.2. Real-time quantitative PC R data for SH-SY5Y cells and RT N1C overexpressing cells in response to two different induction times (6 and 18 h).
The relative mRNA levels of NOS2a are expressed to L34 mRNA level, used as an internal control. Results are means±SD of three independent experiments. Statistical analysis was performed by Student’s t test(*). Statistically significant (p<0.01) compared to control cells.
mR
NA
expr
essi
on
(2-
Ct )
** **
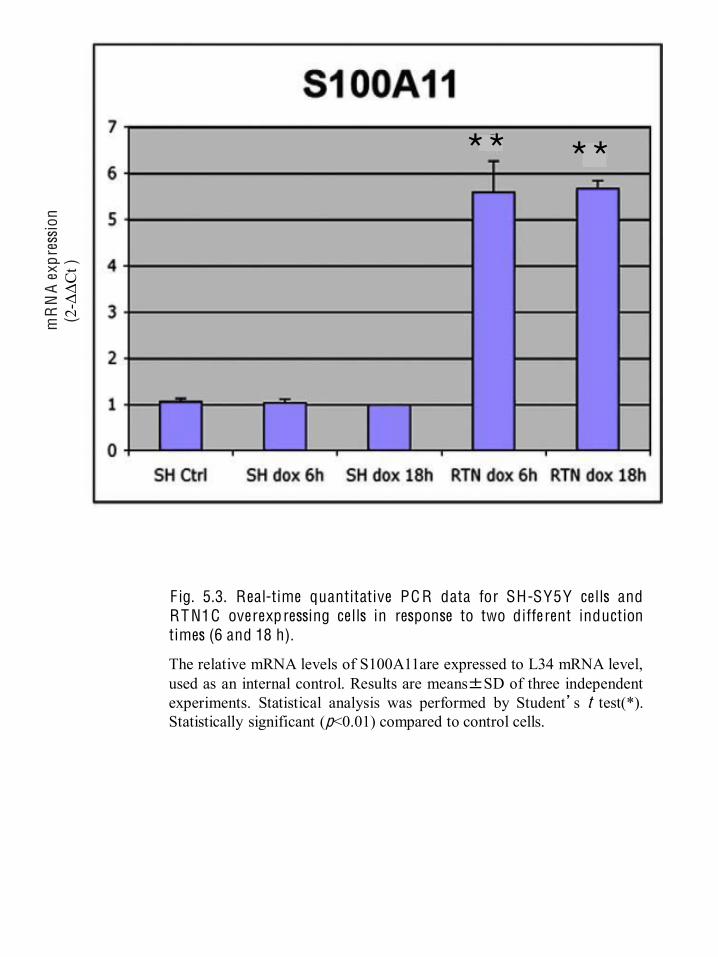
F ig. 5.3. Real-time quantitative PC R data for SH-SY5Y cells and RT N1C overexpressing cells in response to two different induction times (6 and 18 h).
The relative mRNA levels of S100A11are expressed to L34 mRNA level, used as an internal control. Results are means±SD of three independent experiments. Statistical analysis was performed by Student’s t test(*). Statistically significant (p<0.01) compared to control cells.
mR
NA
expr
essi
on
(2-
Ct )
** **
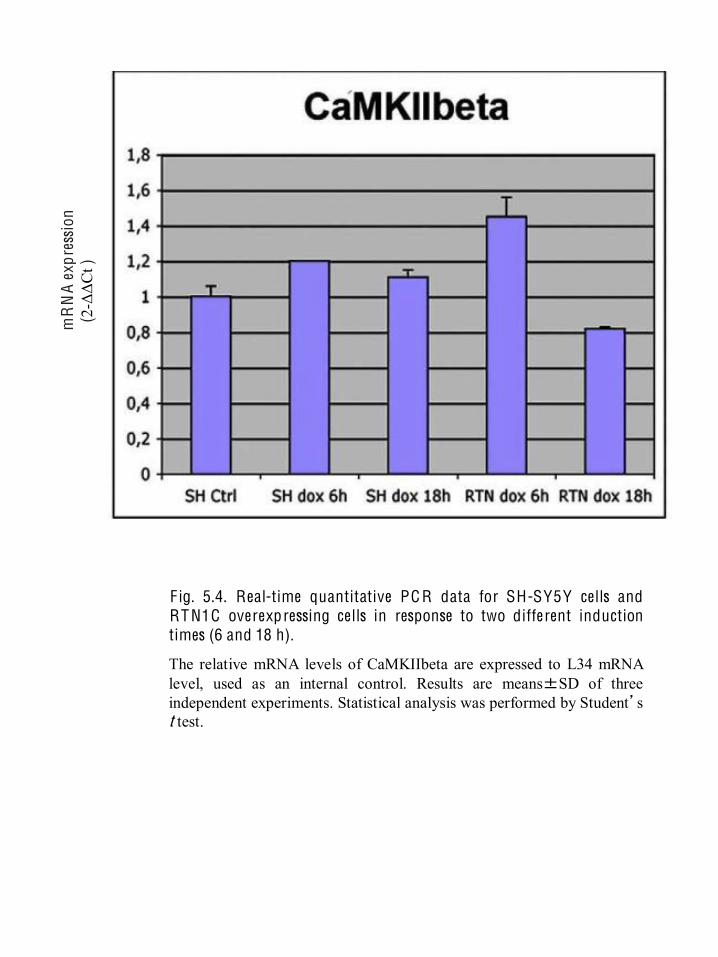
F ig. 5.4. Real-time quantitative PC R data for SH-SY5Y cells and RT N1C overexpressing cells in response to two different induction times (6 and 18 h).
The relative mRNA levels of CaMKIIbeta are expressed to L34 mRNA level, used as an internal control. Results are means±SD of three independent experiments. Statistical analysis was performed by Student’s t test.
mR
NA
expr
essi
on
(2-
Ct )
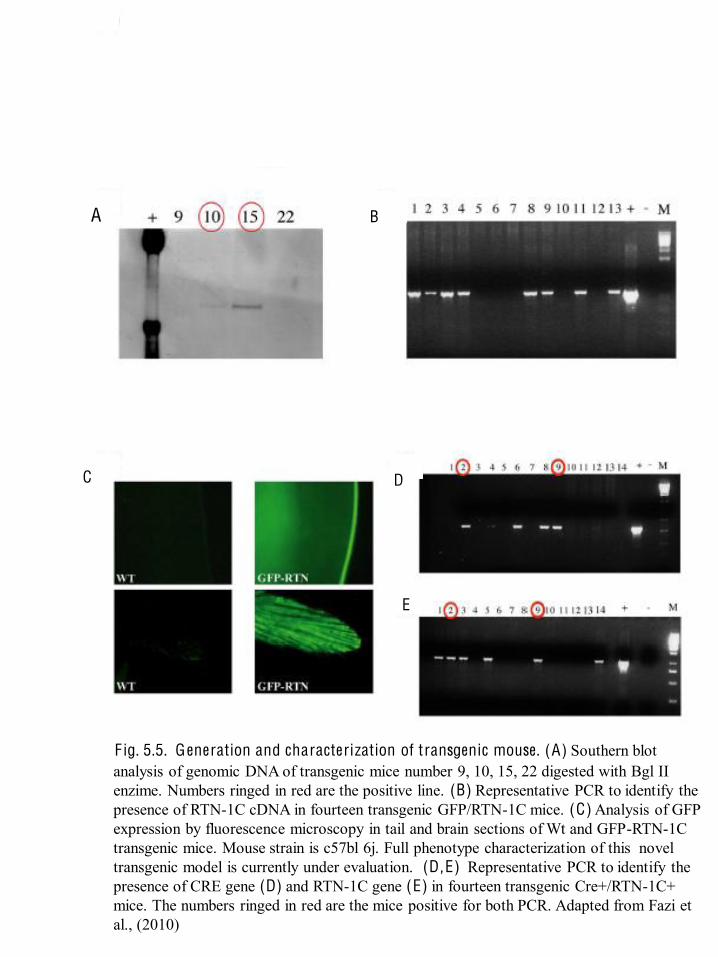
F ig. 5.5. G eneration and characterization of transgenic mouse. (A) Southern blot analysis of genomic DNA of transgenic mice number 9, 10, 15, 22 digested with Bgl II enzime. Numbers ringed in red are the positive line. (B) Representative PCR to identify the presence of RTN-1C cDNA in fourteen transgenic GFP/RTN-1C mice. (C) Analysis of GFP expression by fluorescence microscopy in tail and brain sections of Wt and GFP-RTN-1C transgenic mice. Mouse strain is c57bl 6j. Full phenotype characterization of this novel transgenic model is currently under evaluation. (D , E) Representative PCR to identify the presence of CRE gene (D) and RTN-1C gene (E) in fourteen transgenic Cre+/RTN-1C+ mice. The numbers ringed in red are the mice positive for both PCR. Adapted from Fazi et al., (2010)
A B
C D
E
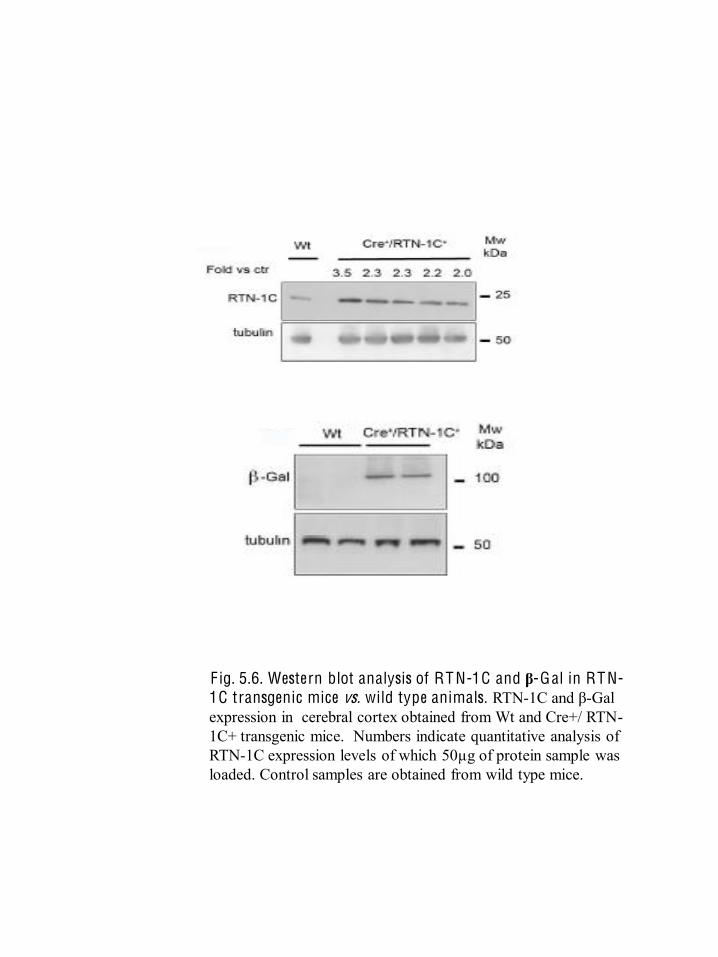
F ig. 5.6. Western blot analysis of RT N-1C and -Gal in RT N-1C transgenic mice vs. wild type animals. RTN-1C and -Gal expression in cerebral cortex obtained from Wt and Cre+/ RTN-1C+ transgenic mice. Numbers indicate quantitative analysis of RTN-1C expression levels of which 50µg of protein sample was loaded. Control samples are obtained from wild type mice.
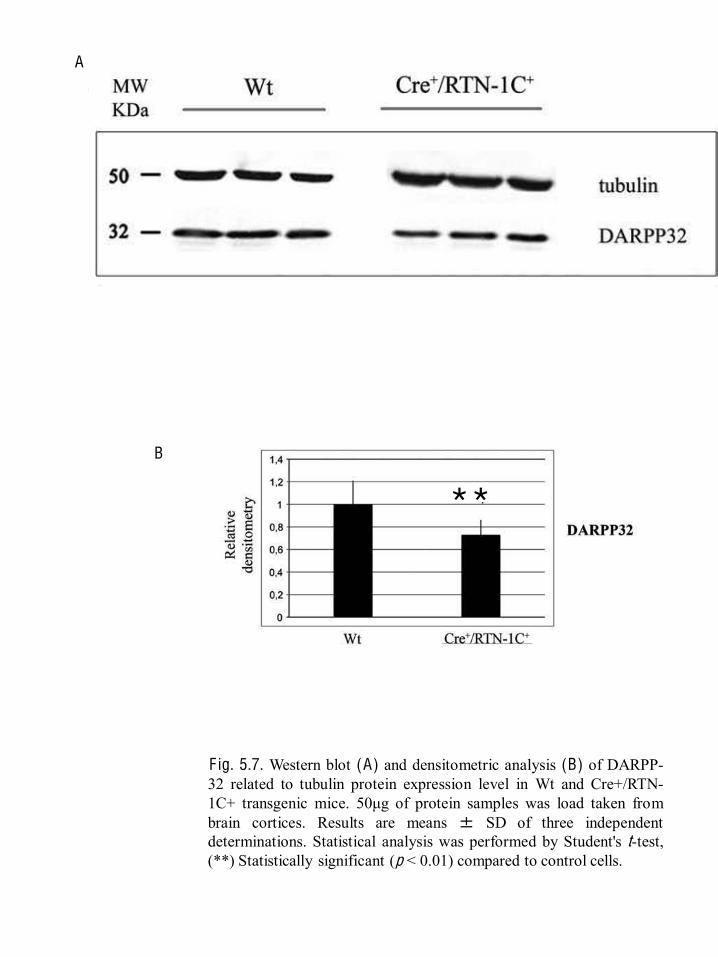
F ig. 5.7. Western blot (A) and densitometric analysis (B) of DARPP-32 related to tubulin protein expression level in Wt and Cre+/RTN-1C+ transgenic mice. 50 g of protein samples was load taken from brain cortices. Results are means ± SD of three independent determinations. Statistical analysis was performed by Student's t-test, (**) Statistically significant (p < 0.01) compared to control cells.
B
A
**
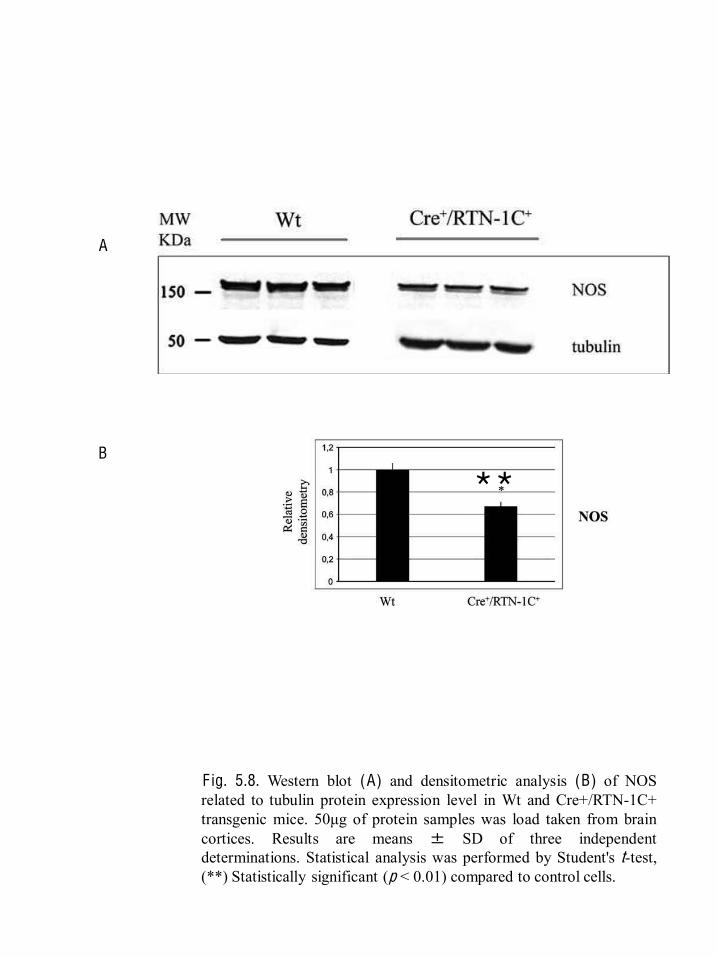
F ig. 5.8. Western blot (A) and densitometric analysis (B) of NOS related to tubulin protein expression level in Wt and Cre+/RTN-1C+ transgenic mice. 50 g of protein samples was load taken from brain cortices. Results are means ± SD of three independent determinations. Statistical analysis was performed by Student's t-test, (**) Statistically significant (p < 0.01) compared to control cells.
B
A
**
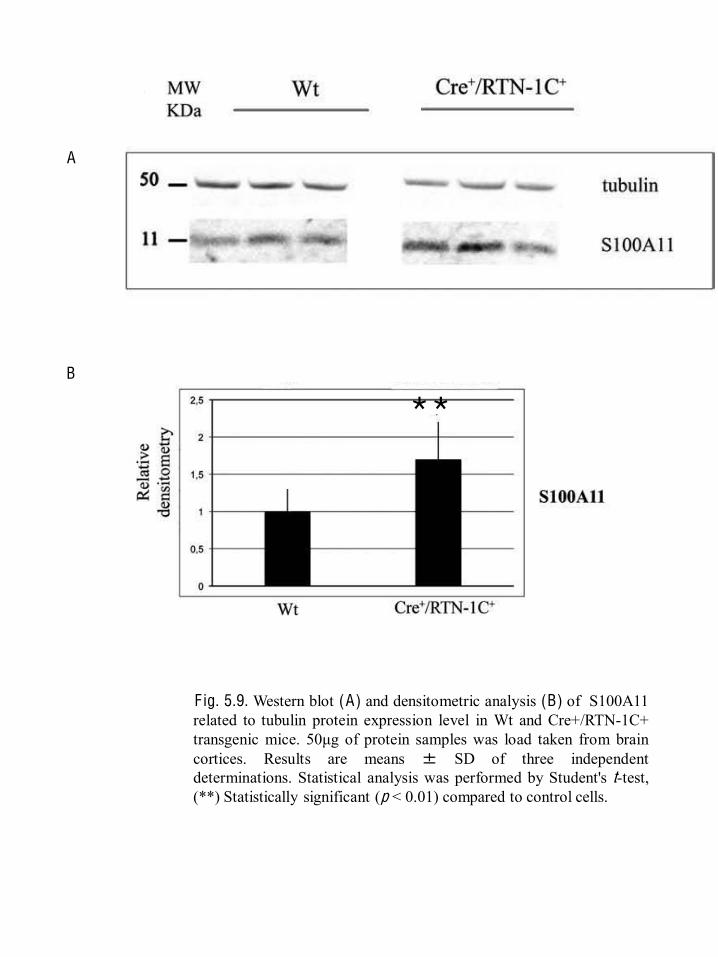
Fig. 5.9. Western blot (A) and densitometric analysis (B) of S100A11 related to tubulin protein expression level in Wt and Cre+/RTN-1C+ transgenic mice. 50 g of protein samples was load taken from brain cortices. Results are means ± SD of three independent determinations. Statistical analysis was performed by Student's t-test, (**) Statistically significant (p < 0.01) compared to control cells.
B
A
**
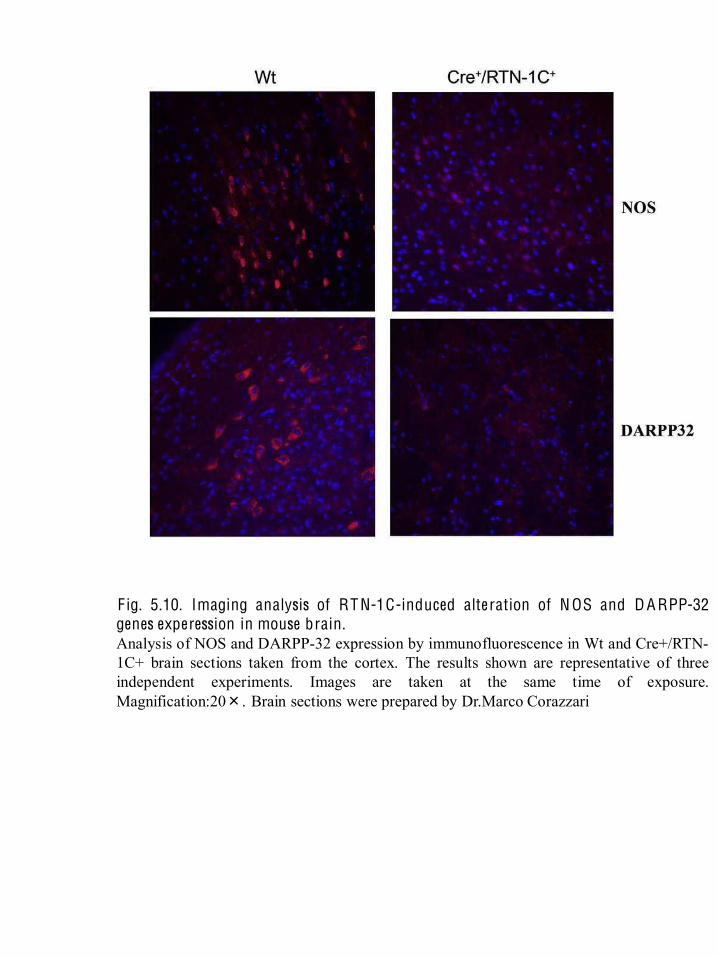
F ig. 5.10. Imaging analysis of RT N-1C-induced alteration of N OS and D A RPP-32 genes experession in mouse brain. Analysis of NOS and DARPP-32 expression by immunofluorescence in Wt and Cre+/RTN-1C+ brain sections taken from the cortex. The results shown are representative of three independent experiments. Images are taken at the same time of exposure. Magnification:20×. Brain sections were prepared by Dr.Marco Corazzari
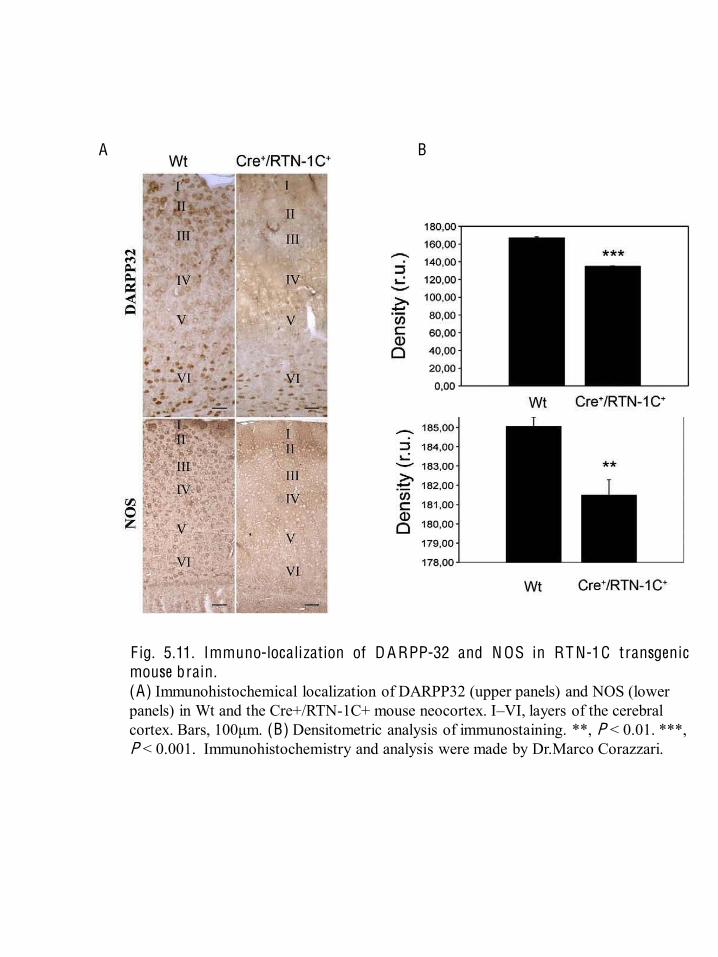
F ig. 5.11. Immuno-localization of D A RPP-32 and N OS in RT N-1C transgenic mouse brain. (A) Immunohistochemical localization of DARPP32 (upper panels) and NOS (lower panels) in Wt and the Cre+/RTN-1C+ mouse neocortex. I VI, layers of the cerebral
(B) Densitometric analysis of immunostaining. **, P < 0.01. ***, P < 0.001. Immunohistochemistry and analysis were made by Dr.Marco Corazzari.
A B
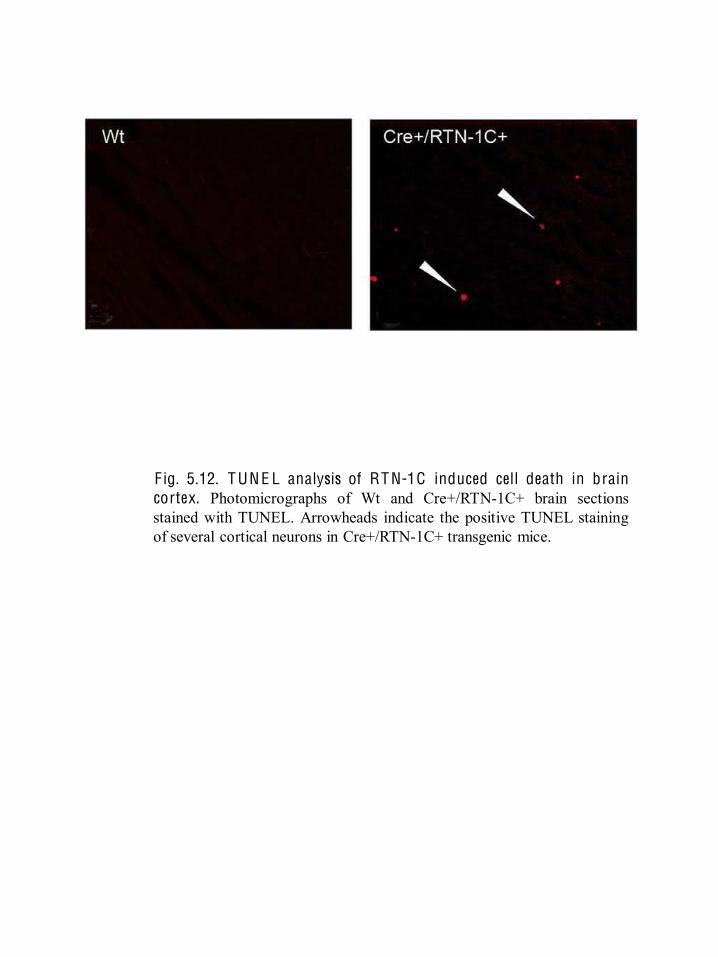
F ig. 5.12. T UN E L analysis of RT N-1C induced cell death in brain cortex. Photomicrographs of Wt and Cre+/RTN-1C+ brain sections stained with TUNEL. Arrowheads indicate the positive TUNEL staining of several cortical neurons in Cre+/RTN-1C+ transgenic mice.
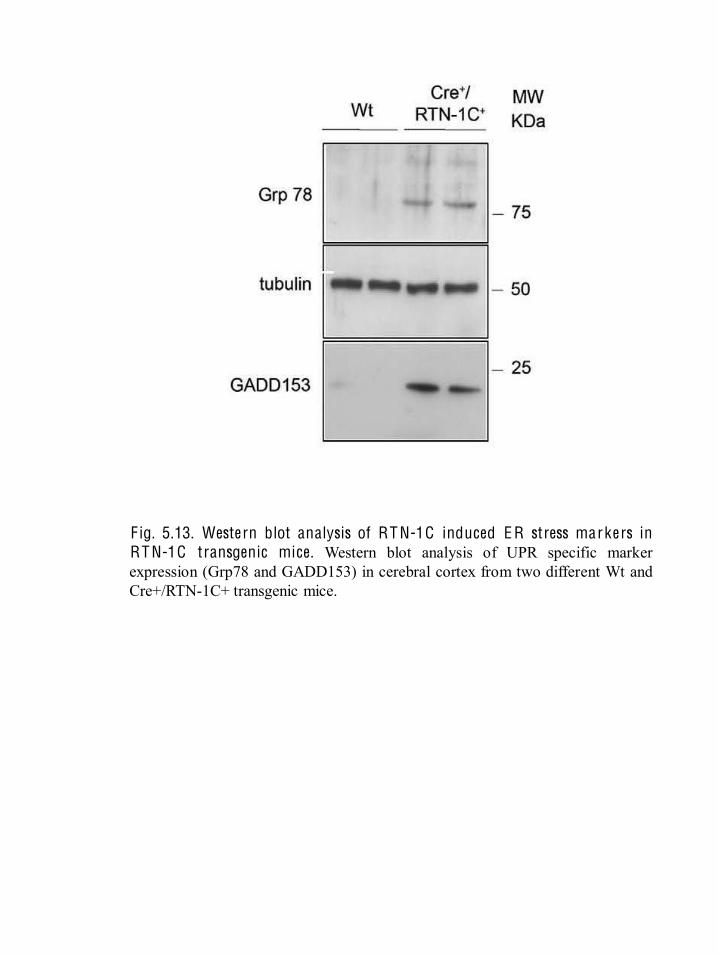
F ig. 5.13. Western blot analysis of RT N-1C induced E R stress markers in RT N-1C transgenic mice. Western blot analysis of UPR specific marker expression (Grp78 and GADD153) in cerebral cortex from two different Wt and Cre+/RTN-1C+ transgenic mice.
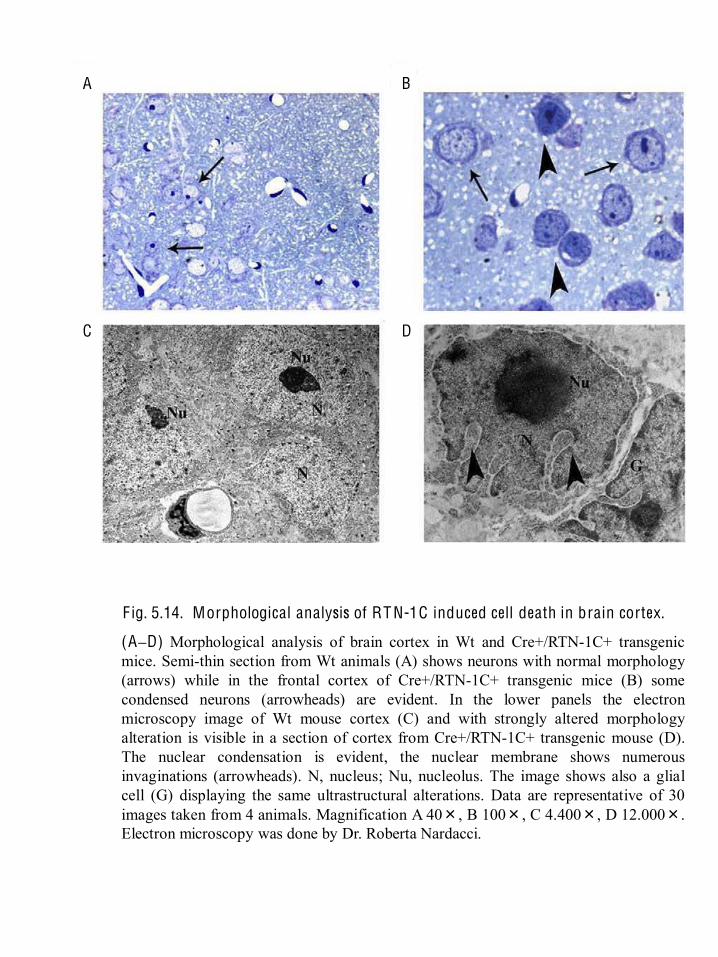
Fig. 5.14. Morphological analysis of RT N-1C induced cell death in brain cortex.
(A D) Morphological analysis of brain cortex in Wt and Cre+/RTN-1C+ transgenic mice. Semi-thin section from Wt animals (A) shows neurons with normal morphology (arrows) while in the frontal cortex of Cre+/RTN-1C+ transgenic mice (B) some condensed neurons (arrowheads) are evident. In the lower panels the electron microscopy image of Wt mouse cortex (C) and with strongly altered morphology alteration is visible in a section of cortex from Cre+/RTN-1C+ transgenic mouse (D). The nuclear condensation is evident, the nuclear membrane shows numerous invaginations (arrowheads). N, nucleus; Nu, nucleolus. The image shows also a glial cell (G) displaying the same ultrastructural alterations. Data are representative of 30 images taken from 4 animals. Magnification A 40×, B 100×, C 4.400×, D 12.000×. Electron microscopy was done by Dr. Roberta Nardacci.
B A
D C