Embed Size (px)
Citation preview
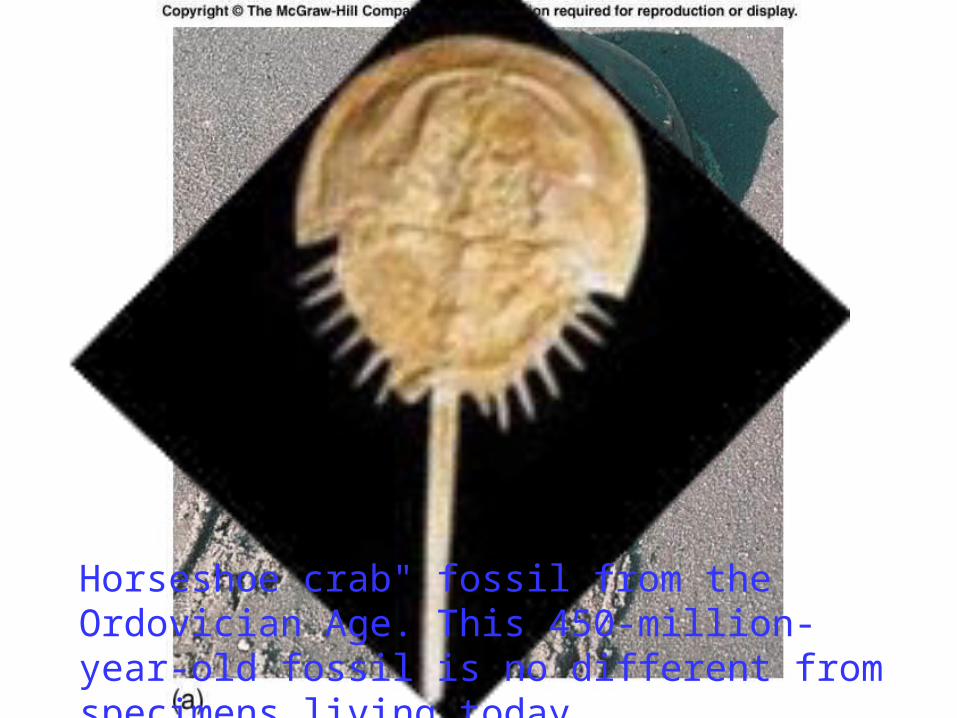
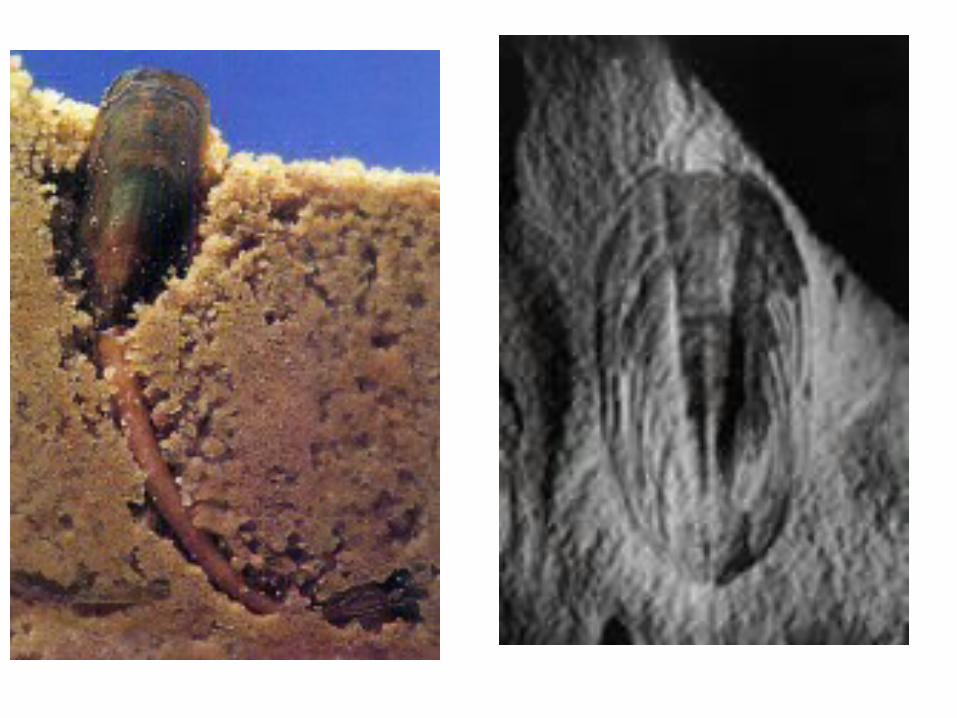
Fig. 14.8a
Horseshoe crab" fossil from the Ordovician Age. This 450-million-year-old fossil is no different from specimens living today.
Nothing lasts forever. Species, too, become extinct.
The paleontologist G. G. Simpson estimated; since the Cambrian 544 million years ago, more than 99% are extinct today.
Had the dinosaurs not become extinct, mammals may never have experienced the opportunity to radiate
Chapter 13 Extinctions
Evolution: speciation vs extinction
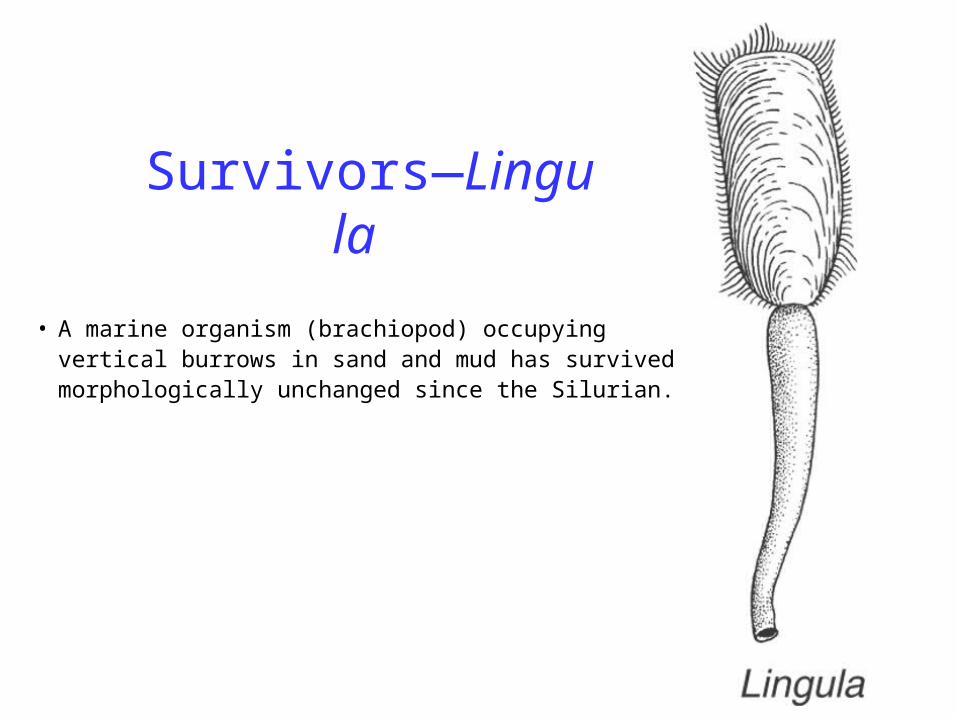
Survivors—Lingula
• A marine organism (brachiopod) occupying vertical burrows in sand and mud has survived morphologically unchanged since the Silurian.
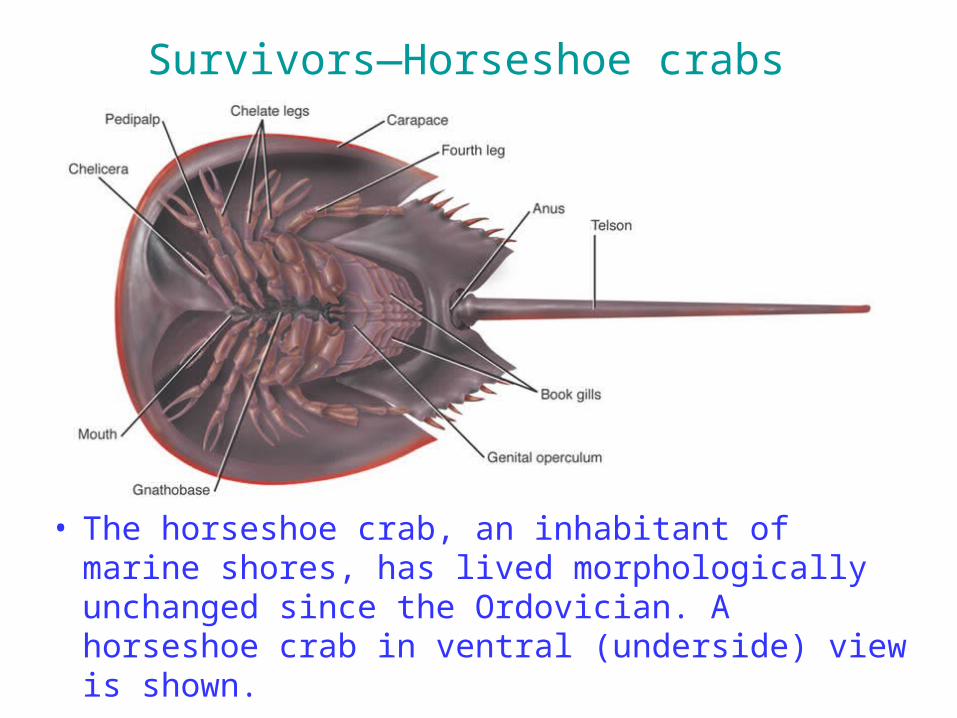
Survivors—Horseshoe crabs
• The horseshoe crab, an inhabitant of marine shores, has lived morphologically unchanged since the Ordovician. A horseshoe crab in ventral (underside) view is shown.
Some taxonomic groups are carried out as part of large, wide-spread catastrophic or mass extinctions.
In uniform or background extinctions, members of taxonomic groups are lost gradually over long time periods without abrupt loss of large numbers. Most of the 99% of species now extinct were lost not suddenly, but slowly,
Species come and go
Copyright © 2002 Pearson Education, Inc., publishing as Benjamin Cummings
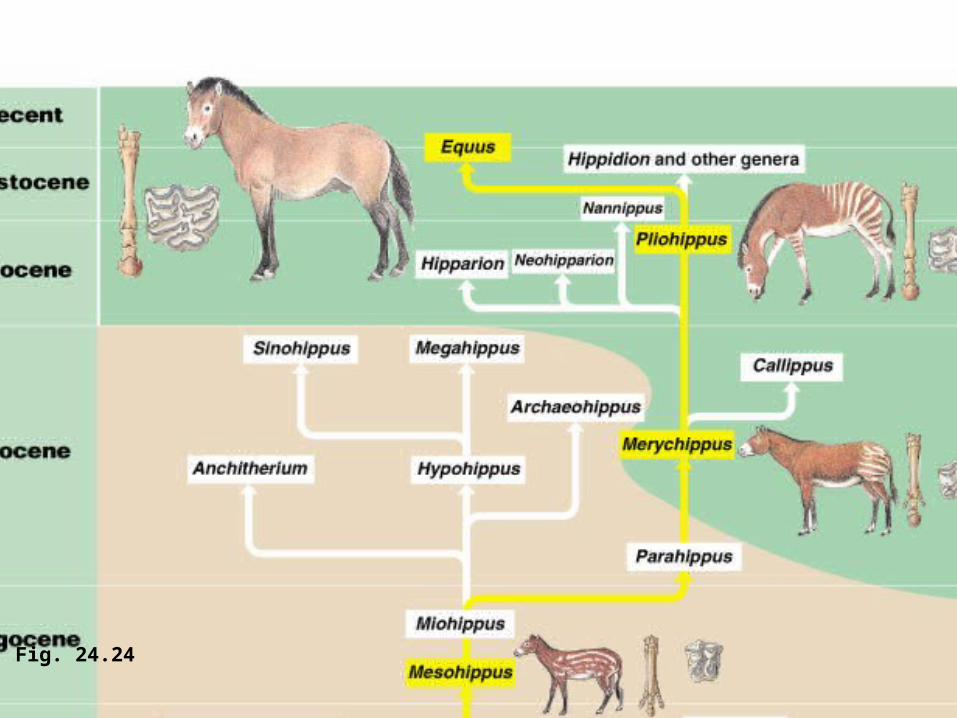
Fig. 24.24
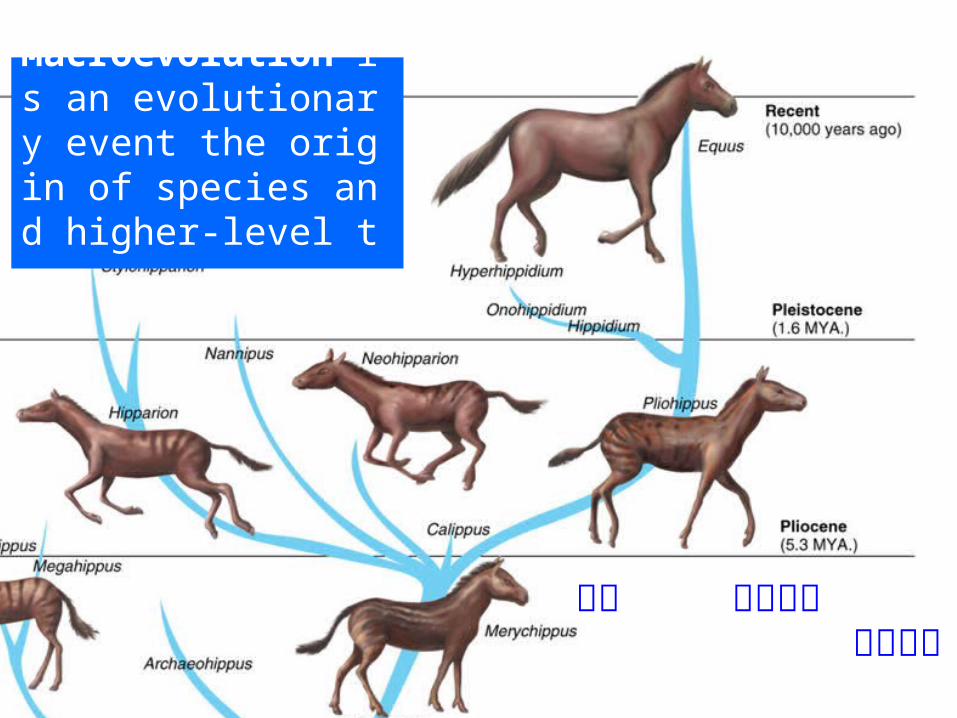
Macroevolution is an evolutionary event the origin of species and higher-level taxa.
注定 宿命絕後 六畜興旺
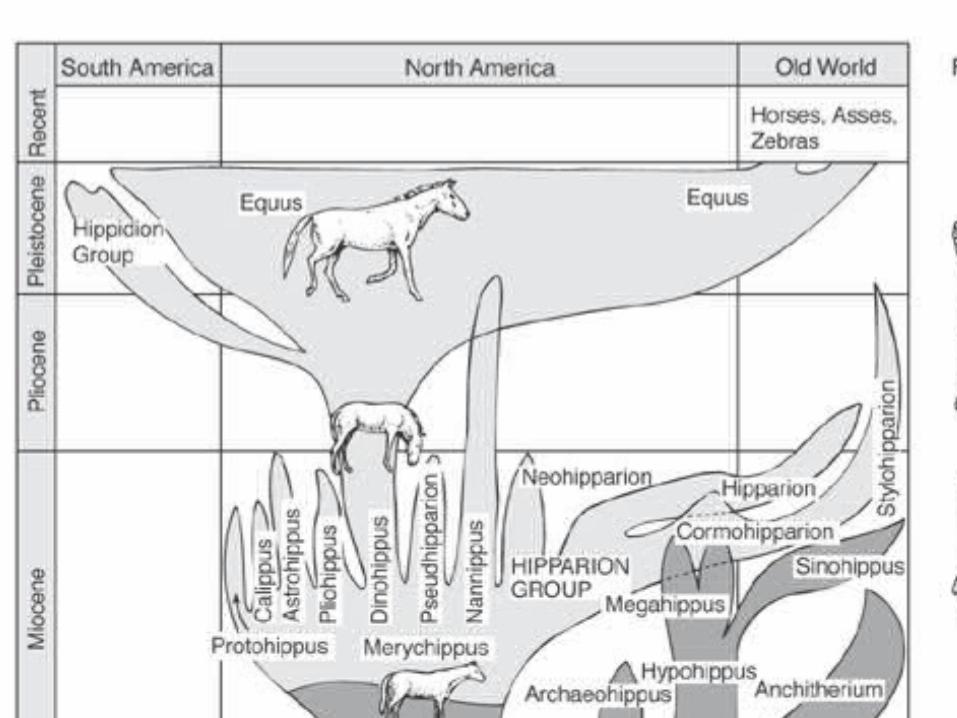
FIGURE 6.5 Morphological Series
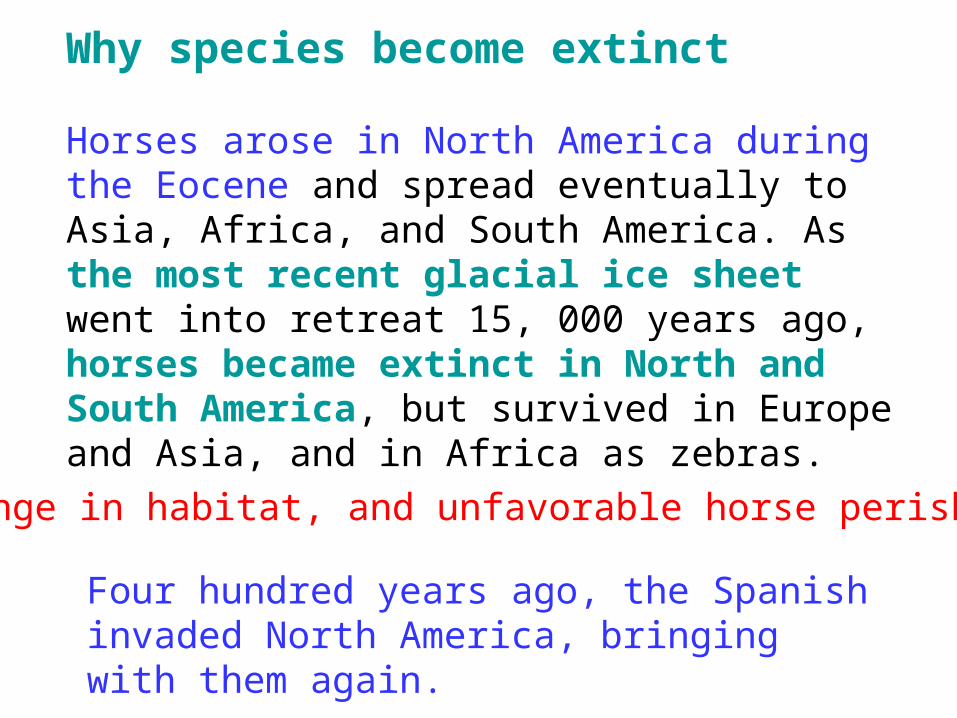
Why species become extinct
Horses arose in North America during the Eocene and spread eventually to Asia, Africa, and South America. As the most recent glacial ice sheet went into retreat 15, 000 years ago, horses became extinct in North and South America, but survived in Europe and Asia, and in Africa as zebras.
Change in habitat, and unfavorable horse perished
Four hundred years ago, the Spanish invaded North America, bringing with them again.
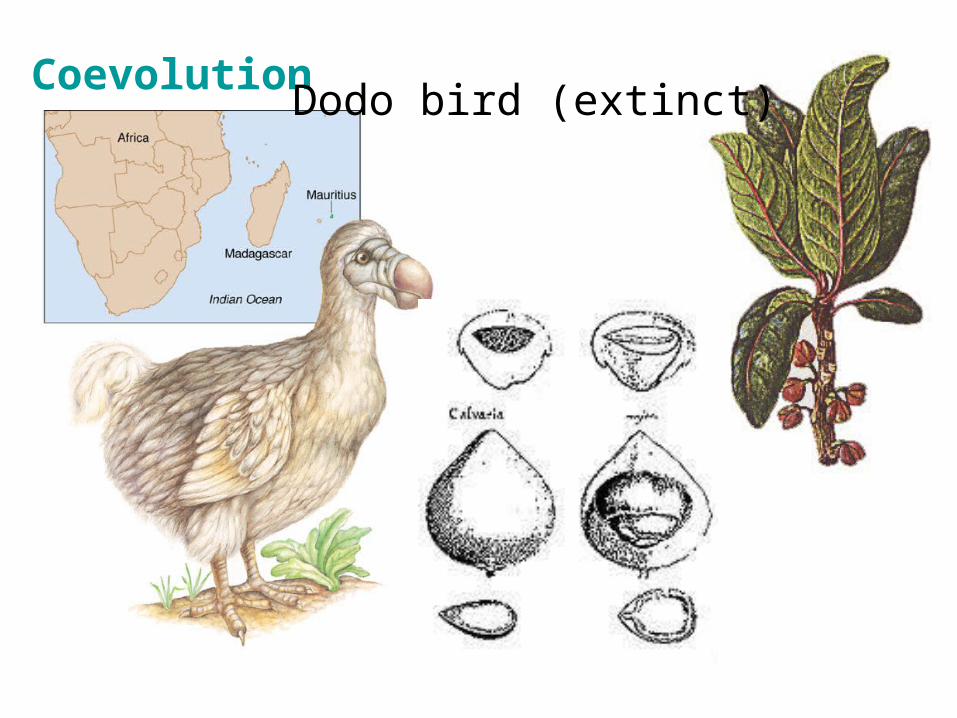
CoevolutionDodo bird (extinct)
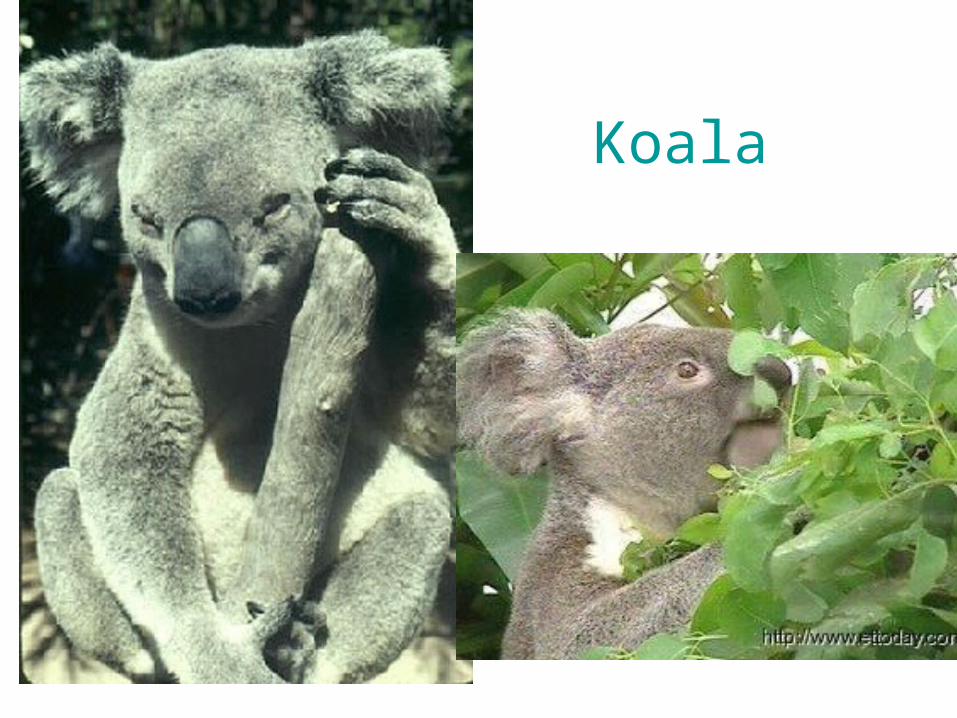
Koala • The koala lives in
Australia and feeds exclusively on the leaves of eucalyptus trees whose toxic oils are harmful to other herbivores.
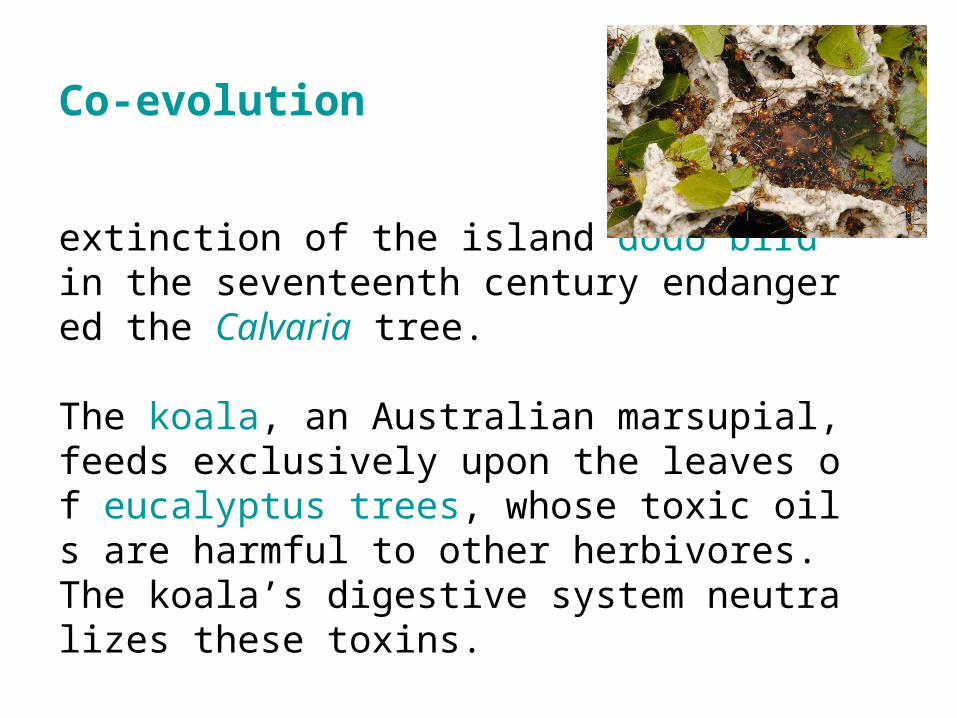
Co-evolution
extinction of the island dodo bird in the seventeenth century endangered the Calvaria tree.
The koala, an Australian marsupial, feeds exclusively upon the leaves of eucalyptus trees, whose toxic oils are harmful to other herbivores. The koala’s digestive system neutralizes these toxins.
• Eucalyptus alba • Eucalyptus albens • Eucalyptus amygdalina • Eucalyptus aromaphloia • Eucalyptus baileyana • Eucalyptus balladoniensis • Eucalyptus bicostata • Eucalyptus botryoides • Eucalyptus brachyandra • Eucalyptus brassiana • Eucalyptus brevistylis • Eucalyptus brockwayi • Eucalyptus camaldulensis (Murray red gum) • Eucalyptus ceracea • Eucalyptus cloeziana (Queensland messmate) • Eucalyptus coccifera • Eucalyptus cordata • Eucalyptus cornuta • Eucalyptus corticosa • Eucalyptus crebra • Eucalyptus croajingolensis • Eucalyptus curtisii • Eucalyptus dalrympleana • Eucalyptus deglupta • Eucalyptus delegatensis • Eucalyptus delicata • Eucalyptus diversicolor • Eucalyptus diversifolia • Eucalyptus dives • Eucalyptus dolichocarpa • Eucalyptus dundasii • Eucalyptus dunnii • Eucalyptus elata • Eucalyptus erythrocorys (illyarie) • Eucalyptus erythrophloia • Eucalyptus eudesmoides • Eucalyptus falcata • Eucalyptus gamophylla • Eucalyptus glaucina • Eucalyptus globulus (blue gum)
– Eucalyptus globulus subsp. bicostata – Eucalyptus globulus subsp. globulus
• Eucalyptus gongylocarpa
• Eucalyptus regnans • Eucalyptus risdonii • Eucalyptus robertsonii • Eucalyptus rodwayi • Eucalyptus rubida • Eucalyptus rubiginosa • Eucalyptus saligna • Eucalyptus salmonophloia • Eucalyptus scoparia • Eucalyptus sieberi • Eucalyptus spathulata • Eucalyptus staeri • Eucalyptus stoatei • Eucalyptus tenuipes • Eucalyptus tenuiramis • Eucalyptus tereticornis • Eucalyptus tetragona (white-leaved marlock) • Eucalyptus tetrodonta • Eucalyptus tindaliae • Eucalyptus torquata • Eucalyptus umbra • Eucalyptus urophylla • Eucalyptus vernicosa • Eucalyptus viminalis • Eucalyptus wandoo • Eucalyptus wetarensis • Eucalyptus willisii
– Eucalyptus willisii subsp. falciformis – Eucalyptus willisii subsp. willisii
• Eucalyptus woodwardii
– Eucalyptus globulus subsp. globulus• Eucalyptus gongylocarpa • Eucalyptus grandis • Eucalyptus grandis x Eucalyptus nitens • Eucalyptus grandis x Eucalyptus urophylla • Eucalyptus guilfoylei • Eucalyptus gunnii (cider tree) • Eucalyptus haemastoma (scribbly gum) • Eucalyptus hallii • Eucalyptus houseana • Eucalyptus jacksonii • Eucalyptus lansdowneana • Eucalyptus latisinensis • Eucalyptus leucophloia • Eucalyptus leucoxylon (white ironbark) • Eucalyptus lockyeri • Eucalyptus lucasii • Eucalyptus maidenii • Eucalyptus marginata • Eucalyptus megacarpa • Eucalyptus melliodora • Eucalyptus michaeliana • Eucalyptus microcorys (tallowwood) • Eucalyptus microtheca • Eucalyptus morrisbyi • Eucalyptus muelleriana (yellow stringybark) • Eucalyptus nitens • Eucalyptus nitida • Eucalyptus obliqua (messmate stringybark) • Eucalyptus obtusiflora • Eucalyptus occidentalis • Eucalyptus optima • Eucalyptus ovata • Eucalyptus pachyphylla • Eucalyptus pauciflora • Eucalyptus pellita • Eucalyptus perriniana • Eucalyptus petiolaris • Eucalyptus pilularis • Eucalyptus piperita • Eucalyptus platyphylla • Eucalyptus polyanthemos • Eucalyptus populnea • Eucalyptus preissiana (bell-fruited mallee) • Eucalyptus pseudoglobulus • Eucalyptus pulchella • Eucalyptus radiata
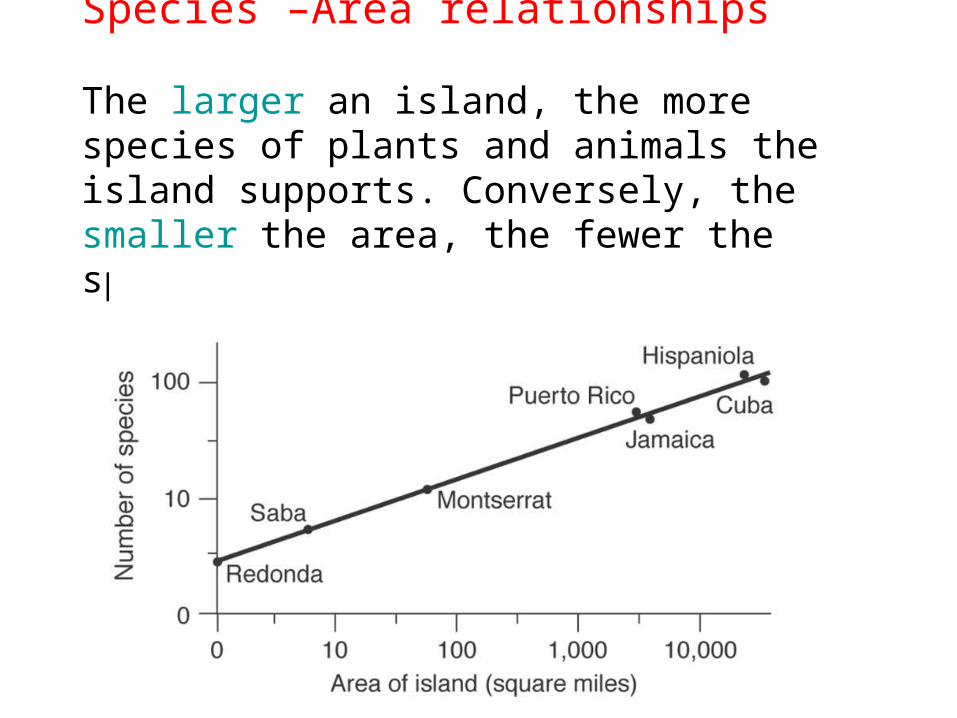
Species –Area relationships
The larger an island, the more species of plants and animals the island supports. Conversely, the smaller the area, the fewer the species.
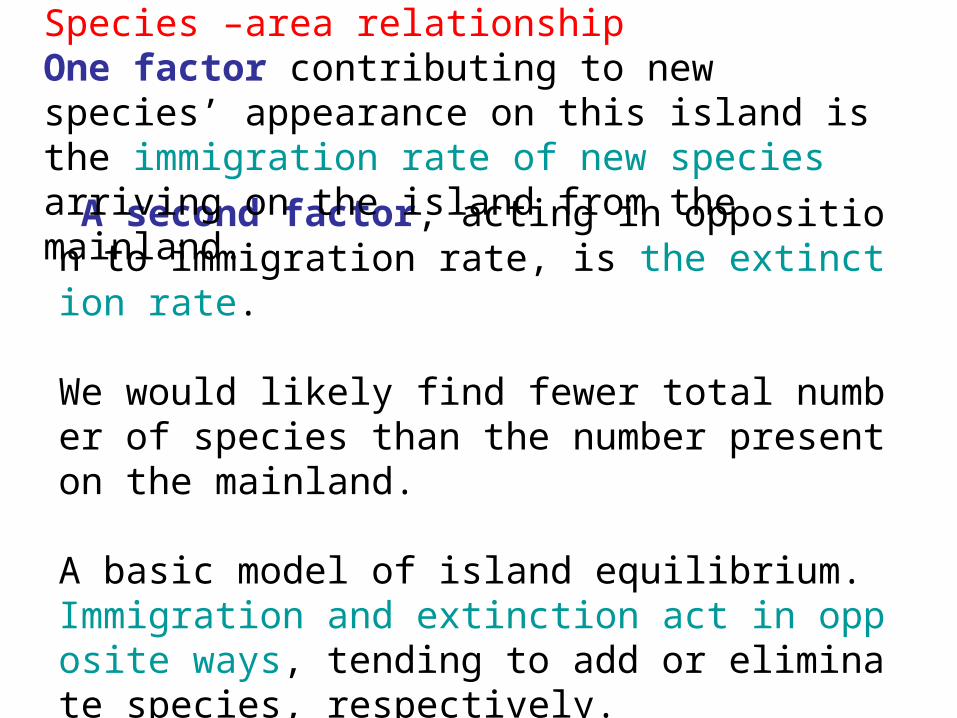
A second factor, acting in opposition to immigration rate, is the extinction rate.
We would likely find fewer total number of species than the number present on the mainland.
A basic model of island equilibrium. Immigration and extinction act in opposite ways, tending to add or eliminate species, respectively.
Species –area relationshipOne factor contributing to new species’ appearance on this island is the immigration rate of new species arriving on the island from the mainland.
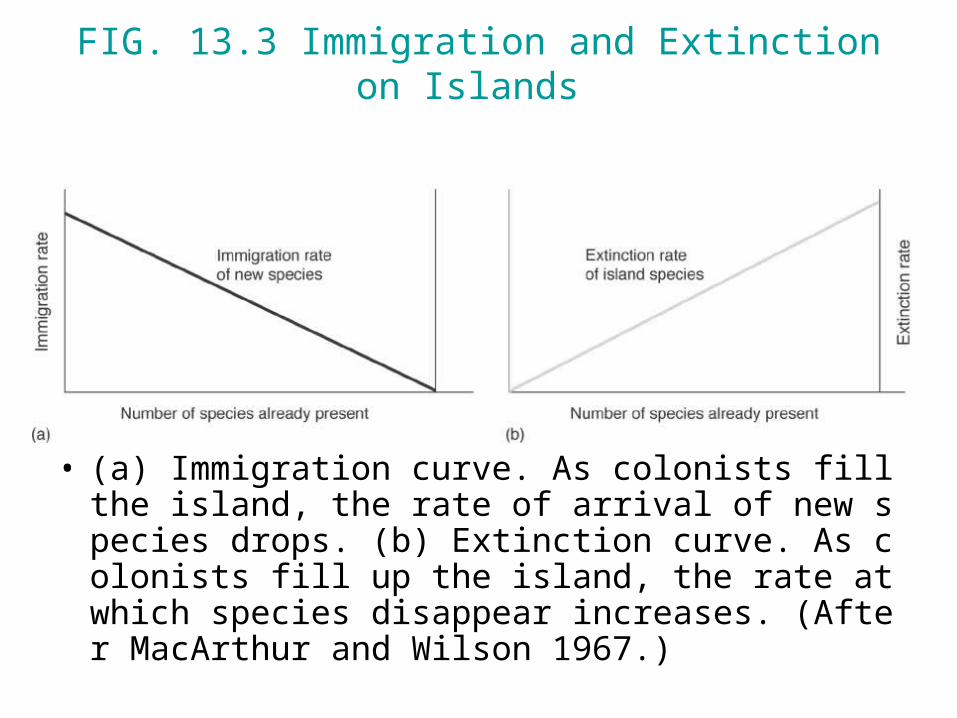
FIG. 13.3 Immigration and Extinction on Islands
• (a) Immigration curve. As colonists fill the island, the rate of arrival of new species drops. (b) Extinction curve. As colonists fill up the island, the rate at which species disappear increases. (After MacArthur and Wilson 1967.)
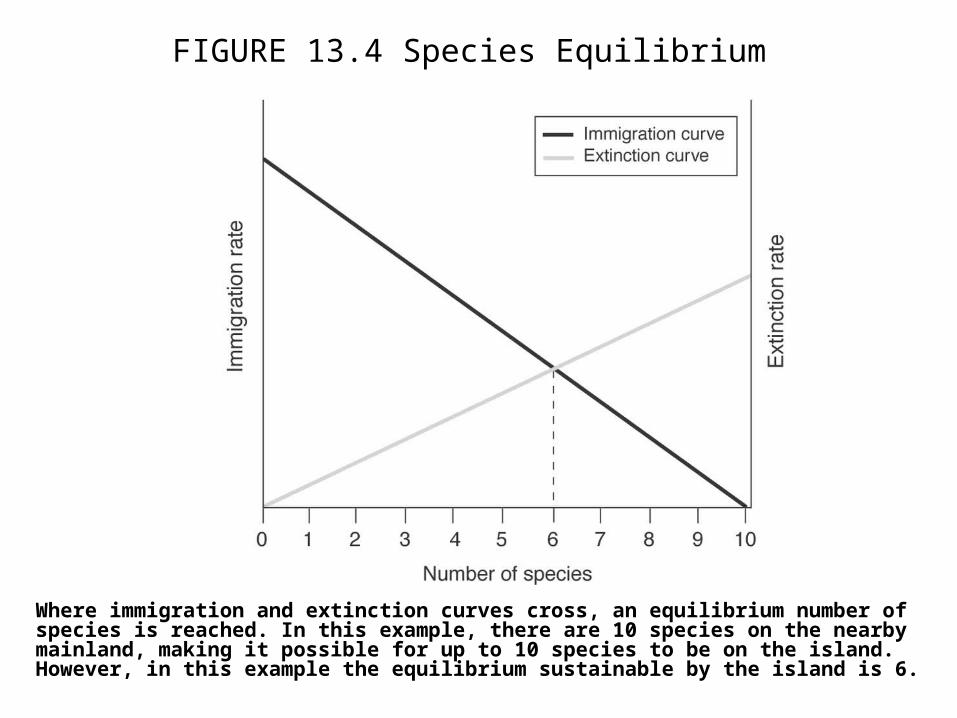
FIGURE 13.4 Species Equilibrium
Where immigration and extinction curves cross, an equilibrium number of species is reached. In this example, there are 10 species on the nearby mainland, making it possible for up to 10 species to be on the island. However, in this example the equilibrium sustainable by the island is 6.
The equilibrium number depends upon the
actual ecological hospitality and resource
richness of the particular island.
But the general principle will be the same.
Islands will reach an equilibrium number of
species that is below that of the larger mainland
nearby.
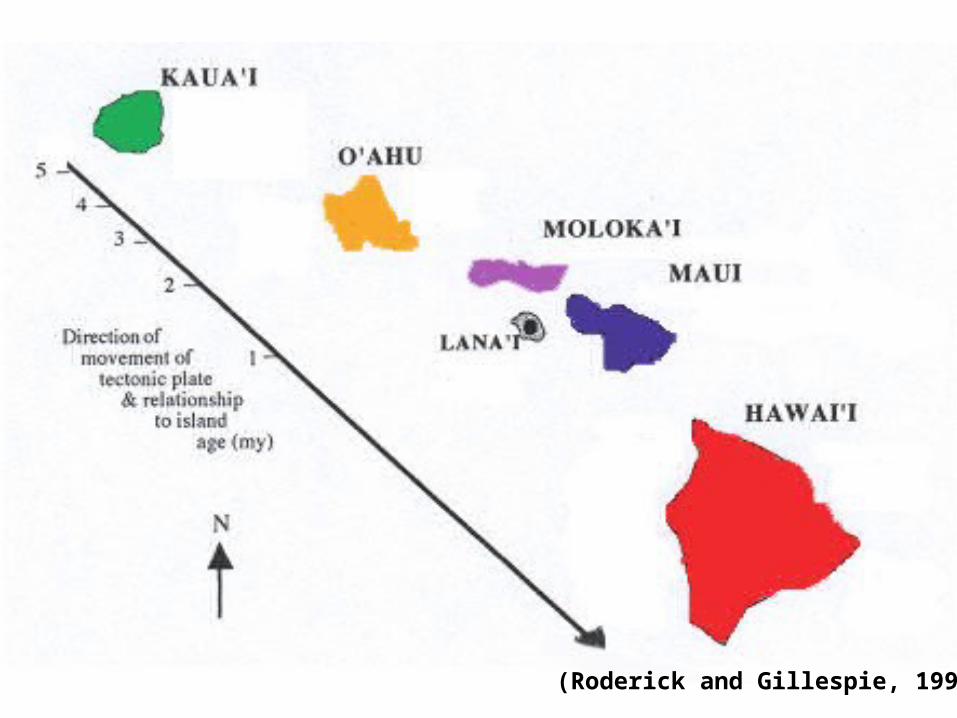
(Roderick and Gillespie, 1998)
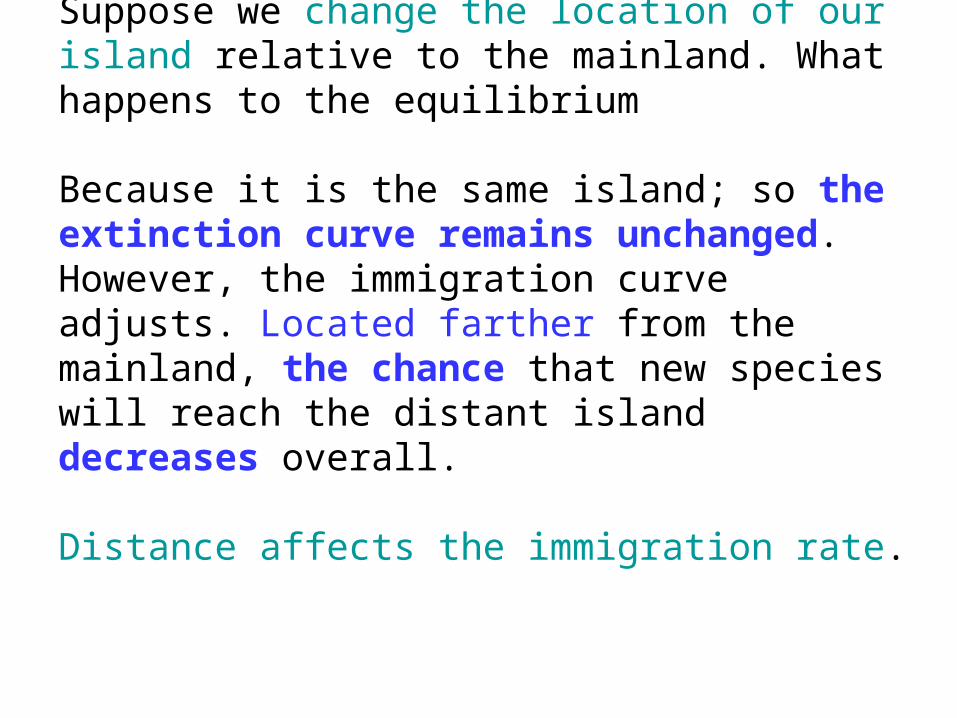
Suppose we change the location of our island relative to the mainland. What happens to the equilibrium
Because it is the same island; so the extinction curve remains unchanged. However, the immigration curve adjusts. Located farther from the mainland, the chance that new species will reach the distant island decreases overall.
Distance affects the immigration rate.
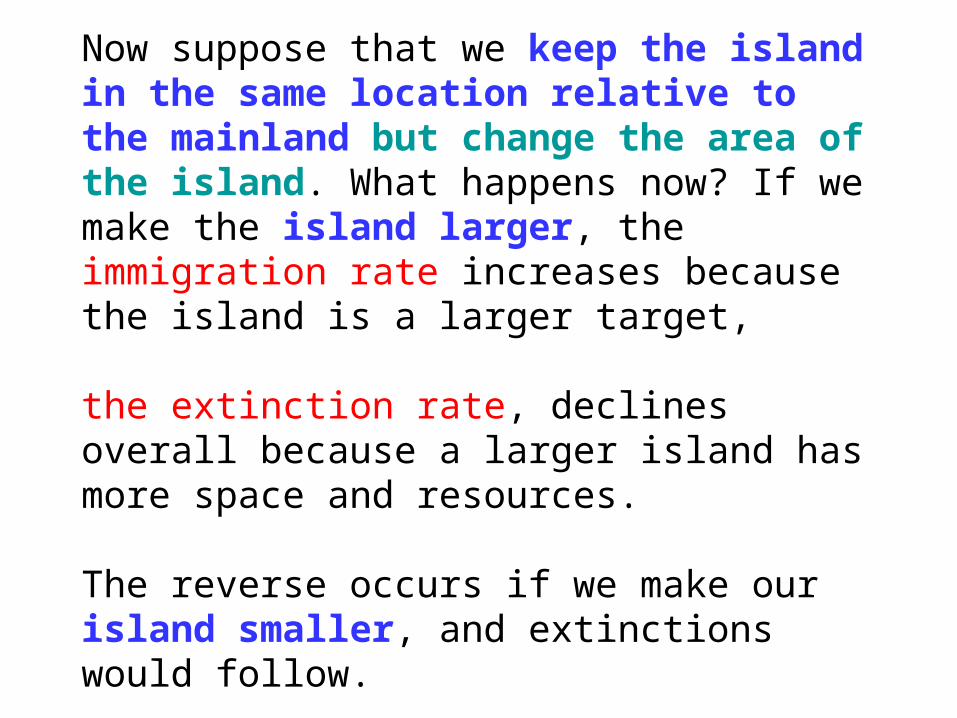
Now suppose that we keep the island in the same location relative to the mainland but change the area of the island. What happens now? If we make the island larger, the immigration rate increases because the island is a larger target,
the extinction rate, declines overall because a larger island has more space and resources.
The reverse occurs if we make our island smaller, and extinctions would follow.
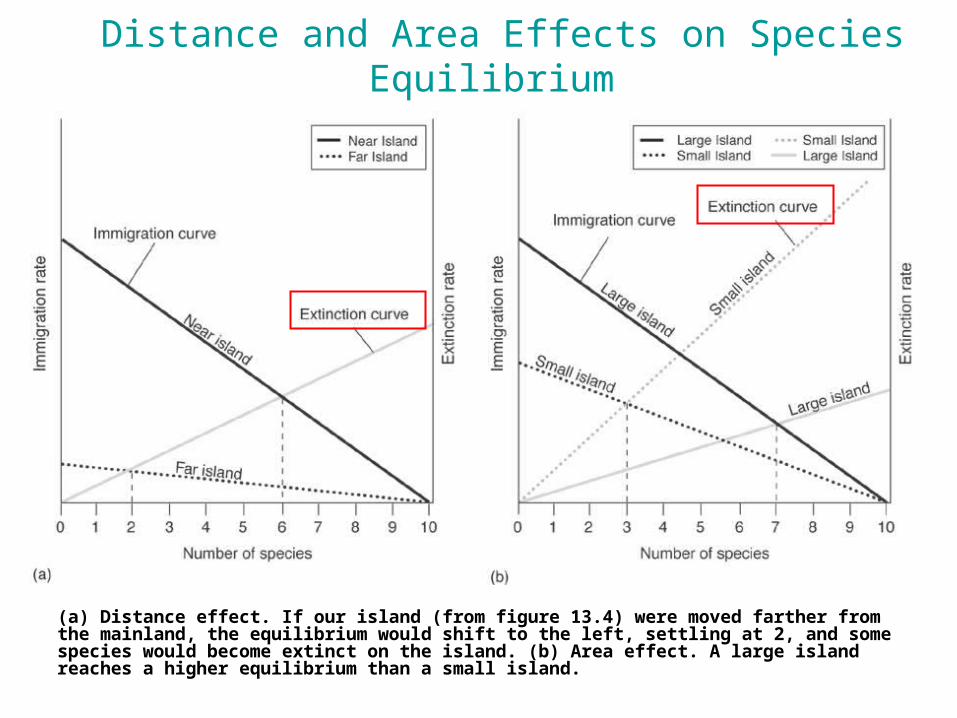
Distance and Area Effects on Species Equilibrium
(a) Distance effect. If our island (from figure 13.4) were moved farther from the mainland, the equilibrium would shift to the left, settling at 2, and some species would become extinct on the island. (b) Area effect. A large island reaches a higher equilibrium than a small island.
所屬網頁 http://www.tspes.tpc.edu.tw
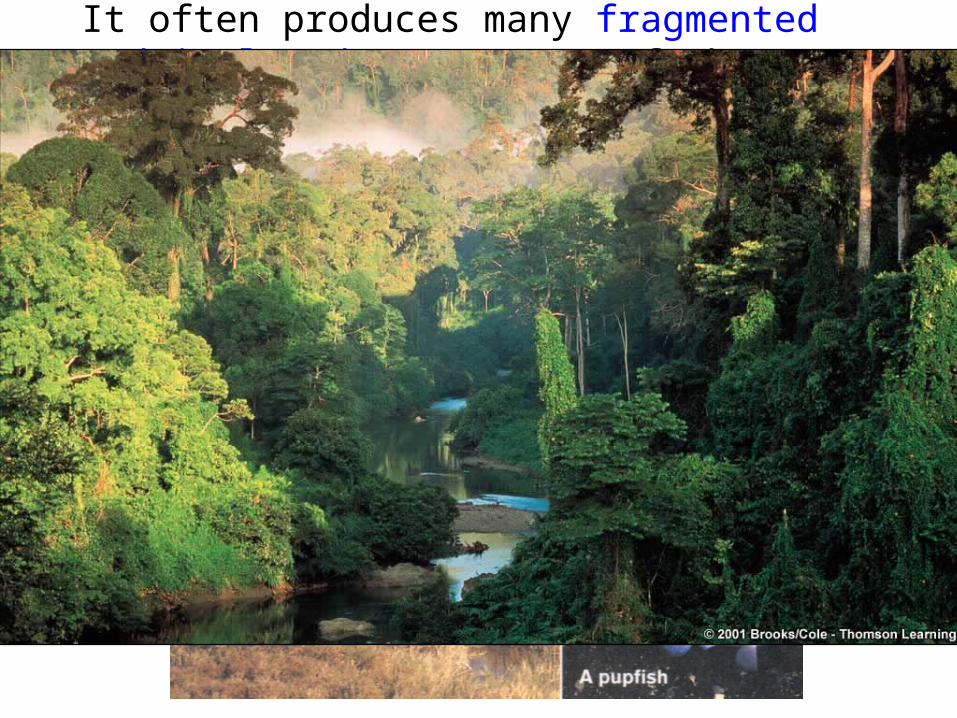
It often produces many fragmented and isolated groups out of the original, single population. Because isolated groups are smaller,
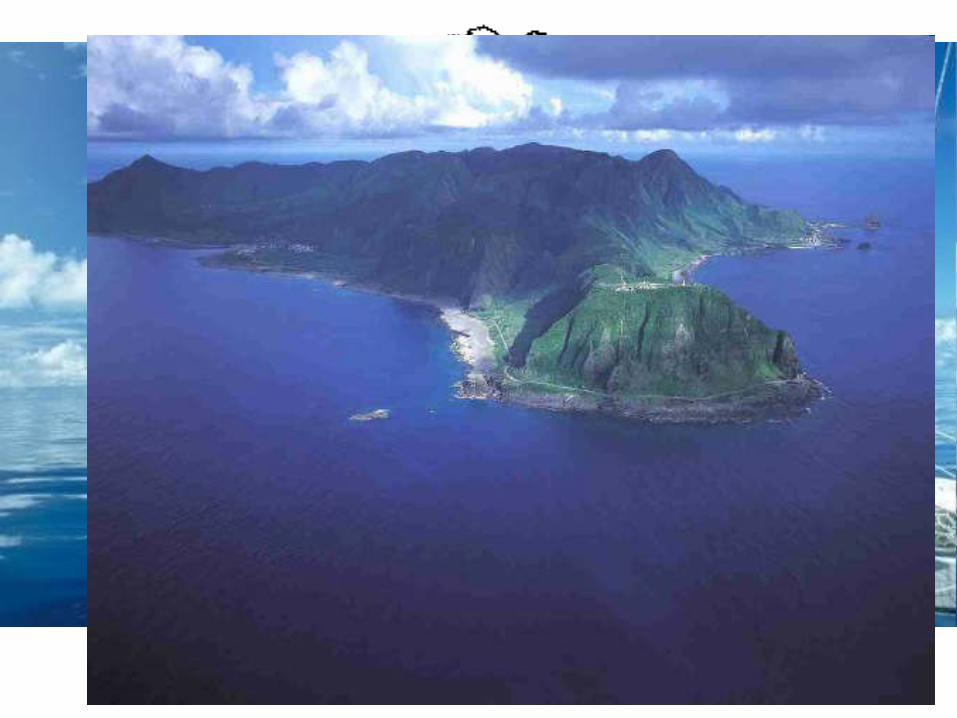
From the standpoint of a species, alpine mountaintops, separated bodies of water, or an isolated tree can be “islands.”
What we have modeled on proper islands is also applicable to a variety of other situations in nature, where small parcels of habitat stand apart from large enclaves of resources elsewhere.
Reducing area reduces the number of species supported, and extinctions follow.
Island Insights
Leigh Van Valen expected extinctions to be abrupt, the result of some sudden, unfavorable change in the environment.
What he found instead was that most groups of species became extinct gradually, at a constant rate characteristic of their taxonomic group.
Red Queen
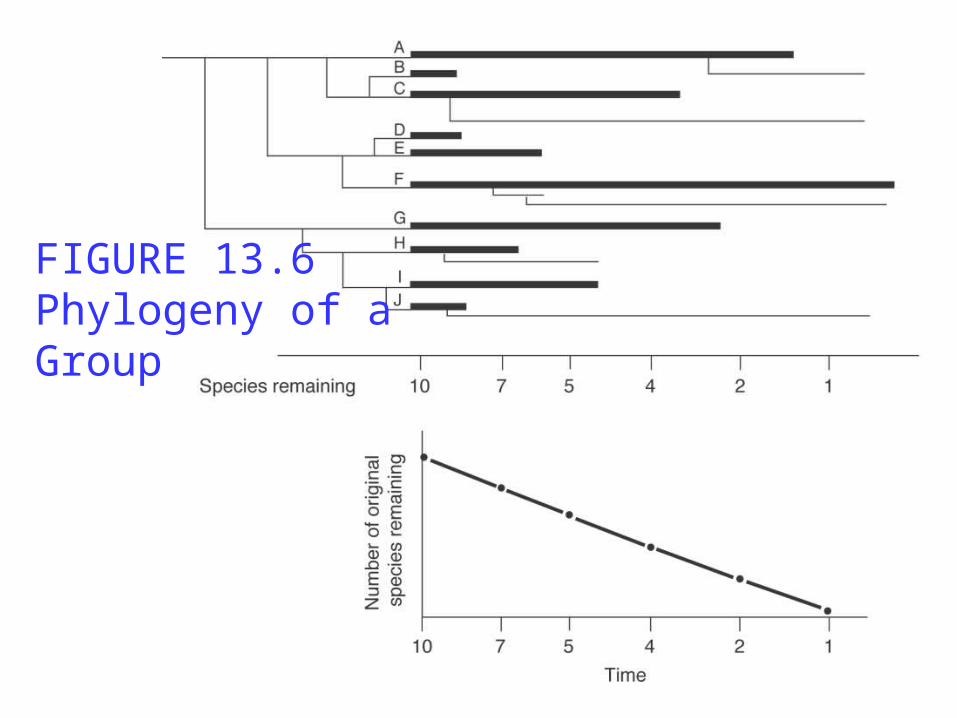
FIGURE 13.6 Phylogeny of a Group
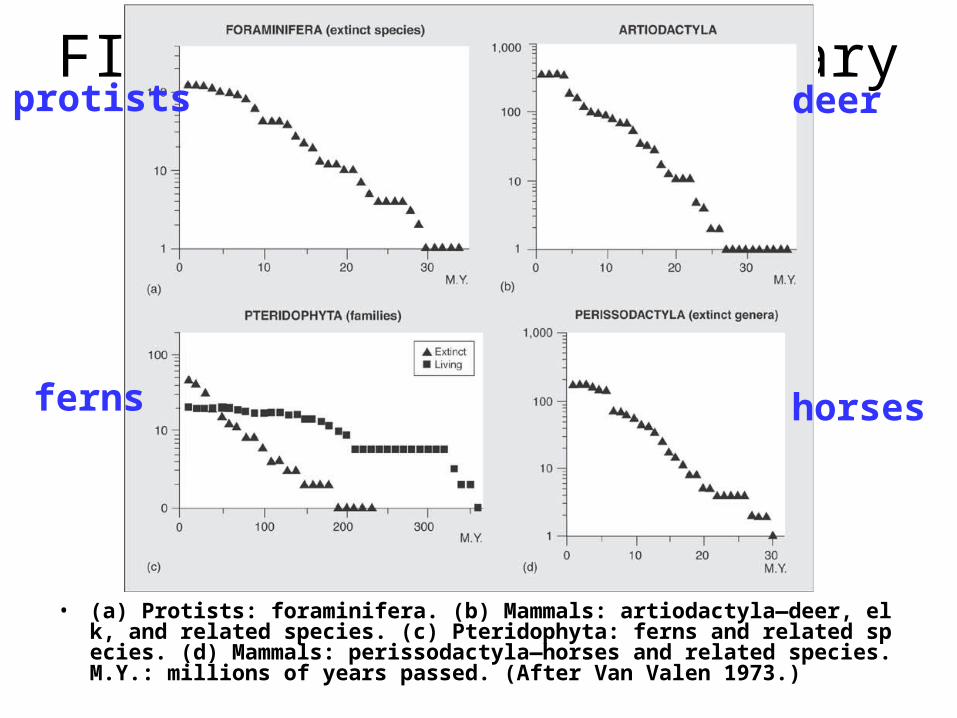
FIGURE 13.7 Evolutionary Survivorship Curves
• (a) Protists: foraminifera. (b) Mammals: artiodactyla—deer, elk, and related species. (c) Pteridophyta: ferns and related species. (d) Mammals: perissodactyla—horses and related species. M.Y.: millions of years passed. (After Van Valen 1973.)
protists deer
ferns horses
• Red Queen Hypothesis.--The "Red Queen" hypothesis is used to describe two similar ideas, which are both based on coevolution.
• The original idea is that coevolution could lead to situations for which the probability of extinction is relatively constant over millions of years (Van Valen 1973).
• The gist of the idea is that, in tightly coevolved interactions, evolutionary change by one species (e.g., a prey or host) could lead to extinction of other species (e.g. a predator or parasite.
• Van Valen named the idea "the Red Queen hypothesis," because, under this view, species had to "run" (evolve) in order to stay in the same place (extant).
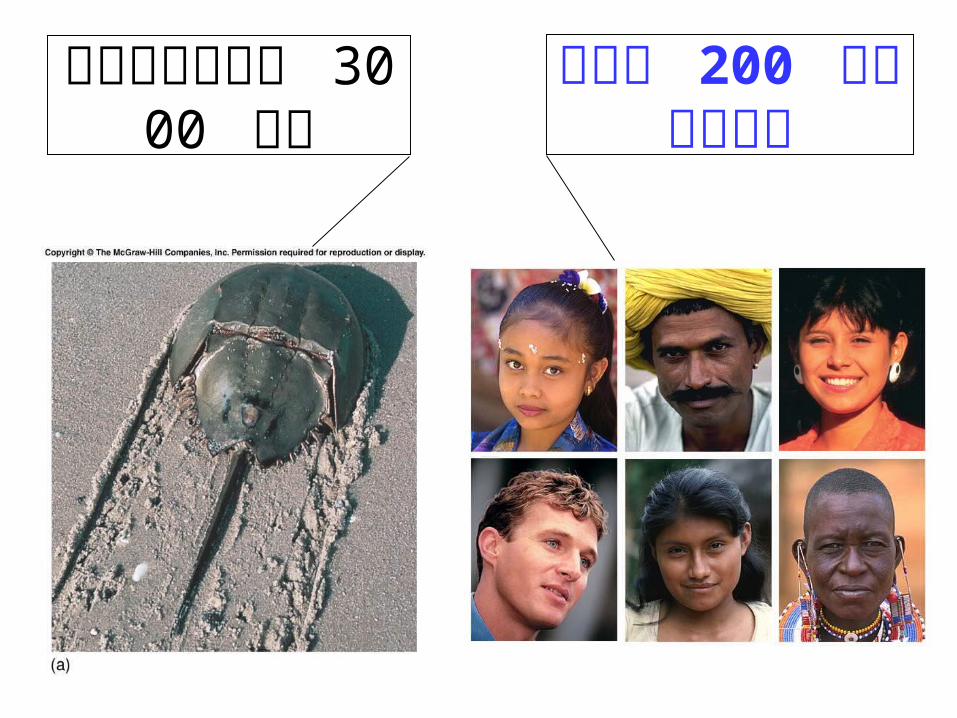
地球可以讓我混 3000 萬年
可以混 200 萬年就不錯了
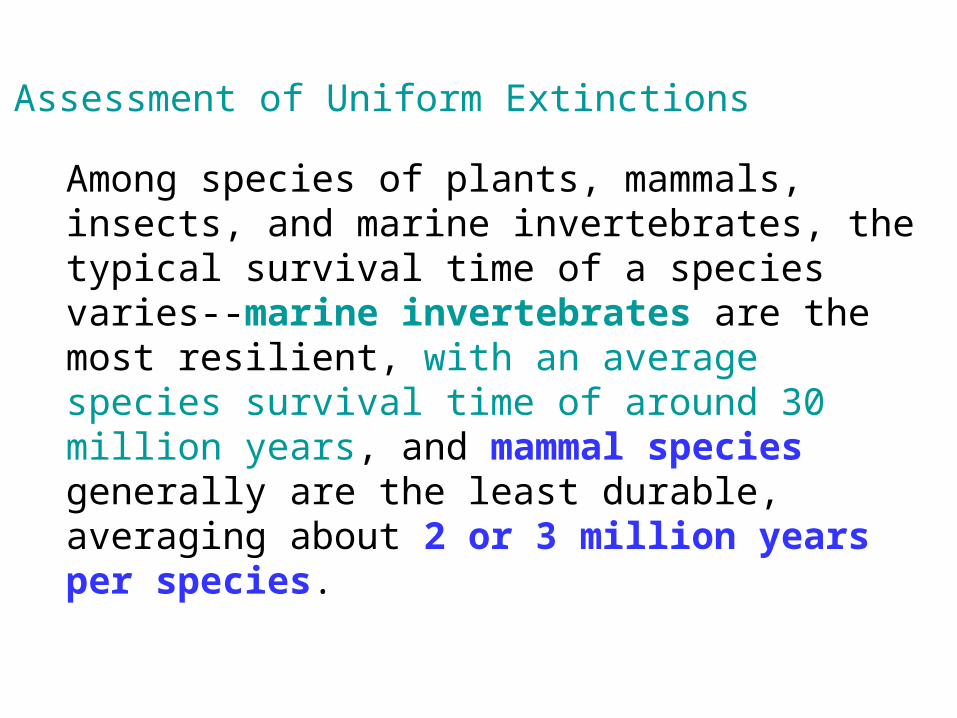
Among species of plants, mammals, insects, and marine invertebrates, the typical survival time of a species varies--marine invertebrates are the most resilient, with an average species survival time of around 30 million years, and mammal species generally are the least durable, averaging about 2 or 3 million years per species.
Assessment of Uniform Extinctions
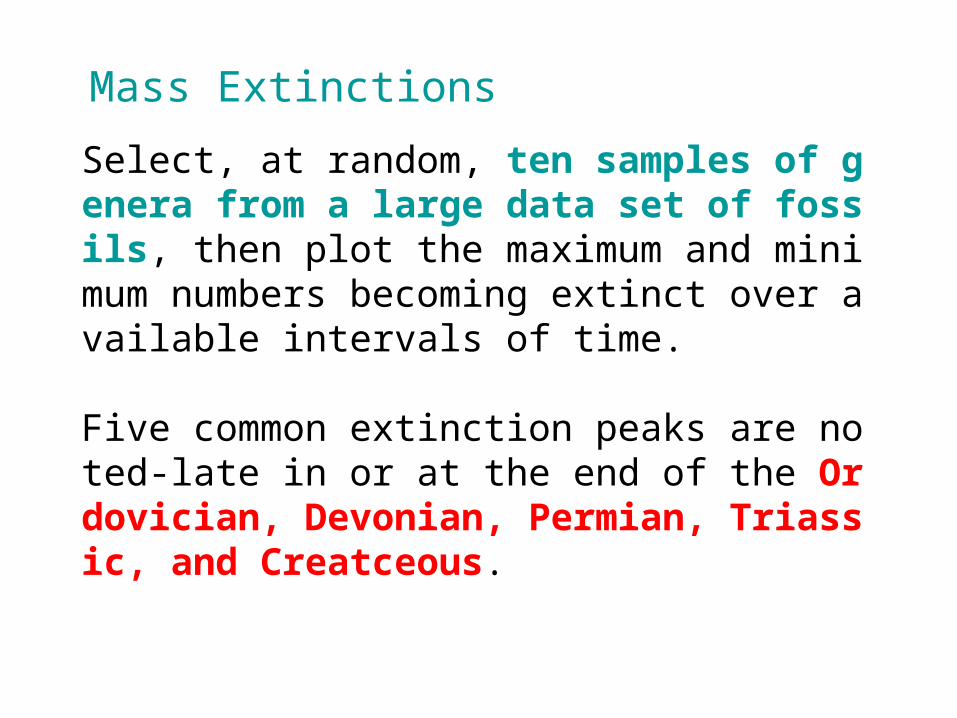
Select, at random, ten samples of genera from a large data set of fossils, then plot the maximum and minimum numbers becoming extinct over available intervals of time.
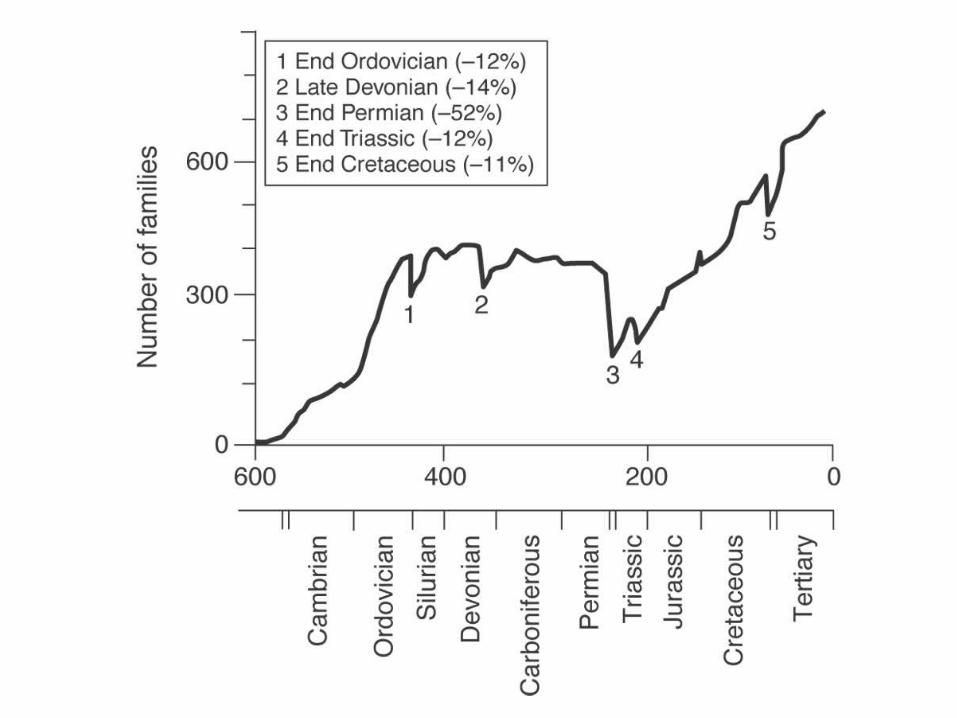
Five common extinction peaks are noted-late in or at the end of the Ordovician, Devonian, Permian, Triassic, and Creatceous.
Mass Extinctions
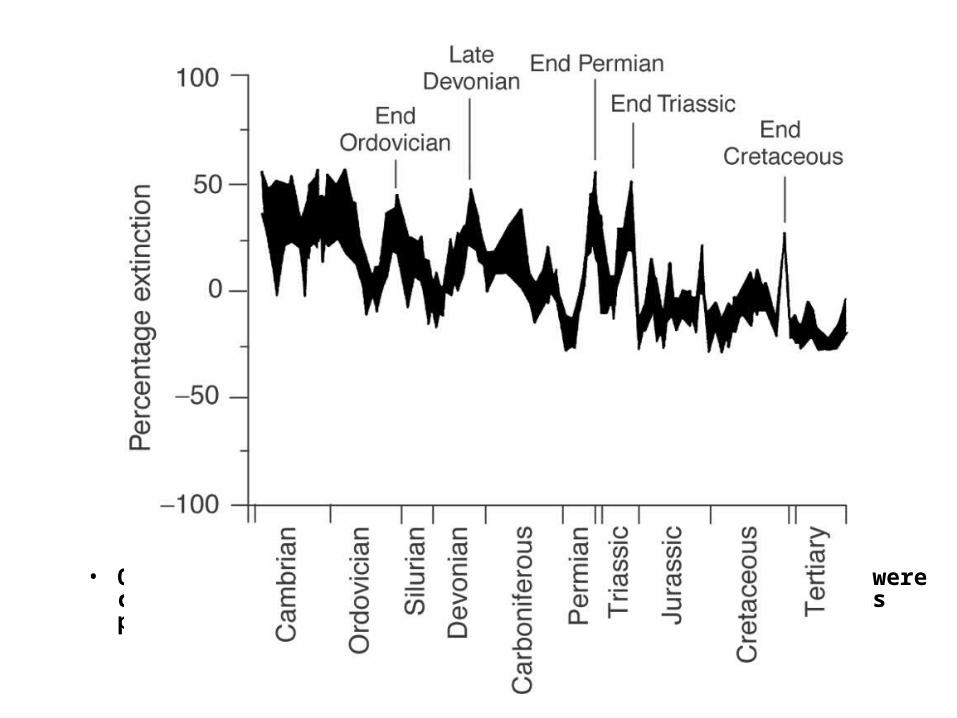
FIGURE 13.8 Extinction Episodes—Random Sample
• Of more than 19,000 genera, 10 samples of 1,000 genera were chosen at random and the percentage becoming extinct was plotted. Major peaks of mass extinction are indicated.
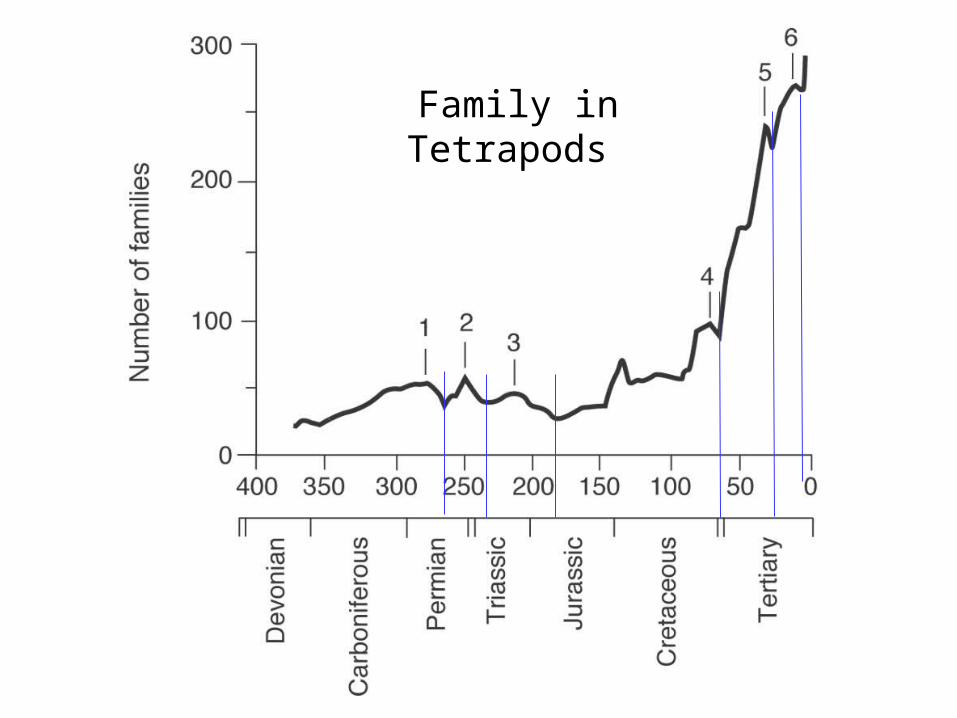
Family in Tetrapods
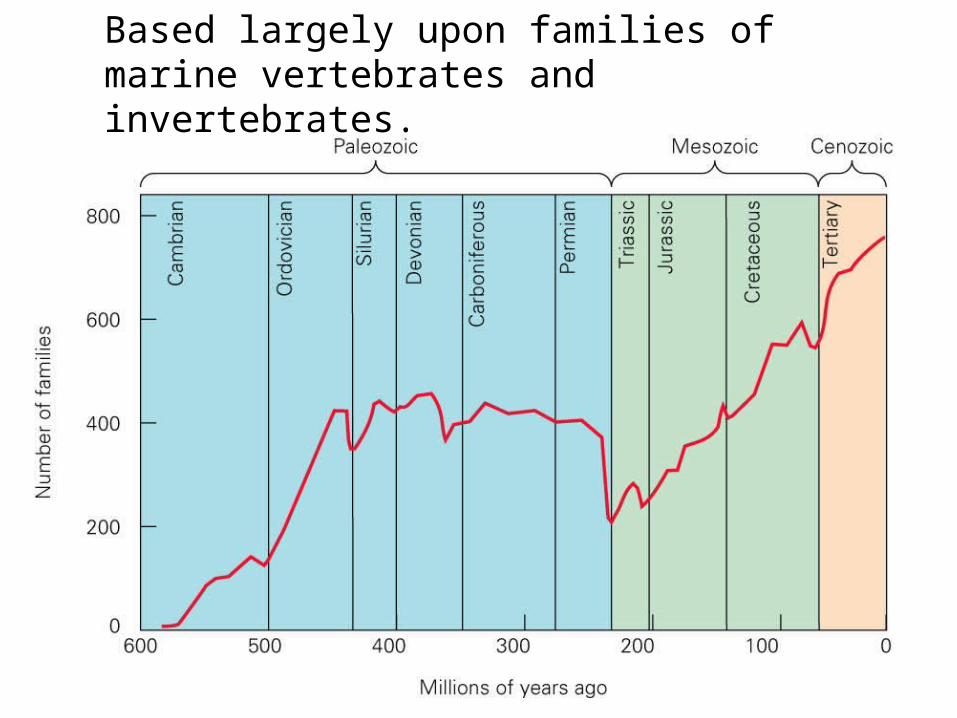
Based largely upon families of marine vertebrates and invertebrates.
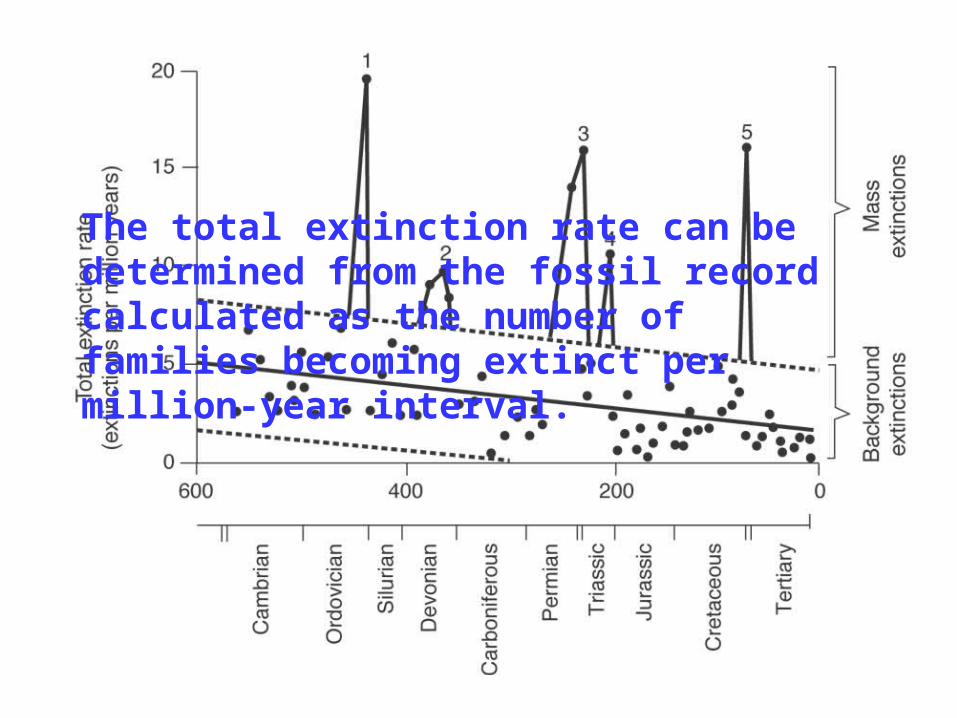
The total extinction rate can be determined from the fossil record calculated as the number of families becoming extinct per million-year interval.
Mass extinctions –case studies
The first occurred at the end of Ordovician, with 85% of marine species becoming extinct within about 10 million years.
The late-Devonian extinction, which lasted less than 3 million years and took an estimated 83% of marine species.
At the end of the Permian, and saw a loss of 53% of marine invertebrate families.
At the end of the Triassic, lasted 4 million years, and took many land vertebrates, but up to 80% of all marine species.
At the end of the Cretaceous, taking all the dinosaurs, many large marine reptiles, small foraminifera, and many other marine species, over a period of about 1 million years.
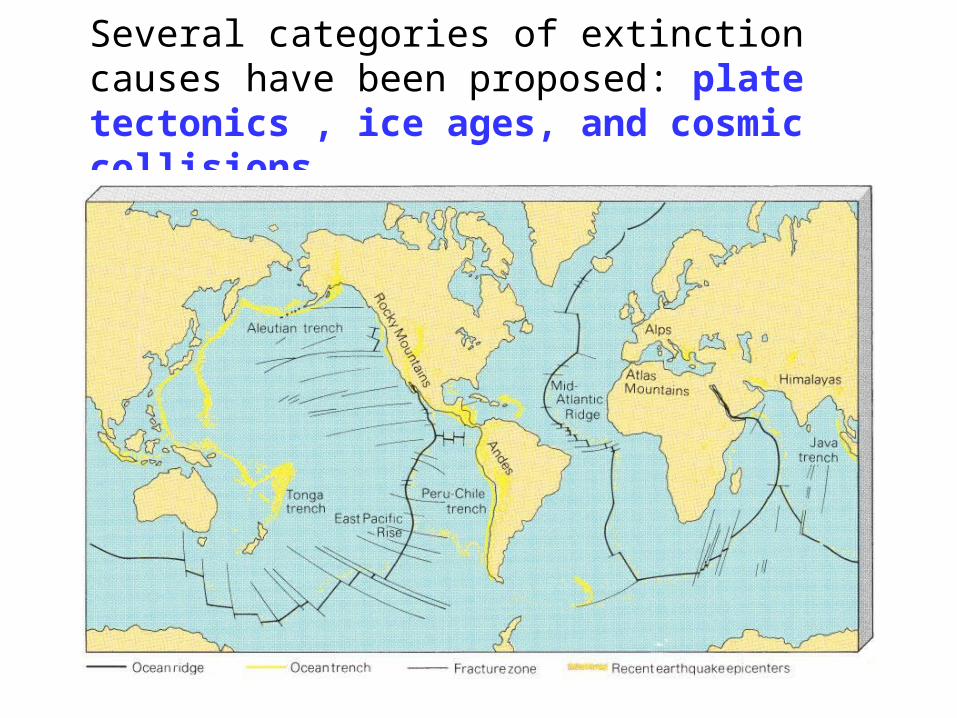
Several categories of extinction causes have been proposed: plate tectonics , ice ages, and cosmic collisions.
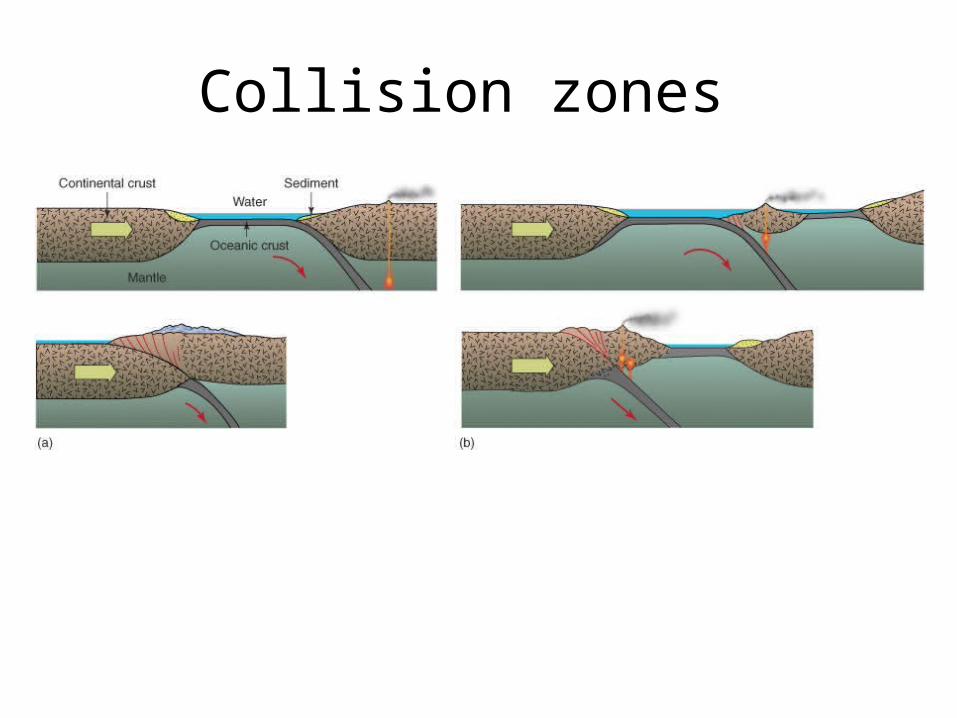
Collision zones
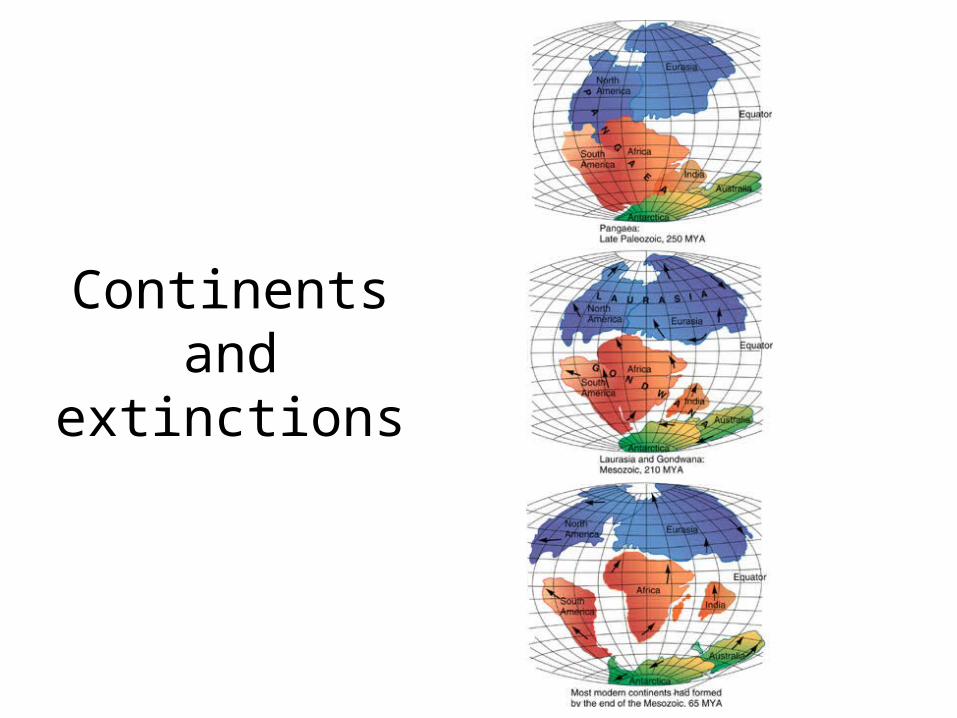
Continents and extinctions
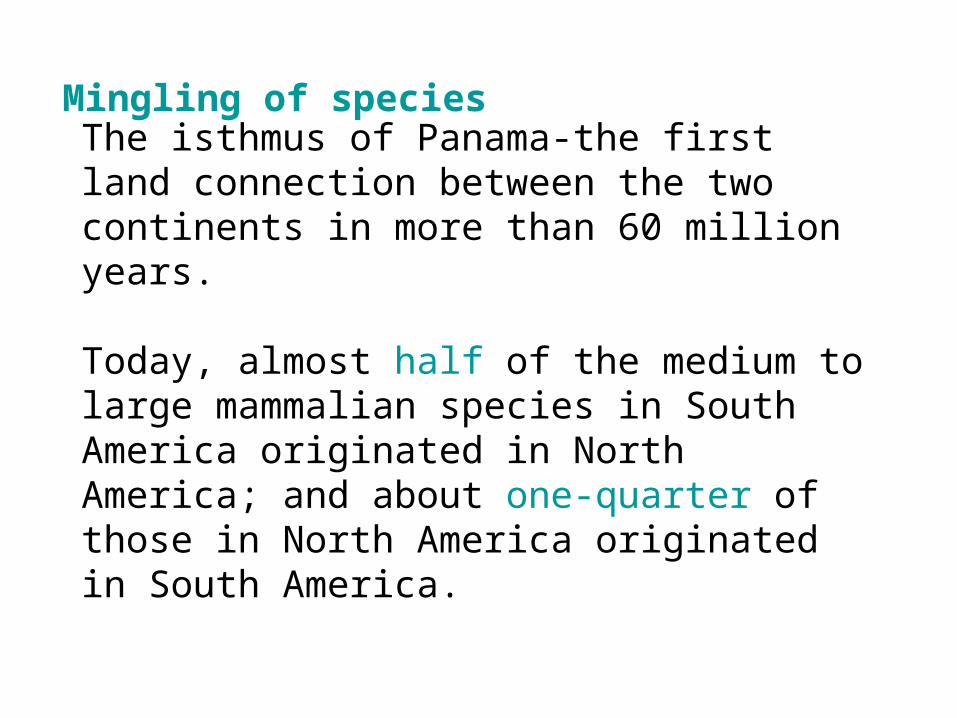
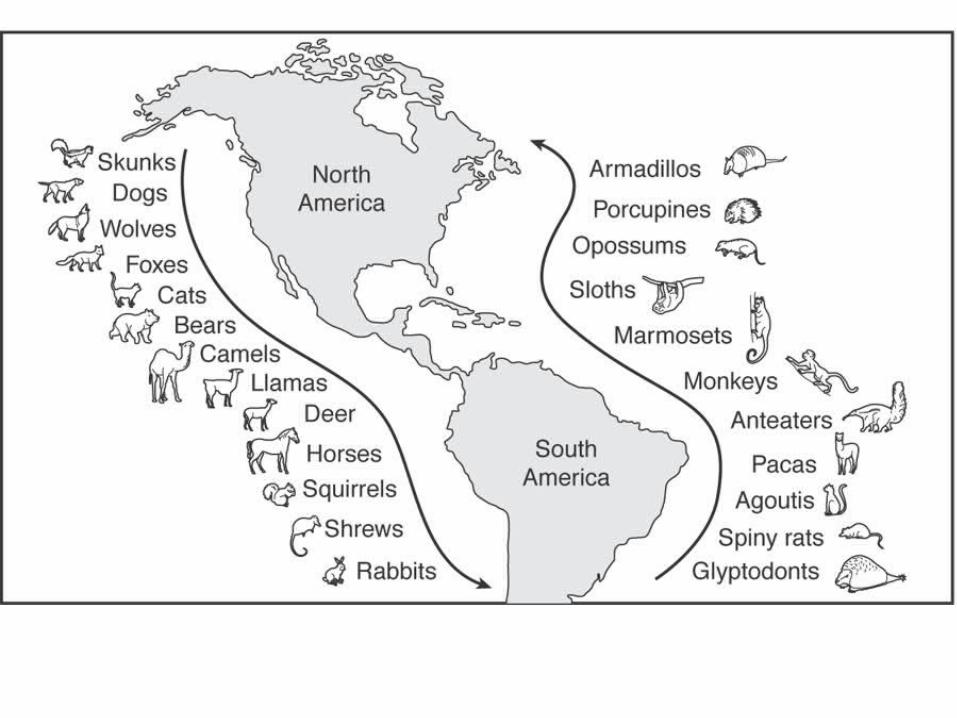
The isthmus of Panama-the first land connection between the two continents in more than 60 million years.
Today, almost half of the medium to large mammalian species in South America originated in North America; and about one-quarter of those in North America originated in South America.
Mingling of species
On each of the separated continents, organisms
were accommodated to each other. But with the s
udden, on a geologic time scale, appearance of n
ew competitors arriving across the land bridge, th
e co-evolutionary dynamics were suddeningly cha
nged. There were new competitors, and little ti
me to adapt.
自然的外來者 vs 入侵者
competition
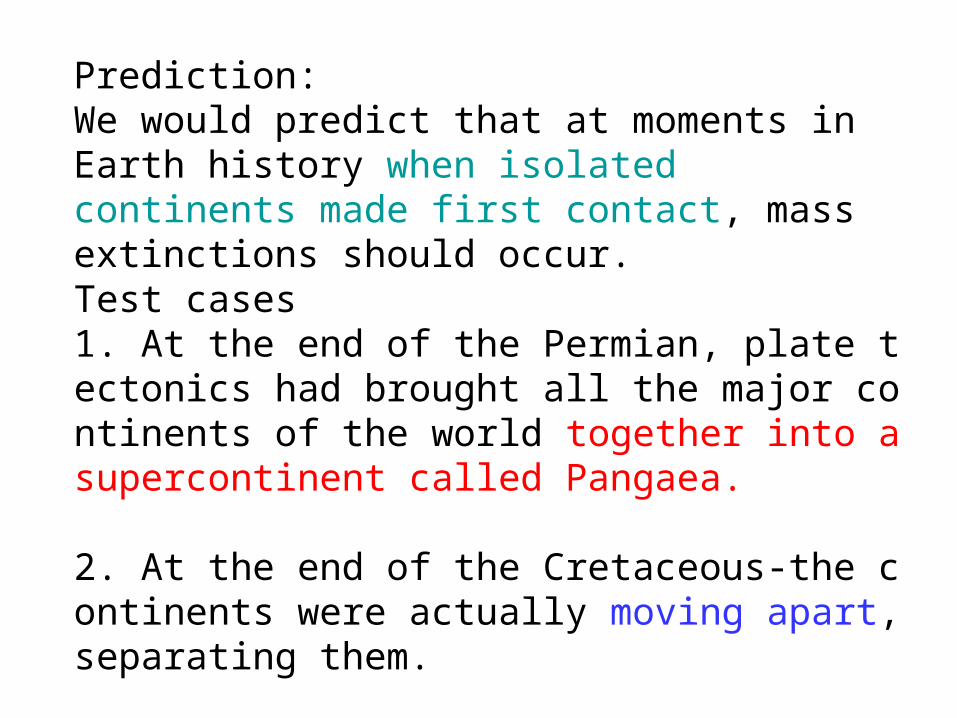
Prediction:We would predict that at moments in Earth history when isolated continents made first contact, mass extinctions should occur.
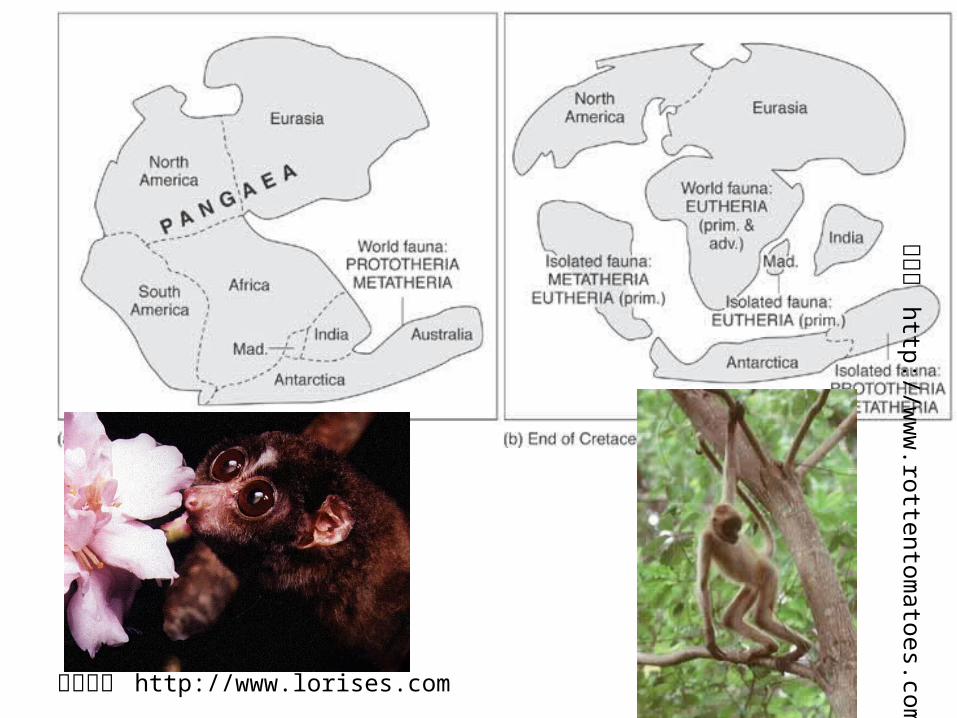
Test cases1. At the end of the Permian, plate tectonics had brought all the major continents of the world together into a supercontinent called Pangaea.
2. At the end of the Cretaceous-the continents were actually moving apart, separating them.
Trophic stability
The more stable the trophic resources, the more species; conversely, the more unstable the trophic resources, the fewer the species.
When continents come together, trophic resources are unstable, leading to low numbers of species
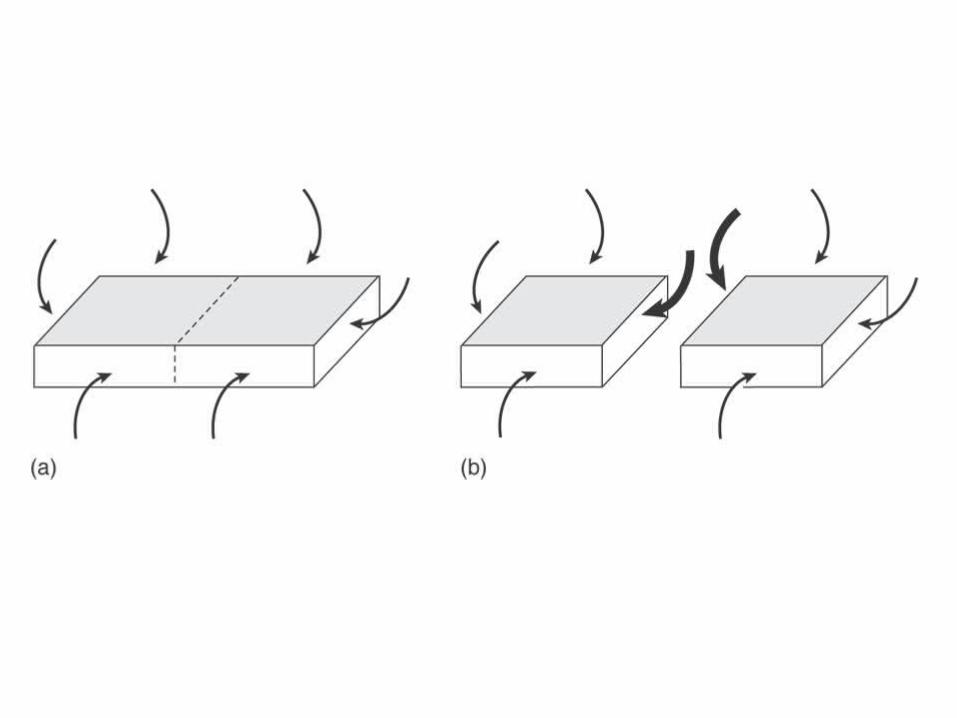
When the same landmass is broken up into separate continents, trophic resources are more stable and more species.
The reason is that when a large continent breaks up into separate, smaller continents, the surrounding ocean has more influence in moderating the continental climate.
Predictions:When plate tectonics bring continents together into one supercontinent, mass extinctions should occur.
Fragments into separate continents, mass extinctions should be absent.
Test cases1. the end of the Permian2. the end of the Cretaceous fragmenting into the smaller and more recognizable continents
所屬網頁 http://www.lorises.com
屬網
頁 http://w
ww
.rottentomatoes.com
/
Changes in sea level
Sea-level changes may result from the influence of plate tectonic activity.
If the ocean basins deepen, sea level along the continental edges drops; if the ocean basins be come more shallow, sea level rises.
Glacial activity,
A drop in sea level has three consequences
First, shallow marine habitat is lost.
Second, a drop in sea level indirectly leads to more severe terrestrial climates of the interior continent.
Third, the groundwater table drops, indirectly leading to dry, even drought, conditions within the interior of the continent.
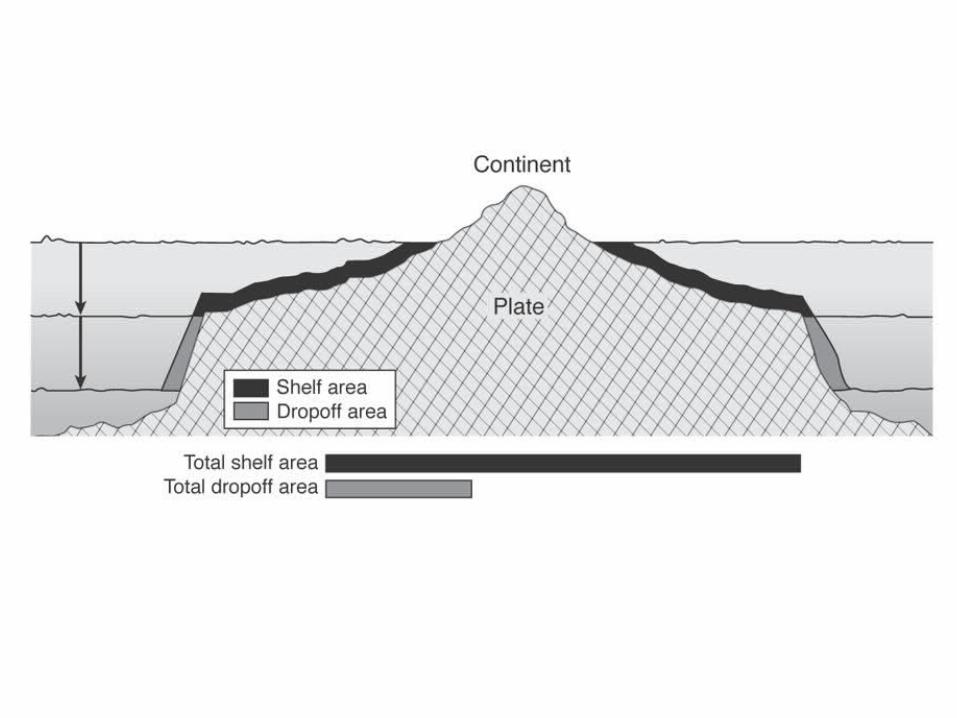
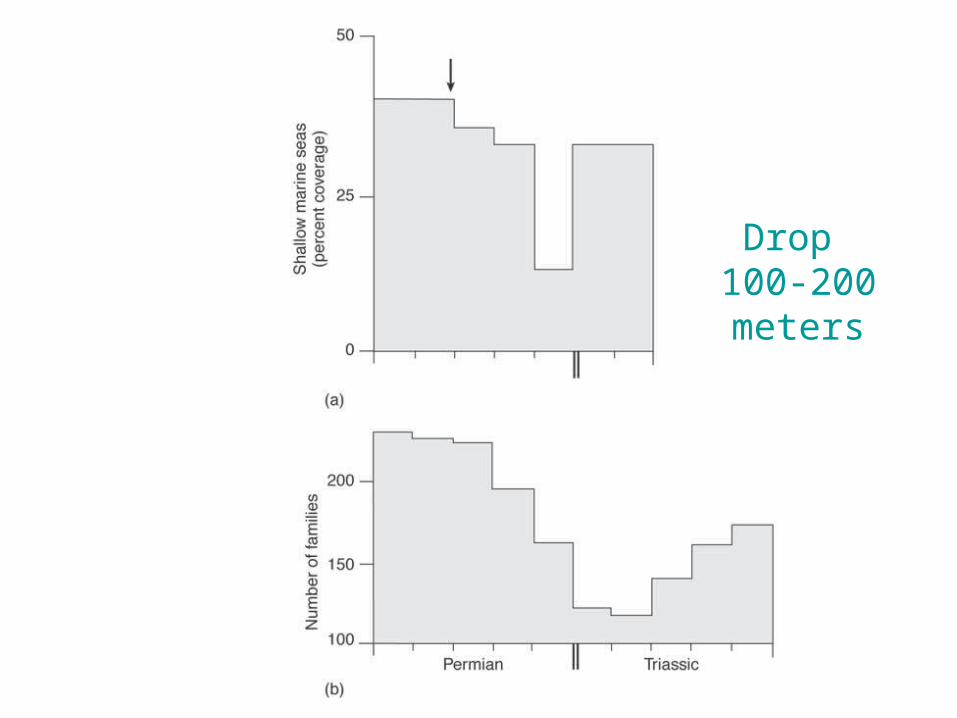
Drop 100-200meters
Predictions:
Mass extinctions should correlate with a drop in sea level. Conversely, a rise in sea level should not coincide with mass extinctions.
1. at the end of the Permian, the sea level dropped significantly
2. sea level also dropped at the end of the Cretaceous, by some estimates by as much as 150 to 200 meters.
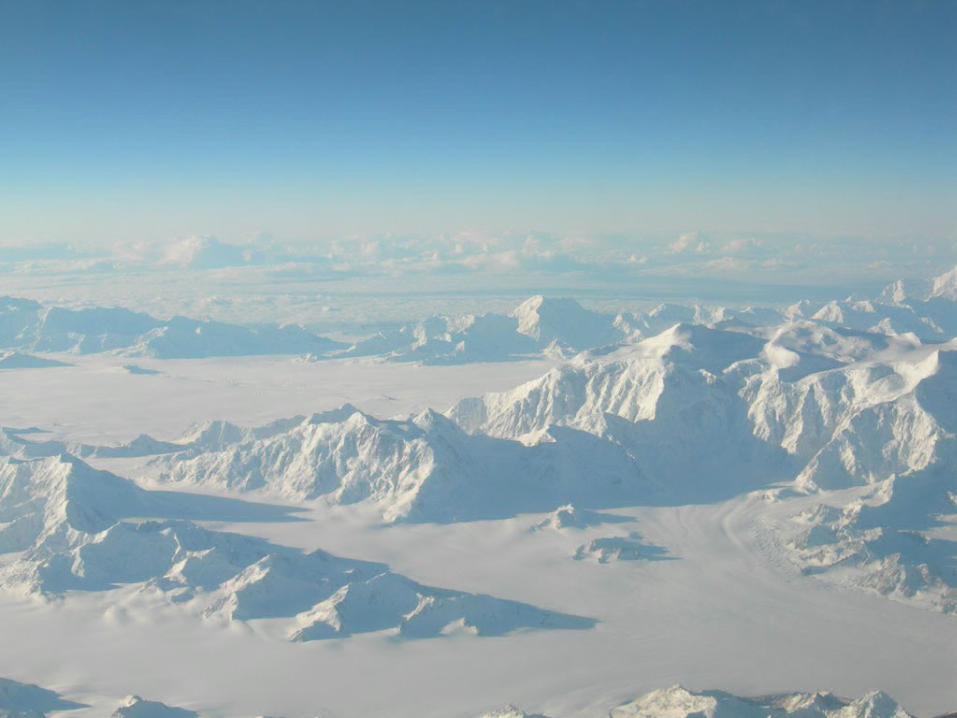
Ice ages we are currently, right now, in an ice age.
One of at least three , during the Phanerozoic. An ice age is made up of cycles wherein there is a glacial phase (climate cools, ice sheets form and spread) and an interglacial phase (climate temporarily warms, ice sheets retreat).
A “wobbling” of the earth on its axis
plate tectonics that might move continents into positions where they intercept and disrupt the flow of warm tropical waters to polar regions.
Reflects more sunlight back into space, and the climate cooling deepens.
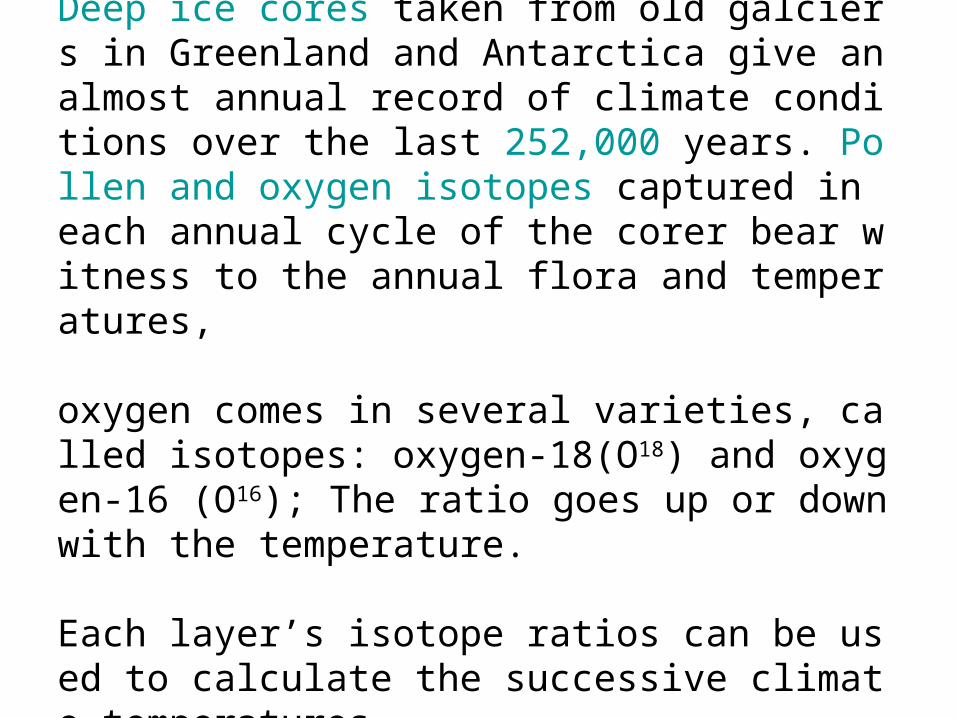
Deep ice cores taken from old galciers in Greenland and Antarctica give an almost annual record of climate conditions over the last 252,000 years. Pollen and oxygen isotopes captured in each annual cycle of the corer bear witness to the annual flora and temperatures,
oxygen comes in several varieties, called isotopes: oxygen-18(O18) and oxygen-16 (O16); The ratio goes up or down with the temperature.
Each layer’s isotope ratios can be used to calculate the successive climate temperatures,
The current ice age began about 30 to 40 million years ago,
We are currently enjoying an interglacial phase that began only about 12,000 years ago,
lasted about 100,000 years and was preceded by an interglacial period lasting 20,000 years, and so on back through vacillating cycles over the 30 to 40 million years of the current ice age.
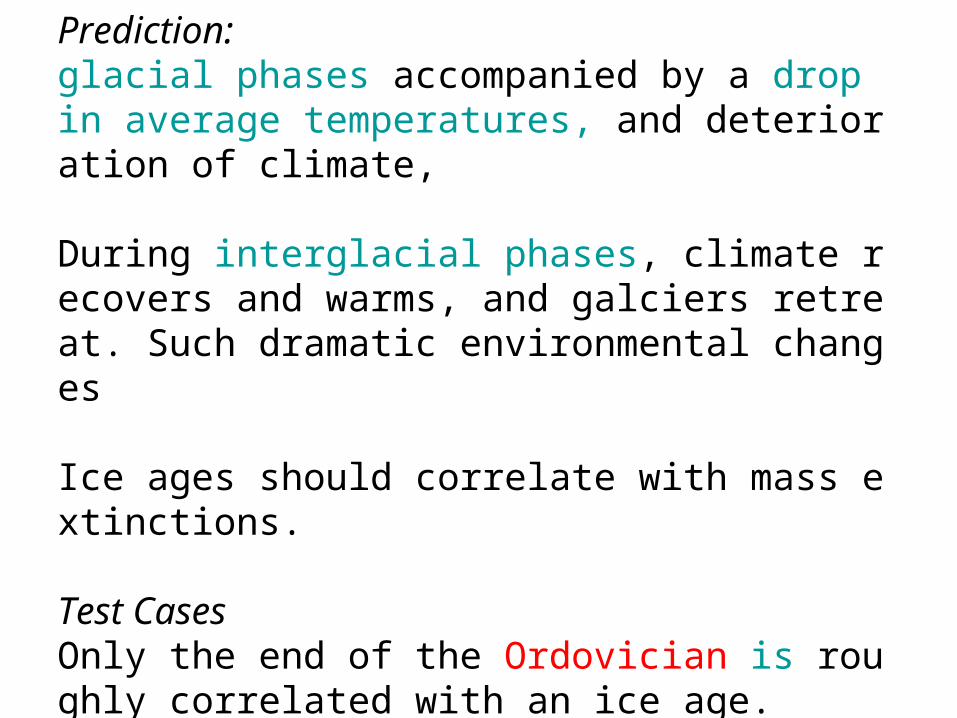
Prediction: glacial phases accompanied by a drop in average temperatures, and deterioration of climate,
During interglacial phases, climate recovers and warms, and galciers retreat. Such dramatic environmental changes
Ice ages should correlate with mass extinctions.
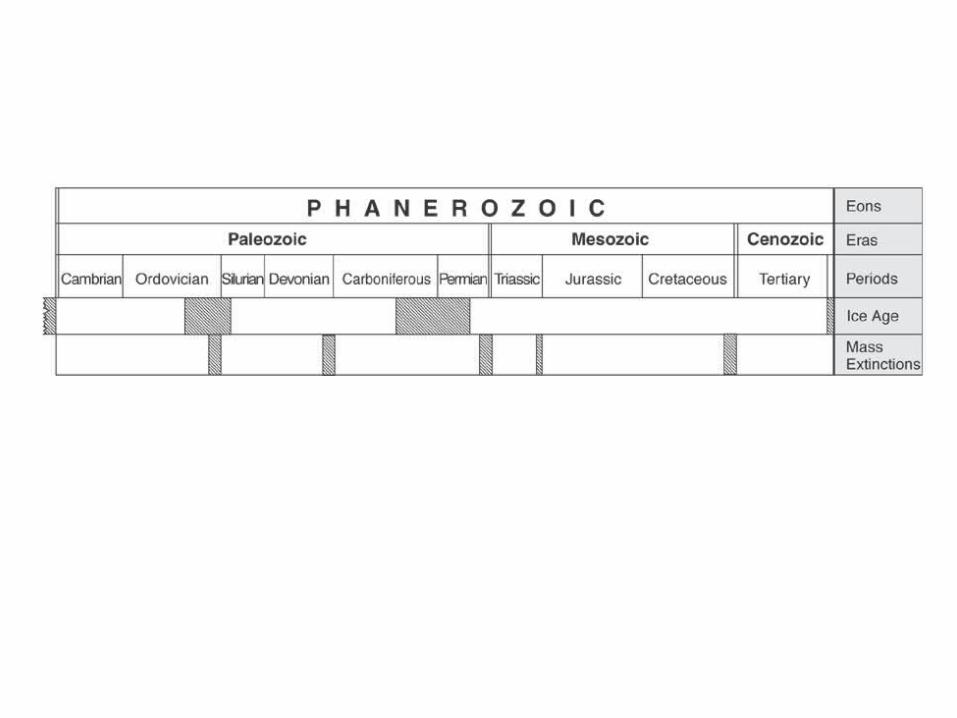
Test CasesOnly the end of the Ordovician is roughly correlated with an ice age.
Asteroid collision with the Earth
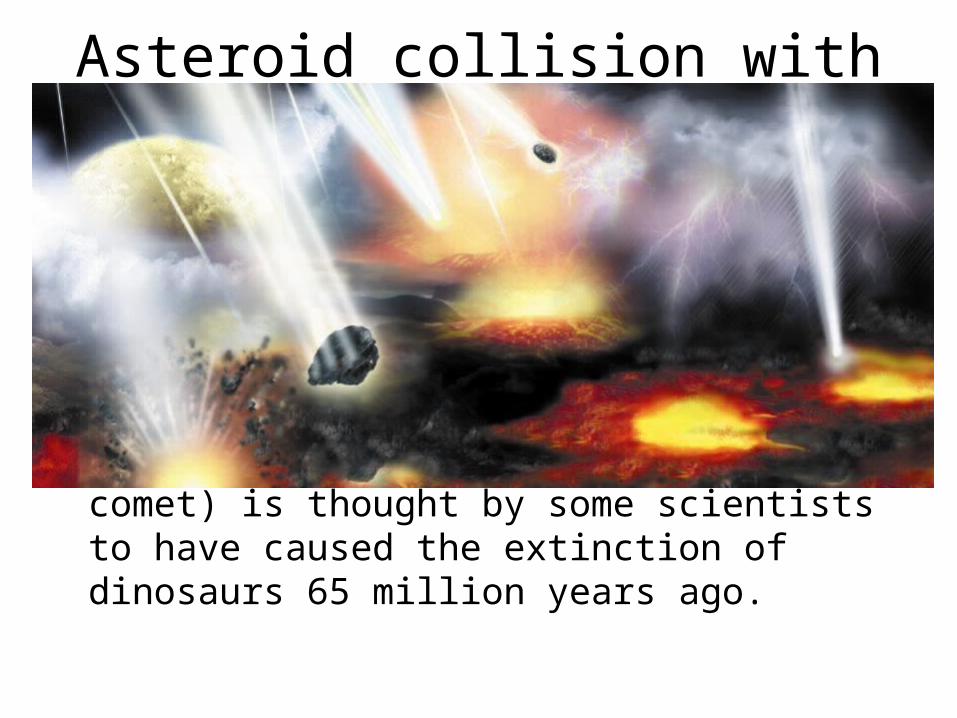
• This figure depicts events on the young planet Earth when, still hot from its cosmic birth, it endured a pummeling by rocky debris 4 billion years ago. This bombardment waned but did not cease entirely. A similar strike by cosmic debris (asteroid or comet) is thought by some scientists to have caused the extinction of dinosaurs 65 million years ago.
Until recently, convincing evidence supported the proposal that earthly extinctions occurred on a regular schedule, about every 26 million years.
Iridium spikes, big jumps in iridium concentration, were documented in rocky formations at the very end of the Cretaceous.
Mineral formed under high heat and pressure
An impact crater at this same time horizon and about 100 miles (150km)
The object that produced it is estimated to have been almost 6 miles (10km) wide.
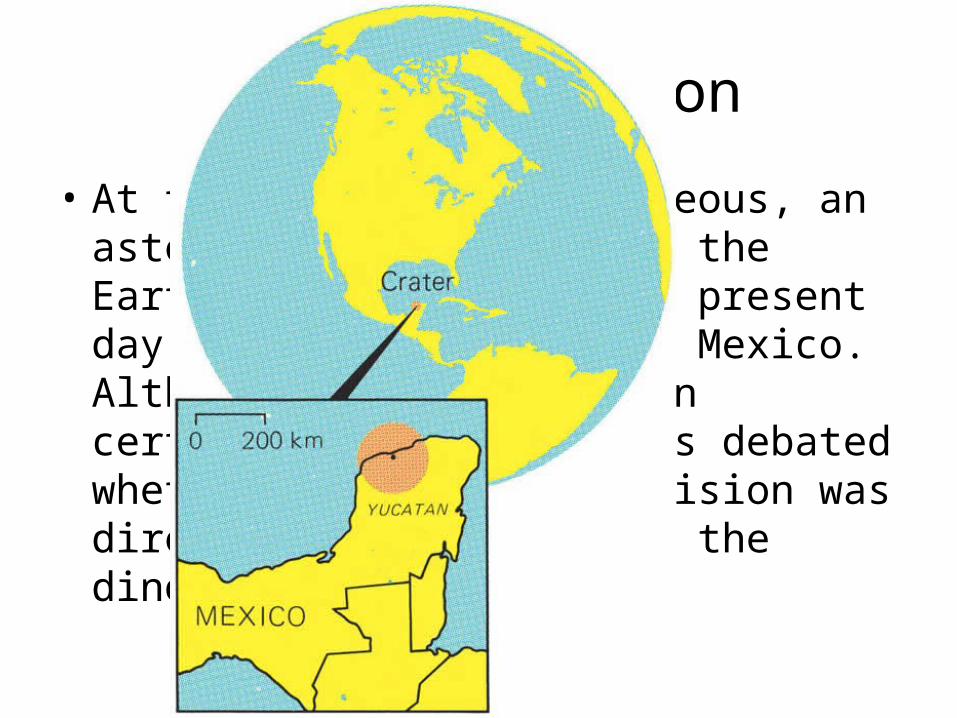
Cosmic collision
• At the end of the Cretaceous, an asteroid or comet struck the Earth in the location of present day Yucatan Peninsula in Mexico. Although such a collision certainly occurred, it is debated whether or not this collision was directly responsible for the dinosaur extinctions.
Critique of Collision Theory
First of all, it is too fast. The scenario of extinctions is completed within years,
Second, dinosaur numbers were already dwindling several million years before the asteroid impact occurred.
Third, the catastrophe was too selective.Amphibians showed no; nor turtles or crocodiles or mammals,
Others have suggested that prolonged volcanism might be the cause.


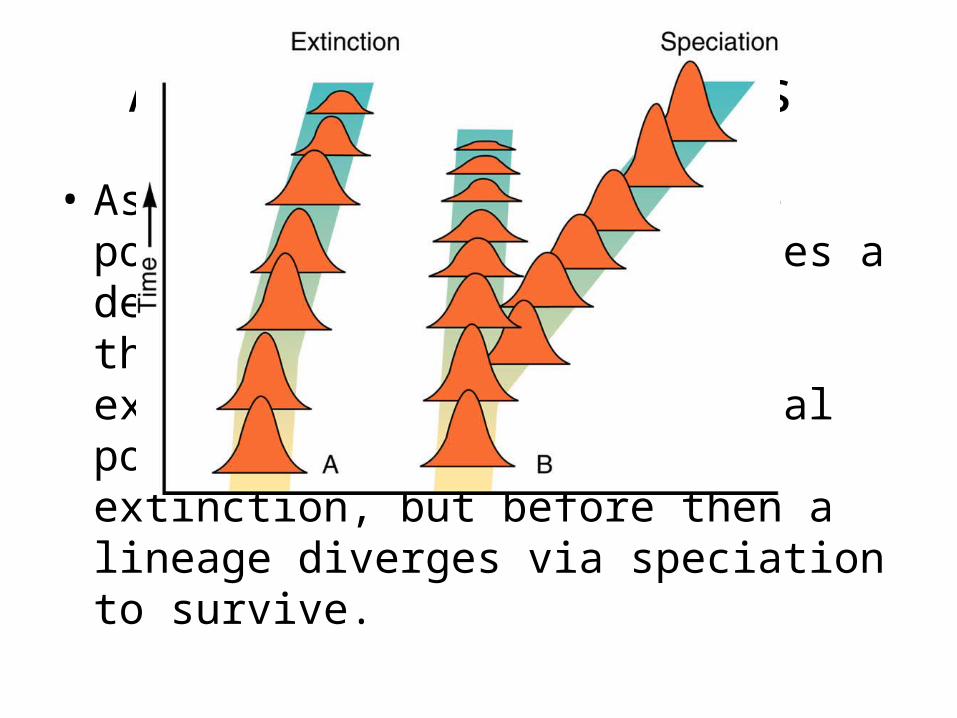
Adapting to changes
• As environment changes, the population at “A” experiences a decline (bell-shaped curve) through time and becomes extinct. At “B,” the original population declines to extinction, but before then a lineage diverges via speciation to survive.

Applied island biogeography
• Principles of island biogeography applied to the management of nature reserves helps make decisions about survival of organisms living in the reserve. In each comparison, design A is superior to B.
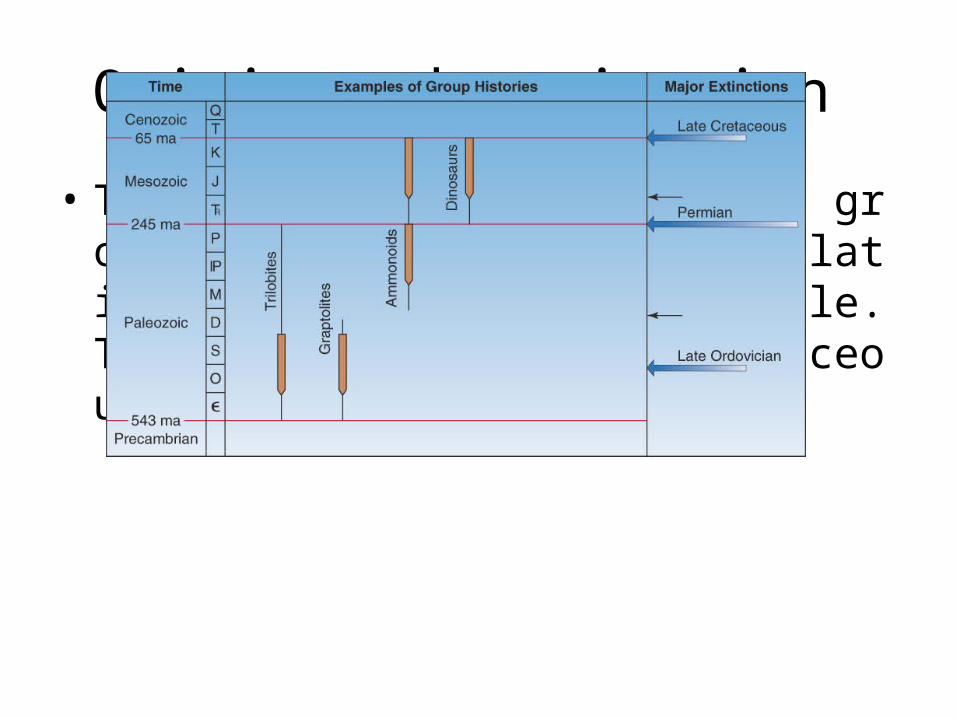
Origin and extinction
• The rise and fall of various groups of animals are shown relative to the geologic time scale. The Permo-Triassic and Cretaceous extinctions are evident.
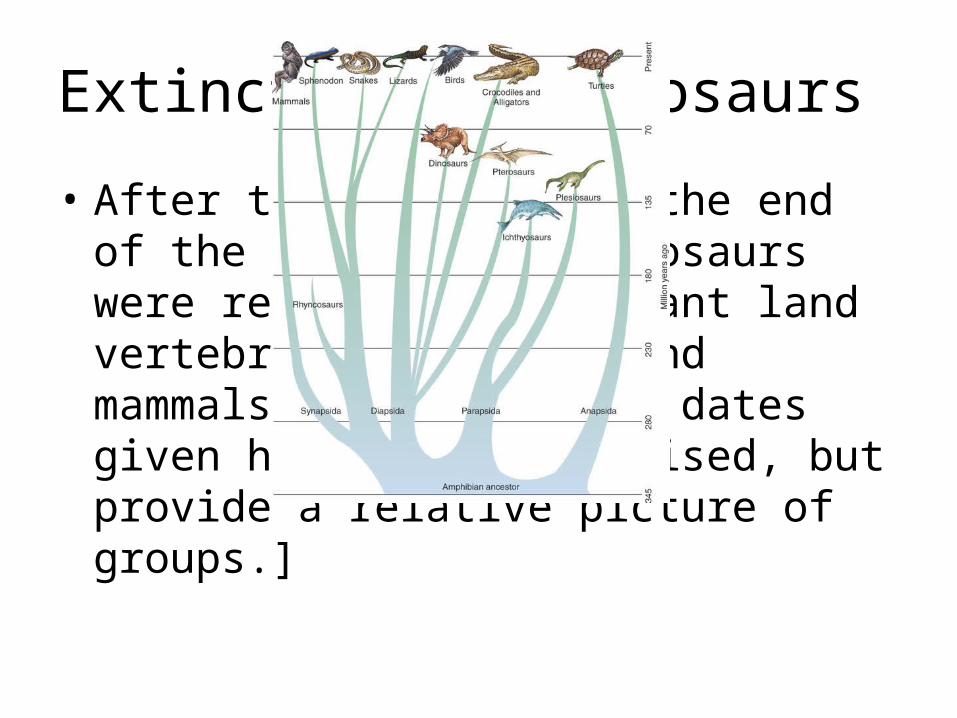
Extinction of dinosaurs
• After their demise at the end of the Cretaceous, dinosaurs were replaced as dominant land vertebrates by birds and mammals. [The geologic dates given here are now revised, but provide a relative picture of groups.]
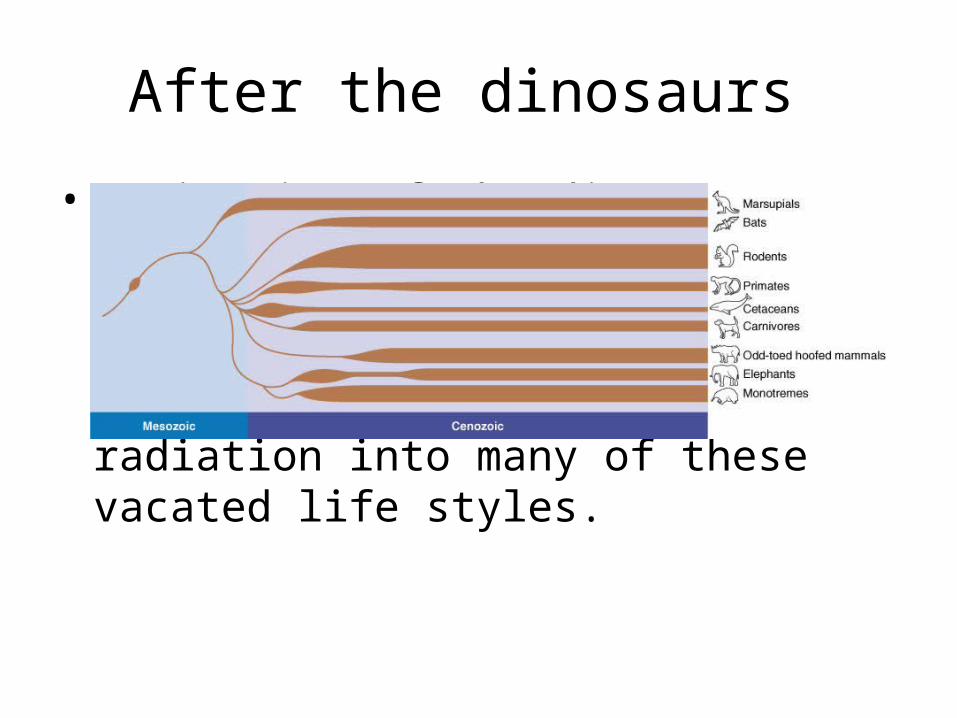
After the dinosaurs
• Extinction of the dinosaurs left may ecological niches empty. In part, the subsequent flourishing of mammals and birds represents an adaptive radiation into many of these vacated life styles.