Embed Size (px)
Citation preview

1
Fighting Inflation
Thank you for inviting me. The Fixed Income Money Market and Derivatives
Association of India (FIMMDA) has been playing an important role in the Indian
bond, money and derivatives markets. It has been working with the Reserve Bank in
various capacities and has helped us address emerging challenges. I thank all of you
for that. The sessions in the conference are all of current interest, and therefore I
have chosen to speak on an issue, inflation, which is of paramount relevance to fixed
income markets.
As you know, the Reserve Bank for India was constituted “to regulate the
issue of Bank notes and the keeping of reserves with a view to securing monetary
stability in India and generally to operate the currency and credit system of the
country to its advantage”. Implicit in these words are the core purposes of the RBI:
to foster monetary and financial stability conducive to sustainable economic growth,
and to ensure the development of an efficient and inclusive financial system.
Note that the RBI is committed to getting the strongest growth possible for
India – there is no difference between us and North Block on this. We believe the
best way we can foster sustainable growth in the current situation, other than
through developing the financial sector, is through monetary stability -- by bringing
down inflation over a reasonable period of time. More specifically, we intend to bring
CPI inflation down to 8 percent by January 2015 and 6 percent by January 2016.
There are a number of points here that need elaborating. First, are we
choosing to tackle inflation at the expense of growth? Most people believe there is a
short run trade-off between growth and inflation. By raising interest rates, the RBI
causes banks to raise rates and thus lowers demand; firms do not borrow as much
to invest when rates are higher and individuals stop buying durable goods against
credit and, instead, turn to save. Lower demand growthleads to a better match
between demand and supply, and thus lower inflation for the goods being produced,
but also lower growth.
Relatedly, if lower rates generate higher demand and higher inflation, people
may produce more believing that they are getting more revenues, not realizing that
high inflation reduces what they can buy out of the revenues. Following the
saying,“You can fool all the people some of the time”, bursts of inflation can generate

2
growth for some time. Thus in the short run, the argument goes, higher inflation
leads to higher growth.
But as the public gets used to the higher level of inflation, the only way to fool
the public again is to generate yet higher inflation. The result is an inflationary spiral
which creates tremendous costs for the public. Therefore, economists have argued –
and a number of Nobel prizes have been given for the ideas contained in the
previous paragraphs – that the best way for the central bank to generate growth in
the long run is for it to bring down inflation.Sooner or later, the public always
understands what the central bank is doing, whether for the good or for the bad. And
if the public starts expecting that inflation will stay low, the central bank can cut
interest rates significantly, thus encouraging demand and growth. Indeed, the reason
the Malaysian Central Bank can keep rates low today to foster growth is because it
has fought the battle against inflation and convinced its citizens that, if need be, it will
smote the inflationary beast again if it rears its head.
Put differently, in order to generate sustainable growth, we have to fight
inflation first. Let me also add that greater public faith that inflation will be low will add
stability to our currency, and prevent the kind of gyrations we saw last summer.
Exchange rate stability is centrally in business interests.
If we have to bring down inflation, we have to start today. We cannot wait till
the public’s expectations of inflation get more entrenched, and the inflationary spiral
gains momentum. This is why we have raised interest rates 3 times since
September.
But what about industrialists who tell us to cut rates? I have yet to meet an
industrialist who does not want lower rates, whatever the level of rates. But will a
lower policy interest rate today give him more incentive to invest? Weat the RBI think
not. First, we don’t believe the primary factor holding back investment today is high
interest rates. Second, even if we cut rates, we don’t believe banks, who are paying
higher deposit rates, will cut their lending rates. The reason is that the depositor,
given her high inflationary expectations, will not settle for less than the rates banks
are paying her. Inflation is placing a floor on deposit rates, and thus on lending rates.
Currently, therefore, we do not believe the policy rate is at a level where it can affect
demand, one way or the other. We do believe, however, that as inflation comes
down because of the weak economy and strong food production, the policy rate will
3
become a stronger influence on bank interest rate setting, and will start influencing
demand.
A more important source of our influence today, therefore, is expectations. If
people believe we are serious about inflation, and their expectations of inflation start
coming down, inflation will also come down.Of course, many people form
expectations simply by extrapolating the most recent or most salient experience they
have. So we also need to take advantage of the current episode of food price
disinflation to bring down expectations – yet another reason for acting now.
Let us turn from answering those who want us to go slow to those who want us to do
more. If we think inflation is so important, why don’t we “do a Volcker” and try and
bring down inflation quickly by raising rates sky high? Of course, if we do raise policy
rates substantially, banks will also have to raise rates to match us. While this may
lead to a collapse in demand and bring inflation down quickly, it will cause significant
damage to the economy – remember the severe recession Volcker’s Fed brought
about and the Savings and Loan Crisis that followed? A developing country is not in
the same resilient position as the United States. Rather than administer shock
therapy to a weak economy, the RBI prefers to dis-inflate over time rather than
abruptly, while being prepared to do what is necessary if the economy deviates from
the projected inflation path. As of now, we believe the rate is appropriately set.
Then there are those who believe we are moving too independently. All we
have done thus far is to adopt the reasonable suggestion of the Patel Committee that
we focus on CPI inflation rather than WPI inflation as our primary objective. The
Patel Committee has also suggested a time horizon to glide down to 6 percent
inflation that seems doable without extreme hardship. If the eventual decision of the
government, in consultation with the Reserve Bank, is to adopt the recommendations
of the Mistry, CFSR, FSLRC and the Patel Committees, and focus on some form of
an inflation objective, it would be good for the medium term inflation target to be set
by the executive or legislature, advised by the Reserve Bank. The Patel Committee
report is out there for public comment and debate, and once we collect and analyse
comments, we will take an internal view and then start deliberations with the
government. All this said, international experience suggests that, ideally, once the
central bank’s objective is given, and the operational target fixed, the government
should leave the technocrats in the central bank to do their job.

4
Finally, does the Patel Committee intend to turn the RBI into inflation “nutters”
focused on bringing down inflation to the exclusion of all else, including financial
stability? Of course not! Medium term flexible inflation targeting means that the
monetary policy committee focuses on inflation over the medium term, being
concerned about too high, as well as too low, inflation. That means it may be willing
to overlook temporary inflation spikes (such as this November’s inflation numbers)
but also raise rates when sustained low interest rates and low inflation increase
threats to financial stability – because a financial crisis could lead to deflation. In
other words, the monetary policy committee will not put on blinkers and see just the
inflation number. A number of emerging markets have adopted some form of
targeting, while “non-targeters” like the Fed target inflation in all but name, including
putting a numerical target to its goal of price stability.
In the remaining time, I want to present one more issue that has many
commentators exercised – they say the real problem is food inflation, how do you
expect to bring it down through the policy rate? The simple answer to such critics is
that core CPI inflation, which excludes food and energy, has also been very high,
reflecting the high inflation in services. Bringing that down is centrally within the
RBI’s ambit.But I will argue that policy is not irrelevant even in controlling food
inflation, though clearly, the government also has an important role to play.
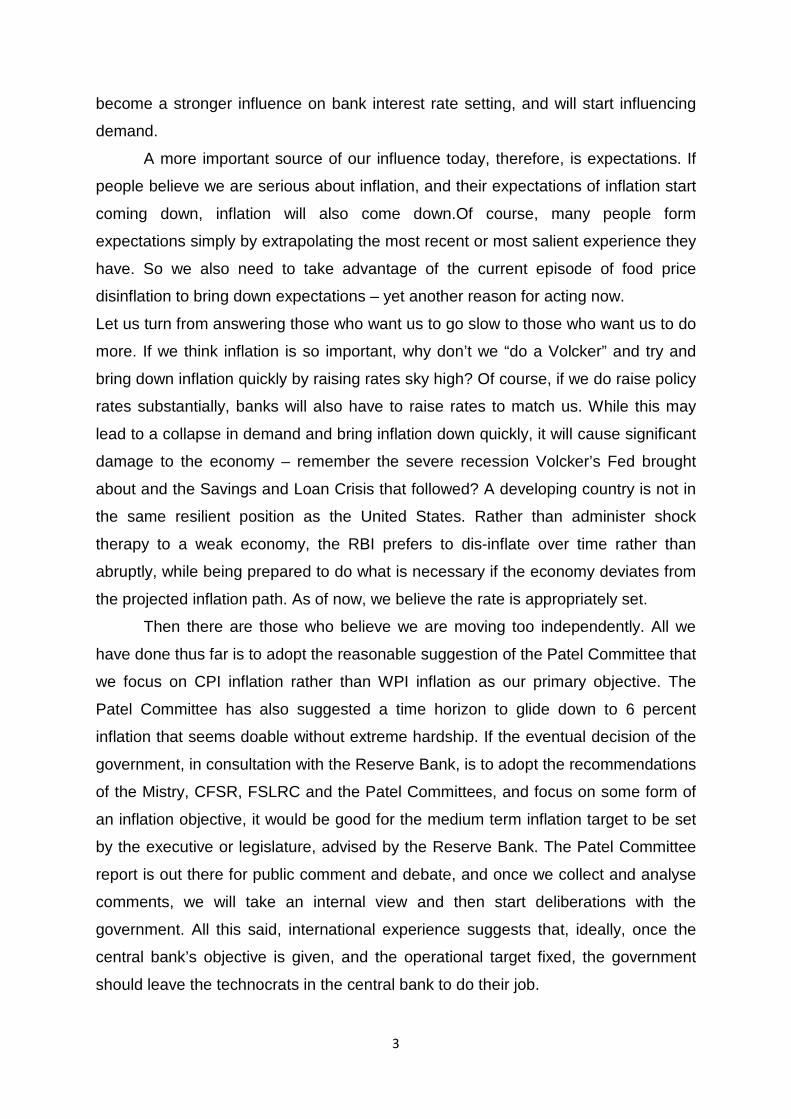
1. Role of food prices in the high inflation experience of recent years Headline inflation measured by the new CPIhas remained in double digitsduring
April 2012 to January 2014, averaging 10 per cent over this period.Food inflation,
which has a weight of 47.6 per cent in the index, has contributed the largest share of
headline inflation (Chart 1). Food inflation itself has stayed in double digits
throughout this period, edging down to 9.9 per cent only in January 2014.
5
Chart 1: Contribution to CPI Inflation
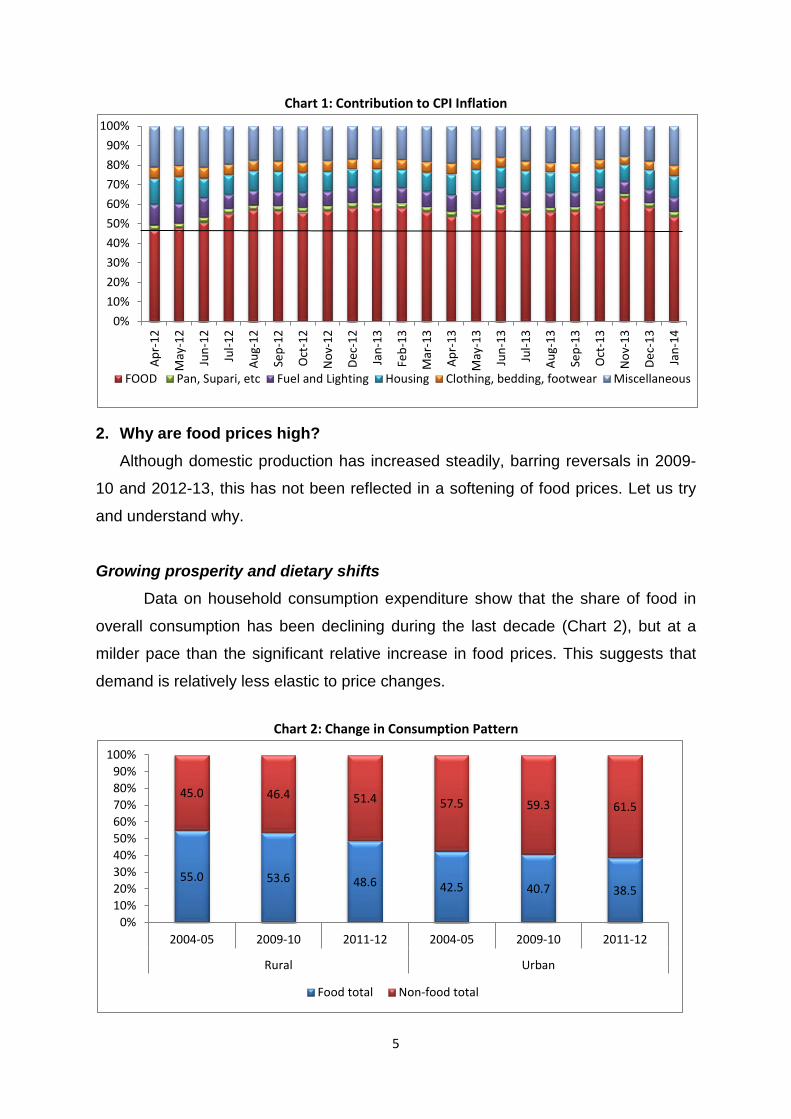
2. Why are food prices high? Although domestic production has increased steadily, barring reversals in 2009-
10 and 2012-13, this has not been reflected in a softening of food prices. Let us try
and understand why.
Growing prosperity and dietary shifts
Data on household consumption expenditure show that the share of food in
overall consumption has been declining during the last decade (Chart 2), but at a
milder pace than the significant relative increase in food prices. This suggests that
demand is relatively less elastic to price changes.
Chart 2: Change in Consumption Pattern
0%10%20%30%40%50%60%70%80%90%
100%
Apr-
12
May
-12
Jun-
12
Jul-1
2
Aug-
12
Sep-
12
Oct
-12
Nov
-12
Dec-
12
Jan-
13
Feb-
13
Mar
-13
Apr-
13
May
-13
Jun-
13
Jul-1
3
Aug-
13
Sep-
13
Oct
-13
Nov
-13
Dec-
13
Jan-
14
FOOD Pan, Supari, etc Fuel and Lighting Housing Clothing, bedding, footwear Miscellaneous
55.0 53.6 48.6 42.5 40.7 38.5
45.0 46.4 51.4 57.5 59.3 61.5
0%10%20%30%40%50%60%70%80%90%
100%
2004-05 2009-10 2011-12 2004-05 2009-10 2011-12
Rural Urban
Food total Non-food total

6
Despite the decline in overall consumption share, per capita food
consumption in real terms has increased, particularly in rural areas (Chart 3).
Chart 3: Per Capita Food Consumption in Real Terms
Note: Deflators used are CPI-AL for Rural consumption and CPI-IW for urban consumption
There has also been a distinct shift in dietary patterns towards protein-rich
items and other high value foods (Chart 4 and Chart 5). These items, in turn, have
been contributing significantly to overall food price increases in the recent period. Chart 4: Change in Dietary Pattern
0
50
100
150
200
250
300
350
400
2004-05 2009-10 2011-12
Rs. p
er c
apita
per
mon
th (2
004-
05
pric
es)
Rural
Food Non-food
0100200300400500600700800900
1000
2004-05 2009-10 2011-12Rs
. per
cap
ita p
er m
onth
(200
4-05
pr
ices
)
Urban
Food Non-food
0
5
10
15
20
25
30
35
40
45
Cerealsand
Subsititues
ProteinRich Items
Vegetablesand Fruits
Others
Shar
e w
ithin
Foo
d Ex
pend
iture
Rural
1993-94 1999-2000 2004-052009-10 2011-12
0
5
10
15
20
25
30
35
40
45
Cereals andSubsititues
Protein RichItems
Vegetablesand Fruits
Others
Shar
e w
ithin
Foo
d Ex
pend
iture
Urban
1993-94 1999-2000 2004-052009-10 2011-12

7
Chart 5: Monthly per Capita Quantity Consumed (in kgs)
* Egg consumption is in number
Other PossibleCauses of High Food Price Inflation a. Minimum Support Price
One obvious cause for higher food price inflation that analysts have pointed to is
higher minimum support prices (MSP). The minimum support price is set by the
government on the recommendations of the CACP, based on a variety of factors
including primarily the cost of production and price trends in the market (domestic
and international). The crops covered under MSP constitute more than a third of the
category ‘primary articles’ in the WPI. Since minimum support prices are intended to
be a floor for market prices, and have sometimes directly set the market price when
increases have been substantial, for key cropsthe rate of price inflation seems to
relate to the increase in MSP in recent years (Chart 6).
0
2
4
6
8
10
12
Cereals Pulses Milk Eggs* Fish &meat
EdibleOil
Rural
2004-05 2009-10
0
2
4
6
8
10
Cereals Pulses Milk Eggs* Fish &meat
EdibleOil
Urban
2004-05 2009-10

8
Chart 6: MSP change and Inflation during 2005-06 to 2012-13
Another way of saying this is that there has been a shift in the relative price of
agricultural commodities, engineered by the rise in MSPs. If the idea is to get more
food production to meet the rising demand we documented, this is just what is
needed. In Chart 7 (a), we plot the ratio of WPI of food to WPI of non-food items.
This suggests an appreciable improvement in terms of trade for agriculture.
Chart 7: MSP and Internal Terms of Trade of Agricultural Commodities
But when we look at the ratio of changes in input cost over the changes in the
output price of agricultural commodities received on the basis of CACP data, it has
0
2
4
6
8
10
12
14
16
18
PaddyCommon
CoarseCereals
Wheat Gram Arhar Moong Urad
Per c
ent
MSP increase WPI inflation
0.0
40.0
80.0
120.0
160.0
200.0
1975
-76
1978
-79
1981
-82
1984
-85
1987
-88
1990
-91
1993
-94
1996
-97
1999
-00
2002
-03
2005
-06
2008
-09
2011
-12
Inde
x 20
04-0
5=10
0
a. MSP and Terms of Trade
MSP(WPI weights) TOT (based on WPI)
60
80
100
120
140
160
1950
-51
1953
-54
1956
-57
1959
-60
1962
-63
1965
-66
1968
-69
1971
-72
1974
-75
1977
-78
1980
-81
1983
-84
1986
-87
1989
-90
1992
-93
1995
-96
1998
-99
2001
-02
2004
-05
2007
-08
2010
-11
Inde
x, B
ase:
Trie
nniu
m e
ndin
g 19
90-9
1 =
100
TOT based on WPICACP-DES measure of TOT
Sources: DIPP, CACP, DES
b. Changes in input prices to changes in output prices

9
remained flat, indicating that the gains from MSP increases have not accrued to the
farm sector in full measure on account of rising costs of inputs. This may indicate
why production growth has not been stronger. What could explain this?
One explanation could be that MSPs also drive input costs, so increasing
MSPs is like a dog chasing its tail – it can never catch it. Another could be that since
rice and wheat are the primary food commodities procured at the MSP, production is
distorted towards rice and wheat, leading to a suboptimal production mix by farmers
– too much rice and wheat, and too little of other needed commodities. Both these
explanations would suggest the need for more moderation as the government sets
the MSPs in coming months. It is useful though, to look at the details of the cost increases. Prices of
agriculturalinputs, including wages, have recorded a sharp increase during 2008-09
through 2012-13 in comparison with the preceding five years (2004-05 to 2007-08)
as shown below (Table 1). Perhaps the most significant increase has been in rural
wages.
Table 1: Increases in Select Farm Input Prices (Annual average, per cent)
2004-05 to 2007-08 2008-09 to 2012-13
Food Articles 7.3 11.4 Fertilizers and Pesticides 1.7 7.8 Fodder 1.3 19.5 Gola (Cattle Feed) 12.2 10.2 High Speed Diesel 4.5 8.0 Electricity (Agricultural) 2.3 8.7 Tractors 3.6 5.4 Wages (Average) 6.2 17.3 Source: Ministry of Commerce, Ministry of Labour
For example, wage increases have accounted for the largest share of
increase in paddy input costs (Chart 8).

10
Chart 8: Variable Cost of Paddy Cultivation
Nominal rural wages have grown at a sharp pace during the last five years.
Because so many Indian workers are at subsistence wages, higher food prices do
drive rural wages higher, and there is some evidence for this before 2007. From
2007 onwards, however, econometric tests suggest causality has flowed from wages
to prices, underscoring the role of rural wages as a major determinant in food price
increases. So why has rural wage growth been so strong?
b. Mahatma Gandhi National Rural Employment Guarantee Act (MGNREGA)
A sharp pickup in rural wages was seen after the rural employment guarantee
program (assuring 100 days of employment to every household whose adult
members volunteer to do unskilled manual work) was enacted. MGNREGA may
have contributed to the bargaining power of rural workers, but careful econometric
studies suggest that it accounts for only a small fraction of the rural wage increase,
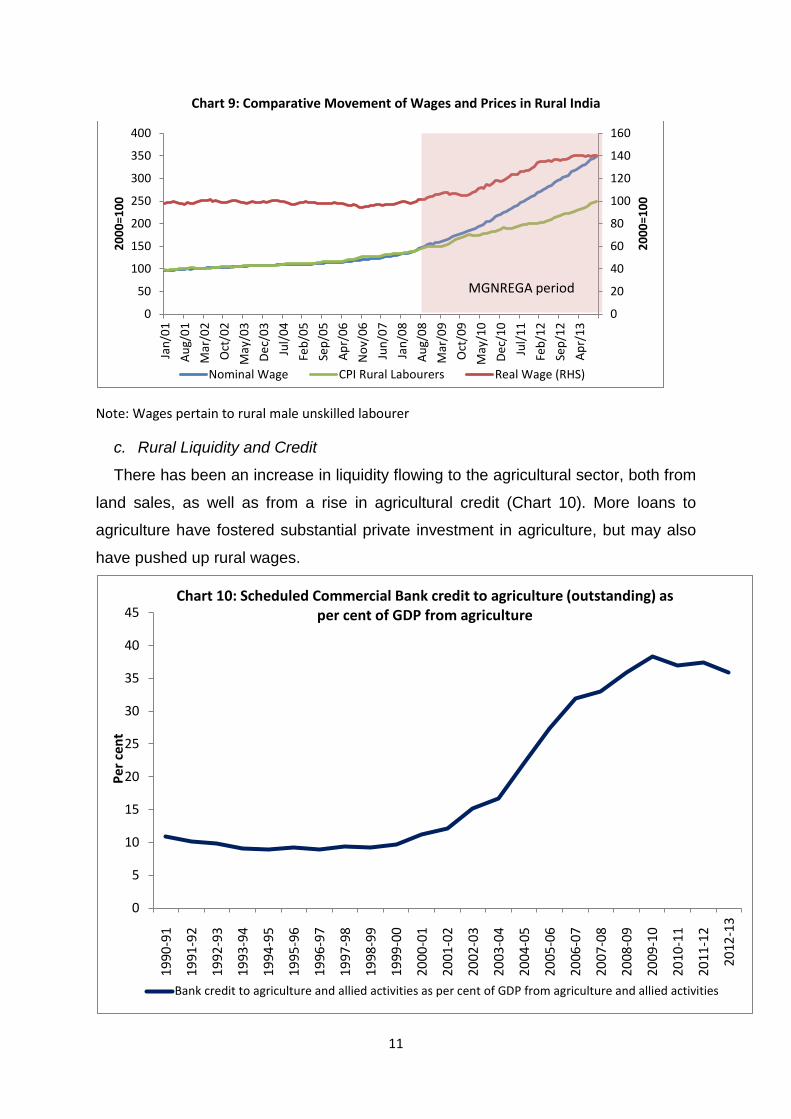
and indeed, any effect is waning (Chart 9).That said, the indexation of MGNREGA
wages suggests its effects in pushing rural wage inflation will not disappear entirely.
-10.0
-5.0
0.0
5.0
10.0
15.0
20.0
ANDHRAPRADESH
BIHAR ORISSA PUNJAB TAMIL NADU UTTAR PRADESH WEST BENGAL
Cont
ribut
ion
in P
erce
ntag
e Po
ints
a:Increase in Cost of Paddy Cultivation: 2004-05 to 2009-10
Human Labour Bullock Labour Fertilizer Insecticide Irrigation Machine Labour Manure Seeds
-10.0
-5.0
0.0
5.0
10.0
15.0
20.0
25.0
30.0
ANDHRAPRADESH
(14.4)
BIHAR(5.6)
ORISSA(6.9)
PUNJAB(11.1)
TAMIL NADU(5.2)
UTTAR PRADESH(13.2)
WEST BENGAL(15.2)Cont
ribut
ion
in P
erce
ntag
e Po
ints
b:Increase in Cost of Paddy Cultivation: 2009-10 to 2011-12
Human Labour Bullock Labour Fertilizer Insecticide Irrigation Machine Labour Manure Seeds
11
Chart 9: Comparative Movement of Wages and Prices in Rural India
Note: Wages pertain to rural male unskilled labourer
c. Rural Liquidity and Credit
There has been an increase in liquidity flowing to the agricultural sector, both from
land sales, as well as from a rise in agricultural credit (Chart 10). More loans to
agriculture have fostered substantial private investment in agriculture, but may also
have pushed up rural wages.
0
20
40
60
80
100
120
140
160
0
50
100
150
200
250
300
350
400
Jan/
01Au
g/01
Mar
/02
Oct
/02
May
/03
Dec/
03Ju
l/04
Feb/
05Se
p/05
Apr/
06N
ov/0
6Ju
n/07
Jan/
08Au
g/08
Mar
/09
Oct
/09
May
/10
Dec/
10Ju
l/11
Feb/
12Se
p/12
Apr/
13
2000
=100
2000
=100
Nominal Wage CPI Rural Labourers Real Wage (RHS)
MGNREGA period
0
5
10
15
20
25
30
35
40
45
1990
-91
1991
-92
1992
-93
1993
-94
1994
-95
1995
-96
1996
-97
1997
-98
1998
-99
1999
-00
2000
-01
2001
-02
2002
-03
2003
-04
2004
-05
2005
-06
2006
-07
2007
-08
2008
-09
2009
-10
2010
-11
2011
-12
2012
-13
Per c
ent
Chart 10: Scheduled Commercial Bank credit to agriculture (outstanding) as per cent of GDP from agriculture
Bank credit to agriculture and allied activities as per cent of GDP from agriculture and allied activities
12
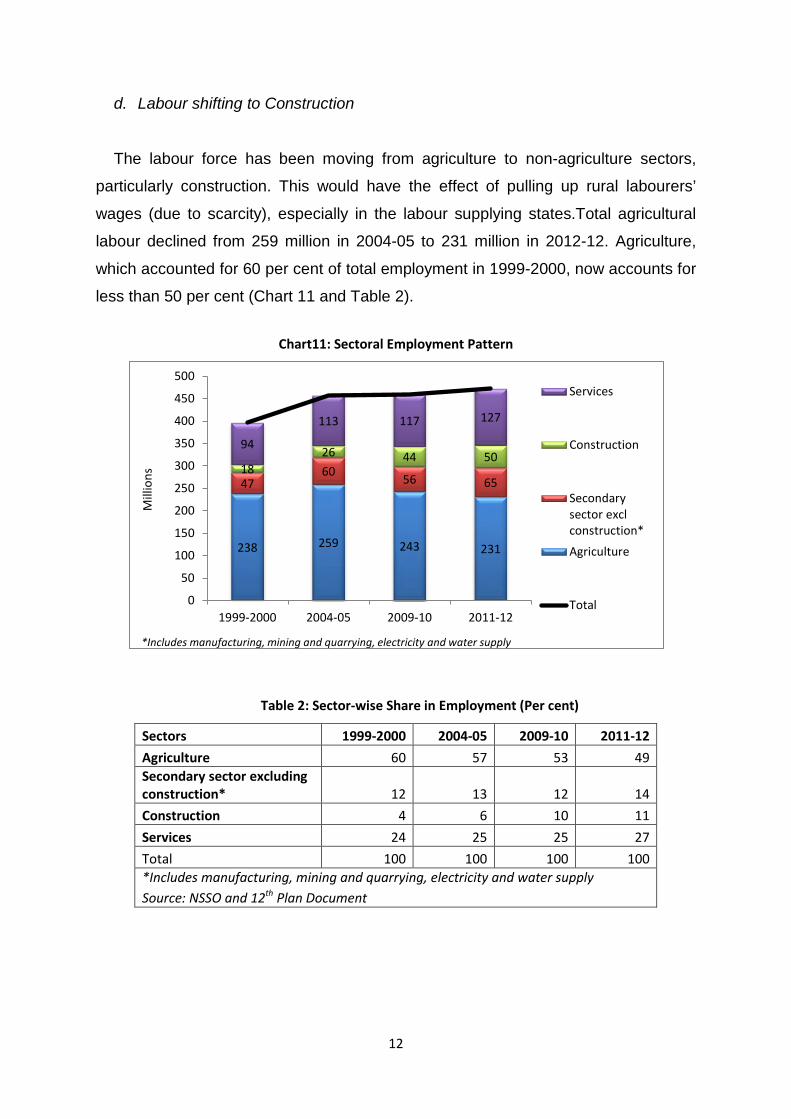
d. Labour shifting to Construction
The labour force has been moving from agriculture to non-agriculture sectors,
particularly construction. This would have the effect of pulling up rural labourers’
wages (due to scarcity), especially in the labour supplying states.Total agricultural
labour declined from 259 million in 2004-05 to 231 million in 2012-12. Agriculture,
which accounted for 60 per cent of total employment in 1999-2000, now accounts for
less than 50 per cent (Chart 11 and Table 2).
Chart11: Sectoral Employment Pattern
Table 2: Sector-wise Share in Employment (Per cent)
Sectors 1999-2000 2004-05 2009-10 2011-12 Agriculture 60 57 53 49 Secondary sector excluding construction* 12 13 12 14 Construction 4 6 10 11 Services 24 25 25 27 Total 100 100 100 100 *Includes manufacturing, mining and quarrying, electricity and water supply Source: NSSO and 12th Plan Document
238 259 243 231
47 60 56 65
18 26 44 50
94
113 117 127
0
50
100
150
200
250
300
350
400
450
500
1999-2000 2004-05 2009-10 2011-12
Mill
ions
Services
Construction
Secondarysector exclconstruction*
Agriculture
Total
*Includes manufacturing, mining and quarrying, electricity and water supply

13
e. Female participation
One of the more interesting possible explanations for the rise in rural wages is the
changing female participation in rural markets. Thefemale participation rate is down
in all the age categories. Improved living standards could lead rural families to
withdraw women from the labour force (Chart 12). Also, higher prosperity could lead
to greater investment in educating girls (for the age group 10 to 24) again leading to
lower participation in the workforce.
Chart 12: Labour Force Participation Rate
Source: NSSO Employment and Unemployment Survey 2011-12.
3. To summarize In sum then, when we examine food inflation, a substantial portion stems from an
increase in food production costs, primarily rural wage inflation. Some of that is an
increase in real wages, needed to attract labour to agriculture, away from
construction, education, household work, or MGNREGA. If, however, wages
elsewhere also go up, the necessary shift in relative wages to keep agricultural work
attractive will not take place, and we will continue to have a wage spiral. Also, some
of the agricultural wage growth may be because of more liquidity flowing into rural
areas. Somewhat paradoxically, to contain food inflation and get a strong increase in
food production, we need to
0
20
40
60
80
100
10-1
4
15-1
9
20-2
4
25-2
9
30-3
4
35-3
9
40-4
4
45-4
9
50-5
4
55-5
9
>=60
Per c
ent
(Rural Male)
1993-94 1999-00 2004-052009-10 2011-12
0
10
20
30
40
50
60
70
10-1
4
15-1
9
20-2
4
25-2
9
30-3
4
35-3
9
40-4
4
45-4
9
50-5
4
55-5
9
>=60
Per c
ent
(Rural Female)
1993-94 1999-00 2004-052009-10 2011-12
14
(i) Contain the rise in wages elsewhere so that relative wages in agriculture
can rise without too much overall increase in wages.
(ii) Contain anyunwarranted rise in rural wages as well as the rise in other
agricultural input costs (though not through subsidies) so that the farmer
gets a higher return.
(iii) Allow food prices to be determined by the market and use minimum
support prices to provide only a lower level of support so that production
decisions do not get distorted or the price wage spiral accentuated. This
means limiting the pace of MSP increases going forward.
(iv) Reduce the wedge between what the farmer gets and what is paid by the
household by reducing the role, number, and monopoly power of
middlemen (amend APMC Acts), as well as by improving logistics.
(v) Improve farm productivity through technology extension, irrigation, etc.
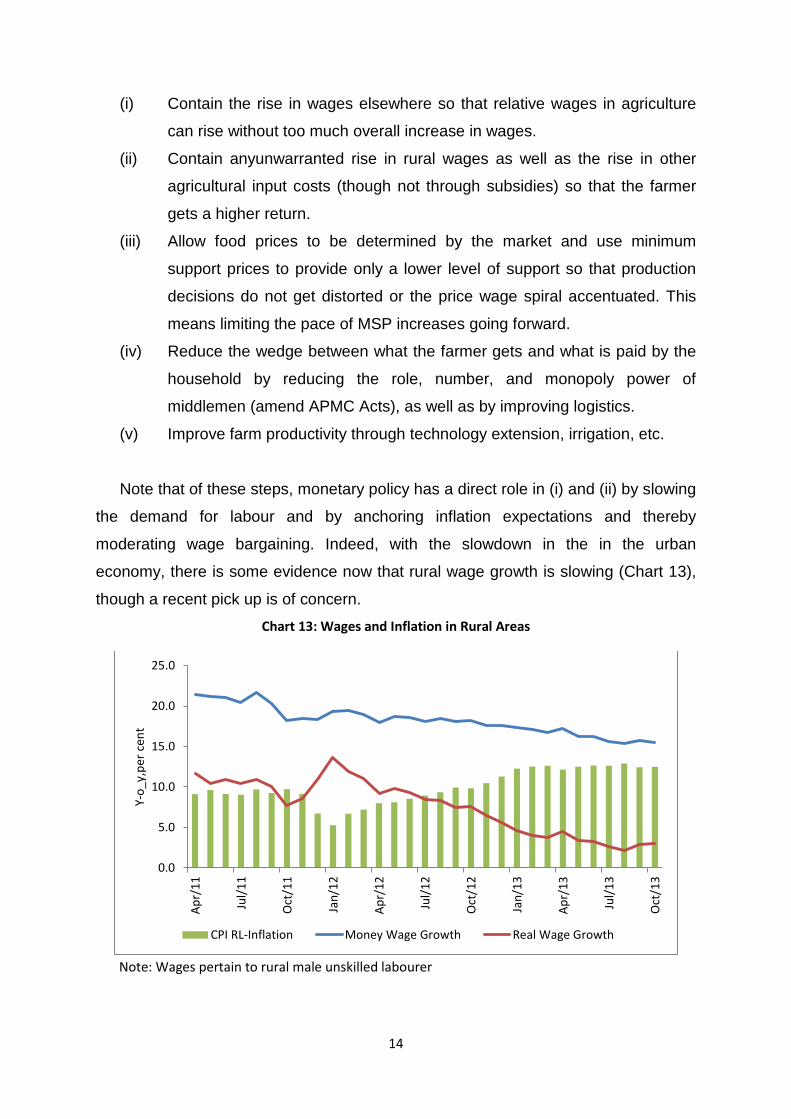
Note that of these steps, monetary policy has a direct role in (i) and (ii) by slowing
the demand for labour and by anchoring inflation expectations and thereby
moderating wage bargaining. Indeed, with the slowdown in the in the urban
economy, there is some evidence now that rural wage growth is slowing (Chart 13),
though a recent pick up is of concern. Chart 13: Wages and Inflation in Rural Areas
Note: Wages pertain to rural male unskilled labourer
0.0
5.0
10.0
15.0
20.0
25.0
Apr/
11
Jul/1
1
Oct
/11
Jan/
12
Apr/
12
Jul/1
2
Oct
/12
Jan/
13
Apr/
13
Jul/1
3
Oct
/13
Y-o_
y,pe
r cen
t
CPI RL-Inflation Money Wage Growth Real Wage Growth

15
Finally, our food prices have largely caught up with global prices(we were the
world’s largest rice exporter last year). Given that global food prices have been
moderating, such moderation should feed through to domestic food prices – provided
we do not intervene to prevent the feed-through of global prices, and do not
intervene in limiting exports or imports.
Let me emphasize that the RBI welcomes rural prosperity and wants to help
increase rural productivity through appropriate credit and investment. But recent
inflation has not helped strengthen the hand of the farmer, so the fight against
inflation is also in the farmer’s interest.
To sum up,
• As prosperity has increased the demand for food, we have needed more food
production (or imports).
• Higher agricultural commodity prices should have incentivized farmers to
produce significantly more.
• They have, but not enough. Part of the reason may be that farmer earnings
are being eaten away by higher costs, most important of which is wages.
• To limit the rise in rural wages, given that it has to rise relative to other wages
to attract labour into agriculture, wages elsewhere should not rise as much.
• Monetary policy is an appropriate tool with which to limit the rise in wages,
especially urban ones.
• The slowdown in rural wage growth may be partly the consequence of tighter
policy limiting wage rise elsewhere.
• Of course, monetary policy’s effectiveness in containing other price and wage
increases (such as services prices, which are an important part of the CPI
index)) is far less controversial.
To conclude, the RBI believes its fight against inflation will have traction, despite
food being an important component of the CPI.